ghg verification statement - themediagroup · 2017-06-23 · tractebel energia s.a. rua paschoal...
TRANSCRIPT
GREENHOUSE GAS INVENTORY VERIFICATION OF THE TRACTEBEL ENERGIA - 2015
GHG Verification Statement

This Statement is not valid without the full Greenhouse Gas Assertion and the verification scope, objectives, criteria and findings available on pages 2 to 4 of this Statement.
Declaração BR16/9364
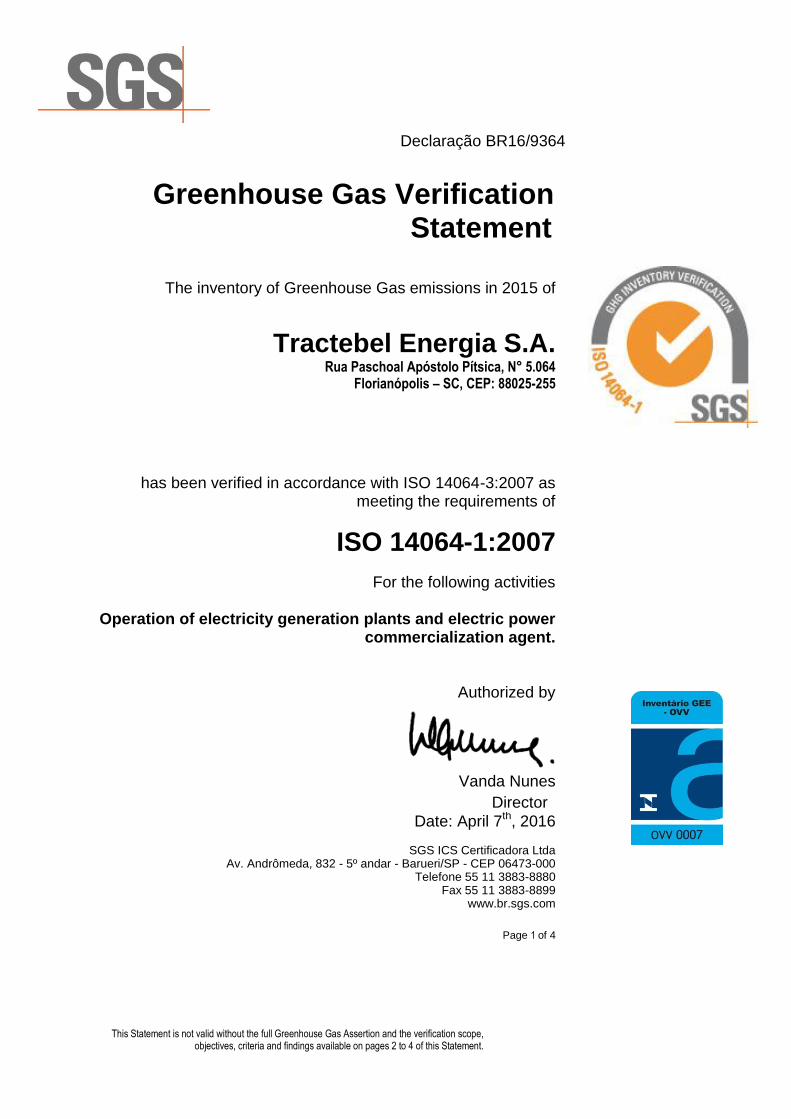
Greenhouse Gas Verification Statement
The inventory of Greenhouse Gas emissions in 2015 of
Tractebel Energia S.A.
Rua Paschoal Apóstolo Pítsica, N° 5.064 Florianópolis – SC, CEP: 88025-255
has been verified in accordance with ISO 14064-3:2007 as meeting the requirements of
ISO 14064-1:2007
For the following activities
Operation of electricity generation plants and electric power
commercialization agent.
Authorized by
Vanda Nunes
Director
Date: April 7th, 2016
SGS ICS Certificadora Ltda Av. Andrômeda, 832 - 5º andar - Barueri/SP - CEP 06473-000
Telefone 55 11 3883-8880 Fax 55 11 3883-8899
www.br.sgs.com
Page 1 of 4
This Statement is not valid without the full Greenhouse Gas Assertion and the verification scope, objectives, criteria and findings available on pages 2 to 4 of this Statement.
SGS has been contracted by Tractebel Energia S.A. (hereinafter referred to as “CLIENT”), Rua Phascoal Apostolo Pítsica, 5.064 – Florianópolis – SC – CEP: 88025-255, for the verification of direct and indirect Greenhouse Gas emissions in accordance with ISO14064 and GHG Program. ISO 14064-3: 2007 as provided by Tractebel Energia S.A. (hereinafter referred to as “RESPONSIBLE PARTY”), Rua Phascoal Apostolo Pítsica, 5.064 – Florianópolis – SC – CEP: 88025-255, in the Greenhouse Gas (GHG) Assertion in the form of inventory covering GHG emissions of the period 2015. Roles and responsibilities The management of Tractebel Energia S.A. is responsible for the organization’s GHG information system, the development and maintenance of records and reporting procedures in accordance with that system, including the calculation and determination of GHG emissions information and the reported GHG emissions. It is SGS’s responsibility to express an independent GHG verification opinion on the GHG emissions as provided in the GHG Assertion for the period 2015. SGS conducted a third party verification of the provided GHG assertion against the principles of ISO 14064-1: 2007 and ISO 14064-3: 2007 and Programa Brasileiro GHG Protocol in the period 2015. The verification was based on the verification scope, objectives and criteria as agreed between Tractebel Energia S.A. and SGS on 28/03/2016. Level of Assurance The level of assurance agreed is that of reasonable assurance. Scope Tractebel Energia S.A. has commissioned an independent verification by SGS ICS Certificadora Ltda of reported GHG emissions of 2015 arising from “Operation of electricity generation plants and electric power commercialization agent” activities, to establish conformance with ISO 14064 principles within the scope of the verification as outlined below. The data and information supporting the GHG assertion were calculated based on monitored and historical data. This engagement covers verification of emission from anthropogenic sources of greenhouse gases included within the organisation’s boundary and is based on ISO 14064-3:2007.
The organizational boundary was established following operational control approach and equity share.
Title or description activities: Operation of electricity generation plants and electric power commercialization agent.
Location/boundary of the activities: Location of the units of the company in Annex A. Physical infrastructure, activities, technologies and processes of the organization: Offices
and Electricity Units Genertaion, according to Annex A. GHG sources, sinks and/or reservoirs included: scope 1, scope 2, scope 3. Types of GHGs included: CO2; CH4; N2O; HFCs; PFCs; SF6 and NF3. Directed action: N.A. GHG information for the following period was verified: 2015.
This Statement is not valid without the full Greenhouse Gas Assertion and the verification scope, objectives, criteria and findings available on pages 2 to 4 of this Statement.
Intended user of the verification statement: Tractebel Energia S.A., ISE – Índice de Sustentabilidade Empresarial, between others.
Objective The purposes of this verification exercise are, by review of objective evidence, to independently review:
Whether the GHG emissions are as declared by the organisation’s GHG assertion The data reported are accurate, complete, consistent, transparent and free of material error
or omission. Criteria Criteria against which the verification assessment is undertaken are the principles of ISO 14064 and Programa Brasileiro GHG Protocol. Materiality The materiality required for the verification was considered by SGS to 5%, based on the needs of the intended user of the GHG Assertion. Conclusion Tractebel Energia S.A. provided the GHG assertion based on the requirements of ISO14064-1: 2007 and GHG Protocol. The GHG information for the period 2015 disclosing emissions of 6.150.621,41 metric tonnes of CO2 equivalent (operational control) and 6.150.308,17 metric tonnes of CO2 equivalent (equity share) are verified by SGS to a reasonable level of assurance, consistent with the agreed verification scope, objectives and criteria.
This Statement is not valid without the full Greenhouse Gas Assertion and the verification scope, objectives, criteria and findings available on pages 2 to 4 of this Statement.
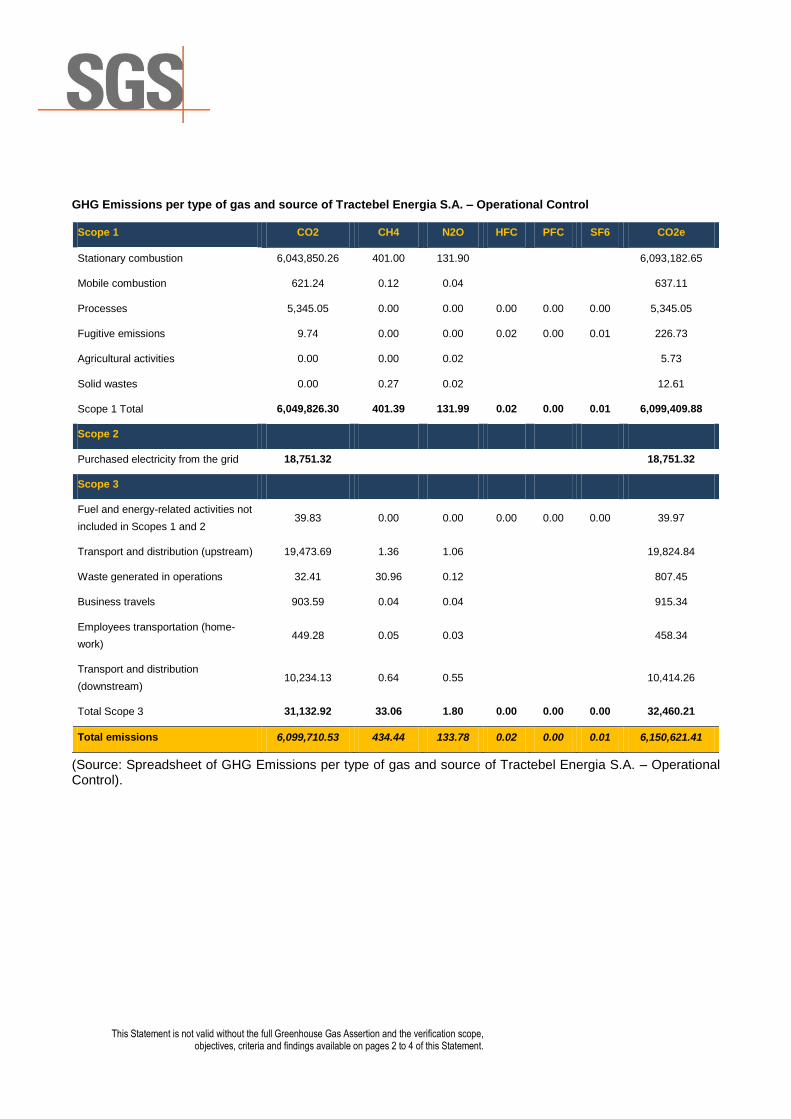
GHG Emissions per type of gas and source of Tractebel Energia S.A. – Operational Control
Scope 1 CO2 CH4 N2O HFC PFC SF6 CO2e
Stationary combustion 6,043,850.26 401.00 131.90 6,093,182.65
Mobile combustion 621.24 0.12 0.04 637.11
Processes 5,345.05 0.00 0.00 0.00 0.00 0.00 5,345.05
Fugitive emissions 9.74 0.00 0.00 0.02 0.00 0.01 226.73
Agricultural activities 0.00 0.00 0.02 5.73
Solid wastes 0.00 0.27 0.02 12.61
Scope 1 Total 6,049,826.30 401.39 131.99 0.02 0.00 0.01 6,099,409.88
Scope 2
Purchased electricity from the grid 18,751.32 18,751.32
Scope 3
Fuel and energy-related activities not
included in Scopes 1 and 2 39.83 0.00 0.00 0.00 0.00 0.00 39.97
Transport and distribution (upstream) 19,473.69 1.36 1.06 19,824.84
Waste generated in operations 32.41 30.96 0.12 807.45
Business travels 903.59 0.04 0.04 915.34
Employees transportation (home-
work) 449.28 0.05 0.03 458.34
Transport and distribution
(downstream) 10,234.13 0.64 0.55 10,414.26
Total Scope 3 31,132.92 33.06 1.80 0.00 0.00 0.00 32,460.21
Total emissions 6,099,710.53 434.44 133.78 0.02 0.00 0.01 6,150,621.41
(Source: Spreadsheet of GHG Emissions per type of gas and source of Tractebel Energia S.A. – Operational Control).
This Statement is not valid without the full Greenhouse Gas Assertion and the verification scope, objectives, criteria and findings available on pages 2 to 4 of this Statement.
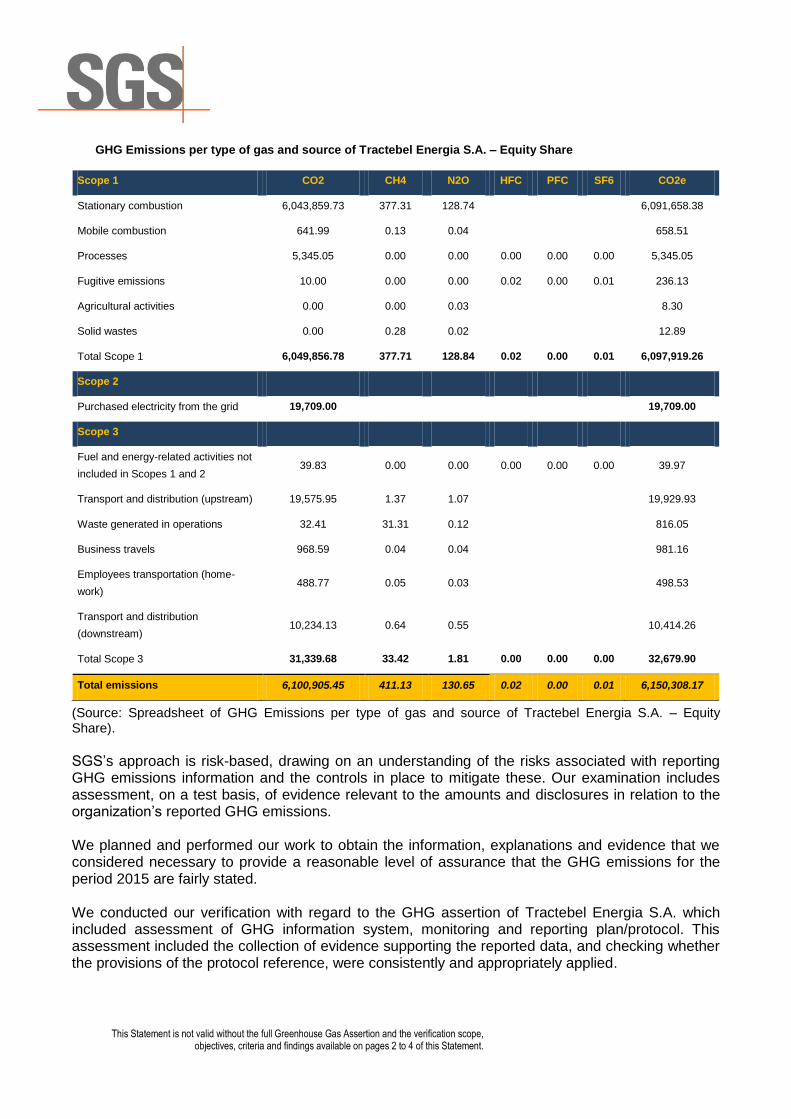
GHG Emissions per type of gas and source of Tractebel Energia S.A. – Equity Share
Scope 1 CO2 CH4 N2O HFC PFC SF6 CO2e
Stationary combustion 6,043,859.73 377.31 128.74 6,091,658.38
Mobile combustion 641.99 0.13 0.04 658.51
Processes 5,345.05 0.00 0.00 0.00 0.00 0.00 5,345.05
Fugitive emissions 10.00 0.00 0.00 0.02 0.00 0.01 236.13
Agricultural activities 0.00 0.00 0.03 8.30
Solid wastes 0.00 0.28 0.02 12.89
Total Scope 1 6,049,856.78 377.71 128.84 0.02 0.00 0.01 6,097,919.26
Scope 2
Purchased electricity from the grid 19,709.00 19,709.00
Scope 3
Fuel and energy-related activities not
included in Scopes 1 and 2 39.83 0.00 0.00 0.00 0.00 0.00 39.97
Transport and distribution (upstream) 19,575.95 1.37 1.07 19,929.93
Waste generated in operations 32.41 31.31 0.12 816.05
Business travels 968.59 0.04 0.04 981.16
Employees transportation (home-
work) 488.77 0.05 0.03 498.53
Transport and distribution
(downstream) 10,234.13 0.64 0.55 10,414.26
Total Scope 3 31,339.68 33.42 1.81 0.00 0.00 0.00 32,679.90
Total emissions 6,100,905.45 411.13 130.65 0.02 0.00 0.01 6,150,308.17
(Source: Spreadsheet of GHG Emissions per type of gas and source of Tractebel Energia S.A. – Equity Share).
SGS’s approach is risk-based, drawing on an understanding of the risks associated with reporting GHG emissions information and the controls in place to mitigate these. Our examination includes assessment, on a test basis, of evidence relevant to the amounts and disclosures in relation to the organization’s reported GHG emissions. We planned and performed our work to obtain the information, explanations and evidence that we considered necessary to provide a reasonable level of assurance that the GHG emissions for the period 2015 are fairly stated. We conducted our verification with regard to the GHG assertion of Tractebel Energia S.A. which included assessment of GHG information system, monitoring and reporting plan/protocol. This assessment included the collection of evidence supporting the reported data, and checking whether the provisions of the protocol reference, were consistently and appropriately applied.

This Statement is not valid without the full Greenhouse Gas Assertion and the verification scope, objectives, criteria and findings available on pages 2 to 4 of this Statement.
In SGS’s opinion the presented GHG assertion:
is materially correct and is a fair representation of the GHG data and information, and is prepared in accordance with ISO14064-1: 2007 on GHG quantification, monitoring and
reporting. This statement shall be interpreted with the GHG assertion of Tractebel Energia S.A. (Relatório Inventário de Emissões de Gases de Efeito Estufa do ano de 2015 Versão 3, 05/04/2016) as a whole.
Note: This Statement is issued, on behalf of Client, by SGS ICS Certificadora Ltda (“SGS”) under its General Conditions for Green
Gas Verification Services available at http://www.sgs.com/terms_and_conditions.htm. The findings recorded hereon are based upon an audit performed by SGS. A full copy of this statement, the findings and the supporting GHG Assertion may be consulted at Tractebel Energia S.A. This Statement does not relieve Client from compliance with any bylaws, federal, national or regional acts and regulations or with any guidelines issued pursuant to such regulations. Stipulations to the contrary are not binding on SGS and SGS shall have no responsibility vis-à-vis parties other than its Client.
This Statement is not valid without the full Greenhouse Gas Assertion and the verification scope, objectives, criteria and findings available on pages 2 to 4 of this Statement.
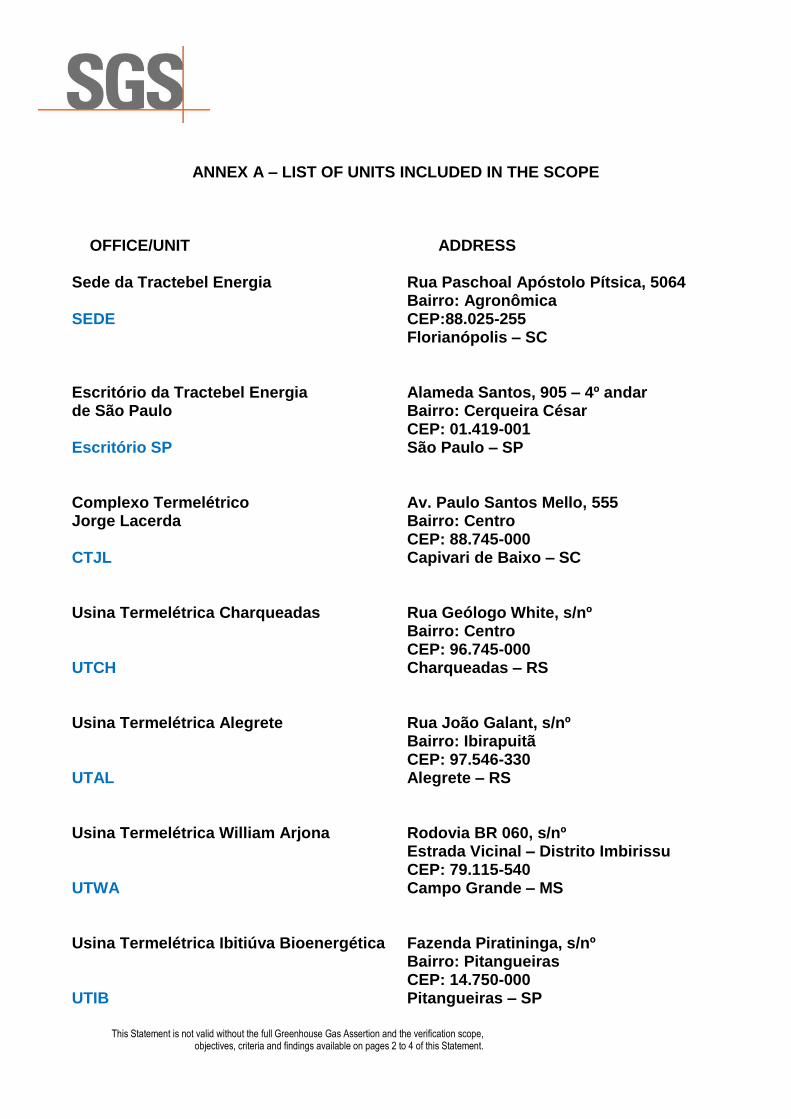
ANNEX A – LIST OF UNITS INCLUDED IN THE SCOPE OFFICE/UNIT ADDRESS Sede da Tractebel Energia Rua Paschoal Apóstolo Pítsica, 5064 Bairro: Agronômica SEDE CEP:88.025-255 Florianópolis – SC Escritório da Tractebel Energia Alameda Santos, 905 – 4º andar de São Paulo Bairro: Cerqueira César CEP: 01.419-001 Escritório SP São Paulo – SP Complexo Termelétrico Av. Paulo Santos Mello, 555 Jorge Lacerda Bairro: Centro CEP: 88.745-000 CTJL Capivari de Baixo – SC Usina Termelétrica Charqueadas Rua Geólogo White, s/nº Bairro: Centro CEP: 96.745-000 UTCH Charqueadas – RS Usina Termelétrica Alegrete Rua João Galant, s/nº Bairro: Ibirapuitã CEP: 97.546-330 UTAL Alegrete – RS Usina Termelétrica William Arjona Rodovia BR 060, s/nº Estrada Vicinal – Distrito Imbirissu CEP: 79.115-540 UTWA Campo Grande – MS Usina Termelétrica Ibitiúva Bioenergética Fazenda Piratininga, s/nº Bairro: Pitangueiras CEP: 14.750-000 UTIB Pitangueiras – SP
This Statement is not valid without the full Greenhouse Gas Assertion and the verification scope, objectives, criteria and findings available on pages 2 to 4 of this Statement.
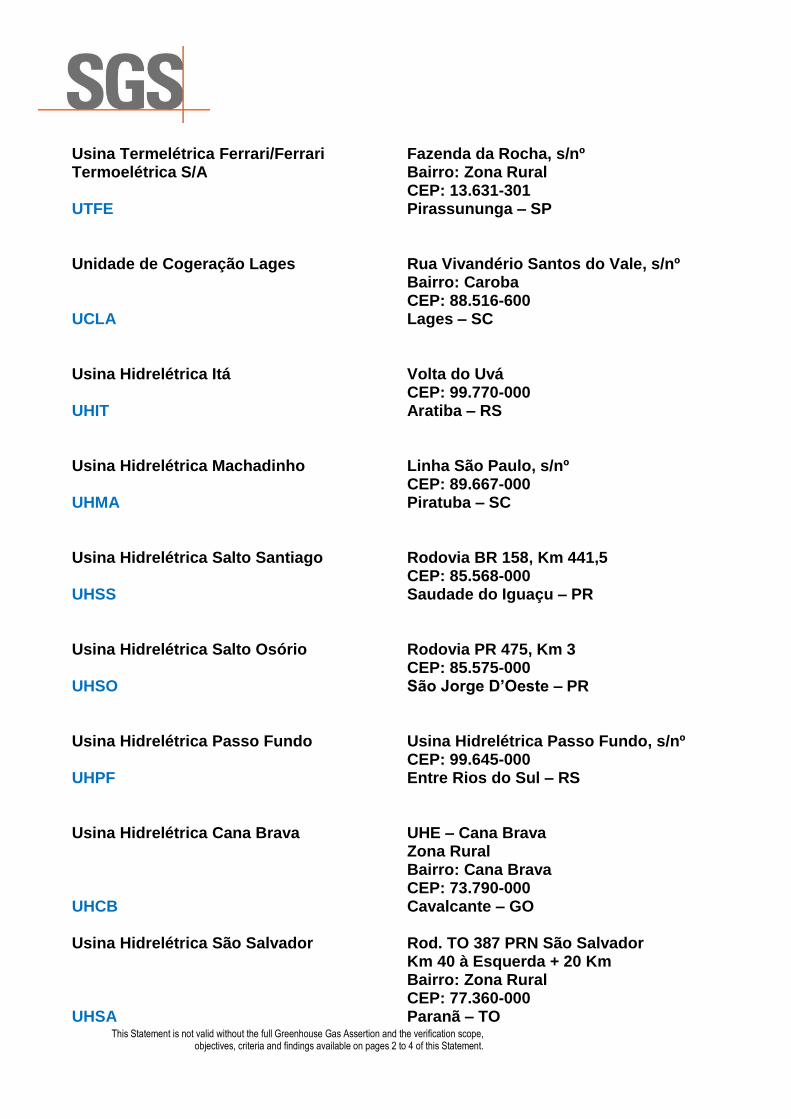
Usina Termelétrica Ferrari/Ferrari Fazenda da Rocha, s/nº Termoelétrica S/A Bairro: Zona Rural CEP: 13.631-301 UTFE Pirassununga – SP Unidade de Cogeração Lages Rua Vivandério Santos do Vale, s/nº Bairro: Caroba CEP: 88.516-600 UCLA Lages – SC Usina Hidrelétrica Itá Volta do Uvá CEP: 99.770-000 UHIT Aratiba – RS Usina Hidrelétrica Machadinho Linha São Paulo, s/nº CEP: 89.667-000 UHMA Piratuba – SC Usina Hidrelétrica Salto Santiago Rodovia BR 158, Km 441,5 CEP: 85.568-000 UHSS Saudade do Iguaçu – PR Usina Hidrelétrica Salto Osório Rodovia PR 475, Km 3 CEP: 85.575-000 UHSO São Jorge D’Oeste – PR Usina Hidrelétrica Passo Fundo Usina Hidrelétrica Passo Fundo, s/nº CEP: 99.645-000 UHPF Entre Rios do Sul – RS Usina Hidrelétrica Cana Brava UHE – Cana Brava Zona Rural Bairro: Cana Brava CEP: 73.790-000 UHCB Cavalcante – GO Usina Hidrelétrica São Salvador Rod. TO 387 PRN São Salvador Km 40 à Esquerda + 20 Km Bairro: Zona Rural CEP: 77.360-000 UHSA Paranã – TO
This Statement is not valid without the full Greenhouse Gas Assertion and the verification scope, objectives, criteria and findings available on pages 2 to 4 of this Statement.
Usina Hidrelétrica Estreito Rodovia BR 230, Km 8, s/nº Zona Rural CEP: 65.975-000 UHET Estreito – MA Usina Hidrelétrica Ponte de Pedra Estrada UHE – Ponte de Pedra, s/nº Zona Rural CEP: 78.790-000 UHPP Itiquira – MT PCH Areia Branca Fazenda Cachoeira Bonita, s/nº Santo Antonio do Manhuaçu Bairro: Zona Rural CEP: 35.321-000 PHAB Caratinga – MG PCH José Gelásio Rodovia BR 163 Km 102, s/nº Ribeirão de Ponte de Pedra Bairro: Zona Rural CEP: 78.740-275 PHJG Rondonópolis – MT PCH Rondonópolis Rodovia BR 163 Km 102, s/nº Ribeirão de Ponte de Pedra Bairro: Zona Rural CEP: 78.740-275 PHRO Rondonópolis – MT Usina/Central Eólica Beberibe Fazenda Uberaba, s/nº - Praia das Fontes CEP: 62.840-000 UEBB Beberibe – CE Usina/Central Eólica Pedra do Sal Praia Pedra do Sal, s/nº Bairro: Zona Rural CEP: 64.200-000 UEPS Parnaíba – Piauí
This Statement is not valid without the full Greenhouse Gas Assertion and the verification scope, objectives, criteria and findings available on pages 2 to 4 of this Statement.
Usina/Central Eólica Guajirú Sítio Manguinhos, s/nº Bairro: Manguinhos CEP: 62.690-000 UEGU Trairi – CE Usina/Central Eólica Mundaú Fazenda Boca da Mata, s/nº Bairro: Zacarias CEP: 62.690-000 UEMU Trairi – CE Usina/Central Eólica Fleixeiras I Sítio Canaã, s/nº Bairro: Canaã CEP: 62.690-000 UEFL Trairi – CE Usina/Central Eólica Trairi Sítio Estrela, s/nº Bairro: Sítio Estrela CEP: 62.690-000 UETR Trairi – CE Usina/Central Eólica Tubarão BR 101, s/nº - Km 329 Bairro: Revoredo CEP: 88704-700 UETB Tubarão – SC Usina Fotovoltaica Cidade Azul BR 101, s/nº - Km 329 Bairro: Revoredo CEP: 88704-700 UFCA Tubarão – SC
REPORT
INVENTORY OF GREENHOUSE GAS
EMISSIONS
2015 YEAR
Tractebel Energia S/A
05/04/2016
Version 3

2
Contents
1.Abbreviations and Acronyms ........................................................................................................................................ 10
2. Synopsis of 2015 Results ............................................................................................................................................ 12
3.Introduction ................................................................................................................................................................... 13
4.Tractebel Energia S.A. ................................................................................................................................................. 14
5.Company in charge and professionals involved in the preparation of the inventory .................................................... 15
5.1.Responsible-EQAO ................................................................................................................................................ 15
5.2.Responsible-Tractebel Energia (AMA and RCs) ................................................................................................... 15
6.Methodology ................................................................................................................................................................. 18
6.1.Considered Gases ................................................................................................................................................. 18
6.2.Limits of GHG emissions inventory ........................................................................................................................ 18
6.2.1. Organizational Limits ......................................................................................................................................... 19
6.2.2. Operational Limits .............................................................................................................................................. 22
6.3.Data collection ........................................................................................................................................................ 27
6.4.Bases and References ........................................................................................................................................... 28
6.5.Methodological changes in comparison with 2014 ................................................................................................ 30
7. Inventory results .......................................................................................................................................................... 32
7.1.Operational Control ................................................................................................................................................ 32
7.1.1.Total Emissions ................................................................................................................................................... 32
7.1.1.1.Scope 1 ............................................................................................................................................................ 32
7.1.1.2.Scope 2 ............................................................................................................................................................ 33
7.1.1.3.Scope 3 ............................................................................................................................................................ 33
7.1.1.4.Biomass emissions .......................................................................................................................................... 34
7.1.1.5.Emissions of Non-Kyoto gases ........................................................................................................................ 34
7.1.2.Emissions from plant/Office ................................................................................................................................ 35
7.1.2.1.Wind turbine ..................................................................................................................................................... 36
7.1.2.2.Photovoltaic Plants .......................................................................................................................................... 42
7.1.2.3.Small Hydropower Plants ................................................................................................................................. 42
7.1.2.4.Hydroelectric power plants ............................................................................................................................... 46
7.1.2.5.Thermal power plants ...................................................................................................................................... 56
7.1.2.6.Offices .............................................................................................................................................................. 68
7.2.Corporate Participation .......................................................................................................................................... 72
7.2.1.Total Emissions ................................................................................................................................................... 72
7.2.1.1.Scope 1 ............................................................................................................................................................ 72
7.2.1.3.Scope 3 ............................................................................................................................................................ 73
7.2.1.4.Biomass emissions .......................................................................................................................................... 73
3
7.2.1.5.Non-Kyoto gases.............................................................................................................................................. 73
7.2.2.Emissions from plant/Office ................................................................................................................................ 73
7.2.2.1.Wind turbines ................................................................................................................................................... 74
7.2.2.2.Photovoltaic Plants .......................................................................................................................................... 75
7.2.2.3.Small Hydropower Plants ................................................................................................................................. 75
7.2.2.4.Hydroelectric power plants ............................................................................................................................... 75
7.2.2.6.Offices .............................................................................................................................................................. 82
8. Emission analysis ........................................................................................................................................................ 83
8.1. Operational ControlVs. Corporate Participation .................................................................................................... 83
8.2. Evaluation of Uncertainties ................................................................................................................................... 84
8.3. Evolution of emissions .......................................................................................................................................... 86
8.3.1.Total Emissions ................................................................................................................................................... 87
8.3.2.Emissions from plant/Office ................................................................................................................................ 92
8.3.2.1.Wind turbine ..................................................................................................................................................... 93
8.3.2.2.Photovoltaic Power Plant ................................................................................................................................. 98
8.3.2.3.Small Hydropower Plants ................................................................................................................................. 99
8.3.2.4.Hydroelectric power plants ............................................................................................................................. 102
8.3.2.6.Offices ............................................................................................................................................................ 122
8.4.Emissions balance ............................................................................................................................................... 124
8.5.Indicators .............................................................................................................................................................. 128
9.Emission reduction opportunities ................................................................................................................................ 133
10.Suggestion for improvement ..................................................................................................................................... 134
11.References ............................................................................................................................................................... 135
Annex I.Total emissions by gas type and Source ......................................................................................................... 139
Annex II.Emission factors .............................................................................................................................................. 142
Annex III.Additional Methodologies ............................................................................................................................... 146
Annex IV. Representation of emission sources ............................................................................................................. 150
Annex V. Uncertainty assessment methodology and Results for plant/Office ........................................................... 157
Annex VI. Methodology of Calculation of emission Reduction ...................................................................................... 165
Annex VII. Total emissions of UHET, UHIT and UHMA ................................................................................................ 175
Annex VIII. Global warming potential of Greenhouse and non-KyotoGases ................................................................ 181
4
List of Figures
Figure 1 – Illustrative Flowchart of emission categories ................................................................................ 22
Figure 2 - Flow of information for the preparation of the GHG inventory of Tractebel Energia S/A ............... 27
Figure 3 – Representation of the UEBB GHG emissions per scope ............................................................. 36
Figure 4 - Representation of the UEBB GHG emissions by source .............................................................. 36
Figure 5 - Representation of the UEFL GHG emissions by scope ................................................................ 38
Figure 6 - Representation of GHG emissions of UEGU by scope ................................................................. 38
Figure 7 - Representation of GHG emissions of UEMU by scope ................................................................. 38
Figure 8 - Representation of the UEPS GHG emissions by scope ................................................................ 39
Figure 9 - Representation of UEPS GHG emissions by source .................................................................... 39
Figure 10 - Representation of UETR GHG emissions by scope .................................................................... 40
Figure 11 - Representation of UETR GHG emissions by source .................................................................. 40
Figure 12 - Representation of the PHAB GHG emissions by scope .............................................................. 42
Figure 13 – Representation of PHAB GHG emissions by source .................................................................. 43
Figure 14 - Representation of GHG emissions of PHJG by scope ................................................................ 44
Figure 15 – Representation of PHJG GHG emissions by source .................................................................. 44
Figure 16 - Representation of the PHRO GHG emissions by scope ............................................................. 45
Figure17 - Representation of the PHRO GHG emissions by source ............................................................. 45
Figure18 - Representation of UHCB GHG emissions by scope .................................................................... 47
Figure19 - Representation of UHCB GHG emissions by source ................................................................... 47
Figure 20 - Representation of UHPF GHG emissions by scope .................................................................... 48
Figure 21 - Representation of UHPF GHG emissions by source .................................................................. 49
(except Scope 2) ............................................................................................................................................ 49
Figure 22 - Representation of UHPP GHG emissions by scope ................................................................... 50
Figure 23 - Representation of UHPP GHG emissions by source .................................................................. 50
Figure 24 - Representation of UHSO GHG emissions by scope ................................................................... 51
Figure 25 - Representation of UHSO GHG emissions by source .................................................................. 52
(except Scope 2) ............................................................................................................................................ 52
Figure 26 - Representation of UHSS GHG emissions by scope ................................................................... 53
Figure 27 - Representation of UHSS GHG emissions by source .................................................................. 53
Figure 28 – Representation of the UHSA GHG emissions by scope ............................................................. 54
Figure 29 – Representation of UHSA GHG emissions by source ................................................................. 55
Figure 30 - Representation of UTAL GHG emissions by scope .................................................................... 56
Figure 31 - Representation of UTAL GHG emissions by source ................................................................... 56
Figure 32 - Representation of UTCH GHG emissions by Scope ................................................................... 57
Figure 33 - Representation of UTCH GHG emissions by source .................................................................. 58
Figure 34 - Representation of CTJL GHG emissions by scope ..................................................................... 60
Figure 35 - Representation of CTJL GHG emissions by source (except stationary combustion) .................. 60
Figure36 – Representation of UTWA GHG emissions by source (except stationary combustion emissions)62
Figure 37 - Representation of UCLA GHG emissions by scope .................................................................... 64
Figure 38 - Representation of UCLA GHG emissions by source ................................................................... 64
Figure39 - Representation of UTFE GHG emissions by scope ..................................................................... 65
Figure 40 – Representation of UTFE GHG emissions by source .................................................................. 66
Figure 41 - Representation of UTIB GHG emissions by scope ..................................................................... 67
Figure 42 - Representation of UTIB GHG emissions by source (except stationary combustion) .................. 67
Figure 43 - Representation of GHG emissions from the headquarters, in Florianópolis, per scope ............. 69
Figure 44 - Representation of GHG emissions by source of Tractebel Energia's headquarters ................... 69
Figure 45 - Representation of GHG emissions from the Office, in Sao Paulo, by scope .............................. 70
Figure 46 - Representation of GHG emissions from the Office, in Sao Paulo, per scope ............................. 71
Figure 47 – Representation of GHG emissions of UHET by Scope .............................................................. 75
Figure 48 – Representation of GHG emissions from source UHET .............................................................. 76
Figure 49 - Representation of GHG emissions the UHIT per Scope Corporate Participation ....................... 77
Figure 50 - Representation of GHG emissions the UHIT by source .............................................................. 77
5
Figure 51 - Representation of GHG emissions of per Scope UHMA - Corporate Participation ..................... 79
Figure 52 - Representation of GHG emissions from source UHMA (except Scope 2) -Corporate Participation ....................................................................................................................................................................... 79
Figure 53 - Representation of GHG emissions of UTIB per Scope Corporate Participation ......................... 81
Figure 54 – Representation of GHG emissions of UTIB by source (except stationary combustion) ............. 81
Figure 55 - Graphic of uncertainty for power plants and offices of Tractebel Energia in relation to total aggregated average ....................................................................................................................................... 86
Figure 56-Scope 1 - Emissions Evolution of Tractebel Energia – Operational Control (2010-2015) ............. 88
Figure 57-Evolution of emissions of Scope 2 and 3 of Tractebel Energia – Operational Control (2010-2015) ....................................................................................................................................................................... 88
Figure 58 - CO2 emission Factor monthly NIS in tCO2/MWh (2010-2015) ................................................... 89
Figure 59-trends in emissions from combustion of biomass of Tractebel Energia – Operational Control (2010-2015) ................................................................................................................................................... 89
Figure 60- evolution of non-Kyoto gases (R-22) of Tractebel Energia Operational Control (2010-2015) ...... 90
Figure 61 - Scope1Emission Evolution of Tractebel Energia Corporate Participation ................................... 91
Figure 62 - Evolution of emissions forScopes 2 and 3 of Tractebel Energia Corporate Participation ........... 91
Figure 63-evolution of emissions from the combustion of biomass of Tractebel Energia-Corporate Participation ................................................................................................................................................... 92
Figure 64-evolution of non-Kyoto gases of Tractebel Energia Corporate Participation ................................. 92
Figure 65 – Evolution of GHG emissions at UEBB in tCO2e ......................................................................... 93
Figure 66 – Evolution of GHG emissions at UEBB in tCO2e ......................................................................... 93
Figure 67 - Evolution of GHG emissions at UEFL in tCO2e .......................................................................... 94
Figure 68 - Evolution of GHG emissions at UEFL by scope in tCO2e ........................................................... 94
Figure 69 - Evolution of GHG emissions at UEGU in tCO2e .......................................................................... 95
Figure 70 - Evolution of GHG emissions at UEGU by scope in tCO2e .......................................................... 95
Figure 71 - Evolution of GHG emissions at UEMU in tCO2e ......................................................................... 96
Figure 72 - Evolution of GHG emissions at UEMU by scope in tCO2e ......................................................... 96
Figure 73 - Evolution of GHG emissions at UEPS in tCO2e ......................................................................... 96
Figure 74 - Evolution of GHG emissions at UEPS by scope in tCO2e ........................................................... 97
Figure 75 - Evolution of GHG emissions at UETR in tCO2e .......................................................................... 97
Figure 76 – Evolution of GHG emissions at UETR by scope in tCO2e .......................................................... 98
Figure 77 - Evolution of GHG emissions at UFCA in tCO2e ......................................................................... 98
Figure 78 - Evolution of GHG emissions at UFCA by scope in tCO2e .......................................................... 99
Figure 79 – Evolution of GHG emissions at PHAB in tCO2e ......................................................................... 99
Figure 80 - Evolution of GHG emissions at PHAB by scope in tCO2e ......................................................... 100
Figure 81 - Evolution of GHG emissions at PHJG in tCO2e ........................................................................ 100
Figure 82 – Evolution of GHG emissions at PHJG by scope in tCO2e ....................................................... 101
Figure 83 - Evolution of GHG emissions at PHRO in tCO2e ....................................................................... 101
Figure 84 - Evolution of GHG emissions at PHRO by scope in tCO2e ....................................................... 102
Figure 85 – Evolution of GHG emissions at UHCB in tCO2e ...................................................................... 102
Figure 86 - Evolution of GHG emissions at UHCB by scope in tCO2e ........................................................ 103
Figure 87 - Evolution of GHG emissions at UHET in tCO2e - Corporate Participation ................................ 103
Figure 88 - Evolution of GHG emissions at UHET by scope in tCO2e - Corporate Participation ................ 104
Figure 89 - Evolution of GHG emissions at UHIT in tCO2e - Corporate Participation ................................. 104
Figure 90 - Evolution of GHG emissions at UHIT by scope in tCO2e -Corporate Participation .................. 105
Figure 91 - Evolution of GHG emissions at UHMA in tCO2e - Corporate Participation ............................... 105
Figure 92 - Evolution of GHG emissions at UHMA by scope in tCO2e - Corporate Participation ............... 106
Figure 93 - Evolution of GHG emissions at UHPF in tCO2e ....................................................................... 106
Figure 94 - Evolution of GHG emissions at UHPF by scope in tCO2e ........................................................ 107
Figure 95 - Evolution of GHG emissions at UHPP in tCO2e ....................................................................... 107
Figure 96 - Evolution of GHG emissions at UHPP by scope in tCO2e ........................................................ 108
Figure 97 – evolution of GHG emissions at UHSO in tCO2e ...................................................................... 108
Figure 98 – evolution of GHG emissions at UHSO by scope in tCO2e ....................................................... 109
Figure 99 - Evolution of GHG emissions at UHSS in tCO2e ....................................................................... 109
Figure 100 - Evolution of GHG emissions at UHSS by scope in tCO2e ...................................................... 110
6
Figure 101 – Evolution of GHG emissions at UHSA in tCO2e .................................................................... 110
Figure 102 – Evolution of GHG emissions at UHSA by scope in tCO2e ..................................................... 111
Figure 103 - Evolution of GHG emissions at UTAL in tCO2e ...................................................................... 112
Figure 104 - Evolution of GHG emissions in Scope 1 at UTAL in tCO2e .................................................... 112
Figure 105 - Evolution of GHG emissions in Scopes 2 and 3 at UTAL in tCO2e ........................................ 112
Figure 106 - Evolution of GHG emissions at UTCH in tCO2e ..................................................................... 113
Figure 107 - Evolution of GHG emissions in Scope 1 at UTCH in tCO2e ................................................... 113
Figure 108 – Evolution of GHG emissions in Scopes 2 and 3 at UTCH in tCO2e ....................................... 114
Figure 109 - Evolution of GHG emissions at CTJL in tCO2e ....................................................................... 114
Figure 110 - Evolution of GHG emissions in Scope 1 at CTJL in tCO2e ..................................................... 114
Figure 111 - Evolution of GHG emissions in Scopes 2 and 3 at CTJL in tCO2e ......................................... 115
Figure 112 - Evolution of GHG emissions at UTWA in tCO2e ..................................................................... 115
Figure 113 - Evolution of GHG emissions in Scope 1 at UTWA in tCO2e ................................................... 116
Figure 114 - Evolution of GHG emissions in Scopes 2 and 3 at UTWA in tCO2e ....................................... 116
Figure 115 - Evolution of GHG emissions at UTIB in tCO2e – Operational Control .................................... 117
Figure 116 – Evolution of GHG emissions in Scope 1 at UTIB in tCO2e – Operational Control ................. 117
Figure 117 - Evolution of GHG emissions in Scopes 2 and 3 at UTIB in tCO2e – Operational Control ...... 117
Figure 118 - Evolution of biomass emissions at UTIB in tCO2e – Operational Control ............................... 118
Figure 119 - Evolution of GHG emissions at UTIB tCO2e – Corporate Participation .................................. 118
Figure 120 – Evolution of GHG emissions in Scope 1 at UTIB in tCO2e – Corporate Participation ........... 118
Figure 121 – Evolution of GHG emissions in Scopes 2 and 3 at UTIB in tCO2e – Corporate Participation 119
Figure 122 - Evolution of biomass emissions at UTIB in tCO2e – Corporate Participation ......................... 119
Figure 123 – Evolution of GHG emissions at UCLA in tCO2e ..................................................................... 119
Figure 124 - Evolution of GHG emissions in Scope 1 at UCLA in tCO2e .................................................... 120
Figure 125 - Evolution of GHG emissions in Scopes 2 and 3 at UCLA in tCO2e ........................................ 120
Figure 126 - Evolution of biomass emissions at UCLA in tCO2e ................................................................ 120
Figure 127 – Evolution of GHG emissions at UTFE in tCO2e ..................................................................... 121
Figure 128 – Evolution of GHG emissions in Scope 1 at UTFE in tCO2e ................................................... 121
Figure 129 - Evolution of GHG emissions in Scopes 2 and 3 at UTFE in tCO2e ........................................ 122
Figure 130 - Evolution of biomass emissions at UTFE in tCO2e ................................................................. 122
Figure 131 - Evolution of GHG emissions from the headquarters in Florianópolis in tCO2e ....................... 123
Figure 132 - Evolution of GHG emissions per scope from the headquarters in Florianópolis in tCO2e ...... 123
Figure 133 - Evolution of GHG emissions from the Sao Paulo Office in tCO2e .......................................... 124
Figure 134 - Evolution of GHG emissions from the Sao Paulo Office by scope in tCO2e ........................... 124
Figure 135 - Evolution of emissions per energy generated from Tractebel Energia in tCO2e/MWh (2010-2015) ............................................................................................................................................................ 132
Figure 136 – Uncertainty analysis of GHG emissions of wind power plants, UEGU, UEFL UEMU, UETB and UEPS ........................................................................................................................................................... 159
Figure 137 – analysis of uncertainty of GHG emissions of the UEBB and wind UETR ............................... 160
Figure 138 – Analysis of uncertainty of GHG emissions of SHP ................................................................. 160
Figure 139 – Analysis of uncertainty of GHG emissions of Tractebel Energia Offices ................................ 161
Figure 140 – Analysis of uncertainty of GHG emissions of UHPF, UHSO, UHMA UHET and UHSS power plants ........................................................................................................................................................... 161
Figure 141 – Analysis of uncertainty of GHG emissions of UHCB, UHSA UHPP and UHIT power plants . 161
Figure 142 – Analysis of uncertainty of GHG emissions at CTJL ................................................................ 162
Figure 143 – Analysis of uncertainty at UTCH and UTWA plants for GHG emissions ................................ 163
Figure 144 - Analysis of uncertainty of GHG emissions at UTAL ................................................................ 163
Figure 145 – Analysis of uncertainty of GHG emissions at UCLA, UTIB and UTFE ................................... 163
Figure 146 – Analysis of uncertainty of GHG emissions at UFCA ............................................................... 164
Figure 147 – Representation of GHG emissions of UHET by scope (100%) .............................................. 175
Figure 148 – Representation of GHG emissions from source UHET (100%) .............................................. 175
Figure 149 - Representation of GHG emissions the UHIT by scope (100%) .............................................. 177
Figure 150 -Representation of GHG emissions the UHIT by source (100%) .............................................. 177
Figure 151 – Representation of GHG emissions of per-scope UHMA (100%) ............................................ 179

7
Figure 152 – Representation of GHG emissions from source UHMA (100%) ............................................. 179
8
List of tables
Table 1 – Responsible for the data collection for the preparation of the GHG inventory of Tractebel Energia in the year 2015 ............................................................................................................................................. 16
Table 2 - Summary of organizational boundaries .......................................................................................... 19
Table 3 - Generator Park of Tractebel Energia S.A. ...................................................................................... 20
Table 4 – Scopes of GHG emissions ............................................................................................................. 22
Table 5 - Sources of GHG emissions outlined in the GHG Protocol ............................................................. 23
Table 6 – GHG emission sources - 2015 Inventory ....................................................................................... 24
Table 7 – Considered methodology and sources of emission factors ........................................................... 29
Table 8 – Scope 1 GHG Emissions – Operational Control ............................................................................ 32
Table 9 – Scope 3 GHG Emissions – Operational Control ............................................................................ 33
Table 10 - Emissions from combustion of biomass of Tractebel Energia among Scopes 1 and 3 ................ 34
Table 11 -Tractebel Energia GHG emissions by Scope and plant/Office Operational Control (tCO2e)......... 35
Table 12 -GHG emissions of the UEBB (in tonnes) ....................................................................................... 37
Table 13 – GHG emissions of UEPS (in tonnes) ........................................................................................... 39
Table 14 - GHG emissions of UETR (in tonnes) ............................................................................................ 41
Table 15 - GHG emissions of PHAB (in tonnes) ............................................................................................ 43
Table 16 - GHG emissions of PHJG (in tonnes) ............................................................................................ 44
Table 17 - GHG emissions the PHRO (in tonnes) ......................................................................................... 46
Table 18 – GHG emissions from UHCB (in tonnes) ...................................................................................... 48
Table 19 - GHG emissions of UHPF (in tonnes) ............................................................................................ 49
Table 20-GHG emissions of UHPP (in tonnes) ............................................................................................. 51
Table 21 - GHG emissions of UHSO (in tonnes) ........................................................................................... 52
Table 22 – GHG emissions of UHSS (in tonnes) ........................................................................................... 54
Table 23 - GHG emissions the UHSA (in tonnes) ......................................................................................... 55
Table 24 – GHG emissions from UTAL (in tonnes) ....................................................................................... 57
Table 25 -GHG emissions of UTCH (in tonnes) ............................................................................................ 59
Table 26 - GHG emissions of CTJL (in tonnes) ............................................................................................. 61
Table 27 - GHG emissions of UTWA (in tonnes) ........................................................................................... 63
Table 28 – GHG emissions from UCLA (in tonnes) ....................................................................................... 65
Table 29 – GHG emissions from UTFE (in tonnes) ....................................................................................... 66
Table 30-GHG emissions of UTIB (in tonnes) ............................................................................................... 68
Table 31 – GHG emissions from Headquarters in Florianópolis (in tonnes) ................................................. 70
Table 32 – GHG emissions from Office in São Paulo (in tonnes) .................................................................. 71
Table 33 – Scope1 GHG emissions – Corporate Participation ...................................................................... 72
Table 34 – Scope3 GHG emissions – Corporate Participation ...................................................................... 73
Table 35-Tractebel Energia GHG emissions by Scope and power plant - Corporate participation (tCO2e) . 74
Table 36 - GHG emissions of UHET (in tonnes) ............................................................................................ 76
Table 37- GHG emissions the UHIT (in tonnes) ............................................................................................ 78
Table 38 - GHG emissions of UHMA (in tonnes) ........................................................................................... 80
Table 39 - GHG emissions of UTIB (in tonnes) ............................................................................................. 82
Table 40 – Comparison of emissions for each power plant in the in the Operational Control and Corporate Participation approaches ............................................................................................................................... 83
Table 41 – Uncertainty analysis for the plants/offices of Tractebel Energia .................................................. 85
Table 42 – Tractebel Energia GHG emissions by Scope in tCO2e – Operational Control (2010-2015) ....... 87
Table 43 - percentage of ethanol added to gasoline and biodiesel in diesel oil (2010 – 2015) ..................... 90
Table44 -Tractebel Energia GHG emissions by Scope in tCO2e Corporate Participation (2010-2015) ....... 91
Table 45 - GHG emission Balance of Tractebel Energia – Operational Control .......................................... 125
Table 46 – GHG emission balance of Tractebel Energia - Corporate Participation .................................... 126
Table 47 - 2015 GHG emissions indicators for Tractebel Energia .............................................................. 129
Table 48 – 2015 GHG emissions indicators per scope ............................................................................... 130
Table 49 - GHG emissions indicators from stationary combustion for fossil fuel power plants ................... 131
9
Table 50 - GHG emissions indicators from stationary combustion for biomass thermoelectric power plants ..................................................................................................................................................................... 131
Table 51 - Evolution of emissions per energy generated from Tractebel Energia in tCO2e/MWh (2010-2015) ..................................................................................................................................................................... 131
Table 52 - GHG emissions by gas type and source of Tractebel Energia - Operational Control ................ 140
Table 53 - GHG emissions by gas type and source of Tractebel Energia-Corporate Participation ............. 141
Table 54 - 2015 emission factors for stationary combustion ....................................................................... 142
Table 55 - 2015 emission factors for mobile combustion by fuel type ......................................................... 143
Table 56 – 2015 emission factors for air travel ............................................................................................ 143
Table 57 - 2015 emission factors of SIN ...................................................................................................... 144
Table 58 - Emission factors for CO2, CH4 and N2O from the energy sector for coal bituminous steam and sub-bituminous (in kg/TJ)............................................................................................................................. 144
Table 59 - lower calorific value (PCI) monitored by Tractebel Energia ........................................................ 145
Table 60 - Evolution of annual average emission factor of SIN, percentage of biodiesel added to diesel and ethanol added to gasoline (2012-2015) ....................................................................................................... 145
Table 61 - The desulphurization process emissions based on the amount of plaster UTCH produced in 2015 ..................................................................................................................................................................... 147
Table 62 - Emission factor for CO2 emissions generated in the incineration .............................................. 149
Table 63 - Representation of the sources of emissions in each scope for the wind power plants – operational control ....................................................................................................................................... 150
Table 64 - Representativeness of the sources of emissions for each scope to the hydropower plants – operational control ....................................................................................................................................... 150
Table 65 - Representativeness of the sources of emissions in each scope to the SHPS and the photovoltaic plant – operational control............................................................................................................................ 152
Table 66 - Representativeness of the sources of emissions in each scope to the thermoelectric fossil fuel – operational control ....................................................................................................................................... 153
Table 67 – representativity of the sources of emissions in each scope to the thermoelectric plants to biomass – operational control ...................................................................................................................... 154
Table 68 - Representativeness of the sources of emissions in each scope to the offices and Tractebel Energia – operational control ....................................................................................................................... 155
Table 69 - Representativeness of the sources of emissions in each scope to UHET, UHMA, UHIT and Tractebel Energia-Corporate Participation .................................................................................................. 155
Table 70 - Value and reference of the emission factor uncertainty ............................................................. 157
Table 71 - Classification of uncertainty for measurements .......................................................................... 158
Table 72 - classification of activity data uncertainty ..................................................................................... 158
Table 73 - Monthly wind emission reduction estimate for renewable energy generation (tCO2e) .............. 167
Table 74 - Monthly SHPS and photovoltaic power plant emission reduction estimate for generation of renewable energy (tCO2e)........................................................................................................................... 167
Table 75 - Estimated monthly emission reduction of thermal power plants for generation of renewable energy (tCO2e) ............................................................................................................................................ 168
Table 76 – Estimated monthly emission reduction of Hydroelectric Power Plants for generation of renewable energy (tCO2e)........................................................................................................................... 168
Table 77 – Reduction of GHG emissions renewable electricity generation of Tractebel Energia - Operational Control ......................................................................................................................................................... 170
Table 78 -GHG emission reduction of generation of renewable electricity of Tractebel Energia-Corporate Participation ................................................................................................................................................. 171
Table 79 -GHG emission reduction of planting of Tractebel Energia – Operational Control ....................... 173
Table 80 -GHG emission reduction of planting of Tractebel Energia Corporate Participation ..................... 174
Table 81 – GHG emissions of 100% of emissions – UHET (in tonnes) ....................................................... 176
Table 82-GHG emissions the UHIT 100% of emissions – (in tonnes) ......................................................... 178
Table 83 -GHG emissions of UHMA-100% of the emissions (in tonnes) .................................................... 180
Table 84 – Global warming Power of greenhouse gases ............................................................................ 181
10
1. Abbreviations and Acronyms
AMA Environmental Organizational Unit of Tractebel Energia
AR4 4th Assessment Report published by the IPCC (Fourth Assessment Report: Climate Change,
2007)
ASHRAE American Society of Heating, Refrigerating and Air-Conditioning Engineers
CEUT Tractebel Energia Utilities Center
CH4 Methane
CO2 Carbon dioxide
UNFCCC United Nations Framework Convention on Climate Change
DEFRA Department for Environment, Food and Rural Affairs
DENORRIS Legal Affairs Organizational Unit
DOC Degradable Organic Carbon
DOP Organizational Unit of Production Operation for Tractebel Energia
DPS Organizational Unit of Documentation, supplies and services of Tractebel Energia
GEE Greenhouse Gas
GWP Global Warming Potential
HCFCs Hydrochlorofluorocarbons
HFCs Hydrofluorocarbons
IPCC Intergovernmental Panel on Climate Change
ISO International Organization for Standardization
MAP Ministry of Agriculture, Livestock and Supply
MCTI Ministry of Science, Technology and Innovation
MDL Clean Development Mechanism
N2O Nitrous oxide
NF3 Nitrogen trifluoride
OMM World Meteorological Organization ("WMO")
PFCs Perfluorocarbons
UNEP United Nations Environment Programme
11
RC Responsible for collecting data from the greenhouse gas inventory of Tractebel Energia
CERs Certified Emission Reduction (CER)
SAR IPCC - Second Assessment Report: Climate Change, 1995
SEPRO Energy Production Sector of Tractebel Energia
SESMT The Security Industry and Occupational Medicine of Tractebel Energia
SF6 Sulphur hexafluoride
NIS The National Grid
TMSH Organizational Unit Maintenance of Hydroelectric Central of Tractebel Energia
TMSS Central organizational unit of Tractebel Energia Systems Maintenance
TMST Central maintenance organizational unit of thermal power plants of Tractebel Energia
WBCSD World Business Council for Sustainable Development
WRI World Resources Institute
12
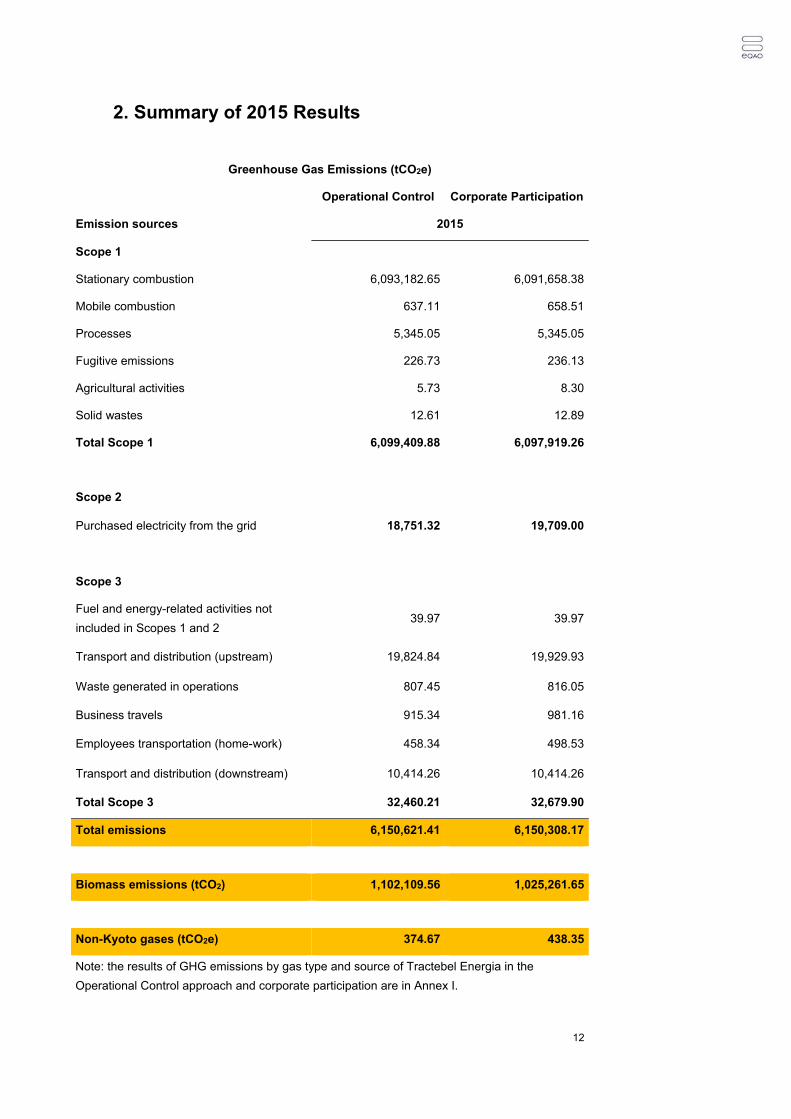
2. Summary of 2015 Results
Greenhouse Gas Emissions (tCO2e)
Operational Control Corporate Participation
Emission sources 2015
Scope 1
Stationary combustion 6,093,182.65 6,091,658.38
Mobile combustion 637.11 658.51
Processes 5,345.05 5,345.05
Fugitive emissions 226.73 236.13
Agricultural activities 5.73 8.30
Solid wastes 12.61 12.89
Total Scope 1 6,099,409.88 6,097,919.26
Scope 2
Purchased electricity from the grid 18,751.32 19,709.00
Scope 3
Fuel and energy-related activities not
included in Scopes 1 and 2 39.97 39.97
Transport and distribution (upstream) 19,824.84 19,929.93
Waste generated in operations 807.45 816.05
Business travels 915.34 981.16
Employees transportation (home-work) 458.34 498.53
Transport and distribution (downstream) 10,414.26 10,414.26
Total Scope 3 32,460.21 32,679.90
Total emissions 6,150,621.41 6,150,308.17
Biomass emissions (tCO2) 1,102,109.56 1,025,261.65
Non-Kyoto gases (tCO2e) 374.67 438.35
Note: the results of GHG emissions by gas type and source of Tractebel Energia in the
Operational Control approach and corporate participation are in Annex I.
13
3. Introduction
In the same way that Tractebel Energia prioritizes and develops projects from
renewable sources (including under the Clean Development Mechanism – CDM) and
Research and Development (R&D), since 2010, the company has been developing its
annual inventory of greenhouse gases (GHG) in line with its policy on climate change.
This is a major strategic corporate tool in the context of climate change, which
allows the company to know its processes better, evaluate and improve its
management system, particularly in relation to GHG emissions.
The inventory incorporates 27 plants in operation during 2015, located in 12
Brazilian States, as well as their administrative headquarters and its Office of Energy
Trading located in Florianópolis (SC) and São Paulo capital, respectively, totaling 29
organizational units considered in this study.
This inventory was developed based on principles and guidelines established
by the accounting and quantification specifications of the Brazilian GHG Protocol
Program and in accordance with ISO 14064-1.
In its constant reach for the highest sustainability standards and considering the
inventory an important management tool, Tractebel Energia has entered its collecting
GHG data in its in its Integrated Management System, applying it to all its operational
plants and their offices.
In 2016, following the example of the previous years and through external
verification/audit, the company aimed at attesting to the quality and credibility of its
2015 GHG inventory and its associated quality management information system.
Tractebel Energia hired SGS, a renowned company in the country for verification of
GHG inventory in the energy sector and accredited for this purpose by INMETRO.
This report presents the Tractebel Energia GHG inventory for the year 2015,
showing the GHG emissions of the company as a whole and its organizational units –
plants in operation (27) and their offices (2) – in Scopes 1, 2 and 3 Scopes, as well as
other important information related to them.
14
4. Tractebel Energia S.A.
Corporate name: Tractebel Energia S.A.
CNPJ (Corporate Taxpayer Registry): 02.474.103/0001-19
Economic Sector: Electricity and Gas
Subsector: Electricity, gas and other utilities
Scope: Electricity-generating plants operation and marketing of electric power.
Address: R. Paschoal Apóstolo Pítsica, nº 5064, 88025-255, Florianópolis, SC
Website: http://www.tractebelenergia.com.br/
Institutional information:
Tractebel Energia operates in the electricity-generating plants operation, as well
as an active agent in marketing. The largest private energy-generating of Brazil, the
company is headquartered in Florianopólis, Santa Catarina, and its plants are installed
in five regions of the country, specifically in the States of Rio Grande do Sul, Santa
Catarina, Paraná, São Paulo, Minas Gerais, Mato Grosso do Sul, Mato Grosso,
Goiás, Tocantins, Maranhão, Piauí and Ceará.
In 2015, Tractebel Energia had a generator Park with 27 (twenty-seven) plants
in operation: 7 (seven) of wind, 9 (nine) hydropower plants, 3 (three) small hydropower
plants, 1 (one) solar plant and 7 (seven) thermal power plants, and (3) three of its
thermal power plants are operated with biomass (bagasse from sugar cane and wood
waste).
Tractebel Energia is controlled by Engie Brazil, previously known as GDF SUEZ
Energy Latin America Participations Ltd. (a subsidiary of ENGIE group, a world leader
in energy), which owns 68.71% of its share capital.
Based on the vision of being the best energy company in Brazil in a sustainable
way, Tractebel Energia, aligned with its policy on climate change, held its first
inventory of greenhouse gas emissions in 2011 – concerning the company's
operations in 2010 – by following the principles of the GHG Protocol. The company
aims at identifying the sources of GHG emissions, quantifying emissions and using the
inventory as a tool for management and decision-making.
15
5. Company in charge and professionals involved in
the preparation of the inventory
The EQAO is the company in charge the preparation of the GHG inventory of
2015 for Tractebel Energia, which received all the necessary information for the
preparation of the GHG Inventory of 2015.
The item 5.1 presents the EQAO professionals involved in the work. There are
also presented the Tractebel Energia professionals who provided and centralized
information on Tractebel Energia, which include representatives of the AMA and RCs
of the plants and offices.
In addition to these professionals, there was significant participation of
Tractebel Energia representatives of DOP, DPS, DJU and power plants, SEPRE,
SESMT, CEUT and administrative sectors, as well as the TMSH, TMST and TMSS.
5.1. Responsible-EQAO
Those responsible for the preparation of the inventory of Tractebel Energia
2015 by the EQAO are:
Adelino Ricardo J. Esparta-Director and founding partner of EQAO –
Coordinator of GHG Inventory;
Karen Midori Nagai - EQAO Projects Analyst.
5.2. Responsible-Tractebel Energia (AMA and RCs)
The following professionals of Tractebel Energia contributed to the data
collection for the preparation of the GHG inventory for the year 2015.
16
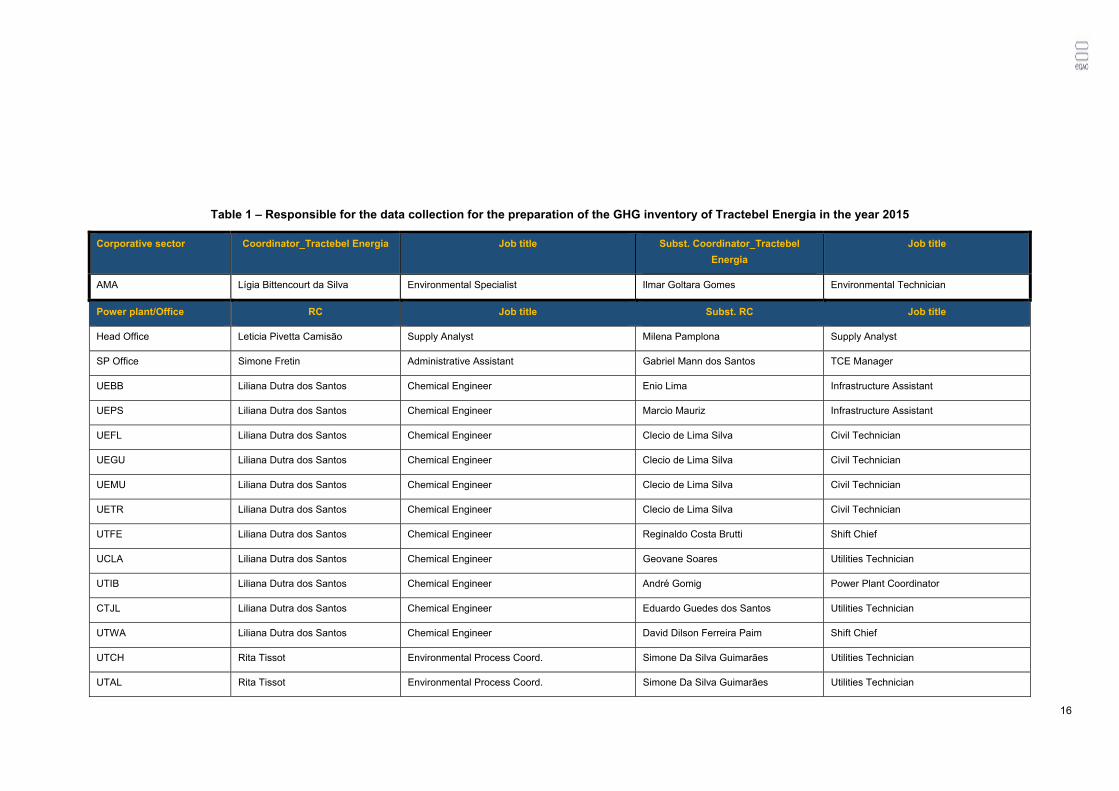
Table 1 – Responsible for the data collection for the preparation of the GHG inventory of Tractebel Energia in the year 2015
Corporative sector Coordinator_Tractebel Energia Job title Subst. Coordinator_Tractebel
Energia
Job title
AMA Lígia Bittencourt da Silva Environmental Specialist Ilmar Goltara Gomes Environmental Technician
Power plant/Office RC Job title Subst. RC Job title
Head Office Leticia Pivetta Camisão Supply Analyst Milena Pamplona Supply Analyst
SP Office Simone Fretin Administrative Assistant Gabriel Mann dos Santos TCE Manager
UEBB Liliana Dutra dos Santos Chemical Engineer Enio Lima Infrastructure Assistant
UEPS Liliana Dutra dos Santos Chemical Engineer Marcio Mauriz Infrastructure Assistant
UEFL Liliana Dutra dos Santos Chemical Engineer Clecio de Lima Silva Civil Technician
UEGU Liliana Dutra dos Santos Chemical Engineer Clecio de Lima Silva Civil Technician
UEMU Liliana Dutra dos Santos Chemical Engineer Clecio de Lima Silva Civil Technician
UETR Liliana Dutra dos Santos Chemical Engineer Clecio de Lima Silva Civil Technician
UTFE Liliana Dutra dos Santos Chemical Engineer Reginaldo Costa Brutti Shift Chief
UCLA Liliana Dutra dos Santos Chemical Engineer Geovane Soares Utilities Technician
UTIB Liliana Dutra dos Santos Chemical Engineer André Gomig Power Plant Coordinator
CTJL Liliana Dutra dos Santos Chemical Engineer Eduardo Guedes dos Santos Utilities Technician
UTWA Liliana Dutra dos Santos Chemical Engineer David Dilson Ferreira Paim Shift Chief
UTCH Rita Tissot Environmental Process Coord. Simone Da Silva Guimarães Utilities Technician
UTAL Rita Tissot Environmental Process Coord. Simone Da Silva Guimarães Utilities Technician
17
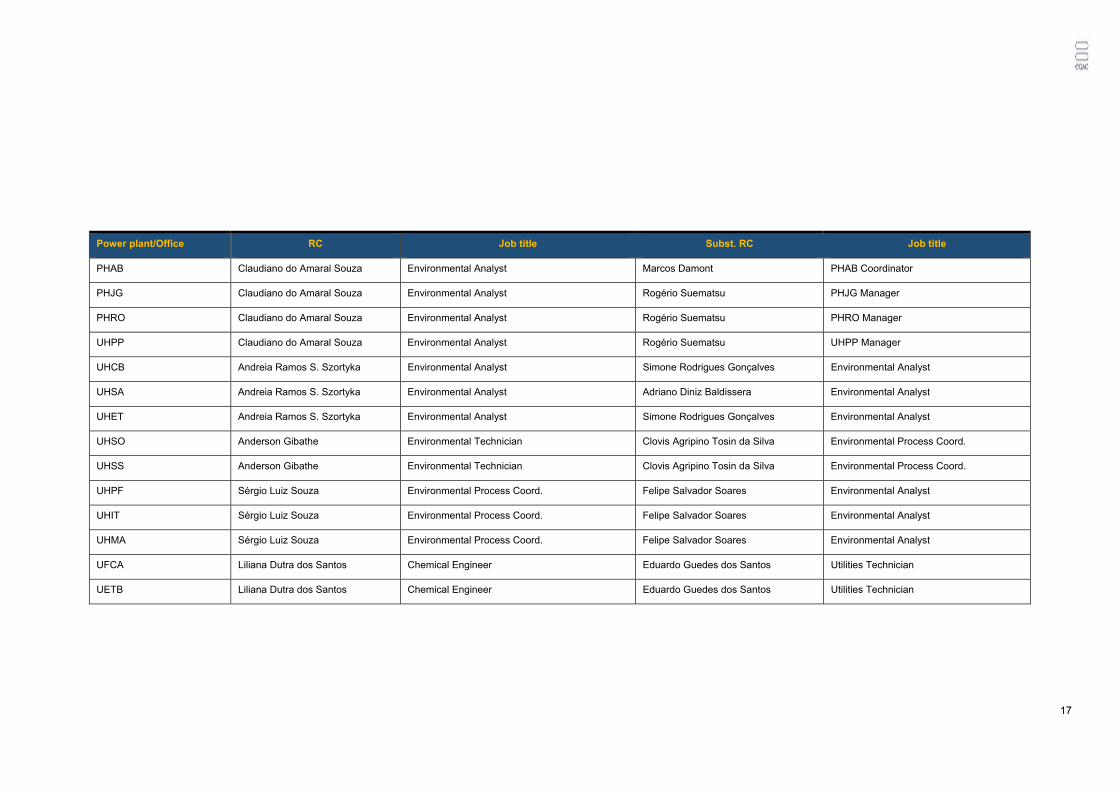
Power plant/Office RC Job title Subst. RC Job title
PHAB Claudiano do Amaral Souza Environmental Analyst Marcos Damont PHAB Coordinator
PHJG Claudiano do Amaral Souza Environmental Analyst Rogério Suematsu PHJG Manager
PHRO Claudiano do Amaral Souza Environmental Analyst Rogério Suematsu PHRO Manager
UHPP Claudiano do Amaral Souza Environmental Analyst Rogério Suematsu UHPP Manager
UHCB Andreia Ramos S. Szortyka Environmental Analyst Simone Rodrigues Gonçalves Environmental Analyst
UHSA Andreia Ramos S. Szortyka Environmental Analyst Adriano Diniz Baldissera Environmental Analyst
UHET Andreia Ramos S. Szortyka Environmental Analyst Simone Rodrigues Gonçalves Environmental Analyst
UHSO Anderson Gibathe Environmental Technician Clovis Agripino Tosin da Silva Environmental Process Coord.
UHSS Anderson Gibathe Environmental Technician Clovis Agripino Tosin da Silva Environmental Process Coord.
UHPF Sérgio Luiz Souza Environmental Process Coord. Felipe Salvador Soares Environmental Analyst
UHIT Sérgio Luiz Souza Environmental Process Coord. Felipe Salvador Soares Environmental Analyst
UHMA Sérgio Luiz Souza Environmental Process Coord. Felipe Salvador Soares Environmental Analyst
UFCA Liliana Dutra dos Santos Chemical Engineer Eduardo Guedes dos Santos Utilities Technician
UETB Liliana Dutra dos Santos Chemical Engineer Eduardo Guedes dos Santos Utilities Technician
6. Methodology
For the preparation of the GHG emissions inventory, GHG Protocol guidelines,
specifications of the Brazilian GHG Protocol Program and ISO 14064:2007 were
considered. IPCC (2006) methodologies and guidelines were also used in the
preparation of this inventory in order to meet specificities of emission sources from
Tractebel Energia. Details regarding bases and references used are described in
section 6.4.
6.1. Included Gases
This report presents the results of the greenhouse gas inventory of Tractebel
Energia S/A regarding its operations in 2015. For effect, five gases and the two
families of internationally recognized gases as greenhouse gases were considered, as
presented in the Kyoto Protocol:
Carbon dioxide (CO2);
Methane (CH4);
Nitrous oxide (N2O);
Sulphur hexafluoride (SF6);
Nitrogen trifluoride (NF3);
Hydrofluorocarbons (HFCs);
Perfluorocarbons (PFCs).
Emissions of CH4, N2O, SF6, NF3, HFCs and PFCs are expressed as CO2e,
whereas the respective global warming potential ("GWP") of each gas, according to
the IPCC reports and the ASHRAE. The GWP of each gas is presented in annex VIII.
In the case of Tractebel, the gases identified are: CO2, CH4, N2O, SF6 and HFC
(HFC-134A, R-410A and R-407C). It is worth mentioning that HCFCs emissions
(HCFC-22 or R-22) were also identified, which are not considered by the Kyoto
Protocol. However, R-22 emissions were reported separately in this report.
6.2. Boundaries of the GHG Emissions Inventory
The first step for preparing an inventory is to set boundaries for identifying GHG
emission sources for accounting. The selected boundaries used for emissions
accounting of Tractebel Energia are described below.
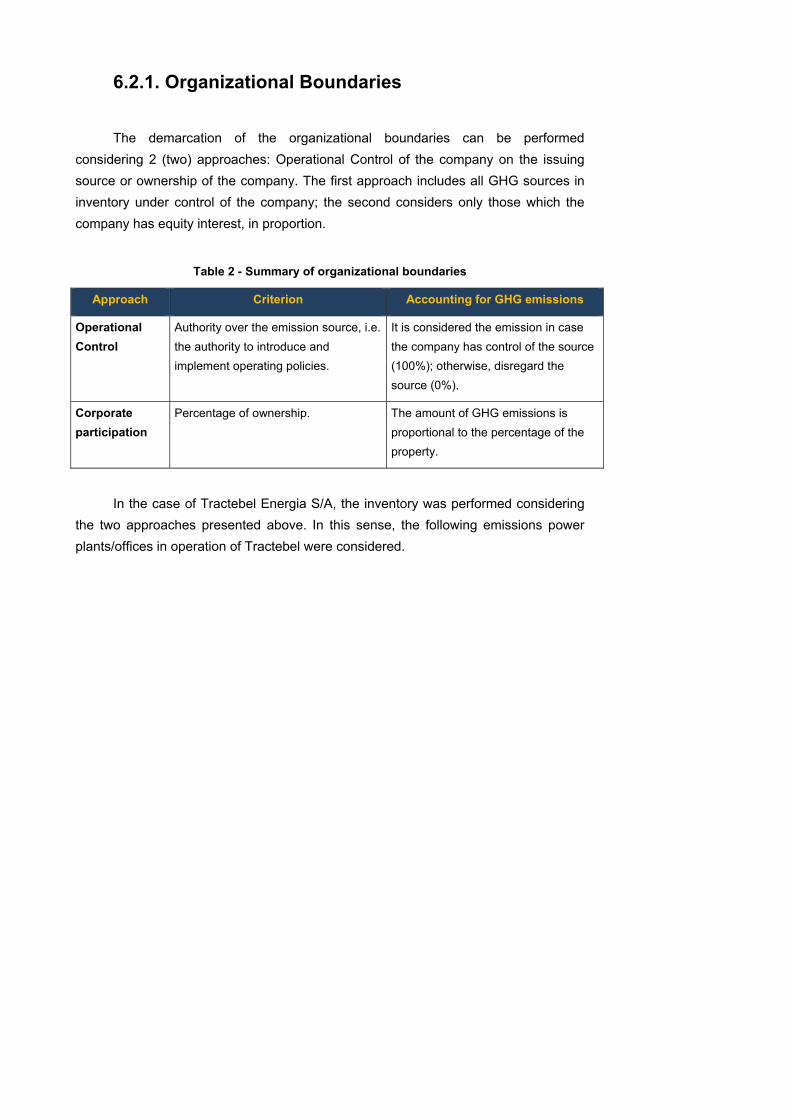
6.2.1. Organizational Boundaries
The demarcation of the organizational boundaries can be performed
considering 2 (two) approaches: Operational Control of the company on the issuing
source or ownership of the company. The first approach includes all GHG sources in
inventory under control of the company; the second considers only those which the
company has equity interest, in proportion.
Table 2 - Summary of organizational boundaries
Approach Criterion Accounting for GHG emissions
Operational
Control
Authority over the emission source, i.e.
the authority to introduce and
implement operating policies.
It is considered the emission in case
the company has control of the source
(100%); otherwise, disregard the
source (0%).
Corporate
participation
Percentage of ownership. The amount of GHG emissions is
proportional to the percentage of the
property.
In the case of Tractebel Energia S/A, the inventory was performed considering
the two approaches presented above. In this sense, the following emissions power
plants/offices in operation of Tractebel were considered.
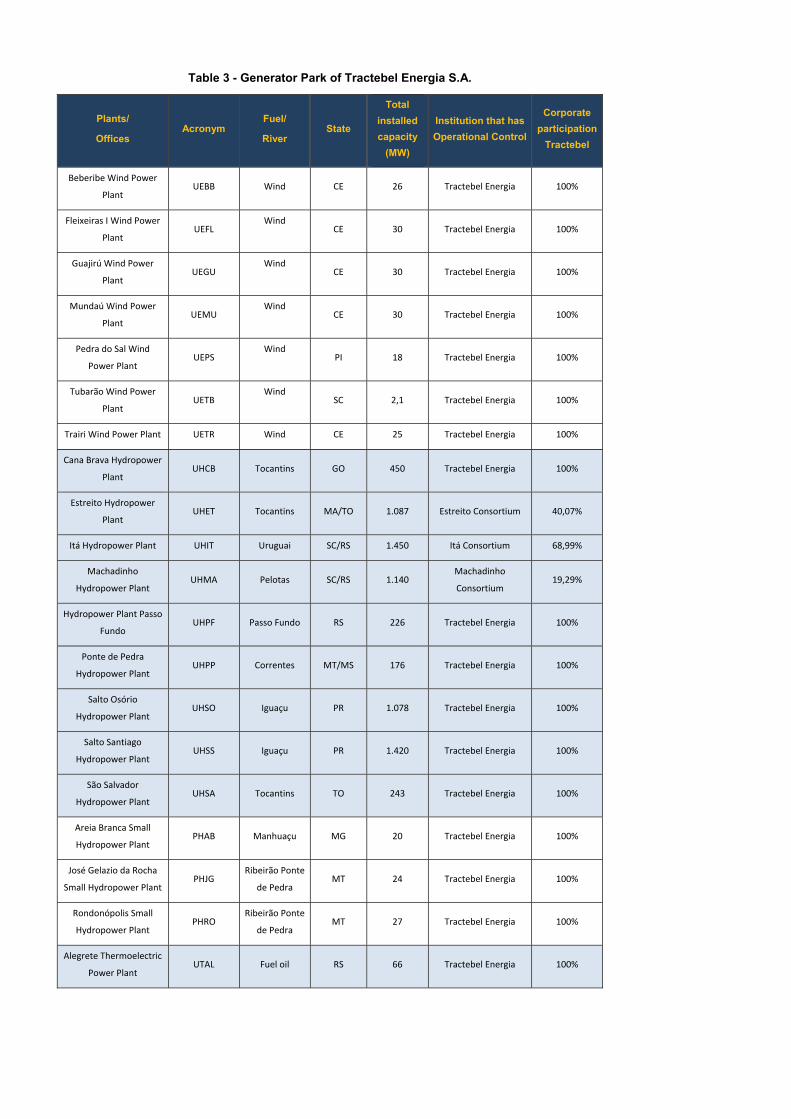
Table 3 - Generator Park of Tractebel Energia S.A.
Plants/
Offices Acronym
Fuel/
River State
Total
installed
capacity
(MW)
Institution that has
Operational Control
Corporate
participation
Tractebel
Beberibe Wind Power
Plant UEBB Wind CE 26 Tractebel Energia 100%
Fleixeiras I Wind Power
Plant UEFL
Wind CE 30 Tractebel Energia 100%
Guajirú Wind Power
Plant UEGU
Wind CE 30 Tractebel Energia 100%
Mundaú Wind Power
Plant UEMU
Wind CE 30 Tractebel Energia 100%
Pedra do Sal Wind
Power Plant UEPS
Wind PI 18 Tractebel Energia 100%
Tubarão Wind Power
Plant UETB
Wind SC 2,1 Tractebel Energia 100%
Trairi Wind Power Plant UETR Wind CE 25 Tractebel Energia 100%
Cana Brava Hydropower
Plant UHCB Tocantins GO 450 Tractebel Energia 100%
Estreito Hydropower
Plant UHET Tocantins MA/TO 1.087 Estreito Consortium 40,07%
Itá Hydropower Plant UHIT Uruguai SC/RS 1.450 Itá Consortium 68,99%
Machadinho
Hydropower Plant UHMA Pelotas SC/RS 1.140
Machadinho
Consortium 19,29%
Hydropower Plant Passo
Fundo UHPF Passo Fundo RS 226 Tractebel Energia 100%
Ponte de Pedra
Hydropower Plant UHPP Correntes MT/MS 176 Tractebel Energia 100%
Salto Osório
Hydropower Plant UHSO Iguaçu PR 1.078 Tractebel Energia 100%
Salto Santiago
Hydropower Plant UHSS Iguaçu PR 1.420 Tractebel Energia 100%
São Salvador
Hydropower Plant UHSA Tocantins TO 243 Tractebel Energia 100%
Areia Branca Small
Hydropower Plant PHAB Manhuaçu MG 20 Tractebel Energia 100%
José Gelazio da Rocha
Small Hydropower Plant PHJG
Ribeirão Ponte
de Pedra MT 24 Tractebel Energia 100%
Rondonópolis Small
Hydropower Plant PHRO
Ribeirão Ponte
de Pedra MT 27 Tractebel Energia 100%
Alegrete Thermoelectric
Power Plant UTAL Fuel oil RS 66 Tractebel Energia 100%
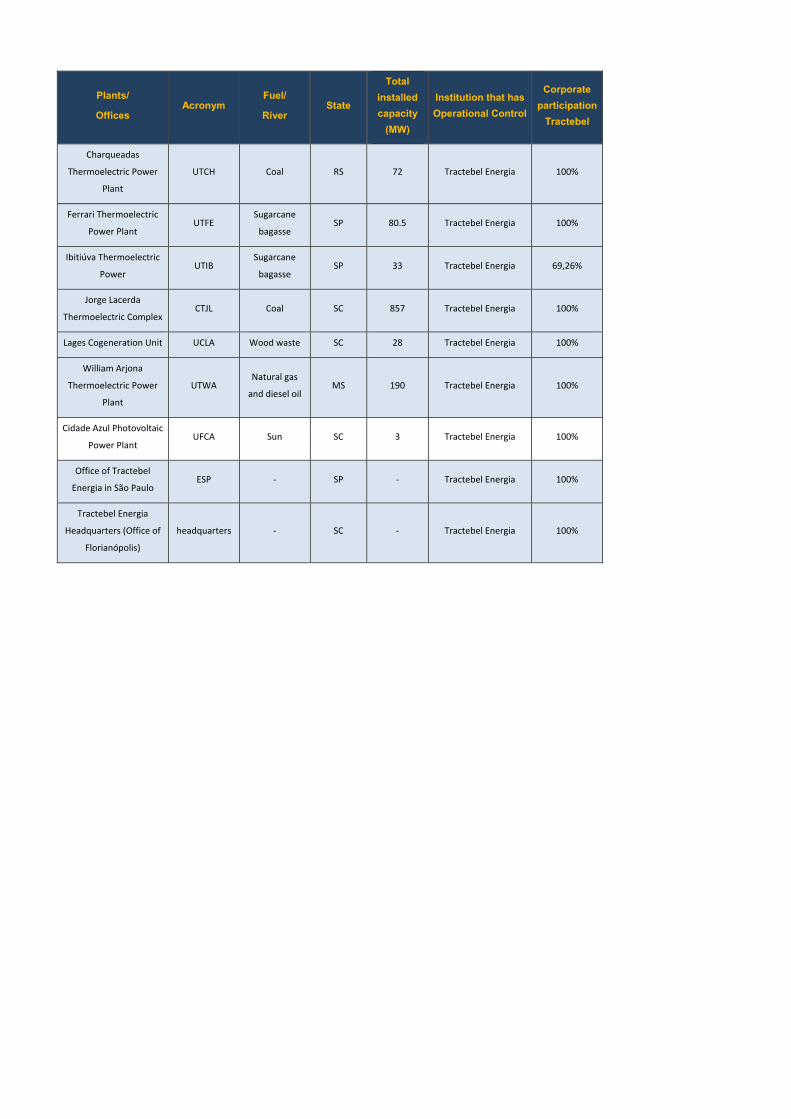
Plants/
Offices Acronym
Fuel/
River State
Total
installed
capacity
(MW)
Institution that has
Operational Control
Corporate
participation
Tractebel
Charqueadas
Thermoelectric Power
Plant
UTCH Coal RS 72 Tractebel Energia 100%
Ferrari Thermoelectric
Power Plant UTFE
Sugarcane
bagasse SP 80.5 Tractebel Energia 100%
Ibitiúva Thermoelectric
Power UTIB
Sugarcane
bagasse SP 33 Tractebel Energia 69,26%
Jorge Lacerda
Thermoelectric Complex CTJL Coal SC 857 Tractebel Energia 100%
Lages Cogeneration Unit UCLA Wood waste SC 28 Tractebel Energia 100%
William Arjona
Thermoelectric Power
Plant
UTWA Natural gas
and diesel oil MS 190 Tractebel Energia 100%
Cidade Azul Photovoltaic
Power Plant UFCA Sun SC 3 Tractebel Energia 100%
Office of Tractebel
Energia in São Paulo ESP ‐ SP ‐ Tractebel Energia 100%
Tractebel Energia
Headquarters (Office of
Florianópolis)
headquarters ‐ SC ‐ Tractebel Energia 100%
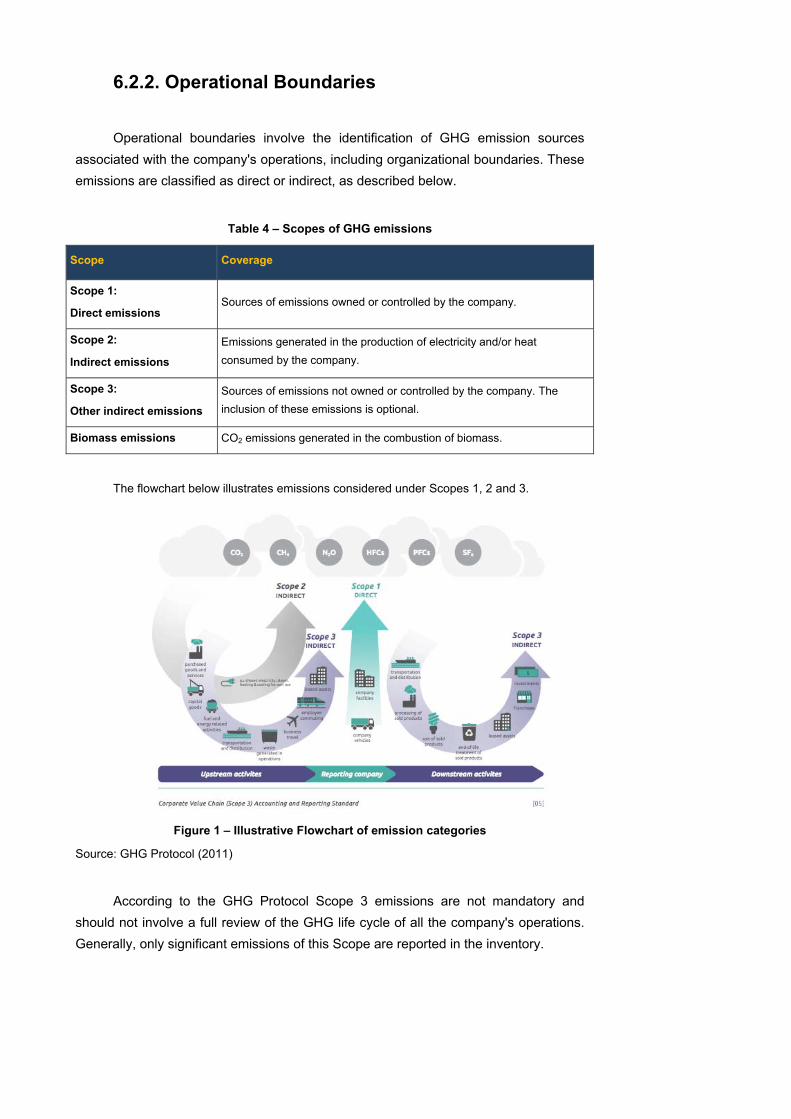
6.2.2. Operational Boundaries
Operational boundaries involve the identification of GHG emission sources
associated with the company's operations, including organizational boundaries. These
emissions are classified as direct or indirect, as described below.
Table 4 – Scopes of GHG emissions
Scope Coverage
Scope 1:
Direct emissions Sources of emissions owned or controlled by the company.
Scope 2:
Indirect emissions
Emissions generated in the production of electricity and/or heat
consumed by the company.
Scope 3:
Other indirect emissions
Sources of emissions not owned or controlled by the company. The
inclusion of these emissions is optional.
Biomass emissions CO2 emissions generated in the combustion of biomass.
The flowchart below illustrates emissions considered under Scopes 1, 2 and 3.
Figure 1 – Illustrative Flowchart of emission categories
Source: GHG Protocol (2011)
According to the GHG Protocol Scope 3 emissions are not mandatory and
should not involve a full review of the GHG life cycle of all the company's operations.
Generally, only significant emissions of this Scope are reported in the inventory.
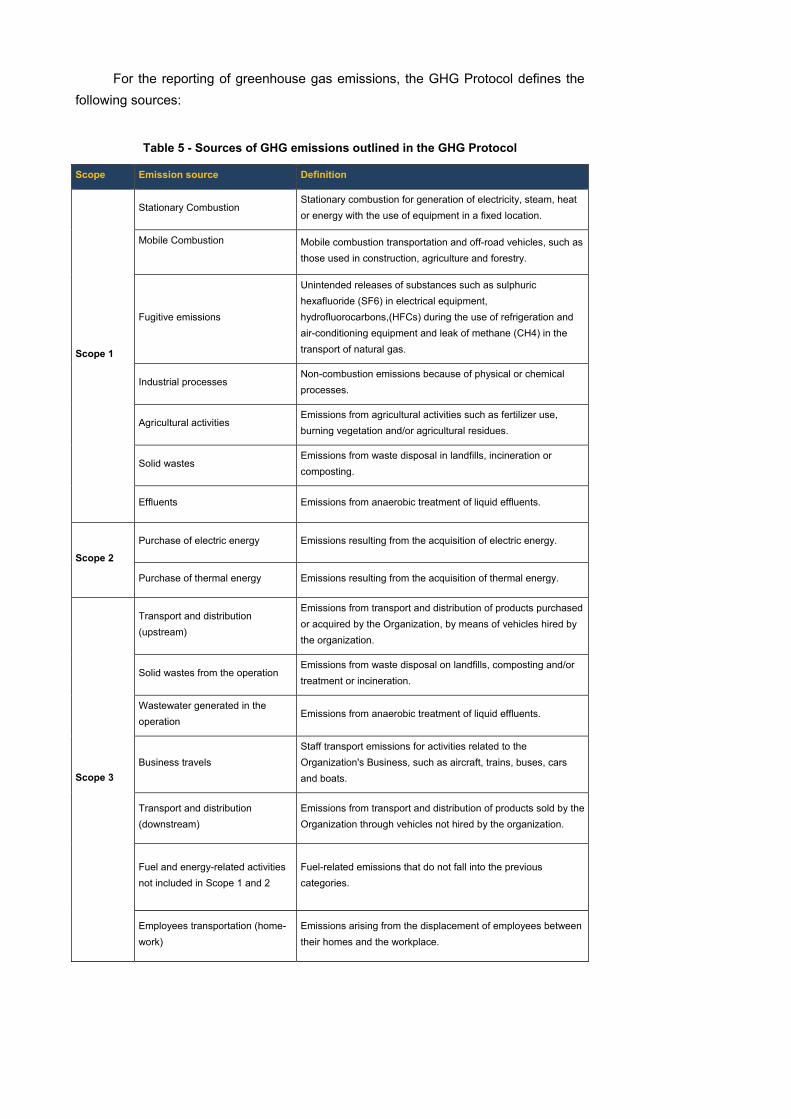
For the reporting of greenhouse gas emissions, the GHG Protocol defines the
following sources:
Table 5 - Sources of GHG emissions outlined in the GHG Protocol
Scope Emission source Definition
Scope 1
Stationary Combustion Stationary combustion for generation of electricity, steam, heat
or energy with the use of equipment in a fixed location.
Mobile Combustion
Mobile combustion transportation and off-road vehicles, such as
those used in construction, agriculture and forestry.
Fugitive emissions
Unintended releases of substances such as sulphuric
hexafluoride (SF6) in electrical equipment,
hydrofluorocarbons,(HFCs) during the use of refrigeration and
air-conditioning equipment and leak of methane (CH4) in the
transport of natural gas.
Industrial processes Non-combustion emissions because of physical or chemical
processes.
Agricultural activities Emissions from agricultural activities such as fertilizer use,
burning vegetation and/or agricultural residues.
Solid wastes Emissions from waste disposal in landfills, incineration or
composting.
Effluents Emissions from anaerobic treatment of liquid effluents.
Scope 2
Purchase of electric energy Emissions resulting from the acquisition of electric energy.
Purchase of thermal energy Emissions resulting from the acquisition of thermal energy.
Scope 3
Transport and distribution
(upstream)
Emissions from transport and distribution of products purchased
or acquired by the Organization, by means of vehicles hired by
the organization.
Solid wastes from the operation Emissions from waste disposal on landfills, composting and/or
treatment or incineration.
Wastewater generated in the
operation Emissions from anaerobic treatment of liquid effluents.
Business travels
Staff transport emissions for activities related to the
Organization's Business, such as aircraft, trains, buses, cars
and boats.
Transport and distribution
(downstream)
Emissions from transport and distribution of products sold by the
Organization through vehicles not hired by the organization.
Fuel and energy-related activities
not included in Scope 1 and 2
Fuel-related emissions that do not fall into the previous
categories.
Employees transportation (home-
work)
Emissions arising from the displacement of employees between
their homes and the workplace.
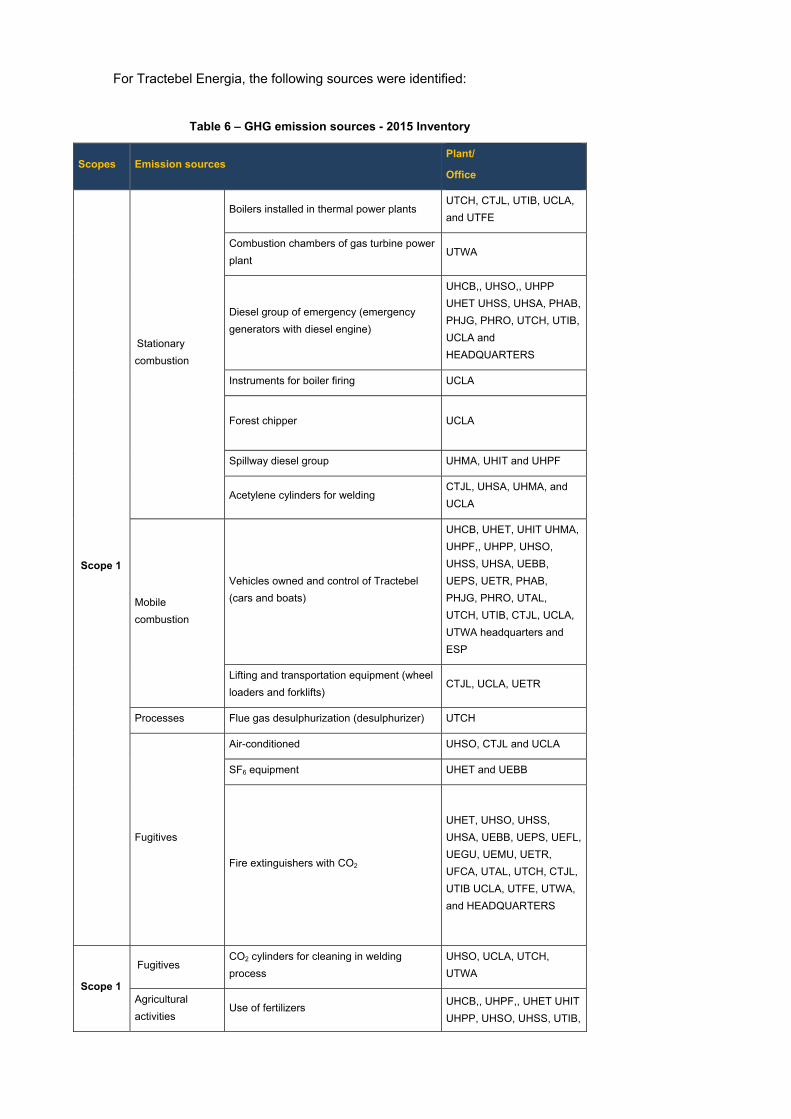
For Tractebel Energia, the following sources were identified:
Table 6 – GHG emission sources - 2015 Inventory
Scopes Emission sources Plant/
Office
Scope 1
Stationary
combustion
Boilers installed in thermal power plants UTCH, CTJL, UTIB, UCLA,
and UTFE
Combustion chambers of gas turbine power
plant UTWA
Diesel group of emergency (emergency
generators with diesel engine)
UHCB,, UHSO,, UHPP
UHET UHSS, UHSA, PHAB,
PHJG, PHRO, UTCH, UTIB,
UCLA and
HEADQUARTERS
Instruments for boiler firing UCLA
Forest chipper UCLA
Spillway diesel group UHMA, UHIT and UHPF
Acetylene cylinders for welding CTJL, UHSA, UHMA, and
UCLA
Mobile
combustion
Vehicles owned and control of Tractebel
(cars and boats)
UHCB, UHET, UHIT UHMA,
UHPF,, UHPP, UHSO,
UHSS, UHSA, UEBB,
UEPS, UETR, PHAB,
PHJG, PHRO, UTAL,
UTCH, UTIB, CTJL, UCLA,
UTWA headquarters and
ESP
Lifting and transportation equipment (wheel
loaders and forklifts) CTJL, UCLA, UETR
Processes Flue gas desulphurization (desulphurizer) UTCH
Fugitives
Air-conditioned UHSO, CTJL and UCLA
SF6 equipment UHET and UEBB
Fire extinguishers with CO2
UHET, UHSO, UHSS,
UHSA, UEBB, UEPS, UEFL,
UEGU, UEMU, UETR,
UFCA, UTAL, UTCH, CTJL,
UTIB UCLA, UTFE, UTWA,
and HEADQUARTERS
Scope 1
Fugitives CO2 cylinders for cleaning in welding
process
UHSO, UCLA, UTCH,
UTWA
Agricultural
activities Use of fertilizers
UHCB,, UHPF,, UHET UHIT
UHPP, UHSO, UHSS, UTIB,
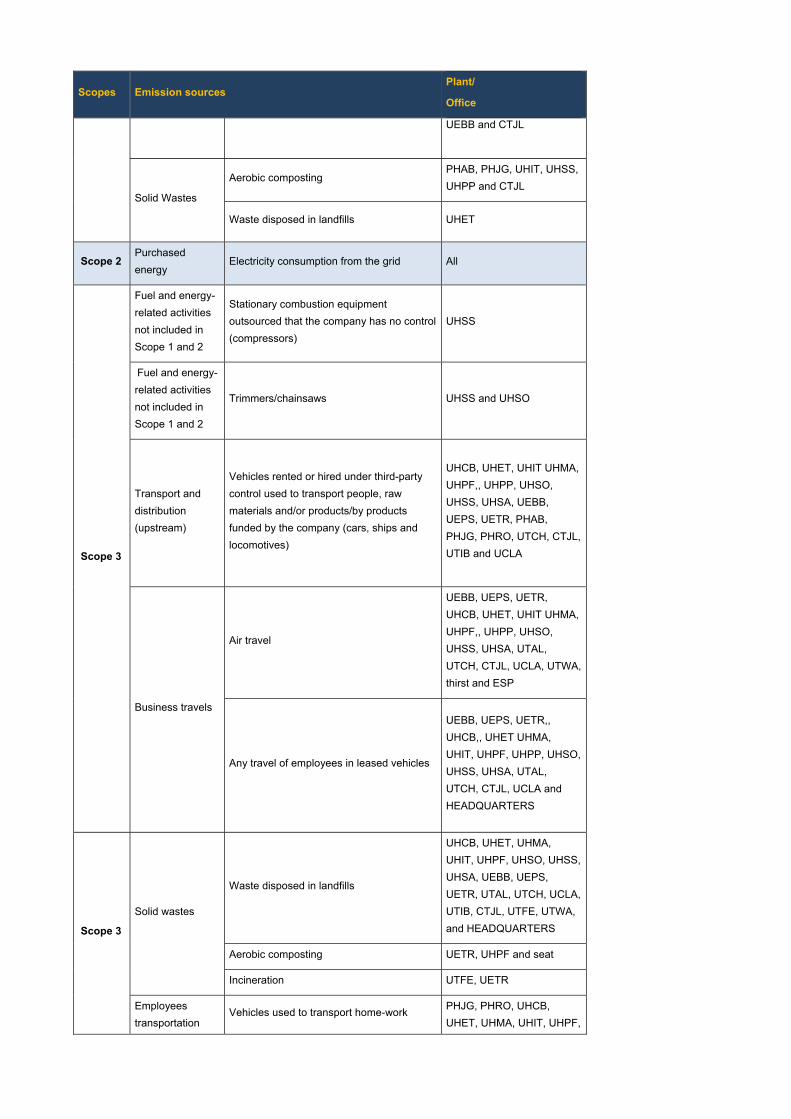
Scopes Emission sources Plant/
Office
UEBB and CTJL
Solid Wastes
Aerobic composting PHAB, PHJG, UHIT, UHSS,
UHPP and CTJL
Waste disposed in landfills UHET
Scope 2 Purchased
energy Electricity consumption from the grid All
Scope 3
Fuel and energy-
related activities
not included in
Scope 1 and 2
Stationary combustion equipment
outsourced that the company has no control
(compressors)
UHSS
Fuel and energy-
related activities
not included in
Scope 1 and 2
Trimmers/chainsaws UHSS and UHSO
Transport and
distribution
(upstream)
Vehicles rented or hired under third-party
control used to transport people, raw
materials and/or products/by products
funded by the company (cars, ships and
locomotives)
UHCB, UHET, UHIT UHMA,
UHPF,, UHPP, UHSO,
UHSS, UHSA, UEBB,
UEPS, UETR, PHAB,
PHJG, PHRO, UTCH, CTJL,
UTIB and UCLA
Business travels
Air travel
UEBB, UEPS, UETR,
UHCB, UHET, UHIT UHMA,
UHPF,, UHPP, UHSO,
UHSS, UHSA, UTAL,
UTCH, CTJL, UCLA, UTWA,
thirst and ESP
Any travel of employees in leased vehicles
UEBB, UEPS, UETR,,
UHCB,, UHET UHMA,
UHIT, UHPF, UHPP, UHSO,
UHSS, UHSA, UTAL,
UTCH, CTJL, UCLA and
HEADQUARTERS
Scope 3
Solid wastes
Waste disposed in landfills
UHCB, UHET, UHMA,
UHIT, UHPF, UHSO, UHSS,
UHSA, UEBB, UEPS,
UETR, UTAL, UTCH, UCLA,
UTIB, CTJL, UTFE, UTWA,
and HEADQUARTERS
Aerobic composting UETR, UHPF and seat
Incineration UTFE, UETR
Employees
transportation Vehicles used to transport home-work
PHJG, PHRO, UHCB,
UHET, UHMA, UHIT, UHPF,
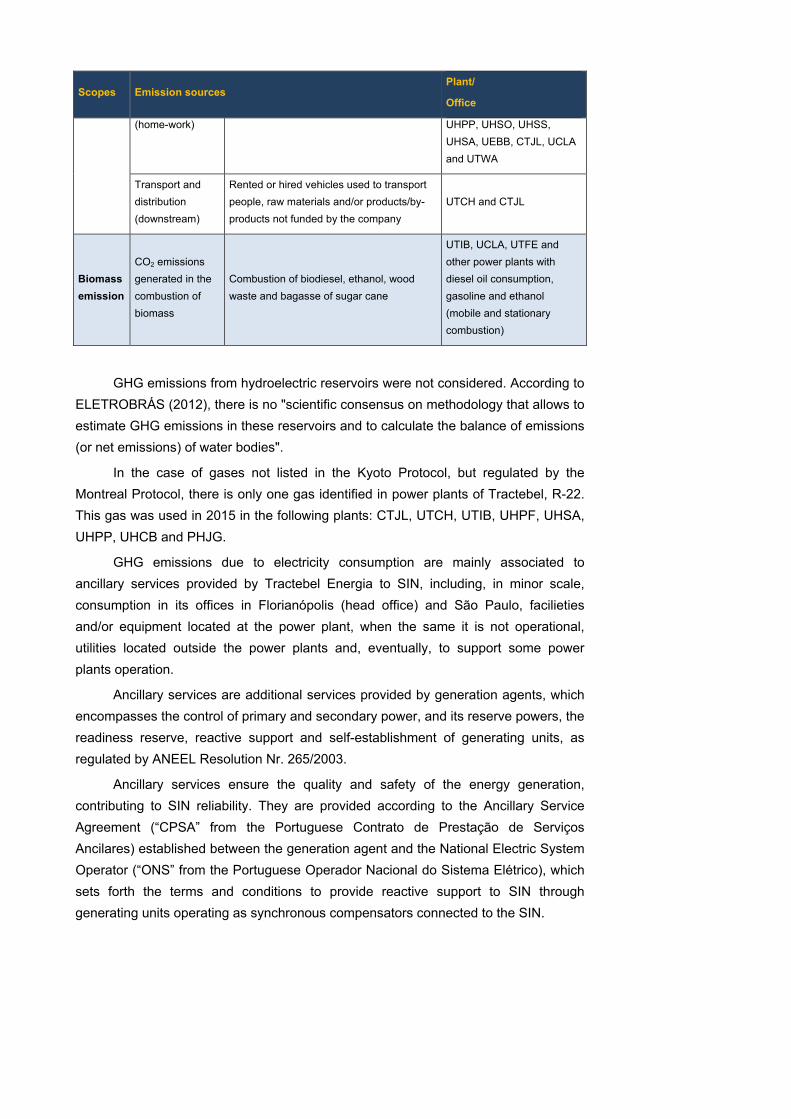
Scopes Emission sources Plant/
Office
(home-work) UHPP, UHSO, UHSS,
UHSA, UEBB, CTJL, UCLA
and UTWA
Transport and
distribution
(downstream)
Rented or hired vehicles used to transport
people, raw materials and/or products/by-
products not funded by the company
UTCH and CTJL
Biomass
emission
CO2 emissions
generated in the
combustion of
biomass
Combustion of biodiesel, ethanol, wood
waste and bagasse of sugar cane
UTIB, UCLA, UTFE and
other power plants with
diesel oil consumption,
gasoline and ethanol
(mobile and stationary
combustion)
GHG emissions from hydroelectric reservoirs were not considered. According to
ELETROBRÁS (2012), there is no "scientific consensus on methodology that allows to
estimate GHG emissions in these reservoirs and to calculate the balance of emissions
(or net emissions) of water bodies".
In the case of gases not listed in the Kyoto Protocol, but regulated by the
Montreal Protocol, there is only one gas identified in power plants of Tractebel, R-22.
This gas was used in 2015 in the following plants: CTJL, UTCH, UTIB, UHPF, UHSA,
UHPP, UHCB and PHJG.
GHG emissions due to electricity consumption are mainly associated to
ancillary services provided by Tractebel Energia to SIN, including, in minor scale,
consumption in its offices in Florianópolis (head office) and São Paulo, facilieties
and/or equipment located at the power plant, when the same it is not operational,
utilities located outside the power plants and, eventually, to support some power
plants operation.
Ancillary services are additional services provided by generation agents, which
encompasses the control of primary and secondary power, and its reserve powers, the
readiness reserve, reactive support and self-establishment of generating units, as
regulated by ANEEL Resolution Nr. 265/2003.
Ancillary services ensure the quality and safety of the energy generation,
contributing to SIN reliability. They are provided according to the Ancillary Service
Agreement (“CPSA” from the Portuguese Contrato de Prestação de Serviços
Ancilares) established between the generation agent and the National Electric System
Operator (“ONS” from the Portuguese Operador Nacional do Sistema Elétrico), which
sets forth the terms and conditions to provide reactive support to SIN through
generating units operating as synchronous compensators connected to the SIN.
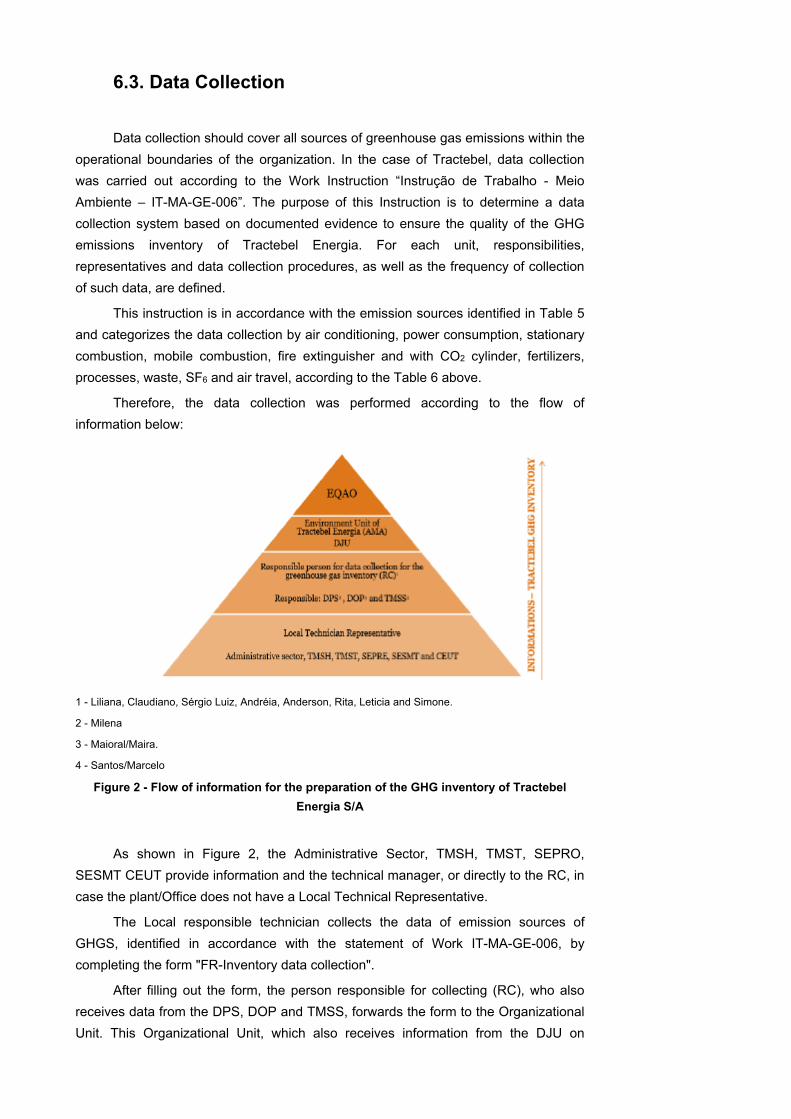
6.3. Data Collection
Data collection should cover all sources of greenhouse gas emissions within the
operational boundaries of the organization. In the case of Tractebel, data collection
was carried out according to the Work Instruction “Instrução de Trabalho - Meio
Ambiente – IT-MA-GE-006”. The purpose of this Instruction is to determine a data
collection system based on documented evidence to ensure the quality of the GHG
emissions inventory of Tractebel Energia. For each unit, responsibilities,
representatives and data collection procedures, as well as the frequency of collection
of such data, are defined.
This instruction is in accordance with the emission sources identified in Table 5
and categorizes the data collection by air conditioning, power consumption, stationary
combustion, mobile combustion, fire extinguisher and with CO2 cylinder, fertilizers,
processes, waste, SF6 and air travel, according to the Table 6 above.
Therefore, the data collection was performed according to the flow of
information below:
1 - Liliana, Claudiano, Sérgio Luiz, Andréia, Anderson, Rita, Leticia and Simone.
2 - Milena
3 - Maioral/Maira.
4 - Santos/Marcelo
Figure 2 - Flow of information for the preparation of the GHG inventory of Tractebel
Energia S/A
As shown in Figure 2, the Administrative Sector, TMSH, TMST, SEPRO,
SESMT CEUT provide information and the technical manager, or directly to the RC, in
case the plant/Office does not have a Local Technical Representative.
The Local responsible technician collects the data of emission sources of
GHGS, identified in accordance with the statement of Work IT-MA-GE-006, by
completing the form "FR-Inventory data collection".
After filling out the form, the person responsible for collecting (RC), who also
receives data from the DPS, DOP and TMSS, forwards the form to the Organizational
Unit. This Organizational Unit, which also receives information from the DJU on
corporate participation in company plants, after evaluation, forwards the worksheets
collection all plants and offices for EQAO (consulting) for carrying out other works for
the inventory preparation.
6.4. Bases and References
For the preparation of the inventory of GHG emissions, therewere considered
GHG Protocol guidelines, the specifications of the Brazilian GHG Protocol Program
and ISO 14064:2007:
"The Greenhouse Gas Protocol – a Corporate Accounting and Reporting
Standard – Revised Edition"-WRI/WBCSD, 2011;
"Verification Specifications of the Brazilian GHG Protocol program –
second edition ' – WRI/FGV, 2011;
"Accounting, quantifying and publication of Corporate Inventories of
greenhouse gas emissions, first edition"-WRI/FGV, 2012;
"ISO 14,064:2007 management system of Greenhouse Gases"-
International Organization for Standardization (International Organization
of Standartization), 2007.
Scoring methodologies are based mainly on documents published by the
Intergovernmental Panel on climate change:
"IPCC Guidelines for National Greenhouse Gas Inventories"-IPCC, 1996;
"IPCC Guidelines for National Greenhouse Gas Inventories"-IPCC, 2006.
Other references used are described in Section 11 of this report.
For accounting emissions of each power plant, the calculation tool was used
"Ferramenta_GHG_Protocol_v2016.1.xlsx" provided by the Brazilian GHG Protocol
Program. Therefore, data monitored by Tractebel Energia offices/plants was used for
the calculation of emission factors and, for cases in which no data was available for
the calculation of emission factors, default emission factors provided in the program
tool were used.
Tables 54 to 60 (Annex II- Emission Factors) detail the main emission factors
used in the inventory from 2015.
According to the article of Kalkreuth (2005), coal from the State of Rio Grande
do Sul, Charqueadas power plant, is classified as sub-bituminous. Thus, the CO2, CH4
and N2O emission factors of used for UTCH were reviewed, as shown in table 58,
Annex II - Emission Factors. This revision was necessary, since the Brazilian GHG
Protocol program considers CO2, CH4 and N2O emission factors for bituminous coal
only. In the following table can be observed methodologies and references of the
emission factors presented above for each emission source found.
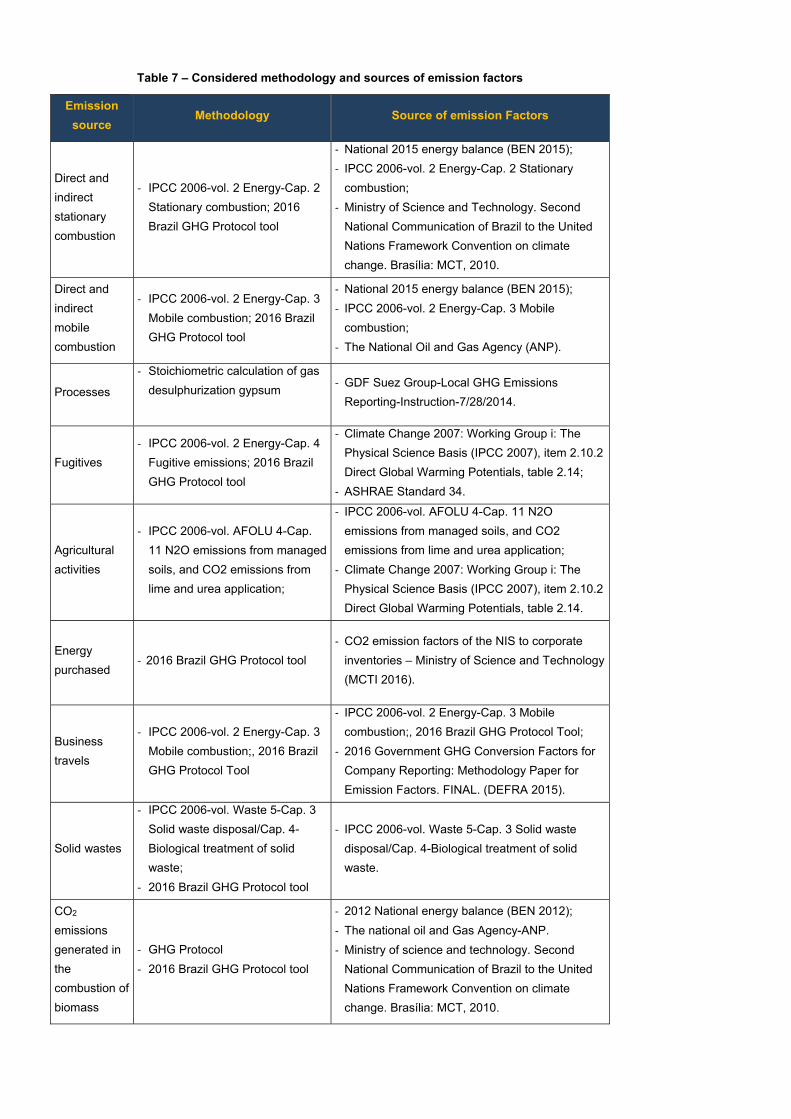
Table 7 – Considered methodology and sources of emission factors
Emission
source Methodology Source of emission Factors
Direct and
indirect
stationary
combustion
‐ IPCC 2006-vol. 2 Energy-Cap. 2
Stationary combustion; 2016
Brazil GHG Protocol tool
‐ National 2015 energy balance (BEN 2015);
‐ IPCC 2006-vol. 2 Energy-Cap. 2 Stationary
combustion;
‐ Ministry of Science and Technology. Second
National Communication of Brazil to the United
Nations Framework Convention on climate
change. Brasília: MCT, 2010.
Direct and
indirect
mobile
combustion
‐ IPCC 2006-vol. 2 Energy-Cap. 3
Mobile combustion; 2016 Brazil
GHG Protocol tool
‐ National 2015 energy balance (BEN 2015);
‐ IPCC 2006-vol. 2 Energy-Cap. 3 Mobile
combustion;
‐ The National Oil and Gas Agency (ANP).
Processes
‐ Stoichiometric calculation of gas
desulphurization gypsum
‐ GDF Suez Group-Local GHG Emissions
Reporting-Instruction-7/28/2014.
Fugitives
‐ IPCC 2006-vol. 2 Energy-Cap. 4
Fugitive emissions; 2016 Brazil
GHG Protocol tool
‐ Climate Change 2007: Working Group i: The
Physical Science Basis (IPCC 2007), item 2.10.2
Direct Global Warming Potentials, table 2.14;
‐ ASHRAE Standard 34.
Agricultural
activities
‐ IPCC 2006-vol. AFOLU 4-Cap.
11 N2O emissions from managed
soils, and CO2 emissions from
lime and urea application;
‐ IPCC 2006-vol. AFOLU 4-Cap. 11 N2O
emissions from managed soils, and CO2
emissions from lime and urea application;
‐ Climate Change 2007: Working Group i: The
Physical Science Basis (IPCC 2007), item 2.10.2
Direct Global Warming Potentials, table 2.14.
Energy
purchased ‐ 2016 Brazil GHG Protocol tool
‐ CO2 emission factors of the NIS to corporate
inventories – Ministry of Science and Technology
(MCTI 2016).
Business
travels
‐ IPCC 2006-vol. 2 Energy-Cap. 3
Mobile combustion;, 2016 Brazil
GHG Protocol Tool
‐ IPCC 2006-vol. 2 Energy-Cap. 3 Mobile
combustion;, 2016 Brazil GHG Protocol Tool;
‐ 2016 Government GHG Conversion Factors for
Company Reporting: Methodology Paper for
Emission Factors. FINAL. (DEFRA 2015).
Solid wastes
‐ IPCC 2006-vol. Waste 5-Cap. 3
Solid waste disposal/Cap. 4-
Biological treatment of solid
waste;
‐ 2016 Brazil GHG Protocol tool
‐ IPCC 2006-vol. Waste 5-Cap. 3 Solid waste
disposal/Cap. 4-Biological treatment of solid
waste.
CO2
emissions
generated in
the
combustion of
biomass
‐ GHG Protocol
‐ 2016 Brazil GHG Protocol tool
‐ 2012 National energy balance (BEN 2012);
‐ The national oil and Gas Agency-ANP.
‐ Ministry of science and technology. Second
National Communication of Brazil to the United
Nations Framework Convention on climate
change. Brasília: MCT, 2010.

Regarding the waste sent to the landfill, which was recorded in the collection
data form as "sludge (water treatment station)", the rate of Degradable Organic
Carbon (DOC)1 of 0.05 was used, the specific of sewage sludge as provided by IPCC
(2006), since the tool of the "Brazilian GHG Protocol Program" does not consider this
classification. The sewage sludge sent to landfill was identified in UHCB, UHET, UHIT,
UHPF, UHSA, UHSS, CTJL, UTCH, UTWA, UCLA and UTFE plants.
Data monitored by Tractebel Energia of net calorific value (NCV) was
considered for accounting GHG emissions when available, as shown in table 59 of
Annex II.
The percentage of nitrogen contained in fertilizers was also monitored by UHIT,
resulting in 2.0% for organic fertilizers and 9.0% for synthetic fertilizers. In cases
where no information on the percentage of nitrogen in the organic fertilizer and/or
synthetic was available, it was considered the default value of 1% for organic fertilizers
and 45% for synthetic fertilizers, as shown in Annex III, in "(a) Use of fertilizer."
Additionally, other GHG accounting methodologies were used in cases where
these have not been provided by the tool of the "Brazilian GHG Protocol Program."
The methodologies and assumptions adopted for the accounting of GHG emission
sources not covered by the program, referring to the use of fertilizer, desulphurization,
use of acetylene and incineration are described in Annex III-Additional Methodologies.
6.5. Methodological changes in comparison with
2014 year
Structural changes of an inventory organization and methodological accounting
can influence significantly impact the calculation of emissions, making I difficult to
monitor emissions over time and, consequently, comparison during years. Thus, this
section aims at the identification of corporate, operational and methodological
changes between 2014 and 2015.
In 2015, the Tubarão wind power plant started operation as a result of a R&D
project, 100% owned by Tractebel Energia. Thus, this plant has been included in the
GHG Inventory in the year of 2015, which does not contributed significantly to the
company's GHG emissions, whereas its ource of emission is due to the electricity
consumption of the grid only.
Regarding other operating units, no changes in societal structure in relation to
2014 were identified. Also, there were no significant operational changes.
In 2015, no changes regarding fuels used in stationary and mobile in the
operations of Tractebel Energia, then, fuels are the same in 2015.
The only additional emission source in relation to 2014 is the incineration of
chemical waste, also identified in 2012 year. This source was included in Scope 3 for
UETR and UTFE. UTIB also monitored data of wood waste incineration, however such
emission source was not considered in this inventory, based on the recommendation 1 Fraction of organic carbon present in the material that degrades in given conditions of temperature and humidity.
of IPCC that establishes that CO2 emissions from combustion of biomass materials for
non-energy purposes (i.e. papers, food and wood waste), should not be included while
accounting emissions.
Additionally, emissions from waste disposal of São Paulo were conservatively
counted based on the paper consumption in 2013 and 2014. Whereas these
emissions are not significant, in relation to the emissions from the office and Tractebel
Energia as a whole (0.01 tCO2e in 2013 and 0.04 tCO2e in 2014), paper consumption
was excluded in this inventory.
According to the Brazilian GHG Protocol program, emission factors, considered
variables, are those that change with a monthly or annual frequency, as is the case of
the CO2 emission factor of the National Interconnected System, the percentage of
biodiesel added to diesel oil and ethanol in gasoline. Therefore, these parameters
impact the results of GHG emissions annual accounting. Evolution of annual average
emission factor of SIN, percentage of biodiesel added to diesel oil and ethanol added
to gasoline in the period from 2012 to 2015, can be observed in table 60, Annex II-
emission Factors.
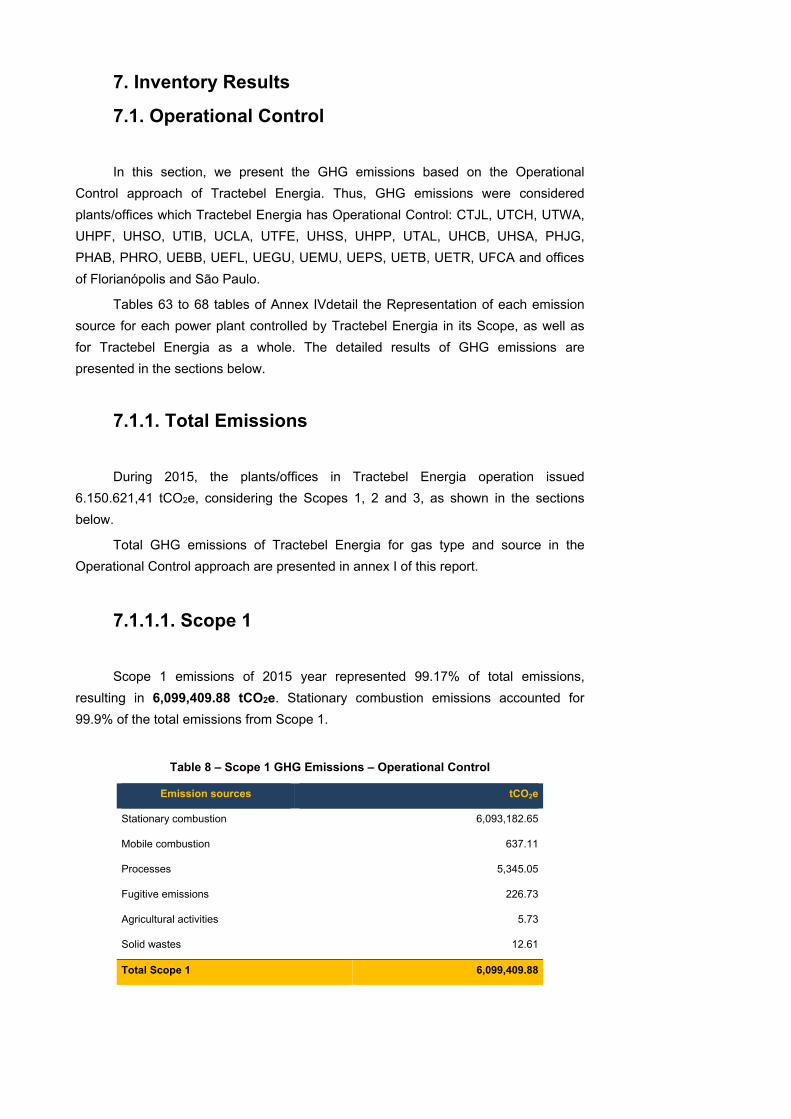
7. Inventory Results
7.1. Operational Control
In this section, we present the GHG emissions based on the Operational
Control approach of Tractebel Energia. Thus, GHG emissions were considered
plants/offices which Tractebel Energia has Operational Control: CTJL, UTCH, UTWA,
UHPF, UHSO, UTIB, UCLA, UTFE, UHSS, UHPP, UTAL, UHCB, UHSA, PHJG,
PHAB, PHRO, UEBB, UEFL, UEGU, UEMU, UEPS, UETB, UETR, UFCA and offices
of Florianópolis and São Paulo.
Tables 63 to 68 tables of Annex IVdetail the Representation of each emission
source for each power plant controlled by Tractebel Energia in its Scope, as well as
for Tractebel Energia as a whole. The detailed results of GHG emissions are
presented in the sections below.
7.1.1. Total Emissions
During 2015, the plants/offices in Tractebel Energia operation issued
6.150.621,41 tCO2e, considering the Scopes 1, 2 and 3, as shown in the sections
below.
Total GHG emissions of Tractebel Energia for gas type and source in the
Operational Control approach are presented in annex I of this report.
7.1.1.1. Scope 1
Scope 1 emissions of 2015 year represented 99.17% of total emissions,
resulting in 6,099,409.88 tCO2e. Stationary combustion emissions accounted for
99.9% of the total emissions from Scope 1.
Table 8 – Scope 1 GHG Emissions – Operational Control
Emission sources tCO2e
Stationary combustion 6,093,182.65
Mobile combustion 637.11
Processes 5,345.05
Fugitive emissions 226.73
Agricultural activities 5.73
Solid wastes 12.61
Total Scope 1 6,099,409.88
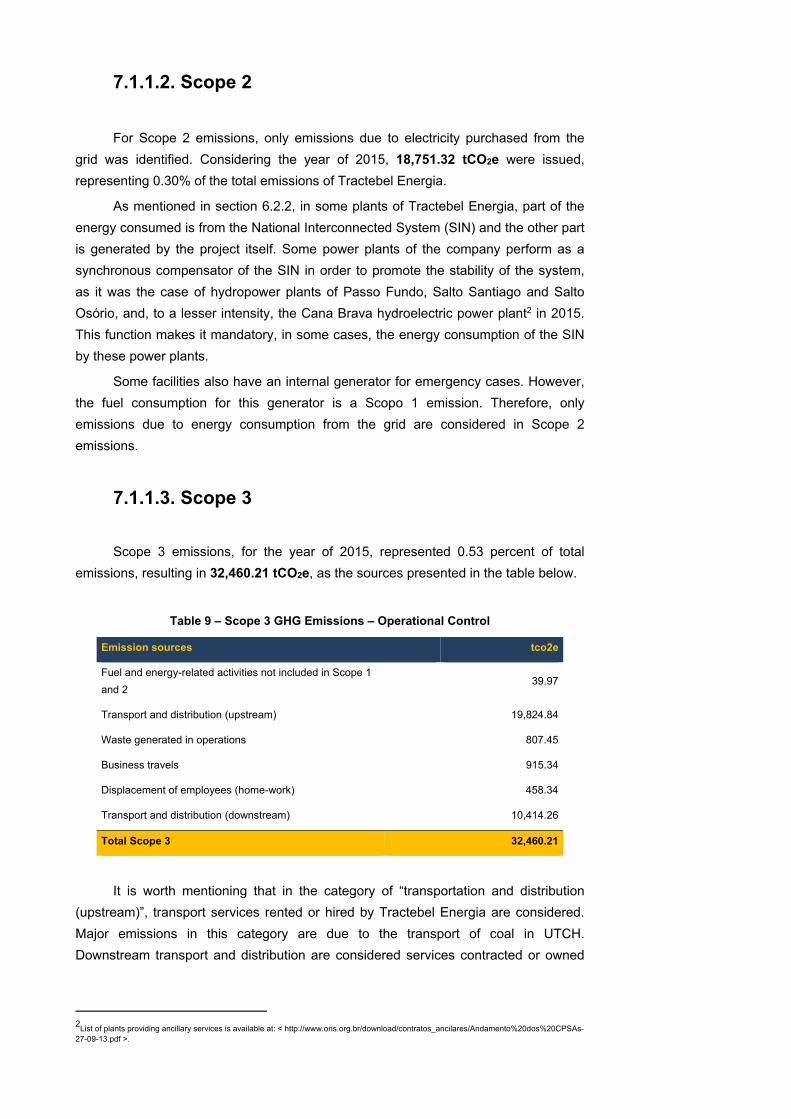
7.1.1.2. Scope 2
For Scope 2 emissions, only emissions due to electricity purchased from the
grid was identified. Considering the year of 2015, 18,751.32 tCO2e were issued,
representing 0.30% of the total emissions of Tractebel Energia.
As mentioned in section 6.2.2, in some plants of Tractebel Energia, part of the
energy consumed is from the National Interconnected System (SIN) and the other part
is generated by the project itself. Some power plants of the company perform as a
synchronous compensator of the SIN in order to promote the stability of the system,
as it was the case of hydropower plants of Passo Fundo, Salto Santiago and Salto
Osório, and, to a lesser intensity, the Cana Brava hydroelectric power plant2 in 2015.
This function makes it mandatory, in some cases, the energy consumption of the SIN
by these power plants.
Some facilities also have an internal generator for emergency cases. However,
the fuel consumption for this generator is a Scopo 1 emission. Therefore, only
emissions due to energy consumption from the grid are considered in Scope 2
emissions.
7.1.1.3. Scope 3
Scope 3 emissions, for the year of 2015, represented 0.53 percent of total
emissions, resulting in 32,460.21 tCO2e, as the sources presented in the table below.
Table 9 – Scope 3 GHG Emissions – Operational Control
Emission sources tco2e
Fuel and energy-related activities not included in Scope 1
and 2 39.97
Transport and distribution (upstream) 19,824.84
Waste generated in operations 807.45
Business travels 915.34
Displacement of employees (home-work) 458.34
Transport and distribution (downstream) 10,414.26
Total Scope 3 32,460.21
It is worth mentioning that in the category of “transportation and distribution
(upstream)”, transport services rented or hired by Tractebel Energia are considered.
Major emissions in this category are due to the transport of coal in UTCH.
Downstream transport and distribution are considered services contracted or owned
2
List of plants providing ancillary services is available at: < http://www.ons.org.br/download/contratos_ancilares/Andamento%20dos%20CPSAs-27-09-13.pdf >.
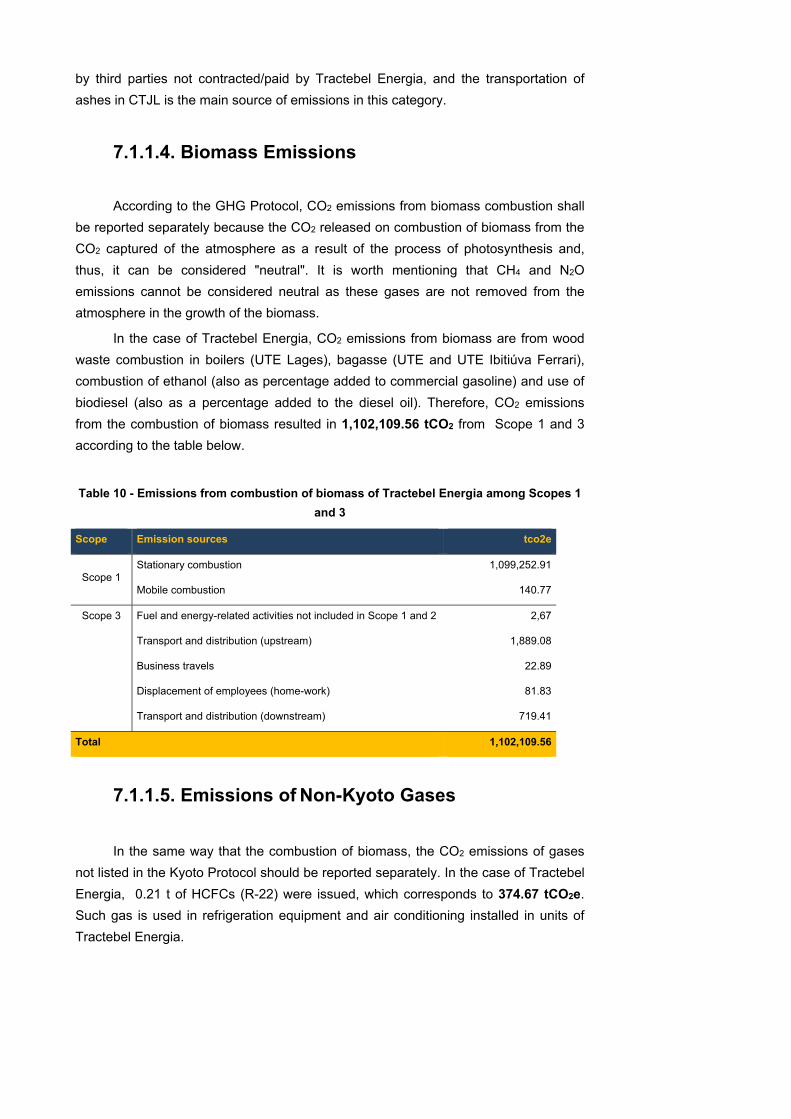
by third parties not contracted/paid by Tractebel Energia, and the transportation of
ashes in CTJL is the main source of emissions in this category.
7.1.1.4. Biomass Emissions
According to the GHG Protocol, CO2 emissions from biomass combustion shall
be reported separately because the CO2 released on combustion of biomass from the
CO2 captured of the atmosphere as a result of the process of photosynthesis and,
thus, it can be considered "neutral". It is worth mentioning that CH4 and N2O
emissions cannot be considered neutral as these gases are not removed from the
atmosphere in the growth of the biomass.
In the case of Tractebel Energia, CO2 emissions from biomass are from wood
waste combustion in boilers (UTE Lages), bagasse (UTE and UTE Ibitiúva Ferrari),
combustion of ethanol (also as percentage added to commercial gasoline) and use of
biodiesel (also as a percentage added to the diesel oil). Therefore, CO2 emissions
from the combustion of biomass resulted in 1,102,109.56 tCO2 from Scope 1 and 3
according to the table below.
Table 10 - Emissions from combustion of biomass of Tractebel Energia among Scopes 1
and 3
Scope Emission sources tco2e
Scope 1 Stationary combustion 1,099,252.91
Mobile combustion 140.77
Scope 3 Fuel and energy-related activities not included in Scope 1 and 2 2,67
Transport and distribution (upstream) 1,889.08
Business travels 22.89
Displacement of employees (home-work) 81.83
Transport and distribution (downstream) 719.41
Total 1,102,109.56
7.1.1.5. Emissions of Non-Kyoto Gases
In the same way that the combustion of biomass, the CO2 emissions of gases
not listed in the Kyoto Protocol should be reported separately. In the case of Tractebel
Energia, 0.21 t of HCFCs (R-22) were issued, which corresponds to 374.67 tCO2e.
Such gas is used in refrigeration equipment and air conditioning installed in units of
Tractebel Energia.
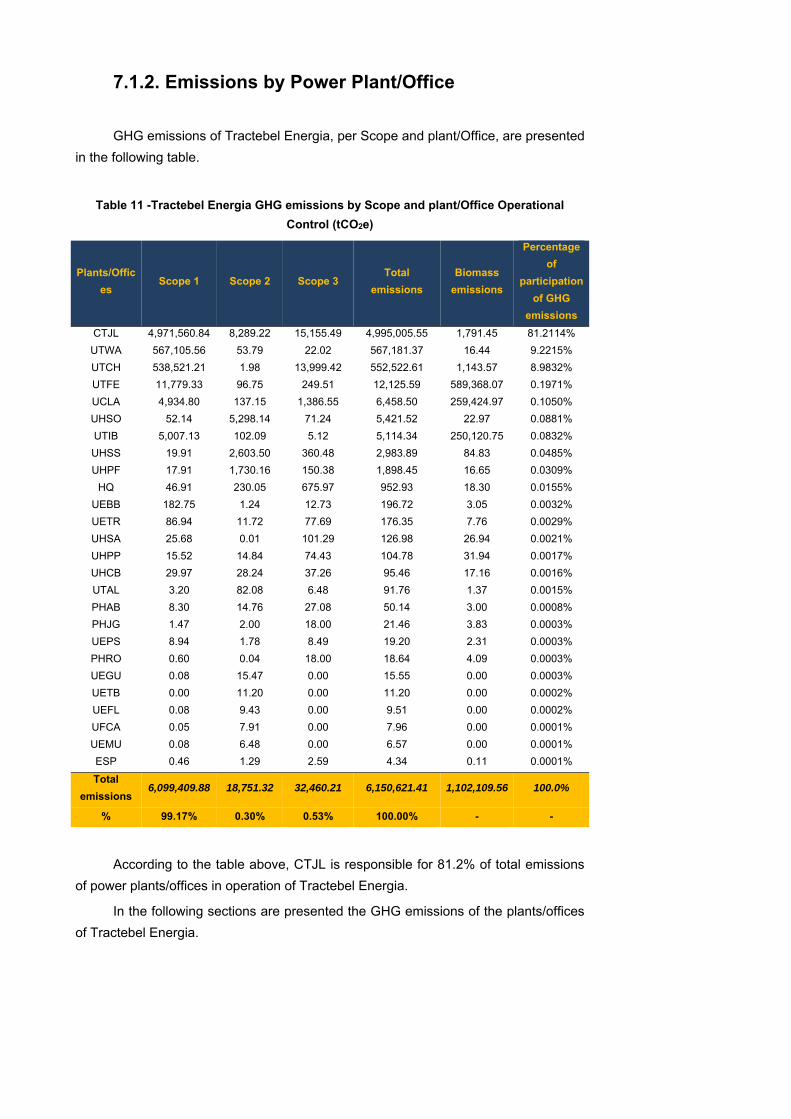
7.1.2. Emissions by Power Plant/Office
GHG emissions of Tractebel Energia, per Scope and plant/Office, are presented
in the following table.
Table 11 -Tractebel Energia GHG emissions by Scope and plant/Office Operational
Control (tCO2e)
Plants/Offic
es Scope 1 Scope 2 Scope 3
Total
emissions
Biomass
emissions
Percentage
of
participation
of GHG
emissions
CTJL 4,971,560.84 8,289.22 15,155.49 4,995,005.55 1,791.45 81.2114%
UTWA 567,105.56 53.79 22.02 567,181.37 16.44 9.2215%
UTCH 538,521.21 1.98 13,999.42 552,522.61 1,143.57 8.9832%
UTFE 11,779.33 96.75 249.51 12,125.59 589,368.07 0.1971%
UCLA 4,934.80 137.15 1,386.55 6,458.50 259,424.97 0.1050%
UHSO 52.14 5,298.14 71.24 5,421.52 22.97 0.0881%
UTIB 5,007.13 102.09 5.12 5,114.34 250,120.75 0.0832%
UHSS 19.91 2,603.50 360.48 2,983.89 84.83 0.0485%
UHPF 17.91 1,730.16 150.38 1,898.45 16.65 0.0309%
HQ 46.91 230.05 675.97 952.93 18.30 0.0155%
UEBB 182.75 1.24 12.73 196.72 3.05 0.0032%
UETR 86.94 11.72 77.69 176.35 7.76 0.0029%
UHSA 25.68 0.01 101.29 126.98 26.94 0.0021%
UHPP 15.52 14.84 74.43 104.78 31.94 0.0017%
UHCB 29.97 28.24 37.26 95.46 17.16 0.0016%
UTAL 3.20 82.08 6.48 91.76 1.37 0.0015%
PHAB 8.30 14.76 27.08 50.14 3.00 0.0008%
PHJG 1.47 2.00 18.00 21.46 3.83 0.0003%
UEPS 8.94 1.78 8.49 19.20 2.31 0.0003%
PHRO 0.60 0.04 18.00 18.64 4.09 0.0003%
UEGU 0.08 15.47 0.00 15.55 0.00 0.0003%
UETB 0.00 11.20 0.00 11.20 0.00 0.0002%
UEFL 0.08 9.43 0.00 9.51 0.00 0.0002%
UFCA 0.05 7.91 0.00 7.96 0.00 0.0001%
UEMU 0.08 6.48 0.00 6.57 0.00 0.0001%
ESP 0.46 1.29 2.59 4.34 0.11 0.0001%
Total
emissions 6,099,409.88 18,751.32 32,460.21 6,150,621.41 1,102,109.56 100.0%
% 99.17% 0.30% 0.53% 100.00% - -
According to the table above, CTJL is responsible for 81.2% of total emissions
of power plants/offices in operation of Tractebel Energia.
In the following sections are presented the GHG emissions of the plants/offices
of Tractebel Energia.
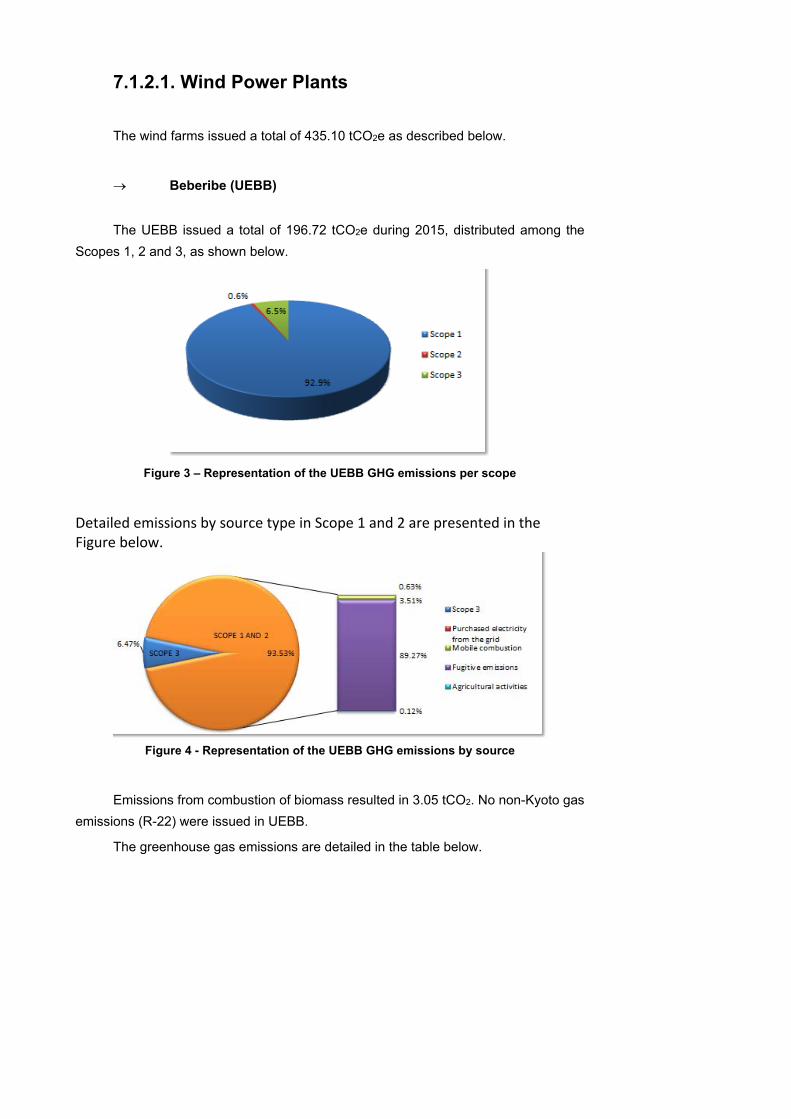
7.1.2.1. Wind Power Plants
The wind farms issued a total of 435.10 tCO2e as described below.
Beberibe (UEBB)
The UEBB issued a total of 196.72 tCO2e during 2015, distributed among the
Scopes 1, 2 and 3, as shown below.
Figure 3 – Representation of the UEBB GHG emissions per scope
Detailed emissions by source type in Scope 1 and 2 are presented in the Figure below.
Figure 4 - Representation of the UEBB GHG emissions by source
Emissions from combustion of biomass resulted in 3.05 tCO2. No non-Kyoto gas
emissions (R-22) were issued in UEBB.
The greenhouse gas emissions are detailed in the table below.
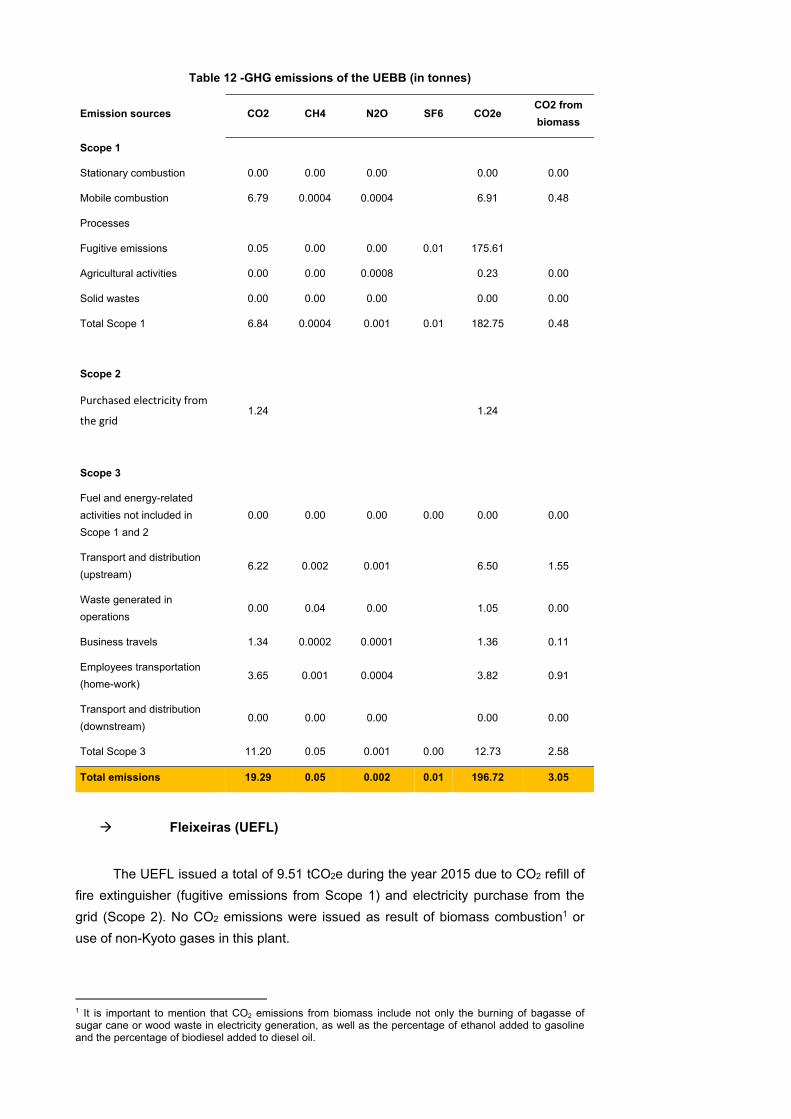
Table 12 -GHG emissions of the UEBB (in tonnes)
Emission sources CO2 CH4 N2O SF6 CO2e CO2 from
biomass
Scope 1
Stationary combustion 0.00 0.00 0.00 0.00 0.00
Mobile combustion 6.79 0.0004 0.0004 6.91 0.48
Processes
Fugitive emissions 0.05 0.00 0.00 0.01 175.61
Agricultural activities 0.00 0.00 0.0008 0.23 0.00
Solid wastes 0.00 0.00 0.00 0.00 0.00
Total Scope 1 6.84 0.0004 0.001 0.01 182.75 0.48
Scope 2
Purchased electricity from
the grid 1.24 1.24
Scope 3
Fuel and energy-related
activities not included in
Scope 1 and 2
0.00 0.00 0.00 0.00 0.00 0.00
Transport and distribution
(upstream) 6.22 0.002 0.001 6.50 1.55
Waste generated in
operations 0.00 0.04 0.00 1.05 0.00
Business travels 1.34 0.0002 0.0001 1.36 0.11
Employees transportation
(home-work) 3.65 0.001 0.0004 3.82 0.91
Transport and distribution
(downstream) 0.00 0.00 0.00 0.00 0.00
Total Scope 3 11.20 0.05 0.001 0.00 12.73 2.58
Total emissions 19.29 0.05 0.002 0.01 196.72 3.05
Fleixeiras (UEFL)
The UEFL issued a total of 9.51 tCO2e during the year 2015 due to CO2 refill of
fire extinguisher (fugitive emissions from Scope 1) and electricity purchase from the
grid (Scope 2). No CO2 emissions were issued as result of biomass combustion1 or
use of non-Kyoto gases in this plant.
1 It is important to mention that CO2 emissions from biomass include not only the burning of bagasse of sugar cane or wood waste in electricity generation, as well as the percentage of ethanol added to gasoline and the percentage of biodiesel added to diesel oil.
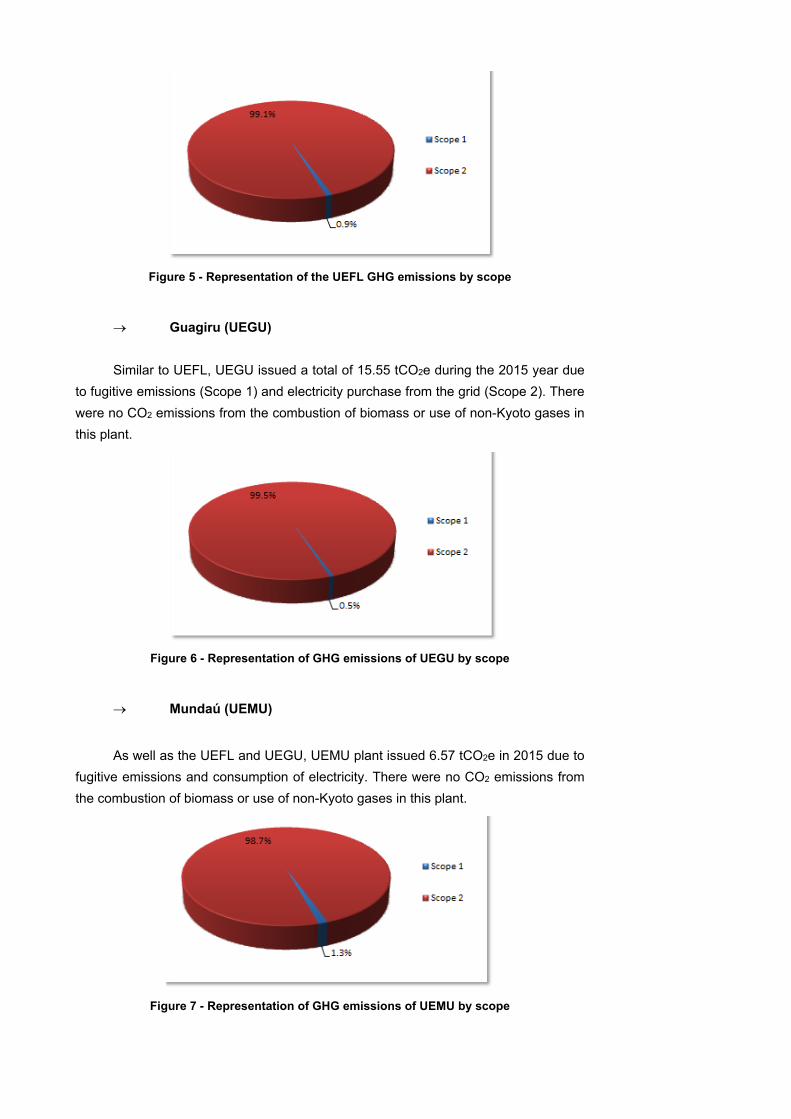
Figure 5 - Representation of the UEFL GHG emissions by scope
Guagiru (UEGU)
Similar to UEFL, UEGU issued a total of 15.55 tCO2e during the 2015 year due
to fugitive emissions (Scope 1) and electricity purchase from the grid (Scope 2). There
were no CO2 emissions from the combustion of biomass or use of non-Kyoto gases in
this plant.
Figure 6 - Representation of GHG emissions of UEGU by scope
Mundaú (UEMU)
As well as the UEFL and UEGU, UEMU plant issued 6.57 tCO2e in 2015 due to
fugitive emissions and consumption of electricity. There were no CO2 emissions from
the combustion of biomass or use of non-Kyoto gases in this plant.
Figure 7 - Representation of GHG emissions of UEMU by scope
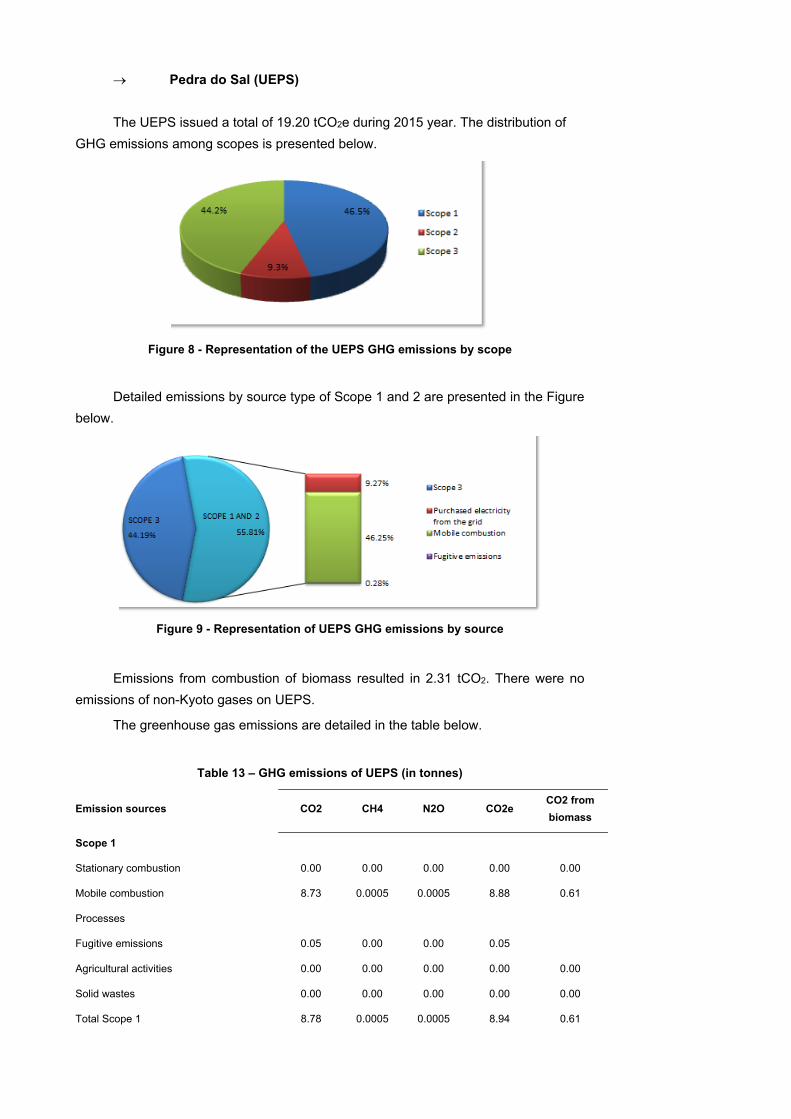
Pedra do Sal (UEPS)
The UEPS issued a total of 19.20 tCO2e during 2015 year. The distribution of
GHG emissions among scopes is presented below.
Figure 8 - Representation of the UEPS GHG emissions by scope
Detailed emissions by source type of Scope 1 and 2 are presented in the Figure
below.
Figure 9 - Representation of UEPS GHG emissions by source
Emissions from combustion of biomass resulted in 2.31 tCO2. There were no
emissions of non-Kyoto gases on UEPS.
The greenhouse gas emissions are detailed in the table below.
Table 13 – GHG emissions of UEPS (in tonnes)
Emission sources CO2 CH4 N2O CO2e CO2 from
biomass
Scope 1
Stationary combustion 0.00 0.00 0.00 0.00 0.00
Mobile combustion 8.73 0.0005 0.0005 8.88 0.61
Processes
Fugitive emissions 0.05 0.00 0.00 0.05
Agricultural activities 0.00 0.00 0.00 0.00 0.00
Solid wastes 0.00 0.00 0.00 0.00 0.00
Total Scope 1 8.78 0.0005 0.0005 8.94 0.61
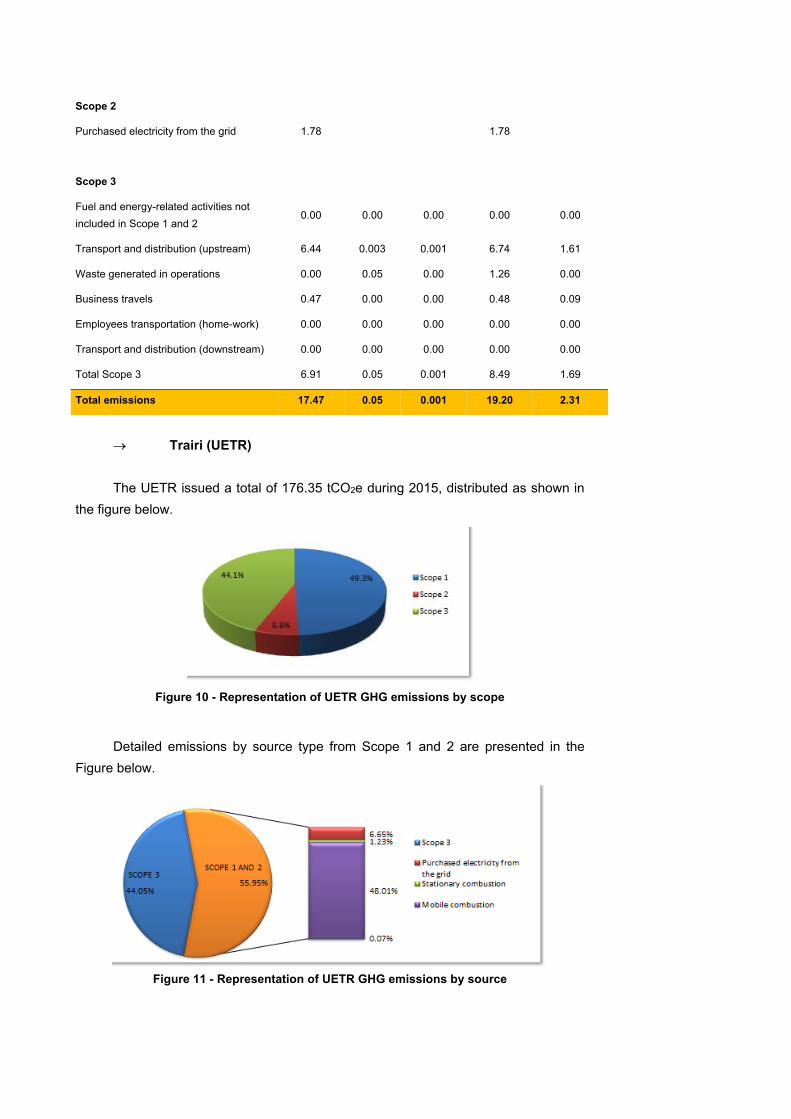
Scope 2
Purchased electricity from the grid 1.78 1.78
Scope 3
Fuel and energy-related activities not
included in Scope 1 and 2 0.00 0.00 0.00 0.00 0.00
Transport and distribution (upstream) 6.44 0.003 0.001 6.74 1.61
Waste generated in operations 0.00 0.05 0.00 1.26 0.00
Business travels 0.47 0.00 0.00 0.48 0.09
Employees transportation (home-work) 0.00 0.00 0.00 0.00 0.00
Transport and distribution (downstream) 0.00 0.00 0.00 0.00 0.00
Total Scope 3 6.91 0.05 0.001 8.49 1.69
Total emissions 17.47 0.05 0.001 19.20 2.31
Trairi (UETR)
The UETR issued a total of 176.35 tCO2e during 2015, distributed as shown in
the figure below.
Figure 10 - Representation of UETR GHG emissions by scope
Detailed emissions by source type from Scope 1 and 2 are presented in the
Figure below.
Figure 11 - Representation of UETR GHG emissions by source
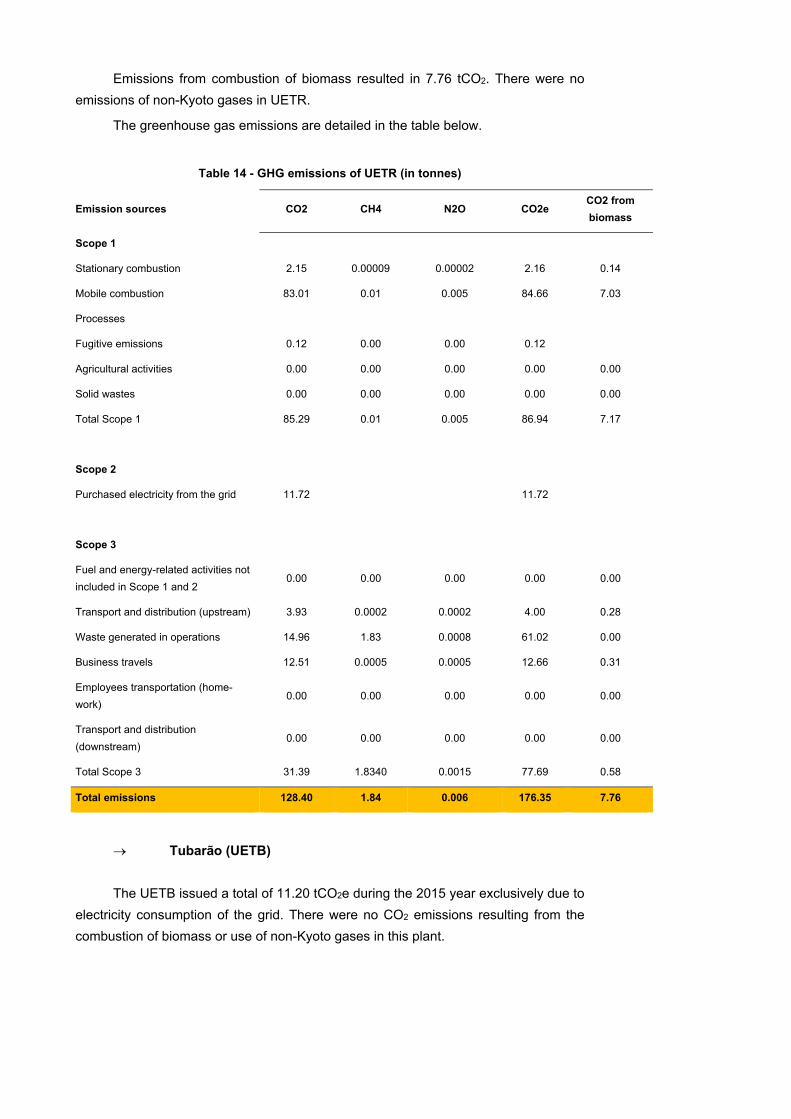
Emissions from combustion of biomass resulted in 7.76 tCO2. There were no
emissions of non-Kyoto gases in UETR.
The greenhouse gas emissions are detailed in the table below.
Table 14 - GHG emissions of UETR (in tonnes)
Emission sources CO2 CH4 N2O CO2e CO2 from
biomass
Scope 1
Stationary combustion 2.15 0.00009 0.00002 2.16 0.14
Mobile combustion 83.01 0.01 0.005 84.66 7.03
Processes
Fugitive emissions 0.12 0.00 0.00 0.12
Agricultural activities 0.00 0.00 0.00 0.00 0.00
Solid wastes 0.00 0.00 0.00 0.00 0.00
Total Scope 1 85.29 0.01 0.005 86.94 7.17
Scope 2
Purchased electricity from the grid 11.72 11.72
Scope 3
Fuel and energy-related activities not
included in Scope 1 and 2 0.00 0.00 0.00 0.00 0.00
Transport and distribution (upstream) 3.93 0.0002 0.0002 4.00 0.28
Waste generated in operations 14.96 1.83 0.0008 61.02 0.00
Business travels 12.51 0.0005 0.0005 12.66 0.31
Employees transportation (home-
work) 0.00 0.00 0.00 0.00 0.00
Transport and distribution
(downstream) 0.00 0.00 0.00 0.00 0.00
Total Scope 3 31.39 1.8340 0.0015 77.69 0.58
Total emissions 128.40 1.84 0.006 176.35 7.76
Tubarão (UETB)
The UETB issued a total of 11.20 tCO2e during the 2015 year exclusively due to
electricity consumption of the grid. There were no CO2 emissions resulting from the
combustion of biomass or use of non-Kyoto gases in this plant.
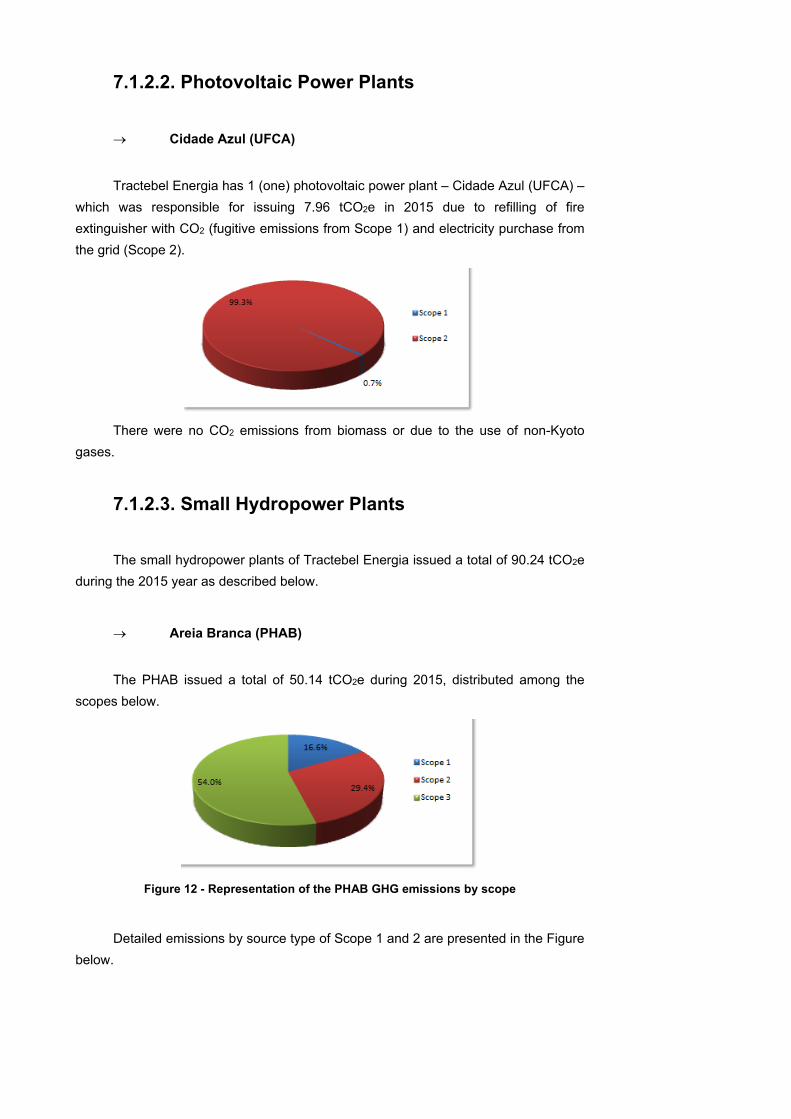
7.1.2.2. Photovoltaic Power Plants
Cidade Azul (UFCA)
Tractebel Energia has 1 (one) photovoltaic power plant – Cidade Azul (UFCA) –
which was responsible for issuing 7.96 tCO2e in 2015 due to refilling of fire
extinguisher with CO2 (fugitive emissions from Scope 1) and electricity purchase from
the grid (Scope 2).
There were no CO2 emissions from biomass or due to the use of non-Kyoto
gases.
7.1.2.3. Small Hydropower Plants
The small hydropower plants of Tractebel Energia issued a total of 90.24 tCO2e
during the 2015 year as described below.
Areia Branca (PHAB)
The PHAB issued a total of 50.14 tCO2e during 2015, distributed among the
scopes below.
Figure 12 - Representation of the PHAB GHG emissions by scope
Detailed emissions by source type of Scope 1 and 2 are presented in the Figure
below.
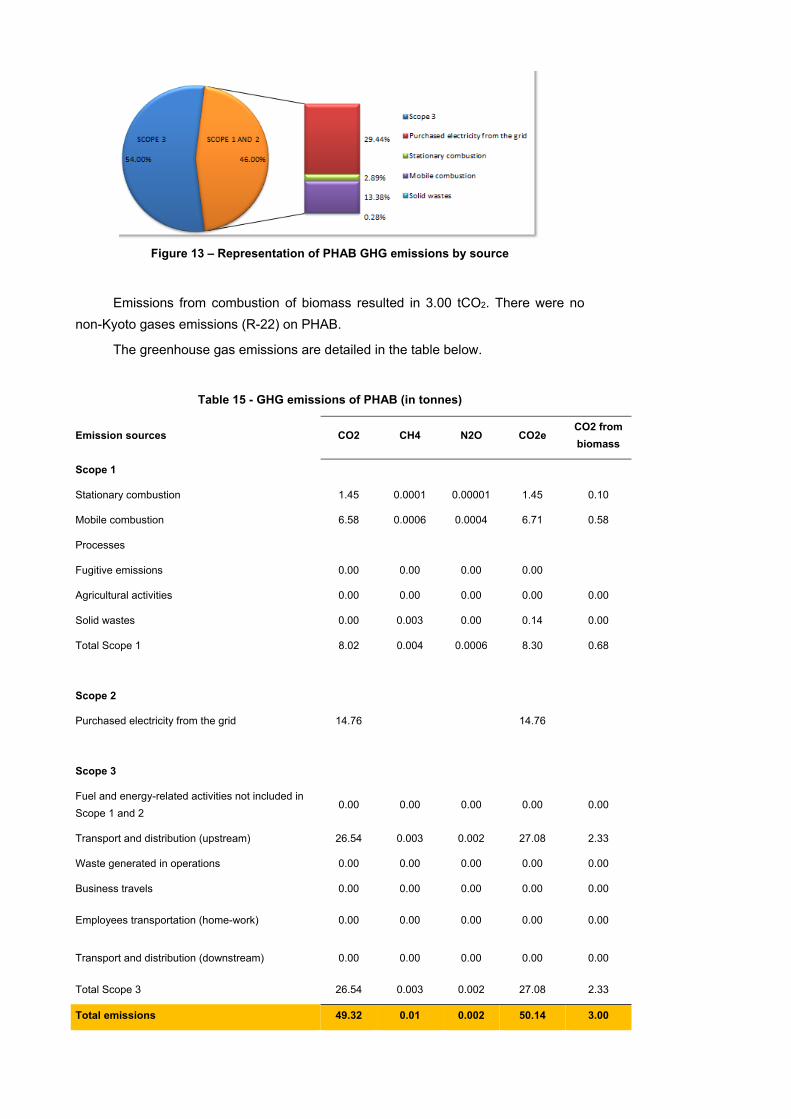
Figure 13 – Representation of PHAB GHG emissions by source
Emissions from combustion of biomass resulted in 3.00 tCO2. There were no
non-Kyoto gases emissions (R-22) on PHAB.
The greenhouse gas emissions are detailed in the table below.
Table 15 - GHG emissions of PHAB (in tonnes)
Emission sources CO2 CH4 N2O CO2e CO2 from
biomass
Scope 1
Stationary combustion 1.45 0.0001 0.00001 1.45 0.10
Mobile combustion 6.58 0.0006 0.0004 6.71 0.58
Processes
Fugitive emissions 0.00 0.00 0.00 0.00
Agricultural activities 0.00 0.00 0.00 0.00 0.00
Solid wastes 0.00 0.003 0.00 0.14 0.00
Total Scope 1 8.02 0.004 0.0006 8.30 0.68
Scope 2
Purchased electricity from the grid 14.76 14.76
Scope 3
Fuel and energy-related activities not included in
Scope 1 and 2 0.00 0.00 0.00 0.00 0.00
Transport and distribution (upstream) 26.54 0.003 0.002 27.08 2.33
Waste generated in operations 0.00 0.00 0.00 0.00 0.00
Business travels 0.00 0.00 0.00 0.00 0.00
Employees transportation (home-work) 0.00 0.00 0.00 0.00 0.00
Transport and distribution (downstream) 0.00 0.00 0.00 0.00 0.00
Total Scope 3 26.54 0.003 0.002 27.08 2.33
Total emissions 49.32 0.01 0.002 50.14 3.00
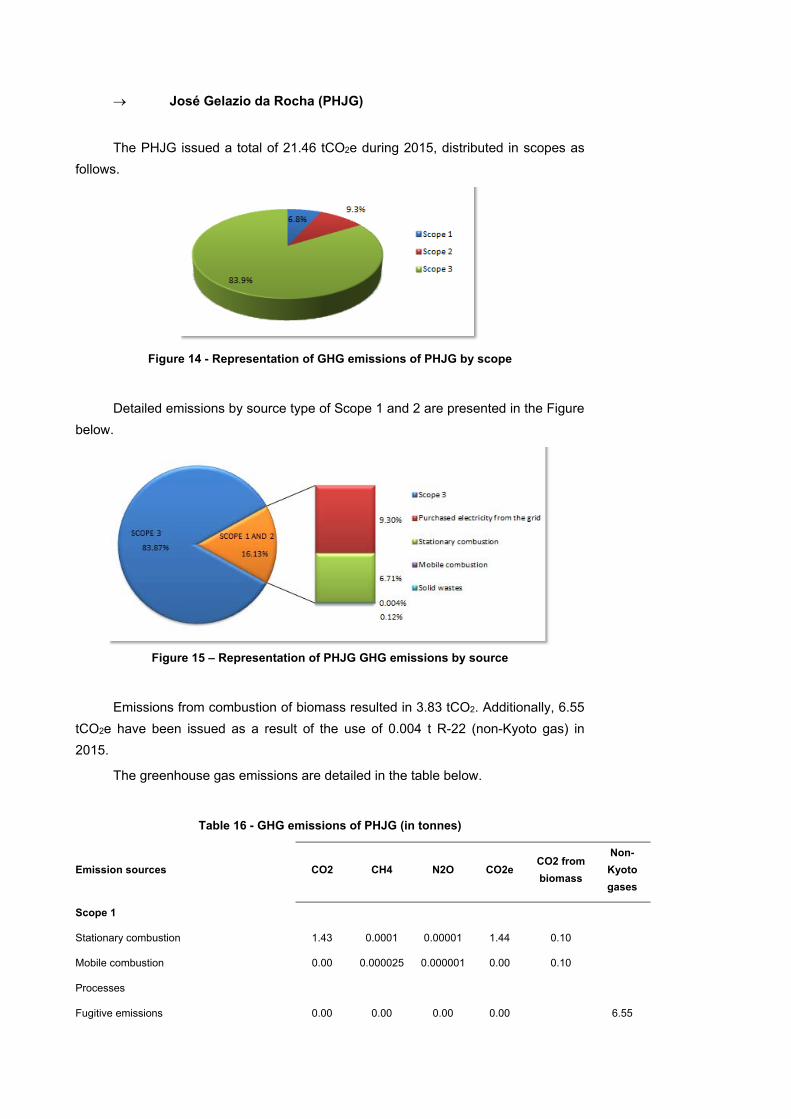
José Gelazio da Rocha (PHJG)
The PHJG issued a total of 21.46 tCO2e during 2015, distributed in scopes as
follows.
Figure 14 - Representation of GHG emissions of PHJG by scope
Detailed emissions by source type of Scope 1 and 2 are presented in the Figure
below.
Figure 15 – Representation of PHJG GHG emissions by source
Emissions from combustion of biomass resulted in 3.83 tCO2. Additionally, 6.55
tCO2e have been issued as a result of the use of 0.004 t R-22 (non-Kyoto gas) in
2015.
The greenhouse gas emissions are detailed in the table below.
Table 16 - GHG emissions of PHJG (in tonnes)
Emission sources CO2 CH4 N2O CO2e CO2 from
biomass
Non-
Kyoto
gases
Scope 1
Stationary combustion 1.43 0.0001 0.00001 1.44 0.10
Mobile combustion 0.00 0.000025 0.000001 0.00 0.10
Processes
Fugitive emissions 0.00 0.00 0.00 0.00 6.55
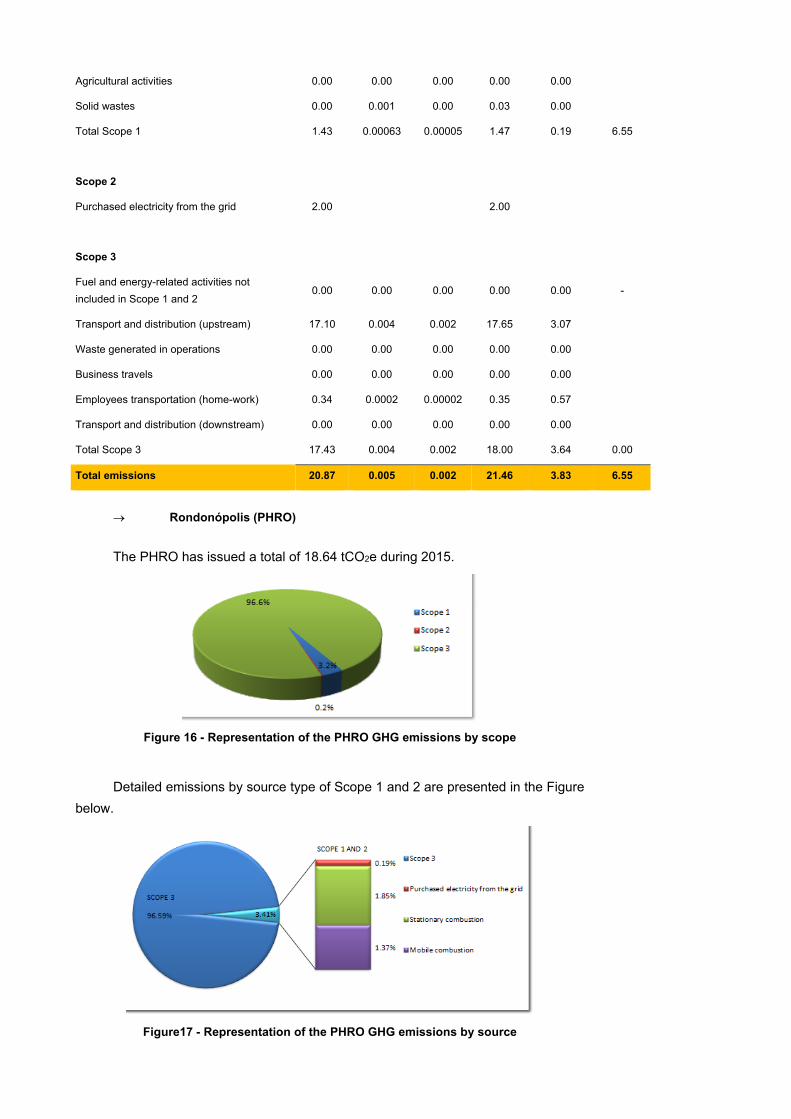
Agricultural activities 0.00 0.00 0.00 0.00 0.00
Solid wastes 0.00 0.001 0.00 0.03 0.00
Total Scope 1 1.43 0.00063 0.00005 1.47 0.19 6.55
Scope 2
Purchased electricity from the grid 2.00 2.00
Scope 3
Fuel and energy-related activities not
included in Scope 1 and 2 0.00 0.00 0.00 0.00 0.00 -
Transport and distribution (upstream) 17.10 0.004 0.002 17.65 3.07
Waste generated in operations 0.00 0.00 0.00 0.00 0.00
Business travels 0.00 0.00 0.00 0.00 0.00
Employees transportation (home-work) 0.34 0.0002 0.00002 0.35 0.57
Transport and distribution (downstream) 0.00 0.00 0.00 0.00 0.00
Total Scope 3 17.43 0.004 0.002 18.00 3.64 0.00
Total emissions 20.87 0.005 0.002 21.46 3.83 6.55
Rondonópolis (PHRO)
The PHRO has issued a total of 18.64 tCO2e during 2015.
Figure 16 - Representation of the PHRO GHG emissions by scope
Detailed emissions by source type of Scope 1 and 2 are presented in the Figure
below.
Figure17 - Representation of the PHRO GHG emissions by source
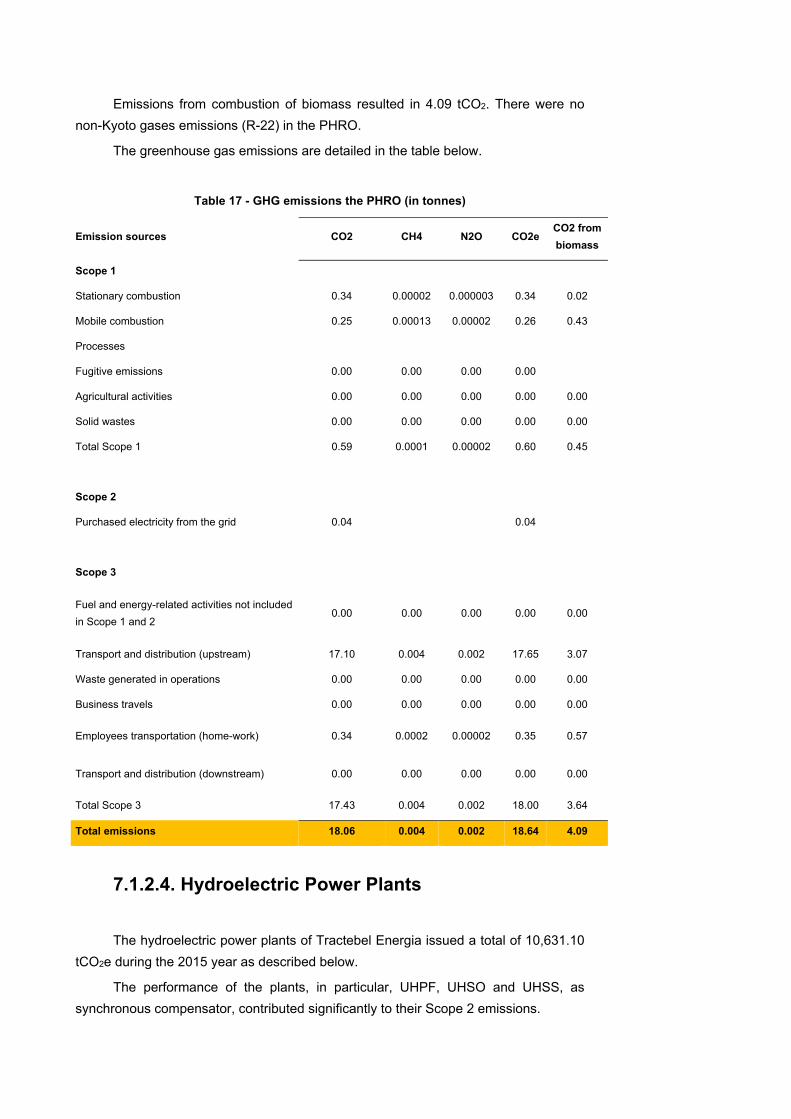
Emissions from combustion of biomass resulted in 4.09 tCO2. There were no
non-Kyoto gases emissions (R-22) in the PHRO.
The greenhouse gas emissions are detailed in the table below.
Table 17 - GHG emissions the PHRO (in tonnes)
Emission sources CO2 CH4 N2O CO2e CO2 from
biomass
Scope 1
Stationary combustion 0.34 0.00002 0.000003 0.34 0.02
Mobile combustion 0.25 0.00013 0.00002 0.26 0.43
Processes
Fugitive emissions 0.00 0.00 0.00 0.00
Agricultural activities 0.00 0.00 0.00 0.00 0.00
Solid wastes 0.00 0.00 0.00 0.00 0.00
Total Scope 1 0.59 0.0001 0.00002 0.60 0.45
Scope 2
Purchased electricity from the grid 0.04 0.04
Scope 3
Fuel and energy-related activities not included
in Scope 1 and 2 0.00 0.00 0.00 0.00 0.00
Transport and distribution (upstream) 17.10 0.004 0.002 17.65 3.07
Waste generated in operations 0.00 0.00 0.00 0.00 0.00
Business travels 0.00 0.00 0.00 0.00 0.00
Employees transportation (home-work) 0.34 0.0002 0.00002 0.35 0.57
Transport and distribution (downstream) 0.00 0.00 0.00 0.00 0.00
Total Scope 3 17.43 0.004 0.002 18.00 3.64
Total emissions 18.06 0.004 0.002 18.64 4.09
7.1.2.4. Hydroelectric Power Plants
The hydroelectric power plants of Tractebel Energia issued a total of 10,631.10
tCO2e during the 2015 year as described below.
The performance of the plants, in particular, UHPF, UHSO and UHSS, as
synchronous compensator, contributed significantly to their Scope 2 emissions.
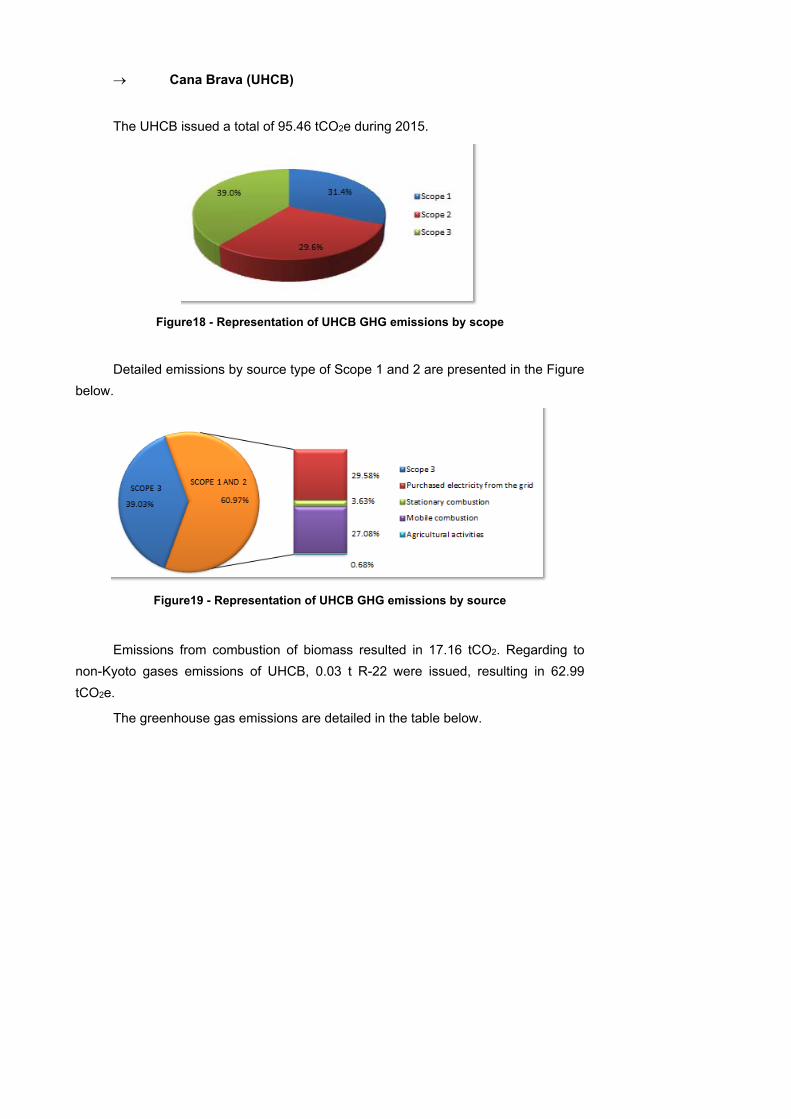
Cana Brava (UHCB)
The UHCB issued a total of 95.46 tCO2e during 2015.
Figure18 - Representation of UHCB GHG emissions by scope
Detailed emissions by source type of Scope 1 and 2 are presented in the Figure
below.
Figure19 - Representation of UHCB GHG emissions by source
Emissions from combustion of biomass resulted in 17.16 tCO2. Regarding to
non-Kyoto gases emissions of UHCB, 0.03 t R-22 were issued, resulting in 62.99
tCO2e.
The greenhouse gas emissions are detailed in the table below.
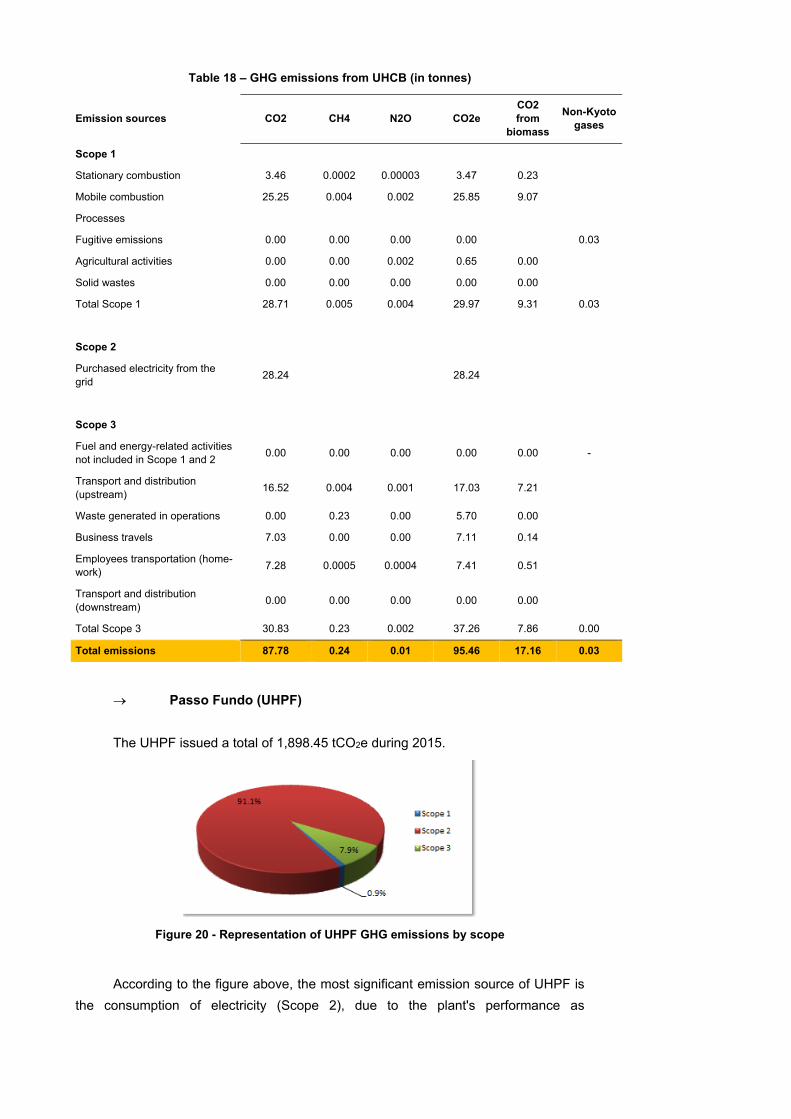
Table 18 – GHG emissions from UHCB (in tonnes)
Emission sources CO2 CH4 N2O CO2e CO2 from
biomass
Non-Kyoto gases
Scope 1
Stationary combustion 3.46 0.0002 0.00003 3.47 0.23
Mobile combustion 25.25 0.004 0.002 25.85 9.07
Processes
Fugitive emissions 0.00 0.00 0.00 0.00 0.03
Agricultural activities 0.00 0.00 0.002 0.65 0.00
Solid wastes 0.00 0.00 0.00 0.00 0.00
Total Scope 1 28.71 0.005 0.004 29.97 9.31 0.03
Scope 2
Purchased electricity from the grid
28.24 28.24
Scope 3
Fuel and energy-related activities not included in Scope 1 and 2
0.00 0.00 0.00 0.00 0.00 -
Transport and distribution (upstream)
16.52 0.004 0.001 17.03 7.21
Waste generated in operations 0.00 0.23 0.00 5.70 0.00
Business travels 7.03 0.00 0.00 7.11 0.14
Employees transportation (home-work)
7.28 0.0005 0.0004 7.41 0.51
Transport and distribution (downstream)
0.00 0.00 0.00 0.00 0.00
Total Scope 3 30.83 0.23 0.002 37.26 7.86 0.00
Total emissions 87.78 0.24 0.01 95.46 17.16 0.03
Passo Fundo (UHPF)
The UHPF issued a total of 1,898.45 tCO2e during 2015.
Figure 20 - Representation of UHPF GHG emissions by scope
According to the figure above, the most significant emission source of UHPF is
the consumption of electricity (Scope 2), due to the plant's performance as
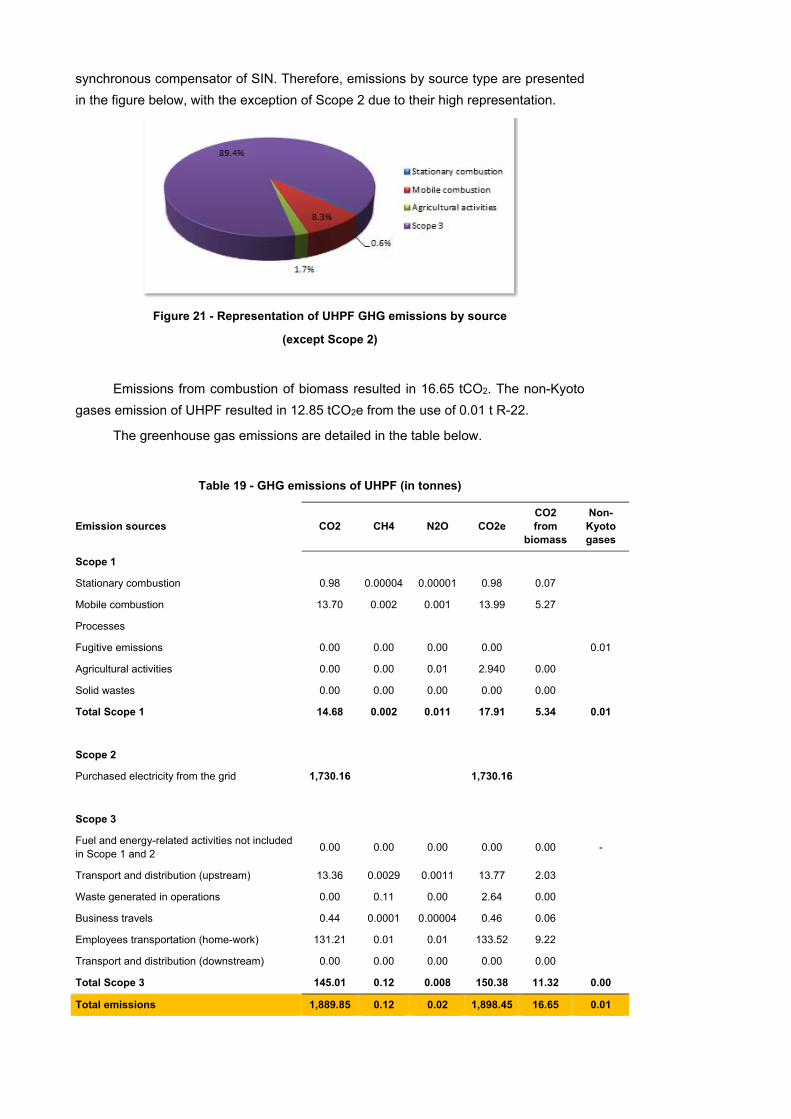
synchronous compensator of SIN. Therefore, emissions by source type are presented
in the figure below, with the exception of Scope 2 due to their high representation.
Figure 21 - Representation of UHPF GHG emissions by source
(except Scope 2)
Emissions from combustion of biomass resulted in 16.65 tCO2. The non-Kyoto
gases emission of UHPF resulted in 12.85 tCO2e from the use of 0.01 t R-22.
The greenhouse gas emissions are detailed in the table below.
Table 19 - GHG emissions of UHPF (in tonnes)
Emission sources CO2 CH4 N2O CO2e CO2 from
biomass
Non-Kyoto gases
Scope 1
Stationary combustion 0.98 0.00004 0.00001 0.98 0.07
Mobile combustion 13.70 0.002 0.001 13.99 5.27
Processes
Fugitive emissions 0.00 0.00 0.00 0.00 0.01
Agricultural activities 0.00 0.00 0.01 2.940 0.00
Solid wastes 0.00 0.00 0.00 0.00 0.00
Total Scope 1 14.68 0.002 0.011 17.91 5.34 0.01
Scope 2
Purchased electricity from the grid 1,730.16 1,730.16
Scope 3
Fuel and energy-related activities not included in Scope 1 and 2
0.00 0.00 0.00 0.00 0.00 -
Transport and distribution (upstream) 13.36 0.0029 0.0011 13.77 2.03
Waste generated in operations 0.00 0.11 0.00 2.64 0.00
Business travels 0.44 0.0001 0.00004 0.46 0.06
Employees transportation (home-work) 131.21 0.01 0.01 133.52 9.22
Transport and distribution (downstream) 0.00 0.00 0.00 0.00 0.00
Total Scope 3 145.01 0.12 0.008 150.38 11.32 0.00
Total emissions 1,889.85 0.12 0.02 1,898.45 16.65 0.01
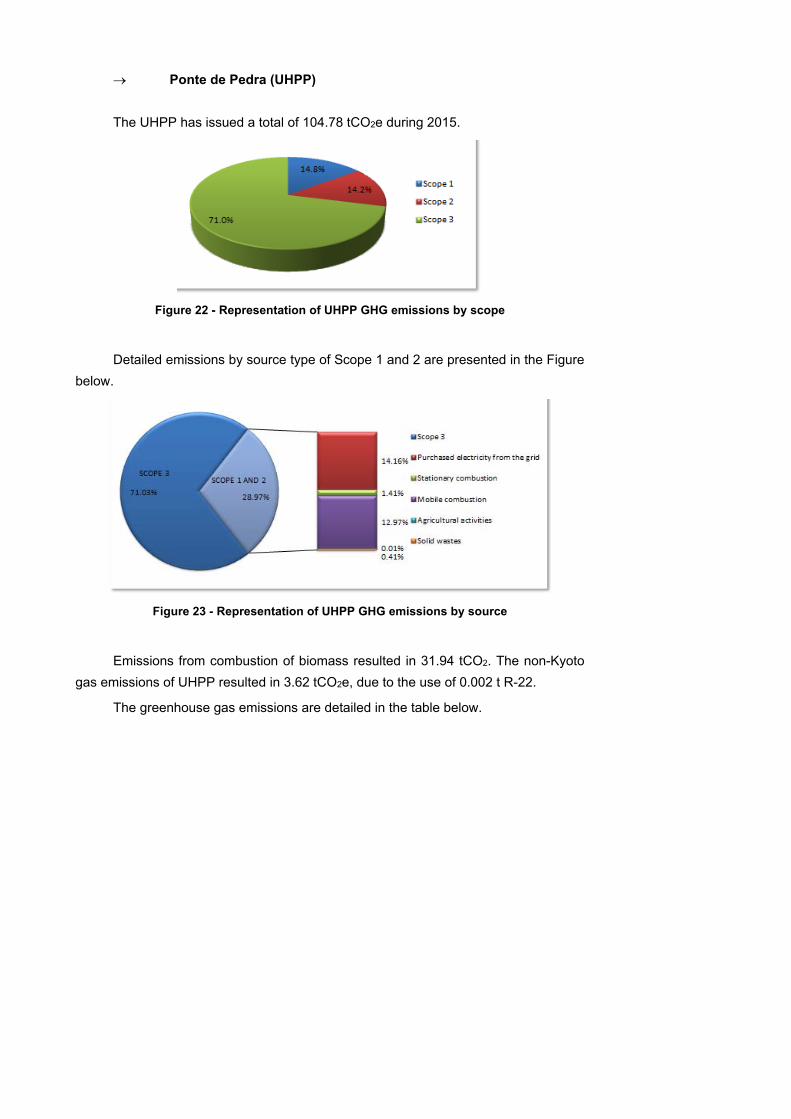
Ponte de Pedra (UHPP)
The UHPP has issued a total of 104.78 tCO2e during 2015.
Figure 22 - Representation of UHPP GHG emissions by scope
Detailed emissions by source type of Scope 1 and 2 are presented in the Figure
below.
Figure 23 - Representation of UHPP GHG emissions by source
Emissions from combustion of biomass resulted in 31.94 tCO2. The non-Kyoto
gas emissions of UHPP resulted in 3.62 tCO2e, due to the use of 0.002 t R-22.
The greenhouse gas emissions are detailed in the table below.
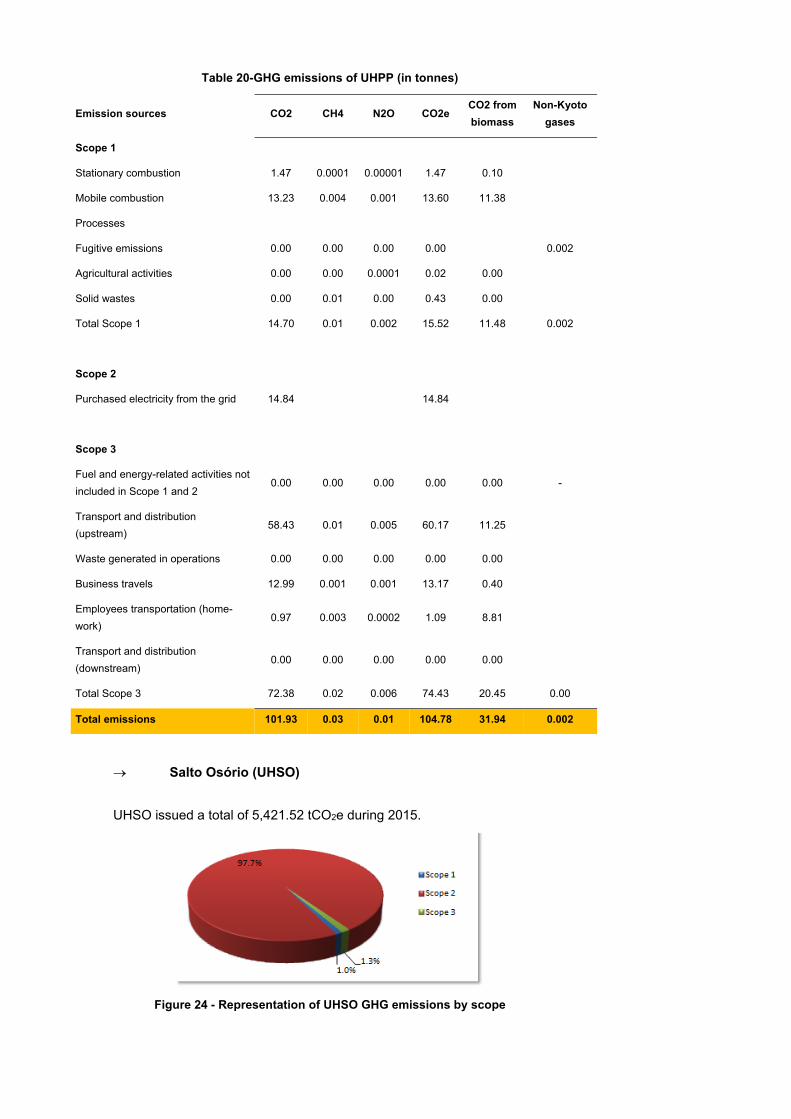
Table 20-GHG emissions of UHPP (in tonnes)
Emission sources CO2 CH4 N2O CO2e CO2 from
biomass
Non-Kyoto
gases
Scope 1
Stationary combustion 1.47 0.0001 0.00001 1.47 0.10
Mobile combustion 13.23 0.004 0.001 13.60 11.38
Processes
Fugitive emissions 0.00 0.00 0.00 0.00 0.002
Agricultural activities 0.00 0.00 0.0001 0.02 0.00
Solid wastes 0.00 0.01 0.00 0.43 0.00
Total Scope 1 14.70 0.01 0.002 15.52 11.48 0.002
Scope 2
Purchased electricity from the grid 14.84 14.84
Scope 3
Fuel and energy-related activities not
included in Scope 1 and 2 0.00 0.00 0.00 0.00 0.00 -
Transport and distribution
(upstream) 58.43 0.01 0.005 60.17 11.25
Waste generated in operations 0.00 0.00 0.00 0.00 0.00
Business travels 12.99 0.001 0.001 13.17 0.40
Employees transportation (home-
work) 0.97 0.003 0.0002 1.09 8.81
Transport and distribution
(downstream) 0.00 0.00 0.00 0.00 0.00
Total Scope 3 72.38 0.02 0.006 74.43 20.45 0.00
Total emissions 101.93 0.03 0.01 104.78 31.94 0.002
Salto Osório (UHSO)
UHSO issued a total of 5,421.52 tCO2e during 2015.
Figure 24 - Representation of UHSO GHG emissions by scope
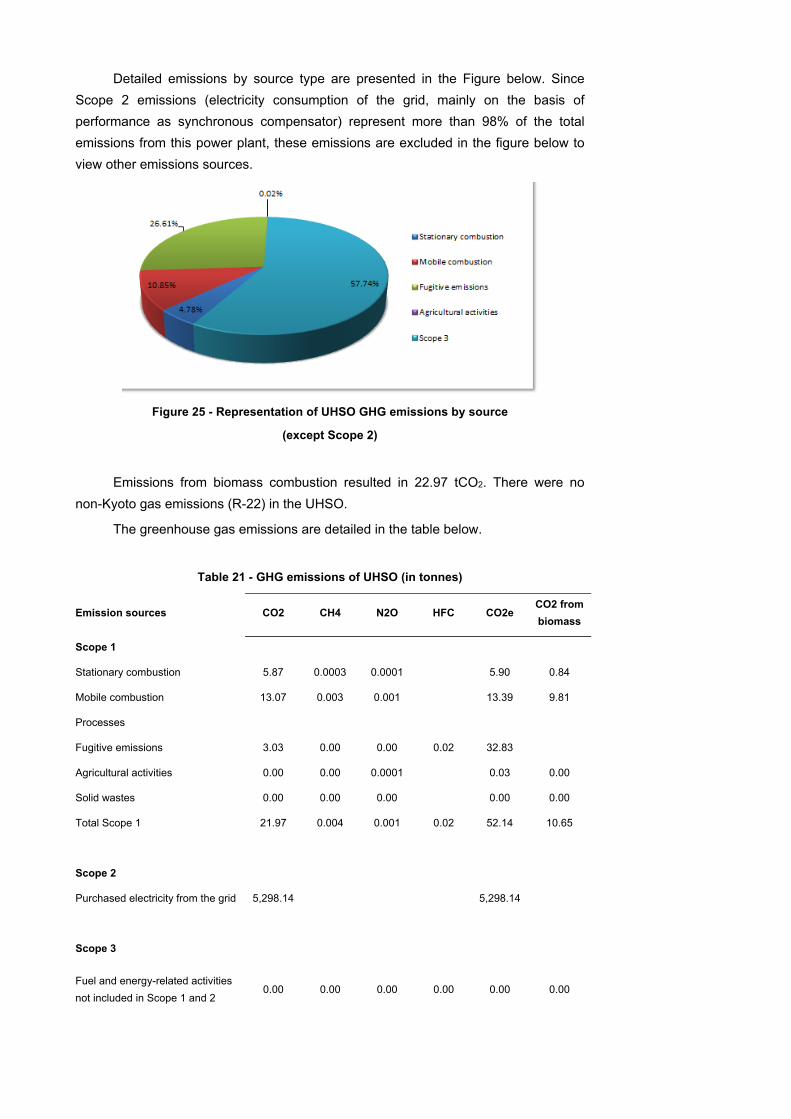
Detailed emissions by source type are presented in the Figure below. Since
Scope 2 emissions (electricity consumption of the grid, mainly on the basis of
performance as synchronous compensator) represent more than 98% of the total
emissions from this power plant, these emissions are excluded in the figure below to
view other emissions sources.
Figure 25 - Representation of UHSO GHG emissions by source
(except Scope 2)
Emissions from biomass combustion resulted in 22.97 tCO2. There were no
non-Kyoto gas emissions (R-22) in the UHSO.
The greenhouse gas emissions are detailed in the table below.
Table 21 - GHG emissions of UHSO (in tonnes)
Emission sources CO2 CH4 N2O HFC CO2e CO2 from
biomass
Scope 1
Stationary combustion 5.87 0.0003 0.0001 5.90 0.84
Mobile combustion 13.07 0.003 0.001 13.39 9.81
Processes
Fugitive emissions 3.03 0.00 0.00 0.02 32.83
Agricultural activities 0.00 0.00 0.0001 0.03 0.00
Solid wastes 0.00 0.00 0.00 0.00 0.00
Total Scope 1 21.97 0.004 0.001 0.02 52.14 10.65
Scope 2
Purchased electricity from the grid 5,298.14 5,298.14
Scope 3
Fuel and energy-related activities
not included in Scope 1 and 2 0.00 0.00 0.00 0.00 0.00 0.00
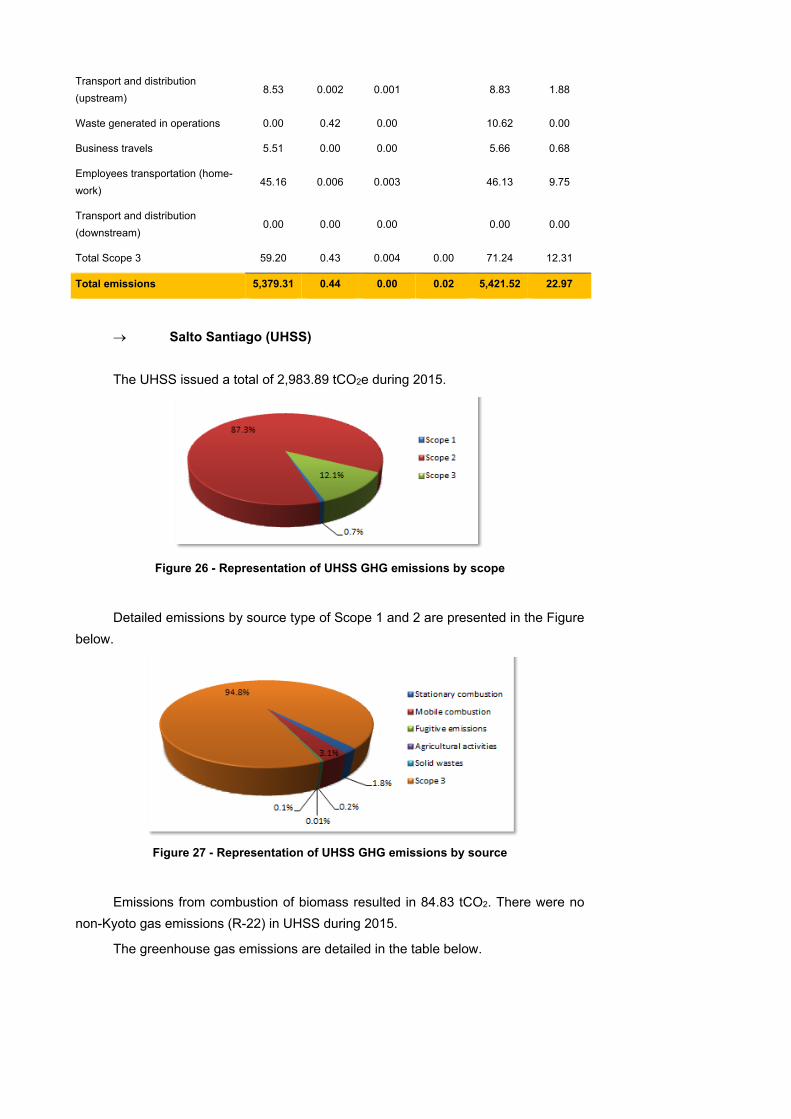
Transport and distribution
(upstream) 8.53 0.002 0.001 8.83 1.88
Waste generated in operations 0.00 0.42 0.00 10.62 0.00
Business travels 5.51 0.00 0.00 5.66 0.68
Employees transportation (home-
work) 45.16 0.006 0.003 46.13 9.75
Transport and distribution
(downstream) 0.00 0.00 0.00 0.00 0.00
Total Scope 3 59.20 0.43 0.004 0.00 71.24 12.31
Total emissions 5,379.31 0.44 0.00 0.02 5,421.52 22.97
Salto Santiago (UHSS)
The UHSS issued a total of 2,983.89 tCO2e during 2015.
Figure 26 - Representation of UHSS GHG emissions by scope
Detailed emissions by source type of Scope 1 and 2 are presented in the Figure
below.
Figure 27 - Representation of UHSS GHG emissions by source
Emissions from combustion of biomass resulted in 84.83 tCO2. There were no
non-Kyoto gas emissions (R-22) in UHSS during 2015.
The greenhouse gas emissions are detailed in the table below.
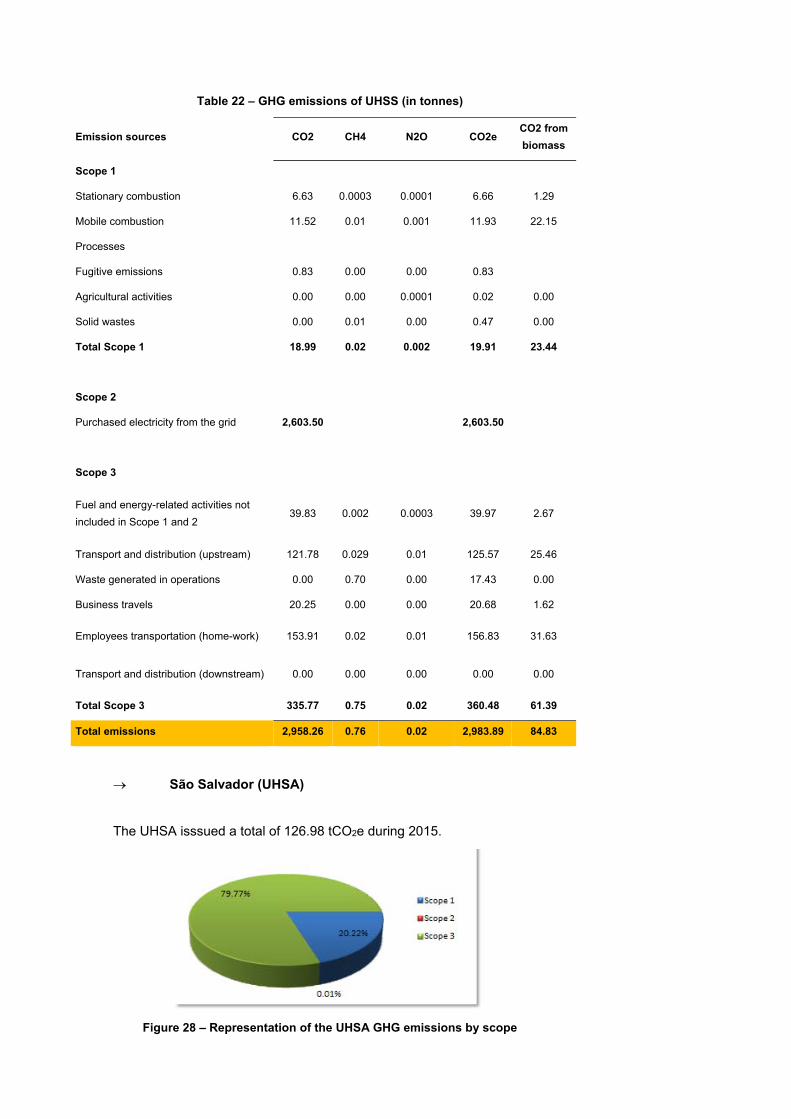
Table 22 – GHG emissions of UHSS (in tonnes)
Emission sources CO2 CH4 N2O CO2e CO2 from
biomass
Scope 1
Stationary combustion 6.63 0.0003 0.0001 6.66 1.29
Mobile combustion 11.52 0.01 0.001 11.93 22.15
Processes
Fugitive emissions 0.83 0.00 0.00 0.83
Agricultural activities 0.00 0.00 0.0001 0.02 0.00
Solid wastes 0.00 0.01 0.00 0.47 0.00
Total Scope 1 18.99 0.02 0.002 19.91 23.44
Scope 2
Purchased electricity from the grid 2,603.50 2,603.50
Scope 3
Fuel and energy-related activities not
included in Scope 1 and 2 39.83 0.002 0.0003 39.97 2.67
Transport and distribution (upstream) 121.78 0.029 0.01 125.57 25.46
Waste generated in operations 0.00 0.70 0.00 17.43 0.00
Business travels 20.25 0.00 0.00 20.68 1.62
Employees transportation (home-work) 153.91 0.02 0.01 156.83 31.63
Transport and distribution (downstream) 0.00 0.00 0.00 0.00 0.00
Total Scope 3 335.77 0.75 0.02 360.48 61.39
Total emissions 2,958.26 0.76 0.02 2,983.89 84.83
São Salvador (UHSA)
The UHSA isssued a total of 126.98 tCO2e during 2015.
Figure 28 – Representation of the UHSA GHG emissions by scope
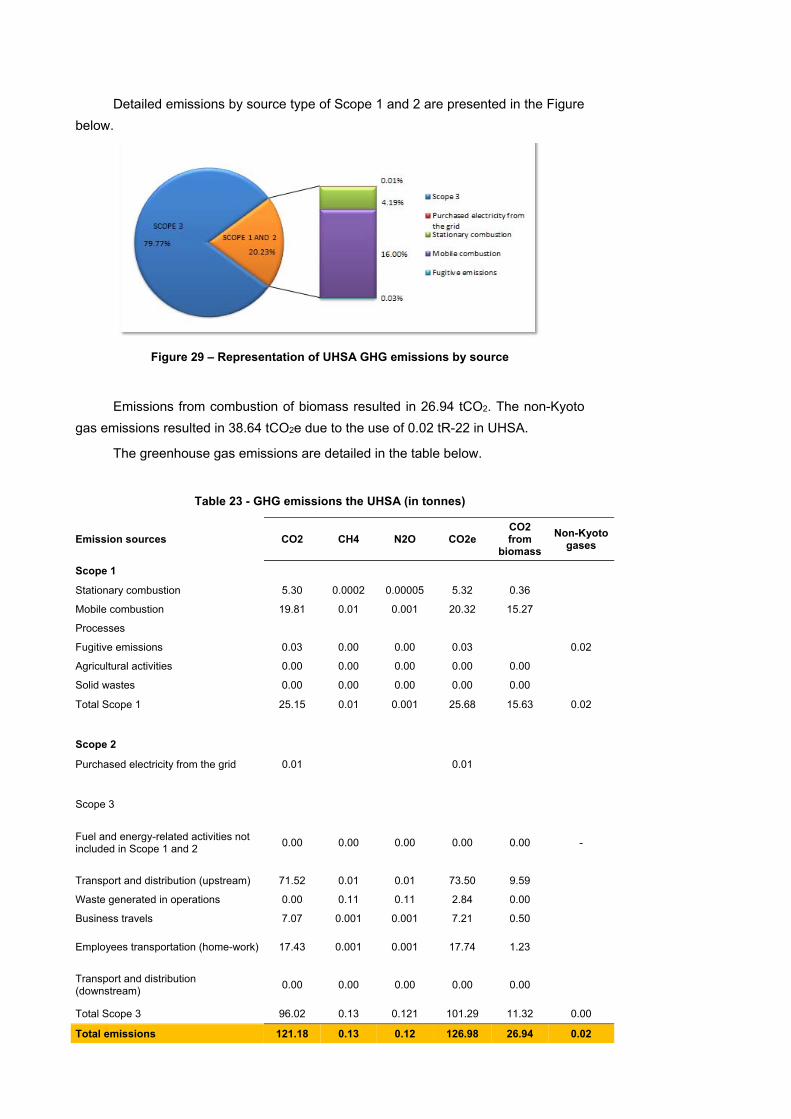
Detailed emissions by source type of Scope 1 and 2 are presented in the Figure
below.
Figure 29 – Representation of UHSA GHG emissions by source
Emissions from combustion of biomass resulted in 26.94 tCO2. The non-Kyoto
gas emissions resulted in 38.64 tCO2e due to the use of 0.02 tR-22 in UHSA.
The greenhouse gas emissions are detailed in the table below.
Table 23 - GHG emissions the UHSA (in tonnes)
Emission sources CO2 CH4 N2O CO2e CO2 from
biomass
Non-Kyoto gases
Scope 1
Stationary combustion 5.30 0.0002 0.00005 5.32 0.36
Mobile combustion 19.81 0.01 0.001 20.32 15.27
Processes
Fugitive emissions 0.03 0.00 0.00 0.03 0.02
Agricultural activities 0.00 0.00 0.00 0.00 0.00
Solid wastes 0.00 0.00 0.00 0.00 0.00
Total Scope 1 25.15 0.01 0.001 25.68 15.63 0.02
Scope 2
Purchased electricity from the grid 0.01 0.01
Scope 3
Fuel and energy-related activities not included in Scope 1 and 2
0.00 0.00 0.00 0.00 0.00 -
Transport and distribution (upstream) 71.52 0.01 0.01 73.50 9.59
Waste generated in operations 0.00 0.11 0.11 2.84 0.00
Business travels 7.07 0.001 0.001 7.21 0.50
Employees transportation (home-work) 17.43 0.001 0.001 17.74 1.23
Transport and distribution (downstream)
0.00 0.00 0.00 0.00 0.00
Total Scope 3 96.02 0.13 0.121 101.29 11.32 0.00
Total emissions 121.18 0.13 0.12 126.98 26.94 0.02
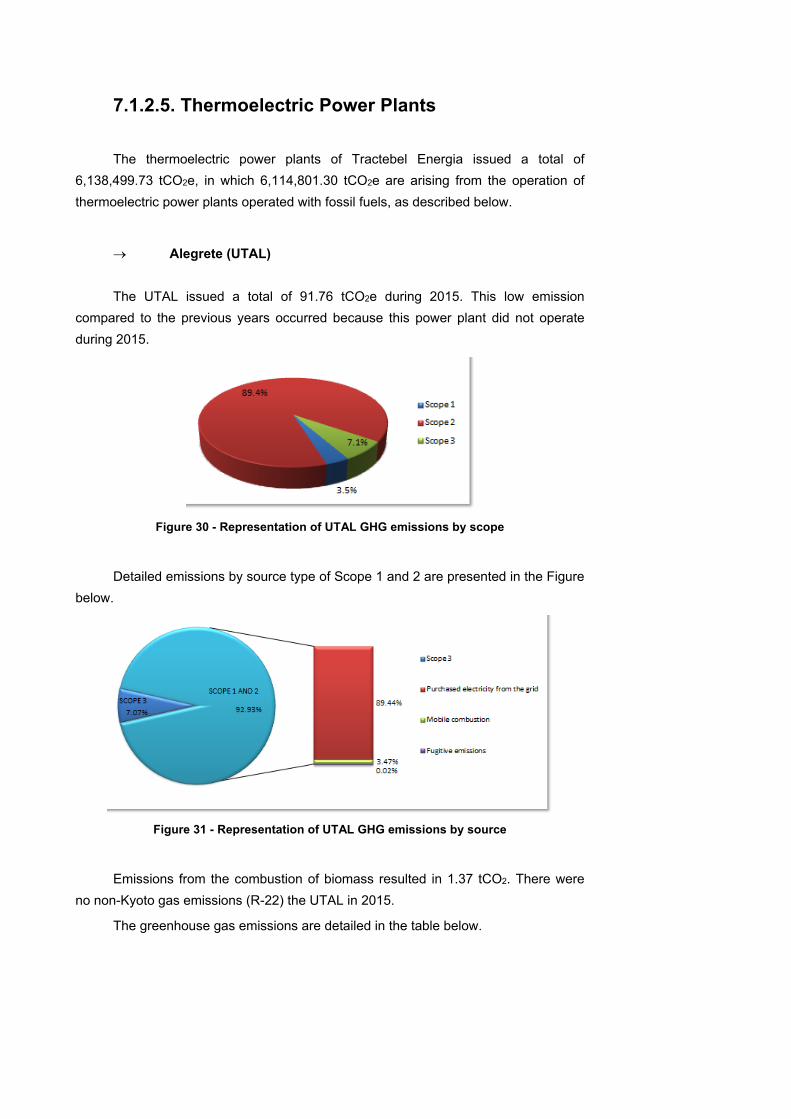
7.1.2.5. Thermoelectric Power Plants
The thermoelectric power plants of Tractebel Energia issued a total of
6,138,499.73 tCO2e, in which 6,114,801.30 tCO2e are arising from the operation of
thermoelectric power plants operated with fossil fuels, as described below.
Alegrete (UTAL)
The UTAL issued a total of 91.76 tCO2e during 2015. This low emission
compared to the previous years occurred because this power plant did not operate
during 2015.
Figure 30 - Representation of UTAL GHG emissions by scope
Detailed emissions by source type of Scope 1 and 2 are presented in the Figure
below.
Figure 31 - Representation of UTAL GHG emissions by source
Emissions from the combustion of biomass resulted in 1.37 tCO2. There were
no non-Kyoto gas emissions (R-22) the UTAL in 2015.
The greenhouse gas emissions are detailed in the table below.
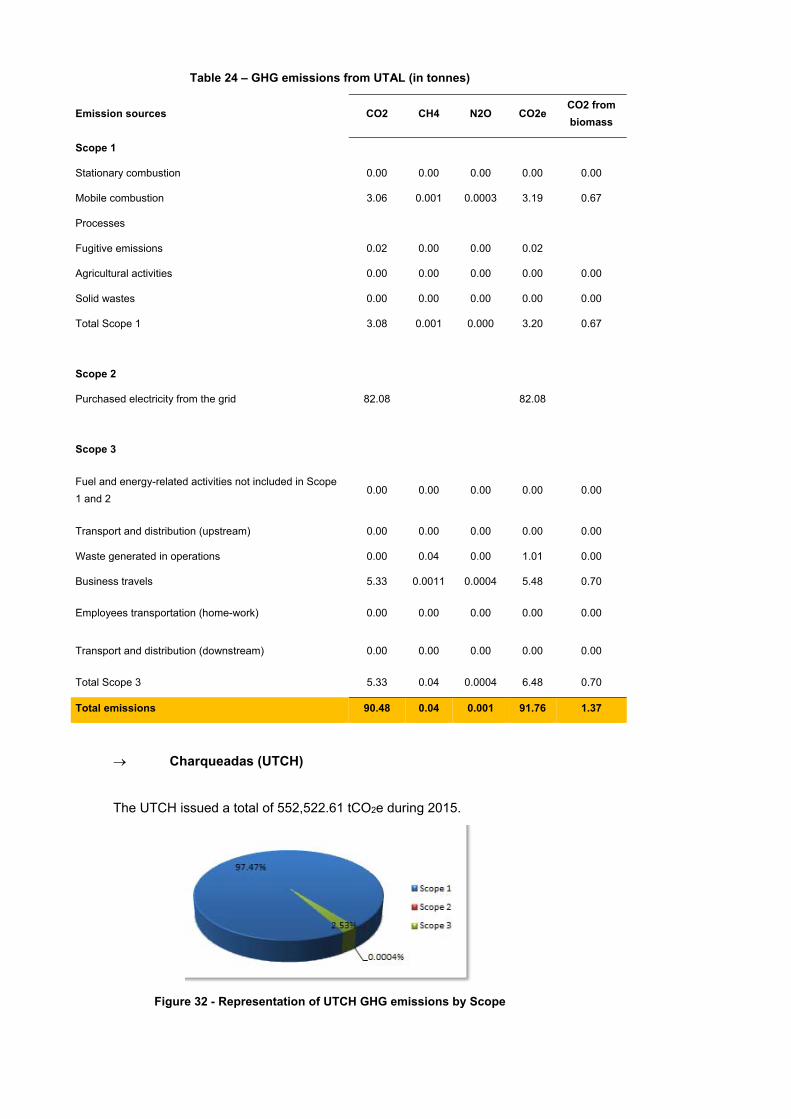
Table 24 – GHG emissions from UTAL (in tonnes)
Emission sources CO2 CH4 N2O CO2e CO2 from
biomass
Scope 1
Stationary combustion 0.00 0.00 0.00 0.00 0.00
Mobile combustion 3.06 0.001 0.0003 3.19 0.67
Processes
Fugitive emissions 0.02 0.00 0.00 0.02
Agricultural activities 0.00 0.00 0.00 0.00 0.00
Solid wastes 0.00 0.00 0.00 0.00 0.00
Total Scope 1 3.08 0.001 0.000 3.20 0.67
Scope 2
Purchased electricity from the grid 82.08 82.08
Scope 3
Fuel and energy-related activities not included in Scope
1 and 2 0.00 0.00 0.00 0.00 0.00
Transport and distribution (upstream) 0.00 0.00 0.00 0.00 0.00
Waste generated in operations 0.00 0.04 0.00 1.01 0.00
Business travels 5.33 0.0011 0.0004 5.48 0.70
Employees transportation (home-work) 0.00 0.00 0.00 0.00 0.00
Transport and distribution (downstream) 0.00 0.00 0.00 0.00 0.00
Total Scope 3 5.33 0.04 0.0004 6.48 0.70
Total emissions 90.48 0.04 0.001 91.76 1.37
Charqueadas (UTCH)
The UTCH issued a total of 552,522.61 tCO2e during 2015.
Figure 32 - Representation of UTCH GHG emissions by Scope
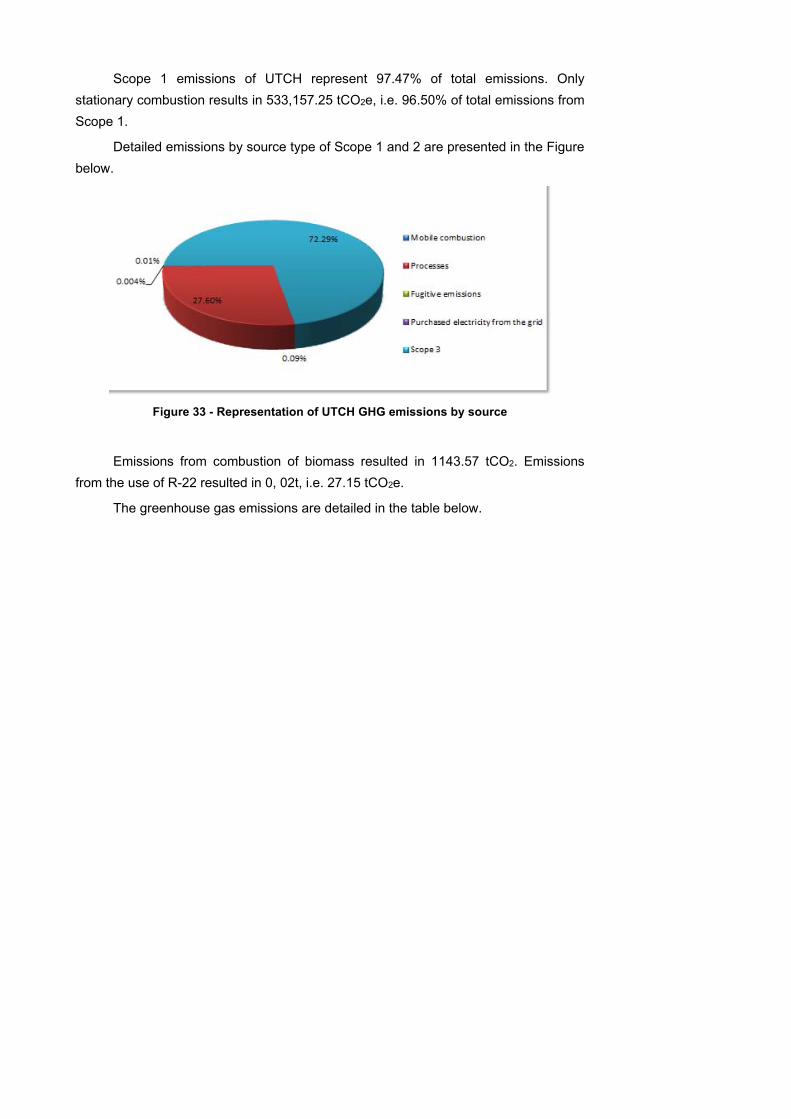
Scope 1 emissions of UTCH represent 97.47% of total emissions. Only
stationary combustion results in 533,157.25 tCO2e, i.e. 96.50% of total emissions from
Scope 1.
Detailed emissions by source type of Scope 1 and 2 are presented in the Figure
below.
Figure 33 - Representation of UTCH GHG emissions by source
Emissions from combustion of biomass resulted in 1143.57 tCO2. Emissions
from the use of R-22 resulted in 0, 02t, i.e. 27.15 tCO2e.
The greenhouse gas emissions are detailed in the table below.
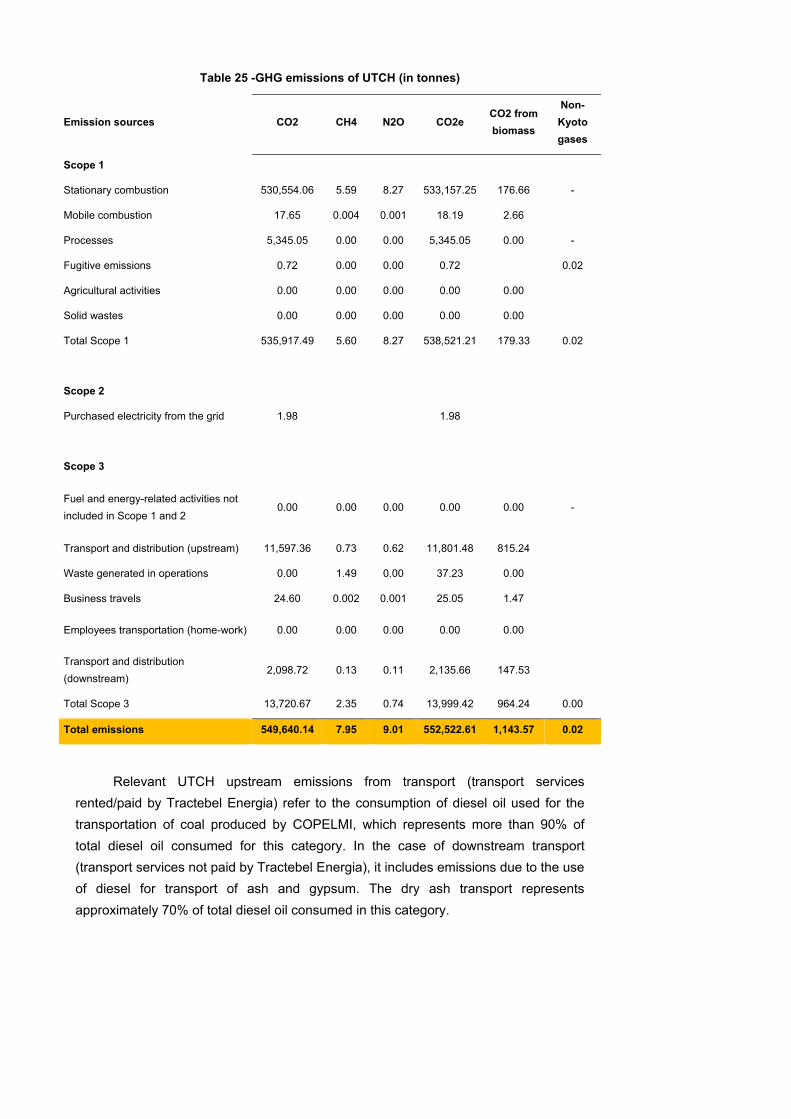
Table 25 -GHG emissions of UTCH (in tonnes)
Emission sources CO2 CH4 N2O CO2e CO2 from
biomass
Non-
Kyoto
gases
Scope 1
Stationary combustion 530,554.06 5.59 8.27 533,157.25 176.66 -
Mobile combustion 17.65 0.004 0.001 18.19 2.66
Processes 5,345.05 0.00 0.00 5,345.05 0.00 -
Fugitive emissions 0.72 0.00 0.00 0.72 0.02
Agricultural activities 0.00 0.00 0.00 0.00 0.00
Solid wastes 0.00 0.00 0.00 0.00 0.00
Total Scope 1 535,917.49 5.60 8.27 538,521.21 179.33 0.02
Scope 2
Purchased electricity from the grid 1.98 1.98
Scope 3
Fuel and energy-related activities not
included in Scope 1 and 2 0.00 0.00 0.00 0.00 0.00 -
Transport and distribution (upstream) 11,597.36 0.73 0.62 11,801.48 815.24
Waste generated in operations 0.00 1.49 0.00 37.23 0.00
Business travels 24.60 0.002 0.001 25.05 1.47
Employees transportation (home-work) 0.00 0.00 0.00 0.00 0.00
Transport and distribution
(downstream) 2,098.72 0.13 0.11 2,135.66 147.53
Total Scope 3 13,720.67 2.35 0.74 13,999.42 964.24 0.00
Total emissions 549,640.14 7.95 9.01 552,522.61 1,143.57 0.02
Relevant UTCH upstream emissions from transport (transport services
rented/paid by Tractebel Energia) refer to the consumption of diesel oil used for the
transportation of coal produced by COPELMI, which represents more than 90% of
total diesel oil consumed for this category. In the case of downstream transport
(transport services not paid by Tractebel Energia), it includes emissions due to the use
of diesel for transport of ash and gypsum. The dry ash transport represents
approximately 70% of total diesel oil consumed in this category.
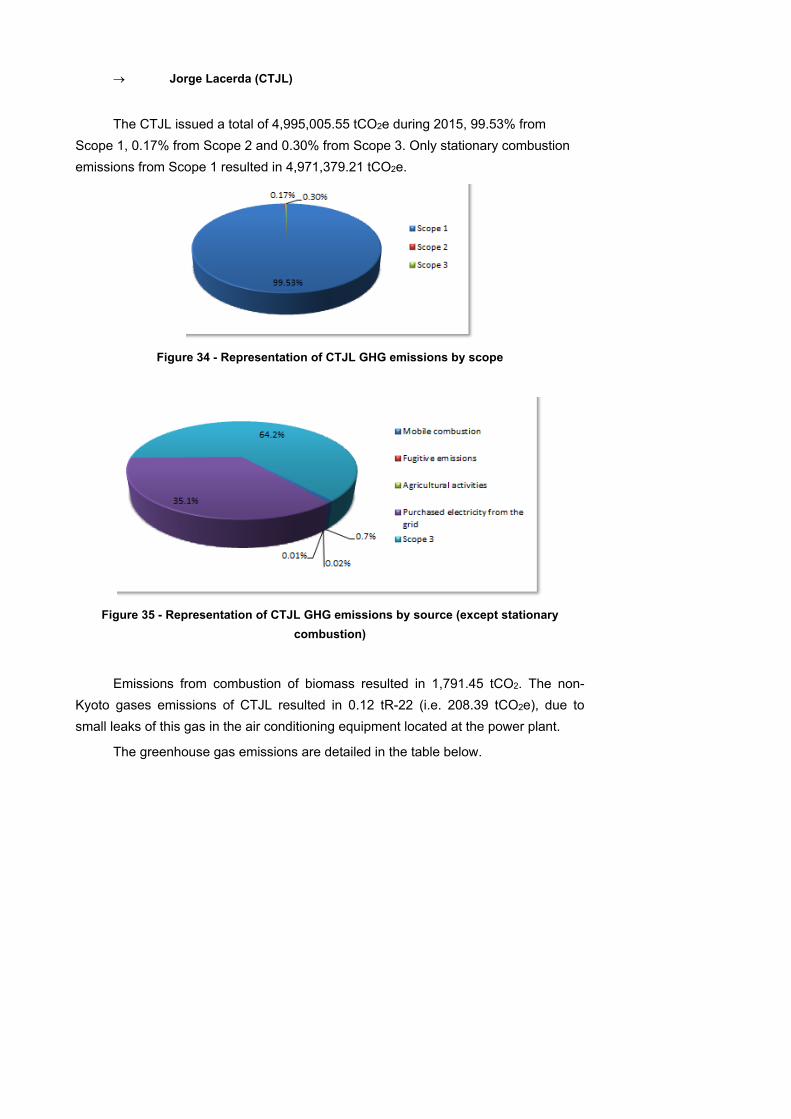
Jorge Lacerda (CTJL)
The CTJL issued a total of 4,995,005.55 tCO2e during 2015, 99.53% from
Scope 1, 0.17% from Scope 2 and 0.30% from Scope 3. Only stationary combustion
emissions from Scope 1 resulted in 4,971,379.21 tCO2e.
Figure 34 - Representation of CTJL GHG emissions by scope
Figure 35 - Representation of CTJL GHG emissions by source (except stationary
combustion)
Emissions from combustion of biomass resulted in 1,791.45 tCO2. The non-
Kyoto gases emissions of CTJL resulted in 0.12 tR-22 (i.e. 208.39 tCO2e), due to
small leaks of this gas in the air conditioning equipment located at the power plant.
The greenhouse gas emissions are detailed in the table below.
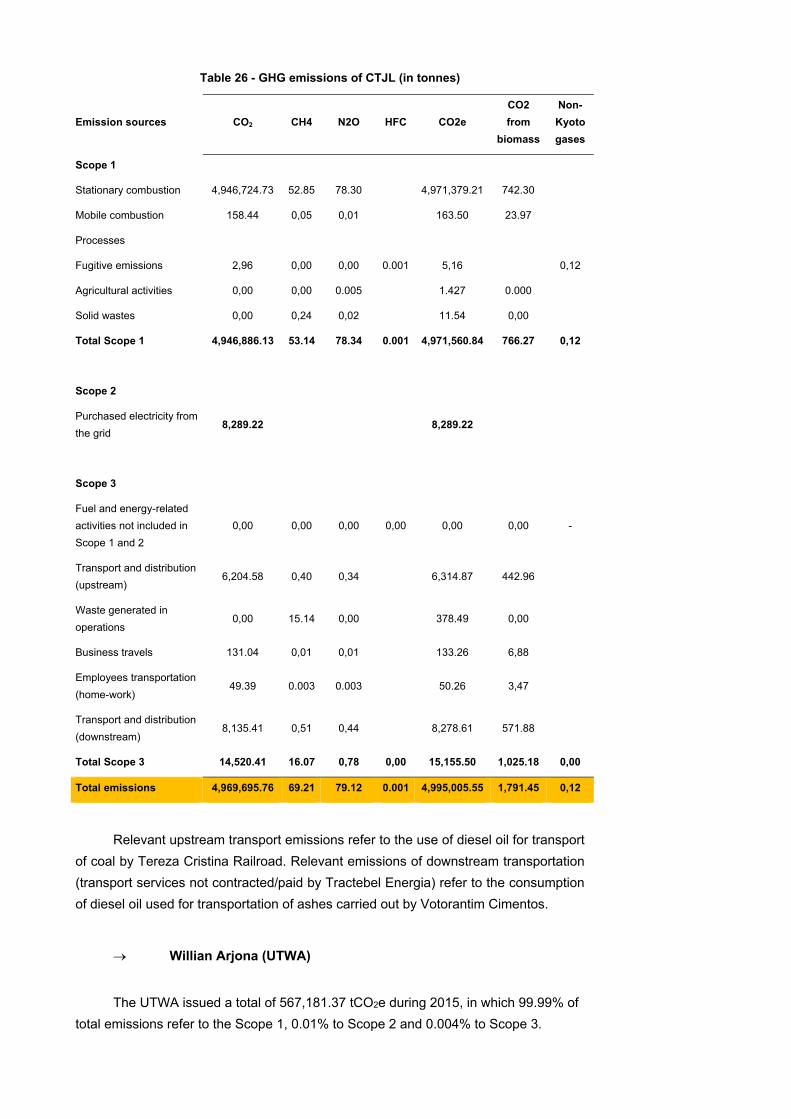
Table 26 - GHG emissions of CTJL (in tonnes)
Emission sources CO2 CH4 N2O HFC CO2e
CO2
from
biomass
Non-
Kyoto
gases
Scope 1
Stationary combustion 4,946,724.73 52.85 78.30 4,971,379.21 742.30
Mobile combustion 158.44 0,05 0,01 163.50 23.97
Processes
Fugitive emissions 2,96 0,00 0,00 0.001 5,16 0,12
Agricultural activities 0,00 0,00 0.005 1.427 0.000
Solid wastes 0,00 0,24 0,02 11.54 0,00
Total Scope 1 4,946,886.13 53.14 78.34 0.001 4,971,560.84 766.27 0,12
Scope 2
Purchased electricity from
the grid 8,289.22 8,289.22
Scope 3
Fuel and energy-related
activities not included in
Scope 1 and 2
0,00 0,00 0,00 0,00 0,00 0,00 -
Transport and distribution
(upstream) 6,204.58 0,40 0,34 6,314.87 442.96
Waste generated in
operations 0,00 15.14 0,00 378.49 0,00
Business travels 131.04 0,01 0,01 133.26 6,88
Employees transportation
(home-work) 49.39 0.003 0.003 50.26 3,47
Transport and distribution
(downstream) 8,135.41 0,51 0,44 8,278.61 571.88
Total Scope 3 14,520.41 16.07 0,78 0,00 15,155.50 1,025.18 0,00
Total emissions 4,969,695.76 69.21 79.12 0.001 4,995,005.55 1,791.45 0,12
Relevant upstream transport emissions refer to the use of diesel oil for transport
of coal by Tereza Cristina Railroad. Relevant emissions of downstream transportation
(transport services not contracted/paid by Tractebel Energia) refer to the consumption
of diesel oil used for transportation of ashes carried out by Votorantim Cimentos.
Willian Arjona (UTWA)
The UTWA issued a total of 567,181.37 tCO2e during 2015, in which 99.99% of
total emissions refer to the Scope 1, 0.01% to Scope 2 and 0.004% to Scope 3.
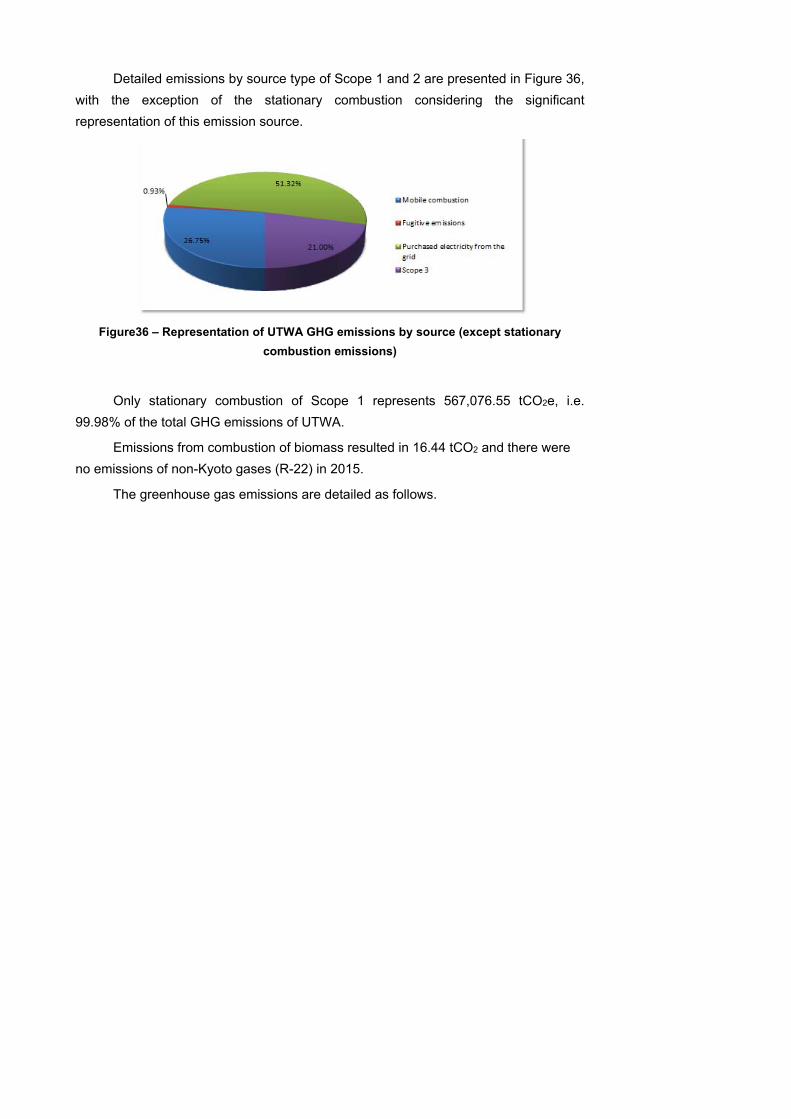
Detailed emissions by source type of Scope 1 and 2 are presented in Figure 36,
with the exception of the stationary combustion considering the significant
representation of this emission source.
Figure36 – Representation of UTWA GHG emissions by source (except stationary
combustion emissions)
Only stationary combustion of Scope 1 represents 567,076.55 tCO2e, i.e.
99.98% of the total GHG emissions of UTWA.
Emissions from combustion of biomass resulted in 16.44 tCO2 and there were
no emissions of non-Kyoto gases (R-22) in 2015.
The greenhouse gas emissions are detailed as follows.
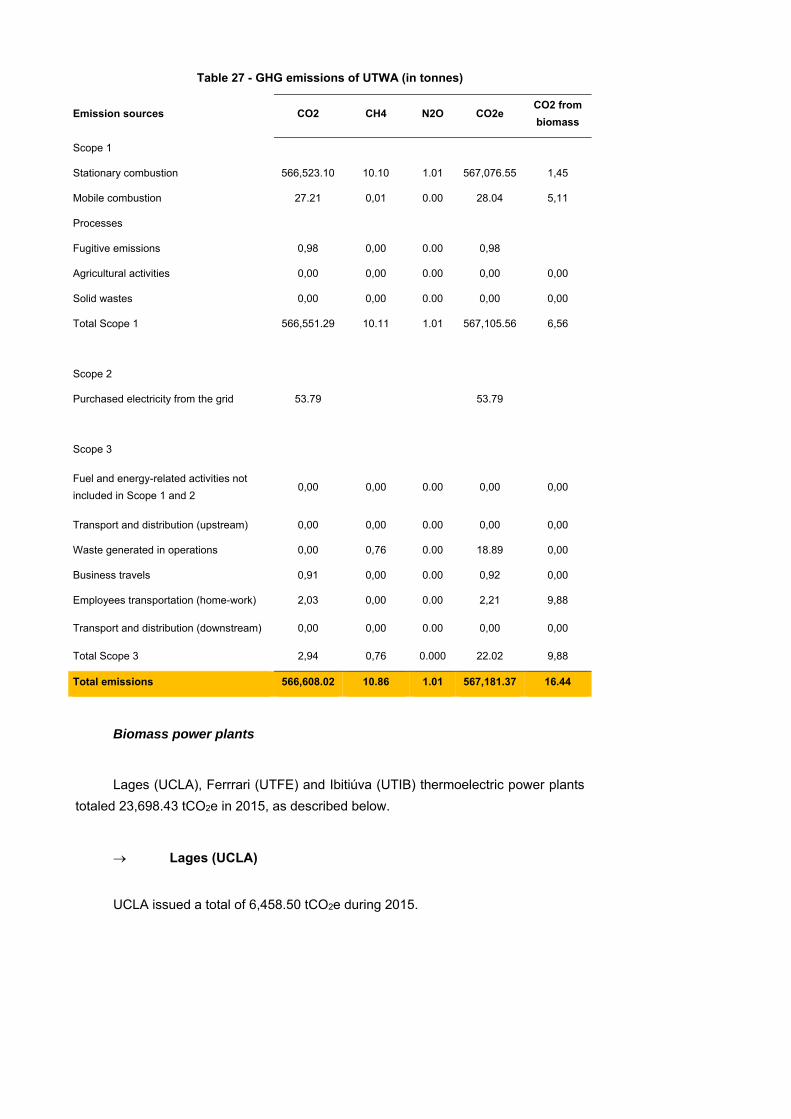
Table 27 - GHG emissions of UTWA (in tonnes)
Emission sources CO2 CH4 N2O CO2e CO2 from
biomass
Scope 1
Stationary combustion 566,523.10 10.10 1.01 567,076.55 1,45
Mobile combustion 27.21 0,01 0.00 28.04 5,11
Processes
Fugitive emissions 0,98 0,00 0.00 0,98
Agricultural activities 0,00 0,00 0.00 0,00 0,00
Solid wastes 0,00 0,00 0.00 0,00 0,00
Total Scope 1 566,551.29 10.11 1.01 567,105.56 6,56
Scope 2
Purchased electricity from the grid 53.79 53.79
Scope 3
Fuel and energy-related activities not
included in Scope 1 and 2 0,00 0,00 0.00 0,00 0,00
Transport and distribution (upstream) 0,00 0,00 0.00 0,00 0,00
Waste generated in operations 0,00 0,76 0.00 18.89 0,00
Business travels 0,91 0,00 0.00 0,92 0,00
Employees transportation (home-work) 2,03 0,00 0.00 2,21 9,88
Transport and distribution (downstream) 0,00 0,00 0.00 0,00 0,00
Total Scope 3 2,94 0,76 0.000 22.02 9,88
Total emissions 566,608.02 10.86 1.01 567,181.37 16.44
Biomass power plants
Lages (UCLA), Ferrrari (UTFE) and Ibitiúva (UTIB) thermoelectric power plants
totaled 23,698.43 tCO2e in 2015, as described below.
Lages (UCLA)
UCLA issued a total of 6,458.50 tCO2e during 2015.
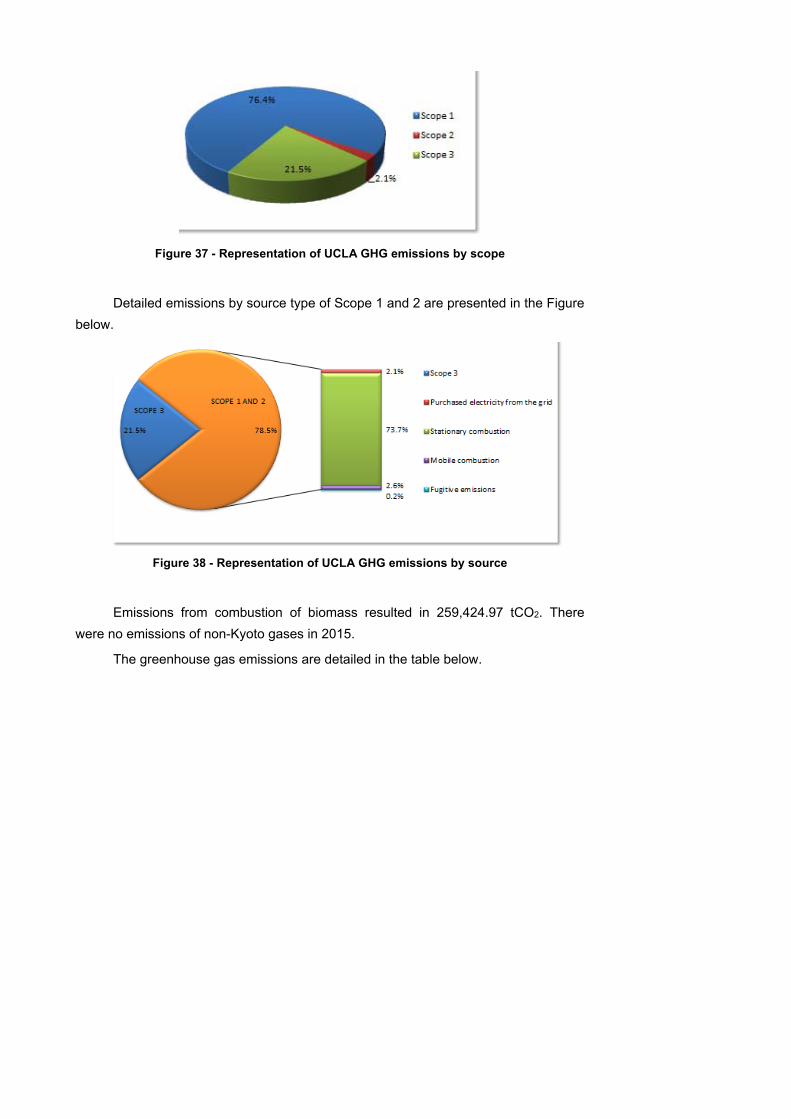
Figure 37 - Representation of UCLA GHG emissions by scope
Detailed emissions by source type of Scope 1 and 2 are presented in the Figure
below.
Figure 38 - Representation of UCLA GHG emissions by source
Emissions from combustion of biomass resulted in 259,424.97 tCO2. There
were no emissions of non-Kyoto gases in 2015.
The greenhouse gas emissions are detailed in the table below.
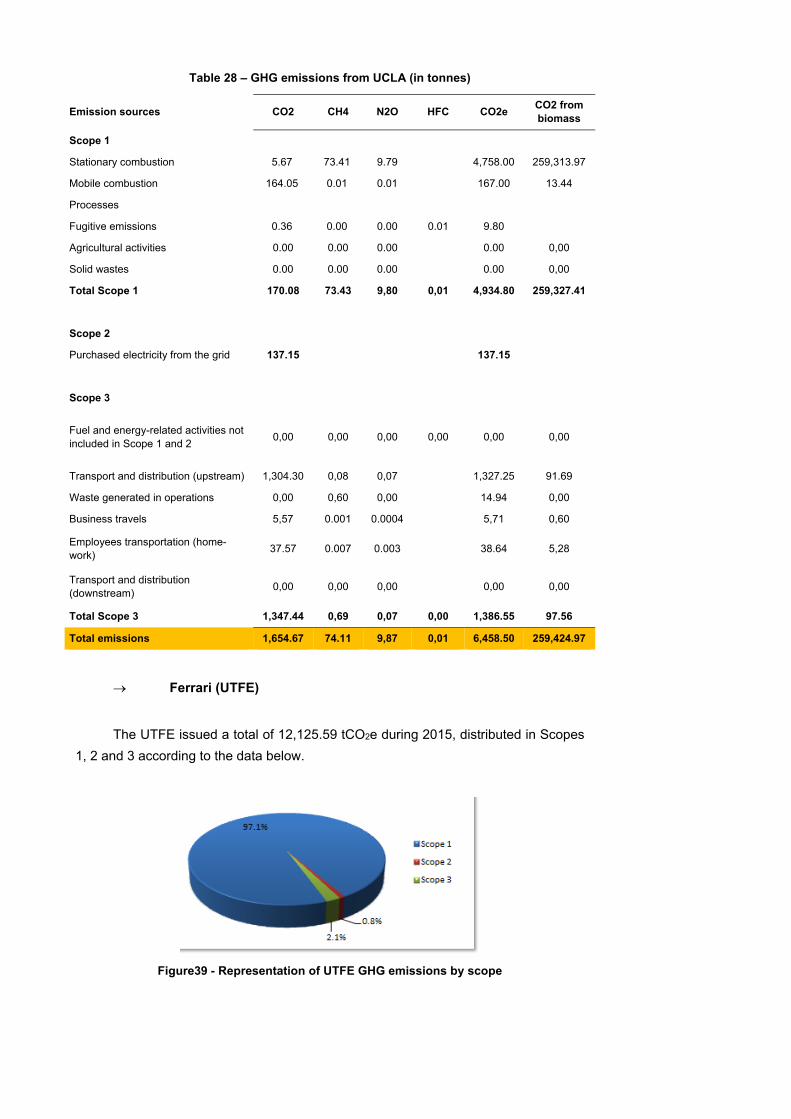
Table 28 – GHG emissions from UCLA (in tonnes)
Emission sources CO2 CH4 N2O HFC CO2e CO2 from biomass
Scope 1
Stationary combustion 5.67 73.41 9.79 4,758.00 259,313.97
Mobile combustion 164.05 0.01 0.01 167.00 13.44
Processes
Fugitive emissions 0.36 0.00 0.00 0.01 9.80
Agricultural activities 0.00 0.00 0.00 0.00 0,00
Solid wastes 0.00 0.00 0.00 0.00 0,00
Total Scope 1 170.08 73.43 9,80 0,01 4,934.80 259,327.41
Scope 2
Purchased electricity from the grid 137.15 137.15
Scope 3
Fuel and energy-related activities not included in Scope 1 and 2
0,00 0,00 0,00 0,00 0,00 0,00
Transport and distribution (upstream) 1,304.30 0,08 0,07 1,327.25 91.69
Waste generated in operations 0,00 0,60 0,00 14.94 0,00
Business travels 5,57 0.001 0.0004 5,71 0,60
Employees transportation (home-work)
37.57 0.007 0.003 38.64 5,28
Transport and distribution (downstream)
0,00 0,00 0,00 0,00 0,00
Total Scope 3 1,347.44 0,69 0,07 0,00 1,386.55 97.56
Total emissions 1,654.67 74.11 9,87 0,01 6,458.50 259,424.97
Ferrari (UTFE)
The UTFE issued a total of 12,125.59 tCO2e during 2015, distributed in Scopes
1, 2 and 3 according to the data below.
Figure39 - Representation of UTFE GHG emissions by scope
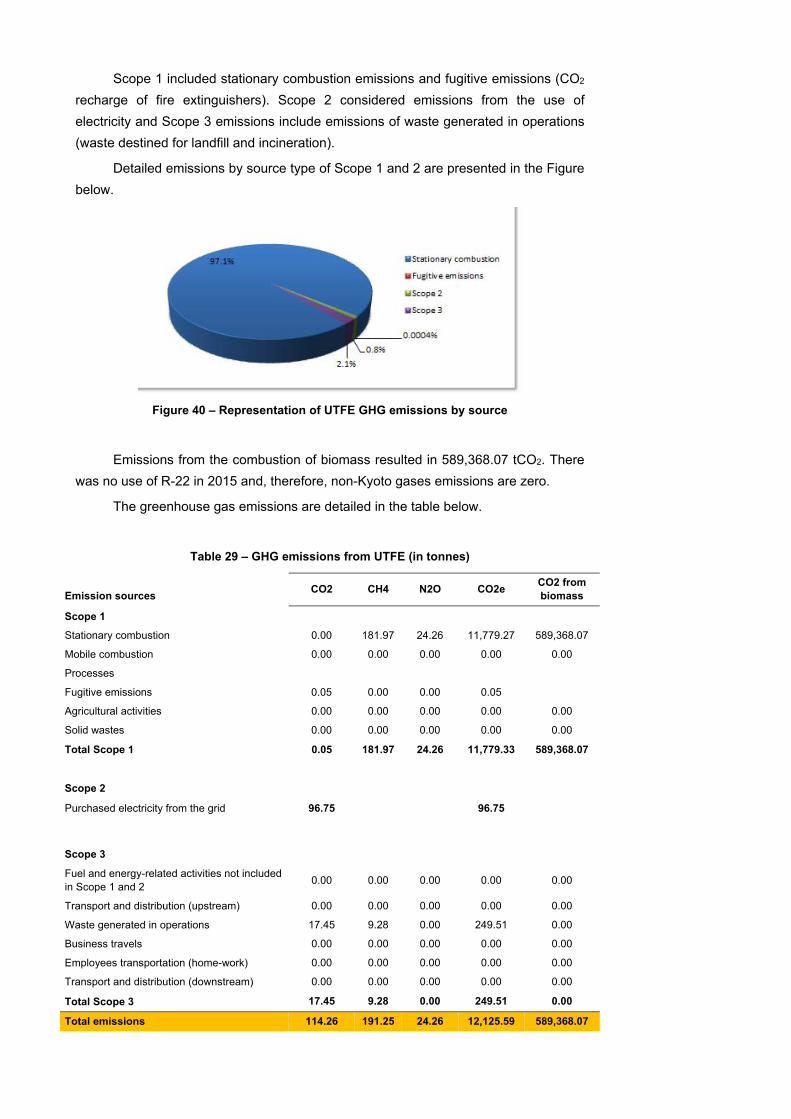
Scope 1 included stationary combustion emissions and fugitive emissions (CO2
recharge of fire extinguishers). Scope 2 considered emissions from the use of
electricity and Scope 3 emissions include emissions of waste generated in operations
(waste destined for landfill and incineration).
Detailed emissions by source type of Scope 1 and 2 are presented in the Figure
below.
Figure 40 – Representation of UTFE GHG emissions by source
Emissions from the combustion of biomass resulted in 589,368.07 tCO2. There
was no use of R-22 in 2015 and, therefore, non-Kyoto gases emissions are zero.
The greenhouse gas emissions are detailed in the table below.
Table 29 – GHG emissions from UTFE (in tonnes)
Emission sources CO2 CH4 N2O CO2e
CO2 from biomass
Scope 1
Stationary combustion 0.00 181.97 24.26 11,779.27 589,368.07
Mobile combustion 0.00 0.00 0.00 0.00 0.00
Processes
Fugitive emissions 0.05 0.00 0.00 0.05
Agricultural activities 0.00 0.00 0.00 0.00 0.00
Solid wastes 0.00 0.00 0.00 0.00 0.00
Total Scope 1 0.05 181.97 24.26 11,779.33 589,368.07
Scope 2
Purchased electricity from the grid 96.75 96.75
Scope 3
Fuel and energy-related activities not included in Scope 1 and 2
0.00 0.00 0.00 0.00 0.00
Transport and distribution (upstream) 0.00 0.00 0.00 0.00 0.00
Waste generated in operations 17.45 9.28 0.00 249.51 0.00
Business travels 0.00 0.00 0.00 0.00 0.00
Employees transportation (home-work) 0.00 0.00 0.00 0.00 0.00
Transport and distribution (downstream) 0.00 0.00 0.00 0.00 0.00
Total Scope 3 17.45 9.28 0.00 249.51 0.00
Total emissions 114.26 191.25 24.26 12,125.59 589,368.07
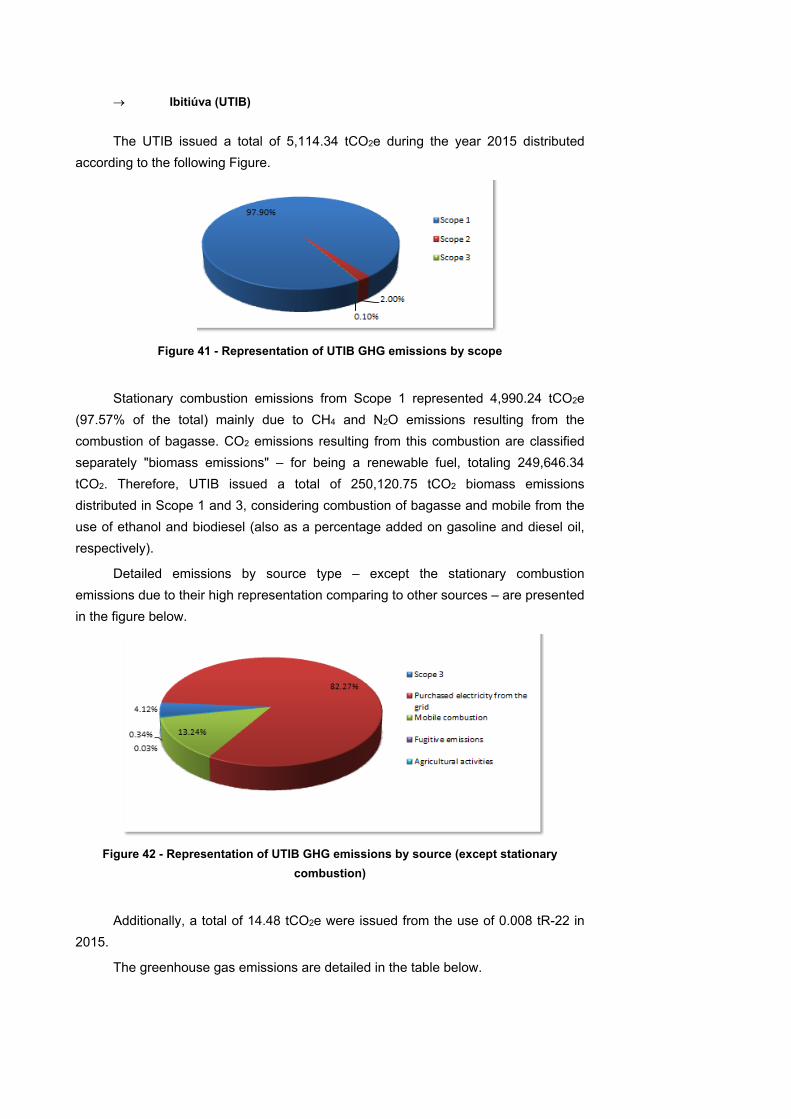
Ibitiúva (UTIB)
The UTIB issued a total of 5,114.34 tCO2e during the year 2015 distributed
according to the following Figure.
Figure 41 - Representation of UTIB GHG emissions by scope
Stationary combustion emissions from Scope 1 represented 4,990.24 tCO2e
(97.57% of the total) mainly due to CH4 and N2O emissions resulting from the
combustion of bagasse. CO2 emissions resulting from this combustion are classified
separately "biomass emissions" – for being a renewable fuel, totaling 249,646.34
tCO2. Therefore, UTIB issued a total of 250,120.75 tCO2 biomass emissions
distributed in Scope 1 and 3, considering combustion of bagasse and mobile from the
use of ethanol and biodiesel (also as a percentage added on gasoline and diesel oil,
respectively).
Detailed emissions by source type – except the stationary combustion
emissions due to their high representation comparing to other sources – are presented
in the figure below.
Figure 42 - Representation of UTIB GHG emissions by source (except stationary
combustion)
Additionally, a total of 14.48 tCO2e were issued from the use of 0.008 tR-22 in
2015.
The greenhouse gas emissions are detailed in the table below.
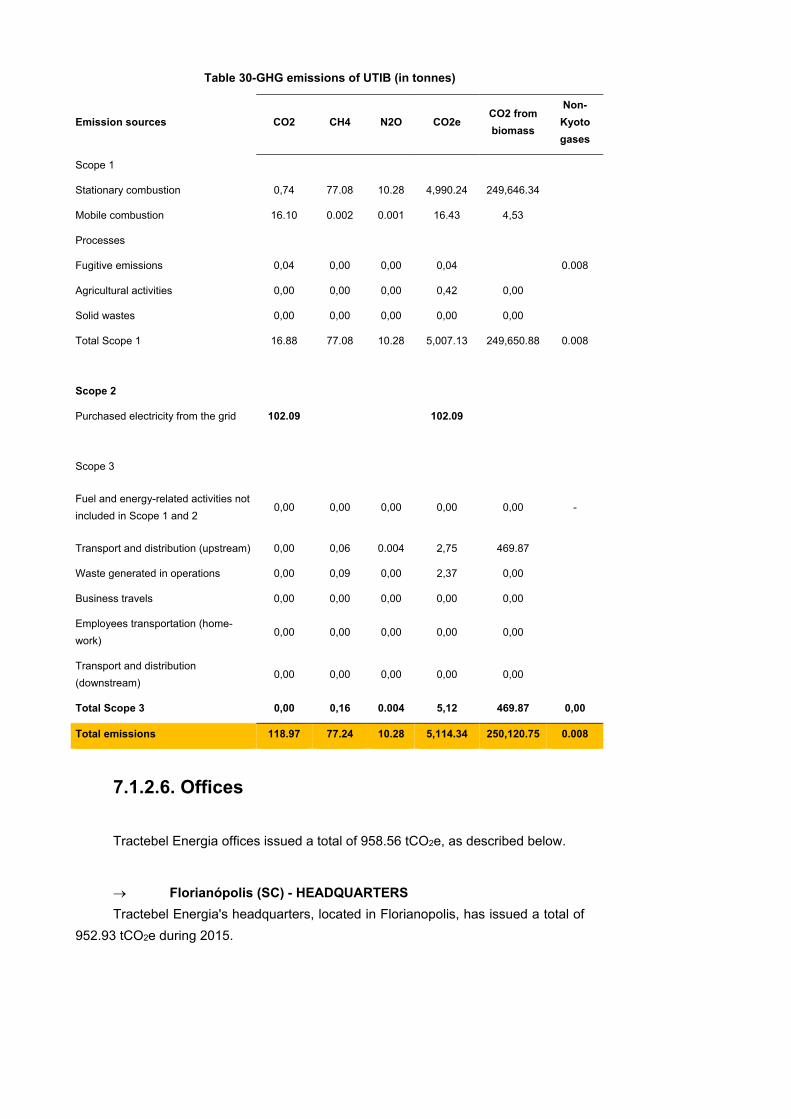
Table 30-GHG emissions of UTIB (in tonnes)
Emission sources CO2 CH4 N2O CO2e CO2 from
biomass
Non-
Kyoto
gases
Scope 1
Stationary combustion 0,74 77.08 10.28 4,990.24 249,646.34
Mobile combustion 16.10 0.002 0.001 16.43 4,53
Processes
Fugitive emissions 0,04 0,00 0,00 0,04 0.008
Agricultural activities 0,00 0,00 0,00 0,42 0,00
Solid wastes 0,00 0,00 0,00 0,00 0,00
Total Scope 1 16.88 77.08 10.28 5,007.13 249,650.88 0.008
Scope 2
Purchased electricity from the grid 102.09 102.09
Scope 3
Fuel and energy-related activities not
included in Scope 1 and 2 0,00 0,00 0,00 0,00 0,00 -
Transport and distribution (upstream) 0,00 0,06 0.004 2,75 469.87
Waste generated in operations 0,00 0,09 0,00 2,37 0,00
Business travels 0,00 0,00 0,00 0,00 0,00
Employees transportation (home-
work) 0,00 0,00 0,00 0,00 0,00
Transport and distribution
(downstream) 0,00 0,00 0,00 0,00 0,00
Total Scope 3 0,00 0,16 0.004 5,12 469.87 0,00
Total emissions 118.97 77.24 10.28 5,114.34 250,120.75 0.008
7.1.2.6. Offices
Tractebel Energia offices issued a total of 958.56 tCO2e, as described below.
Florianópolis (SC) - HEADQUARTERS
Tractebel Energia's headquarters, located in Florianopolis, has issued a total of
952.93 tCO2e during 2015.
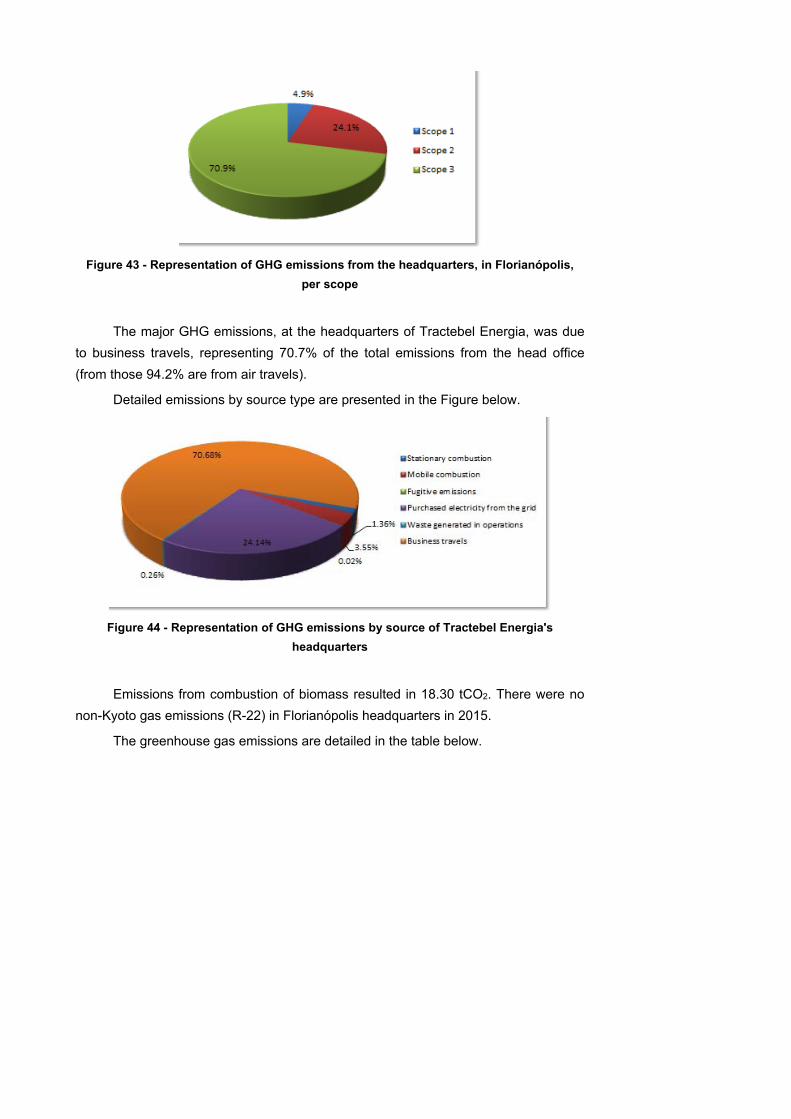
Figure 43 - Representation of GHG emissions from the headquarters, in Florianópolis,
per scope
The major GHG emissions, at the headquarters of Tractebel Energia, was due
to business travels, representing 70.7% of the total emissions from the head office
(from those 94.2% are from air travels).
Detailed emissions by source type are presented in the Figure below.
Figure 44 - Representation of GHG emissions by source of Tractebel Energia's
headquarters
Emissions from combustion of biomass resulted in 18.30 tCO2. There were no
non-Kyoto gas emissions (R-22) in Florianópolis headquarters in 2015.
The greenhouse gas emissions are detailed in the table below.
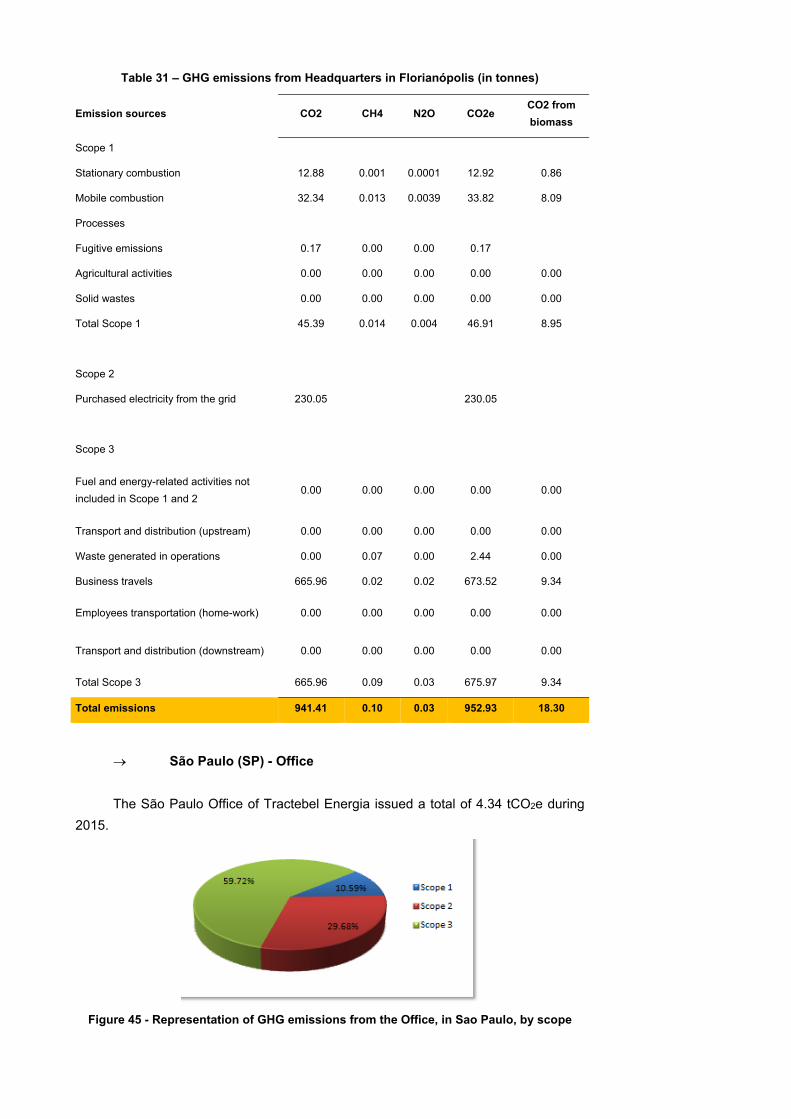
Table 31 – GHG emissions from Headquarters in Florianópolis (in tonnes)
Emission sources CO2 CH4 N2O CO2e CO2 from
biomass
Scope 1
Stationary combustion 12.88 0.001 0.0001 12.92 0.86
Mobile combustion 32.34 0.013 0.0039 33.82 8.09
Processes
Fugitive emissions 0.17 0.00 0.00 0.17
Agricultural activities 0.00 0.00 0.00 0.00 0.00
Solid wastes 0.00 0.00 0.00 0.00 0.00
Total Scope 1 45.39 0.014 0.004 46.91 8.95
Scope 2
Purchased electricity from the grid 230.05 230.05
Scope 3
Fuel and energy-related activities not
included in Scope 1 and 2 0.00 0.00 0.00 0.00 0.00
Transport and distribution (upstream) 0.00 0.00 0.00 0.00 0.00
Waste generated in operations 0.00 0.07 0.00 2.44 0.00
Business travels 665.96 0.02 0.02 673.52 9.34
Employees transportation (home-work) 0.00 0.00 0.00 0.00 0.00
Transport and distribution (downstream) 0.00 0.00 0.00 0.00 0.00
Total Scope 3 665.96 0.09 0.03 675.97 9.34
Total emissions 941.41 0.10 0.03 952.93 18.30
São Paulo (SP) - Office
The São Paulo Office of Tractebel Energia issued a total of 4.34 tCO2e during
2015.
Figure 45 - Representation of GHG emissions from the Office, in Sao Paulo, by scope
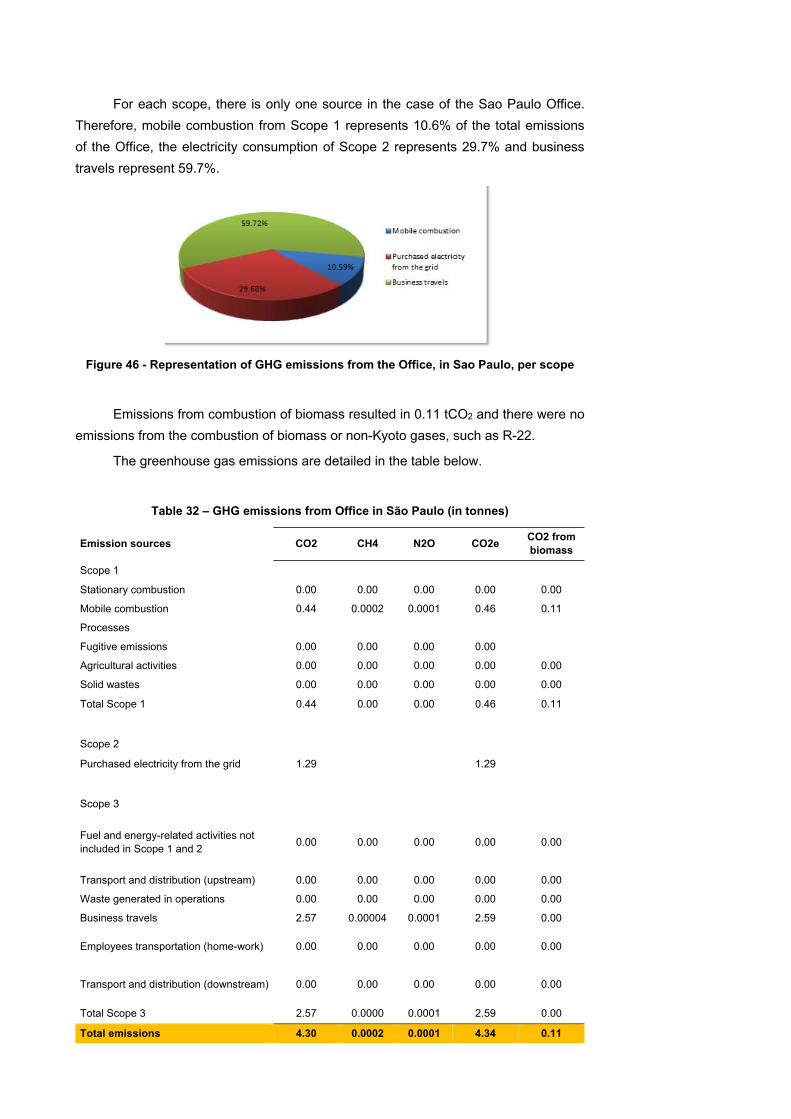
For each scope, there is only one source in the case of the Sao Paulo Office.
Therefore, mobile combustion from Scope 1 represents 10.6% of the total emissions
of the Office, the electricity consumption of Scope 2 represents 29.7% and business
travels represent 59.7%.
Figure 46 - Representation of GHG emissions from the Office, in Sao Paulo, per scope
Emissions from combustion of biomass resulted in 0.11 tCO2 and there were no
emissions from the combustion of biomass or non-Kyoto gases, such as R-22.
The greenhouse gas emissions are detailed in the table below.
Table 32 – GHG emissions from Office in São Paulo (in tonnes)
Emission sources CO2 CH4 N2O CO2e CO2 from biomass
Scope 1
Stationary combustion 0.00 0.00 0.00 0.00 0.00
Mobile combustion 0.44 0.0002 0.0001 0.46 0.11
Processes
Fugitive emissions 0.00 0.00 0.00 0.00
Agricultural activities 0.00 0.00 0.00 0.00 0.00
Solid wastes 0.00 0.00 0.00 0.00 0.00
Total Scope 1 0.44 0.00 0.00 0.46 0.11
Scope 2
Purchased electricity from the grid 1.29 1.29
Scope 3
Fuel and energy-related activities not included in Scope 1 and 2
0.00 0.00 0.00 0.00 0.00
Transport and distribution (upstream) 0.00 0.00 0.00 0.00 0.00
Waste generated in operations 0.00 0.00 0.00 0.00 0.00
Business travels 2.57 0.00004 0.0001 2.59 0.00
Employees transportation (home-work) 0.00 0.00 0.00 0.00 0.00
Transport and distribution (downstream) 0.00 0.00 0.00 0.00 0.00
Total Scope 3 2.57 0.0000 0.0001 2.59 0.00
Total emissions 4.30 0.0002 0.0001 4.34 0.11
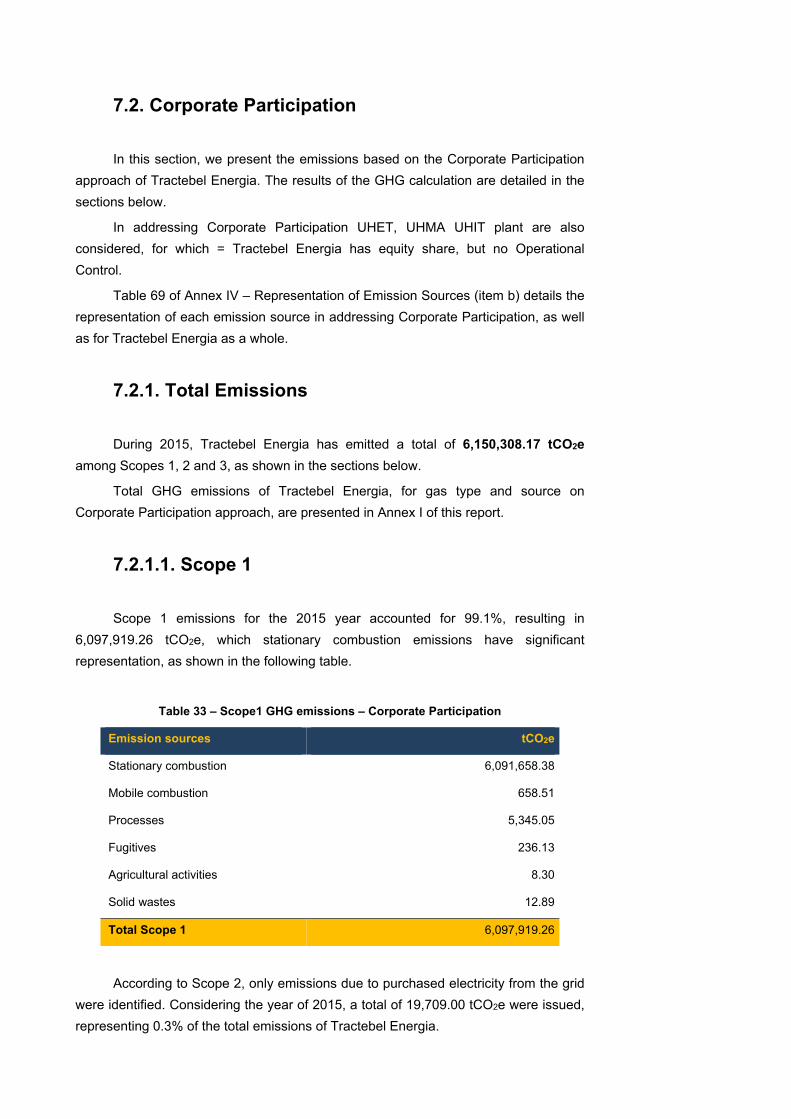
7.2. Corporate Participation
In this section, we present the emissions based on the Corporate Participation
approach of Tractebel Energia. The results of the GHG calculation are detailed in the
sections below.
In addressing Corporate Participation UHET, UHMA UHIT plant are also
considered, for which = Tractebel Energia has equity share, but no Operational
Control.
Table 69 of Annex IV – Representation of Emission Sources (item b) details the
representation of each emission source in addressing Corporate Participation, as well
as for Tractebel Energia as a whole.
7.2.1. Total Emissions
During 2015, Tractebel Energia has emitted a total of 6,150,308.17 tCO2e
among Scopes 1, 2 and 3, as shown in the sections below.
Total GHG emissions of Tractebel Energia, for gas type and source on
Corporate Participation approach, are presented in Annex I of this report.
7.2.1.1. Scope 1
Scope 1 emissions for the 2015 year accounted for 99.1%, resulting in
6,097,919.26 tCO2e, which stationary combustion emissions have significant
representation, as shown in the following table.
Table 33 – Scope1 GHG emissions – Corporate Participation
Emission sources tCO2e
Stationary combustion 6,091,658.38
Mobile combustion 658.51
Processes 5,345.05
Fugitives 236.13
Agricultural activities 8.30
Solid wastes 12.89
Total Scope 1 6,097,919.26
According to Scope 2, only emissions due to purchased electricity from the grid
were identified. Considering the year of 2015, a total of 19,709.00 tCO2e were issued,
representing 0.3% of the total emissions of Tractebel Energia.
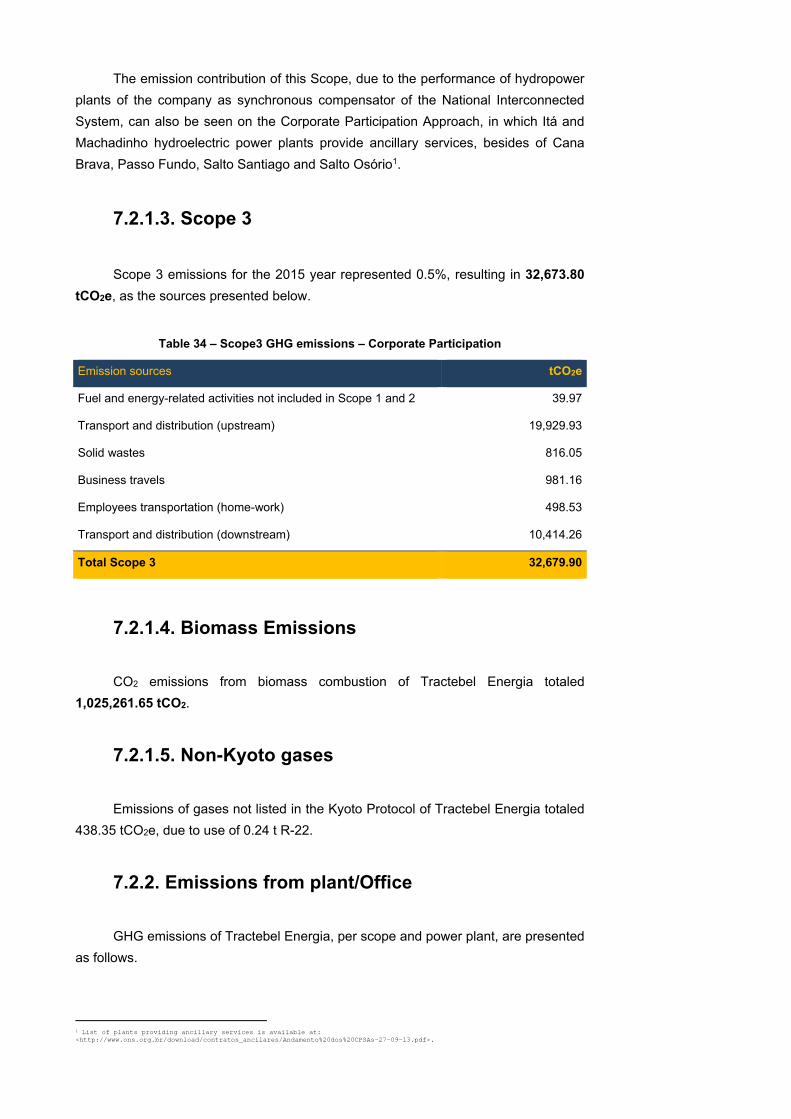
The emission contribution of this Scope, due to the performance of hydropower
plants of the company as synchronous compensator of the National Interconnected
System, can also be seen on the Corporate Participation Approach, in which Itá and
Machadinho hydroelectric power plants provide ancillary services, besides of Cana
Brava, Passo Fundo, Salto Santiago and Salto Osório1.
7.2.1.3. Scope 3
Scope 3 emissions for the 2015 year represented 0.5%, resulting in 32,673.80
tCO2e, as the sources presented below.
Table 34 – Scope3 GHG emissions – Corporate Participation
Emission sources tCO2e
Fuel and energy-related activities not included in Scope 1 and 2 39.97
Transport and distribution (upstream) 19,929.93
Solid wastes 816.05
Business travels 981.16
Employees transportation (home-work) 498.53
Transport and distribution (downstream) 10,414.26
Total Scope 3 32,679.90
7.2.1.4. Biomass Emissions
CO2 emissions from biomass combustion of Tractebel Energia totaled
1,025,261.65 tCO2.
7.2.1.5. Non-Kyoto gases
Emissions of gases not listed in the Kyoto Protocol of Tractebel Energia totaled
438.35 tCO2e, due to use of 0.24 t R-22.
7.2.2. Emissions from plant/Office
GHG emissions of Tractebel Energia, per scope and power plant, are presented
as follows.
1 List of plants providing ancillary services is available at: <http://www.ons.org.br/download/contratos_ancilares/Andamento%20dos%20CPSAs-27-09-13.pdf>.
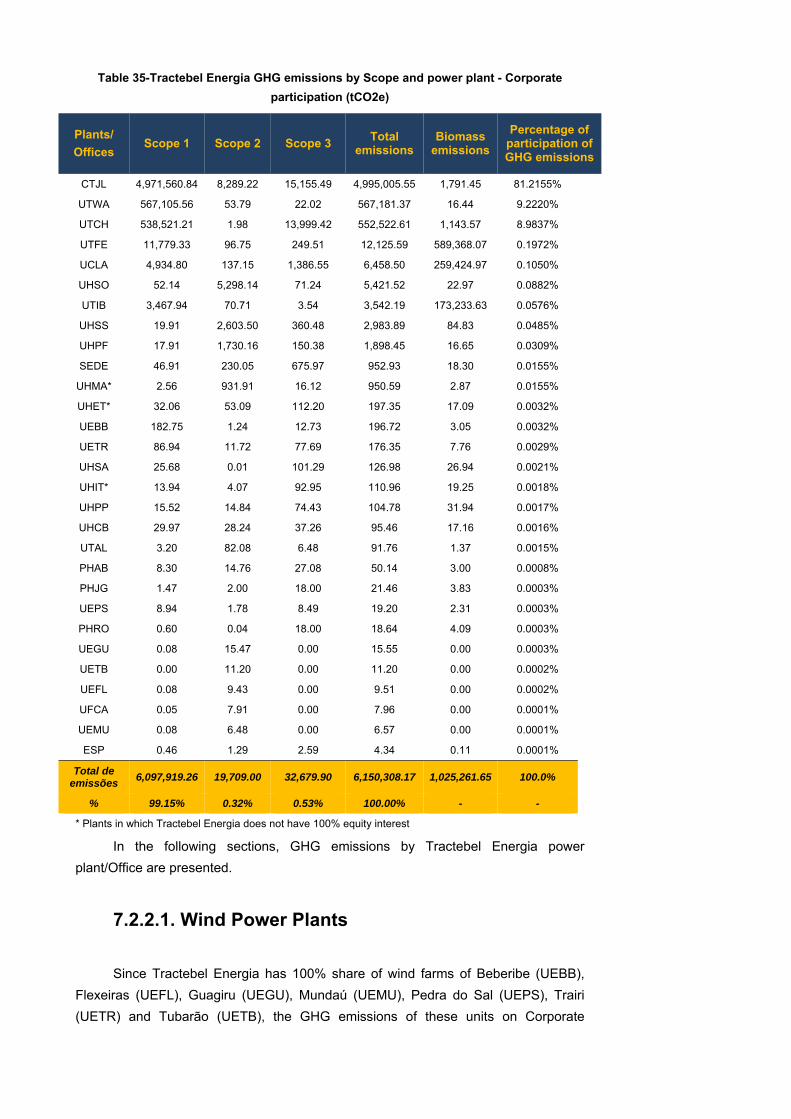
Table 35-Tractebel Energia GHG emissions by Scope and power plant - Corporate
participation (tCO2e)
Plants/
Offices Scope 1 Scope 2 Scope 3
Total emissions
Biomass emissions
Percentage of participation of GHG emissions
CTJL 4,971,560.84 8,289.22 15,155.49 4,995,005.55 1,791.45 81.2155%
UTWA 567,105.56 53.79 22.02 567,181.37 16.44 9.2220%
UTCH 538,521.21 1.98 13,999.42 552,522.61 1,143.57 8.9837%
UTFE 11,779.33 96.75 249.51 12,125.59 589,368.07 0.1972%
UCLA 4,934.80 137.15 1,386.55 6,458.50 259,424.97 0.1050%
UHSO 52.14 5,298.14 71.24 5,421.52 22.97 0.0882%
UTIB 3,467.94 70.71 3.54 3,542.19 173,233.63 0.0576%
UHSS 19.91 2,603.50 360.48 2,983.89 84.83 0.0485%
UHPF 17.91 1,730.16 150.38 1,898.45 16.65 0.0309%
SEDE 46.91 230.05 675.97 952.93 18.30 0.0155%
UHMA* 2.56 931.91 16.12 950.59 2.87 0.0155%
UHET* 32.06 53.09 112.20 197.35 17.09 0.0032%
UEBB 182.75 1.24 12.73 196.72 3.05 0.0032%
UETR 86.94 11.72 77.69 176.35 7.76 0.0029%
UHSA 25.68 0.01 101.29 126.98 26.94 0.0021%
UHIT* 13.94 4.07 92.95 110.96 19.25 0.0018%
UHPP 15.52 14.84 74.43 104.78 31.94 0.0017%
UHCB 29.97 28.24 37.26 95.46 17.16 0.0016%
UTAL 3.20 82.08 6.48 91.76 1.37 0.0015%
PHAB 8.30 14.76 27.08 50.14 3.00 0.0008%
PHJG 1.47 2.00 18.00 21.46 3.83 0.0003%
UEPS 8.94 1.78 8.49 19.20 2.31 0.0003%
PHRO 0.60 0.04 18.00 18.64 4.09 0.0003%
UEGU 0.08 15.47 0.00 15.55 0.00 0.0003%
UETB 0.00 11.20 0.00 11.20 0.00 0.0002%
UEFL 0.08 9.43 0.00 9.51 0.00 0.0002%
UFCA 0.05 7.91 0.00 7.96 0.00 0.0001%
UEMU 0.08 6.48 0.00 6.57 0.00 0.0001%
ESP 0.46 1.29 2.59 4.34 0.11 0.0001%
Total de emissões
6,097,919.26 19,709.00 32,679.90 6,150,308.17 1,025,261.65 100.0%
% 99.15% 0.32% 0.53% 100.00% - -
* Plants in which Tractebel Energia does not have 100% equity interest
In the following sections, GHG emissions by Tractebel Energia power
plant/Office are presented.
7.2.2.1. Wind Power Plants
Since Tractebel Energia has 100% share of wind farms of Beberibe (UEBB),
Flexeiras (UEFL), Guagiru (UEGU), Mundaú (UEMU), Pedra do Sal (UEPS), Trairi
(UETR) and Tubarão (UETB), the GHG emissions of these units on Corporate
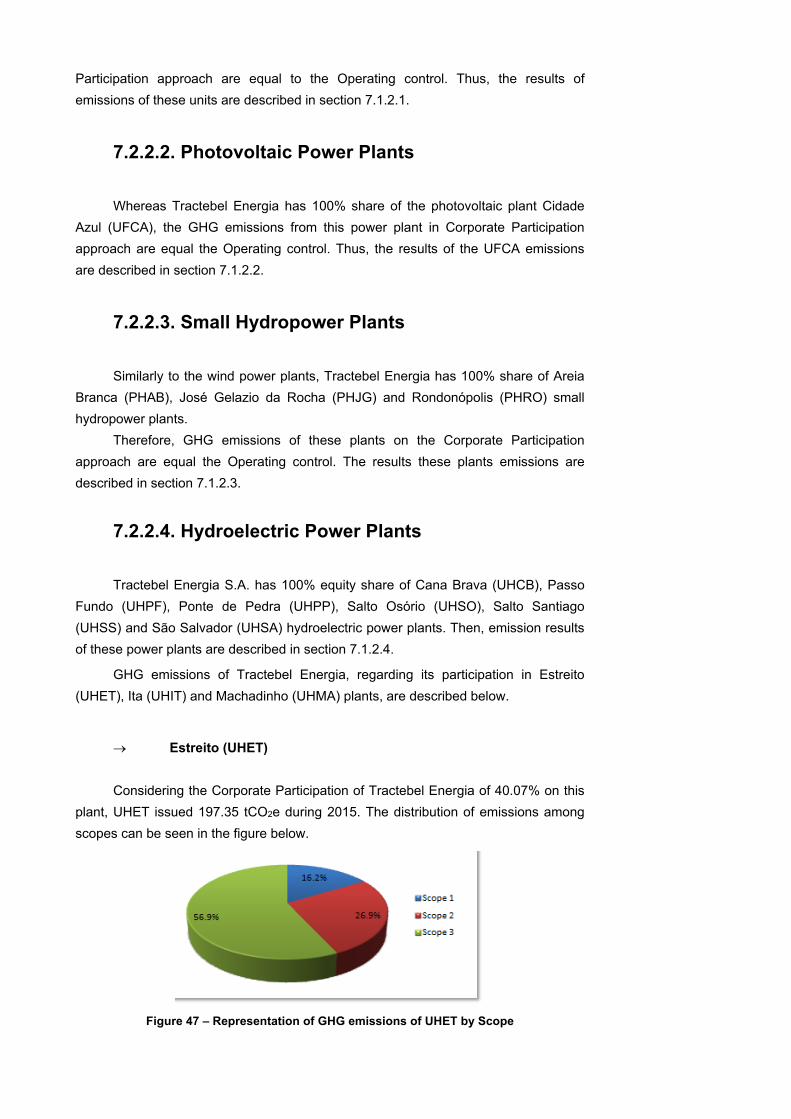
Participation approach are equal to the Operating control. Thus, the results of
emissions of these units are described in section 7.1.2.1.
7.2.2.2. Photovoltaic Power Plants
Whereas Tractebel Energia has 100% share of the photovoltaic plant Cidade
Azul (UFCA), the GHG emissions from this power plant in Corporate Participation
approach are equal the Operating control. Thus, the results of the UFCA emissions
are described in section 7.1.2.2.
7.2.2.3. Small Hydropower Plants
Similarly to the wind power plants, Tractebel Energia has 100% share of Areia
Branca (PHAB), José Gelazio da Rocha (PHJG) and Rondonópolis (PHRO) small
hydropower plants.
Therefore, GHG emissions of these plants on the Corporate Participation
approach are equal the Operating control. The results these plants emissions are
described in section 7.1.2.3.
7.2.2.4. Hydroelectric Power Plants
Tractebel Energia S.A. has 100% equity share of Cana Brava (UHCB), Passo
Fundo (UHPF), Ponte de Pedra (UHPP), Salto Osório (UHSO), Salto Santiago
(UHSS) and São Salvador (UHSA) hydroelectric power plants. Then, emission results
of these power plants are described in section 7.1.2.4.
GHG emissions of Tractebel Energia, regarding its participation in Estreito
(UHET), Ita (UHIT) and Machadinho (UHMA) plants, are described below.
Estreito (UHET)
Considering the Corporate Participation of Tractebel Energia of 40.07% on this
plant, UHET issued 197.35 tCO2e during 2015. The distribution of emissions among
scopes can be seen in the figure below.
Figure 47 – Representation of GHG emissions of UHET by Scope
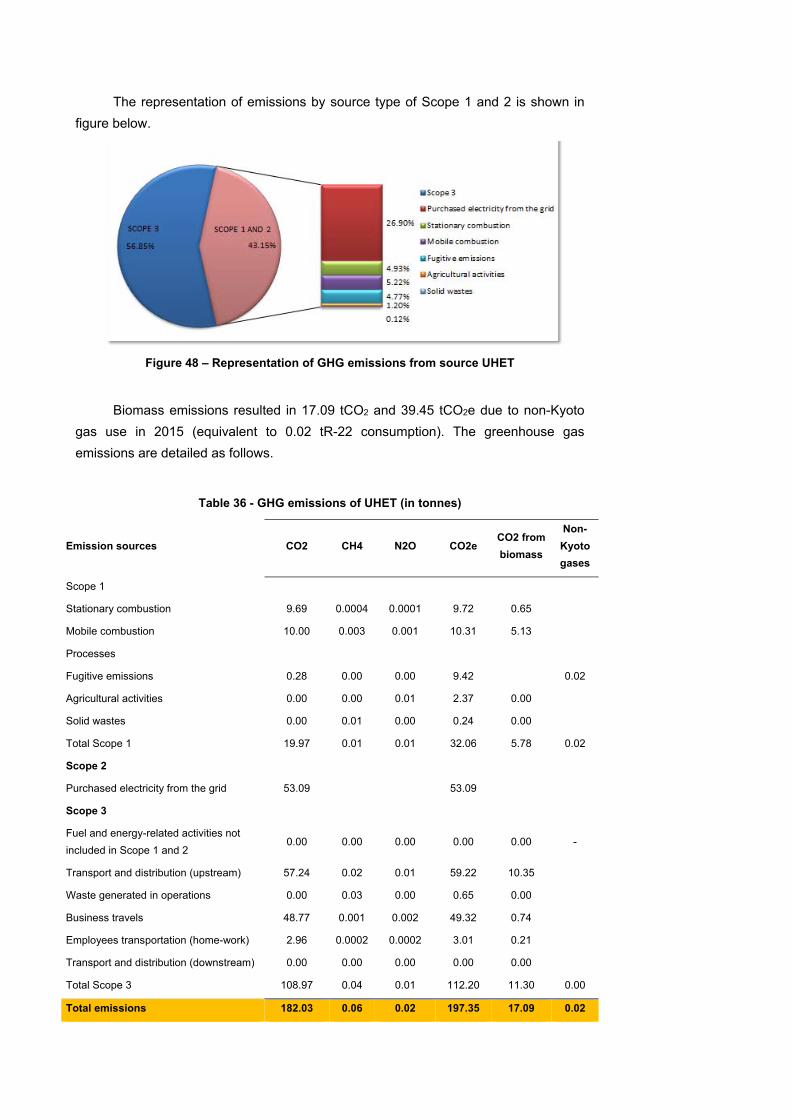
The representation of emissions by source type of Scope 1 and 2 is shown in
figure below.
Figure 48 – Representation of GHG emissions from source UHET
Biomass emissions resulted in 17.09 tCO2 and 39.45 tCO2e due to non-Kyoto
gas use in 2015 (equivalent to 0.02 tR-22 consumption). The greenhouse gas
emissions are detailed as follows.
Table 36 - GHG emissions of UHET (in tonnes)
Emission sources CO2 CH4 N2O CO2e CO2 from
biomass
Non-
Kyoto
gases
Scope 1
Stationary combustion 9.69 0.0004 0.0001 9.72 0.65
Mobile combustion 10.00 0.003 0.001 10.31 5.13
Processes
Fugitive emissions 0.28 0.00 0.00 9.42 0.02
Agricultural activities 0.00 0.00 0.01 2.37 0.00
Solid wastes 0.00 0.01 0.00 0.24 0.00
Total Scope 1 19.97 0.01 0.01 32.06 5.78 0.02
Scope 2
Purchased electricity from the grid 53.09 53.09
Scope 3
Fuel and energy-related activities not
included in Scope 1 and 2 0.00 0.00 0.00 0.00 0.00 -
Transport and distribution (upstream) 57.24 0.02 0.01 59.22 10.35
Waste generated in operations 0.00 0.03 0.00 0.65 0.00
Business travels 48.77 0.001 0.002 49.32 0.74
Employees transportation (home-work) 2.96 0.0002 0.0002 3.01 0.21
Transport and distribution (downstream) 0.00 0.00 0.00 0.00 0.00
Total Scope 3 108.97 0.04 0.01 112.20 11.30 0.00
Total emissions 182.03 0.06 0.02 197.35 17.09 0.02
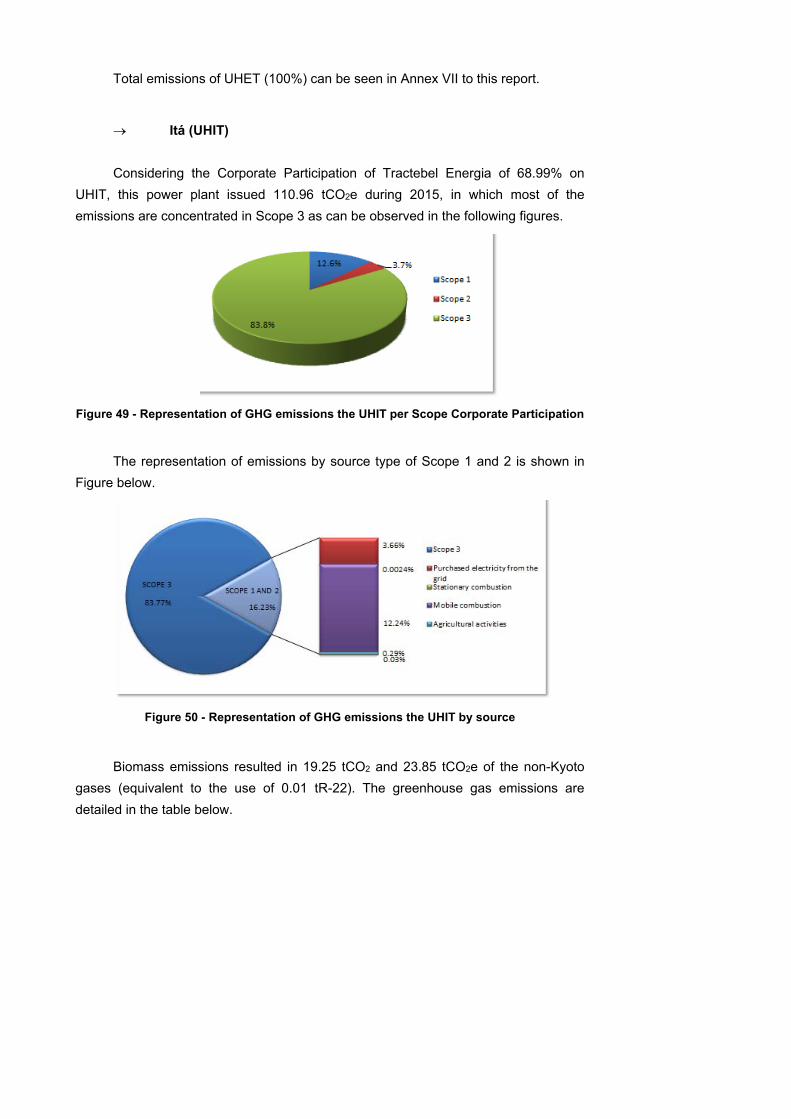
Total emissions of UHET (100%) can be seen in Annex VII to this report.
Itá (UHIT)
Considering the Corporate Participation of Tractebel Energia of 68.99% on
UHIT, this power plant issued 110.96 tCO2e during 2015, in which most of the
emissions are concentrated in Scope 3 as can be observed in the following figures.
Figure 49 - Representation of GHG emissions the UHIT per Scope Corporate Participation
The representation of emissions by source type of Scope 1 and 2 is shown in
Figure below.
Figure 50 - Representation of GHG emissions the UHIT by source
Biomass emissions resulted in 19.25 tCO2 and 23.85 tCO2e of the non-Kyoto
gases (equivalent to the use of 0.01 tR-22). The greenhouse gas emissions are
detailed in the table below.
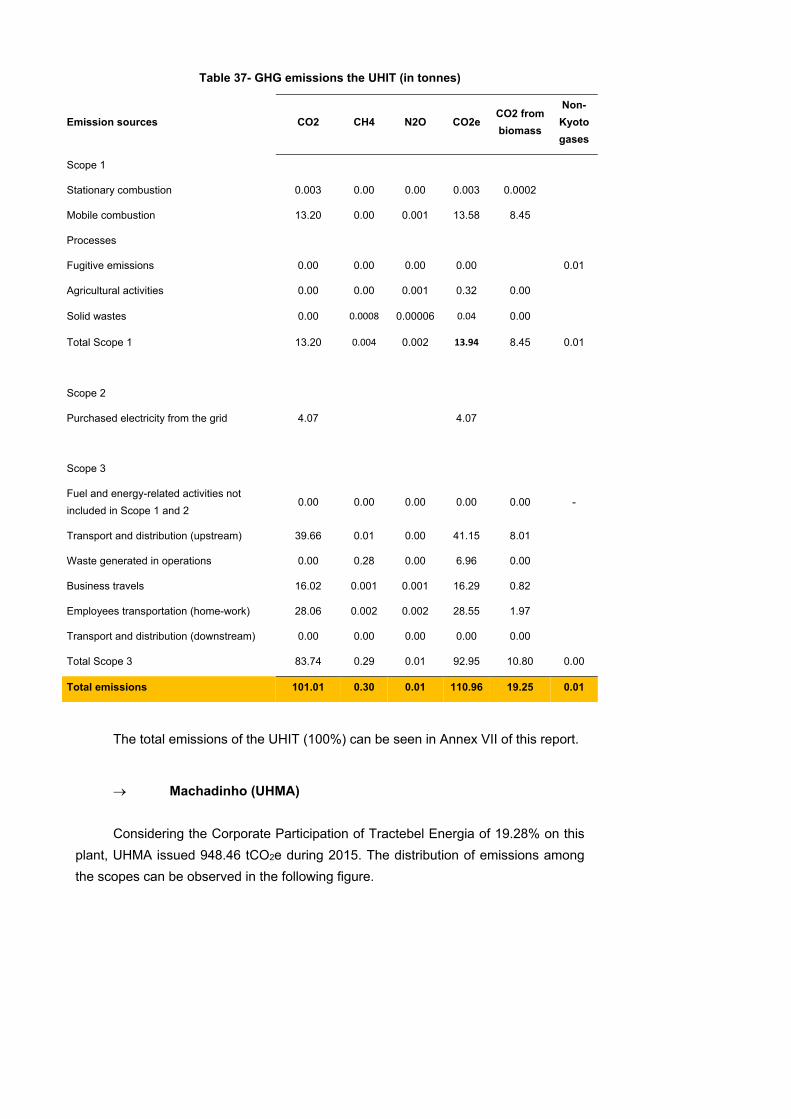
Table 37- GHG emissions the UHIT (in tonnes)
Emission sources CO2 CH4 N2O CO2e CO2 from
biomass
Non-
Kyoto
gases
Scope 1
Stationary combustion 0.003 0.00 0.00 0.003 0.0002
Mobile combustion 13.20 0.00 0.001 13.58 8.45
Processes
Fugitive emissions 0.00 0.00 0.00 0.00 0.01
Agricultural activities 0.00 0.00 0.001 0.32 0.00
Solid wastes 0.00 0.0008 0.00006 0.04 0.00
Total Scope 1 13.20 0.004 0.002 13.94 8.45 0.01
Scope 2
Purchased electricity from the grid 4.07 4.07
Scope 3
Fuel and energy-related activities not
included in Scope 1 and 2 0.00 0.00 0.00 0.00 0.00 -
Transport and distribution (upstream) 39.66 0.01 0.00 41.15 8.01
Waste generated in operations 0.00 0.28 0.00 6.96 0.00
Business travels 16.02 0.001 0.001 16.29 0.82
Employees transportation (home-work) 28.06 0.002 0.002 28.55 1.97
Transport and distribution (downstream) 0.00 0.00 0.00 0.00 0.00
Total Scope 3 83.74 0.29 0.01 92.95 10.80 0.00
Total emissions 101.01 0.30 0.01 110.96 19.25 0.01
The total emissions of the UHIT (100%) can be seen in Annex VII of this report.
Machadinho (UHMA)
Considering the Corporate Participation of Tractebel Energia of 19.28% on this
plant, UHMA issued 948.46 tCO2e during 2015. The distribution of emissions among
the scopes can be observed in the following figure.
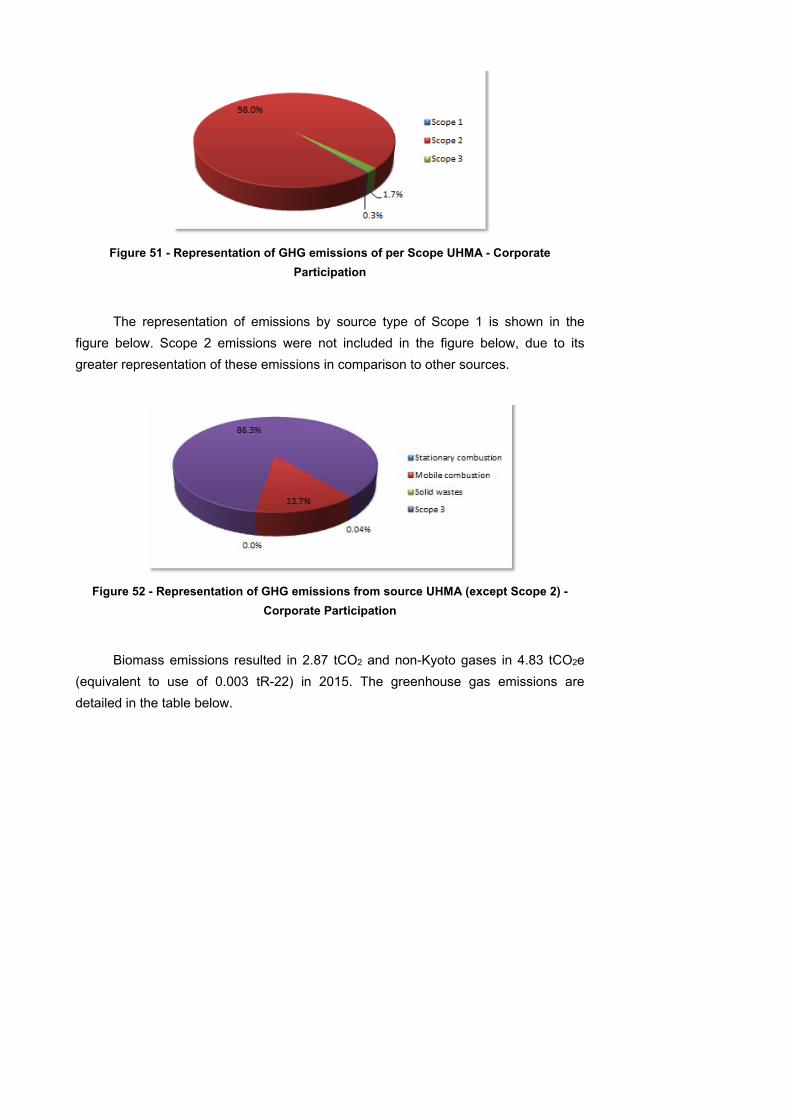
Figure 51 - Representation of GHG emissions of per Scope UHMA - Corporate
Participation
The representation of emissions by source type of Scope 1 is shown in the
figure below. Scope 2 emissions were not included in the figure below, due to its
greater representation of these emissions in comparison to other sources.
Figure 52 - Representation of GHG emissions from source UHMA (except Scope 2) -
Corporate Participation
Biomass emissions resulted in 2.87 tCO2 and non-Kyoto gases in 4.83 tCO2e
(equivalent to use of 0.003 tR-22) in 2015. The greenhouse gas emissions are
detailed in the table below.
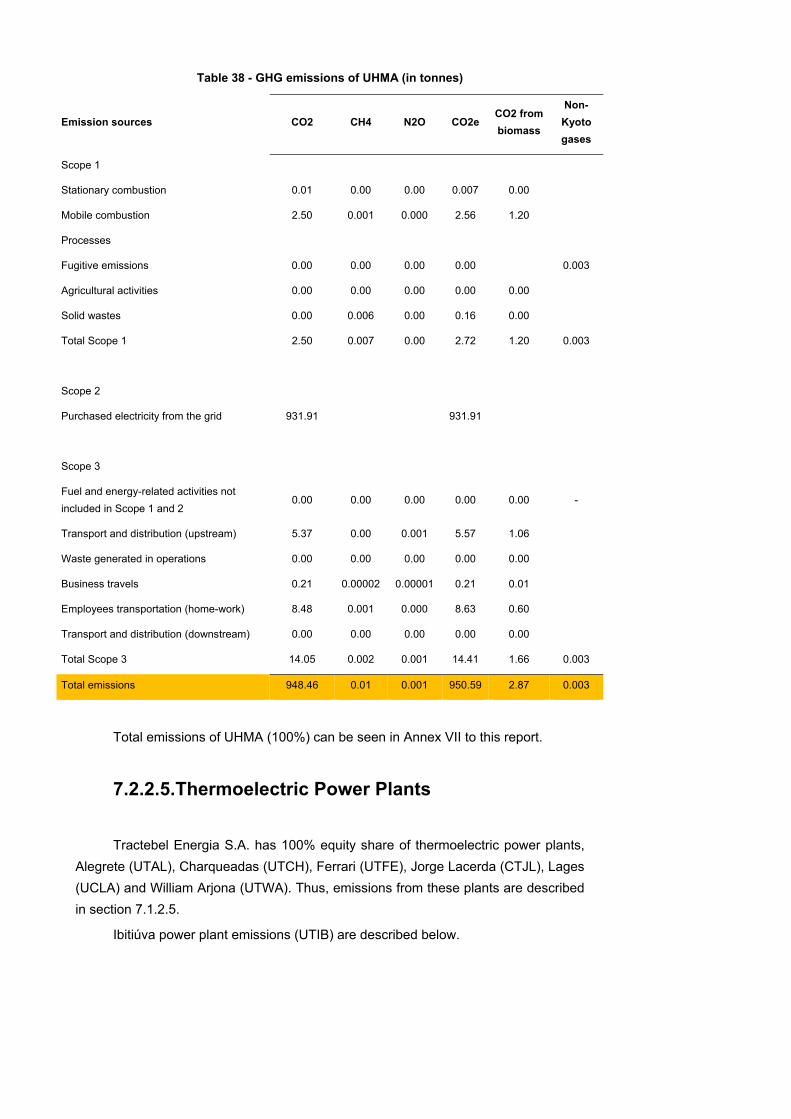
Table 38 - GHG emissions of UHMA (in tonnes)
Emission sources CO2 CH4 N2O CO2e CO2 from
biomass
Non-
Kyoto
gases
Scope 1
Stationary combustion 0.01 0.00 0.00 0.007 0.00
Mobile combustion 2.50 0.001 0.000 2.56 1.20
Processes
Fugitive emissions 0.00 0.00 0.00 0.00 0.003
Agricultural activities 0.00 0.00 0.00 0.00 0.00
Solid wastes 0.00 0.006 0.00 0.16 0.00
Total Scope 1 2.50 0.007 0.00 2.72 1.20 0.003
Scope 2
Purchased electricity from the grid 931.91 931.91
Scope 3
Fuel and energy-related activities not
included in Scope 1 and 2 0.00 0.00 0.00 0.00 0.00 -
Transport and distribution (upstream) 5.37 0.00 0.001 5.57 1.06
Waste generated in operations 0.00 0.00 0.00 0.00 0.00
Business travels 0.21 0.00002 0.00001 0.21 0.01
Employees transportation (home-work) 8.48 0.001 0.000 8.63 0.60
Transport and distribution (downstream) 0.00 0.00 0.00 0.00 0.00
Total Scope 3 14.05 0.002 0.001 14.41 1.66 0.003
Total emissions 948.46 0.01 0.001 950.59 2.87 0.003
Total emissions of UHMA (100%) can be seen in Annex VII to this report.
7.2.2.5.Thermoelectric Power Plants
Tractebel Energia S.A. has 100% equity share of thermoelectric power plants,
Alegrete (UTAL), Charqueadas (UTCH), Ferrari (UTFE), Jorge Lacerda (CTJL), Lages
(UCLA) and William Arjona (UTWA). Thus, emissions from these plants are described
in section 7.1.2.5.
Ibitiúva power plant emissions (UTIB) are described below.
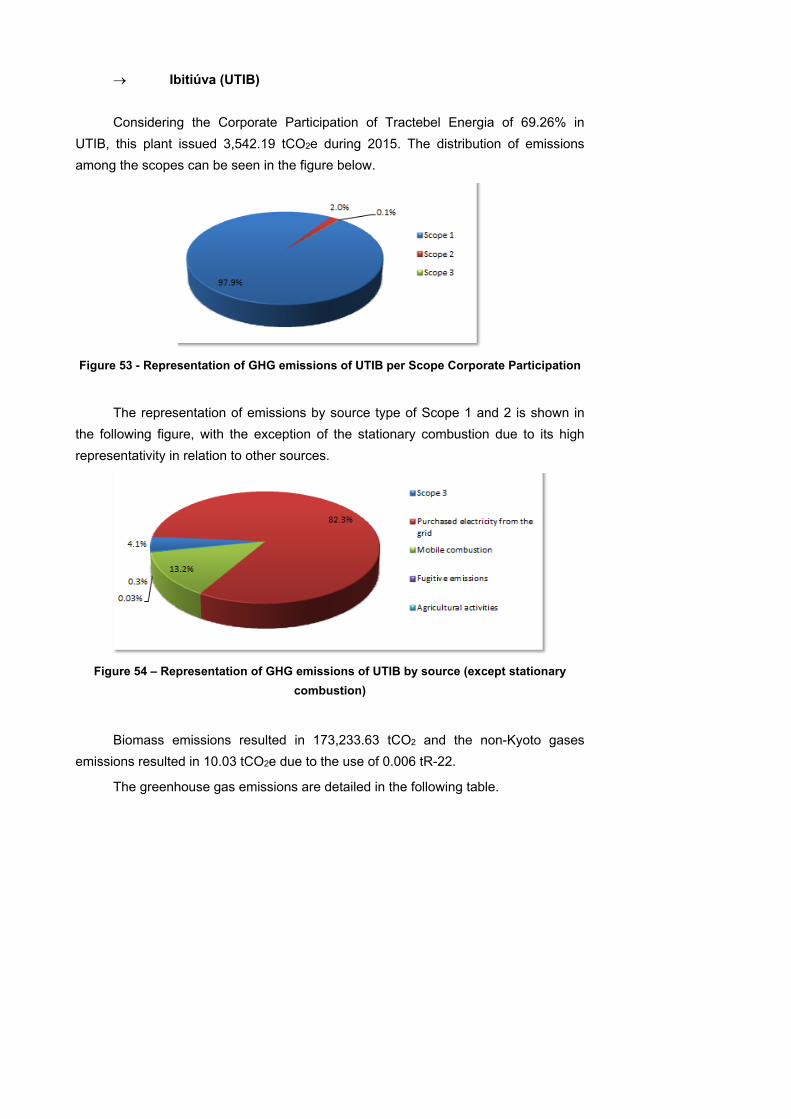
Ibitiúva (UTIB)
Considering the Corporate Participation of Tractebel Energia of 69.26% in
UTIB, this plant issued 3,542.19 tCO2e during 2015. The distribution of emissions
among the scopes can be seen in the figure below.
Figure 53 - Representation of GHG emissions of UTIB per Scope Corporate Participation
The representation of emissions by source type of Scope 1 and 2 is shown in
the following figure, with the exception of the stationary combustion due to its high
representativity in relation to other sources.
Figure 54 – Representation of GHG emissions of UTIB by source (except stationary
combustion)
Biomass emissions resulted in 173,233.63 tCO2 and the non-Kyoto gases
emissions resulted in 10.03 tCO2e due to the use of 0.006 tR-22.
The greenhouse gas emissions are detailed in the following table.
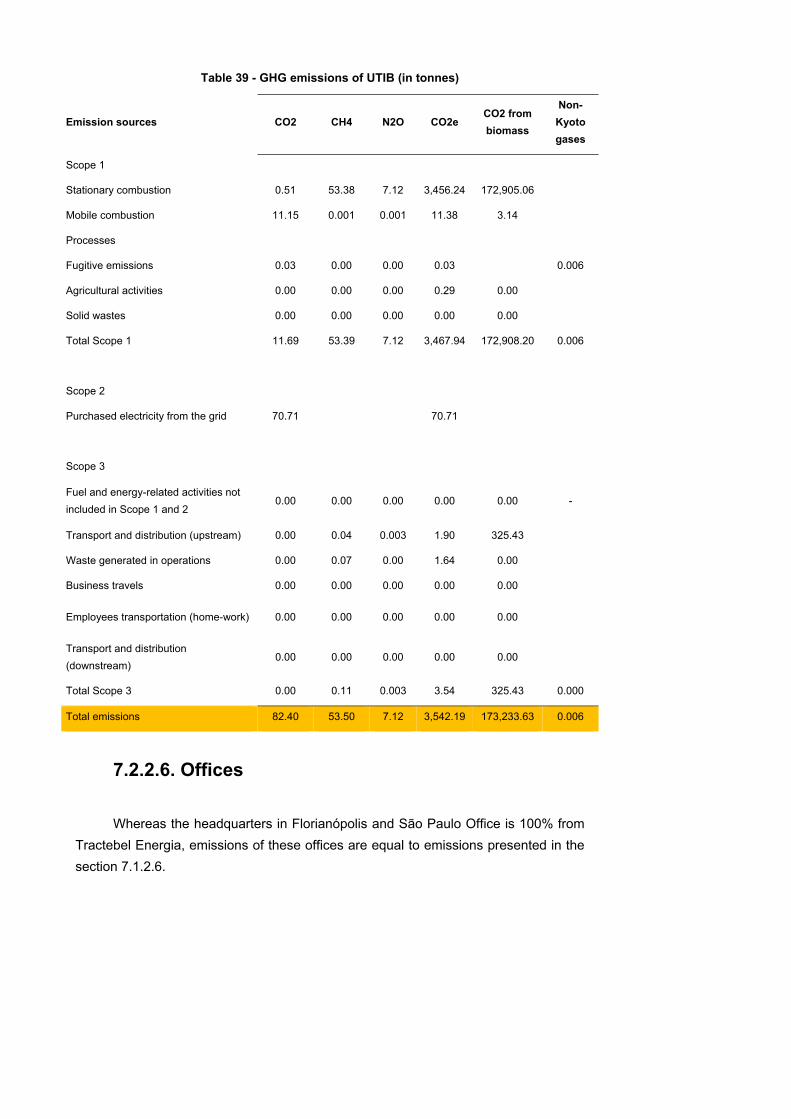
Table 39 - GHG emissions of UTIB (in tonnes)
Emission sources CO2 CH4 N2O CO2e CO2 from
biomass
Non-
Kyoto
gases
Scope 1
Stationary combustion 0.51 53.38 7.12 3,456.24 172,905.06
Mobile combustion 11.15 0.001 0.001 11.38 3.14
Processes
Fugitive emissions 0.03 0.00 0.00 0.03 0.006
Agricultural activities 0.00 0.00 0.00 0.29 0.00
Solid wastes 0.00 0.00 0.00 0.00 0.00
Total Scope 1 11.69 53.39 7.12 3,467.94 172,908.20 0.006
Scope 2
Purchased electricity from the grid 70.71 70.71
Scope 3
Fuel and energy-related activities not
included in Scope 1 and 2 0.00 0.00 0.00 0.00 0.00 -
Transport and distribution (upstream) 0.00 0.04 0.003 1.90 325.43
Waste generated in operations 0.00 0.07 0.00 1.64 0.00
Business travels 0.00 0.00 0.00 0.00 0.00
Employees transportation (home-work) 0.00 0.00 0.00 0.00 0.00
Transport and distribution
(downstream) 0.00 0.00 0.00 0.00 0.00
Total Scope 3 0.00 0.11 0.003 3.54 325.43 0.000
Total emissions 82.40 53.50 7.12 3,542.19 173,233.63 0.006
7.2.2.6. Offices
Whereas the headquarters in Florianópolis and São Paulo Office is 100% from
Tractebel Energia, emissions of these offices are equal to emissions presented in the
section 7.1.2.6.
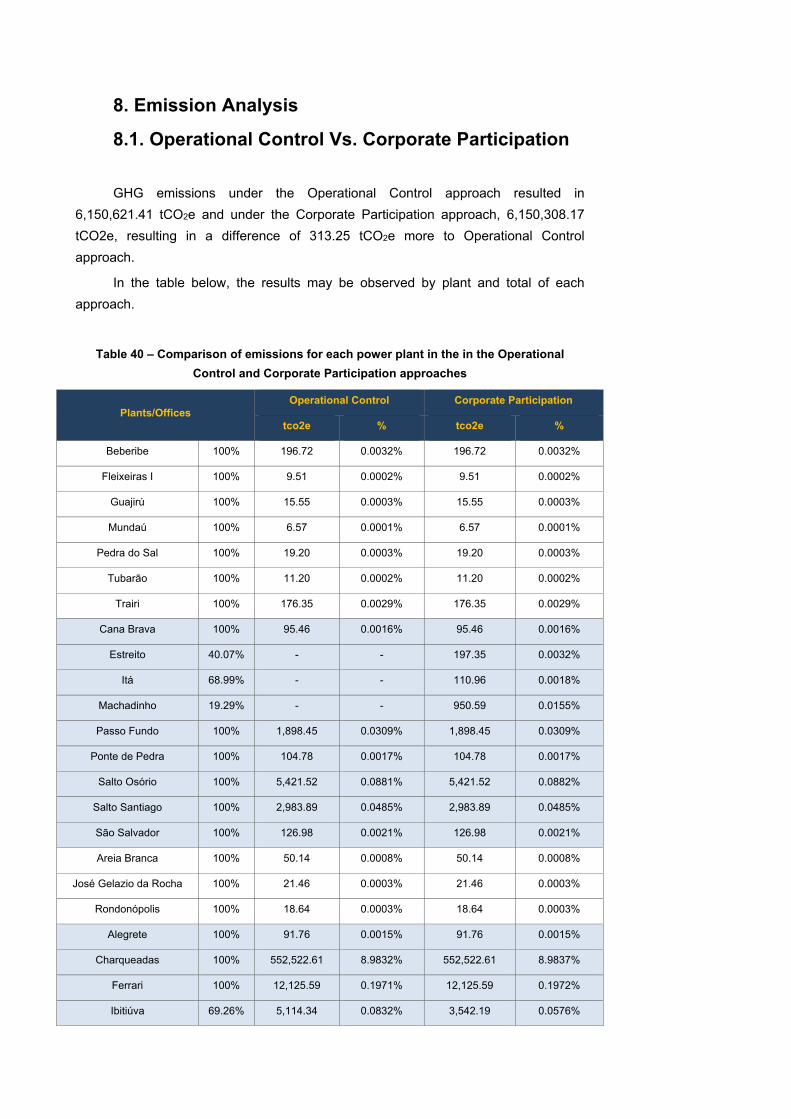
8. Emission Analysis
8.1. Operational Control Vs. Corporate Participation
GHG emissions under the Operational Control approach resulted in
6,150,621.41 tCO2e and under the Corporate Participation approach, 6,150,308.17
tCO2e, resulting in a difference of 313.25 tCO2e more to Operational Control
approach.
In the table below, the results may be observed by plant and total of each
approach.
Table 40 – Comparison of emissions for each power plant in the in the Operational
Control and Corporate Participation approaches
Plants/Offices Operational Control Corporate Participation
tco2e % tco2e %
Beberibe 100% 196.72 0.0032% 196.72 0.0032%
Fleixeiras I 100% 9.51 0.0002% 9.51 0.0002%
Guajirú 100% 15.55 0.0003% 15.55 0.0003%
Mundaú 100% 6.57 0.0001% 6.57 0.0001%
Pedra do Sal 100% 19.20 0.0003% 19.20 0.0003%
Tubarão 100% 11.20 0.0002% 11.20 0.0002%
Trairi 100% 176.35 0.0029% 176.35 0.0029%
Cana Brava 100% 95.46 0.0016% 95.46 0.0016%
Estreito 40.07% - - 197.35 0.0032%
Itá 68.99% - - 110.96 0.0018%
Machadinho 19.29% - - 950.59 0.0155%
Passo Fundo 100% 1,898.45 0.0309% 1,898.45 0.0309%
Ponte de Pedra 100% 104.78 0.0017% 104.78 0.0017%
Salto Osório 100% 5,421.52 0.0881% 5,421.52 0.0882%
Salto Santiago 100% 2,983.89 0.0485% 2,983.89 0.0485%
São Salvador 100% 126.98 0.0021% 126.98 0.0021%
Areia Branca 100% 50.14 0.0008% 50.14 0.0008%
José Gelazio da Rocha 100% 21.46 0.0003% 21.46 0.0003%
Rondonópolis 100% 18.64 0.0003% 18.64 0.0003%
Alegrete 100% 91.76 0.0015% 91.76 0.0015%
Charqueadas 100% 552,522.61 8.9832% 552,522.61 8.9837%
Ferrari 100% 12,125.59 0.1971% 12,125.59 0.1972%
Ibitiúva 69.26% 5,114.34 0.0832% 3,542.19 0.0576%
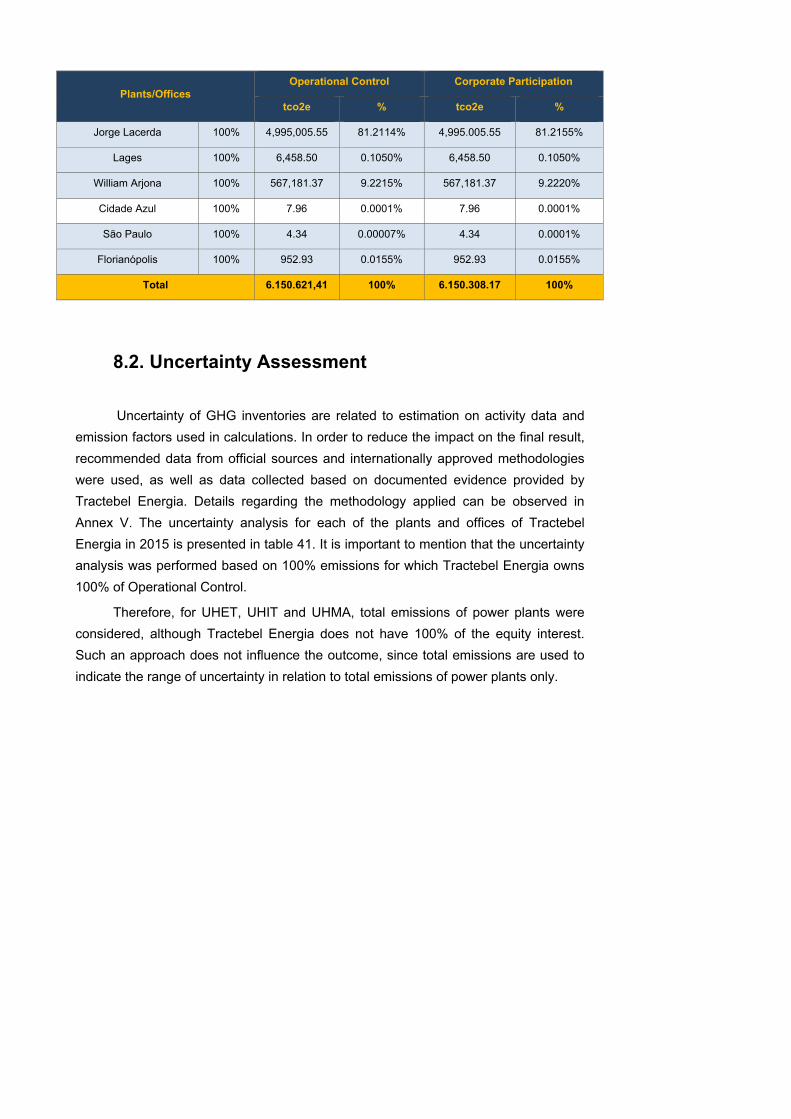
Plants/Offices Operational Control Corporate Participation
tco2e % tco2e %
Jorge Lacerda 100% 4,995,005.55 81.2114% 4,995.005.55 81.2155%
Lages 100% 6,458.50 0.1050% 6,458.50 0.1050%
William Arjona 100% 567,181.37 9.2215% 567,181.37 9.2220%
Cidade Azul 100% 7.96 0.0001% 7.96 0.0001%
São Paulo 100% 4.34 0.00007% 4.34 0.0001%
Florianópolis 100% 952.93 0.0155% 952.93 0.0155%
Total 6.150.621,41 100% 6.150.308.17 100%
8.2. Uncertainty Assessment
Uncertainty of GHG inventories are related to estimation on activity data and
emission factors used in calculations. In order to reduce the impact on the final result,
recommended data from official sources and internationally approved methodologies
were used, as well as data collected based on documented evidence provided by
Tractebel Energia. Details regarding the methodology applied can be observed in
Annex V. The uncertainty analysis for each of the plants and offices of Tractebel
Energia in 2015 is presented in table 41. It is important to mention that the uncertainty
analysis was performed based on 100% emissions for which Tractebel Energia owns
100% of Operational Control.
Therefore, for UHET, UHIT and UHMA, total emissions of power plants were
considered, although Tractebel Energia does not have 100% of the equity interest.
Such an approach does not influence the outcome, since total emissions are used to
indicate the range of uncertainty in relation to total emissions of power plants only.
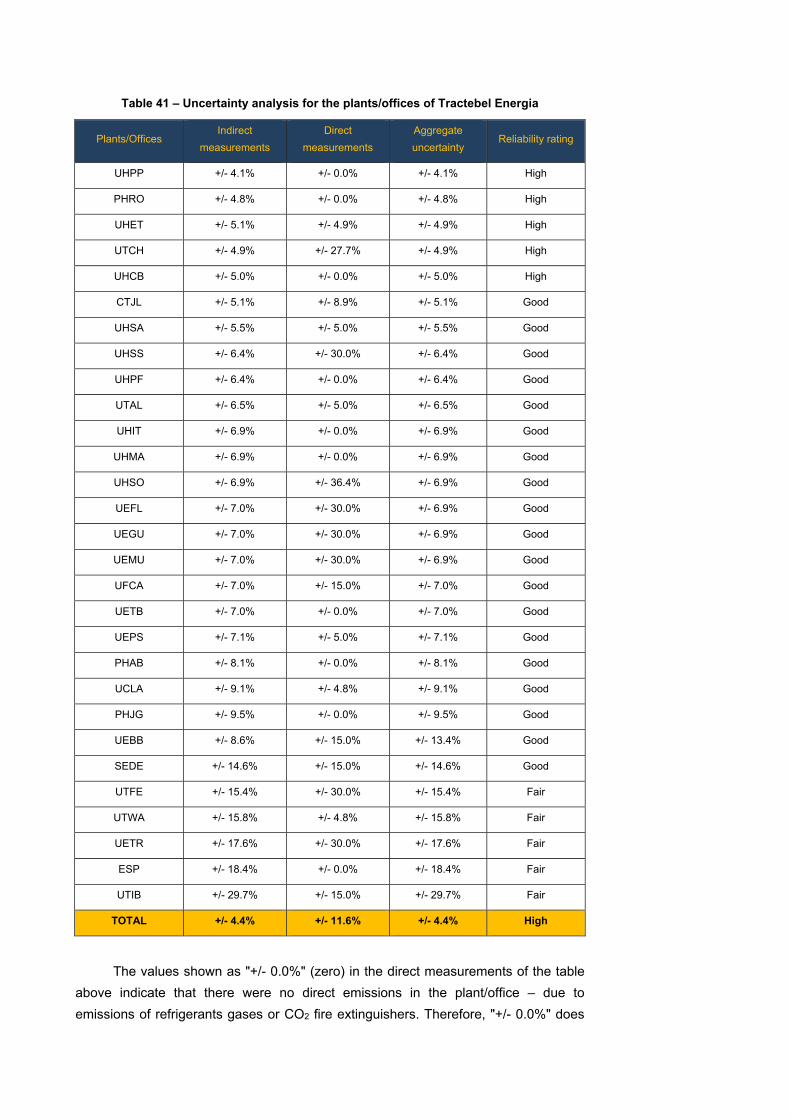
Table 41 – Uncertainty analysis for the plants/offices of Tractebel Energia
Plants/Offices Indirect
measurements
Direct
measurements
Aggregate
uncertainty Reliability rating
UHPP +/- 4.1% +/- 0.0% +/- 4.1% High
PHRO +/- 4.8% +/- 0.0% +/- 4.8% High
UHET +/- 5.1% +/- 4.9% +/- 4.9% High
UTCH +/- 4.9% +/- 27.7% +/- 4.9% High
UHCB +/- 5.0% +/- 0.0% +/- 5.0% High
CTJL +/- 5.1% +/- 8.9% +/- 5.1% Good
UHSA +/- 5.5% +/- 5.0% +/- 5.5% Good
UHSS +/- 6.4% +/- 30.0% +/- 6.4% Good
UHPF +/- 6.4% +/- 0.0% +/- 6.4% Good
UTAL +/- 6.5% +/- 5.0% +/- 6.5% Good
UHIT +/- 6.9% +/- 0.0% +/- 6.9% Good
UHMA +/- 6.9% +/- 0.0% +/- 6.9% Good
UHSO +/- 6.9% +/- 36.4% +/- 6.9% Good
UEFL +/- 7.0% +/- 30.0% +/- 6.9% Good
UEGU +/- 7.0% +/- 30.0% +/- 6.9% Good
UEMU +/- 7.0% +/- 30.0% +/- 6.9% Good
UFCA +/- 7.0% +/- 15.0% +/- 7.0% Good
UETB +/- 7.0% +/- 0.0% +/- 7.0% Good
UEPS +/- 7.1% +/- 5.0% +/- 7.1% Good
PHAB +/- 8.1% +/- 0.0% +/- 8.1% Good
UCLA +/- 9.1% +/- 4.8% +/- 9.1% Good
PHJG +/- 9.5% +/- 0.0% +/- 9.5% Good
UEBB +/- 8.6% +/- 15.0% +/- 13.4% Good
SEDE +/- 14.6% +/- 15.0% +/- 14.6% Good
UTFE +/- 15.4% +/- 30.0% +/- 15.4% Fair
UTWA +/- 15.8% +/- 4.8% +/- 15.8% Fair
UETR +/- 17.6% +/- 30.0% +/- 17.6% Fair
ESP +/- 18.4% +/- 0.0% +/- 18.4% Fair
UTIB +/- 29.7% +/- 15.0% +/- 29.7% Fair
TOTAL +/- 4.4% +/- 11.6% +/- 4.4% High
The values shown as "+/- 0.0%" (zero) in the direct measurements of the table
above indicate that there were no direct emissions in the plant/office – due to
emissions of refrigerants gases or CO2 fire extinguishers. Therefore, "+/- 0.0%" does
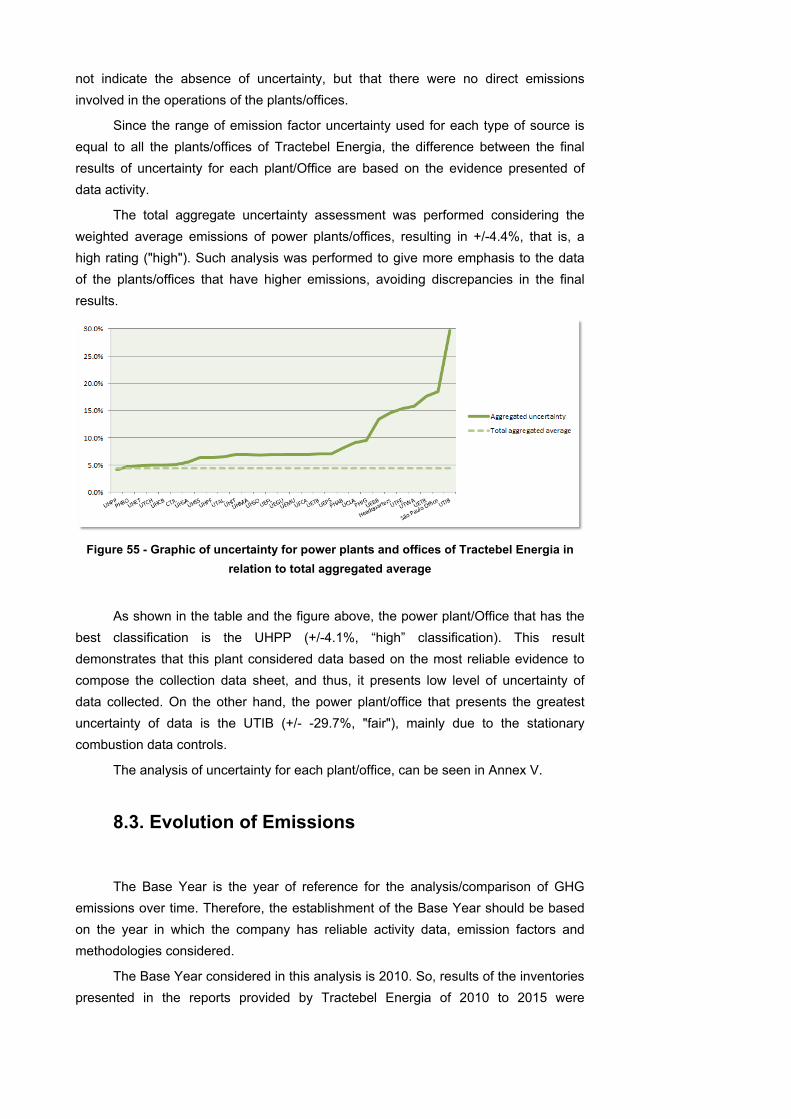
not indicate the absence of uncertainty, but that there were no direct emissions
involved in the operations of the plants/offices.
Since the range of emission factor uncertainty used for each type of source is
equal to all the plants/offices of Tractebel Energia, the difference between the final
results of uncertainty for each plant/Office are based on the evidence presented of
data activity.
The total aggregate uncertainty assessment was performed considering the
weighted average emissions of power plants/offices, resulting in +/-4.4%, that is, a
high rating ("high"). Such analysis was performed to give more emphasis to the data
of the plants/offices that have higher emissions, avoiding discrepancies in the final
results.
Figure 55 - Graphic of uncertainty for power plants and offices of Tractebel Energia in
relation to total aggregated average
As shown in the table and the figure above, the power plant/Office that has the
best classification is the UHPP (+/-4.1%, “high” classification). This result
demonstrates that this plant considered data based on the most reliable evidence to
compose the collection data sheet, and thus, it presents low level of uncertainty of
data collected. On the other hand, the power plant/office that presents the greatest
uncertainty of data is the UTIB (+/- -29.7%, "fair"), mainly due to the stationary
combustion data controls.
The analysis of uncertainty for each plant/office, can be seen in Annex V.
8.3. Evolution of Emissions
The Base Year is the year of reference for the analysis/comparison of GHG
emissions over time. Therefore, the establishment of the Base Year should be based
on the year in which the company has reliable activity data, emission factors and
methodologies considered.
The Base Year considered in this analysis is 2010. So, results of the inventories
presented in the reports provided by Tractebel Energia of 2010 to 2015 were
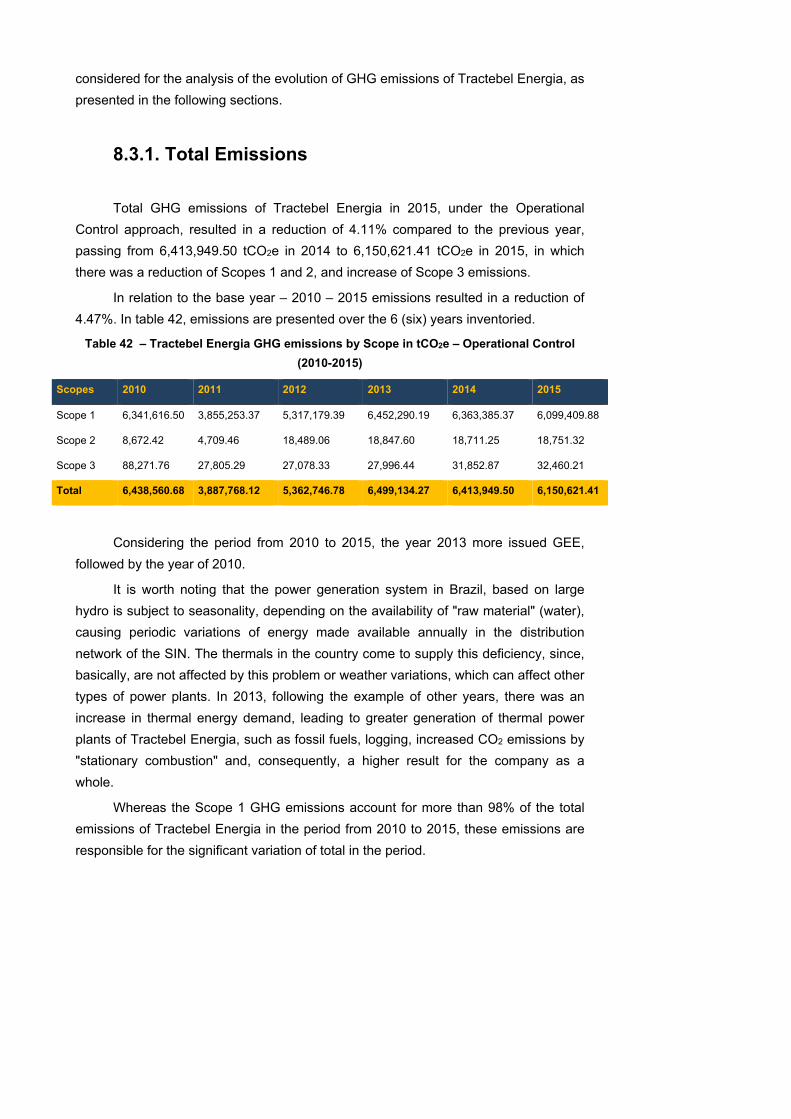
considered for the analysis of the evolution of GHG emissions of Tractebel Energia, as
presented in the following sections.
8.3.1. Total Emissions
Total GHG emissions of Tractebel Energia in 2015, under the Operational
Control approach, resulted in a reduction of 4.11% compared to the previous year,
passing from 6,413,949.50 tCO2e in 2014 to 6,150,621.41 tCO2e in 2015, in which
there was a reduction of Scopes 1 and 2, and increase of Scope 3 emissions.
In relation to the base year – 2010 – 2015 emissions resulted in a reduction of
4.47%. In table 42, emissions are presented over the 6 (six) years inventoried.
Table 42 – Tractebel Energia GHG emissions by Scope in tCO2e – Operational Control
(2010-2015)
Scopes 2010 2011 2012 2013 2014 2015
Scope 1 6,341,616.50 3,855,253.37 5,317,179.39 6,452,290.19 6,363,385.37 6,099,409.88
Scope 2 8,672.42 4,709.46 18,489.06 18,847.60 18,711.25 18,751.32
Scope 3 88,271.76 27,805.29 27,078.33 27,996.44 31,852.87 32,460.21
Total 6,438,560.68 3,887,768.12 5,362,746.78 6,499,134.27 6,413,949.50 6,150,621.41
Considering the period from 2010 to 2015, the year 2013 more issued GEE,
followed by the year of 2010.
It is worth noting that the power generation system in Brazil, based on large
hydro is subject to seasonality, depending on the availability of "raw material" (water),
causing periodic variations of energy made available annually in the distribution
network of the SIN. The thermals in the country come to supply this deficiency, since,
basically, are not affected by this problem or weather variations, which can affect other
types of power plants. In 2013, following the example of other years, there was an
increase in thermal energy demand, leading to greater generation of thermal power
plants of Tractebel Energia, such as fossil fuels, logging, increased CO2 emissions by
"stationary combustion" and, consequently, a higher result for the company as a
whole.
Whereas the Scope 1 GHG emissions account for more than 98% of the total
emissions of Tractebel Energia in the period from 2010 to 2015, these emissions are
responsible for the significant variation of total in the period.
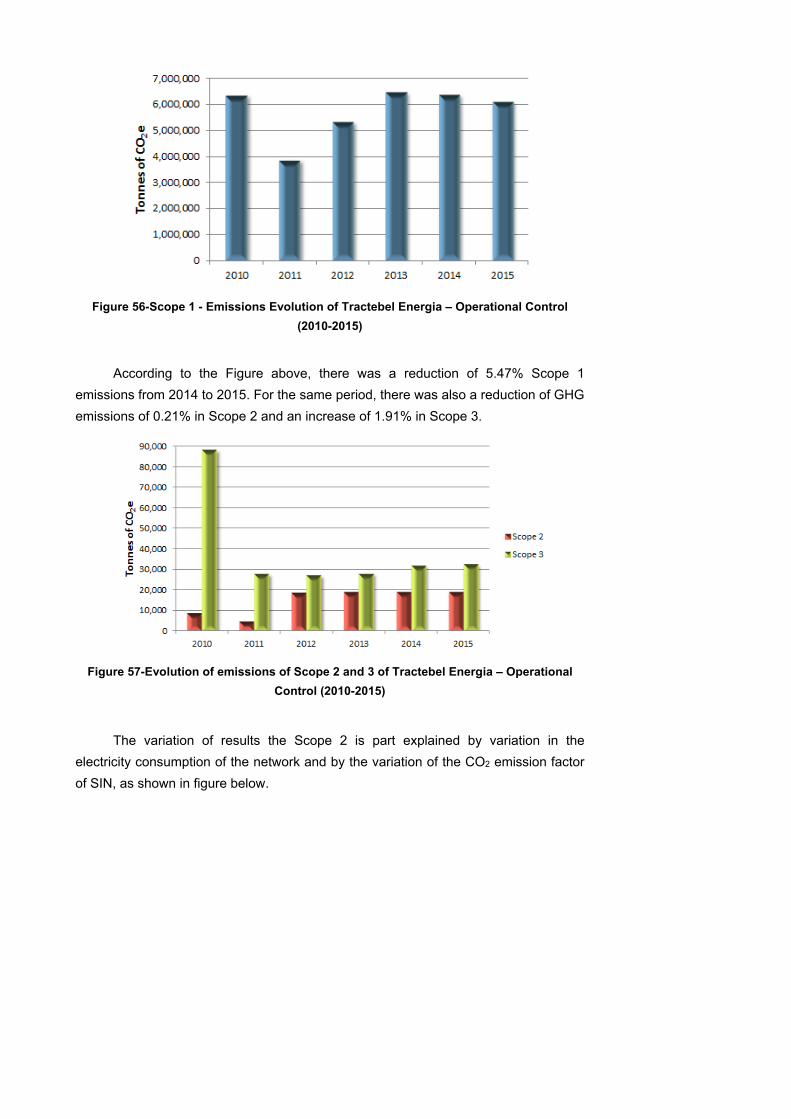
Figure 56-Scope 1 - Emissions Evolution of Tractebel Energia – Operational Control
(2010-2015)
According to the Figure above, there was a reduction of 5.47% Scope 1
emissions from 2014 to 2015. For the same period, there was also a reduction of GHG
emissions of 0.21% in Scope 2 and an increase of 1.91% in Scope 3.
Figure 57-Evolution of emissions of Scope 2 and 3 of Tractebel Energia – Operational
Control (2010-2015)
The variation of results the Scope 2 is part explained by variation in the
electricity consumption of the network and by the variation of the CO2 emission factor
of SIN, as shown in figure below.
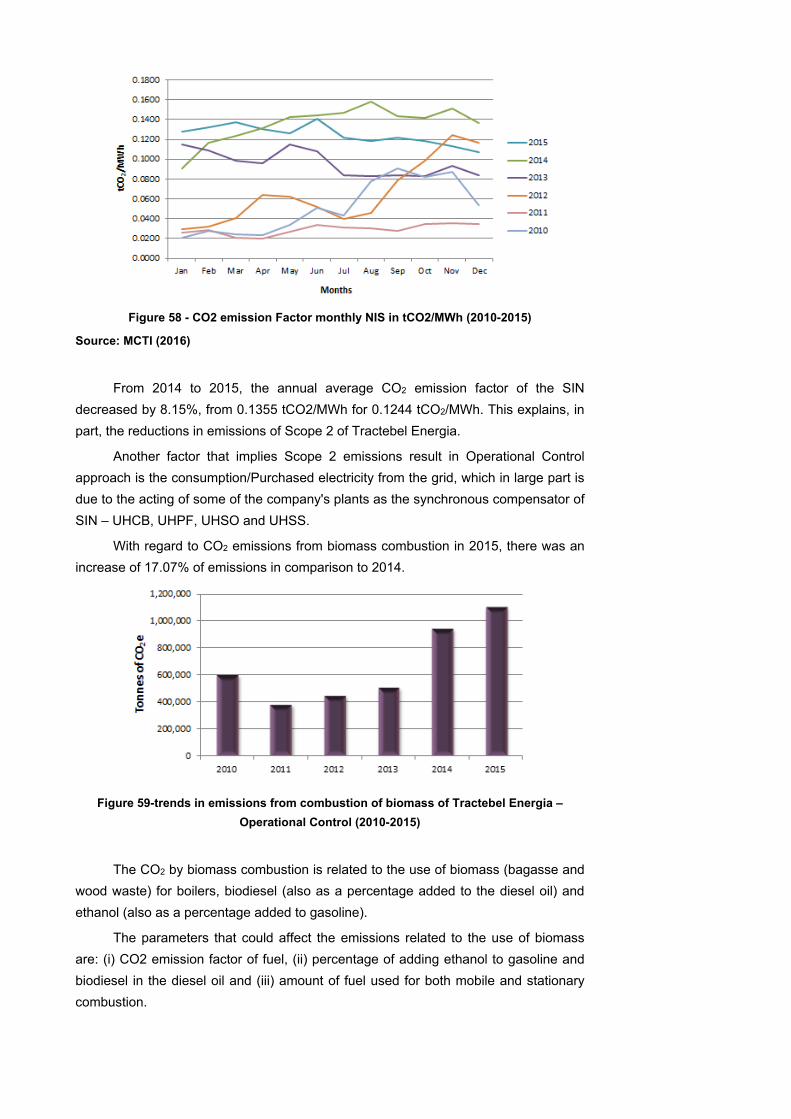
Figure 58 - CO2 emission Factor monthly NIS in tCO2/MWh (2010-2015)
Source: MCTI (2016)
From 2014 to 2015, the annual average CO2 emission factor of the SIN
decreased by 8.15%, from 0.1355 tCO2/MWh for 0.1244 tCO2/MWh. This explains, in
part, the reductions in emissions of Scope 2 of Tractebel Energia.
Another factor that implies Scope 2 emissions result in Operational Control
approach is the consumption/Purchased electricity from the grid, which in large part is
due to the acting of some of the company's plants as the synchronous compensator of
SIN – UHCB, UHPF, UHSO and UHSS.
With regard to CO2 emissions from biomass combustion in 2015, there was an
increase of 17.07% of emissions in comparison to 2014.
Figure 59-trends in emissions from combustion of biomass of Tractebel Energia –
Operational Control (2010-2015)
The CO2 by biomass combustion is related to the use of biomass (bagasse and
wood waste) for boilers, biodiesel (also as a percentage added to the diesel oil) and
ethanol (also as a percentage added to gasoline).
The parameters that could affect the emissions related to the use of biomass
are: (i) CO2 emission factor of fuel, (ii) percentage of adding ethanol to gasoline and
biodiesel in the diesel oil and (iii) amount of fuel used for both mobile and stationary
combustion.
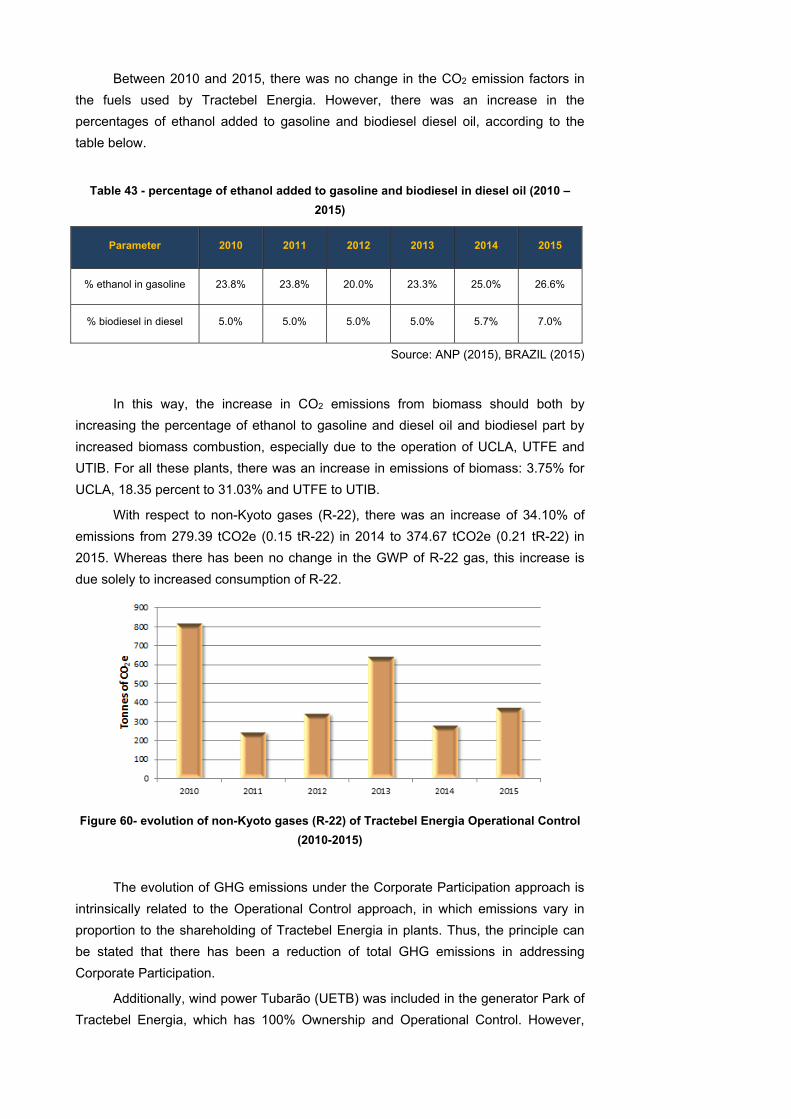
Between 2010 and 2015, there was no change in the CO2 emission factors in
the fuels used by Tractebel Energia. However, there was an increase in the
percentages of ethanol added to gasoline and biodiesel diesel oil, according to the
table below.
Table 43 - percentage of ethanol added to gasoline and biodiesel in diesel oil (2010 –
2015)
Parameter 2010 2011 2012 2013 2014 2015
% ethanol in gasoline 23.8% 23.8% 20.0% 23.3% 25.0% 26.6%
% biodiesel in diesel 5.0% 5.0% 5.0% 5.0% 5.7% 7.0%
Source: ANP (2015), BRAZIL (2015)
In this way, the increase in CO2 emissions from biomass should both by
increasing the percentage of ethanol to gasoline and diesel oil and biodiesel part by
increased biomass combustion, especially due to the operation of UCLA, UTFE and
UTIB. For all these plants, there was an increase in emissions of biomass: 3.75% for
UCLA, 18.35 percent to 31.03% and UTFE to UTIB.
With respect to non-Kyoto gases (R-22), there was an increase of 34.10% of
emissions from 279.39 tCO2e (0.15 tR-22) in 2014 to 374.67 tCO2e (0.21 tR-22) in
2015. Whereas there has been no change in the GWP of R-22 gas, this increase is
due solely to increased consumption of R-22.
Figure 60- evolution of non-Kyoto gases (R-22) of Tractebel Energia Operational Control
(2010-2015)
The evolution of GHG emissions under the Corporate Participation approach is
intrinsically related to the Operational Control approach, in which emissions vary in
proportion to the shareholding of Tractebel Energia in plants. Thus, the principle can
be stated that there has been a reduction of total GHG emissions in addressing
Corporate Participation.
Additionally, wind power Tubarão (UETB) was included in the generator Park of
Tractebel Energia, which has 100% Ownership and Operational Control. However,
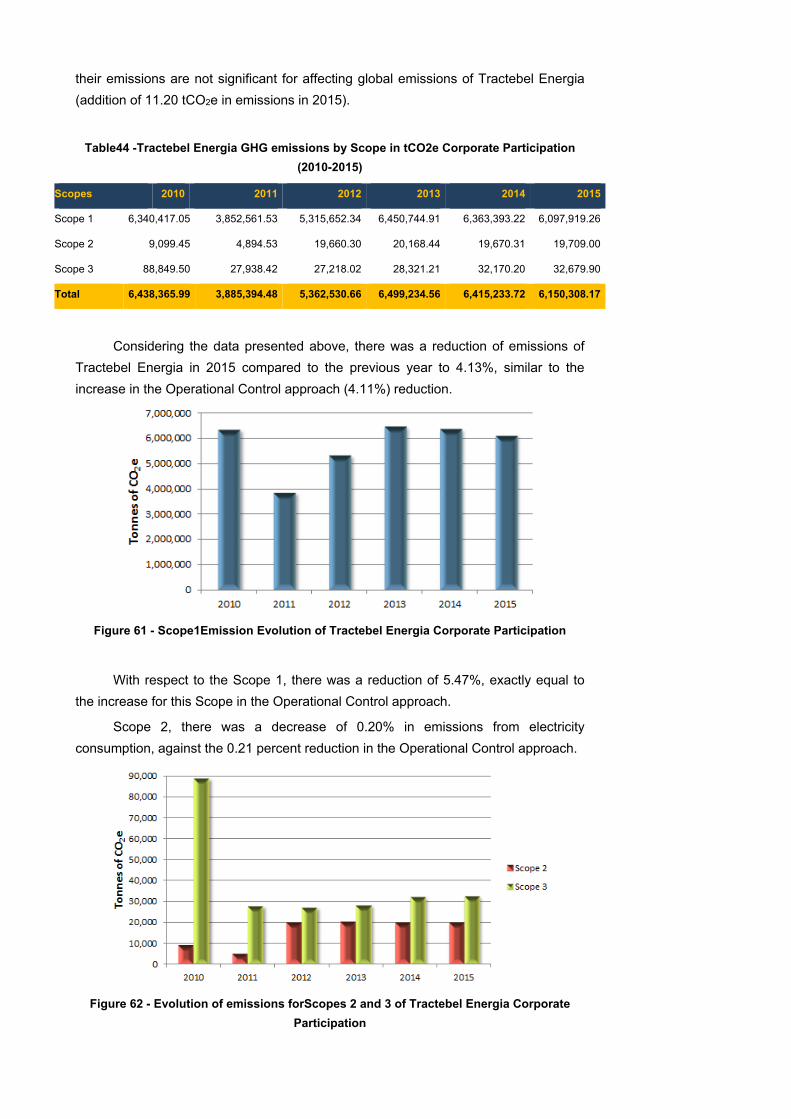
their emissions are not significant for affecting global emissions of Tractebel Energia
(addition of 11.20 tCO2e in emissions in 2015).
Table44 -Tractebel Energia GHG emissions by Scope in tCO2e Corporate Participation
(2010-2015)
Scopes 2010 2011 2012 2013 2014 2015
Scope 1 6,340,417.05 3,852,561.53 5,315,652.34 6,450,744.91 6,363,393.22 6,097,919.26
Scope 2 9,099.45 4,894.53 19,660.30 20,168.44 19,670.31 19,709.00
Scope 3 88,849.50 27,938.42 27,218.02 28,321.21 32,170.20 32,679.90
Total 6,438,365.99 3,885,394.48 5,362,530.66 6,499,234.56 6,415,233.72 6,150,308.17
Considering the data presented above, there was a reduction of emissions of
Tractebel Energia in 2015 compared to the previous year to 4.13%, similar to the
increase in the Operational Control approach (4.11%) reduction.
Figure 61 - Scope1Emission Evolution of Tractebel Energia Corporate Participation
With respect to the Scope 1, there was a reduction of 5.47%, exactly equal to
the increase for this Scope in the Operational Control approach.
Scope 2, there was a decrease of 0.20% in emissions from electricity
consumption, against the 0.21 percent reduction in the Operational Control approach.
Figure 62 - Evolution of emissions forScopes 2 and 3 of Tractebel Energia Corporate
Participation
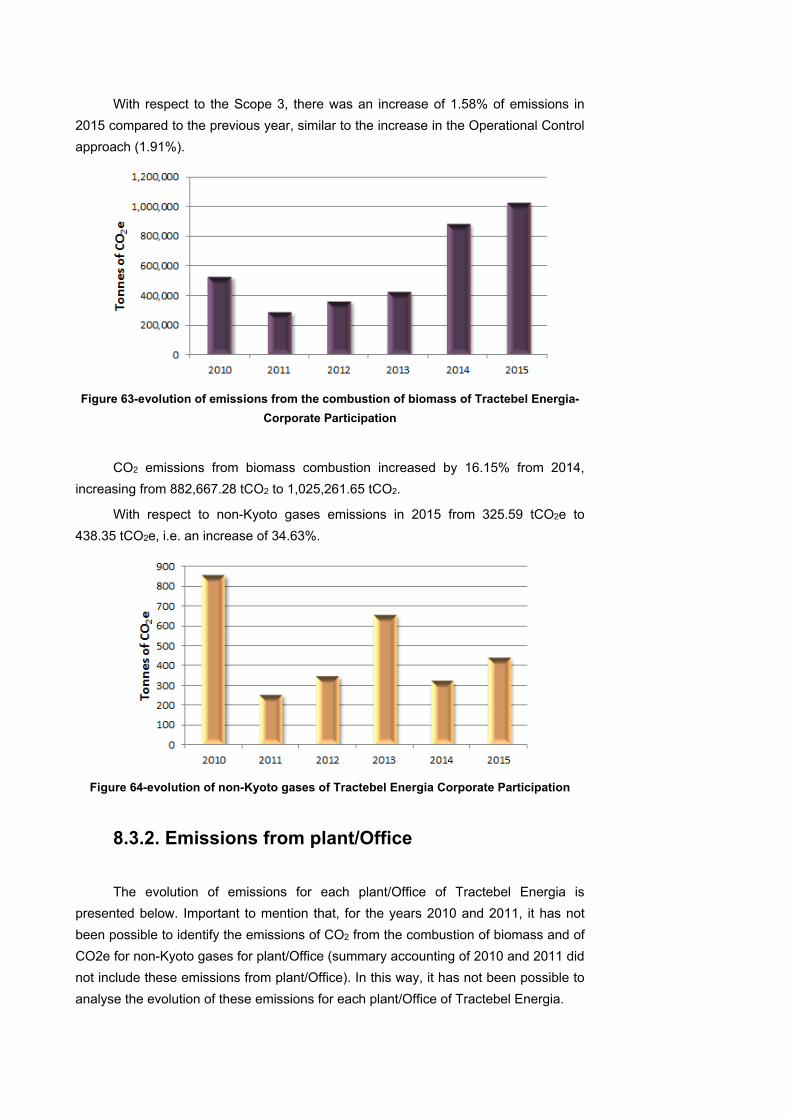
With respect to the Scope 3, there was an increase of 1.58% of emissions in
2015 compared to the previous year, similar to the increase in the Operational Control
approach (1.91%).
Figure 63-evolution of emissions from the combustion of biomass of Tractebel Energia-
Corporate Participation
CO2 emissions from biomass combustion increased by 16.15% from 2014,
increasing from 882,667.28 tCO2 to 1,025,261.65 tCO2.
With respect to non-Kyoto gases emissions in 2015 from 325.59 tCO2e to
438.35 tCO2e, i.e. an increase of 34.63%.
Figure 64-evolution of non-Kyoto gases of Tractebel Energia Corporate Participation
8.3.2. Emissions from plant/Office
The evolution of emissions for each plant/Office of Tractebel Energia is
presented below. Important to mention that, for the years 2010 and 2011, it has not
been possible to identify the emissions of CO2 from the combustion of biomass and of
CO2e for non-Kyoto gases for plant/Office (summary accounting of 2010 and 2011 did
not include these emissions from plant/Office). In this way, it has not been possible to
analyse the evolution of these emissions for each plant/Office of Tractebel Energia.
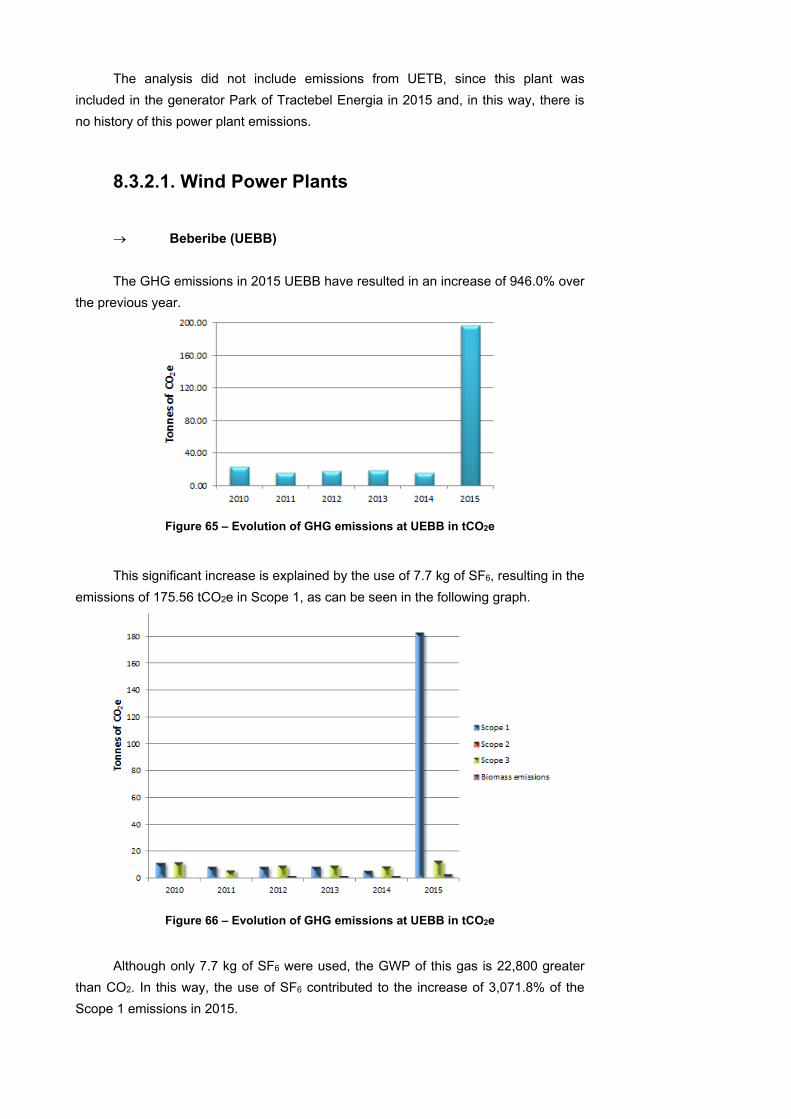
The analysis did not include emissions from UETB, since this plant was
included in the generator Park of Tractebel Energia in 2015 and, in this way, there is
no history of this power plant emissions.
8.3.2.1. Wind Power Plants
Beberibe (UEBB)
The GHG emissions in 2015 UEBB have resulted in an increase of 946.0% over
the previous year.
Figure 65 – Evolution of GHG emissions at UEBB in tCO2e
This significant increase is explained by the use of 7.7 kg of SF6, resulting in the
emissions of 175.56 tCO2e in Scope 1, as can be seen in the following graph.
Figure 66 – Evolution of GHG emissions at UEBB in tCO2e
Although only 7.7 kg of SF6 were used, the GWP of this gas is 22,800 greater
than CO2. In this way, the use of SF6 contributed to the increase of 3,071.8% of the
Scope 1 emissions in 2015.
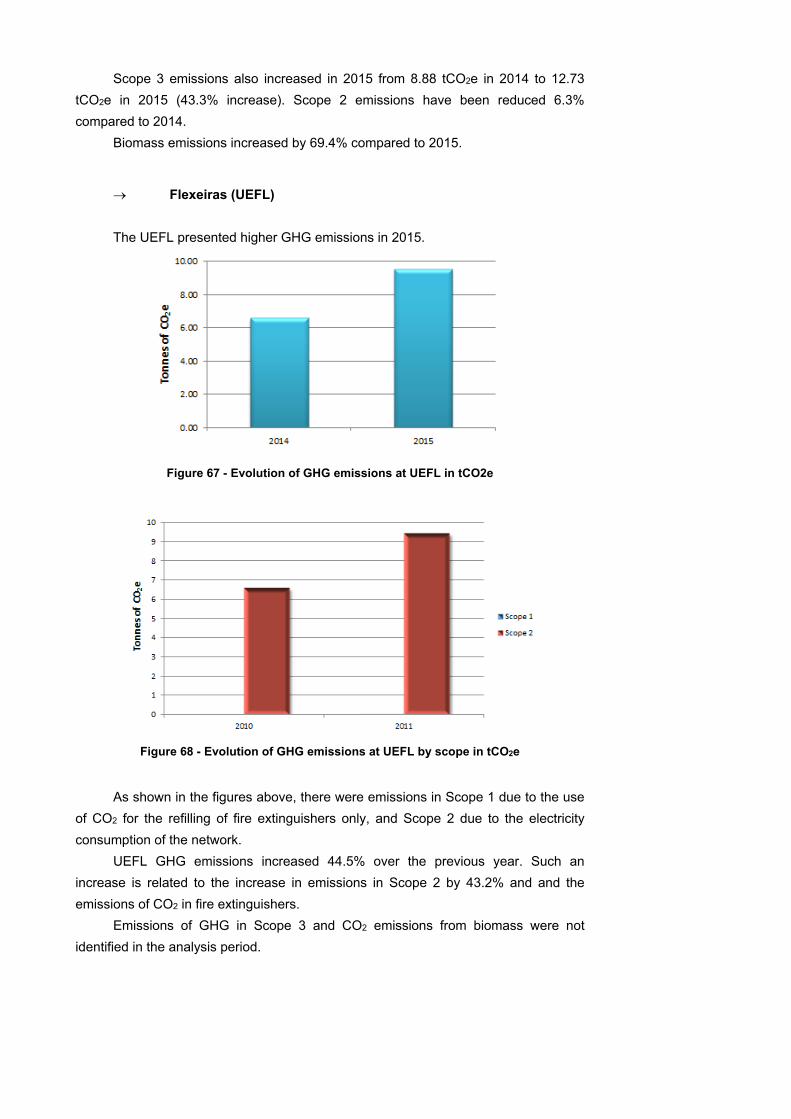
Scope 3 emissions also increased in 2015 from 8.88 tCO2e in 2014 to 12.73
tCO2e in 2015 (43.3% increase). Scope 2 emissions have been reduced 6.3%
compared to 2014.
Biomass emissions increased by 69.4% compared to 2015.
Flexeiras (UEFL)
The UEFL presented higher GHG emissions in 2015.
Figure 67 - Evolution of GHG emissions at UEFL in tCO2e
Figure 68 - Evolution of GHG emissions at UEFL by scope in tCO2e
As shown in the figures above, there were emissions in Scope 1 due to the use
of CO2 for the refilling of fire extinguishers only, and Scope 2 due to the electricity
consumption of the network.
UEFL GHG emissions increased 44.5% over the previous year. Such an
increase is related to the increase in emissions in Scope 2 by 43.2% and and the
emissions of CO2 in fire extinguishers.
Emissions of GHG in Scope 3 and CO2 emissions from biomass were not
identified in the analysis period.
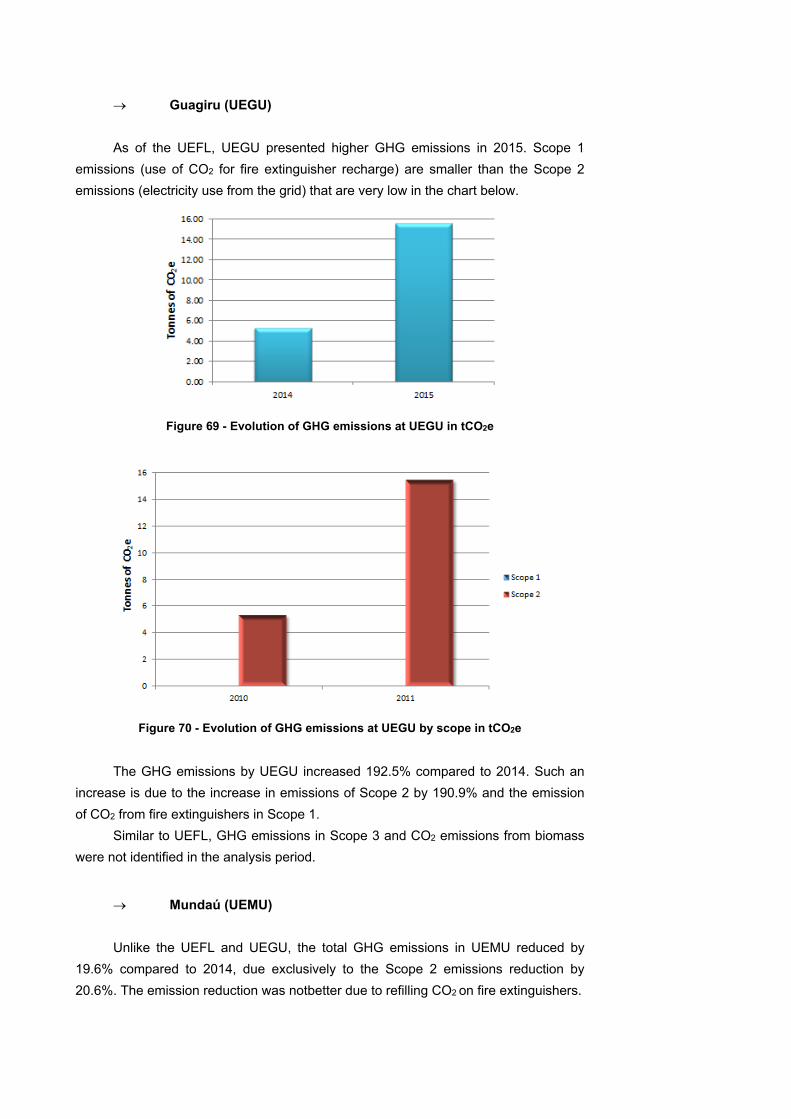
Guagiru (UEGU)
As of the UEFL, UEGU presented higher GHG emissions in 2015. Scope 1
emissions (use of CO2 for fire extinguisher recharge) are smaller than the Scope 2
emissions (electricity use from the grid) that are very low in the chart below.
Figure 69 - Evolution of GHG emissions at UEGU in tCO2e
Figure 70 - Evolution of GHG emissions at UEGU by scope in tCO2e
The GHG emissions by UEGU increased 192.5% compared to 2014. Such an
increase is due to the increase in emissions of Scope 2 by 190.9% and the emission
of CO2 from fire extinguishers in Scope 1.
Similar to UEFL, GHG emissions in Scope 3 and CO2 emissions from biomass
were not identified in the analysis period.
Mundaú (UEMU)
Unlike the UEFL and UEGU, the total GHG emissions in UEMU reduced by
19.6% compared to 2014, due exclusively to the Scope 2 emissions reduction by
20.6%. The emission reduction was notbetter due to refilling CO2 on fire extinguishers.
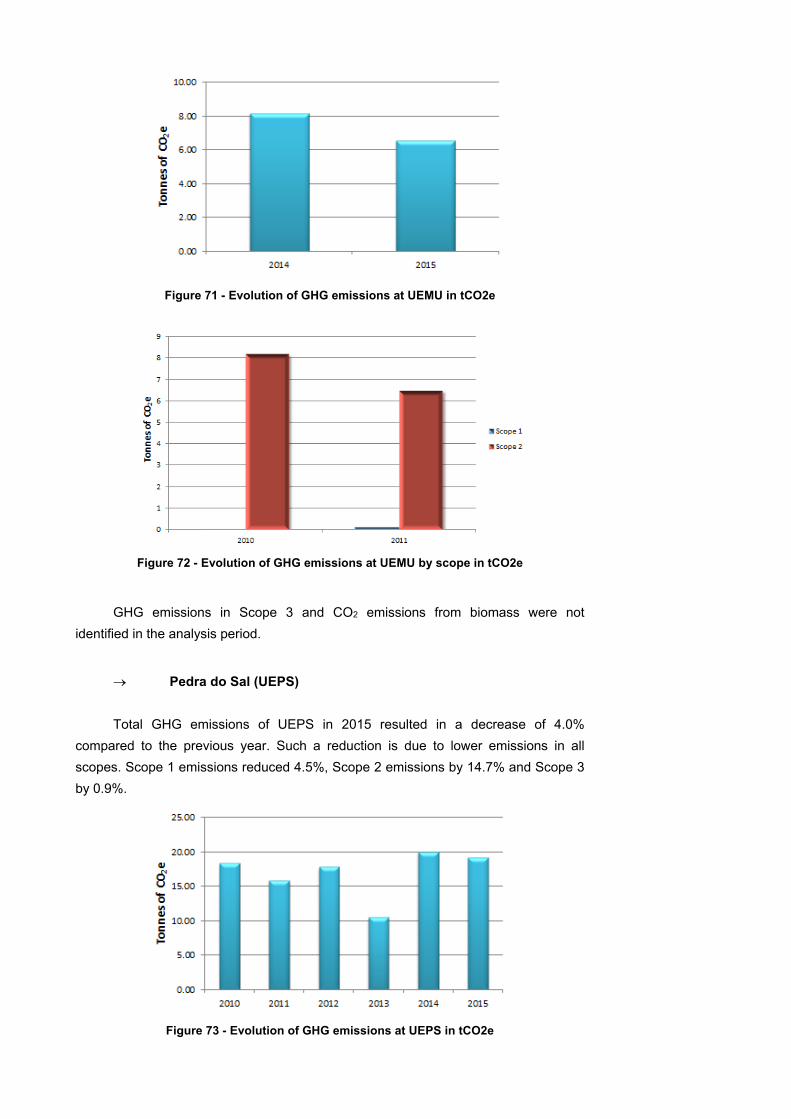
Figure 71 - Evolution of GHG emissions at UEMU in tCO2e
Figure 72 - Evolution of GHG emissions at UEMU by scope in tCO2e
GHG emissions in Scope 3 and CO2 emissions from biomass were not
identified in the analysis period.
Pedra do Sal (UEPS)
Total GHG emissions of UEPS in 2015 resulted in a decrease of 4.0%
compared to the previous year. Such a reduction is due to lower emissions in all
scopes. Scope 1 emissions reduced 4.5%, Scope 2 emissions by 14.7% and Scope 3
by 0.9%.
Figure 73 - Evolution of GHG emissions at UEPS in tCO2e
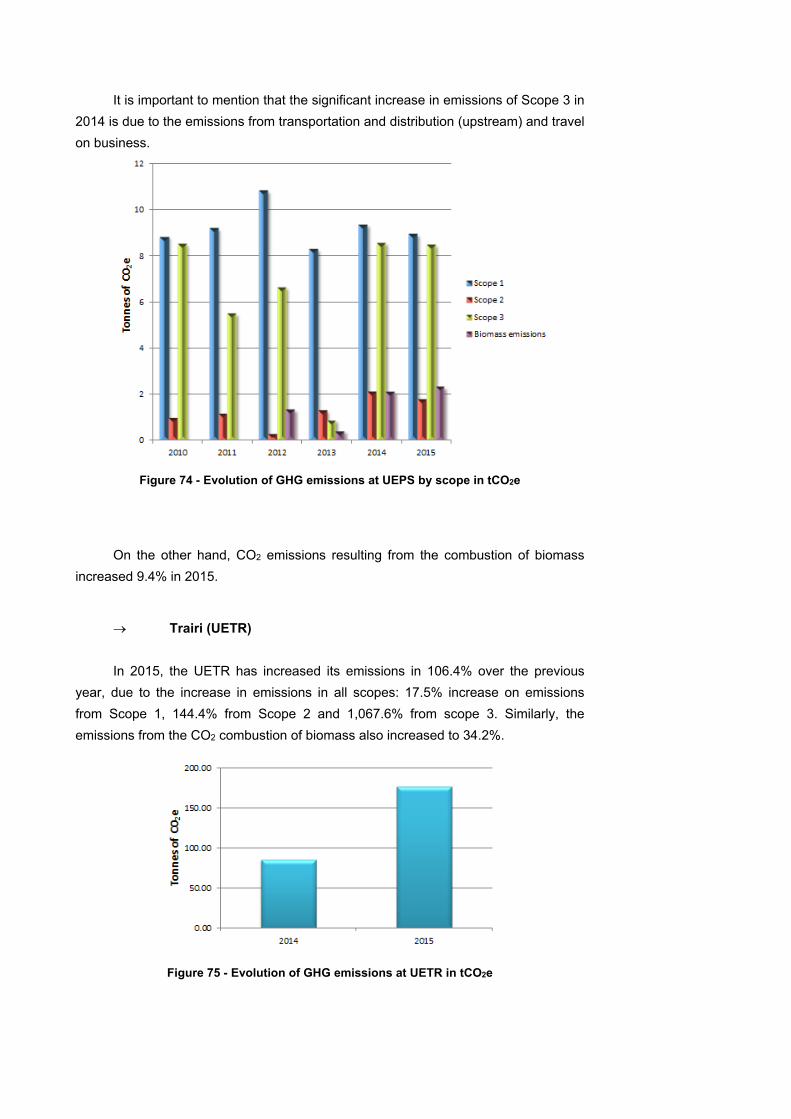
It is important to mention that the significant increase in emissions of Scope 3 in
2014 is due to the emissions from transportation and distribution (upstream) and travel
on business.
Figure 74 - Evolution of GHG emissions at UEPS by scope in tCO2e
On the other hand, CO2 emissions resulting from the combustion of biomass
increased 9.4% in 2015.
Trairi (UETR)
In 2015, the UETR has increased its emissions in 106.4% over the previous
year, due to the increase in emissions in all scopes: 17.5% increase on emissions
from Scope 1, 144.4% from Scope 2 and 1,067.6% from scope 3. Similarly, the
emissions from the CO2 combustion of biomass also increased to 34.2%.
Figure 75 - Evolution of GHG emissions at UETR in tCO2e
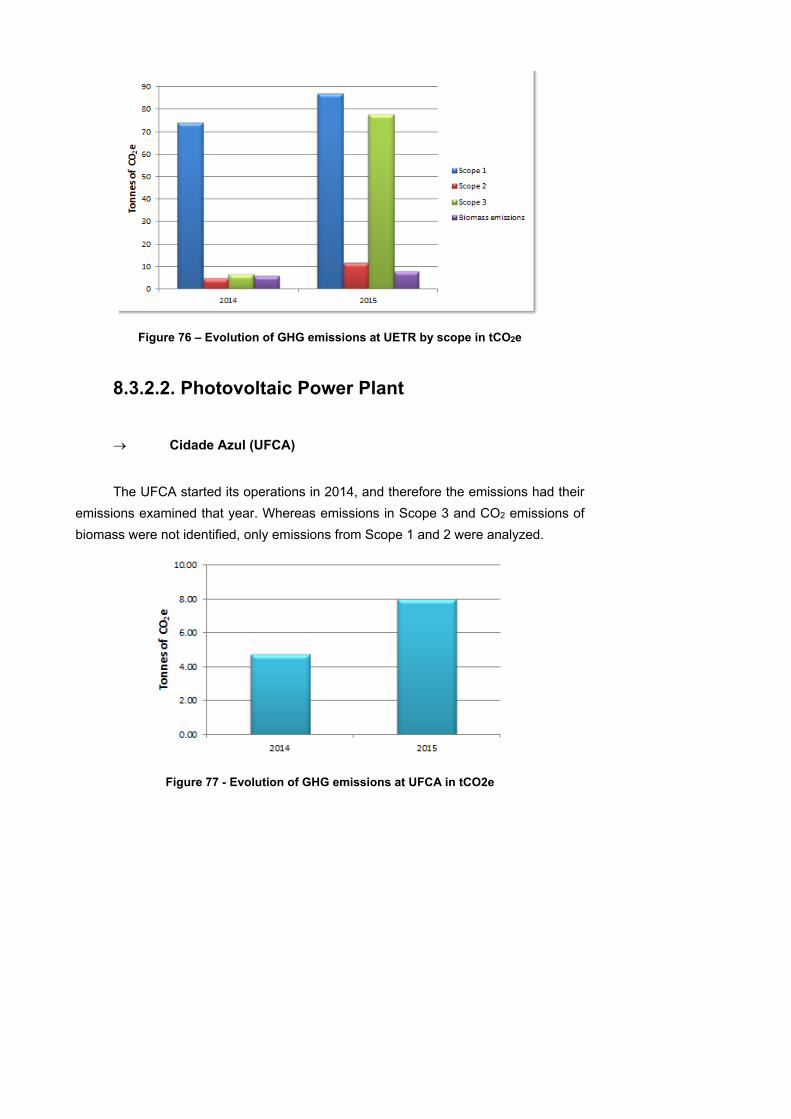
Figure 76 – Evolution of GHG emissions at UETR by scope in tCO2e
8.3.2.2. Photovoltaic Power Plant
Cidade Azul (UFCA)
The UFCA started its operations in 2014, and therefore the emissions had their
emissions examined that year. Whereas emissions in Scope 3 and CO2 emissions of
biomass were not identified, only emissions from Scope 1 and 2 were analyzed.
Figure 77 - Evolution of GHG emissions at UFCA in tCO2e
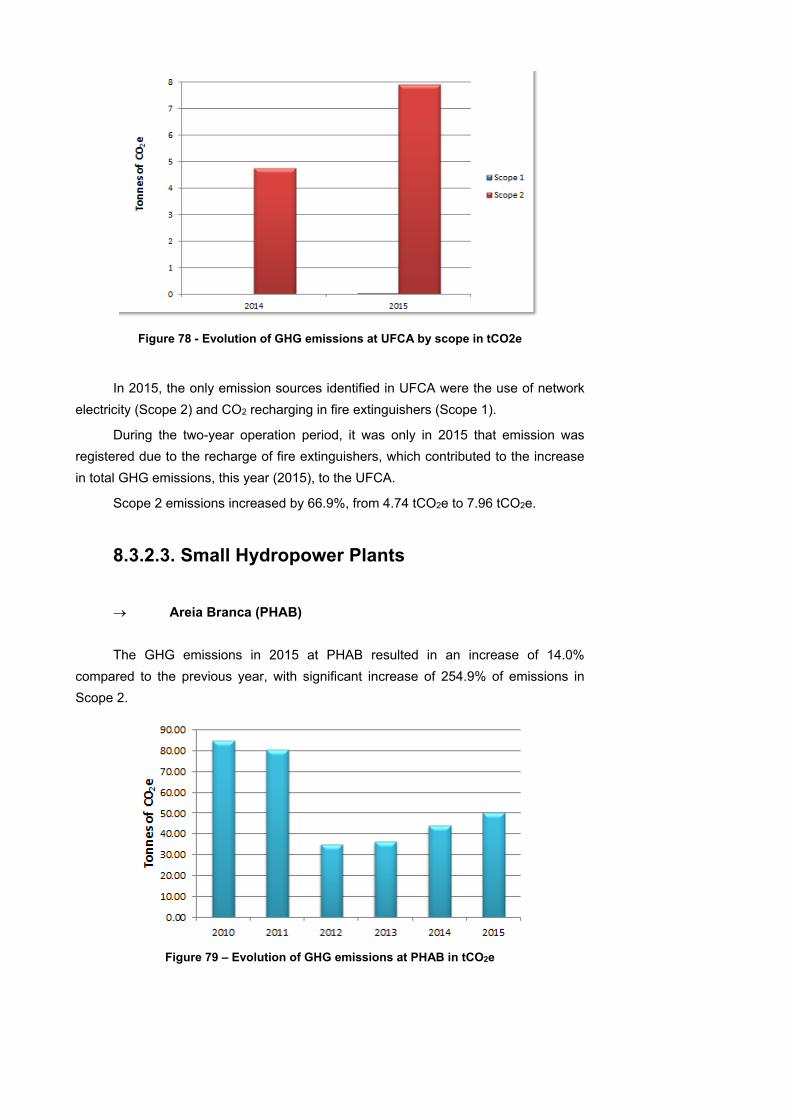
Figure 78 - Evolution of GHG emissions at UFCA by scope in tCO2e
In 2015, the only emission sources identified in UFCA were the use of network
electricity (Scope 2) and CO2 recharging in fire extinguishers (Scope 1).
During the two-year operation period, it was only in 2015 that emission was
registered due to the recharge of fire extinguishers, which contributed to the increase
in total GHG emissions, this year (2015), to the UFCA.
Scope 2 emissions increased by 66.9%, from 4.74 tCO2e to 7.96 tCO2e.
8.3.2.3. Small Hydropower Plants
Areia Branca (PHAB)
The GHG emissions in 2015 at PHAB resulted in an increase of 14.0%
compared to the previous year, with significant increase of 254.9% of emissions in
Scope 2.
Figure 79 – Evolution of GHG emissions at PHAB in tCO2e
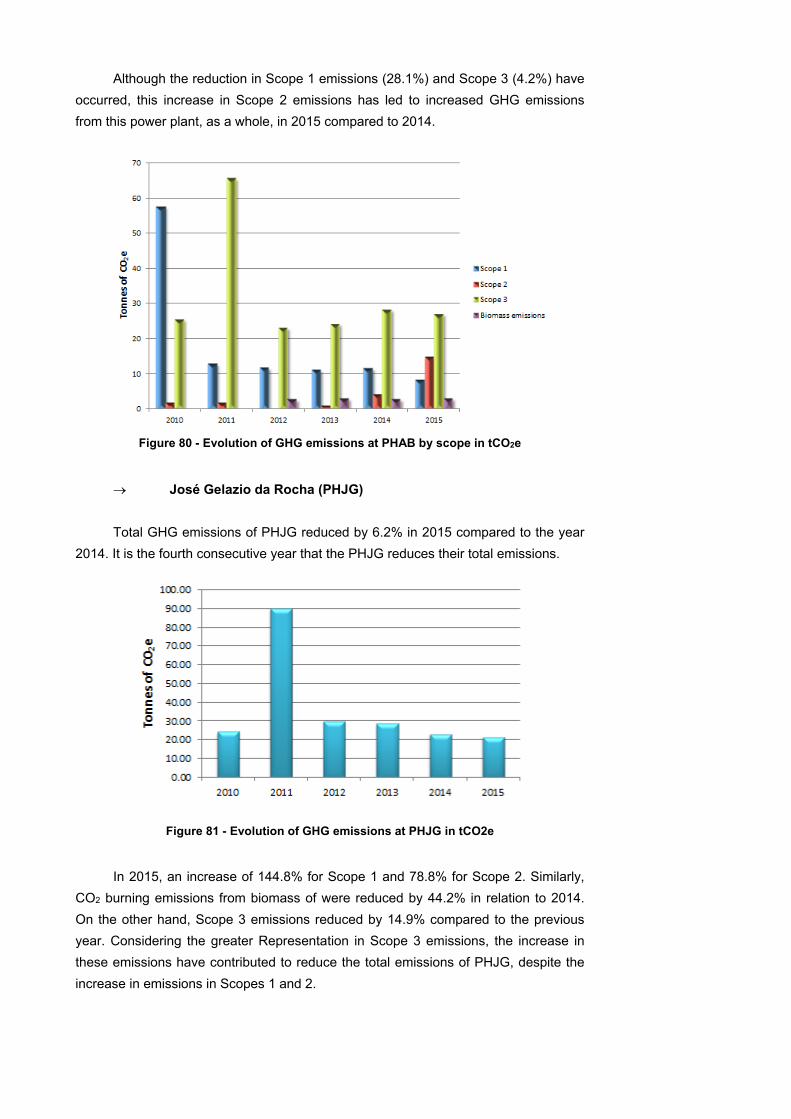
Although the reduction in Scope 1 emissions (28.1%) and Scope 3 (4.2%) have
occurred, this increase in Scope 2 emissions has led to increased GHG emissions
from this power plant, as a whole, in 2015 compared to 2014.
Figure 80 - Evolution of GHG emissions at PHAB by scope in tCO2e
José Gelazio da Rocha (PHJG)
Total GHG emissions of PHJG reduced by 6.2% in 2015 compared to the year
2014. It is the fourth consecutive year that the PHJG reduces their total emissions.
Figure 81 - Evolution of GHG emissions at PHJG in tCO2e
In 2015, an increase of 144.8% for Scope 1 and 78.8% for Scope 2. Similarly,
CO2 burning emissions from biomass of were reduced by 44.2% in relation to 2014.
On the other hand, Scope 3 emissions reduced by 14.9% compared to the previous
year. Considering the greater Representation in Scope 3 emissions, the increase in
these emissions have contributed to reduce the total emissions of PHJG, despite the
increase in emissions in Scopes 1 and 2.
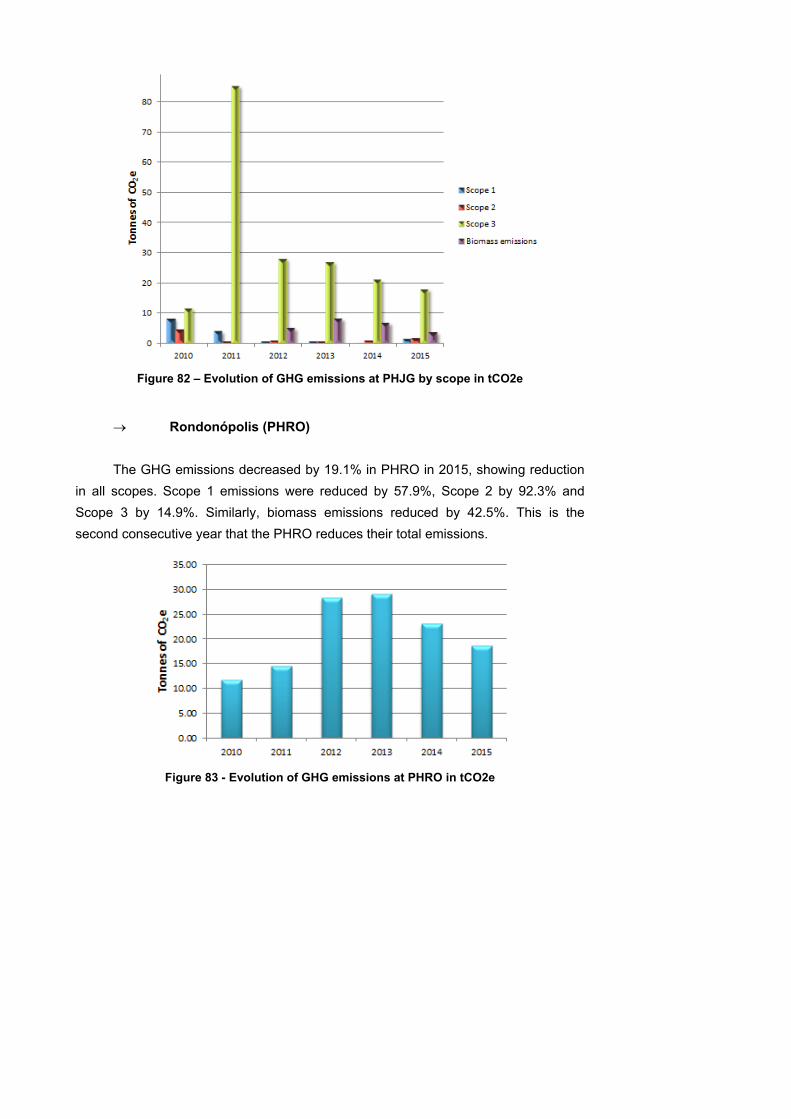
Figure 82 – Evolution of GHG emissions at PHJG by scope in tCO2e
Rondonópolis (PHRO)
The GHG emissions decreased by 19.1% in PHRO in 2015, showing reduction
in all scopes. Scope 1 emissions were reduced by 57.9%, Scope 2 by 92.3% and
Scope 3 by 14.9%. Similarly, biomass emissions reduced by 42.5%. This is the
second consecutive year that the PHRO reduces their total emissions.
Figure 83 - Evolution of GHG emissions at PHRO in tCO2e
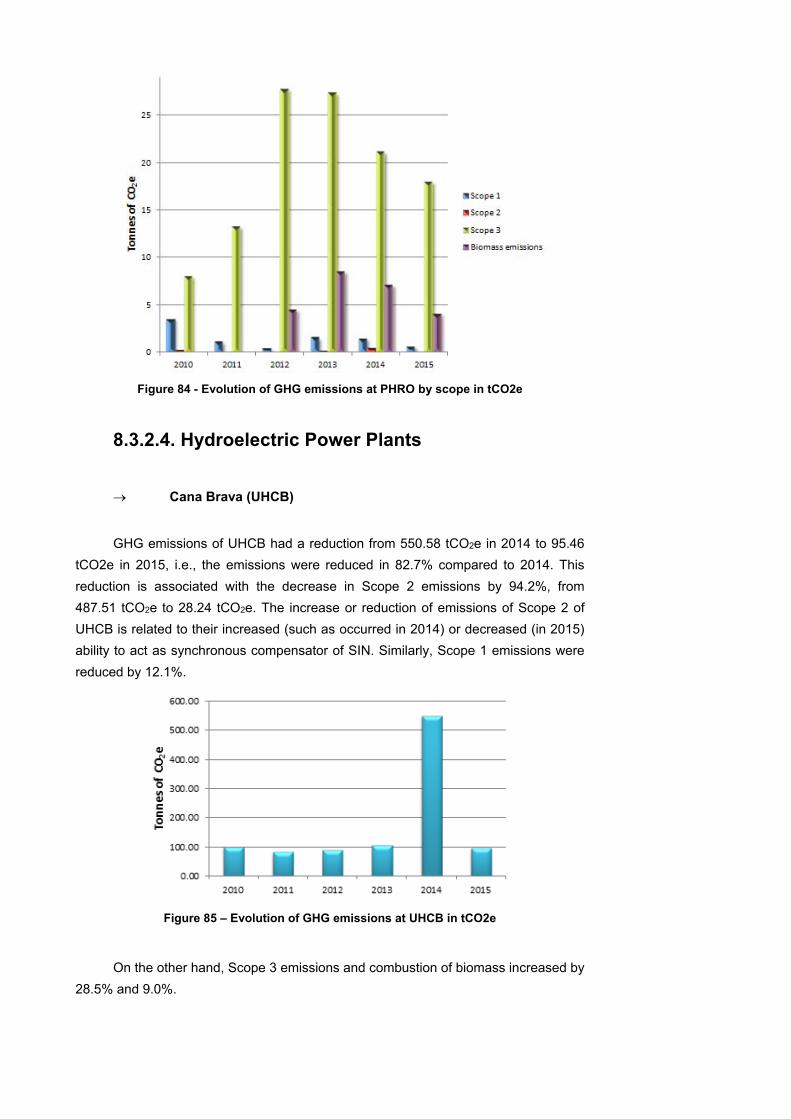
Figure 84 - Evolution of GHG emissions at PHRO by scope in tCO2e
8.3.2.4. Hydroelectric Power Plants
Cana Brava (UHCB)
GHG emissions of UHCB had a reduction from 550.58 tCO2e in 2014 to 95.46
tCO2e in 2015, i.e., the emissions were reduced in 82.7% compared to 2014. This
reduction is associated with the decrease in Scope 2 emissions by 94.2%, from
487.51 tCO2e to 28.24 tCO2e. The increase or reduction of emissions of Scope 2 of
UHCB is related to their increased (such as occurred in 2014) or decreased (in 2015)
ability to act as synchronous compensator of SIN. Similarly, Scope 1 emissions were
reduced by 12.1%.
Figure 85 – Evolution of GHG emissions at UHCB in tCO2e
On the other hand, Scope 3 emissions and combustion of biomass increased by
28.5% and 9.0%.
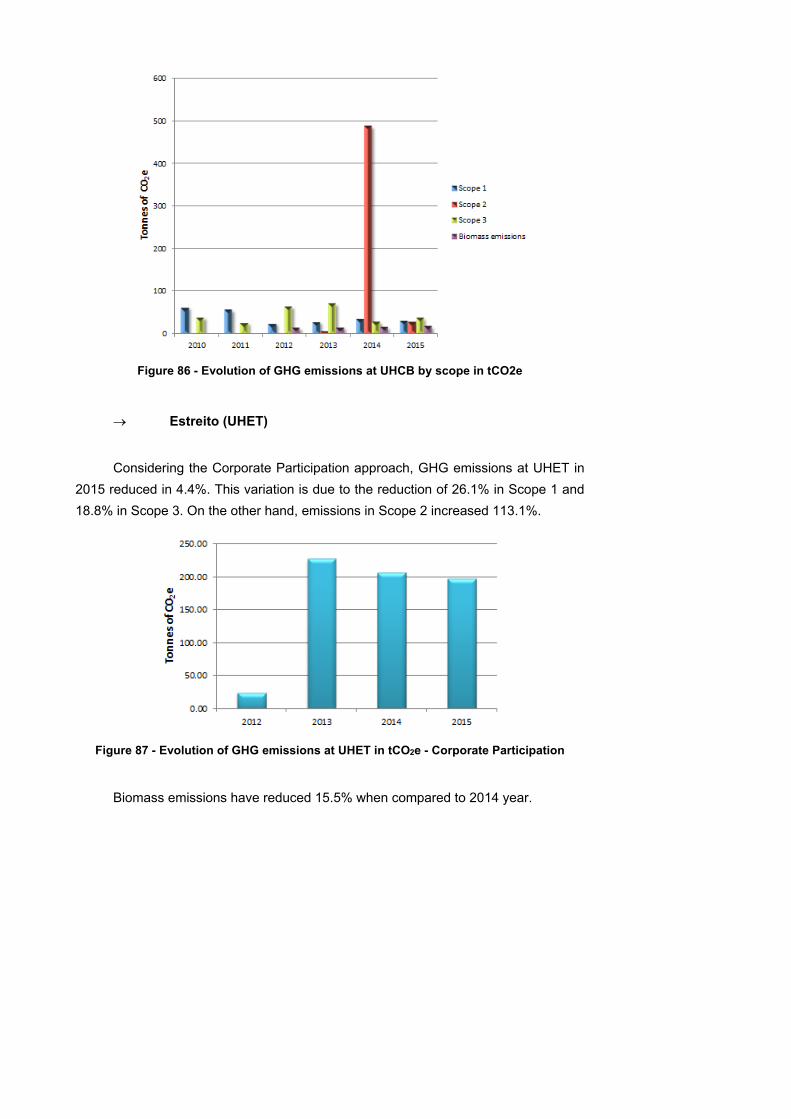
Figure 86 - Evolution of GHG emissions at UHCB by scope in tCO2e
Estreito (UHET)
Considering the Corporate Participation approach, GHG emissions at UHET in
2015 reduced in 4.4%. This variation is due to the reduction of 26.1% in Scope 1 and
18.8% in Scope 3. On the other hand, emissions in Scope 2 increased 113.1%.
Figure 87 - Evolution of GHG emissions at UHET in tCO2e - Corporate Participation
Biomass emissions have reduced 15.5% when compared to 2014 year.
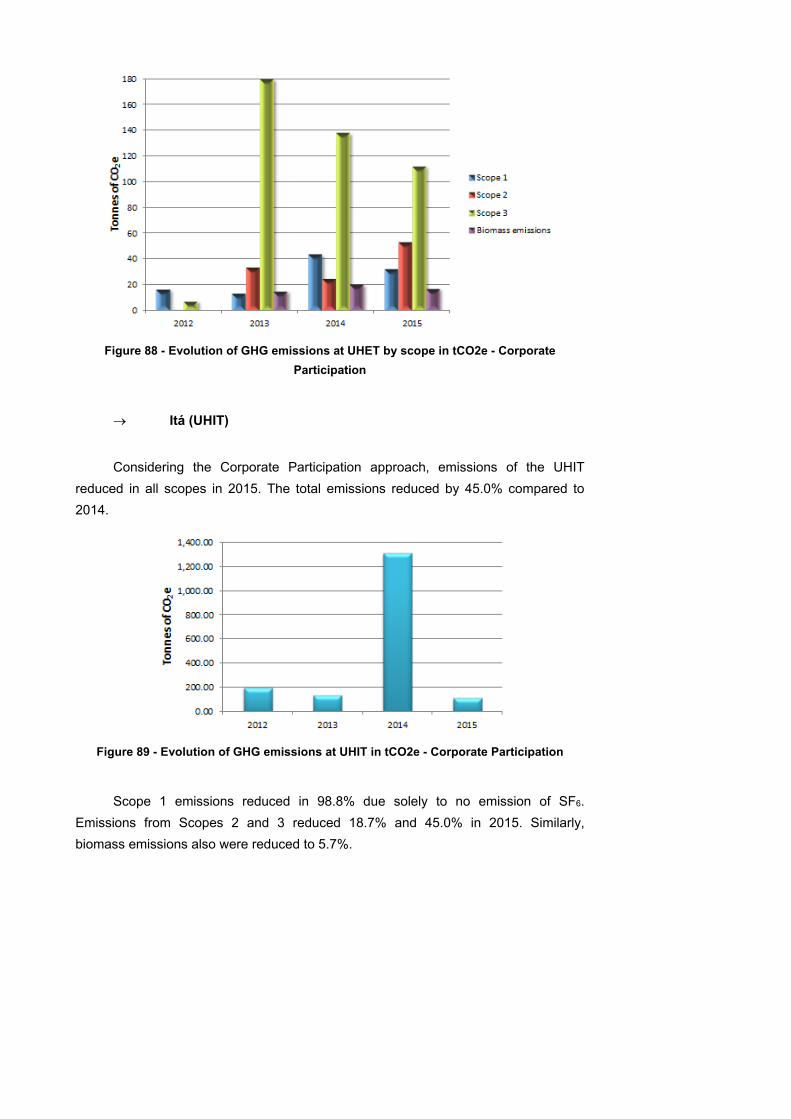
Figure 88 - Evolution of GHG emissions at UHET by scope in tCO2e - Corporate
Participation
Itá (UHIT)
Considering the Corporate Participation approach, emissions of the UHIT
reduced in all scopes in 2015. The total emissions reduced by 45.0% compared to
2014.
Figure 89 - Evolution of GHG emissions at UHIT in tCO2e - Corporate Participation
Scope 1 emissions reduced in 98.8% due solely to no emission of SF6.
Emissions from Scopes 2 and 3 reduced 18.7% and 45.0% in 2015. Similarly,
biomass emissions also were reduced to 5.7%.
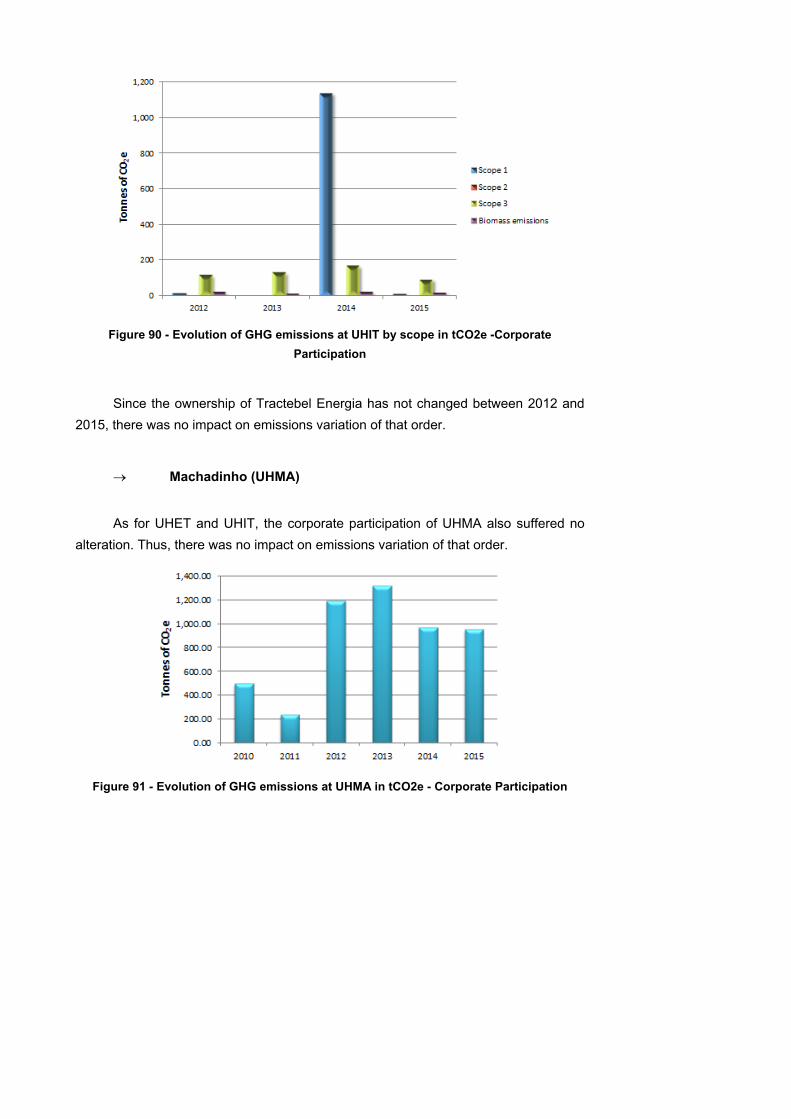
Figure 90 - Evolution of GHG emissions at UHIT by scope in tCO2e -Corporate
Participation
Since the ownership of Tractebel Energia has not changed between 2012 and
2015, there was no impact on emissions variation of that order.
Machadinho (UHMA)
As for UHET and UHIT, the corporate participation of UHMA also suffered no
alteration. Thus, there was no impact on emissions variation of that order.
Figure 91 - Evolution of GHG emissions at UHMA in tCO2e - Corporate Participation
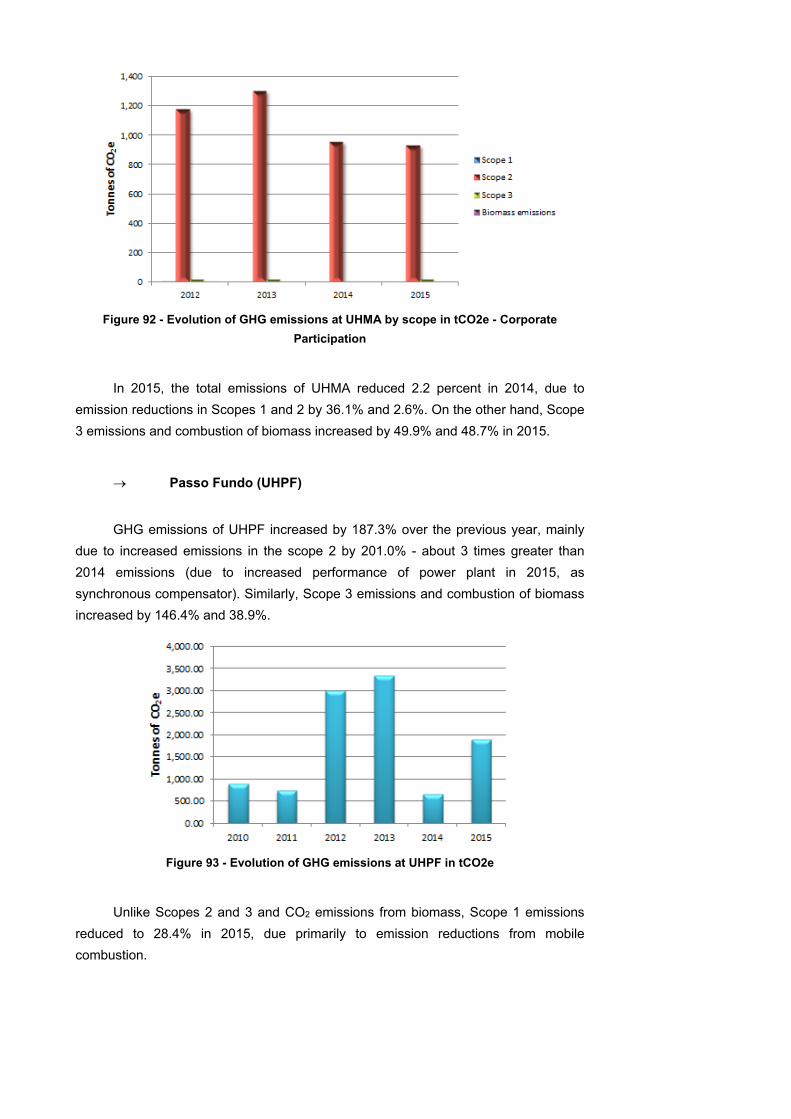
Figure 92 - Evolution of GHG emissions at UHMA by scope in tCO2e - Corporate
Participation
In 2015, the total emissions of UHMA reduced 2.2 percent in 2014, due to
emission reductions in Scopes 1 and 2 by 36.1% and 2.6%. On the other hand, Scope
3 emissions and combustion of biomass increased by 49.9% and 48.7% in 2015.
Passo Fundo (UHPF)
GHG emissions of UHPF increased by 187.3% over the previous year, mainly
due to increased emissions in the scope 2 by 201.0% - about 3 times greater than
2014 emissions (due to increased performance of power plant in 2015, as
synchronous compensator). Similarly, Scope 3 emissions and combustion of biomass
increased by 146.4% and 38.9%.
Figure 93 - Evolution of GHG emissions at UHPF in tCO2e
Unlike Scopes 2 and 3 and CO2 emissions from biomass, Scope 1 emissions
reduced to 28.4% in 2015, due primarily to emission reductions from mobile
combustion.
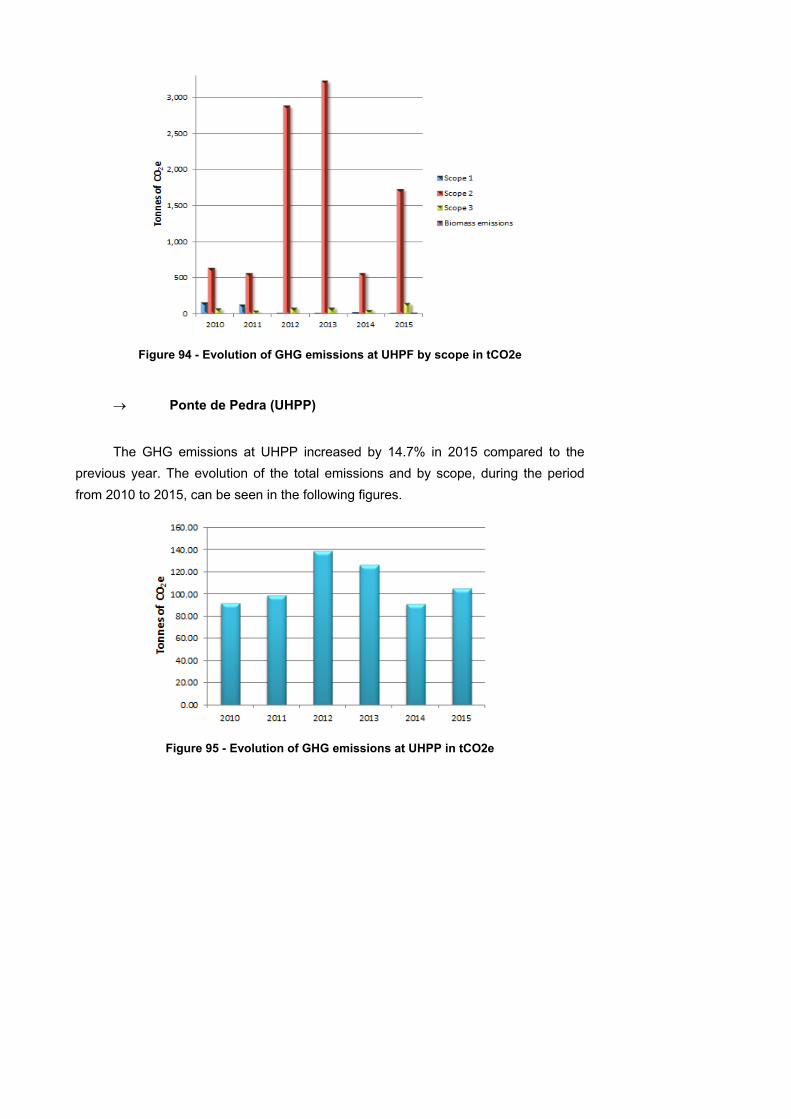
Figure 94 - Evolution of GHG emissions at UHPF by scope in tCO2e
Ponte de Pedra (UHPP)
The GHG emissions at UHPP increased by 14.7% in 2015 compared to the
previous year. The evolution of the total emissions and by scope, during the period
from 2010 to 2015, can be seen in the following figures.
Figure 95 - Evolution of GHG emissions at UHPP in tCO2e
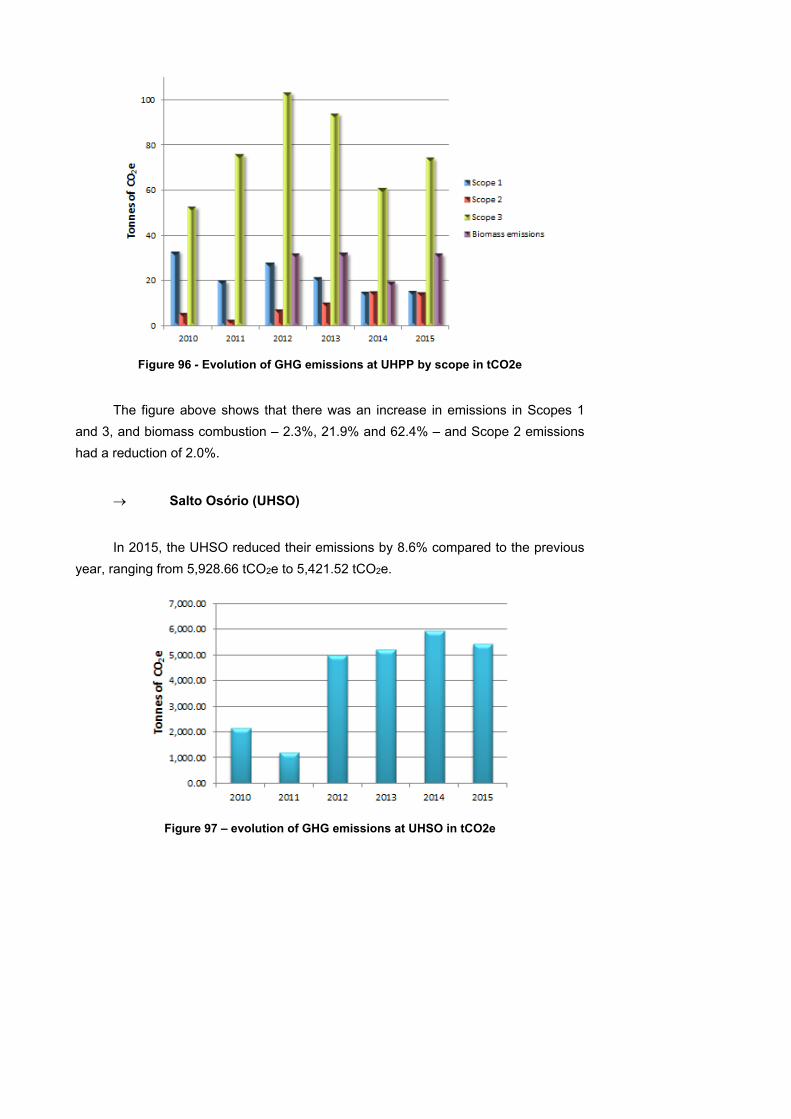
Figure 96 - Evolution of GHG emissions at UHPP by scope in tCO2e
The figure above shows that there was an increase in emissions in Scopes 1
and 3, and biomass combustion – 2.3%, 21.9% and 62.4% – and Scope 2 emissions
had a reduction of 2.0%.
Salto Osório (UHSO)
In 2015, the UHSO reduced their emissions by 8.6% compared to the previous
year, ranging from 5,928.66 tCO2e to 5,421.52 tCO2e.
Figure 97 – evolution of GHG emissions at UHSO in tCO2e
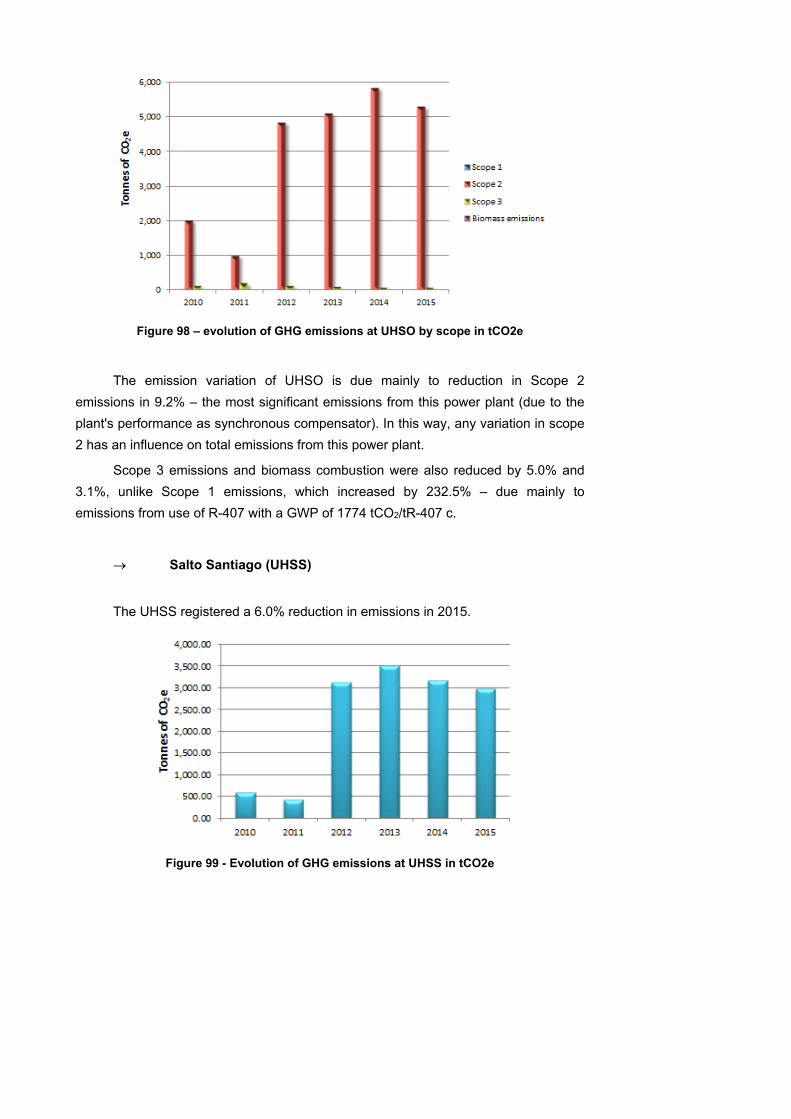
Figure 98 – evolution of GHG emissions at UHSO by scope in tCO2e
The emission variation of UHSO is due mainly to reduction in Scope 2
emissions in 9.2% – the most significant emissions from this power plant (due to the
plant's performance as synchronous compensator). In this way, any variation in scope
2 has an influence on total emissions from this power plant.
Scope 3 emissions and biomass combustion were also reduced by 5.0% and
3.1%, unlike Scope 1 emissions, which increased by 232.5% – due mainly to
emissions from use of R-407 with a GWP of 1774 tCO2/tR-407 c.
Salto Santiago (UHSS)
The UHSS registered a 6.0% reduction in emissions in 2015.
Figure 99 - Evolution of GHG emissions at UHSS in tCO2e
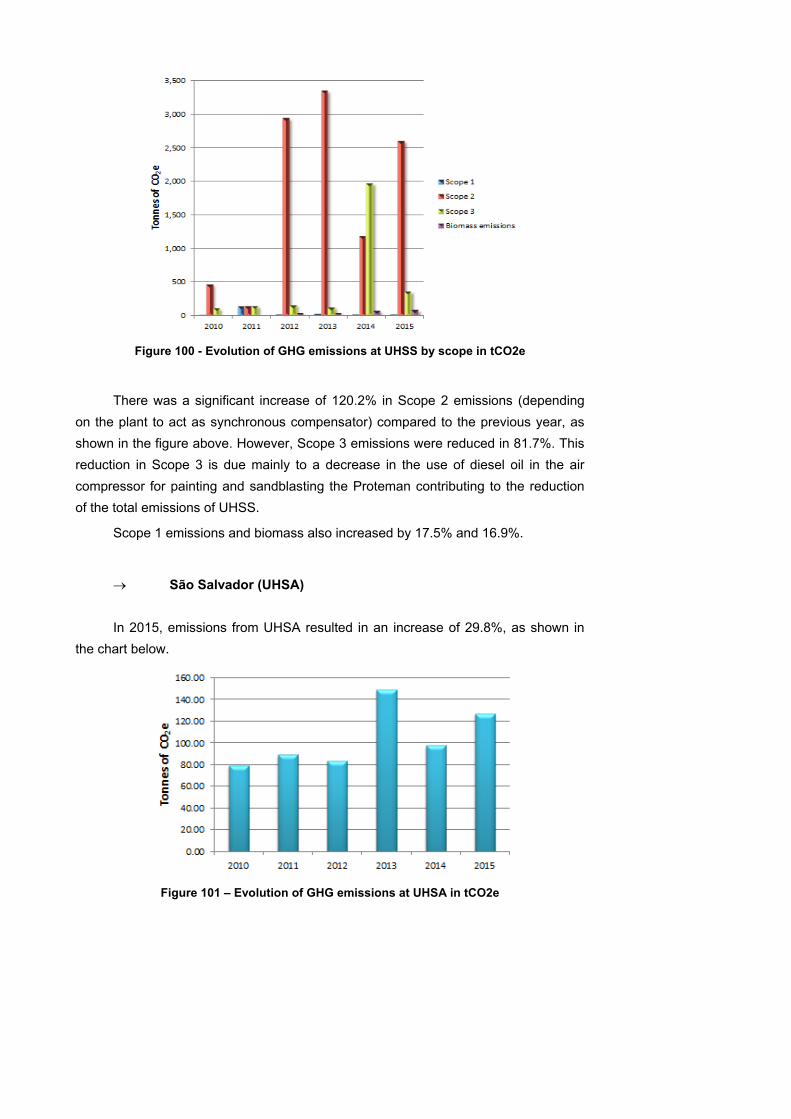
Figure 100 - Evolution of GHG emissions at UHSS by scope in tCO2e
There was a significant increase of 120.2% in Scope 2 emissions (depending
on the plant to act as synchronous compensator) compared to the previous year, as
shown in the figure above. However, Scope 3 emissions were reduced in 81.7%. This
reduction in Scope 3 is due mainly to a decrease in the use of diesel oil in the air
compressor for painting and sandblasting the Proteman contributing to the reduction
of the total emissions of UHSS.
Scope 1 emissions and biomass also increased by 17.5% and 16.9%.
São Salvador (UHSA)
In 2015, emissions from UHSA resulted in an increase of 29.8%, as shown in
the chart below.
Figure 101 – Evolution of GHG emissions at UHSA in tCO2e
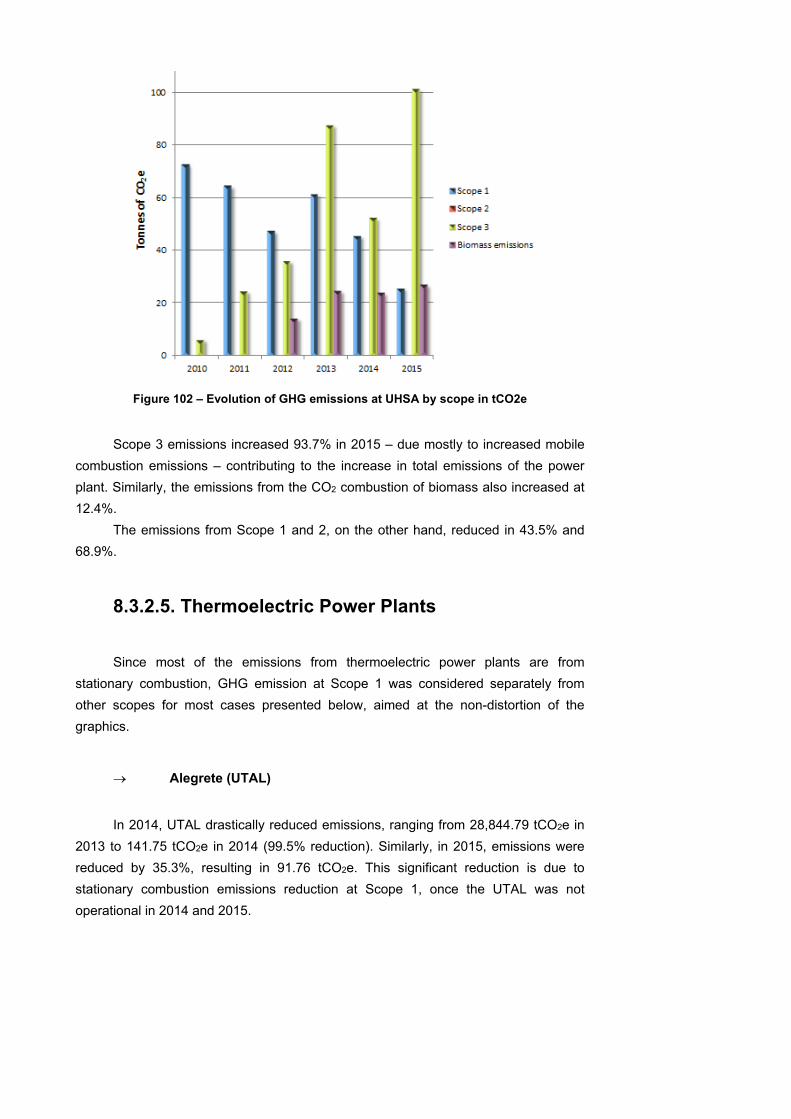
Figure 102 – Evolution of GHG emissions at UHSA by scope in tCO2e
Scope 3 emissions increased 93.7% in 2015 – due mostly to increased mobile
combustion emissions – contributing to the increase in total emissions of the power
plant. Similarly, the emissions from the CO2 combustion of biomass also increased at
12.4%.
The emissions from Scope 1 and 2, on the other hand, reduced in 43.5% and
68.9%.
8.3.2.5. Thermoelectric Power Plants
Since most of the emissions from thermoelectric power plants are from
stationary combustion, GHG emission at Scope 1 was considered separately from
other scopes for most cases presented below, aimed at the non-distortion of the
graphics.
Alegrete (UTAL)
In 2014, UTAL drastically reduced emissions, ranging from 28,844.79 tCO2e in
2013 to 141.75 tCO2e in 2014 (99.5% reduction). Similarly, in 2015, emissions were
reduced by 35.3%, resulting in 91.76 tCO2e. This significant reduction is due to
stationary combustion emissions reduction at Scope 1, once the UTAL was not
operational in 2014 and 2015.
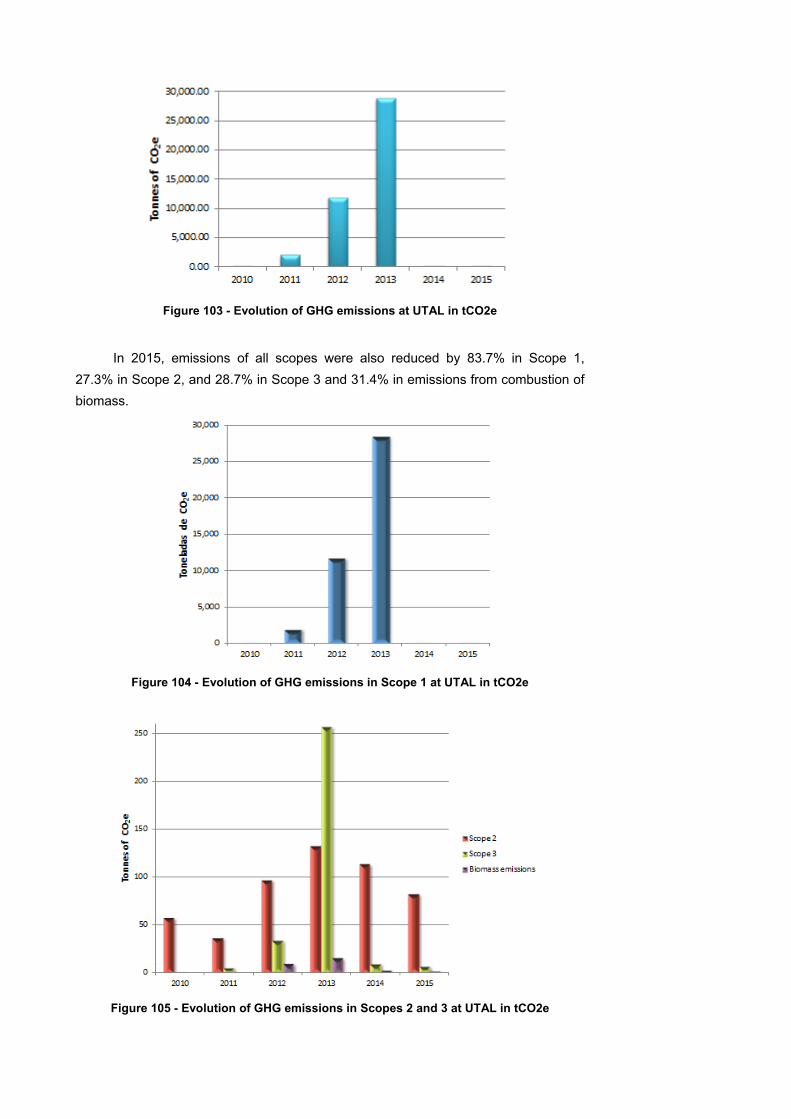
Figure 103 - Evolution of GHG emissions at UTAL in tCO2e
In 2015, emissions of all scopes were also reduced by 83.7% in Scope 1,
27.3% in Scope 2, and 28.7% in Scope 3 and 31.4% in emissions from combustion of
biomass.
Figure 104 - Evolution of GHG emissions in Scope 1 at UTAL in tCO2e
Figure 105 - Evolution of GHG emissions in Scopes 2 and 3 at UTAL in tCO2e
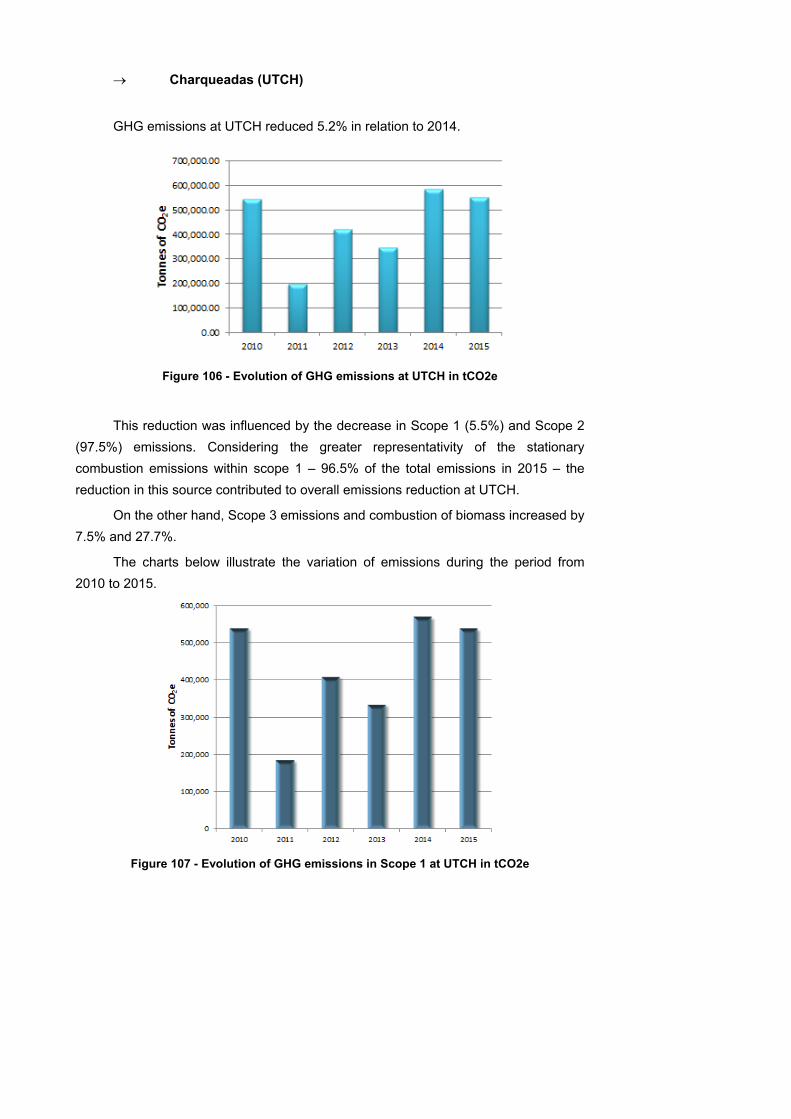
Charqueadas (UTCH)
GHG emissions at UTCH reduced 5.2% in relation to 2014.
Figure 106 - Evolution of GHG emissions at UTCH in tCO2e
This reduction was influenced by the decrease in Scope 1 (5.5%) and Scope 2
(97.5%) emissions. Considering the greater representativity of the stationary
combustion emissions within scope 1 – 96.5% of the total emissions in 2015 – the
reduction in this source contributed to overall emissions reduction at UTCH.
On the other hand, Scope 3 emissions and combustion of biomass increased by
7.5% and 27.7%.
The charts below illustrate the variation of emissions during the period from
2010 to 2015.
Figure 107 - Evolution of GHG emissions in Scope 1 at UTCH in tCO2e
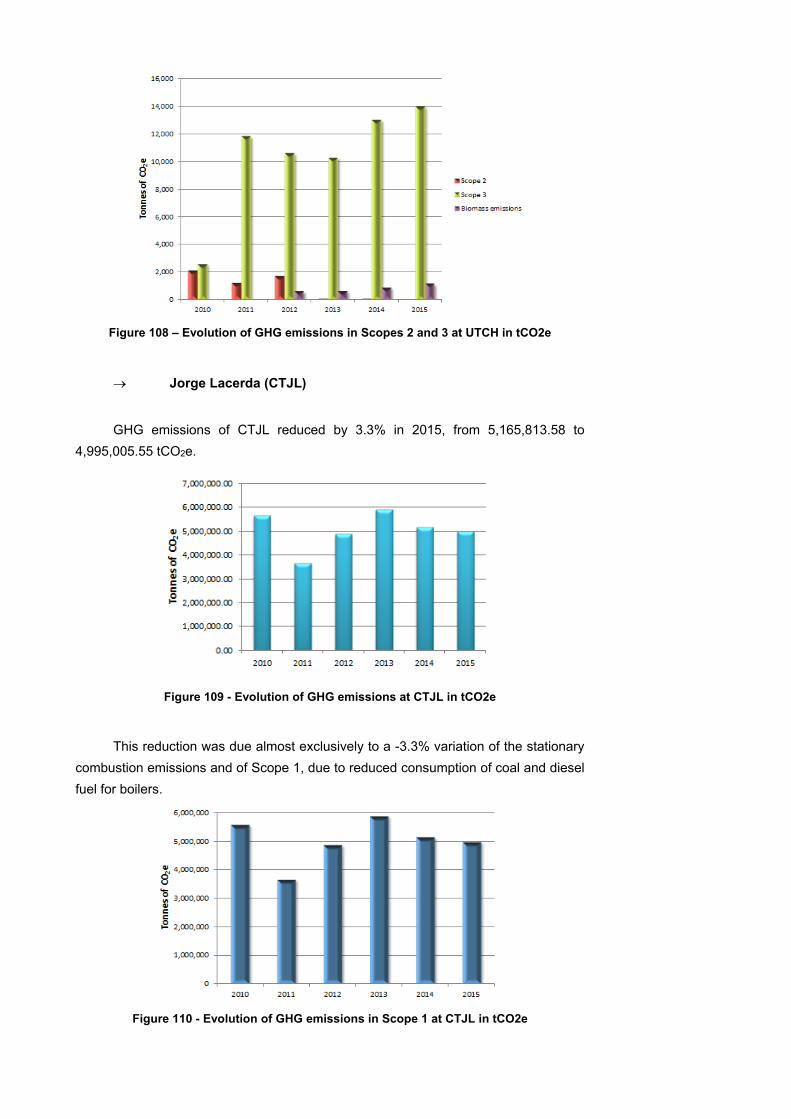
Figure 108 – Evolution of GHG emissions in Scopes 2 and 3 at UTCH in tCO2e
Jorge Lacerda (CTJL)
GHG emissions of CTJL reduced by 3.3% in 2015, from 5,165,813.58 to
4,995,005.55 tCO2e.
Figure 109 - Evolution of GHG emissions at CTJL in tCO2e
This reduction was due almost exclusively to a -3.3% variation of the stationary
combustion emissions and of Scope 1, due to reduced consumption of coal and diesel
fuel for boilers.
Figure 110 - Evolution of GHG emissions in Scope 1 at CTJL in tCO2e
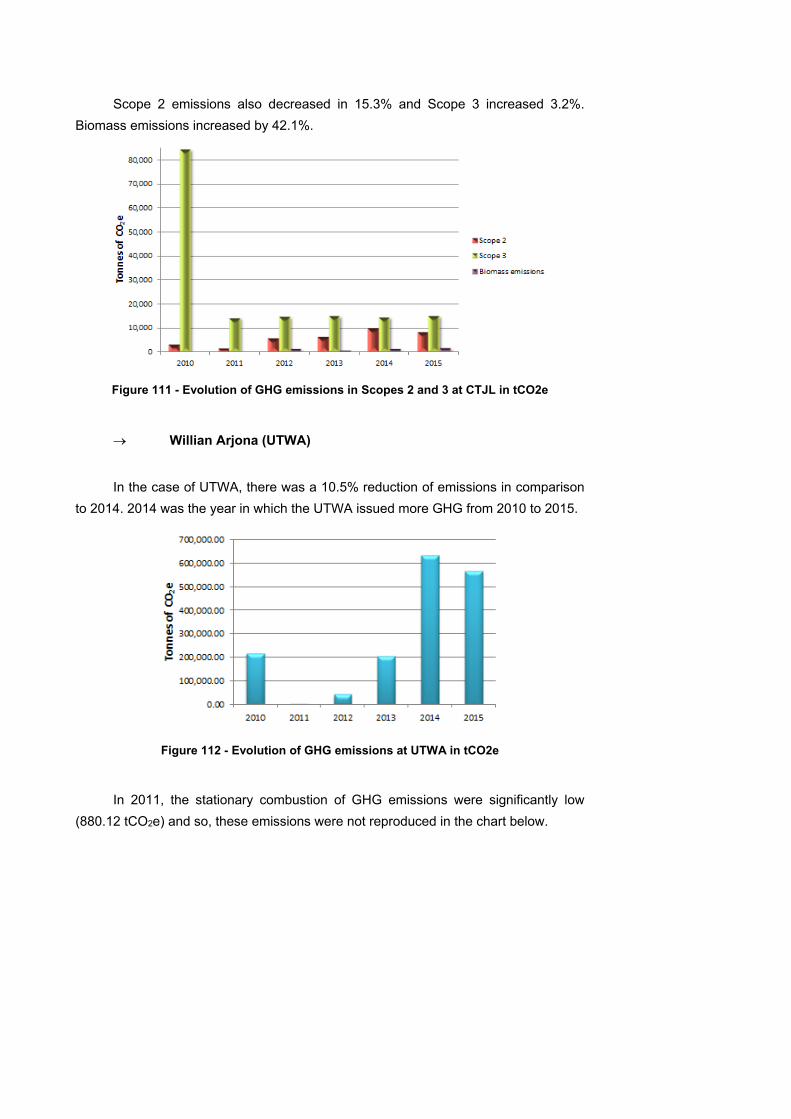
Scope 2 emissions also decreased in 15.3% and Scope 3 increased 3.2%.
Biomass emissions increased by 42.1%.
Figure 111 - Evolution of GHG emissions in Scopes 2 and 3 at CTJL in tCO2e
Willian Arjona (UTWA)
In the case of UTWA, there was a 10.5% reduction of emissions in comparison
to 2014. 2014 was the year in which the UTWA issued more GHG from 2010 to 2015.
Figure 112 - Evolution of GHG emissions at UTWA in tCO2e
In 2011, the stationary combustion of GHG emissions were significantly low
(880.12 tCO2e) and so, these emissions were not reproduced in the chart below.
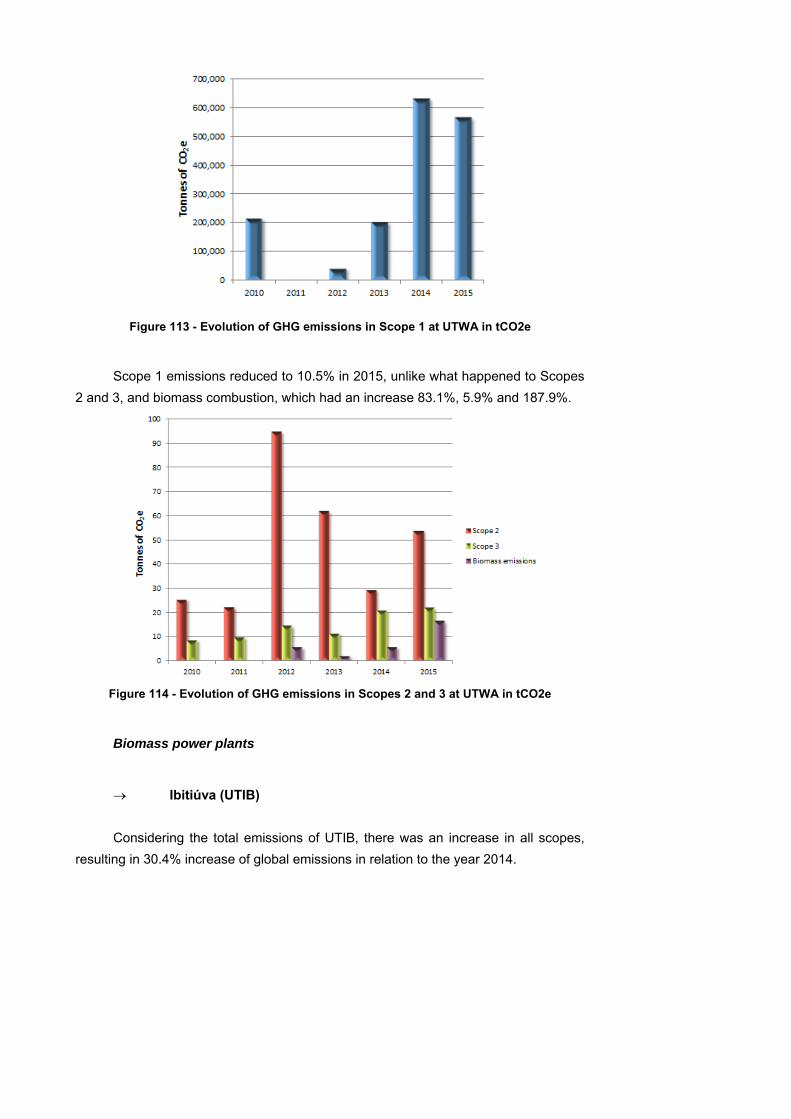
Figure 113 - Evolution of GHG emissions in Scope 1 at UTWA in tCO2e
Scope 1 emissions reduced to 10.5% in 2015, unlike what happened to Scopes
2 and 3, and biomass combustion, which had an increase 83.1%, 5.9% and 187.9%.
Figure 114 - Evolution of GHG emissions in Scopes 2 and 3 at UTWA in tCO2e
Biomass power plants
Ibitiúva (UTIB)
Considering the total emissions of UTIB, there was an increase in all scopes,
resulting in 30.4% increase of global emissions in relation to the year 2014.
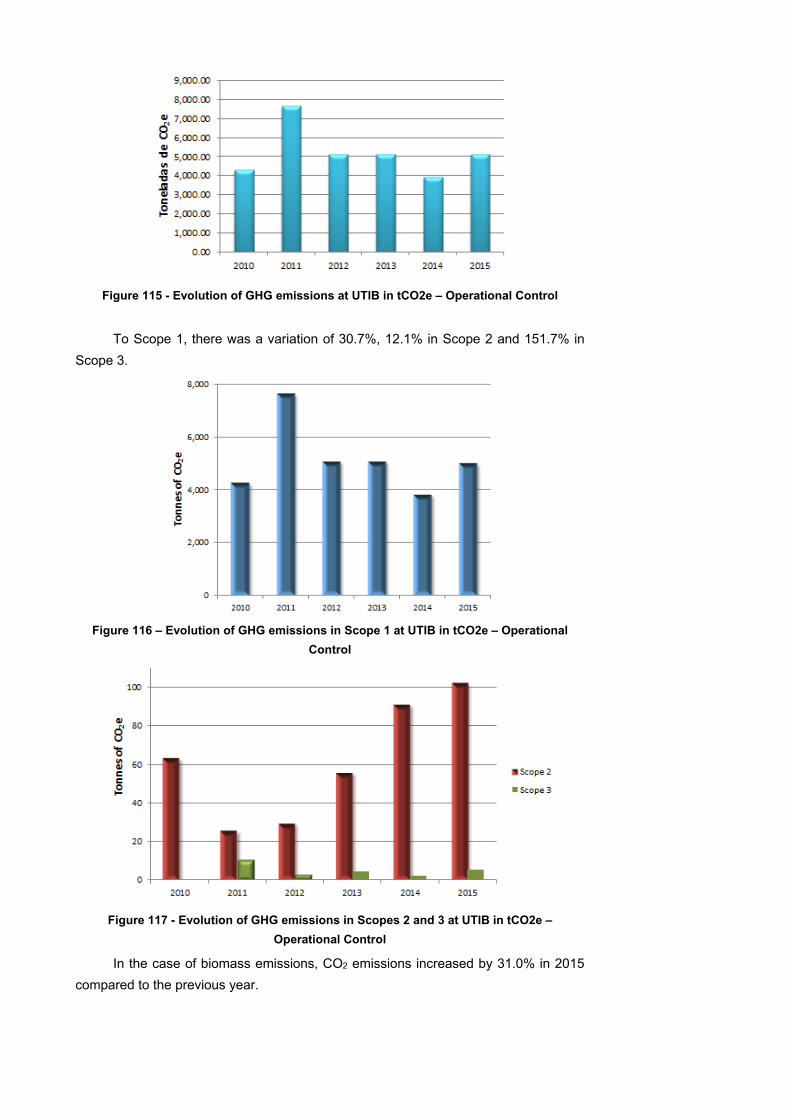
Figure 115 - Evolution of GHG emissions at UTIB in tCO2e – Operational Control
To Scope 1, there was a variation of 30.7%, 12.1% in Scope 2 and 151.7% in
Scope 3.
Figure 116 – Evolution of GHG emissions in Scope 1 at UTIB in tCO2e – Operational
Control
Figure 117 - Evolution of GHG emissions in Scopes 2 and 3 at UTIB in tCO2e –
Operational Control
In the case of biomass emissions, CO2 emissions increased by 31.0% in 2015
compared to the previous year.
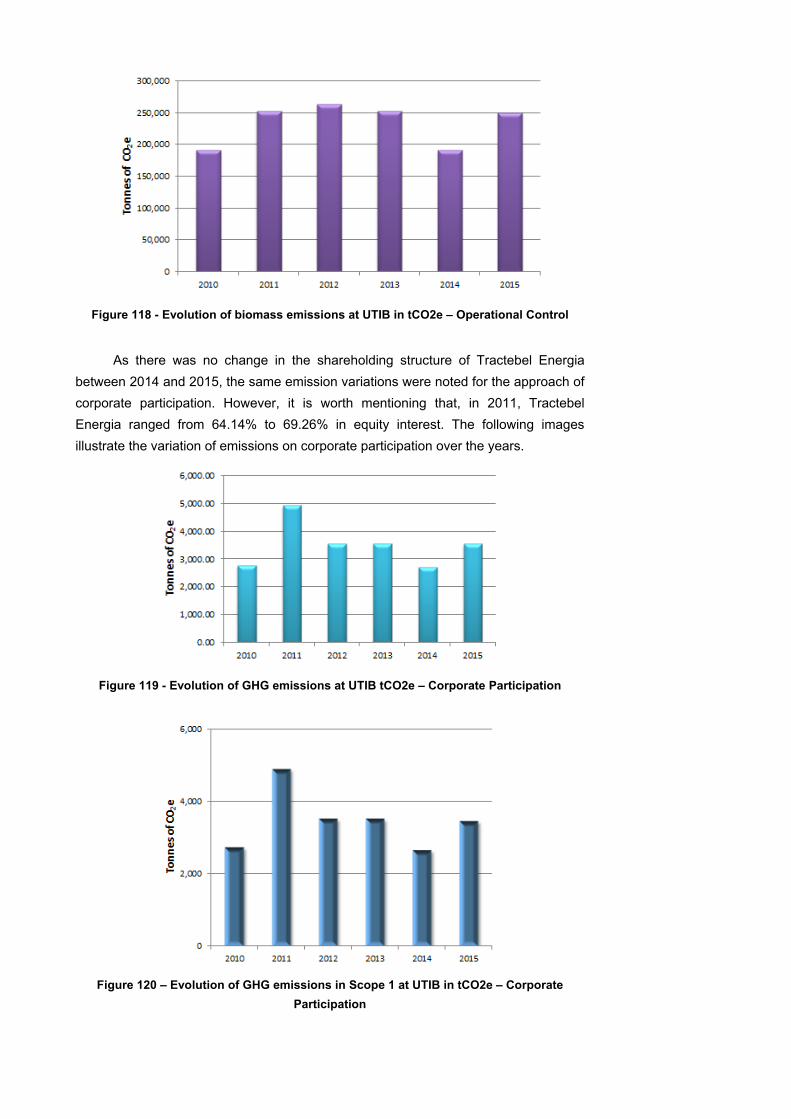
Figure 118 - Evolution of biomass emissions at UTIB in tCO2e – Operational Control
As there was no change in the shareholding structure of Tractebel Energia
between 2014 and 2015, the same emission variations were noted for the approach of
corporate participation. However, it is worth mentioning that, in 2011, Tractebel
Energia ranged from 64.14% to 69.26% in equity interest. The following images
illustrate the variation of emissions on corporate participation over the years.
Figure 119 - Evolution of GHG emissions at UTIB tCO2e – Corporate Participation
Figure 120 – Evolution of GHG emissions in Scope 1 at UTIB in tCO2e – Corporate
Participation
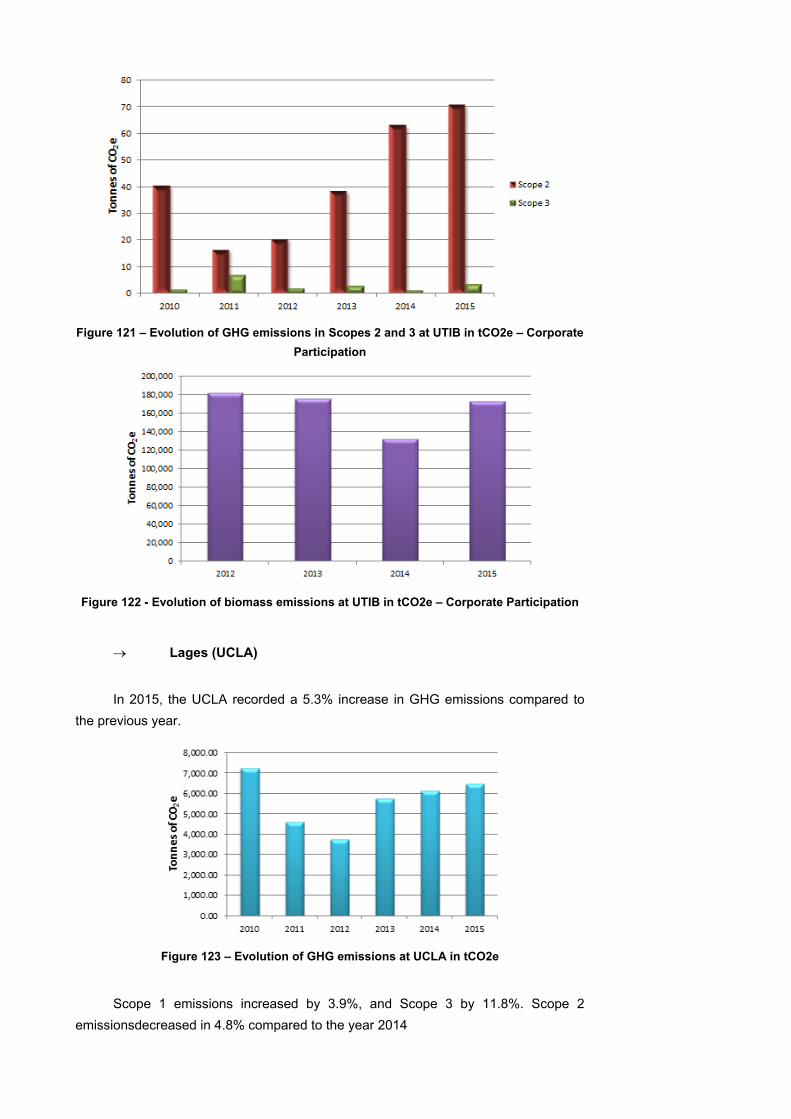
Figure 121 – Evolution of GHG emissions in Scopes 2 and 3 at UTIB in tCO2e – Corporate
Participation
Figure 122 - Evolution of biomass emissions at UTIB in tCO2e – Corporate Participation
Lages (UCLA)
In 2015, the UCLA recorded a 5.3% increase in GHG emissions compared to
the previous year.
Figure 123 – Evolution of GHG emissions at UCLA in tCO2e
Scope 1 emissions increased by 3.9%, and Scope 3 by 11.8%. Scope 2
emissionsdecreased in 4.8% compared to the year 2014
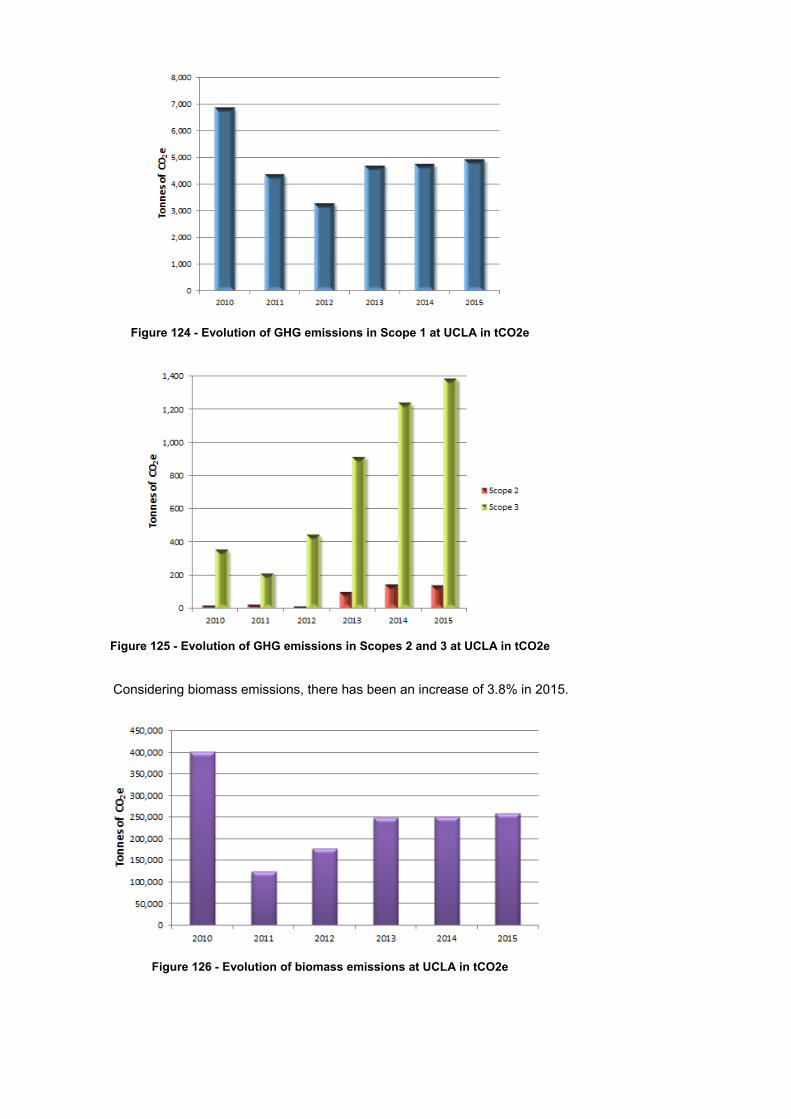
Figure 124 - Evolution of GHG emissions in Scope 1 at UCLA in tCO2e
Figure 125 - Evolution of GHG emissions in Scopes 2 and 3 at UCLA in tCO2e
Considering biomass emissions, there has been an increase of 3.8% in 2015.
Figure 126 - Evolution of biomass emissions at UCLA in tCO2e
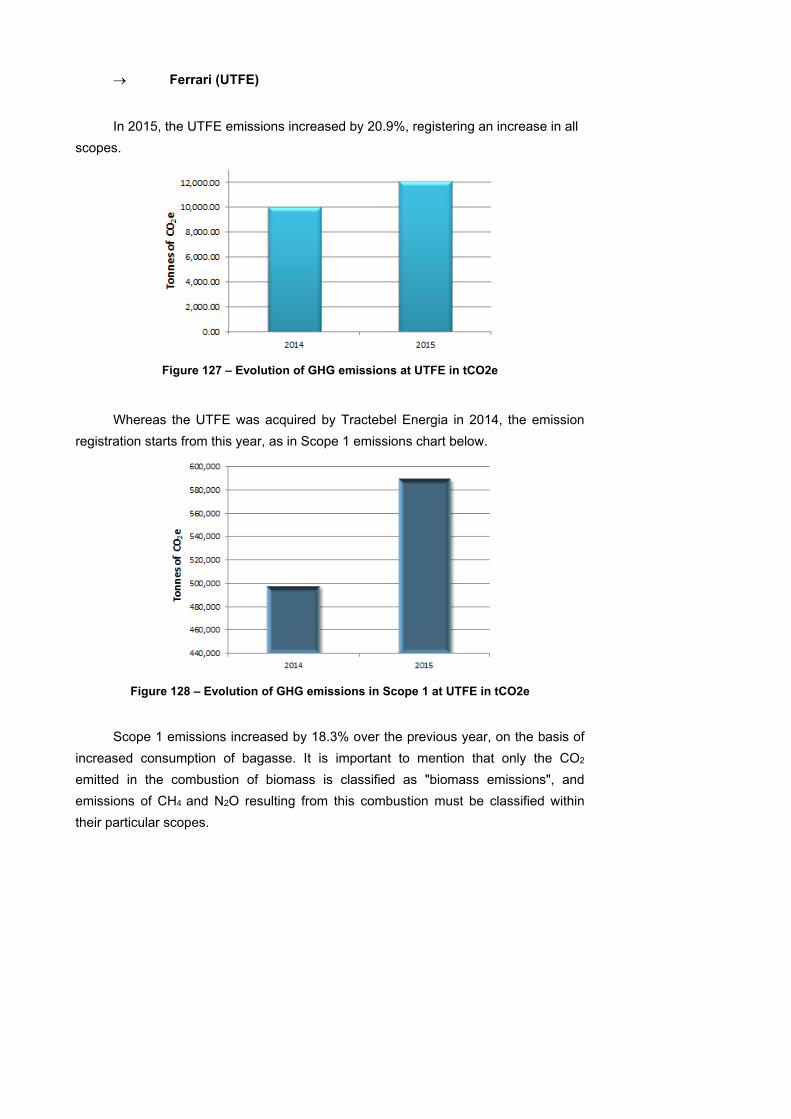
Ferrari (UTFE)
In 2015, the UTFE emissions increased by 20.9%, registering an increase in all
scopes.
Figure 127 – Evolution of GHG emissions at UTFE in tCO2e
Whereas the UTFE was acquired by Tractebel Energia in 2014, the emission
registration starts from this year, as in Scope 1 emissions chart below.
Figure 128 – Evolution of GHG emissions in Scope 1 at UTFE in tCO2e
Scope 1 emissions increased by 18.3% over the previous year, on the basis of
increased consumption of bagasse. It is important to mention that only the CO2
emitted in the combustion of biomass is classified as "biomass emissions", and
emissions of CH4 and N2O resulting from this combustion must be classified within
their particular scopes.
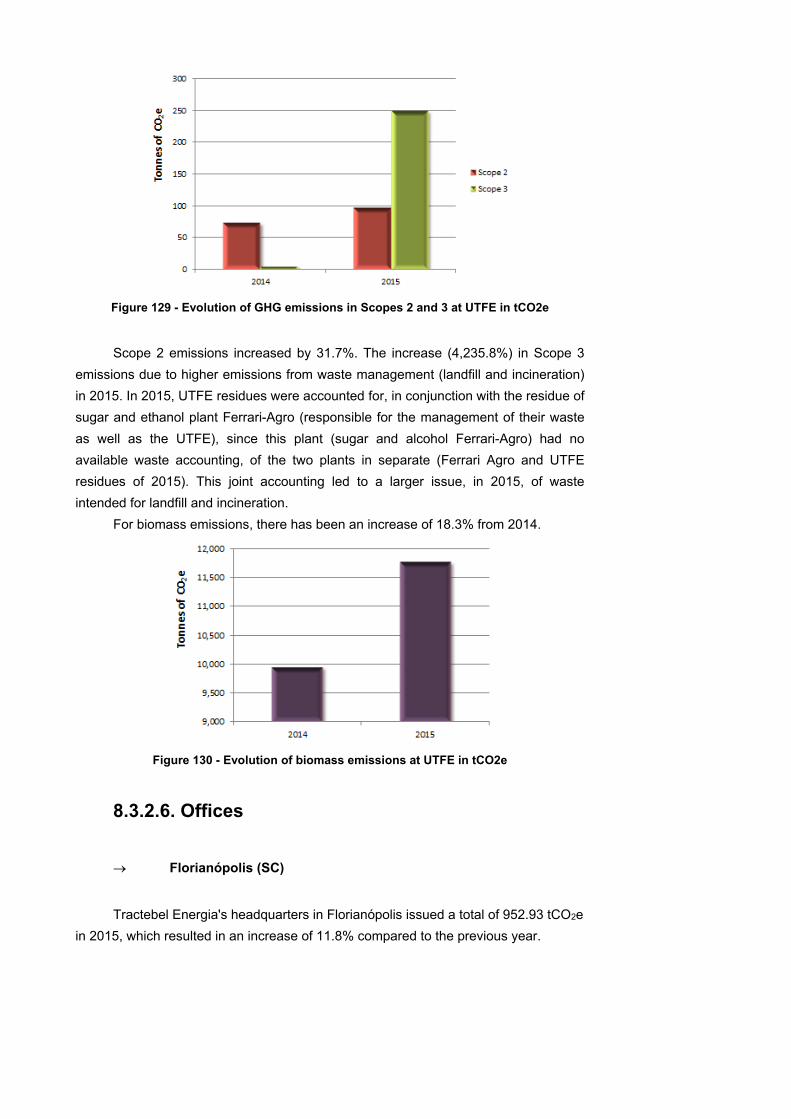
Figure 129 - Evolution of GHG emissions in Scopes 2 and 3 at UTFE in tCO2e
Scope 2 emissions increased by 31.7%. The increase (4,235.8%) in Scope 3
emissions due to higher emissions from waste management (landfill and incineration)
in 2015. In 2015, UTFE residues were accounted for, in conjunction with the residue of
sugar and ethanol plant Ferrari-Agro (responsible for the management of their waste
as well as the UTFE), since this plant (sugar and alcohol Ferrari-Agro) had no
available waste accounting, of the two plants in separate (Ferrari Agro and UTFE
residues of 2015). This joint accounting led to a larger issue, in 2015, of waste
intended for landfill and incineration.
For biomass emissions, there has been an increase of 18.3% from 2014.
Figure 130 - Evolution of biomass emissions at UTFE in tCO2e
8.3.2.6. Offices
Florianópolis (SC)
Tractebel Energia's headquarters in Florianópolis issued a total of 952.93 tCO2e
in 2015, which resulted in an increase of 11.8% compared to the previous year.
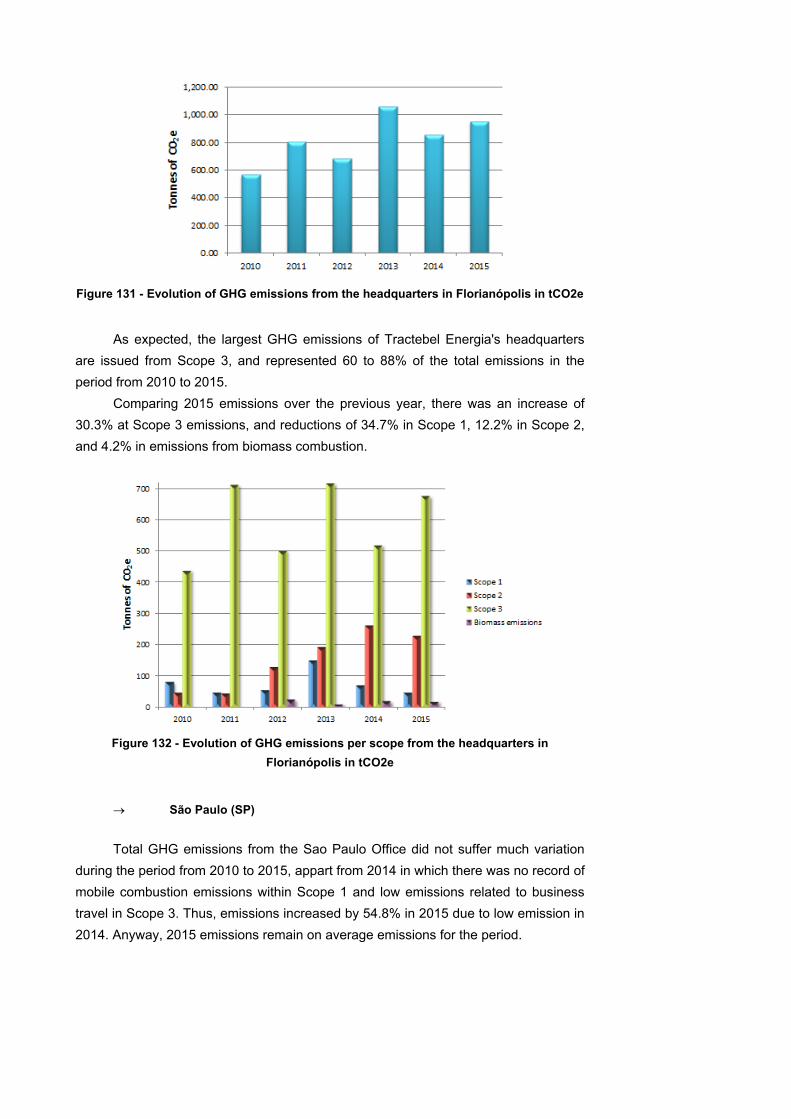
Figure 131 - Evolution of GHG emissions from the headquarters in Florianópolis in tCO2e
As expected, the largest GHG emissions of Tractebel Energia's headquarters
are issued from Scope 3, and represented 60 to 88% of the total emissions in the
period from 2010 to 2015.
Comparing 2015 emissions over the previous year, there was an increase of
30.3% at Scope 3 emissions, and reductions of 34.7% in Scope 1, 12.2% in Scope 2,
and 4.2% in emissions from biomass combustion.
Figure 132 - Evolution of GHG emissions per scope from the headquarters in
Florianópolis in tCO2e
São Paulo (SP)
Total GHG emissions from the Sao Paulo Office did not suffer much variation
during the period from 2010 to 2015, appart from 2014 in which there was no record of
mobile combustion emissions within Scope 1 and low emissions related to business
travel in Scope 3. Thus, emissions increased by 54.8% in 2015 due to low emission in
2014. Anyway, 2015 emissions remain on average emissions for the period.
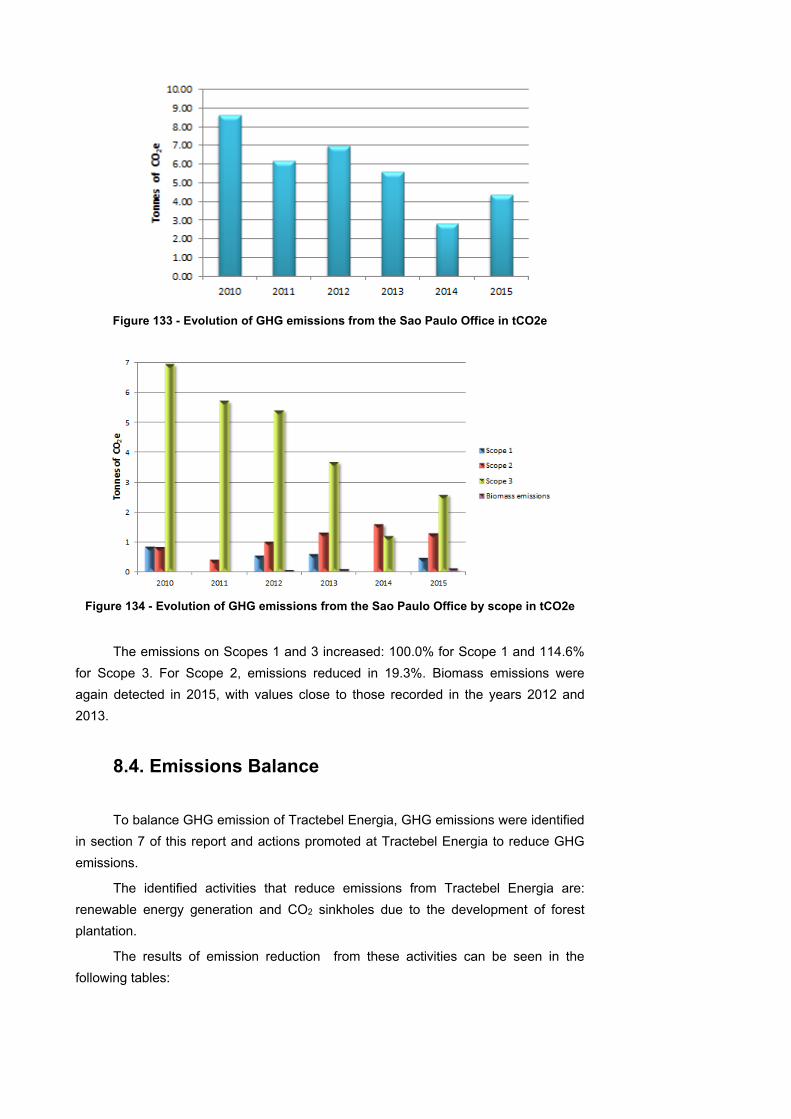
Figure 133 - Evolution of GHG emissions from the Sao Paulo Office in tCO2e
Figure 134 - Evolution of GHG emissions from the Sao Paulo Office by scope in tCO2e
The emissions on Scopes 1 and 3 increased: 100.0% for Scope 1 and 114.6%
for Scope 3. For Scope 2, emissions reduced in 19.3%. Biomass emissions were
again detected in 2015, with values close to those recorded in the years 2012 and
2013.
8.4. Emissions Balance
To balance GHG emission of Tractebel Energia, GHG emissions were identified
in section 7 of this report and actions promoted at Tractebel Energia to reduce GHG
emissions.
The identified activities that reduce emissions from Tractebel Energia are:
renewable energy generation and CO2 sinkholes due to the development of forest
plantation.
The results of emission reduction from these activities can be seen in the
following tables:
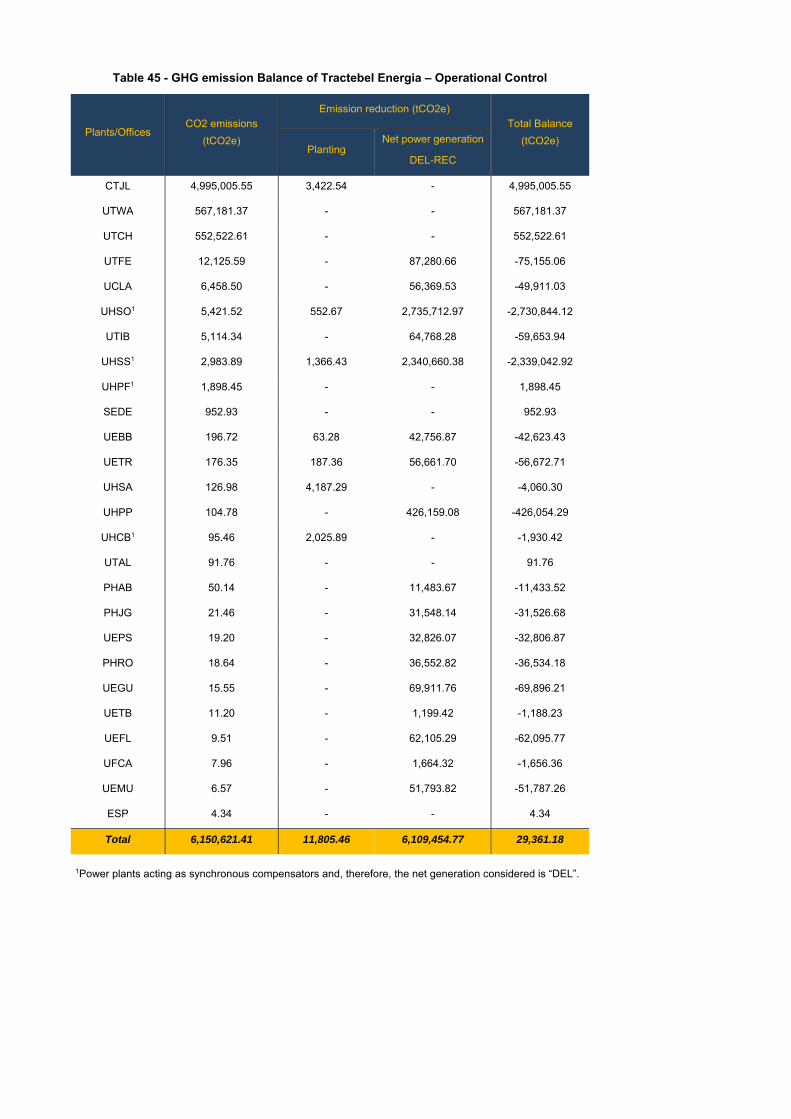
Table 45 - GHG emission Balance of Tractebel Energia – Operational Control
Plants/Offices CO2 emissions
(tCO2e)
Emission reduction (tCO2e)
Total Balance
(tCO2e) Planting
Net power generation
DEL-REC
CTJL 4,995,005.55 3,422.54 - 4,995,005.55
UTWA 567,181.37 - - 567,181.37
UTCH 552,522.61 - - 552,522.61
UTFE 12,125.59 - 87,280.66 -75,155.06
UCLA 6,458.50 - 56,369.53 -49,911.03
UHSO1 5,421.52 552.67 2,735,712.97 -2,730,844.12
UTIB 5,114.34 - 64,768.28 -59,653.94
UHSS1 2,983.89 1,366.43 2,340,660.38 -2,339,042.92
UHPF1 1,898.45 - - 1,898.45
SEDE 952.93 - - 952.93
UEBB 196.72 63.28 42,756.87 -42,623.43
UETR 176.35 187.36 56,661.70 -56,672.71
UHSA 126.98 4,187.29 - -4,060.30
UHPP 104.78 - 426,159.08 -426,054.29
UHCB1 95.46 2,025.89 - -1,930.42
UTAL 91.76 - - 91.76
PHAB 50.14 - 11,483.67 -11,433.52
PHJG 21.46 - 31,548.14 -31,526.68
UEPS 19.20 - 32,826.07 -32,806.87
PHRO 18.64 - 36,552.82 -36,534.18
UEGU 15.55 - 69,911.76 -69,896.21
UETB 11.20 - 1,199.42 -1,188.23
UEFL 9.51 - 62,105.29 -62,095.77
UFCA 7.96 - 1,664.32 -1,656.36
UEMU 6.57 - 51,793.82 -51,787.26
ESP 4.34 - - 4.34
Total 6,150,621.41 11,805.46 6,109,454.77 29,361.18
1Power plants acting as synchronous compensators and, therefore, the net generation considered is “DEL”.
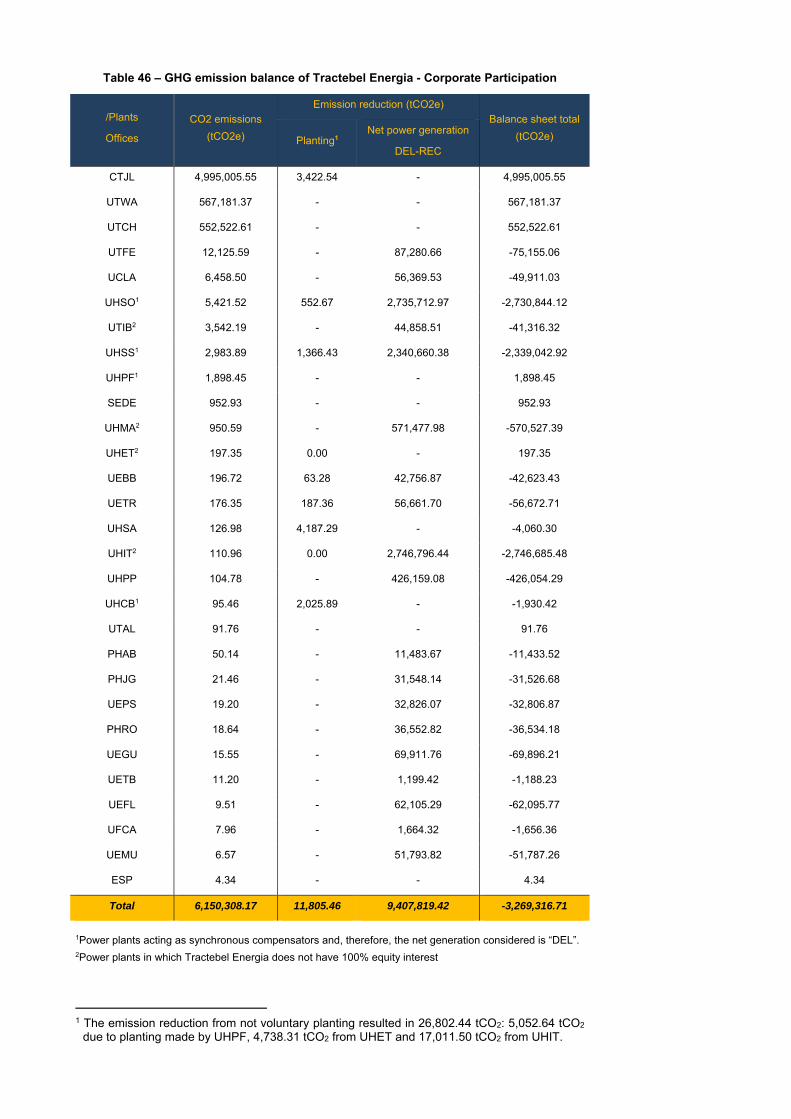
Table 46 – GHG emission balance of Tractebel Energia - Corporate Participation
/Plants
Offices
CO2 emissions
(tCO2e)
Emission reduction (tCO2e)
Balance sheet total
(tCO2e) Planting1 Net power generation
DEL-REC
CTJL 4,995,005.55 3,422.54 - 4,995,005.55
UTWA 567,181.37 - - 567,181.37
UTCH 552,522.61 - - 552,522.61
UTFE 12,125.59 - 87,280.66 -75,155.06
UCLA 6,458.50 - 56,369.53 -49,911.03
UHSO1 5,421.52 552.67 2,735,712.97 -2,730,844.12
UTIB2 3,542.19 - 44,858.51 -41,316.32
UHSS1 2,983.89 1,366.43 2,340,660.38 -2,339,042.92
UHPF1 1,898.45 - - 1,898.45
SEDE 952.93 - - 952.93
UHMA2 950.59 - 571,477.98 -570,527.39
UHET2 197.35 0.00 - 197.35
UEBB 196.72 63.28 42,756.87 -42,623.43
UETR 176.35 187.36 56,661.70 -56,672.71
UHSA 126.98 4,187.29 - -4,060.30
UHIT2 110.96 0.00 2,746,796.44 -2,746,685.48
UHPP 104.78 - 426,159.08 -426,054.29
UHCB1 95.46 2,025.89 - -1,930.42
UTAL 91.76 - - 91.76
PHAB 50.14 - 11,483.67 -11,433.52
PHJG 21.46 - 31,548.14 -31,526.68
UEPS 19.20 - 32,826.07 -32,806.87
PHRO 18.64 - 36,552.82 -36,534.18
UEGU 15.55 - 69,911.76 -69,896.21
UETB 11.20 - 1,199.42 -1,188.23
UEFL 9.51 - 62,105.29 -62,095.77
UFCA 7.96 - 1,664.32 -1,656.36
UEMU 6.57 - 51,793.82 -51,787.26
ESP 4.34 - - 4.34
Total 6,150,308.17 11,805.46 9,407,819.42 -3,269,316.71
1Power plants acting as synchronous compensators and, therefore, the net generation considered is “DEL”. 2Power plants in which Tractebel Energia does not have 100% equity interest
1 The emission reduction from not voluntary planting resulted in 26,802.44 tCO2: 5,052.64 tCO2
due to planting made by UHPF, 4,738.31 tCO2 from UHET and 17,011.50 tCO2 from UHIT.
As shown in the tables above, all units that generate net renewable energy
were able to reduce emissions more than they issue. Such reductions, although not
certified, reflect, according to the methodology applied, the contribution of these plants
for the reduction of greenhouse gas emissions.
In addition to the initiatives presented above, it is worth noting that Tractebel
Energia also develops other actions to reduce CO2 emitted to the atmosphere, as
described below.
The company is developing a Research and Development Project (R&D) that
will reduce CO2 emissions related to the use of coal using co-firing technology (dual
fuel) rice straw will be a fuel supplement in place of coal in thermoelectric plants. If it
turns out to be viable, this will lead to GHG emission reductions in its main source.
The company also invests in research and development on technologies for
developing solar and wind power generation. Through this initiative, it was possible
the implementation of photovoltaic plant at Cidade Azul in 2014 and the Tubarão wind
power plant in 2015.
Another action that reduces GHG emissions developed by Tractebel Energia is
the use of teleconference technology. The company encourages this practice that
saves greenhouse gas emissions, time and financial resources, although the GHG
emission reductions with the use of this technology is not controlled.
The company also promotes reduction of CO2 emissions using the ashes
produced in cement industry. In addition, Tractebel Energia also carries out projects to
improve the energy efficiency of its power plants, thus reducing their GHG emissions
per MWh generated.
GHG accounting methodologies and detailed results obtained for Tractebel
Energia's plants are described in Annex VI.

8.5. Indicators
From the result of emissions at Tractebel Energia, it is possible to elaborate
indicators to identify whether changes in GHG emissions over the years are
associated with an increase in productivity or a loss of efficiency in the process.
In the following tables, emission indicators for net electricity generation and total
gross and scope are presented.
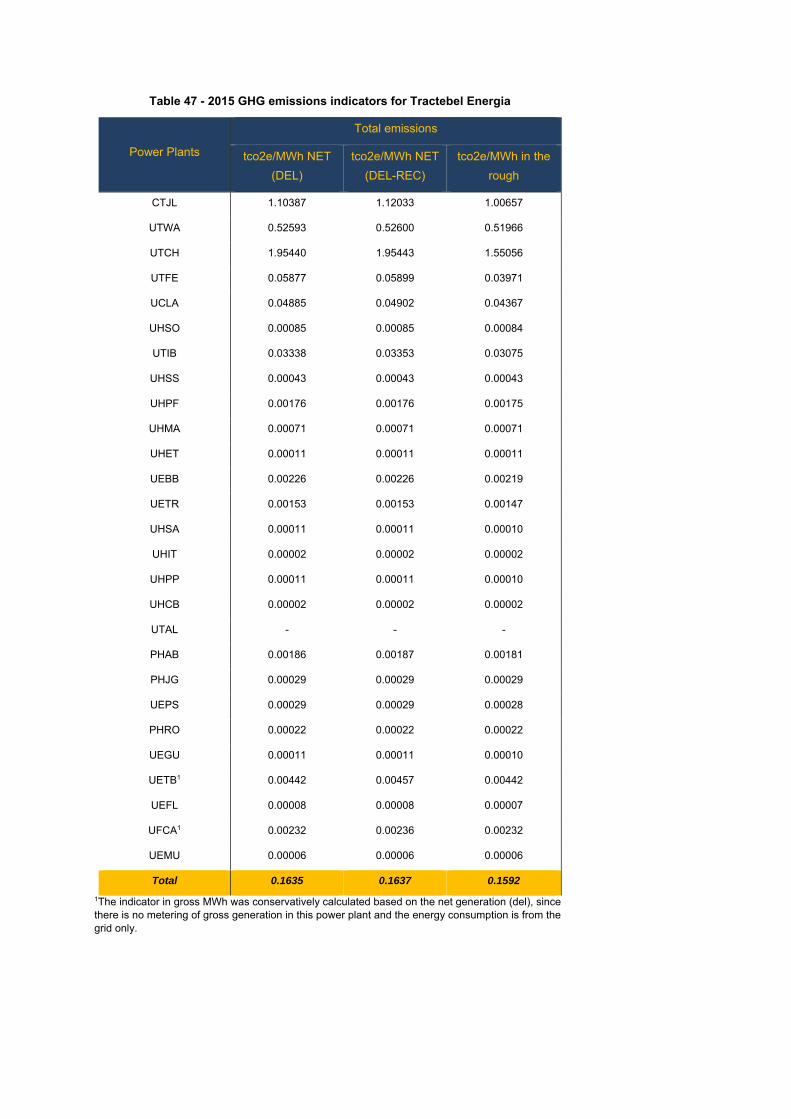
Table 47 - 2015 GHG emissions indicators for Tractebel Energia
Power Plants
Total emissions
tco2e/MWh NET
(DEL)
tco2e/MWh NET
(DEL-REC)
tco2e/MWh in the
rough
CTJL 1.10387 1.12033 1.00657
UTWA 0.52593 0.52600 0.51966
UTCH 1.95440 1.95443 1.55056
UTFE 0.05877 0.05899 0.03971
UCLA 0.04885 0.04902 0.04367
UHSO 0.00085 0.00085 0.00084
UTIB 0.03338 0.03353 0.03075
UHSS 0.00043 0.00043 0.00043
UHPF 0.00176 0.00176 0.00175
UHMA 0.00071 0.00071 0.00071
UHET 0.00011 0.00011 0.00011
UEBB 0.00226 0.00226 0.00219
UETR 0.00153 0.00153 0.00147
UHSA 0.00011 0.00011 0.00010
UHIT 0.00002 0.00002 0.00002
UHPP 0.00011 0.00011 0.00010
UHCB 0.00002 0.00002 0.00002
UTAL - - -
PHAB 0.00186 0.00187 0.00181
PHJG 0.00029 0.00029 0.00029
UEPS 0.00029 0.00029 0.00028
PHRO 0.00022 0.00022 0.00022
UEGU 0.00011 0.00011 0.00010
UETB1 0.00442 0.00457 0.00442
UEFL 0.00008 0.00008 0.00007
UFCA1 0.00232 0.00236 0.00232
UEMU 0.00006 0.00006 0.00006
Total 0.1635 0.1637 0.1592
1The indicator in gross MWh was conservatively calculated based on the net generation (del), since there is no metering of gross generation in this power plant and the energy consumption is from the grid only.
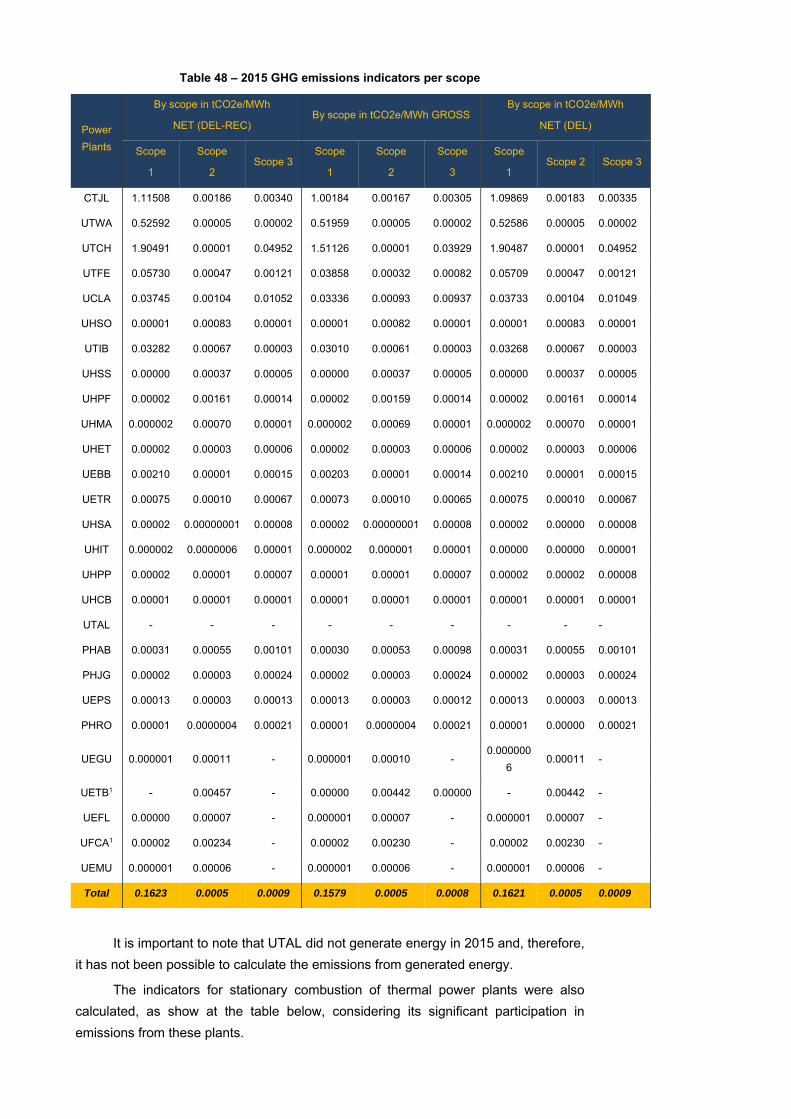
Table 48 – 2015 GHG emissions indicators per scope
Power
Plants
By scope in tCO2e/MWh
NET (DEL-REC) By scope in tCO2e/MWh GROSS
By scope in tCO2e/MWh
NET (DEL)
Scope
1
Scope
2 Scope 3
Scope
1
Scope
2
Scope
3
Scope
1 Scope 2 Scope 3
CTJL 1.11508 0.00186 0.00340 1.00184 0.00167 0.00305 1.09869 0.00183 0.00335
UTWA 0.52592 0.00005 0.00002 0.51959 0.00005 0.00002 0.52586 0.00005 0.00002
UTCH 1.90491 0.00001 0.04952 1.51126 0.00001 0.03929 1.90487 0.00001 0.04952
UTFE 0.05730 0.00047 0.00121 0.03858 0.00032 0.00082 0.05709 0.00047 0.00121
UCLA 0.03745 0.00104 0.01052 0.03336 0.00093 0.00937 0.03733 0.00104 0.01049
UHSO 0.00001 0.00083 0.00001 0.00001 0.00082 0.00001 0.00001 0.00083 0.00001
UTIB 0.03282 0.00067 0.00003 0.03010 0.00061 0.00003 0.03268 0.00067 0.00003
UHSS 0.00000 0.00037 0.00005 0.00000 0.00037 0.00005 0.00000 0.00037 0.00005
UHPF 0.00002 0.00161 0.00014 0.00002 0.00159 0.00014 0.00002 0.00161 0.00014
UHMA 0.000002 0.00070 0.00001 0.000002 0.00069 0.00001 0.000002 0.00070 0.00001
UHET 0.00002 0.00003 0.00006 0.00002 0.00003 0.00006 0.00002 0.00003 0.00006
UEBB 0.00210 0.00001 0.00015 0.00203 0.00001 0.00014 0.00210 0.00001 0.00015
UETR 0.00075 0.00010 0.00067 0.00073 0.00010 0.00065 0.00075 0.00010 0.00067
UHSA 0.00002 0.00000001 0.00008 0.00002 0.00000001 0.00008 0.00002 0.00000 0.00008
UHIT 0.000002 0.0000006 0.00001 0.000002 0.000001 0.00001 0.00000 0.00000 0.00001
UHPP 0.00002 0.00001 0.00007 0.00001 0.00001 0.00007 0.00002 0.00002 0.00008
UHCB 0.00001 0.00001 0.00001 0.00001 0.00001 0.00001 0.00001 0.00001 0.00001
UTAL - - - - - - - - -
PHAB 0.00031 0.00055 0.00101 0.00030 0.00053 0.00098 0.00031 0.00055 0.00101
PHJG 0.00002 0.00003 0.00024 0.00002 0.00003 0.00024 0.00002 0.00003 0.00024
UEPS 0.00013 0.00003 0.00013 0.00013 0.00003 0.00012 0.00013 0.00003 0.00013
PHRO 0.00001 0.0000004 0.00021 0.00001 0.0000004 0.00021 0.00001 0.00000 0.00021
UEGU 0.000001 0.00011 - 0.000001 0.00010 - 0.000000
6 0.00011 -
UETB1 - 0.00457 - 0.00000 0.00442 0.00000 - 0.00442 -
UEFL 0.00000 0.00007 - 0.000001 0.00007 - 0.000001 0.00007 -
UFCA1 0.00002 0.00234 - 0.00002 0.00230 - 0.00002 0.00230 -
UEMU 0.000001 0.00006 - 0.000001 0.00006 - 0.000001 0.00006 -
Total 0.1623 0.0005 0.0009 0.1579 0.0005 0.0008 0.1621 0.0005 0.0009
It is important to note that UTAL did not generate energy in 2015 and, therefore,
it has not been possible to calculate the emissions from generated energy.
The indicators for stationary combustion of thermal power plants were also
calculated, as show at the table below, considering its significant participation in
emissions from these plants.
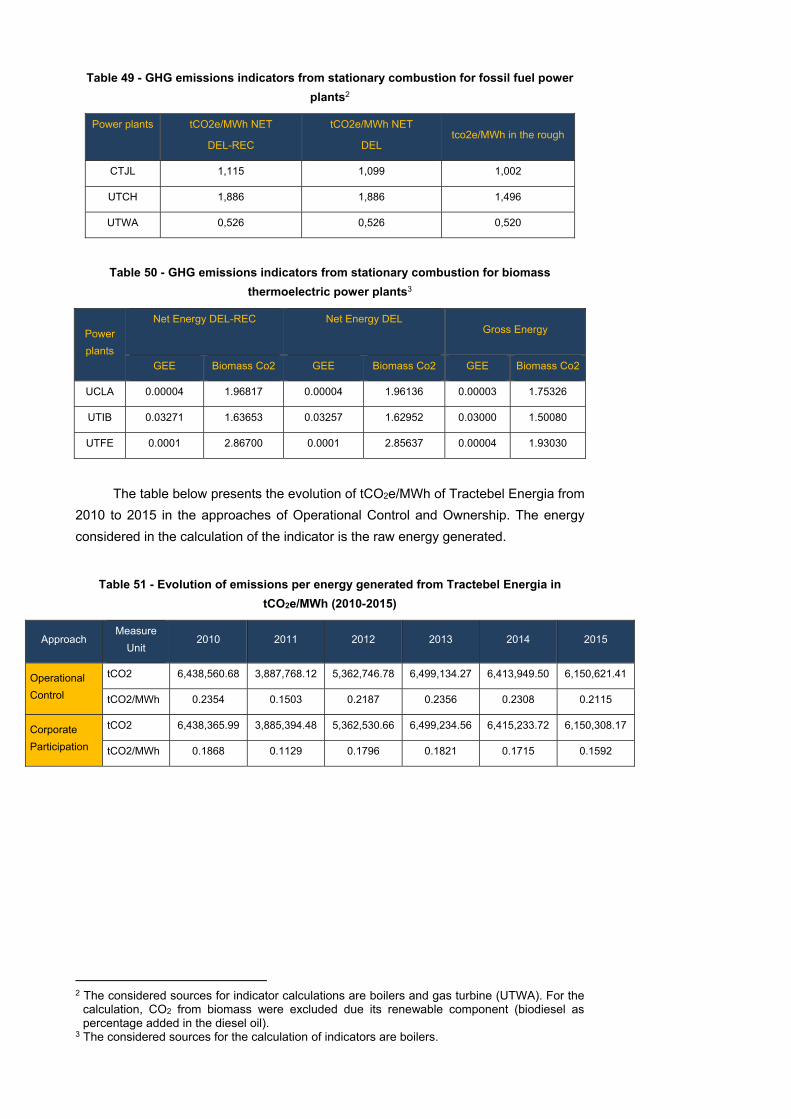
Table 49 - GHG emissions indicators from stationary combustion for fossil fuel power
plants2
Power plants tCO2e/MWh NET
DEL-REC
tCO2e/MWh NET
DEL tco2e/MWh in the rough
CTJL 1,115 1,099 1,002
UTCH 1,886 1,886 1,496
UTWA 0,526 0,526 0,520
Table 50 - GHG emissions indicators from stationary combustion for biomass
thermoelectric power plants3
Power
plants
Net Energy DEL-REC
Net Energy DEL
Gross Energy
GEE Biomass Co2 GEE Biomass Co2 GEE Biomass Co2
UCLA 0.00004 1.96817 0.00004 1.96136 0.00003 1.75326
UTIB 0.03271 1.63653 0.03257 1.62952 0.03000 1.50080
UTFE 0.0001 2.86700 0.0001 2.85637 0.00004 1.93030
The table below presents the evolution of tCO2e/MWh of Tractebel Energia from
2010 to 2015 in the approaches of Operational Control and Ownership. The energy
considered in the calculation of the indicator is the raw energy generated.
Table 51 - Evolution of emissions per energy generated from Tractebel Energia in
tCO2e/MWh (2010-2015)
Approach Measure
Unit 2010 2011 2012 2013 2014 2015
Operational
Control
tCO2 6,438,560.68 3,887,768.12 5,362,746.78 6,499,134.27 6,413,949.50 6,150,621.41
tCO2/MWh 0.2354 0.1503 0.2187 0.2356 0.2308 0.2115
Corporate
Participation
tCO2 6,438,365.99 3,885,394.48 5,362,530.66 6,499,234.56 6,415,233.72 6,150,308.17
tCO2/MWh 0.1868 0.1129 0.1796 0.1821 0.1715 0.1592
2 The considered sources for indicator calculations are boilers and gas turbine (UTWA). For the
calculation, CO2 from biomass were excluded due its renewable component (biodiesel as percentage added in the diesel oil).
3 The considered sources for the calculation of indicators are boilers.
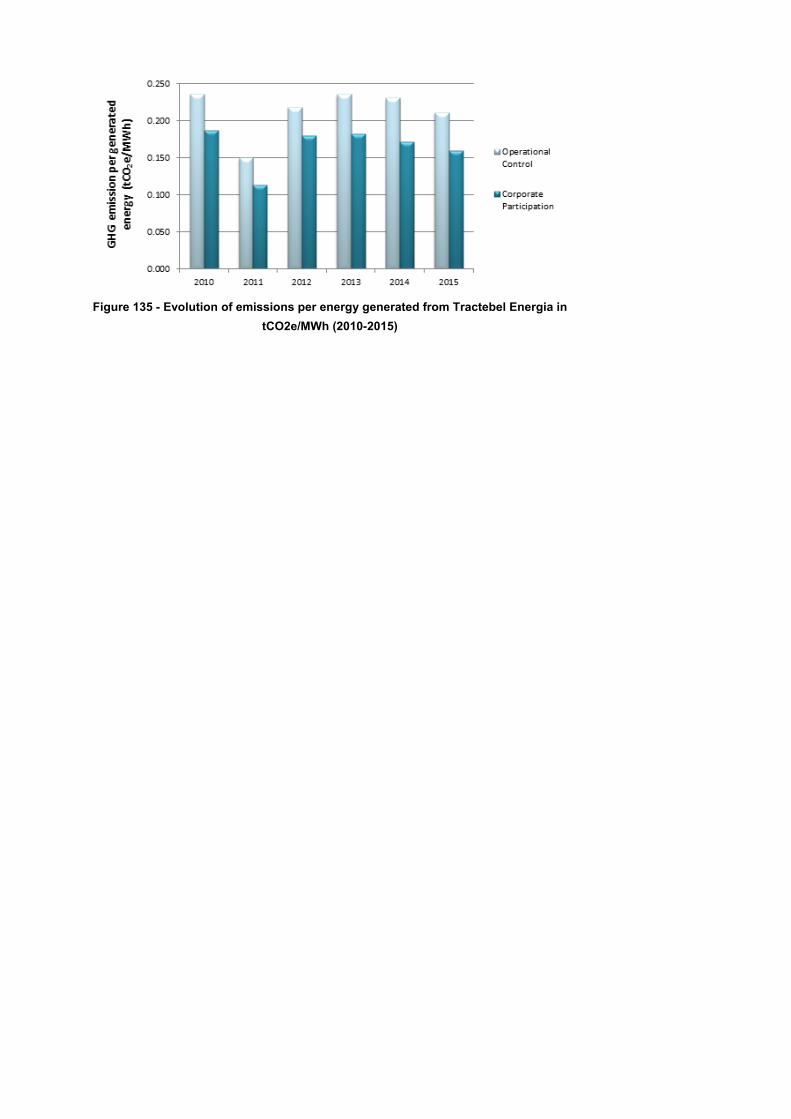
Figure 135 - Evolution of emissions per energy generated from Tractebel Energia in
tCO2e/MWh (2010-2015)
9. Emission Reduction Opportunities
The biggest source of greenhouse gases detected in this inventory is the
stationary combustion, responsible for over 99% of emissions. Therefore, emission
reduction efforts must be focused on this activity. To this end, it is suggested
investments in Research and Development (R&D) projects for the replacement of the
fossil fuel used in thermal power plants for biomass. Moreover, the continous
investment in improvement of efficiency of boilers used in order to decrease the fuel
consumption can be an alternative environmentally and economically attractive.
In addition, it was observed that, in terms of installed power, 86.6% of the plants
in operation come from renewable sources. The prioritization of investment in
renewable energy projects such as hydropower plants, wind, solar and biomass is
important and it should aim at renewable energy certificates and/or carbon credits.
Considering the other emission sources not as representative, some initiatives
aiming at reducing emissions can be considered. In the case of the transport of
employees, raw material and residues, an alternative would be the use of biofuels,
such as ethanol and biodiesel, the use of gasoline and diesel. In the case of transport
of employees and directors, the teleconference system should be maintained for the
reduction of the number of air travel, which also involves a possibility of reducing costs
and improving efficiency and management.
Another important point is the awareness and sensitizing employees to
emission reduction initiatives. For this, it is proposed the development of training and
lectures, as well as the dissemination of posters stimulating sustainable attitudes. The
contractors to provide services or raw material to Tractebel Energia also must be
engaged to perform attitudes aiming this initiative. It is suggested that, to the extent
possible, Tractebel Energia request these companies to report their emissions of
greenhouse gases, as well as to present an emissions reduction plan.
Another measure would be to increase the area for planting seedlings, a
practice that is already used in some power plants. Another way to neutralize these
unavoidable emissions is by obtaining carbon credits in the voluntary market.
10. Suggestion for Improvement
Considering the principles for accounting and inventory of the GHG Protocol –
relevance, completeness, consistency, transparency and accuracy –some points were
identified for improvement of future inventories:
Consideration of a greater number of data and information on the basis of
documents that have lower level of uncertainty, such as invoices, ensuring
data accuracy and targeting future audits;
Preparation of procedures and automated/systematic internal controls
aimed at obtaining faster and consistent data and information;
Detail of sources of emission in the worksheets collection, mostly
stationary and mobile combustion, for the correct identification of emission
sources associated with each plant/Office of Tractebel Energia.
We suggest that these procedures and controls should consider:
Monitoring of data and information regarding mobile combustion, such as
routes, distances, spending on fuel consumption, fuel type, among others,
reducing the reliance on data and third-party controls;
Monitoring of information on third-party treatment of Tractebel Energia
waste pits.
11. References
AGRAWALA, S. Explaining the Evolution of the IPCC Structure and Process. PRSP
Discussion Paper E-97-05, Kennedy School of Government, Harvard University,
1997.
ANP. Rules on the mandatory percentage of biodiesel addition to diesel oil. National
Agency of petroleum and Natural gas and Biofuels.
ASHRAE 2010. Designation and Safety Classification of Refrigerants. ANSI/ASHRAE
Standard 34-2010.
BRAZIL. LAW NO. 13033, OF 24 SEPTEMBER 2014. Rules on the mandatory
addition of biodiesel in the diesel fuel sold to the final consumer. Diário Oficial
da União, Brasília, DF, 24 Sept. 2014.
DEFRA. "2013 Guidelines to DEFRA/DECC's GHG Conversion Factors for Company
Reporting".
ELETROBRÁS. Inventory of greenhouse gas emissions-base year 2011. Jun 2012.
EMBRAPA. Brazil's climate database.
Ghg Protocol. Corporate Value Chain (Scope 3). Accounting and Reporting Standard,
2011. Available at:
http://www.ghgprotocol.org/files/ghgp/public/Corporate%20Value%20Chain%20
%28Scope3%29_EReader.pdf.
Ghg Protocol. GHG Uncertainty tool. September 2003. Available at:
<http://www.ghgprotocol.org/calculation-tools/all-tools>.
HOUGHTON, J.T. et al. (eds.) IPCC First Assessment Report 1990 (FAR). Cambridge
University Press, UK 1990. Available at: <
https://www.ipcc.ch/publications_and_data/publications_and_data_reports.shtm
l >.
HOUGHTON, J.T. Global Warming: The complete briefing. Cambridge University
Press, UK, 1997.
ICOPT. "Energy and Global Warming Impacts of Next Generation Refrigeration and
Air Conditioning Technologies". International Conference on Ozone Protection
Technologies in Washington, DC, ICOPT, 21-23 October 1996. Available at: <
http://www.osti.gov/bridge/servlets/purl/402297/402297.pdf >.
IPCC. Summary for 7. In: Climate Change 2007: The Physical Science Basis.
Contribution of Working Group I to the Fourth Assessment Report of the
Intergovernmental Panel on Climate Change, 2007a.
______. Climate Change 2007: Mitigation of Climate Change. Contribution of Working
Group III to the Fourth Assessment Report (AR4) of the Intergovernmental
Panel on Climate Change, 2007. [(B). Metz, O.R. Davidson, P.R. Bosch, R.
Dave, L.A. Meyer (eds)]. Cambridge University Press, Cambridge, United
Kingdom and New York, NY, USA, 2007b.
______. IPCC Fourth Assessment Report: Climate Change 2007 (AR4). Available at:
<
https://www.ipcc.ch/publications_and_data/publications_and_data_reports.shtm
l >.
______. 2006 IPCC Guidelines for National Greenhouse Gas Inventories. Available at:
<http://www.ipcc-nggip.iges.or.jp/public/2006gl/>.
______. IPCC Third Assessment Report: Climate Change 2001 (TAR). Available at: <
https://www.ipcc.ch/publications_and_data/publications_and_data_reports.shtm
l >.
______. Second Assessment Report: Climate Change 1995 (SAR). Climate Change
1995 — The Science of Climate Change, Contribution of Working Group I to the
Second Assessment Report of the Intergovernmental Panel on Climate
Change. Editors J.J. Houghton, L.G. First Son, IS. A. Callander, N. Harris, A.
Kattenberg and K. Maskell, 1996.
Kalkreuth, W. et al. Petrology and chemistry of Permian coals from the Paraná Basin:
1. Santa Terezinha, lion-Butia and Candiota Coalfields, Rio Grande do Sul,
Brazil. International Journal of Coal Geology 68 (2006) 79-116 ELSEVIER.
Accepted on 24 Oct 2005.
MAP. Rules on the compulsory percentage addition of anhydrous ethyl alcohol fuel to
gasoline. Ministry of State for agriculture, livestock and food supply.
MCTI. CO2 emission factors for electricity generation in the national interconnected
System of Brazil for inventories. Ministry of science, technology and innovation.
Available at: < http://www.mct.gov.br/index.php/content/view/72764.html >.
Accessed on 05 mar 2016.
NCASI (2010). Life Cycle Assessment of North American Printing and Writing Paper
Products.
SCHIMIDHEINY, S. et all. Walking the talk: the business case for sustainable
development. August, 2002, 288 p.
SCHNEIDER, S.H. The changing climate. Scientific American, vol. 261, no. 3, 1989.
SKOOG, D. A.; WEST, D. M.; HOLLER, F. J. Fundamentals of analytical chemistry.
Publisher Thomson Pioneer, 1 Edition, p. 244-248, 2005.
TRACTEBEL ENERGIA. Company data, historical and generator Park. Available at: <
http://www.tractebelenergia.com.br/>.
UNDP. World Energy Assessment: Energy and the challenge of sustainability. United
Nations Development Programme, United Nations Department of Economic and
Social Affairs, World Energy Council [Edited by J. Goldemberg], 2000.
UNFCCC. Approved Baseline and Monitoring Methodologies for CDM Project
Activities Large Scale. Available at: <
http://cdm.unfccc.int/methodologies/PAmethodologies/approved >.
UNITED NATIONS. Kyoto Protocol. The United Nations Framework Convention on
Climate Change, 1997.
UNEP. Capacity Development for the Clean Development Mechanism (CD4CDM).
United Nations Environment Programme (UNEP). Status in Oct 2012.
VOTORANTIM CIMENTOS BRASIL LTDA. 006 (NBR 14725) MSDS-Dolomitic
Limestone, 2009.
WCED. Our Common Future. The World Commission on Environment and
Development. Oxford University Press, 1987.
WRI/FGV. Check specifications of the Brazilian GHG Protocol program. Aug 2011.

WRI/FGV. Accounting, Quantifying and Publication of Corporate Inventories of
greenhouse gas emissions. Second Edition.
WRI/WBCSD. Corporate Value Chain (Scope 3). Ghg Protocol. Accounting and
Reporting Standard, 2011. Available at: <
http://www.ghgprotocol.org/files/ghgp/public/Corporate%20Value%20Chain%20
%28Scope3%29_EReader.pdf >.

Annex I. Total emissions by gas type and source
Tractebel Energia emissions by gas type and source in the approaches of
Operational Control and Corporate Participation are presented below.
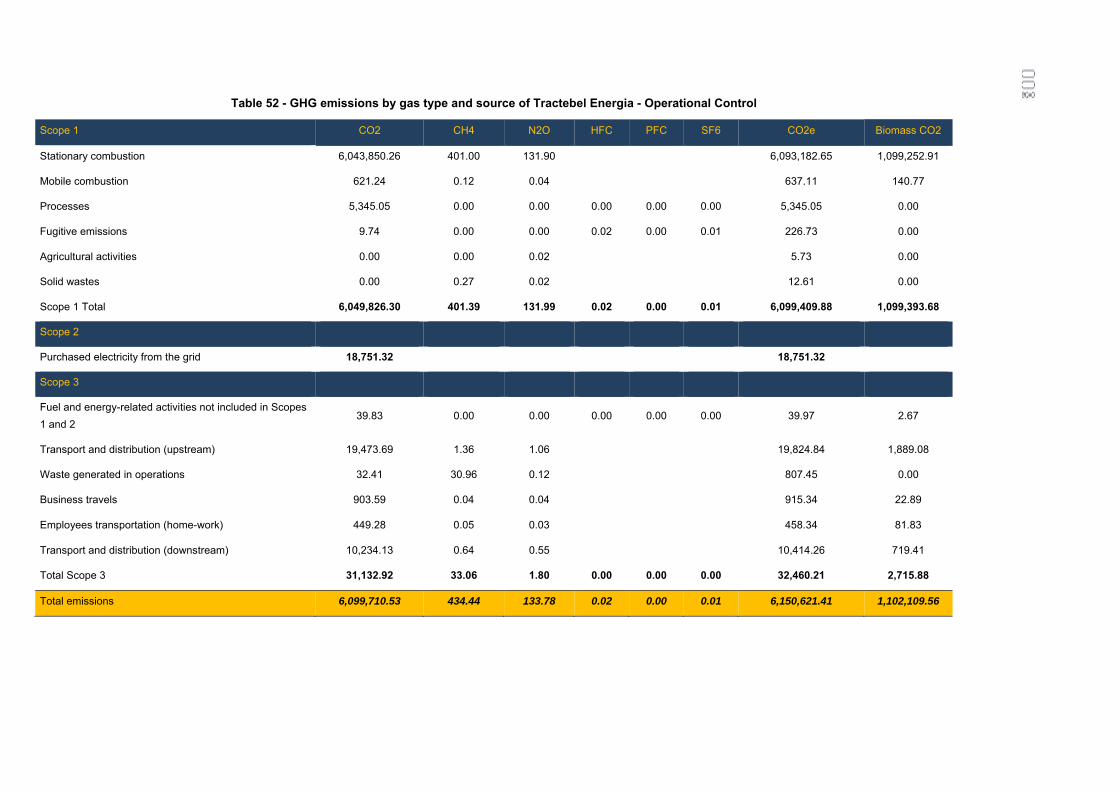
Table 52 - GHG emissions by gas type and source of Tractebel Energia - Operational Control
Scope 1 CO2 CH4 N2O HFC PFC SF6 CO2e Biomass CO2
Stationary combustion 6,043,850.26 401.00 131.90 6,093,182.65 1,099,252.91
Mobile combustion 621.24 0.12 0.04 637.11 140.77
Processes 5,345.05 0.00 0.00 0.00 0.00 0.00 5,345.05 0.00
Fugitive emissions 9.74 0.00 0.00 0.02 0.00 0.01 226.73 0.00
Agricultural activities 0.00 0.00 0.02 5.73 0.00
Solid wastes 0.00 0.27 0.02 12.61 0.00
Scope 1 Total 6,049,826.30 401.39 131.99 0.02 0.00 0.01 6,099,409.88 1,099,393.68
Scope 2
Purchased electricity from the grid 18,751.32 18,751.32
Scope 3
Fuel and energy-related activities not included in Scopes
1 and 2 39.83 0.00 0.00 0.00 0.00 0.00 39.97 2.67
Transport and distribution (upstream) 19,473.69 1.36 1.06 19,824.84 1,889.08
Waste generated in operations 32.41 30.96 0.12 807.45 0.00
Business travels 903.59 0.04 0.04 915.34 22.89
Employees transportation (home-work) 449.28 0.05 0.03 458.34 81.83
Transport and distribution (downstream) 10,234.13 0.64 0.55 10,414.26 719.41
Total Scope 3 31,132.92 33.06 1.80 0.00 0.00 0.00 32,460.21 2,715.88
Total emissions 6,099,710.53 434.44 133.78 0.02 0.00 0.01 6,150,621.41 1,102,109.56

Table 53 - GHG emissions by gas type and source of Tractebel Energia-Corporate Participation
Scope 1 CO2 CH4 N2O HFC PFC SF6 CO2e CO2 from biomass
Stationary combustion 6,043,859.73 377.31 128.74 6,091,658.38 1,022,512.27
Mobile combustion 641.99 0.13 0.04 658.51 154.16
Processes 5,345.05 0.00 0.00 0.00 0.00 0.00 5,345.05 0.00
Fugitive emissions 10.00 0.00 0.00 0.02 0.00 0.01 236.13 0.00
Agricultural activities 0.00 0.00 0.03 8.30 0.00
Solid wastes 0.00 0.28 0.02 12.89 0.00
Total Scope 1 6,049,856.78 377.71 128.84 0.02 0.00 0.01 6,097,919.26 1,022,666.44
Scope 2
Purchased electricity from the grid 19,709.00 19,709.00
Scope 3
Fuel and energy-related activities not included in Scopes
1 and 2 39.83 0.00 0.00 0.00 0.00 0.00 39.97 2.67
Transport and distribution (upstream) 19,575.95 1.37 1.07 19,929.93 1,764.06
Waste generated in operations 32.41 31.31 0.12 816.05 0.00
Business travels 968.59 0.04 0.04 981.16 24.46
Employees transportation (home-work) 488.77 0.05 0.03 498.53 84.60
Transport and distribution (downstream) 10,234.13 0.64 0.55 10,414.26 719.41
Total Scope 3 31,339.68 33.42 1.81 0.00 0.00 0.00 32,679.90 2,595.21
Total emissions 6,100,905.45 411.13 130.65 0.02 0.00 0.01 6,150,308.17 1,025,261.65
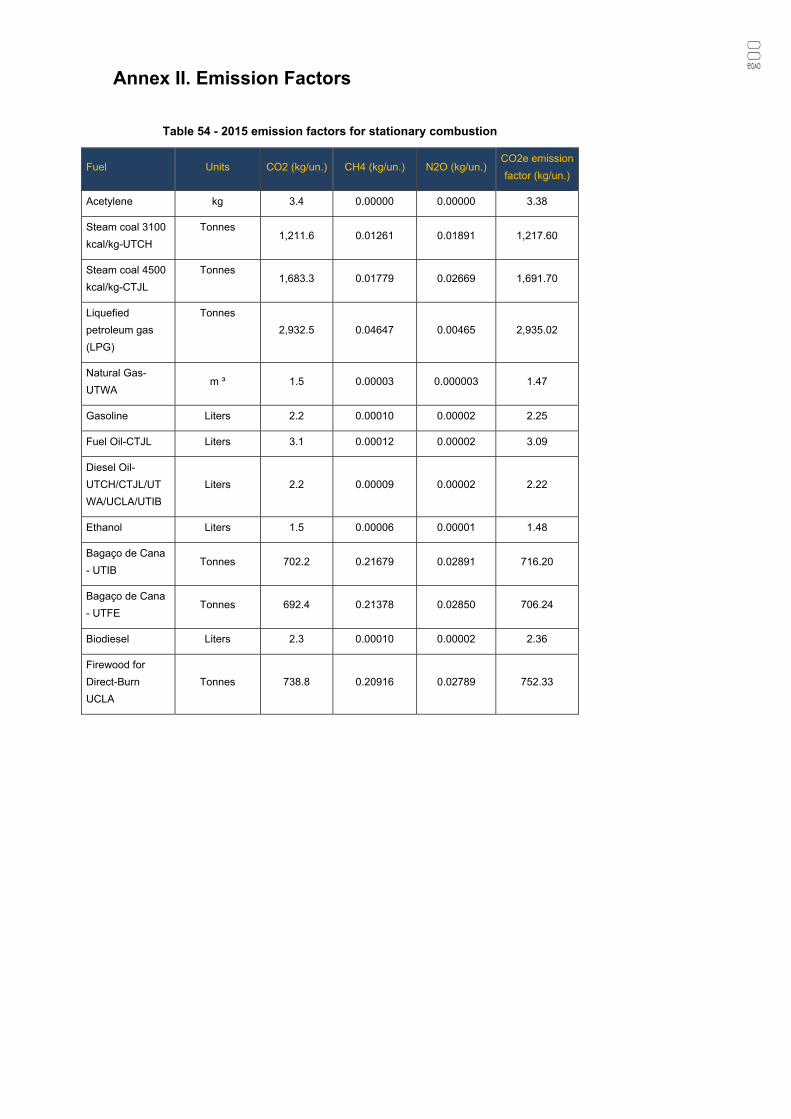
Annex II. Emission Factors
Table 54 - 2015 emission factors for stationary combustion
Fuel Units CO2 (kg/un.) CH4 (kg/un.) N2O (kg/un.) CO2e emission
factor (kg/un.)
Acetylene kg 3.4 0.00000 0.00000 3.38
Steam coal 3100
kcal/kg-UTCH
Tonnes 1,211.6 0.01261 0.01891 1,217.60
Steam coal 4500
kcal/kg-CTJL
Tonnes 1,683.3 0.01779 0.02669 1,691.70
Liquefied
petroleum gas
(LPG)
Tonnes
2,932.5 0.04647 0.00465 2,935.02
Natural Gas-
UTWA m ³ 1.5 0.00003 0.000003 1.47
Gasoline Liters 2.2 0.00010 0.00002 2.25
Fuel Oil-CTJL Liters 3.1 0.00012 0.00002 3.09
Diesel Oil-
UTCH/CTJL/UT
WA/UCLA/UTIB
Liters 2.2 0.00009 0.00002 2.22
Ethanol Liters 1.5 0.00006 0.00001 1.48
Bagaço de Cana
- UTIB Tonnes 702.2 0.21679 0.02891 716.20
Bagaço de Cana
- UTFE Tonnes 692.4 0.21378 0.02850 706.24
Biodiesel Liters 2.3 0.00010 0.00002 2.36
Firewood for
Direct-Burn
UCLA
Tonnes 738.8 0.20916 0.02789 752.33
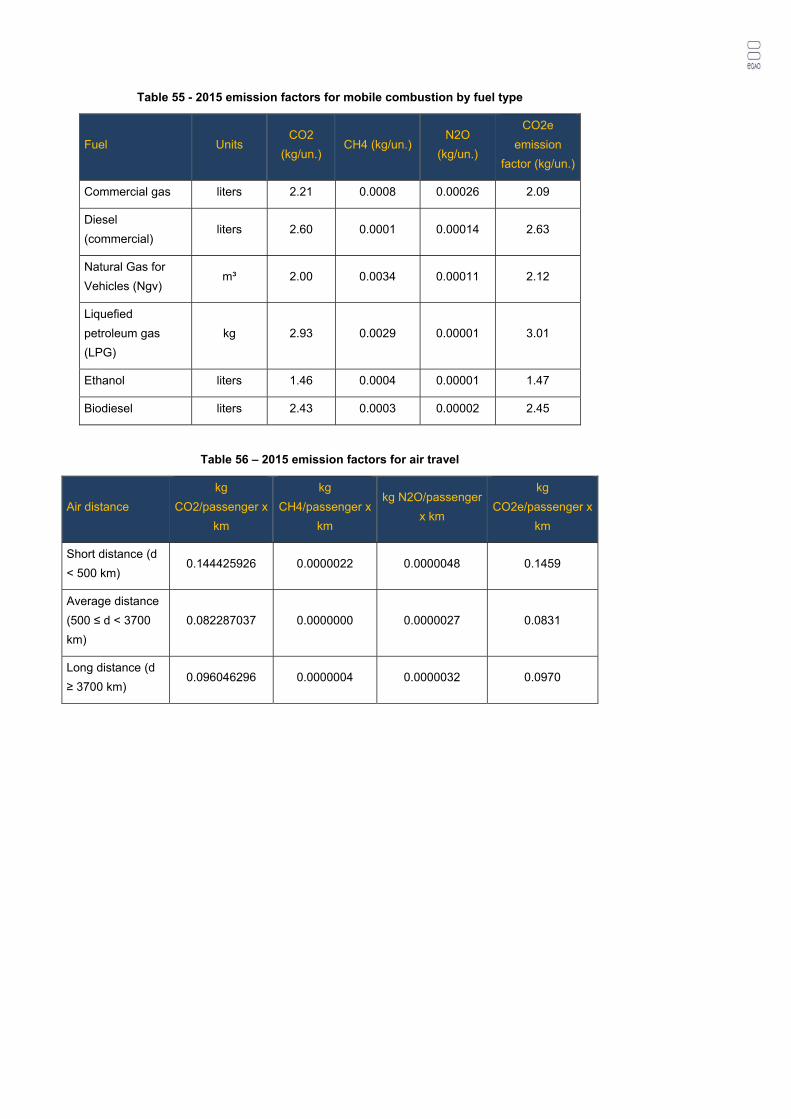
Table 55 - 2015 emission factors for mobile combustion by fuel type
Fuel Units CO2
(kg/un.) CH4 (kg/un.)
N2O
(kg/un.)
CO2e
emission
factor (kg/un.)
Commercial gas liters 2.21 0.0008 0.00026 2.09
Diesel
(commercial) liters 2.60 0.0001 0.00014 2.63
Natural Gas for
Vehicles (Ngv) m³ 2.00 0.0034 0.00011 2.12
Liquefied
petroleum gas
(LPG)
kg 2.93 0.0029 0.00001 3.01
Ethanol liters 1.46 0.0004 0.00001 1.47
Biodiesel liters 2.43 0.0003 0.00002 2.45
Table 56 – 2015 emission factors for air travel
Air distance
kg
CO2/passenger x
km
kg
CH4/passenger x
km
kg N2O/passenger
x km
kg
CO2e/passenger x
km
Short distance (d
< 500 km) 0.144425926 0.0000022 0.0000048 0.1459
Average distance
(500 ≤ d < 3700
km)
0.082287037 0.0000000 0.0000027 0.0831
Long distance (d
≥ 3700 km) 0.096046296 0.0000004 0.0000032 0.0970
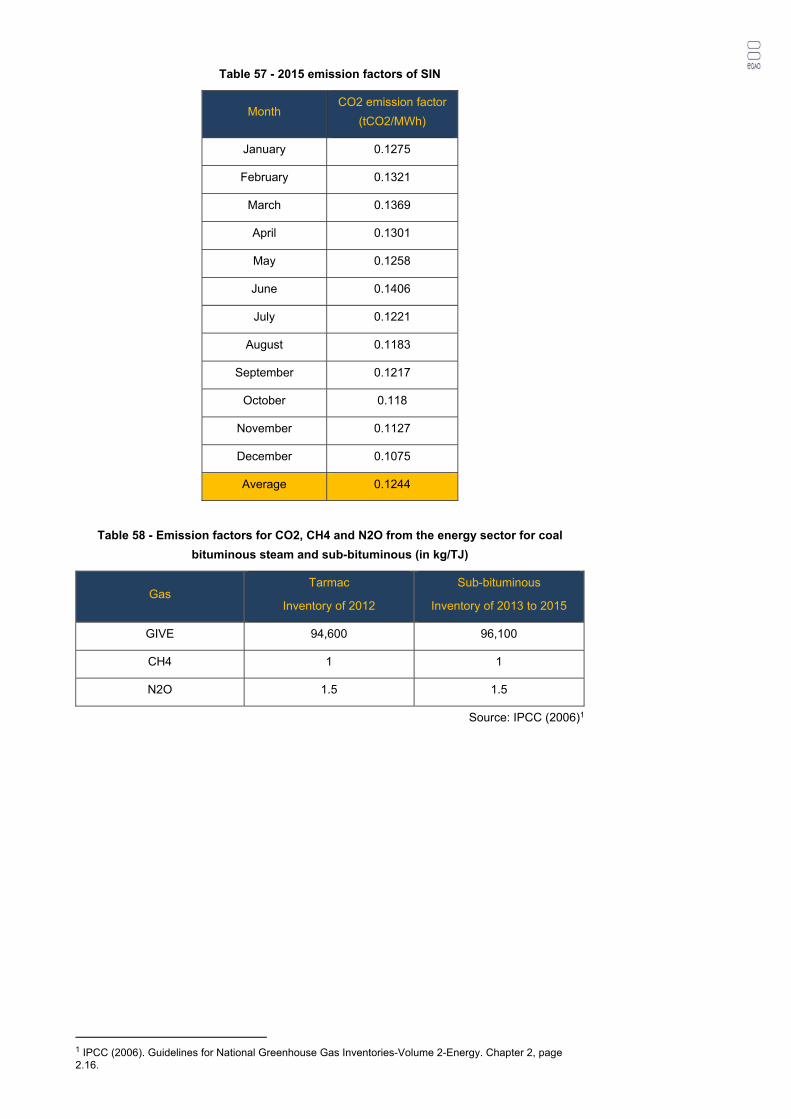
Table 57 - 2015 emission factors of SIN
Month CO2 emission factor
(tCO2/MWh)
January 0.1275
February 0.1321
March 0.1369
April 0.1301
May 0.1258
June 0.1406
July 0.1221
August 0.1183
September 0.1217
October 0.118
November 0.1127
December 0.1075
Average 0.1244
Table 58 - Emission factors for CO2, CH4 and N2O from the energy sector for coal
bituminous steam and sub-bituminous (in kg/TJ)
Gas Tarmac
Inventory of 2012
Sub-bituminous
Inventory of 2013 to 2015
GIVE 94,600 96,100
CH4 1 1
N2O 1.5 1.5
Source: IPCC (2006)1
1 IPCC (2006). Guidelines for National Greenhouse Gas Inventories-Volume 2-Energy. Chapter 2, page 2.16.
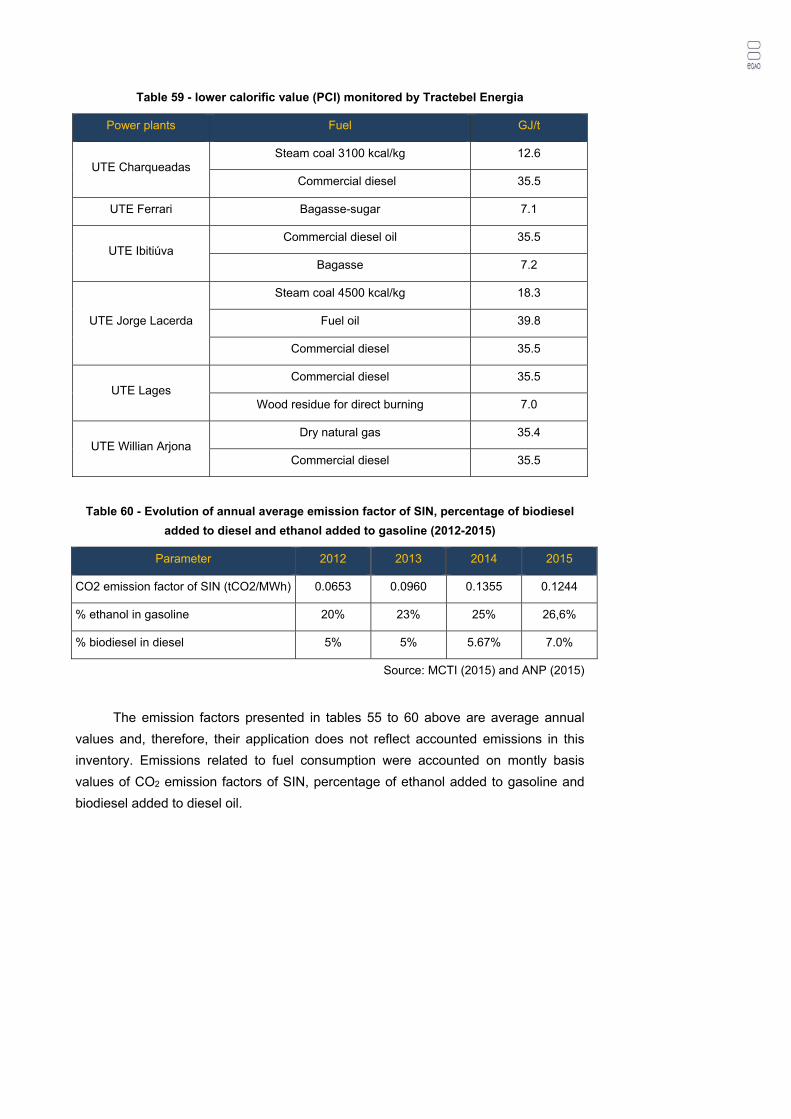
Table 59 - lower calorific value (PCI) monitored by Tractebel Energia
Power plants Fuel GJ/t
UTE Charqueadas Steam coal 3100 kcal/kg 12.6
Commercial diesel 35.5
UTE Ferrari Bagasse-sugar 7.1
UTE Ibitiúva Commercial diesel oil 35.5
Bagasse 7.2
UTE Jorge Lacerda
Steam coal 4500 kcal/kg 18.3
Fuel oil 39.8
Commercial diesel 35.5
UTE Lages Commercial diesel 35.5
Wood residue for direct burning 7.0
UTE Willian Arjona Dry natural gas 35.4
Commercial diesel 35.5
Table 60 - Evolution of annual average emission factor of SIN, percentage of biodiesel
added to diesel and ethanol added to gasoline (2012-2015)
Parameter 2012 2013 2014 2015
CO2 emission factor of SIN (tCO2/MWh) 0.0653 0.0960 0.1355 0.1244
% ethanol in gasoline 20% 23% 25% 26,6%
% biodiesel in diesel 5% 5% 5.67% 7.0%
Source: MCTI (2015) and ANP (2015)
The emission factors presented in tables 55 to 60 above are average annual
values and, therefore, their application does not reflect accounted emissions in this
inventory. Emissions related to fuel consumption were accounted on montly basis
values of CO2 emission factors of SIN, percentage of ethanol added to gasoline and
biodiesel added to diesel oil.
Annex III. Additional Methodologies
(a) Use of fertilizers
GHG emissions from the use of fertilizers are essentially related to the
generation of nitrous oxide (N2O). Nitrous oxide is produced during denitrification,
microbial process when anaerobic bacteria use nitrate (NO3-) as a final electron
acceptor in substitution to oxygen (O2). This process occurs under conditions of
anoxia, being favored by the availability of carbon and the presence of NO3- from the
mineralization of soil organic matter and the application of organic and mineral
fertilizers.
The methodology used to estimate emissions of N2O from agricultural soils
following the IPCC (2006). Direct emissions of N2O from agricultural soils, according to
the more general method ("Tier 1"), are calculated by the following formula2:
N2ODirect-N = N2O - NNinputs + N2O-NOS + N2O-NPRP
Where:
N2ODirect-N = Annual direct emissions of N2O from agricultural soils, in kg N-N2O
yr-1
N2O-NNinputs = Annual direct emissions of N-N2O-N of N applied as fertilizer to the
soil, in kg N-N2O- yr-1
N2O-NOS = Annual direct emissions of N-N2O organic soil grown in kg N-N2O
yr-1
N2O-NPRP = Annual direct emissions of N-N2O of manure intentionally applied
to the soil, in kg N-N2O yr-1
Assuming no application of manures and, either growing in organic soils, only
the portion of N applied as fertilizer to the soil will be considered.
N2O-NNinputs = (FSN + FON + FCR + FSOM) × EF1
Where:
FSN = Annual amount of N in synthetic fertilizer nitrogen applied to the soil, in
kg N yr-1
FON = Annual quantity of N in manures, compost, sewage sludge and other
additions of organic N applied to the soil, in kg N yr-1
FCR = Quantity of N in crop residues that return annually to the soil, in kg N yr-
1
FSOM = Quantity of N in mineral soil that is mineralized, in kg N yr-1
EF1 = Direct N2O emission factor applied to the quantities of N added to soils,
in kg N yr-1
The amounts of nutrients and fertilizers specifications in Brazil follow the
requirements of the Normative Statement of the Ministério da Agricultura, Pecuária e
2 N2O = N-N2O × 44 ÷ 28
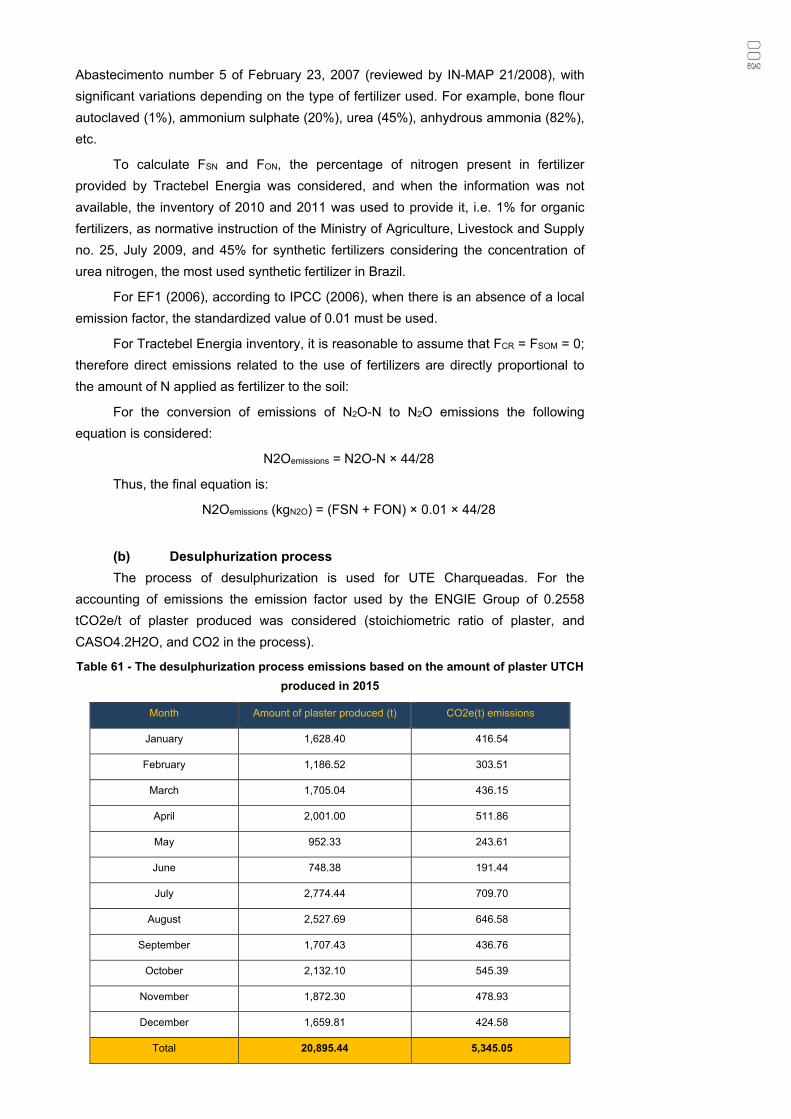
Abastecimento number 5 of February 23, 2007 (reviewed by IN-MAP 21/2008), with
significant variations depending on the type of fertilizer used. For example, bone flour
autoclaved (1%), ammonium sulphate (20%), urea (45%), anhydrous ammonia (82%),
etc.
To calculate FSN and FON, the percentage of nitrogen present in fertilizer
provided by Tractebel Energia was considered, and when the information was not
available, the inventory of 2010 and 2011 was used to provide it, i.e. 1% for organic
fertilizers, as normative instruction of the Ministry of Agriculture, Livestock and Supply
no. 25, July 2009, and 45% for synthetic fertilizers considering the concentration of
urea nitrogen, the most used synthetic fertilizer in Brazil.
For EF1 (2006), according to IPCC (2006), when there is an absence of a local
emission factor, the standardized value of 0.01 must be used.
For Tractebel Energia inventory, it is reasonable to assume that FCR = FSOM = 0;
therefore direct emissions related to the use of fertilizers are directly proportional to
the amount of N applied as fertilizer to the soil:
For the conversion of emissions of N2O-N to N2O emissions the following
equation is considered:
N2Oemissions = N2O-N × 44/28
Thus, the final equation is:
N2Oemissions (kgN2O) = (FSN + FON) × 0.01 × 44/28
(b) Desulphurization process
The process of desulphurization is used for UTE Charqueadas. For the
accounting of emissions the emission factor used by the ENGIE Group of 0.2558
tCO2e/t of plaster produced was considered (stoichiometric ratio of plaster, and
CASO4.2H2O, and CO2 in the process).
Table 61 - The desulphurization process emissions based on the amount of plaster UTCH
produced in 2015
Month Amount of plaster produced (t) CO2e(t) emissions
January 1,628.40 416.54
February 1,186.52 303.51
March 1,705.04 436.15
April 2,001.00 511.86
May 952.33 243.61
June 748.38 191.44
July 2,774.44 709.70
August 2,527.69 646.58
September 1,707.43 436.76
October 2,132.10 545.39
November 1,872.30 478.93
December 1,659.81 424.58
Total 20,895.44 5,345.05
(c) Use of acetylene
Acetylene (C2H2) is commonly used for welding due to the low cost and power,
and its combustion emits CO2. Whereas some plants of Tractebel use acetylene for
welding due to equipment maintenance, that source should be considered for GHG
emissions inventory.
The balanced equation of combustion process of acetylene is presented below:
C2H2 + 5/2 O2 2CO2 + H2O
In this way, for the combustion of 1 (one) acetylene binding, 2 (two) molecules
of CO2 are emitted, i.e. for every 26g C2H2 burnt, 88g CO2 are emitted. Thus, the
emission factor considered for the use of acetylene is 88gCO2/26gC2H2 = 3.385
gCO2/gC2H2.
(d) Incineration
Waste incineration is defined as the controlled combustion of solid and liquid
waste within facilities. According to the IPCC (2006), during the incineration and open
burning of waste, CO2, CH4 and N2O are emitted. The quantities issued to each gas
depends on the type of waste, burning temperature, type of incineration/technology,
management practices, among others.
Generally, CO2 is emitted in greater quantity for both incineration and burning
out in the open. CH4 is emitted from the incomplete burning of the waste
combustion/and is relevant in the case of open burning. N2O is emitted between
temperatures ranging between 500 and 950ºC. So, regarding incineration emissions
are calculated according to the equation below:
Emissionsres = CO2Emissions+ CH4Emissions + N2OEmissions
According to a more general method (Tier 1), CO2 emissions can be estimated
according to the equation below.
CO2Emissions = ∑ (SWi x dmi x CFi x FCFi x OFi) x 44/12
Where:
CO2Emissions = Annual CO2 emissions, Gg/year
SWi = Total amount of solid waste type i (wet weight) incinerated or burnt
in the open (fraction)
dmi = Dry matter content in the waste (wet weight) incinerated or burnt in
the open (fraction)
CFi = Carbon fraction in dry matter (total carbon content) (fraction)
FCFi = Fraction of fossil carbon in the total carbon (fraction)
OFi = Oxidation factor (fraction)
44/12 = Conversion factor from C to CO2
i = Type of waste incinerated/burnt out in the open: urban solid waste,
industrial waste, sewage sludge, hazardous waste, clinical waste,
other (must be specified).
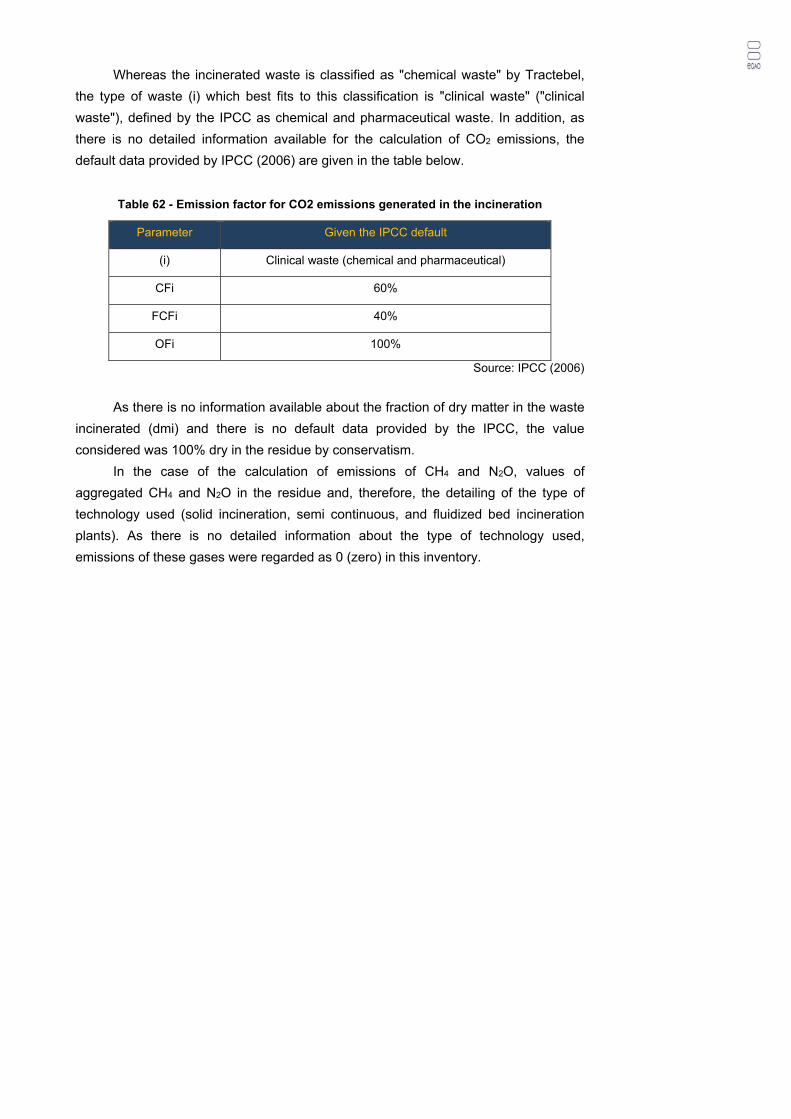
Whereas the incinerated waste is classified as "chemical waste" by Tractebel,
the type of waste (i) which best fits to this classification is "clinical waste" ("clinical
waste"), defined by the IPCC as chemical and pharmaceutical waste. In addition, as
there is no detailed information available for the calculation of CO2 emissions, the
default data provided by IPCC (2006) are given in the table below.
Table 62 - Emission factor for CO2 emissions generated in the incineration
Parameter Given the IPCC default
(i) Clinical waste (chemical and pharmaceutical)
CFi 60%
FCFi 40%
OFi 100%
Source: IPCC (2006)
As there is no information available about the fraction of dry matter in the waste
incinerated (dmi) and there is no default data provided by the IPCC, the value
considered was 100% dry in the residue by conservatism.
In the case of the calculation of emissions of CH4 and N2O, values of
aggregated CH4 and N2O in the residue and, therefore, the detailing of the type of
technology used (solid incineration, semi continuous, and fluidized bed incineration
plants). As there is no detailed information about the type of technology used,
emissions of these gases were regarded as 0 (zero) in this inventory.
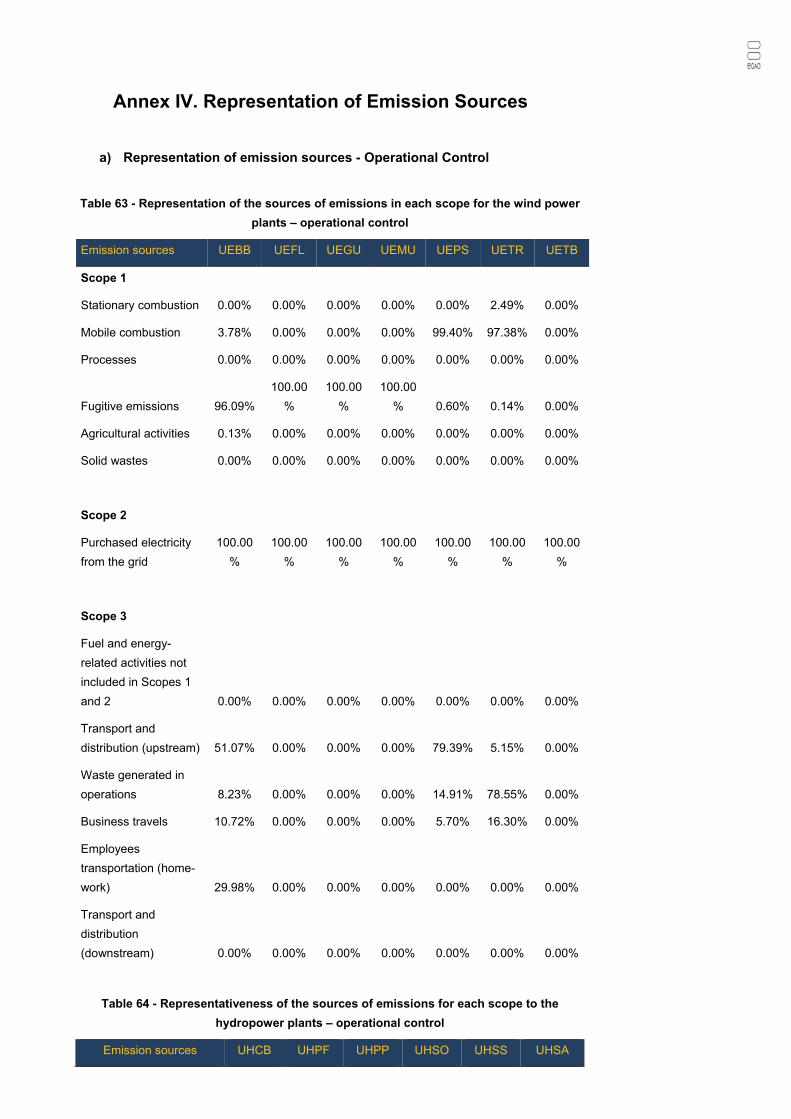
Annex IV. Representation of Emission Sources
a) Representation of emission sources - Operational Control
Table 63 - Representation of the sources of emissions in each scope for the wind power
plants – operational control
Emission sources UEBB UEFL UEGU UEMU UEPS UETR UETB
Scope 1
Stationary combustion 0.00% 0.00% 0.00% 0.00% 0.00% 2.49% 0.00%
Mobile combustion 3.78% 0.00% 0.00% 0.00% 99.40% 97.38% 0.00%
Processes 0.00% 0.00% 0.00% 0.00% 0.00% 0.00% 0.00%
Fugitive emissions 96.09%
100.00
%
100.00
%
100.00
% 0.60% 0.14% 0.00%
Agricultural activities 0.13% 0.00% 0.00% 0.00% 0.00% 0.00% 0.00%
Solid wastes 0.00% 0.00% 0.00% 0.00% 0.00% 0.00% 0.00%
Scope 2
Purchased electricity
from the grid
100.00
%
100.00
%
100.00
%
100.00
%
100.00
%
100.00
%
100.00
%
Scope 3
Fuel and energy-
related activities not
included in Scopes 1
and 2 0.00% 0.00% 0.00% 0.00% 0.00% 0.00% 0.00%
Transport and
distribution (upstream) 51.07% 0.00% 0.00% 0.00% 79.39% 5.15% 0.00%
Waste generated in
operations 8.23% 0.00% 0.00% 0.00% 14.91% 78.55% 0.00%
Business travels 10.72% 0.00% 0.00% 0.00% 5.70% 16.30% 0.00%
Employees
transportation (home-
work) 29.98% 0.00% 0.00% 0.00% 0.00% 0.00% 0.00%
Transport and
distribution
(downstream) 0.00% 0.00% 0.00% 0.00% 0.00% 0.00% 0.00%
Table 64 - Representativeness of the sources of emissions for each scope to the
hydropower plants – operational control
Emission sources UHCB UHPF UHPP UHSO UHSS UHSA
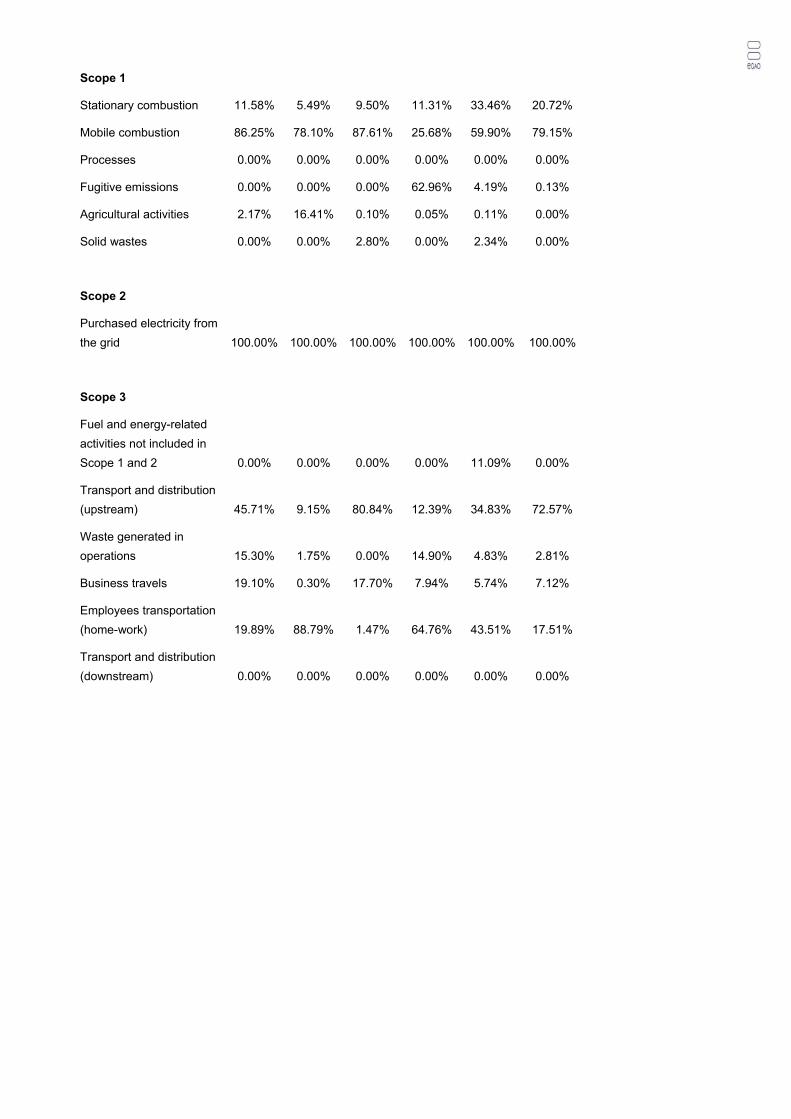
Scope 1
Stationary combustion 11.58% 5.49% 9.50% 11.31% 33.46% 20.72%
Mobile combustion 86.25% 78.10% 87.61% 25.68% 59.90% 79.15%
Processes 0.00% 0.00% 0.00% 0.00% 0.00% 0.00%
Fugitive emissions 0.00% 0.00% 0.00% 62.96% 4.19% 0.13%
Agricultural activities 2.17% 16.41% 0.10% 0.05% 0.11% 0.00%
Solid wastes 0.00% 0.00% 2.80% 0.00% 2.34% 0.00%
Scope 2
Purchased electricity from
the grid 100.00% 100.00% 100.00% 100.00% 100.00% 100.00%
Scope 3
Fuel and energy-related
activities not included in
Scope 1 and 2 0.00% 0.00% 0.00% 0.00% 11.09% 0.00%
Transport and distribution
(upstream) 45.71% 9.15% 80.84% 12.39% 34.83% 72.57%
Waste generated in
operations 15.30% 1.75% 0.00% 14.90% 4.83% 2.81%
Business travels 19.10% 0.30% 17.70% 7.94% 5.74% 7.12%
Employees transportation
(home-work) 19.89% 88.79% 1.47% 64.76% 43.51% 17.51%
Transport and distribution
(downstream) 0.00% 0.00% 0.00% 0.00% 0.00% 0.00%
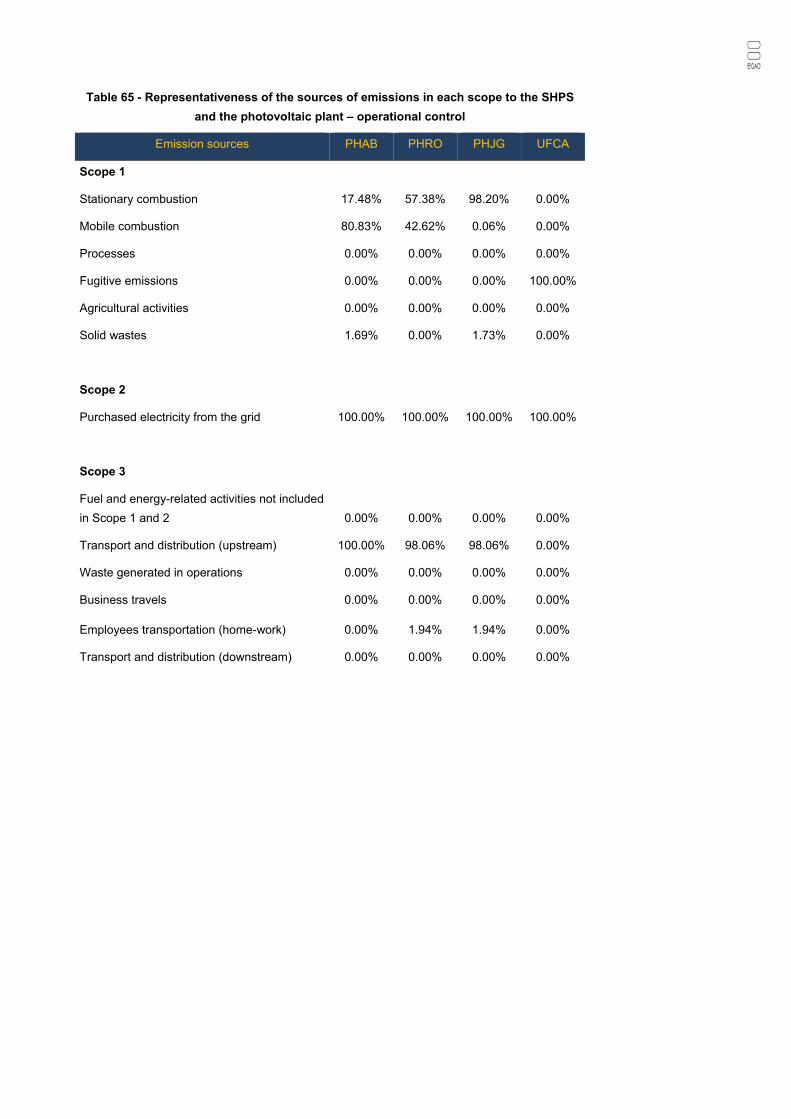
Table 65 - Representativeness of the sources of emissions in each scope to the SHPS
and the photovoltaic plant – operational control
Emission sources PHAB PHRO PHJG UFCA
Scope 1
Stationary combustion 17.48% 57.38% 98.20% 0.00%
Mobile combustion 80.83% 42.62% 0.06% 0.00%
Processes 0.00% 0.00% 0.00% 0.00%
Fugitive emissions 0.00% 0.00% 0.00% 100.00%
Agricultural activities 0.00% 0.00% 0.00% 0.00%
Solid wastes 1.69% 0.00% 1.73% 0.00%
Scope 2
Purchased electricity from the grid 100.00% 100.00% 100.00% 100.00%
Scope 3
Fuel and energy-related activities not included
in Scope 1 and 2 0.00% 0.00% 0.00% 0.00%
Transport and distribution (upstream) 100.00% 98.06% 98.06% 0.00%
Waste generated in operations 0.00% 0.00% 0.00% 0.00%
Business travels 0.00% 0.00% 0.00% 0.00%
Employees transportation (home-work) 0.00% 1.94% 1.94% 0.00%
Transport and distribution (downstream) 0.00% 0.00% 0.00% 0.00%
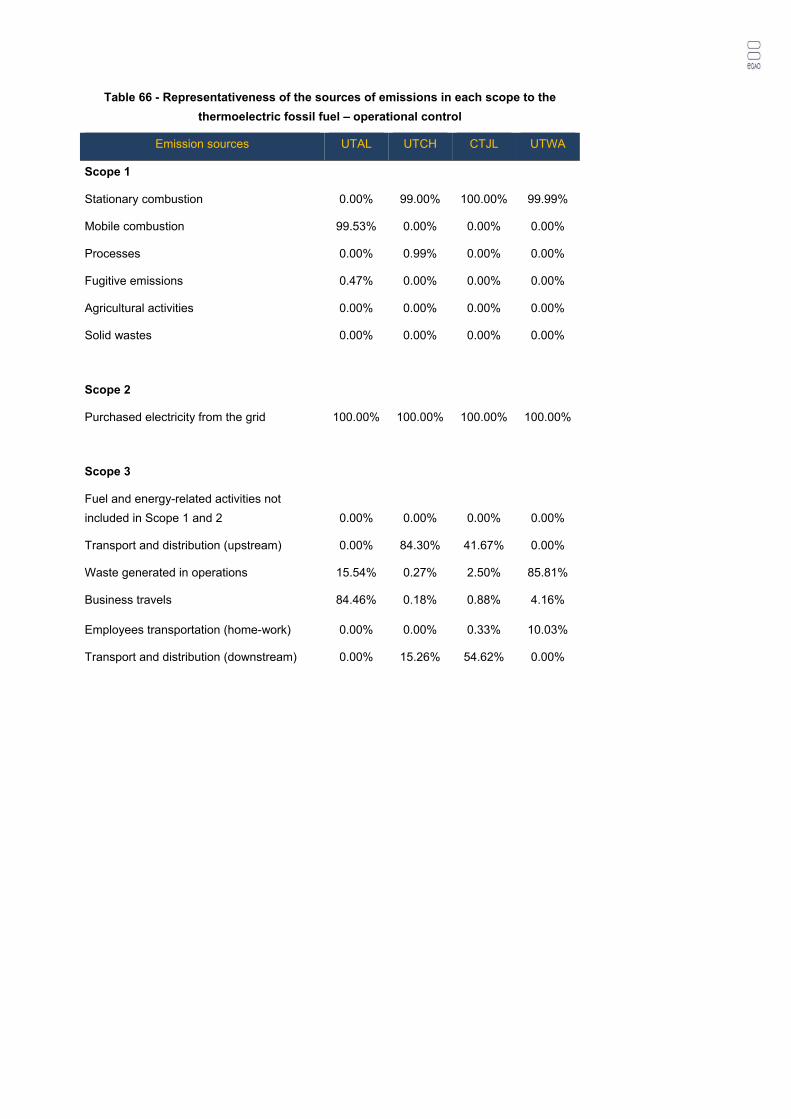
Table 66 - Representativeness of the sources of emissions in each scope to the
thermoelectric fossil fuel – operational control
Emission sources UTAL UTCH CTJL UTWA
Scope 1
Stationary combustion 0.00% 99.00% 100.00% 99.99%
Mobile combustion 99.53% 0.00% 0.00% 0.00%
Processes 0.00% 0.99% 0.00% 0.00%
Fugitive emissions 0.47% 0.00% 0.00% 0.00%
Agricultural activities 0.00% 0.00% 0.00% 0.00%
Solid wastes 0.00% 0.00% 0.00% 0.00%
Scope 2
Purchased electricity from the grid 100.00% 100.00% 100.00% 100.00%
Scope 3
Fuel and energy-related activities not
included in Scope 1 and 2 0.00% 0.00% 0.00% 0.00%
Transport and distribution (upstream) 0.00% 84.30% 41.67% 0.00%
Waste generated in operations 15.54% 0.27% 2.50% 85.81%
Business travels 84.46% 0.18% 0.88% 4.16%
Employees transportation (home-work) 0.00% 0.00% 0.33% 10.03%
Transport and distribution (downstream) 0.00% 15.26% 54.62% 0.00%
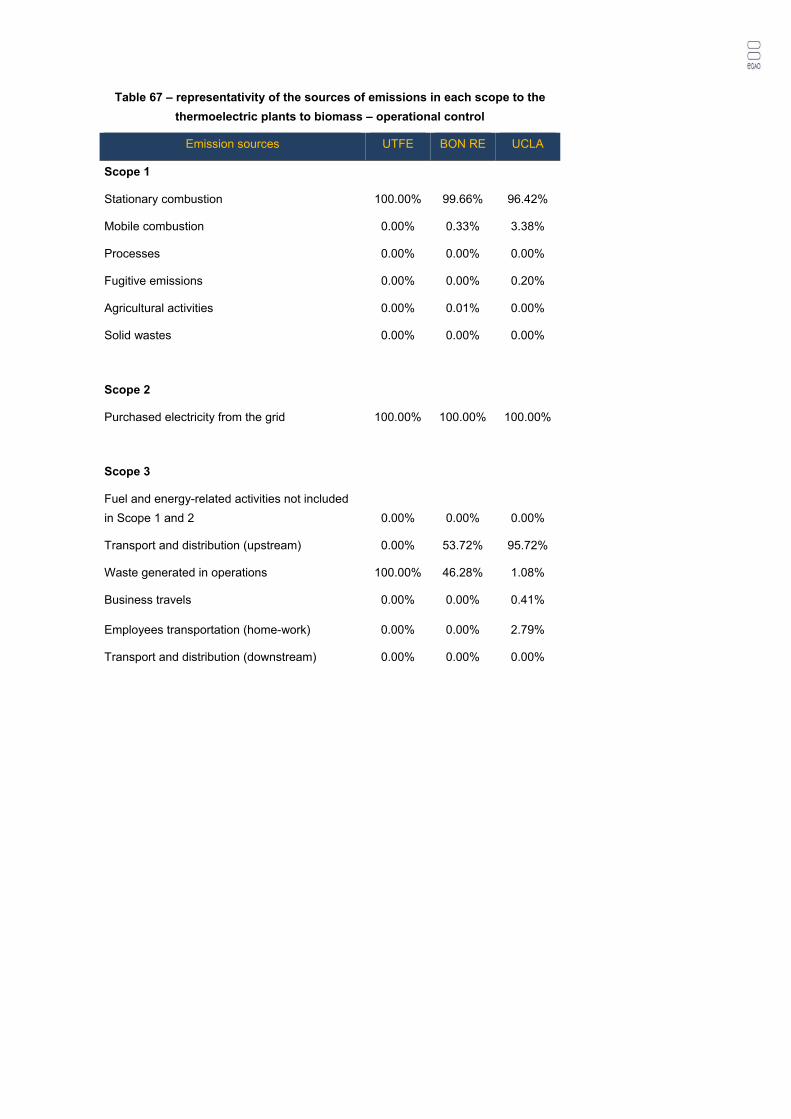
Table 67 – representativity of the sources of emissions in each scope to the
thermoelectric plants to biomass – operational control
Emission sources UTFE BON RE UCLA
Scope 1
Stationary combustion 100.00% 99.66% 96.42%
Mobile combustion 0.00% 0.33% 3.38%
Processes 0.00% 0.00% 0.00%
Fugitive emissions 0.00% 0.00% 0.20%
Agricultural activities 0.00% 0.01% 0.00%
Solid wastes 0.00% 0.00% 0.00%
Scope 2
Purchased electricity from the grid 100.00% 100.00% 100.00%
Scope 3
Fuel and energy-related activities not included
in Scope 1 and 2 0.00% 0.00% 0.00%
Transport and distribution (upstream) 0.00% 53.72% 95.72%
Waste generated in operations 100.00% 46.28% 1.08%
Business travels 0.00% 0.00% 0.41%
Employees transportation (home-work) 0.00% 0.00% 2.79%
Transport and distribution (downstream) 0.00% 0.00% 0.00%
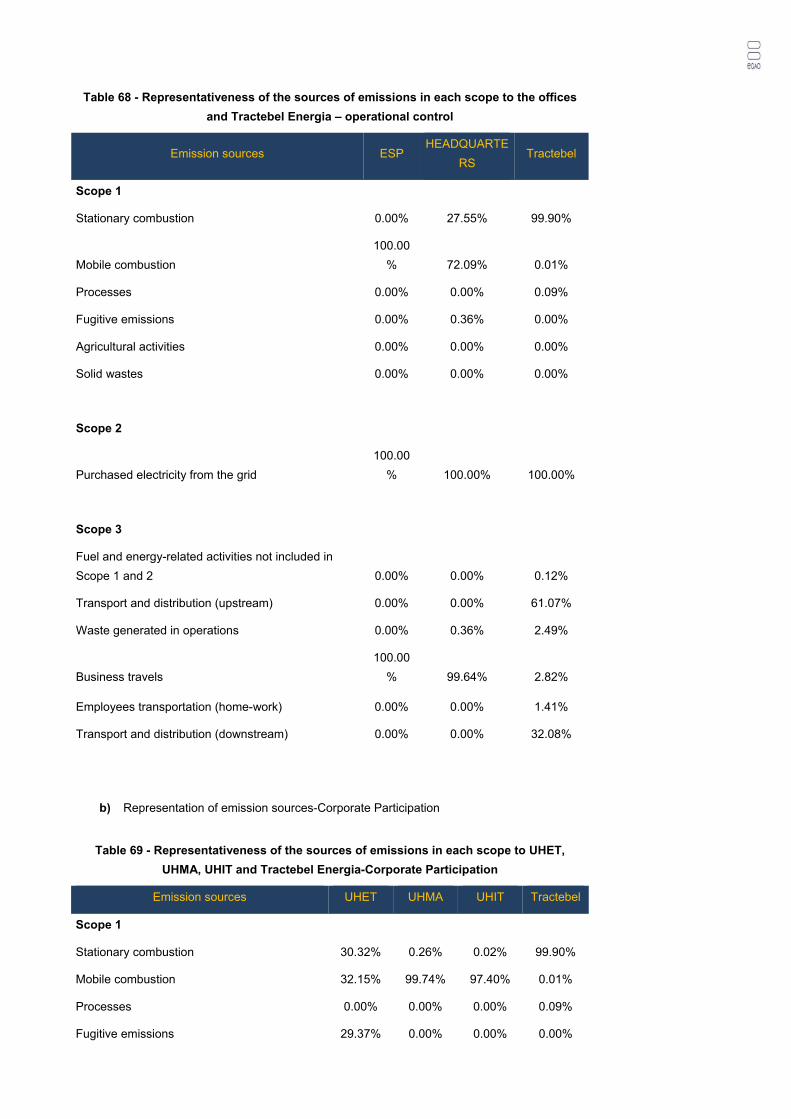
Table 68 - Representativeness of the sources of emissions in each scope to the offices
and Tractebel Energia – operational control
Emission sources ESP HEADQUARTE
RS Tractebel
Scope 1
Stationary combustion 0.00% 27.55% 99.90%
Mobile combustion
100.00
% 72.09% 0.01%
Processes 0.00% 0.00% 0.09%
Fugitive emissions 0.00% 0.36% 0.00%
Agricultural activities 0.00% 0.00% 0.00%
Solid wastes 0.00% 0.00% 0.00%
Scope 2
Purchased electricity from the grid
100.00
% 100.00% 100.00%
Scope 3
Fuel and energy-related activities not included in
Scope 1 and 2 0.00% 0.00% 0.12%
Transport and distribution (upstream) 0.00% 0.00% 61.07%
Waste generated in operations 0.00% 0.36% 2.49%
Business travels
100.00
% 99.64% 2.82%
Employees transportation (home-work) 0.00% 0.00% 1.41%
Transport and distribution (downstream) 0.00% 0.00% 32.08%
b) Representation of emission sources-Corporate Participation
Table 69 - Representativeness of the sources of emissions in each scope to UHET,
UHMA, UHIT and Tractebel Energia-Corporate Participation
Emission sources UHET UHMA UHIT Tractebel
Scope 1
Stationary combustion 30.32% 0.26% 0.02% 99.90%
Mobile combustion 32.15% 99.74% 97.40% 0.01%
Processes 0.00% 0.00% 0.00% 0.09%
Fugitive emissions 29.37% 0.00% 0.00% 0.00%
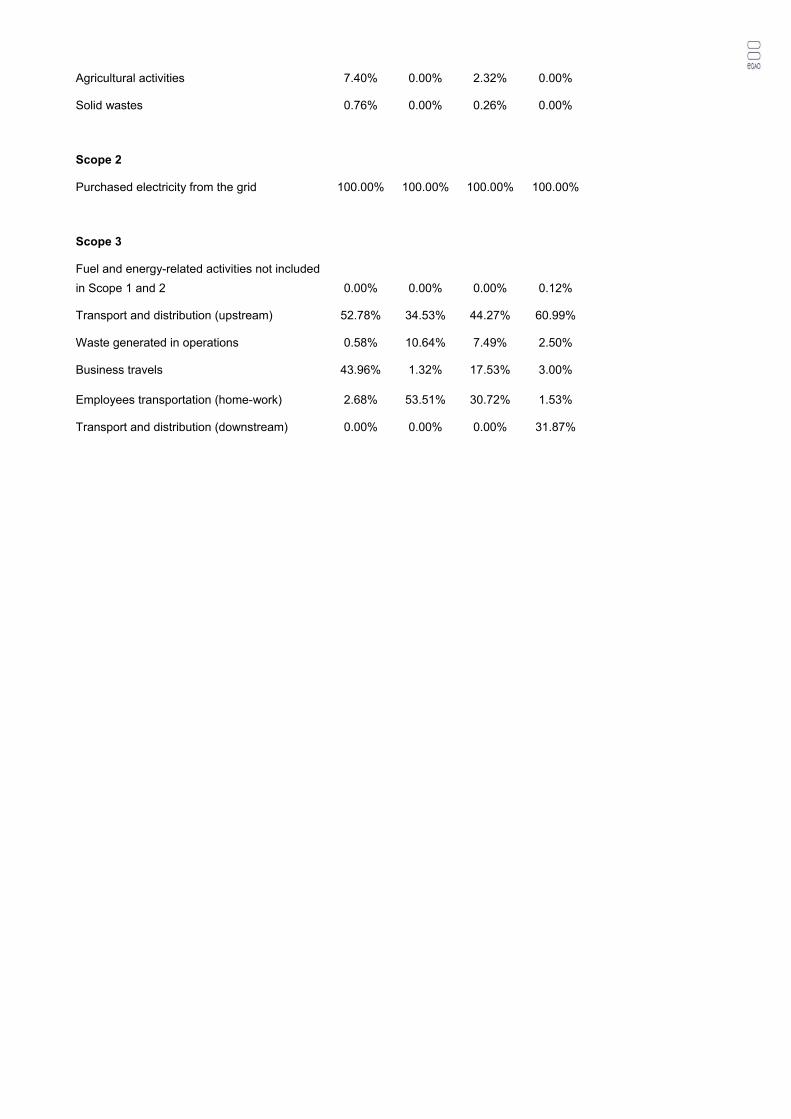
Agricultural activities 7.40% 0.00% 2.32% 0.00%
Solid wastes 0.76% 0.00% 0.26% 0.00%
Scope 2
Purchased electricity from the grid 100.00% 100.00% 100.00% 100.00%
Scope 3
Fuel and energy-related activities not included
in Scope 1 and 2 0.00% 0.00% 0.00% 0.12%
Transport and distribution (upstream) 52.78% 34.53% 44.27% 60.99%
Waste generated in operations 0.58% 10.64% 7.49% 2.50%
Business travels 43.96% 1.32% 17.53% 3.00%
Employees transportation (home-work) 2.68% 53.51% 30.72% 1.53%
Transport and distribution (downstream) 0.00% 0.00% 0.00% 31.87%
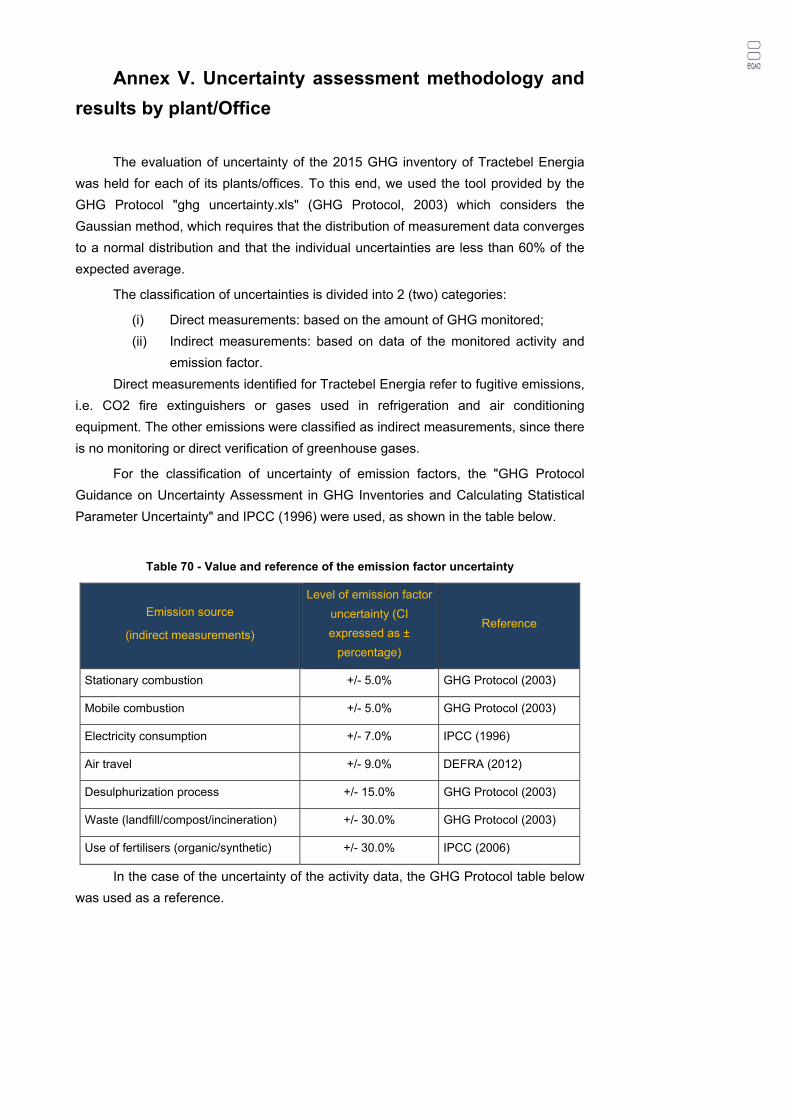
Annex V. Uncertainty assessment methodology and
results by plant/Office
The evaluation of uncertainty of the 2015 GHG inventory of Tractebel Energia
was held for each of its plants/offices. To this end, we used the tool provided by the
GHG Protocol "ghg uncertainty.xls" (GHG Protocol, 2003) which considers the
Gaussian method, which requires that the distribution of measurement data converges
to a normal distribution and that the individual uncertainties are less than 60% of the
expected average.
The classification of uncertainties is divided into 2 (two) categories:
(i) Direct measurements: based on the amount of GHG monitored;
(ii) Indirect measurements: based on data of the monitored activity and
emission factor.
Direct measurements identified for Tractebel Energia refer to fugitive emissions,
i.e. CO2 fire extinguishers or gases used in refrigeration and air conditioning
equipment. The other emissions were classified as indirect measurements, since there
is no monitoring or direct verification of greenhouse gases.
For the classification of uncertainty of emission factors, the "GHG Protocol
Guidance on Uncertainty Assessment in GHG Inventories and Calculating Statistical
Parameter Uncertainty" and IPCC (1996) were used, as shown in the table below.
Table 70 - Value and reference of the emission factor uncertainty
Emission source
(indirect measurements)
Level of emission factor
uncertainty (CI
expressed as ±
percentage)
Reference
Stationary combustion +/- 5.0% GHG Protocol (2003)
Mobile combustion +/- 5.0% GHG Protocol (2003)
Electricity consumption +/- 7.0% IPCC (1996)
Air travel +/- 9.0% DEFRA (2012)
Desulphurization process +/- 15.0% GHG Protocol (2003)
Waste (landfill/compost/incineration) +/- 30.0% GHG Protocol (2003)
Use of fertilisers (organic/synthetic) +/- 30.0% IPCC (2006)
In the case of the uncertainty of the activity data, the GHG Protocol table below
was used as a reference.
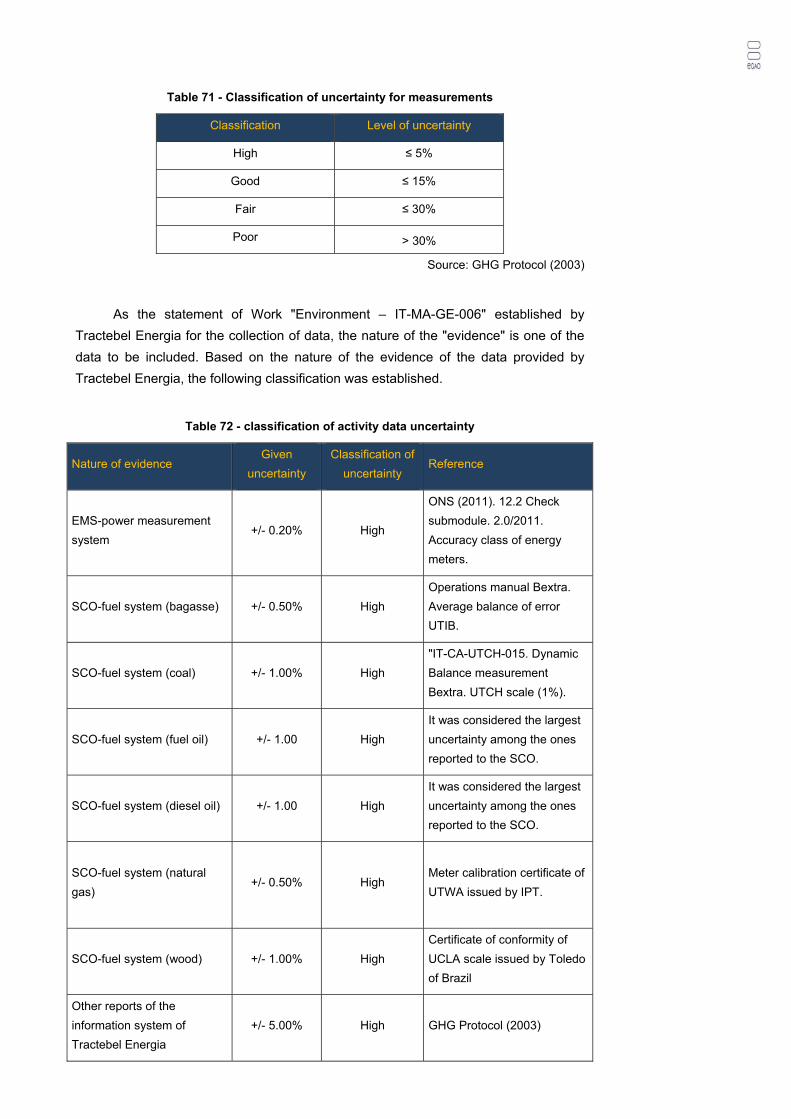
Table 71 - Classification of uncertainty for measurements
Classification Level of uncertainty
High ≤ 5%
Good ≤ 15%
Fair ≤ 30%
Poor > 30%
Source: GHG Protocol (2003)
As the statement of Work "Environment – IT-MA-GE-006" established by
Tractebel Energia for the collection of data, the nature of the "evidence" is one of the
data to be included. Based on the nature of the evidence of the data provided by
Tractebel Energia, the following classification was established.
Table 72 - classification of activity data uncertainty
Nature of evidence Given
uncertainty
Classification of
uncertainty Reference
EMS-power measurement
system +/- 0.20% High
ONS (2011). 12.2 Check
submodule. 2.0/2011.
Accuracy class of energy
meters.
SCO-fuel system (bagasse) +/- 0.50% High
Operations manual Bextra.
Average balance of error
UTIB.
SCO-fuel system (coal) +/- 1.00% High
"IT-CA-UTCH-015. Dynamic
Balance measurement
Bextra. UTCH scale (1%).
SCO-fuel system (fuel oil) +/- 1.00 High
It was considered the largest
uncertainty among the ones
reported to the SCO.
SCO-fuel system (diesel oil) +/- 1.00 High
It was considered the largest
uncertainty among the ones
reported to the SCO.
SCO-fuel system (natural
gas) +/- 0.50% High
Meter calibration certificate of
UTWA issued by IPT.
SCO-fuel system (wood) +/- 1.00% High
Certificate of conformity of
UCLA scale issued by Toledo
of Brazil
Other reports of the
information system of
Tractebel Energia
+/- 5.00% High GHG Protocol (2003)
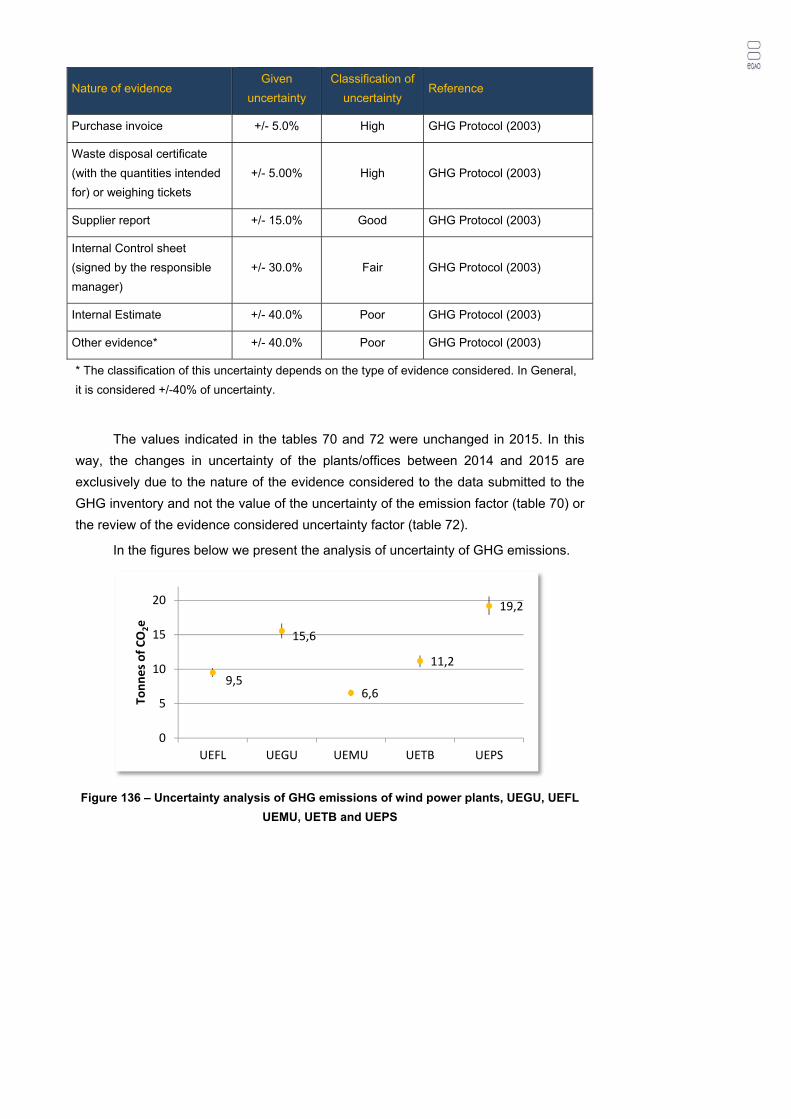
Nature of evidence Given
uncertainty
Classification of
uncertainty Reference
Purchase invoice +/- 5.0% High GHG Protocol (2003)
Waste disposal certificate
(with the quantities intended
for) or weighing tickets
+/- 5.00% High GHG Protocol (2003)
Supplier report +/- 15.0% Good GHG Protocol (2003)
Internal Control sheet
(signed by the responsible
manager)
+/- 30.0% Fair GHG Protocol (2003)
Internal Estimate +/- 40.0% Poor GHG Protocol (2003)
Other evidence* +/- 40.0% Poor GHG Protocol (2003)
* The classification of this uncertainty depends on the type of evidence considered. In General,
it is considered +/-40% of uncertainty.
The values indicated in the tables 70 and 72 were unchanged in 2015. In this
way, the changes in uncertainty of the plants/offices between 2014 and 2015 are
exclusively due to the nature of the evidence considered to the data submitted to the
GHG inventory and not the value of the uncertainty of the emission factor (table 70) or
the review of the evidence considered uncertainty factor (table 72).
In the figures below we present the analysis of uncertainty of GHG emissions.
Figure 136 – Uncertainty analysis of GHG emissions of wind power plants, UEGU, UEFL
UEMU, UETB and UEPS
9,5
15,6
6,6
11,2
19,2
0
5
10
15
20
UEFL UEGU UEMU UETB UEPS
Tonnes of CO
2e
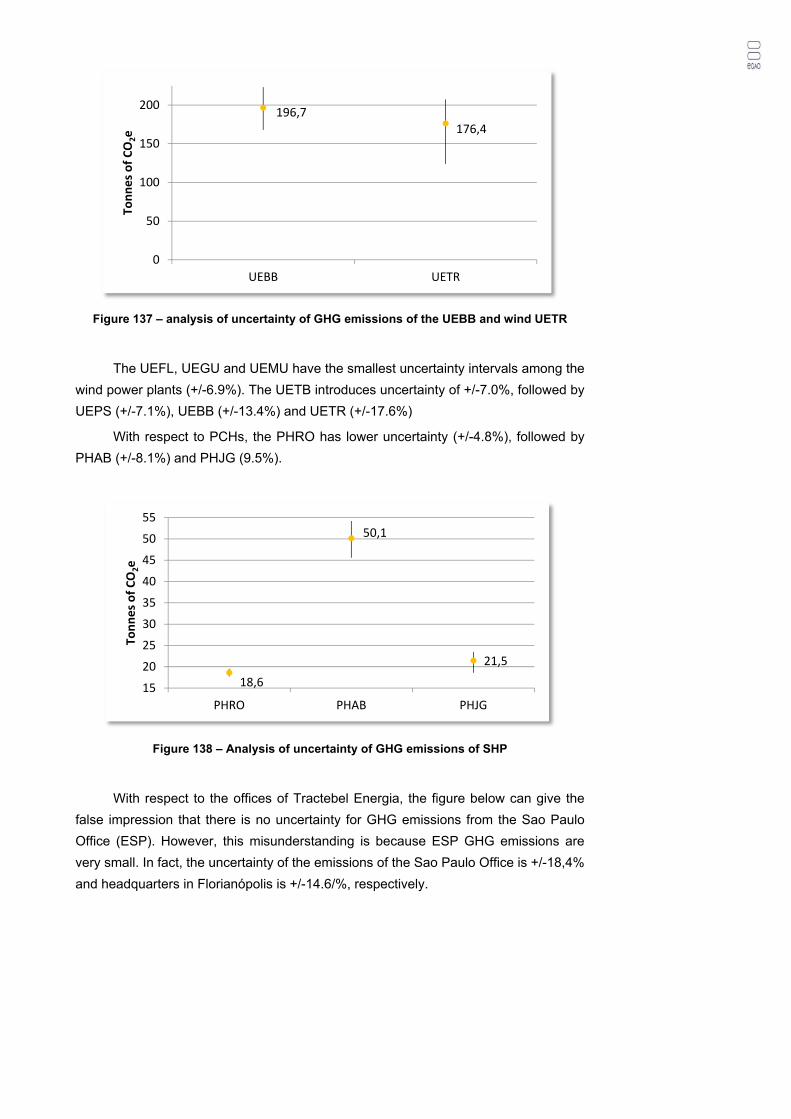
Figure 137 – analysis of uncertainty of GHG emissions of the UEBB and wind UETR
The UEFL, UEGU and UEMU have the smallest uncertainty intervals among the
wind power plants (+/-6.9%). The UETB introduces uncertainty of +/-7.0%, followed by
UEPS (+/-7.1%), UEBB (+/-13.4%) and UETR (+/-17.6%)
With respect to PCHs, the PHRO has lower uncertainty (+/-4.8%), followed by
PHAB (+/-8.1%) and PHJG (9.5%).
Figure 138 – Analysis of uncertainty of GHG emissions of SHP
With respect to the offices of Tractebel Energia, the figure below can give the
false impression that there is no uncertainty for GHG emissions from the Sao Paulo
Office (ESP). However, this misunderstanding is because ESP GHG emissions are
very small. In fact, the uncertainty of the emissions of the Sao Paulo Office is +/-18,4%
and headquarters in Florianópolis is +/-14.6/%, respectively.
196,7176,4
0
50
100
150
200
UEBB UETR
Tonnes of CO
2e
18,6
50,1
21,5
15
20
25
30
35
40
45
50
55
PHRO PHAB PHJG
Tonnes of CO
2e
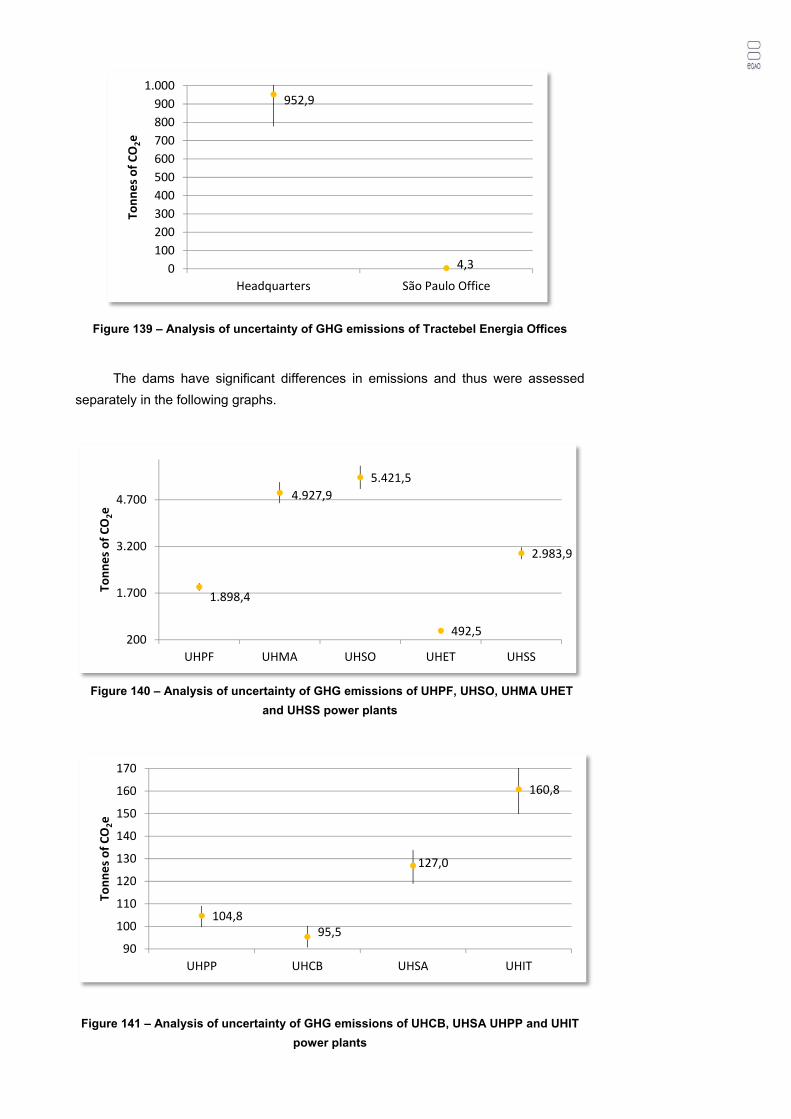
Figure 139 – Analysis of uncertainty of GHG emissions of Tractebel Energia Offices
The dams have significant differences in emissions and thus were assessed
separately in the following graphs.
Figure 140 – Analysis of uncertainty of GHG emissions of UHPF, UHSO, UHMA UHET
and UHSS power plants
Figure 141 – Analysis of uncertainty of GHG emissions of UHCB, UHSA UHPP and UHIT
power plants
952,9
4,30
100
200
300
400
500
600
700
800
900
1.000
Headquarters São Paulo Office
Tonnes of CO
2e
1.898,4
4.927,9
5.421,5
492,5
2.983,9
200
1.700
3.200
4.700
UHPF UHMA UHSO UHET UHSS
Tonnes of CO
2e
104,895,5
127,0
160,8
90
100
110
120
130
140
150
160
170
UHPP UHCB UHSA UHIT
Tonnes of CO
2e
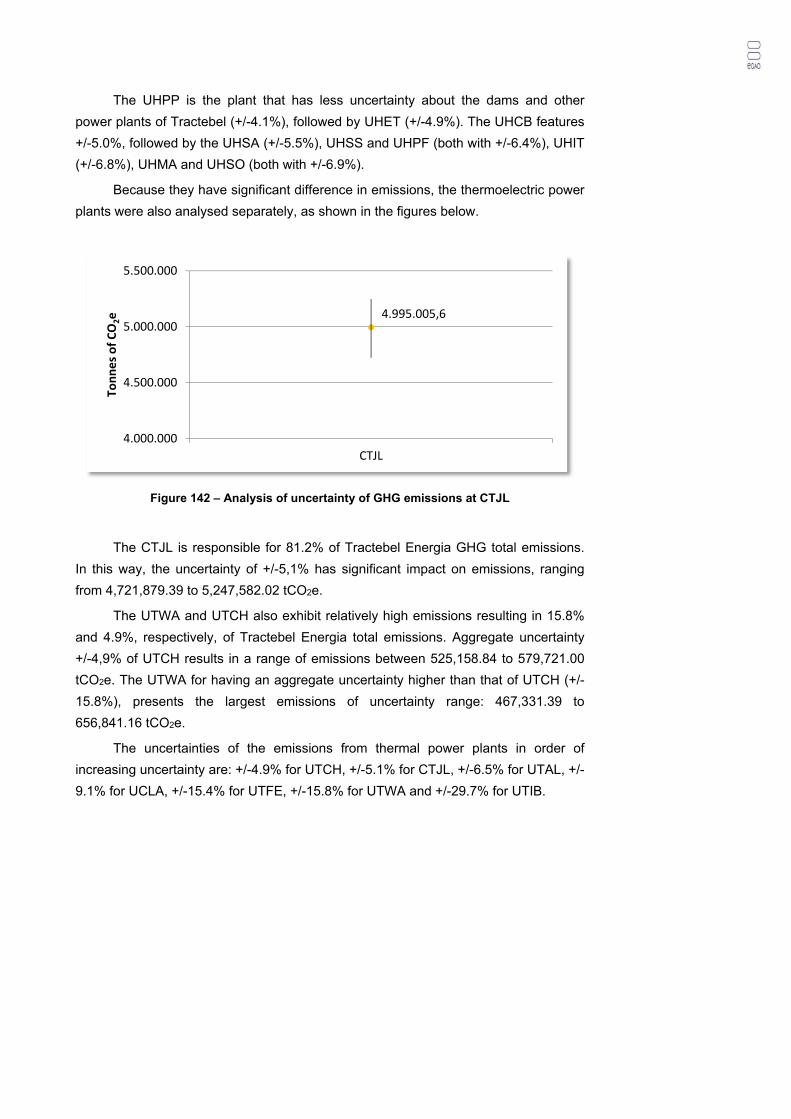
The UHPP is the plant that has less uncertainty about the dams and other
power plants of Tractebel (+/-4.1%), followed by UHET (+/-4.9%). The UHCB features
+/-5.0%, followed by the UHSA (+/-5.5%), UHSS and UHPF (both with +/-6.4%), UHIT
(+/-6.8%), UHMA and UHSO (both with +/-6.9%).
Because they have significant difference in emissions, the thermoelectric power
plants were also analysed separately, as shown in the figures below.
Figure 142 – Analysis of uncertainty of GHG emissions at CTJL
The CTJL is responsible for 81.2% of Tractebel Energia GHG total emissions.
In this way, the uncertainty of +/-5,1% has significant impact on emissions, ranging
from 4,721,879.39 to 5,247,582.02 tCO2e.
The UTWA and UTCH also exhibit relatively high emissions resulting in 15.8%
and 4.9%, respectively, of Tractebel Energia total emissions. Aggregate uncertainty
+/-4,9% of UTCH results in a range of emissions between 525,158.84 to 579,721.00
tCO2e. The UTWA for having an aggregate uncertainty higher than that of UTCH (+/-
15.8%), presents the largest emissions of uncertainty range: 467,331.39 to
656,841.16 tCO2e.
The uncertainties of the emissions from thermal power plants in order of
increasing uncertainty are: +/-4.9% for UTCH, +/-5.1% for CTJL, +/-6.5% for UTAL, +/-
9.1% for UCLA, +/-15.4% for UTFE, +/-15.8% for UTWA and +/-29.7% for UTIB.
4.995.005,6
4.000.000
4.500.000
5.000.000
5.500.000
CTJL
Tonnes of CO
2e
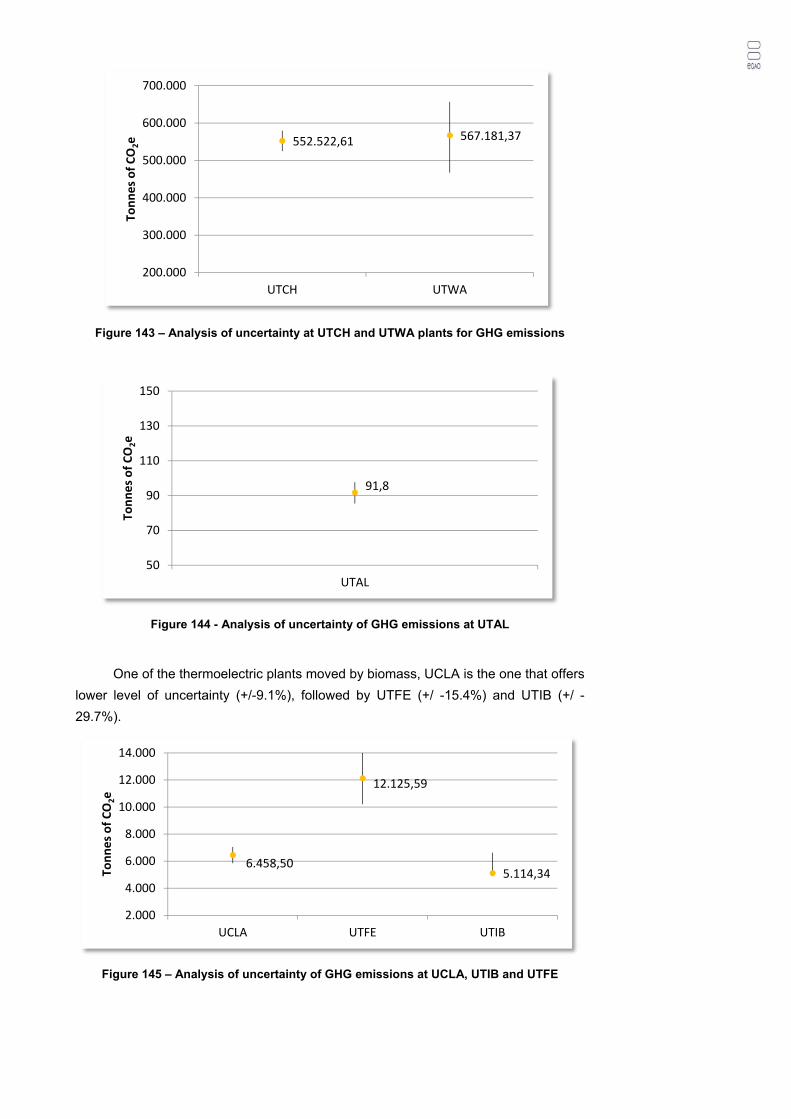
Figure 143 – Analysis of uncertainty at UTCH and UTWA plants for GHG emissions
Figure 144 - Analysis of uncertainty of GHG emissions at UTAL
One of the thermoelectric plants moved by biomass, UCLA is the one that offers
lower level of uncertainty (+/-9.1%), followed by UTFE (+/ -15.4%) and UTIB (+/ -
29.7%).
Figure 145 – Analysis of uncertainty of GHG emissions at UCLA, UTIB and UTFE
552.522,61 567.181,37
200.000
300.000
400.000
500.000
600.000
700.000
UTCH UTWA
Tonnes of CO
2e
91,8
50
70
90
110
130
150
UTAL
Tonnes of CO
2e
6.458,50
12.125,59
5.114,34
2.000
4.000
6.000
8.000
10.000
12.000
14.000
UCLA UTFE UTIB
Tonnes of CO
2e
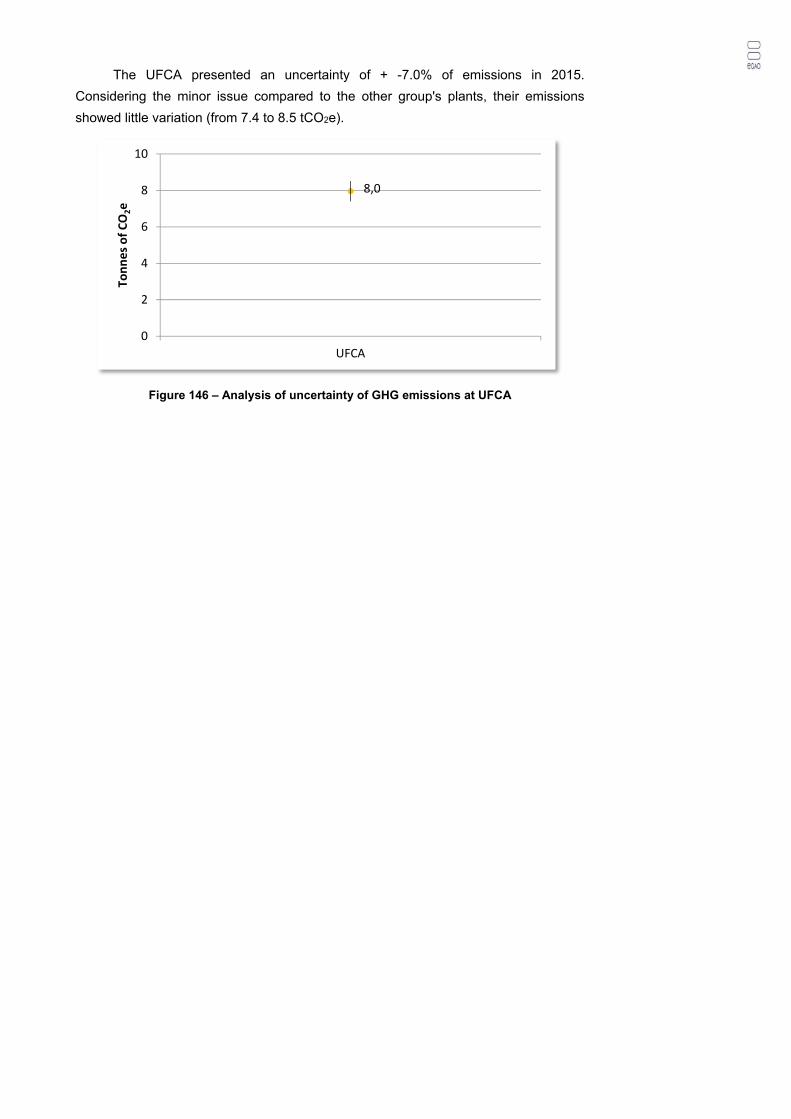
The UFCA presented an uncertainty of + -7.0% of emissions in 2015.
Considering the minor issue compared to the other group's plants, their emissions
showed little variation (from 7.4 to 8.5 tCO2e).
Figure 146 – Analysis of uncertainty of GHG emissions at UFCA
8,0
0
2
4
6
8
10
UFCA
Tonnes of CO
2e
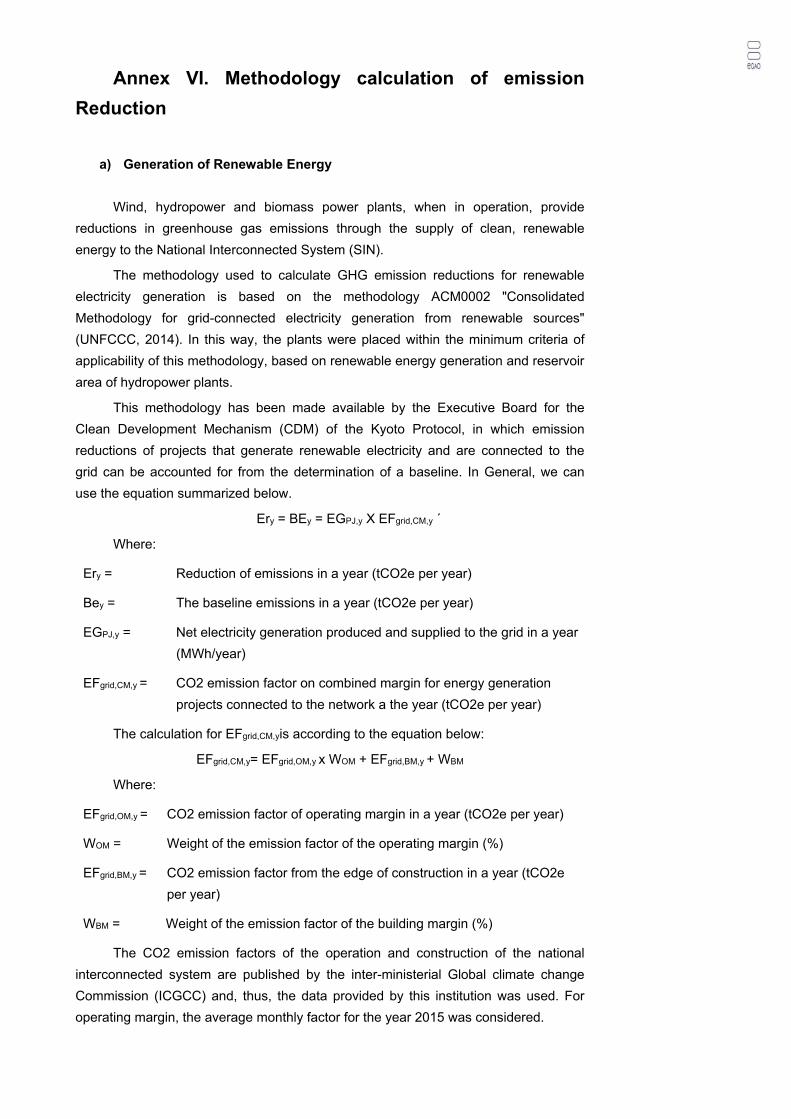
Annex VI. Methodology calculation of emission
Reduction
a) Generation of Renewable Energy
Wind, hydropower and biomass power plants, when in operation, provide
reductions in greenhouse gas emissions through the supply of clean, renewable
energy to the National Interconnected System (SIN).
The methodology used to calculate GHG emission reductions for renewable
electricity generation is based on the methodology ACM0002 "Consolidated
Methodology for grid-connected electricity generation from renewable sources"
(UNFCCC, 2014). In this way, the plants were placed within the minimum criteria of
applicability of this methodology, based on renewable energy generation and reservoir
area of hydropower plants.
This methodology has been made available by the Executive Board for the
Clean Development Mechanism (CDM) of the Kyoto Protocol, in which emission
reductions of projects that generate renewable electricity and are connected to the
grid can be accounted for from the determination of a baseline. In General, we can
use the equation summarized below.
Ery = BEy = EGPJ,y X EFgrid,CM,y ´
Where:
Ery = Reduction of emissions in a year (tCO2e per year)
Bey = The baseline emissions in a year (tCO2e per year)
EGPJ,y = Net electricity generation produced and supplied to the grid in a year
(MWh/year)
EFgrid,CM,y = CO2 emission factor on combined margin for energy generation
projects connected to the network a the year (tCO2e per year)
The calculation for EFgrid,CM,yis according to the equation below:
EFgrid,CM,y= EFgrid,OM,y x WOM + EFgrid,BM,y + WBM
Where:
EFgrid,OM,y = CO2 emission factor of operating margin in a year (tCO2e per year)
WOM = Weight of the emission factor of the operating margin (%)
EFgrid,BM,y = CO2 emission factor from the edge of construction in a year (tCO2e
per year)
WBM = Weight of the emission factor of the building margin (%)
The CO2 emission factors of the operation and construction of the national
interconnected system are published by the inter-ministerial Global climate change
Commission (ICGCC) and, thus, the data provided by this institution was used. For
operating margin, the average monthly factor for the year 2015 was considered.
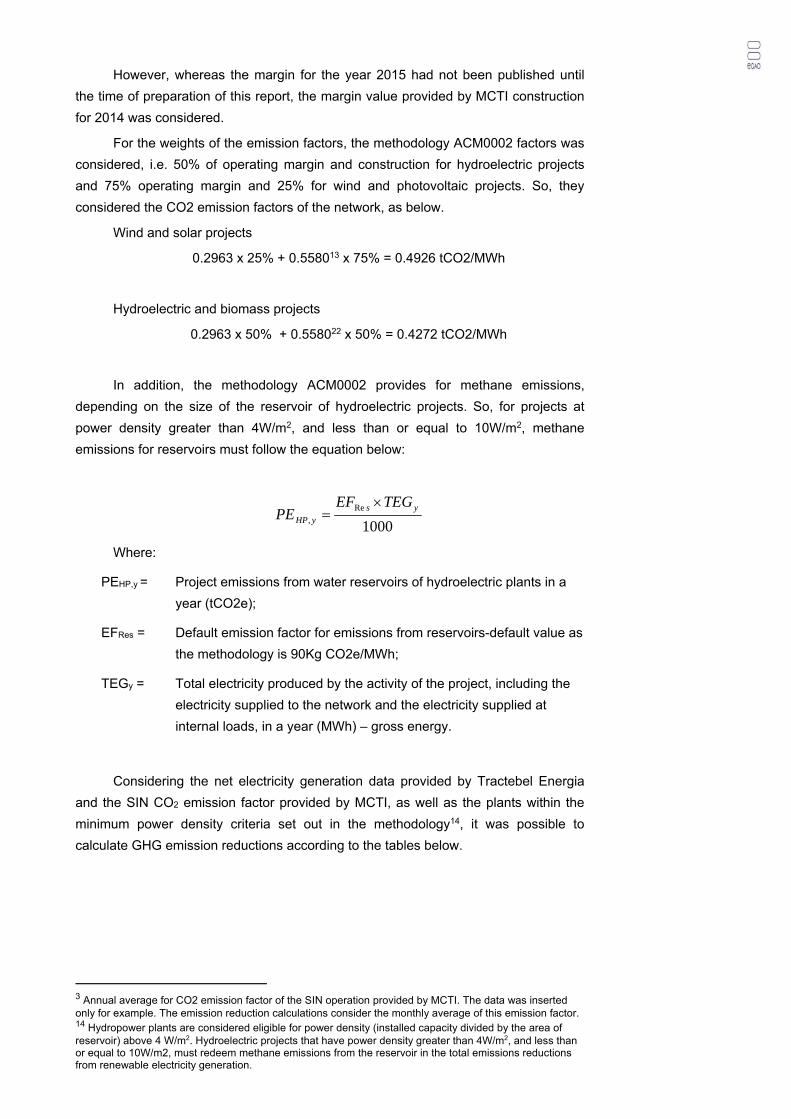
However, whereas the margin for the year 2015 had not been published until
the time of preparation of this report, the margin value provided by MCTI construction
for 2014 was considered.
For the weights of the emission factors, the methodology ACM0002 factors was
considered, i.e. 50% of operating margin and construction for hydroelectric projects
and 75% operating margin and 25% for wind and photovoltaic projects. So, they
considered the CO2 emission factors of the network, as below.
Wind and solar projects
0.2963 x 25% + 0.558013 x 75% = 0.4926 tCO2/MWh
Hydroelectric and biomass projects
0.2963 x 50% + 0.558022 x 50% = 0.4272 tCO2/MWh
In addition, the methodology ACM0002 provides for methane emissions,
depending on the size of the reservoir of hydroelectric projects. So, for projects at
power density greater than 4W/m2, and less than or equal to 10W/m2, methane
emissions for reservoirs must follow the equation below:
Where:
PEHP,y = Project emissions from water reservoirs of hydroelectric plants in a
year (tCO2e);
EFRes = Default emission factor for emissions from reservoirs-default value as
the methodology is 90Kg CO2e/MWh;
TEGy = Total electricity produced by the activity of the project, including the
electricity supplied to the network and the electricity supplied at
internal loads, in a year (MWh) – gross energy.
Considering the net electricity generation data provided by Tractebel Energia
and the SIN CO2 emission factor provided by MCTI, as well as the plants within the
minimum power density criteria set out in the methodology14, it was possible to
calculate GHG emission reductions according to the tables below.
3 Annual average for CO2 emission factor of the SIN operation provided by MCTI. The data was inserted only for example. The emission reduction calculations consider the monthly average of this emission factor. 14 Hydropower plants are considered eligible for power density (installed capacity divided by the area of reservoir) above 4 W/m2. Hydroelectric projects that have power density greater than 4W/m2, and less than or equal to 10W/m2, must redeem methane emissions from the reservoir in the total emissions reductions from renewable electricity generation.
1000Re
,
ys
yHP
TEGEFPE
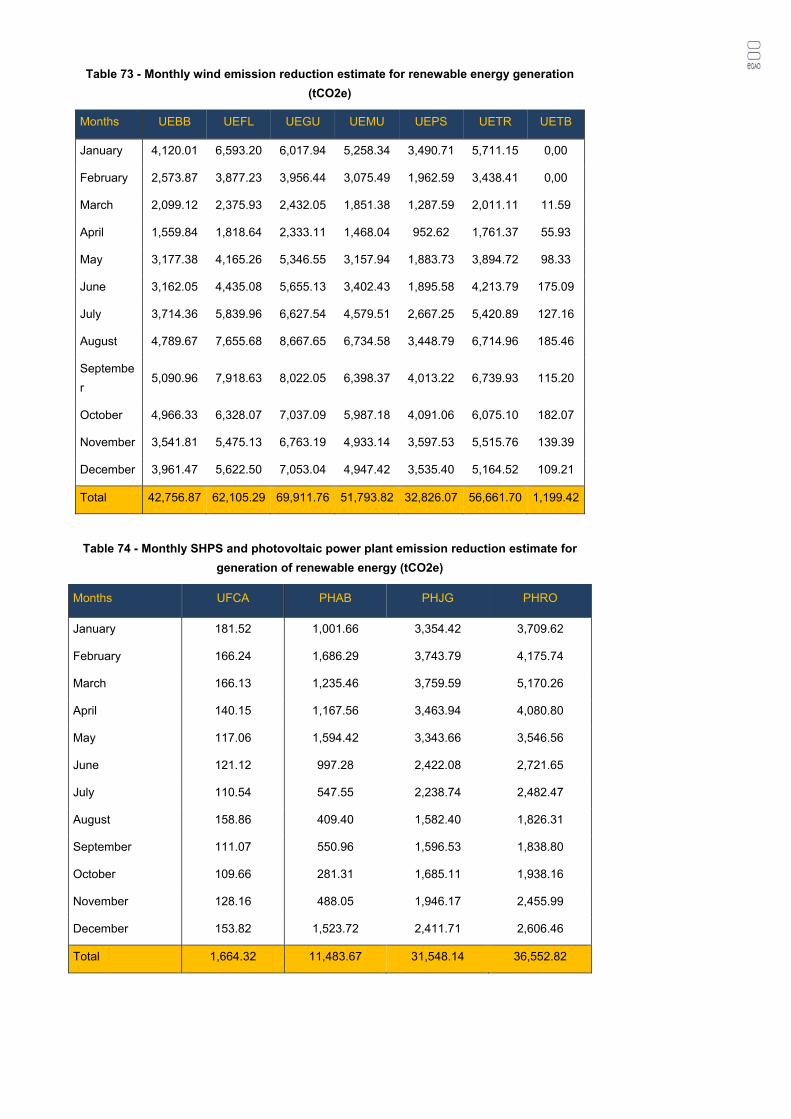
Table 73 - Monthly wind emission reduction estimate for renewable energy generation
(tCO2e)
Months UEBB UEFL UEGU UEMU UEPS UETR UETB
January 4,120.01 6,593.20 6,017.94 5,258.34 3,490.71 5,711.15 0,00
February 2,573.87 3,877.23 3,956.44 3,075.49 1,962.59 3,438.41 0,00
March 2,099.12 2,375.93 2,432.05 1,851.38 1,287.59 2,011.11 11.59
April 1,559.84 1,818.64 2,333.11 1,468.04 952.62 1,761.37 55.93
May 3,177.38 4,165.26 5,346.55 3,157.94 1,883.73 3,894.72 98.33
June 3,162.05 4,435.08 5,655.13 3,402.43 1,895.58 4,213.79 175.09
July 3,714.36 5,839.96 6,627.54 4,579.51 2,667.25 5,420.89 127.16
August 4,789.67 7,655.68 8,667.65 6,734.58 3,448.79 6,714.96 185.46
Septembe
r 5,090.96 7,918.63 8,022.05 6,398.37 4,013.22 6,739.93 115.20
October 4,966.33 6,328.07 7,037.09 5,987.18 4,091.06 6,075.10 182.07
November 3,541.81 5,475.13 6,763.19 4,933.14 3,597.53 5,515.76 139.39
December 3,961.47 5,622.50 7,053.04 4,947.42 3,535.40 5,164.52 109.21
Total 42,756.87 62,105.29 69,911.76 51,793.82 32,826.07 56,661.70 1,199.42
Table 74 - Monthly SHPS and photovoltaic power plant emission reduction estimate for
generation of renewable energy (tCO2e)
Months UFCA PHAB PHJG PHRO
January 181.52 1,001.66 3,354.42 3,709.62
February 166.24 1,686.29 3,743.79 4,175.74
March 166.13 1,235.46 3,759.59 5,170.26
April 140.15 1,167.56 3,463.94 4,080.80
May 117.06 1,594.42 3,343.66 3,546.56
June 121.12 997.28 2,422.08 2,721.65
July 110.54 547.55 2,238.74 2,482.47
August 158.86 409.40 1,582.40 1,826.31
September 111.07 550.96 1,596.53 1,838.80
October 109.66 281.31 1,685.11 1,938.16
November 128.16 488.05 1,946.17 2,455.99
December 153.82 1,523.72 2,411.71 2,606.46
Total 1,664.32 11,483.67 31,548.14 36,552.82
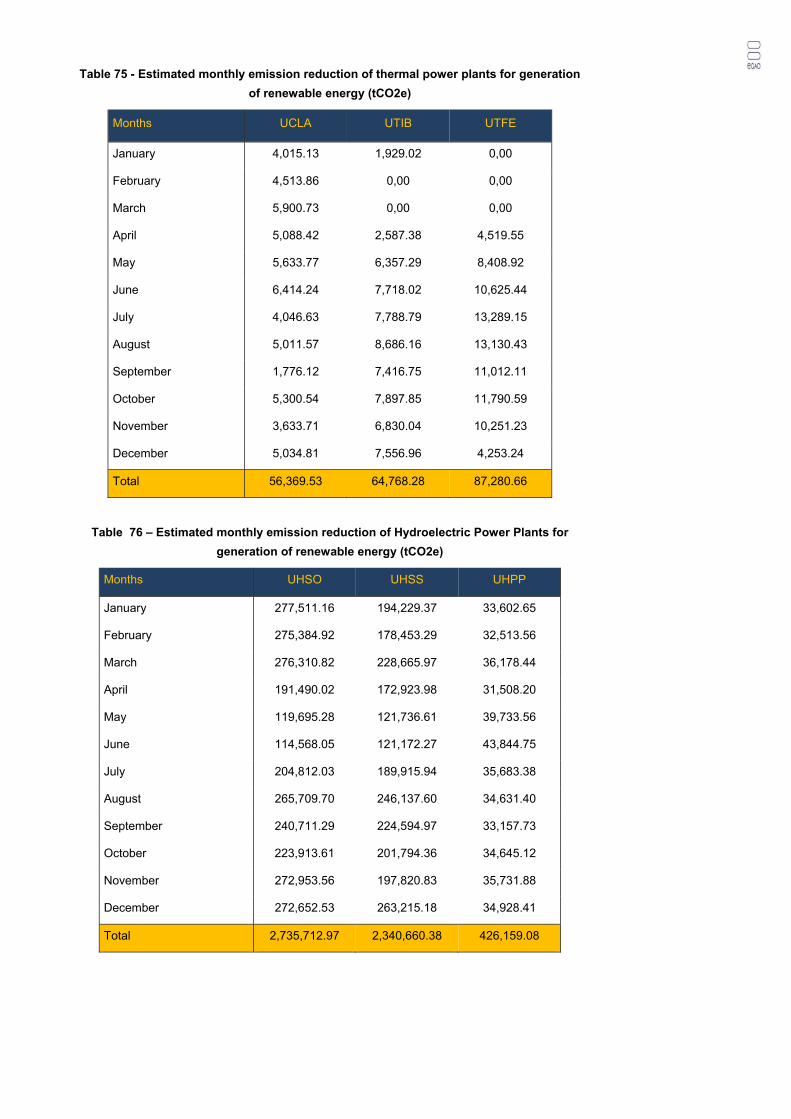
Table 75 - Estimated monthly emission reduction of thermal power plants for generation
of renewable energy (tCO2e)
Months UCLA UTIB UTFE
January 4,015.13 1,929.02 0,00
February 4,513.86 0,00 0,00
March 5,900.73 0,00 0,00
April 5,088.42 2,587.38 4,519.55
May 5,633.77 6,357.29 8,408.92
June 6,414.24 7,718.02 10,625.44
July 4,046.63 7,788.79 13,289.15
August 5,011.57 8,686.16 13,130.43
September 1,776.12 7,416.75 11,012.11
October 5,300.54 7,897.85 11,790.59
November 3,633.71 6,830.04 10,251.23
December 5,034.81 7,556.96 4,253.24
Total 56,369.53 64,768.28 87,280.66
Table 76 – Estimated monthly emission reduction of Hydroelectric Power Plants for
generation of renewable energy (tCO2e)
Months UHSO UHSS UHPP
January 277,511.16 194,229.37 33,602.65
February 275,384.92 178,453.29 32,513.56
March 276,310.82 228,665.97 36,178.44
April 191,490.02 172,923.98 31,508.20
May 119,695.28 121,736.61 39,733.56
June 114,568.05 121,172.27 43,844.75
July 204,812.03 189,915.94 35,683.38
August 265,709.70 246,137.60 34,631.40
September 240,711.29 224,594.97 33,157.73
October 223,913.61 201,794.36 34,645.12
November 272,953.56 197,820.83 35,731.88
December 272,652.53 263,215.18 34,928.41
Total 2,735,712.97 2,340,660.38 426,159.08
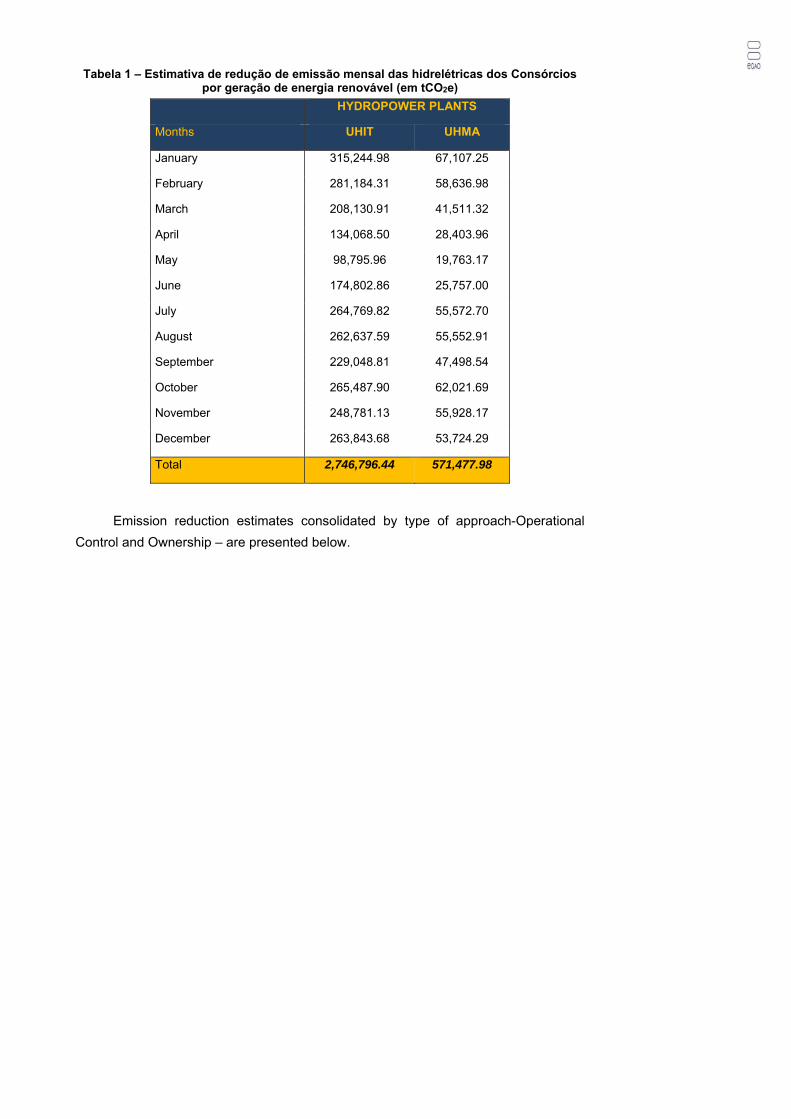
Tabela 1 – Estimativa de redução de emissão mensal das hidrelétricas dos Consórcios por geração de energia renovável (em tCO2e)
HYDROPOWER PLANTS
Months UHIT UHMA
January 315,244.98 67,107.25
February 281,184.31 58,636.98
March 208,130.91 41,511.32
April 134,068.50 28,403.96
May 98,795.96 19,763.17
June 174,802.86 25,757.00
July 264,769.82 55,572.70
August 262,637.59 55,552.91
September 229,048.81 47,498.54
October 265,487.90 62,021.69
November 248,781.13 55,928.17
December 263,843.68 53,724.29
Total 2,746,796.44 571,477.98
Emission reduction estimates consolidated by type of approach-Operational
Control and Ownership – are presented below.
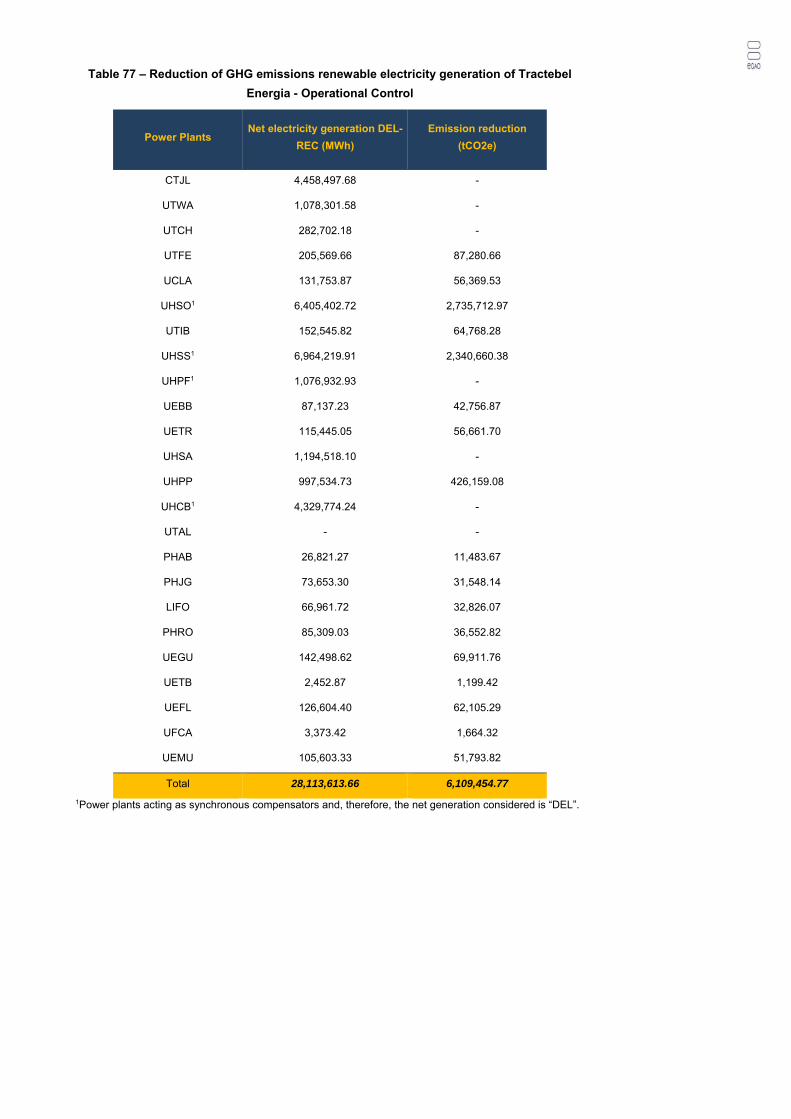
Table 77 – Reduction of GHG emissions renewable electricity generation of Tractebel
Energia - Operational Control
Power Plants Net electricity generation DEL-
REC (MWh)
Emission reduction
(tCO2e)
CTJL 4,458,497.68 -
UTWA 1,078,301.58 -
UTCH 282,702.18 -
UTFE 205,569.66 87,280.66
UCLA 131,753.87 56,369.53
UHSO1 6,405,402.72 2,735,712.97
UTIB 152,545.82 64,768.28
UHSS1 6,964,219.91 2,340,660.38
UHPF1 1,076,932.93 -
UEBB 87,137.23 42,756.87
UETR 115,445.05 56,661.70
UHSA 1,194,518.10 -
UHPP 997,534.73 426,159.08
UHCB1 4,329,774.24 -
UTAL - -
PHAB 26,821.27 11,483.67
PHJG 73,653.30 31,548.14
LIFO 66,961.72 32,826.07
PHRO 85,309.03 36,552.82
UEGU 142,498.62 69,911.76
UETB 2,452.87 1,199.42
UEFL 126,604.40 62,105.29
UFCA 3,373.42 1,664.32
UEMU 105,603.33 51,793.82
Total 28,113,613.66 6,109,454.77
1Power plants acting as synchronous compensators and, therefore, the net generation considered is “DEL”.
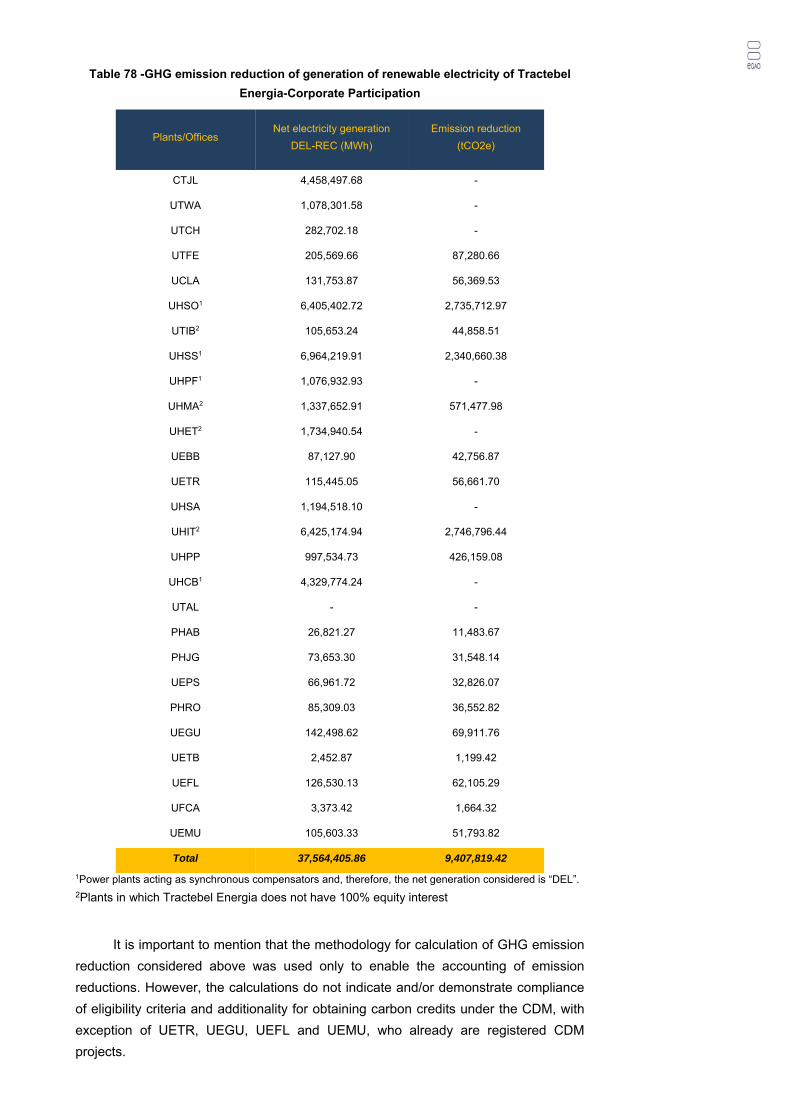
Table 78 -GHG emission reduction of generation of renewable electricity of Tractebel
Energia-Corporate Participation
Plants/Offices Net electricity generation
DEL-REC (MWh)
Emission reduction
(tCO2e)
CTJL 4,458,497.68 -
UTWA 1,078,301.58 -
UTCH 282,702.18 -
UTFE 205,569.66 87,280.66
UCLA 131,753.87 56,369.53
UHSO1 6,405,402.72 2,735,712.97
UTIB2 105,653.24 44,858.51
UHSS1 6,964,219.91 2,340,660.38
UHPF1 1,076,932.93 -
UHMA2 1,337,652.91 571,477.98
UHET2 1,734,940.54 -
UEBB 87,127.90 42,756.87
UETR 115,445.05 56,661.70
UHSA 1,194,518.10 -
UHIT2 6,425,174.94 2,746,796.44
UHPP 997,534.73 426,159.08
UHCB1 4,329,774.24 -
UTAL - -
PHAB 26,821.27 11,483.67
PHJG 73,653.30 31,548.14
UEPS 66,961.72 32,826.07
PHRO 85,309.03 36,552.82
UEGU 142,498.62 69,911.76
UETB 2,452.87 1,199.42
UEFL 126,530.13 62,105.29
UFCA 3,373.42 1,664.32
UEMU 105,603.33 51,793.82
Total 37,564,405.86 9,407,819.42
1Power plants acting as synchronous compensators and, therefore, the net generation considered is “DEL”. 2Plants in which Tractebel Energia does not have 100% equity interest
It is important to mention that the methodology for calculation of GHG emission
reduction considered above was used only to enable the accounting of emission
reductions. However, the calculations do not indicate and/or demonstrate compliance
of eligibility criteria and additionality for obtaining carbon credits under the CDM, with
exception of UETR, UEGU, UEFL and UEMU, who already are registered CDM
projects.
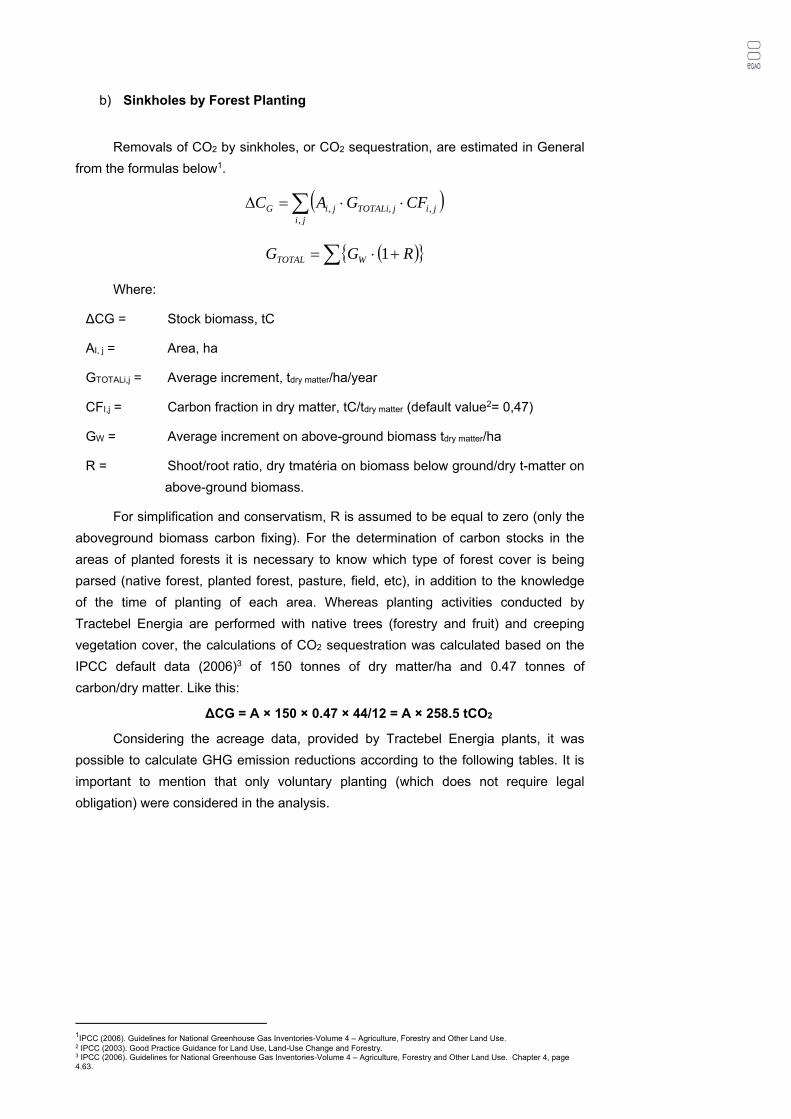
b) Sinkholes by Forest Planting
Removals of CO2 by sinkholes, or CO2 sequestration, are estimated in General
from the formulas below1.
Where:
∆CG = Stock biomass, tC
AI, j = Area, ha
GTOTALi,j = Average increment, tdry matter/ha/year
CFI,j = Carbon fraction in dry matter, tC/tdry matter (default value2= 0,47)
GW = Average increment on above-ground biomass tdry matter/ha
R = Shoot/root ratio, dry tmatéria on biomass below ground/dry t-matter on
above-ground biomass.
For simplification and conservatism, R is assumed to be equal to zero (only the
aboveground biomass carbon fixing). For the determination of carbon stocks in the
areas of planted forests it is necessary to know which type of forest cover is being
parsed (native forest, planted forest, pasture, field, etc), in addition to the knowledge
of the time of planting of each area. Whereas planting activities conducted by
Tractebel Energia are performed with native trees (forestry and fruit) and creeping
vegetation cover, the calculations of CO2 sequestration was calculated based on the
IPCC default data (2006)3 of 150 tonnes of dry matter/ha and 0.47 tonnes of
carbon/dry matter. Like this:
∆CG = A × 150 × 0.47 × 44/12 = A × 258.5 tCO2
Considering the acreage data, provided by Tractebel Energia plants, it was
possible to calculate GHG emission reductions according to the following tables. It is
important to mention that only voluntary planting (which does not require legal
obligation) were considered in the analysis.
1IPCC (2006). Guidelines for National Greenhouse Gas Inventories-Volume 4 – Agriculture, Forestry and Other Land Use. 2 IPCC (2003). Good Practice Guidance for Land Use, Land-Use Change and Forestry. 3 IPCC (2006). Guidelines for National Greenhouse Gas Inventories-Volume 4 – Agriculture, Forestry and Other Land Use. Chapter 4, page 4.63.
ji
jijTOTALijiG CFGAC,
,,,
RGG WTOTAL 1
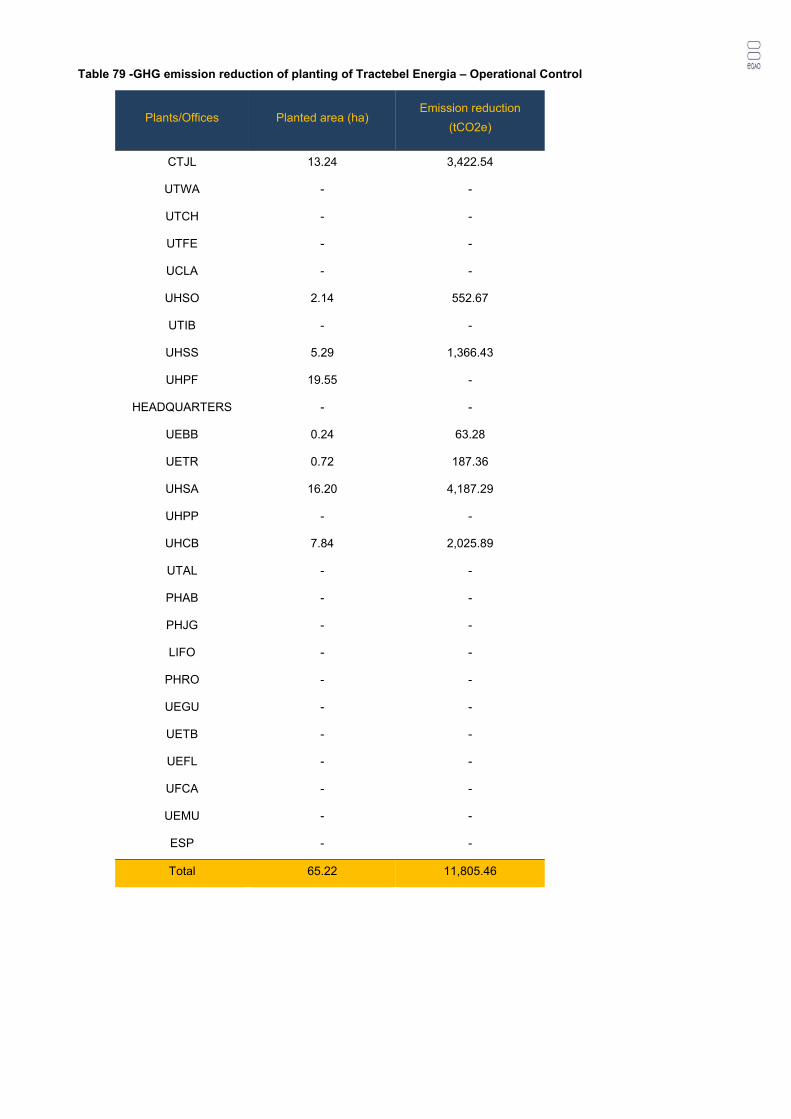
Table 79 -GHG emission reduction of planting of Tractebel Energia – Operational Control
Plants/Offices Planted area (ha) Emission reduction
(tCO2e)
CTJL 13.24 3,422.54
UTWA - -
UTCH - -
UTFE - -
UCLA - -
UHSO 2.14 552.67
UTIB - -
UHSS 5.29 1,366.43
UHPF 19.55 -
HEADQUARTERS - -
UEBB 0.24 63.28
UETR 0.72 187.36
UHSA 16.20 4,187.29
UHPP - -
UHCB 7.84 2,025.89
UTAL - -
PHAB - -
PHJG - -
LIFO - -
PHRO - -
UEGU - -
UETB - -
UEFL - -
UFCA - -
UEMU - -
ESP - -
Total 65.22 11,805.46
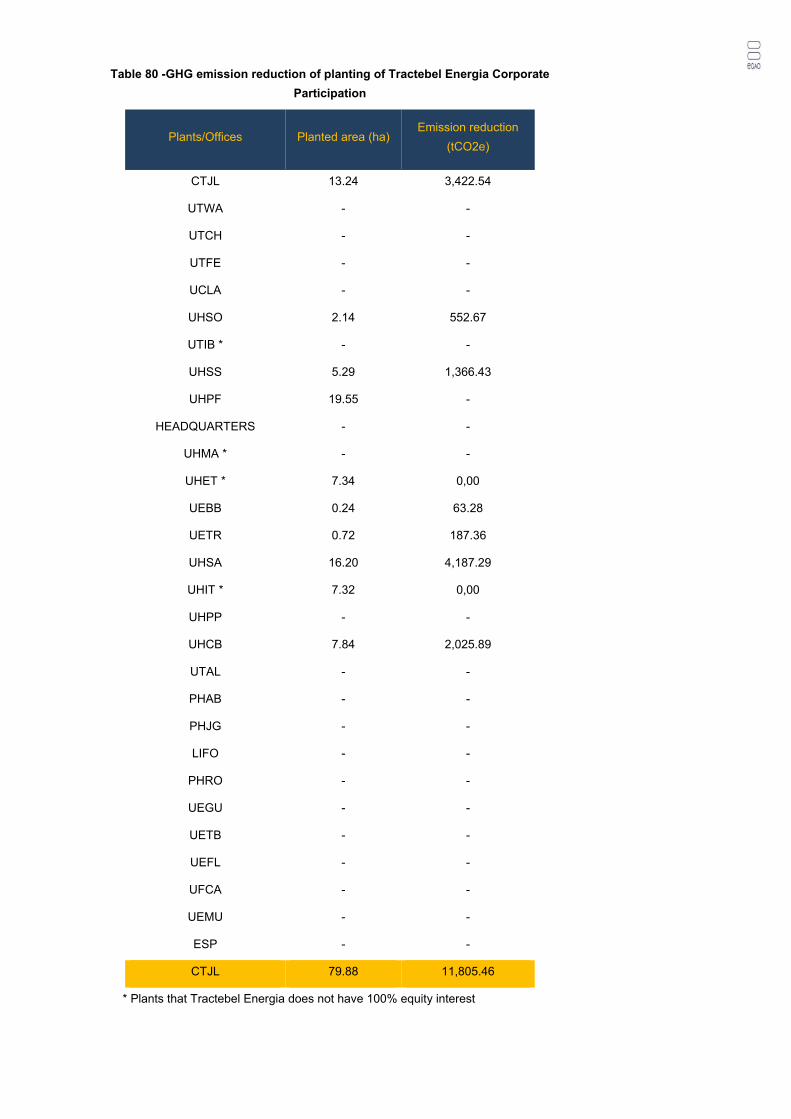
Table 80 -GHG emission reduction of planting of Tractebel Energia Corporate
Participation
Plants/Offices Planted area (ha) Emission reduction
(tCO2e)
CTJL 13.24 3,422.54
UTWA - -
UTCH - -
UTFE - -
UCLA - -
UHSO 2.14 552.67
UTIB * - -
UHSS 5.29 1,366.43
UHPF 19.55 -
HEADQUARTERS - -
UHMA * - -
UHET * 7.34 0,00
UEBB 0.24 63.28
UETR 0.72 187.36
UHSA 16.20 4,187.29
UHIT * 7.32 0,00
UHPP - -
UHCB 7.84 2,025.89
UTAL - -
PHAB - -
PHJG - -
LIFO - -
PHRO - -
UEGU - -
UETB - -
UEFL - -
UFCA - -
UEMU - -
ESP - -
CTJL 79.88 11,805.46
* Plants that Tractebel Energia does not have 100% equity interest
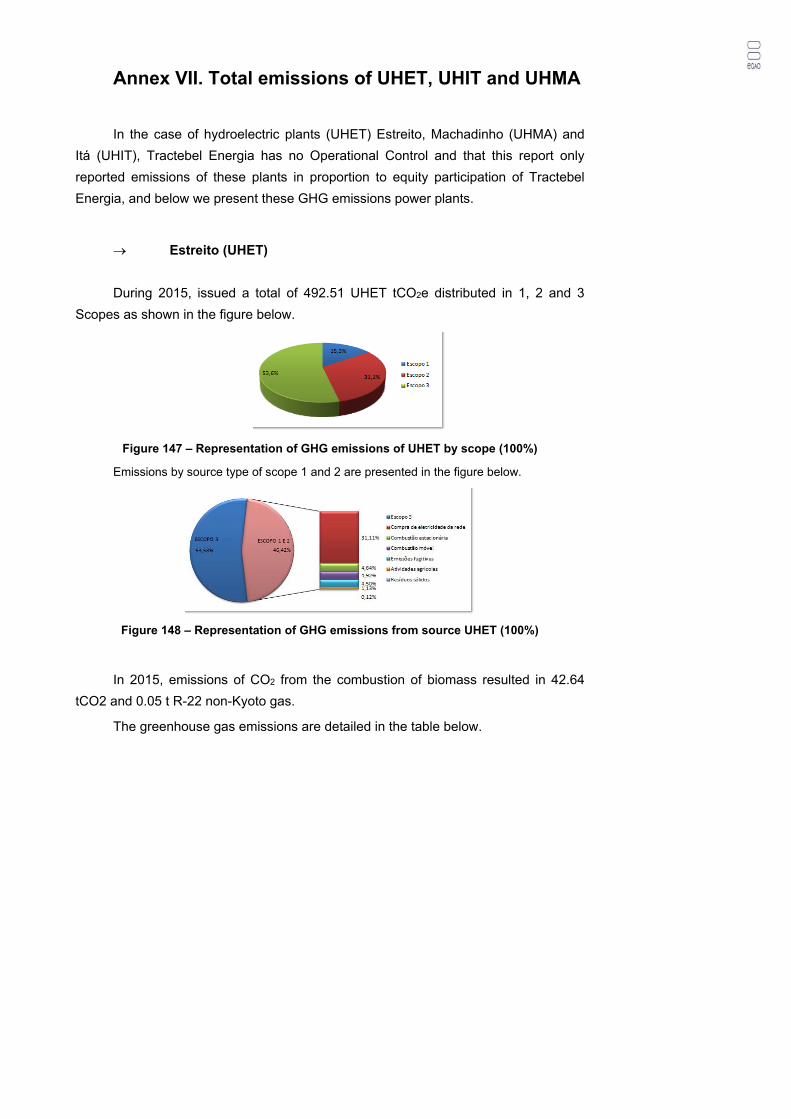
Annex VII. Total emissions of UHET, UHIT and UHMA
In the case of hydroelectric plants (UHET) Estreito, Machadinho (UHMA) and
Itá (UHIT), Tractebel Energia has no Operational Control and that this report only
reported emissions of these plants in proportion to equity participation of Tractebel
Energia, and below we present these GHG emissions power plants.
Estreito (UHET)
During 2015, issued a total of 492.51 UHET tCO2e distributed in 1, 2 and 3
Scopes as shown in the figure below.
Figure 147 – Representation of GHG emissions of UHET by scope (100%)
Emissions by source type of scope 1 and 2 are presented in the figure below.
Figure 148 – Representation of GHG emissions from source UHET (100%)
In 2015, emissions of CO2 from the combustion of biomass resulted in 42.64
tCO2 and 0.05 t R-22 non-Kyoto gas.
The greenhouse gas emissions are detailed in the table below.
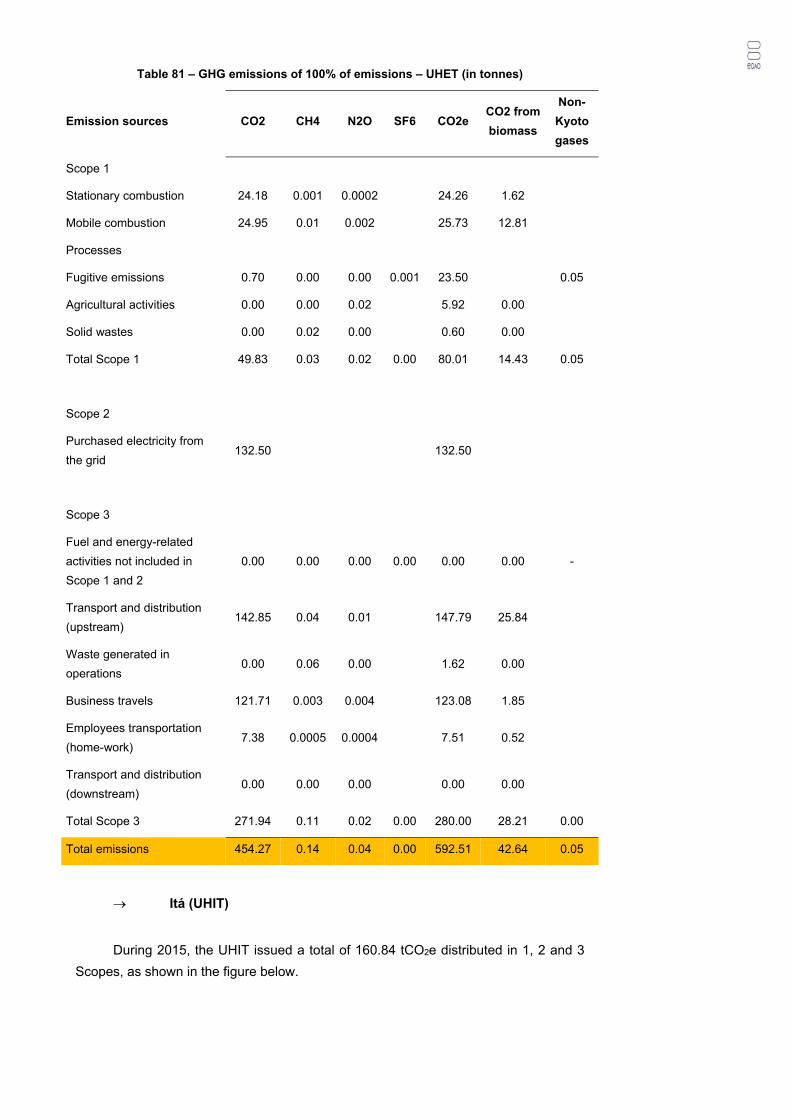
Table 81 – GHG emissions of 100% of emissions – UHET (in tonnes)
Emission sources CO2 CH4 N2O SF6 CO2e CO2 from
biomass
Non-
Kyoto
gases
Scope 1
Stationary combustion 24.18 0.001 0.0002 24.26 1.62
Mobile combustion 24.95 0.01 0.002 25.73 12.81
Processes
Fugitive emissions 0.70 0.00 0.00 0.001 23.50 0.05
Agricultural activities 0.00 0.00 0.02 5.92 0.00
Solid wastes 0.00 0.02 0.00 0.60 0.00
Total Scope 1 49.83 0.03 0.02 0.00 80.01 14.43 0.05
Scope 2
Purchased electricity from
the grid 132.50 132.50
Scope 3
Fuel and energy-related
activities not included in
Scope 1 and 2
0.00 0.00 0.00 0.00 0.00 0.00 -
Transport and distribution
(upstream) 142.85 0.04 0.01 147.79 25.84
Waste generated in
operations 0.00 0.06 0.00 1.62 0.00
Business travels 121.71 0.003 0.004 123.08 1.85
Employees transportation
(home-work) 7.38 0.0005 0.0004 7.51 0.52
Transport and distribution
(downstream) 0.00 0.00 0.00 0.00 0.00
Total Scope 3 271.94 0.11 0.02 0.00 280.00 28.21 0.00
Total emissions 454.27 0.14 0.04 0.00 592.51 42.64 0.05
Itá (UHIT)
During 2015, the UHIT issued a total of 160.84 tCO2e distributed in 1, 2 and 3
Scopes, as shown in the figure below.
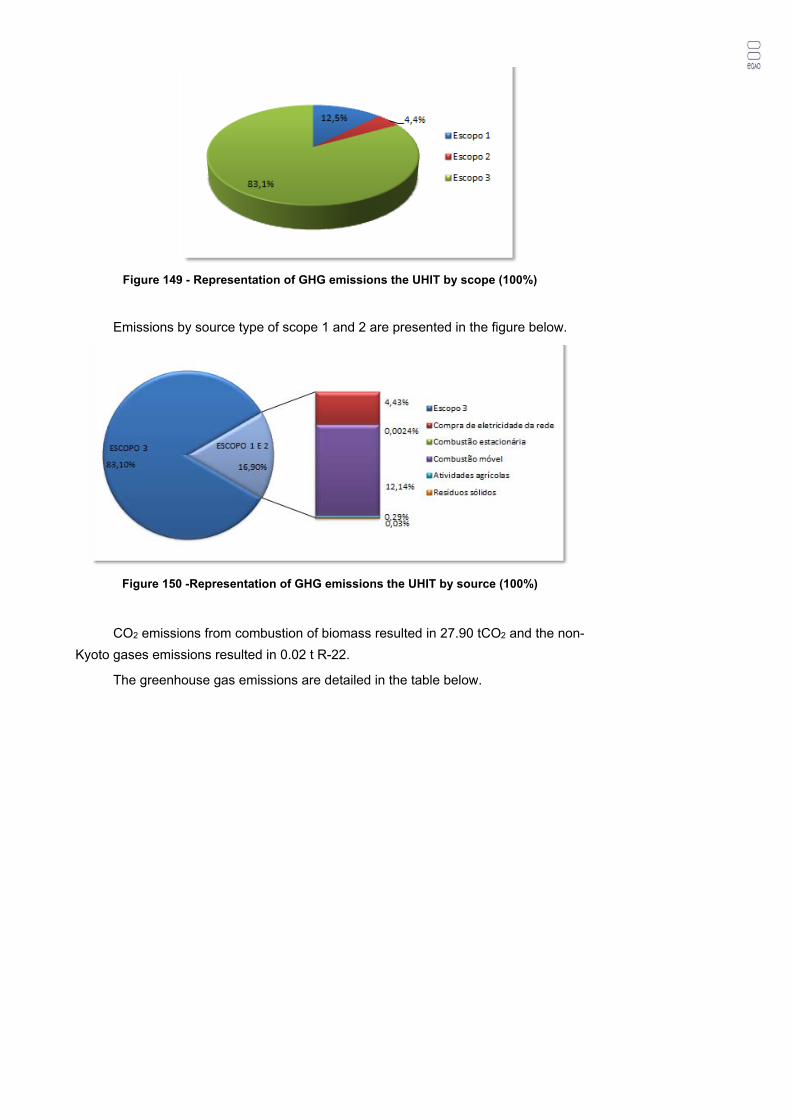
Figure 149 - Representation of GHG emissions the UHIT by scope (100%)
Emissions by source type of scope 1 and 2 are presented in the figure below.
Figure 150 -Representation of GHG emissions the UHIT by source (100%)
CO2 emissions from combustion of biomass resulted in 27.90 tCO2 and the non-
Kyoto gases emissions resulted in 0.02 t R-22.
The greenhouse gas emissions are detailed in the table below.
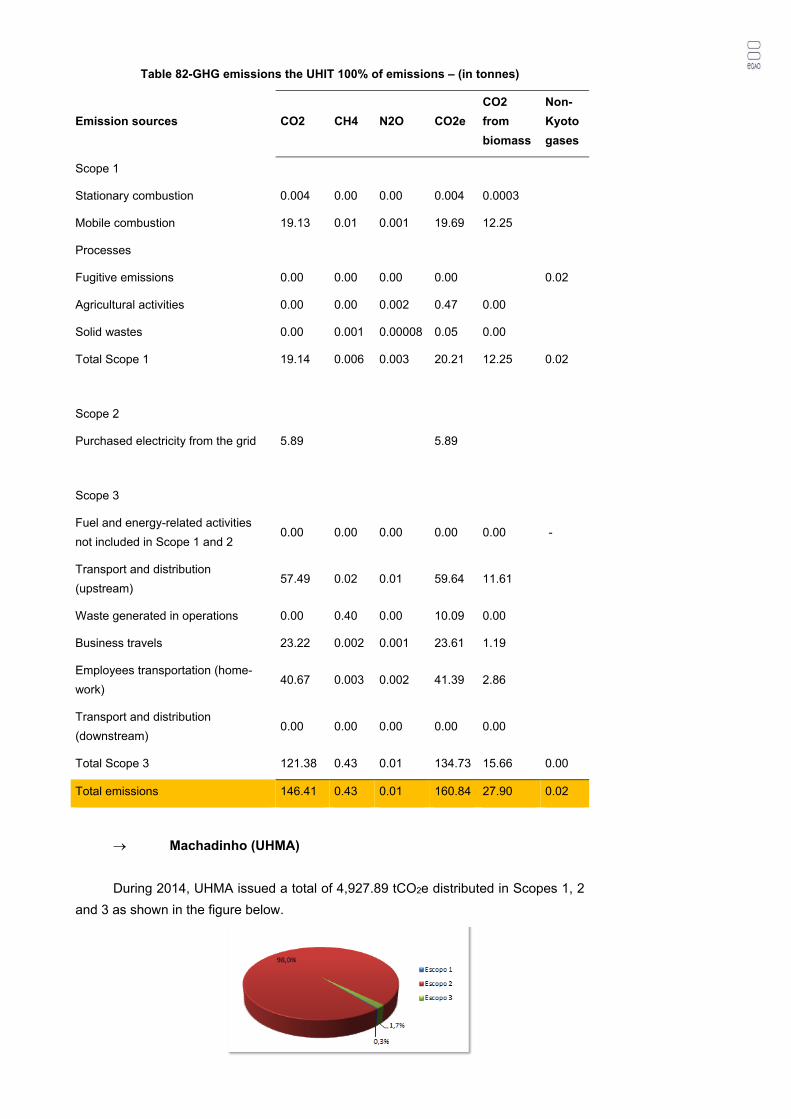
Table 82-GHG emissions the UHIT 100% of emissions – (in tonnes)
Emission sources CO2 CH4 N2O CO2e
CO2
from
biomass
Non-
Kyoto
gases
Scope 1
Stationary combustion 0.004 0.00 0.00 0.004 0.0003
Mobile combustion 19.13 0.01 0.001 19.69 12.25
Processes
Fugitive emissions 0.00 0.00 0.00 0.00 0.02
Agricultural activities 0.00 0.00 0.002 0.47 0.00
Solid wastes 0.00 0.001 0.00008 0.05 0.00
Total Scope 1 19.14 0.006 0.003 20.21 12.25 0.02
Scope 2
Purchased electricity from the grid 5.89 5.89
Scope 3
Fuel and energy-related activities
not included in Scope 1 and 2 0.00 0.00 0.00 0.00 0.00 -
Transport and distribution
(upstream) 57.49 0.02 0.01 59.64 11.61
Waste generated in operations 0.00 0.40 0.00 10.09 0.00
Business travels 23.22 0.002 0.001 23.61 1.19
Employees transportation (home-
work) 40.67 0.003 0.002 41.39 2.86
Transport and distribution
(downstream) 0.00 0.00 0.00 0.00 0.00
Total Scope 3 121.38 0.43 0.01 134.73 15.66 0.00
Total emissions 146.41 0.43 0.01 160.84 27.90 0.02
Machadinho (UHMA)
During 2014, UHMA issued a total of 4,927.89 tCO2e distributed in Scopes 1, 2
and 3 as shown in the figure below.
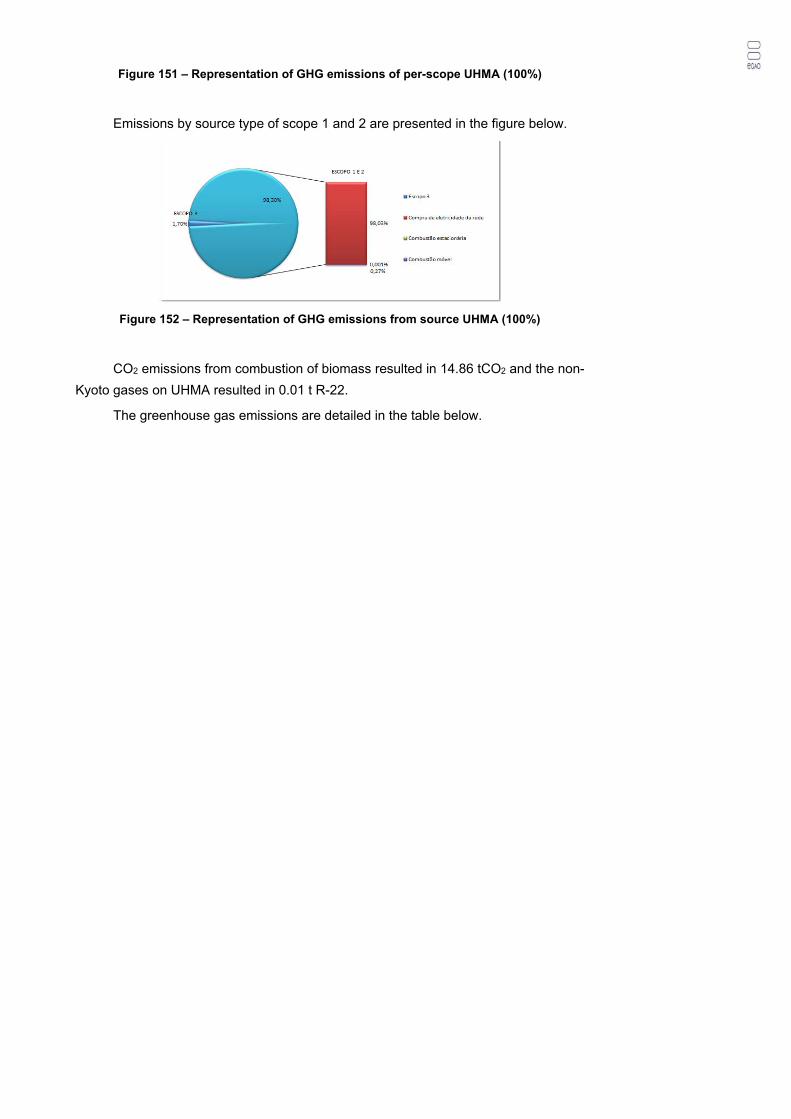
Figure 151 – Representation of GHG emissions of per-scope UHMA (100%)
Emissions by source type of scope 1 and 2 are presented in the figure below.
Figure 152 – Representation of GHG emissions from source UHMA (100%)
CO2 emissions from combustion of biomass resulted in 14.86 tCO2 and the non-
Kyoto gases on UHMA resulted in 0.01 t R-22.
The greenhouse gas emissions are detailed in the table below.
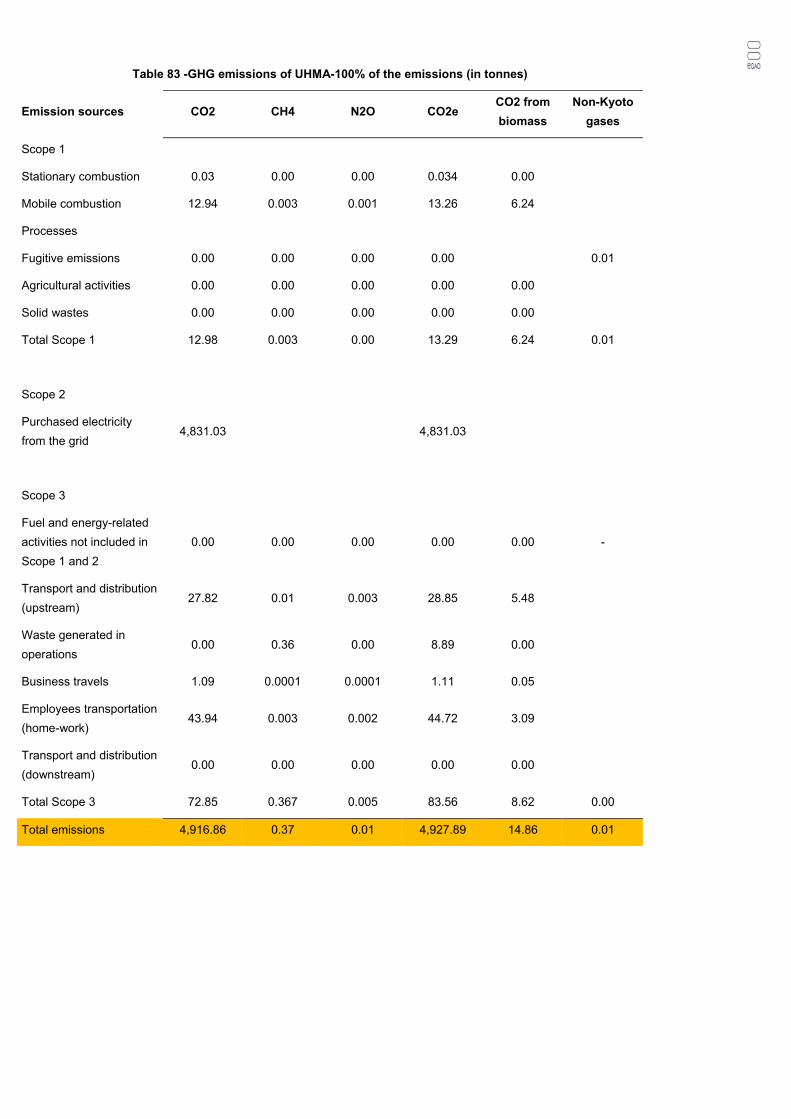
Table 83 -GHG emissions of UHMA-100% of the emissions (in tonnes)
Emission sources CO2 CH4 N2O CO2e CO2 from
biomass
Non-Kyoto
gases
Scope 1
Stationary combustion 0.03 0.00 0.00 0.034 0.00
Mobile combustion 12.94 0.003 0.001 13.26 6.24
Processes
Fugitive emissions 0.00 0.00 0.00 0.00 0.01
Agricultural activities 0.00 0.00 0.00 0.00 0.00
Solid wastes 0.00 0.00 0.00 0.00 0.00
Total Scope 1 12.98 0.003 0.00 13.29 6.24 0.01
Scope 2
Purchased electricity
from the grid 4,831.03 4,831.03
Scope 3
Fuel and energy-related
activities not included in
Scope 1 and 2
0.00 0.00 0.00 0.00 0.00 -
Transport and distribution
(upstream) 27.82 0.01 0.003 28.85 5.48
Waste generated in
operations 0.00 0.36 0.00 8.89 0.00
Business travels 1.09 0.0001 0.0001 1.11 0.05
Employees transportation
(home-work) 43.94 0.003 0.002 44.72 3.09
Transport and distribution
(downstream) 0.00 0.00 0.00 0.00 0.00
Total Scope 3 72.85 0.367 0.005 83.56 8.62 0.00
Total emissions 4,916.86 0.37 0.01 4,927.89 14.86 0.01
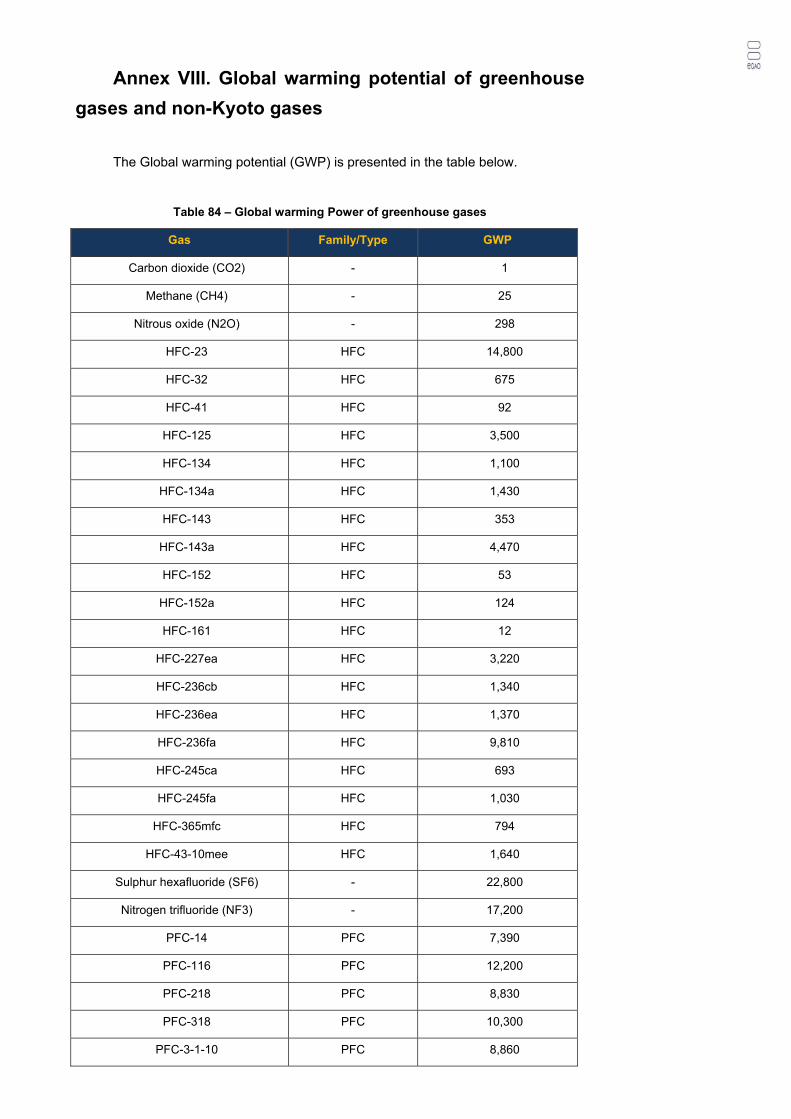
Annex VIII. Global warming potential of greenhouse
gases and non-Kyoto gases
The Global warming potential (GWP) is presented in the table below.
Table 84 – Global warming Power of greenhouse gases
Gas Family/Type GWP
Carbon dioxide (CO2) - 1
Methane (CH4) - 25
Nitrous oxide (N2O) - 298
HFC-23 HFC 14,800
HFC-32 HFC 675
HFC-41 HFC 92
HFC-125 HFC 3,500
HFC-134 HFC 1,100
HFC-134a HFC 1,430
HFC-143 HFC 353
HFC-143a HFC 4,470
HFC-152 HFC 53
HFC-152a HFC 124
HFC-161 HFC 12
HFC-227ea HFC 3,220
HFC-236cb HFC 1,340
HFC-236ea HFC 1,370
HFC-236fa HFC 9,810
HFC-245ca HFC 693
HFC-245fa HFC 1,030
HFC-365mfc HFC 794
HFC-43-10mee HFC 1,640
Sulphur hexafluoride (SF6) - 22,800
Nitrogen trifluoride (NF3) - 17,200
PFC-14 PFC 7,390
PFC-116 PFC 12,200
PFC-218 PFC 8,830
PFC-318 PFC 10,300
PFC-3-1-10 PFC 8,860
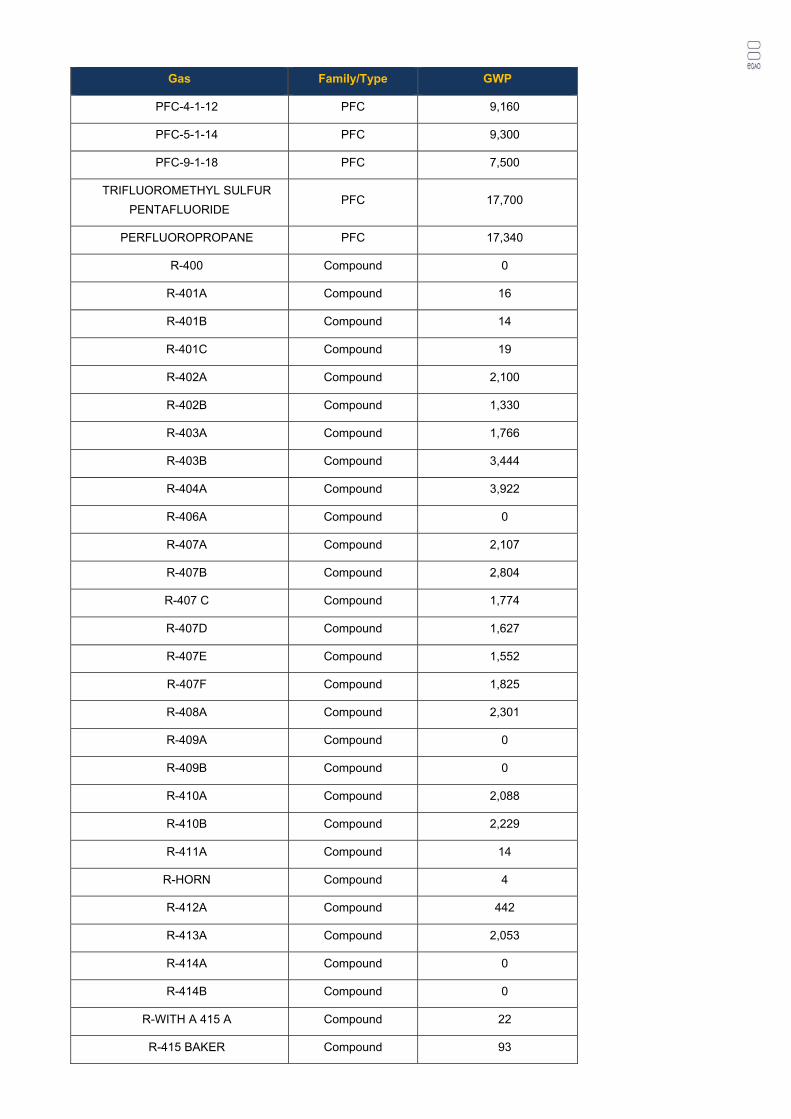
Gas Family/Type GWP
PFC-4-1-12 PFC 9,160
PFC-5-1-14 PFC 9,300
PFC-9-1-18 PFC 7,500
TRIFLUOROMETHYL SULFUR
PENTAFLUORIDE PFC 17,700
PERFLUOROPROPANE PFC 17,340
R-400 Compound 0
R-401A Compound 16
R-401B Compound 14
R-401C Compound 19
R-402A Compound 2,100
R-402B Compound 1,330
R-403A Compound 1,766
R-403B Compound 3,444
R-404A Compound 3,922
R-406A Compound 0
R-407A Compound 2,107
R-407B Compound 2,804
R-407 C Compound 1,774
R-407D Compound 1,627
R-407E Compound 1,552
R-407F Compound 1,825
R-408A Compound 2,301
R-409A Compound 0
R-409B Compound 0
R-410A Compound 2,088
R-410B Compound 2,229
R-411A Compound 14
R-HORN Compound 4
R-412A Compound 442
R-413A Compound 2,053
R-414A Compound 0
R-414B Compound 0
R-WITH A 415 A Compound 22
R-415 BAKER Compound 93
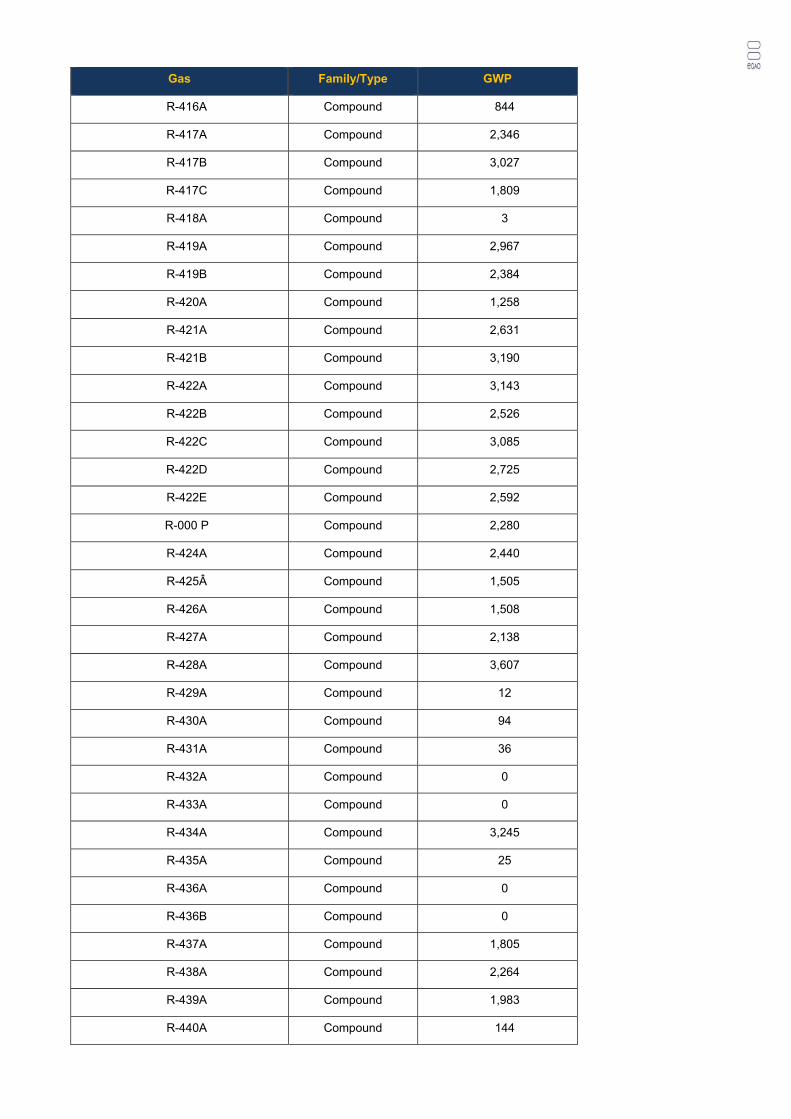
Gas Family/Type GWP
R-416A Compound 844
R-417A Compound 2,346
R-417B Compound 3,027
R-417C Compound 1,809
R-418A Compound 3
R-419A Compound 2,967
R-419B Compound 2,384
R-420A Compound 1,258
R-421A Compound 2,631
R-421B Compound 3,190
R-422A Compound 3,143
R-422B Compound 2,526
R-422C Compound 3,085
R-422D Compound 2,725
R-422E Compound 2,592
R-000 P Compound 2,280
R-424A Compound 2,440
R-425Â Compound 1,505
R-426A Compound 1,508
R-427A Compound 2,138
R-428A Compound 3,607
R-429A Compound 12
R-430A Compound 94
R-431A Compound 36
R-432A Compound 0
R-433A Compound 0
R-434A Compound 3,245
R-435A Compound 25
R-436A Compound 0
R-436B Compound 0
R-437A Compound 1,805
R-438A Compound 2,264
R-439A Compound 1,983
R-440A Compound 144
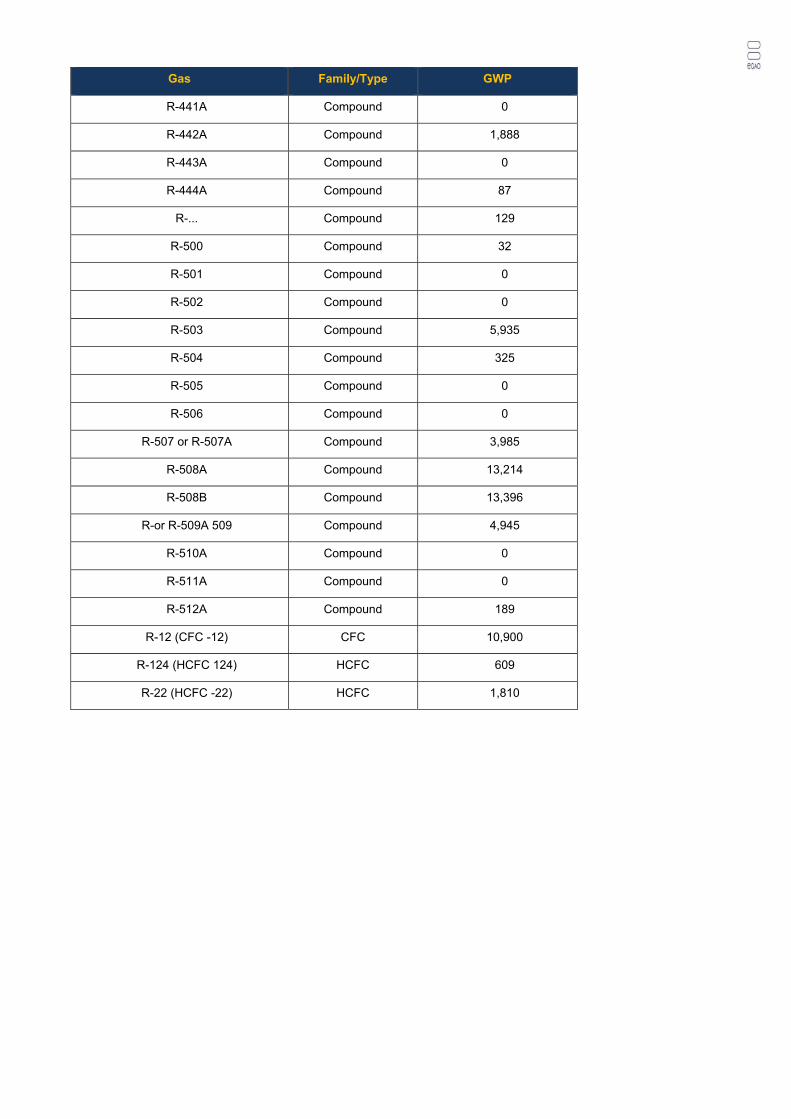
Gas Family/Type GWP
R-441A Compound 0
R-442A Compound 1,888
R-443A Compound 0
R-444A Compound 87
R-... Compound 129
R-500 Compound 32
R-501 Compound 0
R-502 Compound 0
R-503 Compound 5,935
R-504 Compound 325
R-505 Compound 0
R-506 Compound 0
R-507 or R-507A Compound 3,985
R-508A Compound 13,214
R-508B Compound 13,396
R-or R-509A 509 Compound 4,945
R-510A Compound 0
R-511A Compound 0
R-512A Compound 189
R-12 (CFC -12) CFC 10,900
R-124 (HCFC 124) HCFC 609
R-22 (HCFC -22) HCFC 1,810