ghg life-cycle comparisons full-electric medium- duty vehicles
TRANSCRIPT
GHG Life-Cycle Comparisons between Propane and Full-Electric Medium-Duty VehiclesGokul VishwanathanDirector, Research and SustainabilityPropane Education & Research CouncilNov. 3rd, 2021

This presentation is a condensed version of a white paper that was published last year
White paper with references can be downloaded from Propane Education & Research Council (PERC) website:
https://propane.com/research-development/emissions/decarbonization-of-md-hd-vehicles-with-propane/

What is Renewable Propane?
Source: NREL and Abhari, et al. Process for producing jet fuel and LPG from renewable sources. 7,846,323 B2, 2010
5 – 6 wt% Propane
6-7 wt% C3 + C4
• Isomerize• Crack
• Hydrogenate double bonds
• Deoxygenate
• Potential yield of propane ~ 5-7% (wt.%) depending on the end-product (Renewable Diesel (RD) or Sustainable Aviation Fuel (SAF))
Used cooking oil (e.g., soybean)
Fossil or green Fossil or green
Triglyceride

• Over 790M Gal/y (2.4M t/y) RD/SAF production in service →~68M gallons potential• Claimed growth of RD/SAF to over 6.3B Gal/y (19M t/y) → ~540M gallons potential• Highest capacity in Louisiana area > 2.5B Gal/y (7.8M t/y), California > 1.8B Gal/y (5.7M
t/y)• None on the east coast
Commercial HEFA/HVO Production of RD and SAF - USA
Company Location Existing Gal/y
Additional Gal/y
Technology
1 Renewable Energy Group Geismar, LA 90M 250M Expanding 2023
2 Diamond Green – Valero Norco, LA 290M 400M Expanding 2021 Ecofining
3 Marathon Dickinson, ND 180M HydroFlex
4 NextChem/ Saola Energy Garnett, KA 5M
5 BP Cherry Point Birch Bay, WA 42M
6 World Energy Paramount, CA 35M 230M Expanding 2023
7 Sinclair/HollyFrontier Sinclair, WY 150M 240M
8 CVR Wynnewood Wynnewood, OK 100M Under construction HydroFlex
9 Diamond Green – Valero Port Arthur, TX 470M Under construction 2024
10 Emerald Biofuels Port Arthur, TX 110M Under construction
11 Green Fuels Port of Columbia, LA 32M Planning 2025
12 Holly Cheyenne, Wy 90M Planning 2022
13 Marathon Martinez, CA 730M Converting 2023 HydroFlex
14 Next Renewables Columbia River, OR 750M Planned 2024
15 Phillips 66 Rodeo, CA 650M Planning 2024
16 Ryze Renewables Las Vegas, NV 100M Planning
17 Ryze Renewables Reno, NV 50M Planning
18 St Josheph Renewable Fuels Newton, IL 90M Planning
19 Bakersfield Renewable Fuels Bakersfield, CA 230M Converting 2022 HydroFlex
20 HollyFrontier Artesia, NM 110M Converting 2022
21 Grön Fuels Baton Rouge, LA 900M Planning 2030
Total 792M 5,532M
Biofuels Digest, Feb. 2021. https://www.biofuelsdigest.com/bdigest/2021/02/08/50-renewable-diesel-projects-and-the-technologies-behind-them/10/ , Biodiesel Magazine, Jan. 2021.
83.19
3326
20.526.5
37.5 38.543.5
27 28.5
0
10
20
30
40
50
60
70
80
90
Fossil Distilled corn oil NA sourced usedcooking oil
US sourced non-rendered used
cooking oil
SA sourced usedcooking oil
NA sourcedanimal fat
(tallow)
SA sourcedanimal fat
(tallow)
Asia pacificsourced animal
fat (tallow)
SanimaxMontreal animal
fat (tallow)
Sanimax USAanimal fat
(tallow)
Car
bo
n In
ten
sity
(gC
O2
eq/M
J)
Feedstock Source
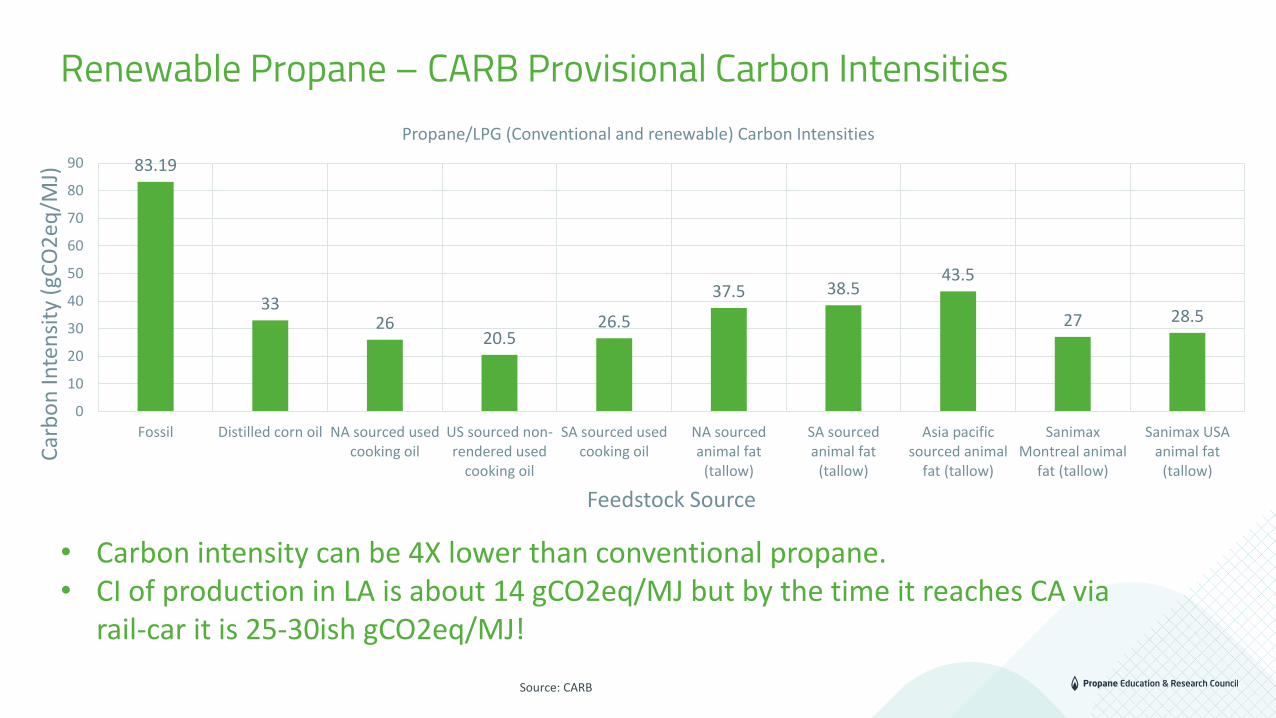
Propane/LPG (Conventional and renewable) Carbon Intensities
Renewable Propane – CARB Provisional Carbon Intensities
• Carbon intensity can be 4X lower than conventional propane.• CI of production in LA is about 14 gCO2eq/MJ but by the time it reaches CA via
rail-car it is 25-30ish gCO2eq/MJ!
Source: CARB
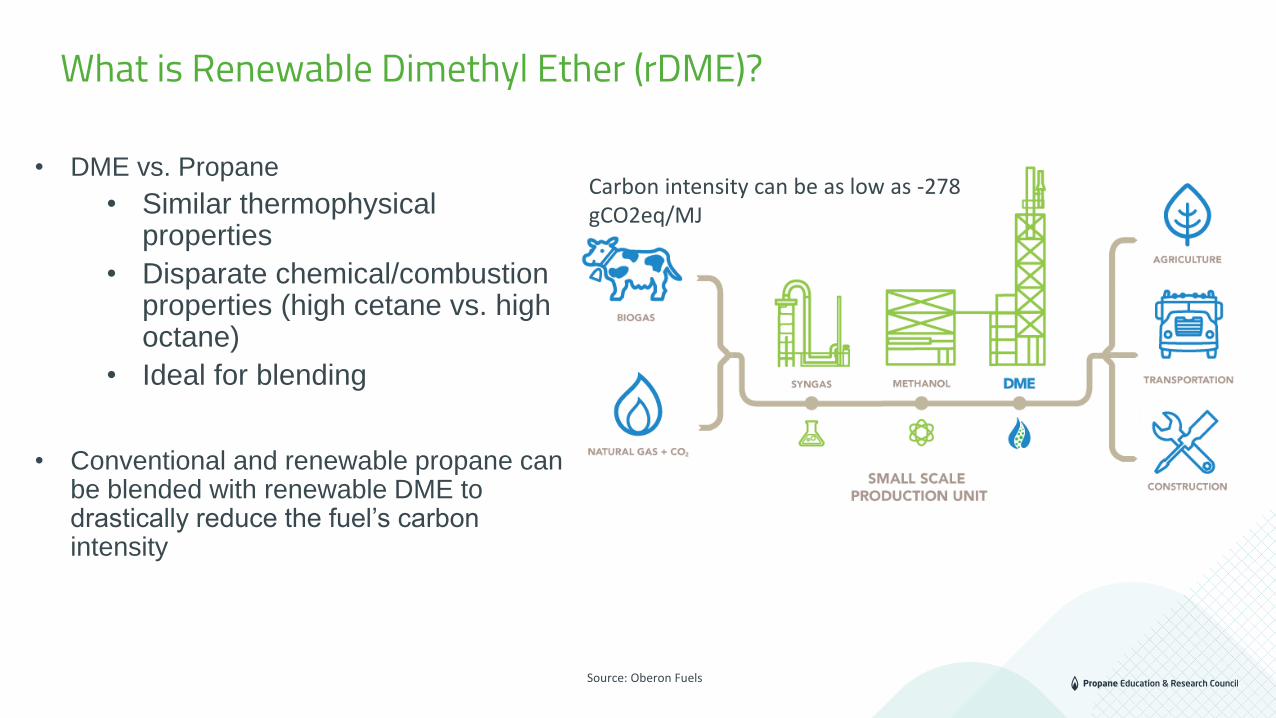
What is Renewable Dimethyl Ether (rDME)?
• DME vs. Propane
• Similar thermophysical properties
• Disparate chemical/combustion properties (high cetane vs. high octane)
• Ideal for blending
• Conventional and renewable propane can be blended with renewable DME to drastically reduce the fuel’s carbon intensity
Source: Oberon Fuels
Carbon intensity can be as low as -278 gCO2eq/MJ

What is Renewable Dimethyl Ether (rDME)?
ALL models are wrong, but some are useful
– British Statistician George E.P. Box
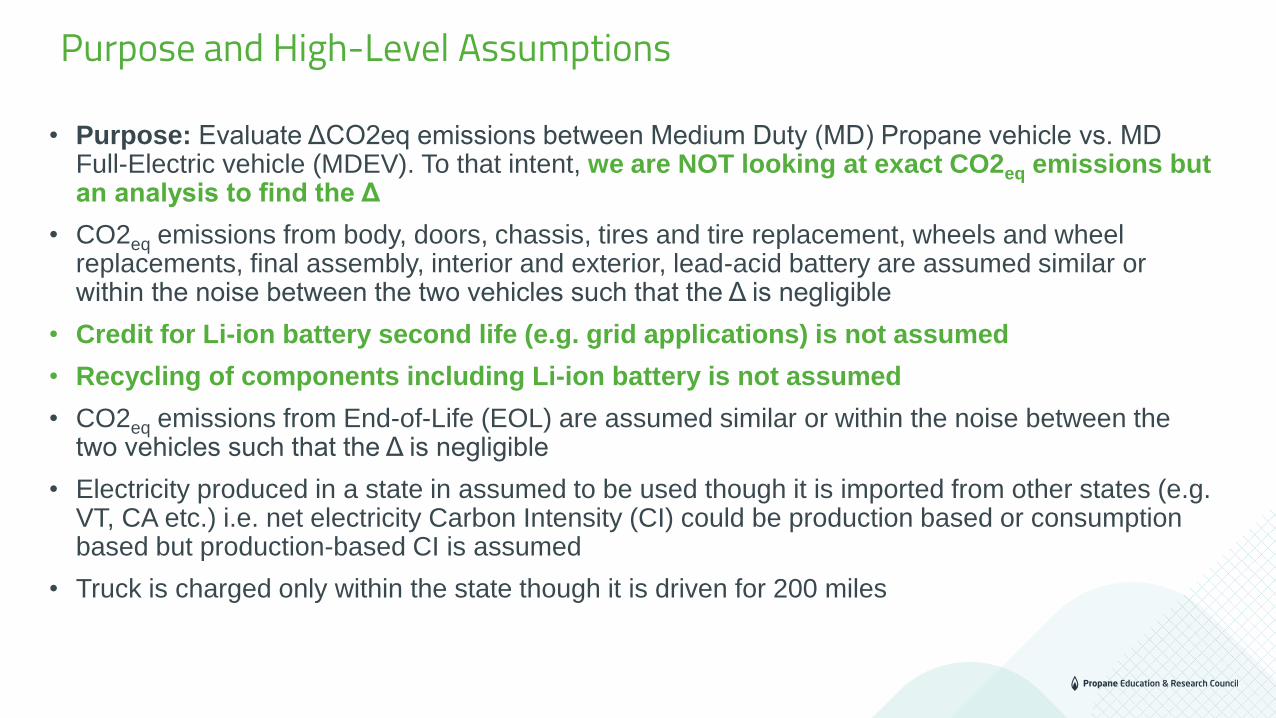
• Purpose: Evaluate ΔCO2eq emissions between Medium Duty (MD) Propane vehicle vs. MD Full-Electric vehicle (MDEV). To that intent, we are NOT looking at exact CO2eq emissions but an analysis to find the Δ
• CO2eq emissions from body, doors, chassis, tires and tire replacement, wheels and wheel replacements, final assembly, interior and exterior, lead-acid battery are assumed similar or within the noise between the two vehicles such that the Δ is negligible
• Credit for Li-ion battery second life (e.g. grid applications) is not assumed
• Recycling of components including Li-ion battery is not assumed
• CO2eq emissions from End-of-Life (EOL) are assumed similar or within the noise between the two vehicles such that the Δ is negligible
• Electricity produced in a state in assumed to be used though it is imported from other states (e.g. VT, CA etc.) i.e. net electricity Carbon Intensity (CI) could be production based or consumption based but production-based CI is assumed
• Truck is charged only within the state though it is driven for 200 miles
Purpose and High-Level Assumptions
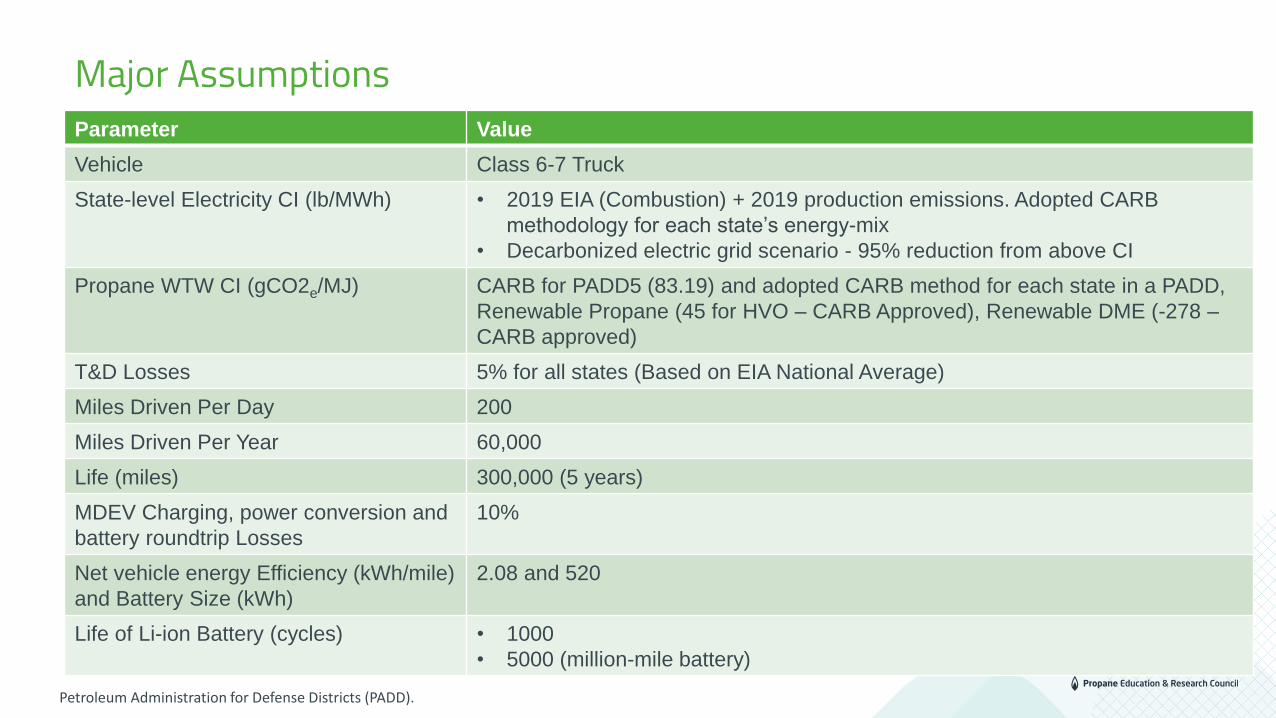
Major AssumptionsParameter Value
Vehicle Class 6-7 Truck
State-level Electricity CI (lb/MWh) • 2019 EIA (Combustion) + 2019 production emissions. Adopted CARB
methodology for each state’s energy-mix
• Decarbonized electric grid scenario - 95% reduction from above CI
Propane WTW CI (gCO2e/MJ) CARB for PADD5 (83.19) and adopted CARB method for each state in a PADD,
Renewable Propane (45 for HVO – CARB Approved), Renewable DME (-278 –
CARB approved)
T&D Losses 5% for all states (Based on EIA National Average)
Miles Driven Per Day 200
Miles Driven Per Year 60,000
Life (miles) 300,000 (5 years)
MDEV Charging, power conversion and
battery roundtrip Losses
10%
Net vehicle energy Efficiency (kWh/mile)
and Battery Size (kWh)
2.08 and 520
Life of Li-ion Battery (cycles) • 1000
• 5000 (million-mile battery)
Petroleum Administration for Defense Districts (PADD).

Major AssumptionsParameter Value
Battery Manufacturing CO2eq Emissions
(kgCO2eq/kWh)
• 140 (ICCT Study)
• 61 (Decarbonized electric grid scenario)
Regenerative Braking Energy Savings 20%
Propane Vehicle MPG • 5.5 for propane and renewable propane
• 5.3 when blended with DME due to its 3% lower energy content
Engine Peak Power (kW) 260
Accounted for:
• GHG footprint of engine, after-treatment and transmission production
• GHG footprint of fluids for MDEV and Propane vehicle and their replacement
• GHG footprint of MDEV motor, inverter, controller, transmission and cooling system
• MDEV service interval – 40,000 miles. Propane vehicle service interval (oil - 5,000 miles, radiator coolant –15,000 miles and all others – 40,000 miles)

Boundary of LCA
Vehicle Production
Powertrain Production
Vehicle Usage
Fuel Production/Electricity Generation
Vehicle Maintenance
End of Life
Waste material recycling/disposal
Parts recycling/disposal
Parts recycling/disposal
Powertrain Maintenance
Adapted from Kawamoto et al. (2020). Estimation of CO2eq Emissions of Internal Combustion Engine Vehicle and Battery Electric Vehicle Using LCA, Sustainability, 2019
Individually Calculated
Not calculated assuming negligible Δ Out of scope
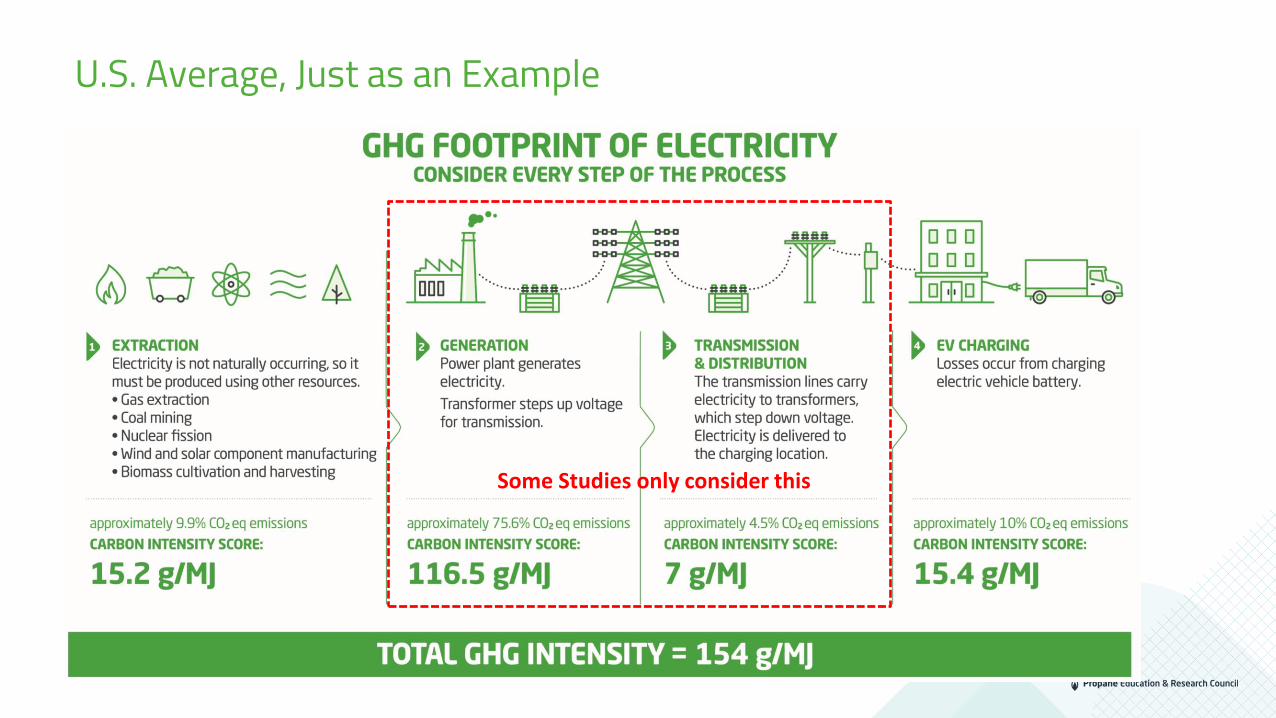
U.S. Average, Just as an Example
Some Studies only consider this
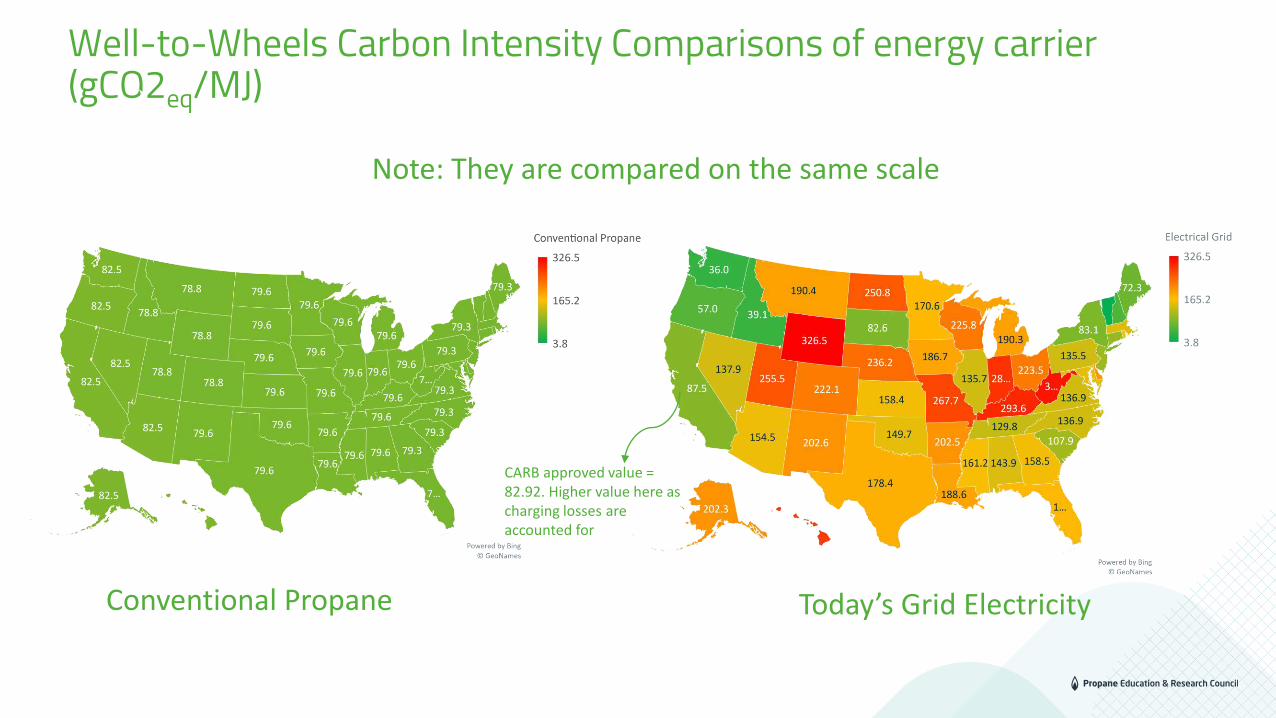
Well-to-Wheels Carbon Intensity Comparisons of energy carrier (gCO2eq/MJ)
Note: They are compared on the same scale
CARB approved value = 82.92. Higher value here as charging losses are accounted for
Conventional Propane Today’s Grid Electricity

Simulated CasesCase Detail
Case I Comparison of conventional propane vehicle vs. MDEV
Case II Comparison of renewable propane vehicle vs. MDEV
Case III Comparison of propane/renewable DME blend (80%-20% by mass) vehicle vs. MDEV
Case IV Comparison of renewable propane/renewable DME blend (80%-20% by mass) vehicle vs. MDEV
• Renewable fuel and components production CIs assumed the same as status-quo even under decarbonized electric grid scenario. In reality, the CI of renewable fuels and production CIs will be lower due to cleaner electricity. Calculation of these are out-of-scope
• Propane vehicle fuel economy has been kept the same as status-quo even under decarbonized electric grid scenario. In reality, the fuel economy will improve significantly due to evolution of engine technologies (~25 years from now)

Case-I: ΔCO2eq for One Truck: Green - Propane is Better, Red – MDEV is better
Today, Propane is a cleaner solution for 38 states and DC
Numbers represent ΔLC CO2 emissions in US tons per MD vehicle

Case-II: ΔCO2eq for One Truck: Green – Renewable Propane is Better, Red – MDEV is better
Today, Renewable Propane is a cleaner solution for all states (and DC) but Vermont
Numbers represent ΔLC CO2 emissions in US tons per MD vehicle
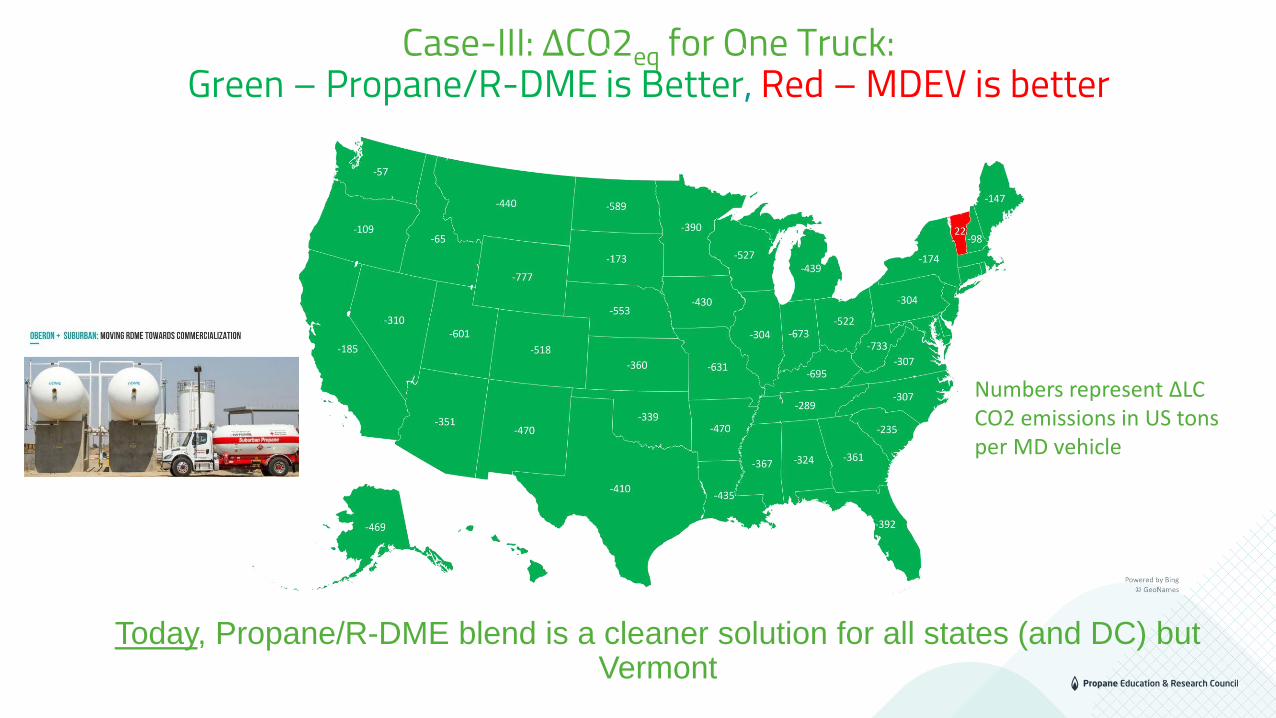
Case-III: ΔCO2eq for One Truck: Green – Propane/R-DME is Better, Red – MDEV is better
Today, Propane/R-DME blend is a cleaner solution for all states (and DC) but Vermont
Numbers represent ΔLC CO2 emissions in US tons per MD vehicle
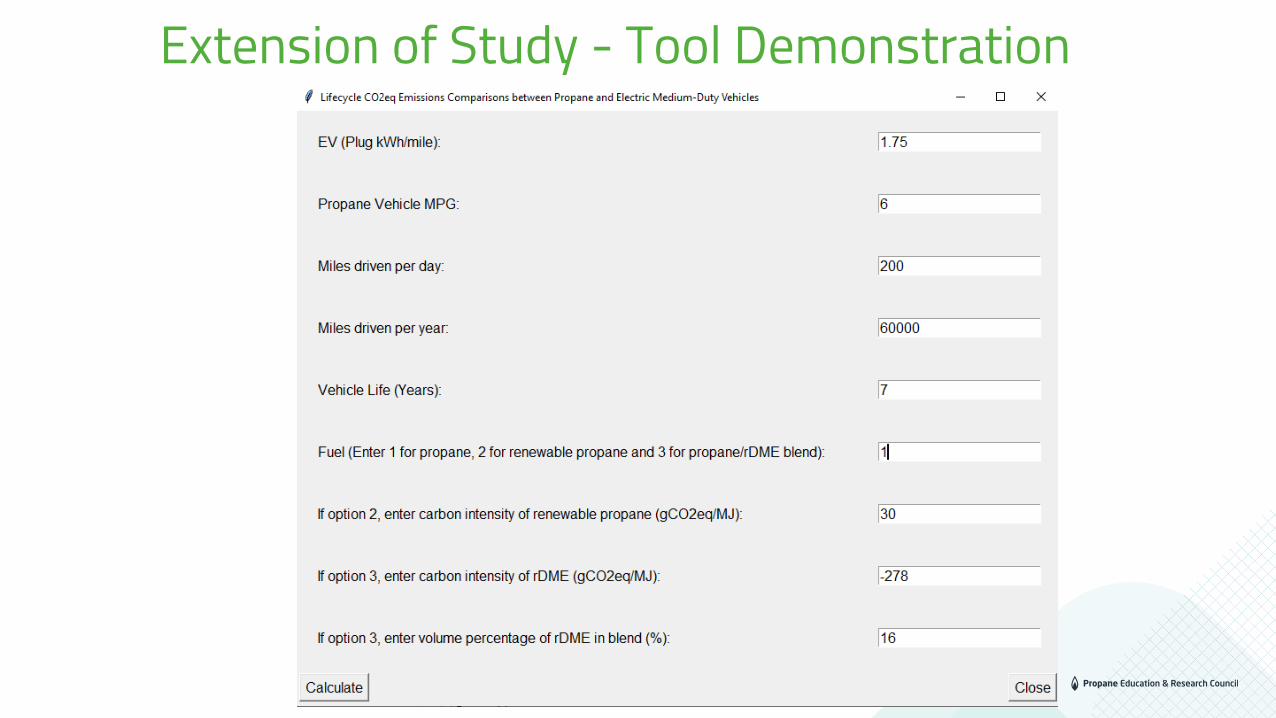
Extension of Study - Tool Demonstration

Conventional Propane MDVs & EVs - CO2eq Emissions
“Average” Grid Emissions28 states/territories propane MDVs are better24 states/territories EVs are better
“Marginal” Grid Emissions49 states/territories propane MDVs are better3 states/territories EVs are better (Hydroelectric dominated)
Policies are made considering “average” emissions

Conventional Propane MDVs & EVs - NOx Emissions
“Average” Grid Emissions44 states/territories propane ultra-low NOx MDVs are better8 states/territories EVs are better
“Marginal” Grid Emissions51 states/territories propane ultra-low NOx MDVs are better1 state EVs are better (Hydro-electric dominated)
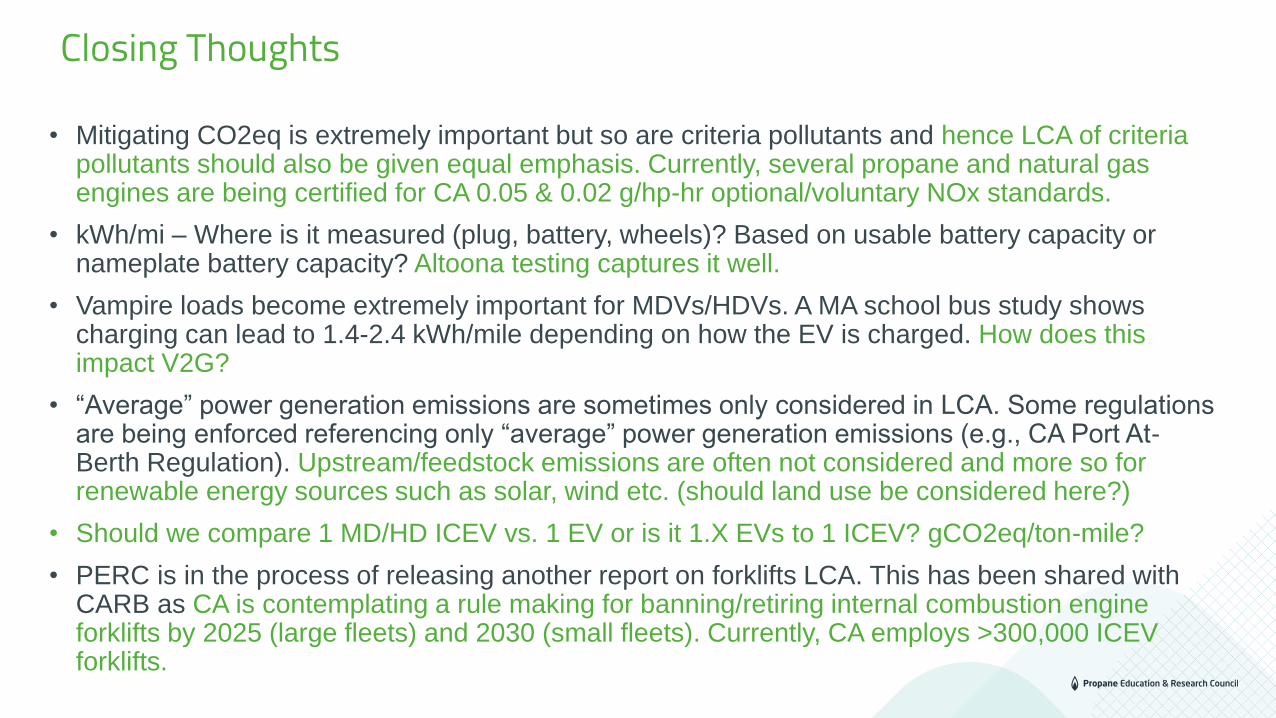
• Mitigating CO2eq is extremely important but so are criteria pollutants and hence LCA of criteria pollutants should also be given equal emphasis. Currently, several propane and natural gas engines are being certified for CA 0.05 & 0.02 g/hp-hr optional/voluntary NOx standards.
• kWh/mi – Where is it measured (plug, battery, wheels)? Based on usable battery capacity or nameplate battery capacity? Altoona testing captures it well.
• Vampire loads become extremely important for MDVs/HDVs. A MA school bus study shows charging can lead to 1.4-2.4 kWh/mile depending on how the EV is charged. How does this impact V2G?
• “Average” power generation emissions are sometimes only considered in LCA. Some regulations are being enforced referencing only “average” power generation emissions (e.g., CA Port At-Berth Regulation). Upstream/feedstock emissions are often not considered and more so for renewable energy sources such as solar, wind etc. (should land use be considered here?)
• Should we compare 1 MD/HD ICEV vs. 1 EV or is it 1.X EVs to 1 ICEV? gCO2eq/ton-mile?
• PERC is in the process of releasing another report on forklifts LCA. This has been shared with CARB as CA is contemplating a rule making for banning/retiring internal combustion engine forklifts by 2025 (large fleets) and 2030 (small fleets). Currently, CA employs >300,000 ICEV forklifts.
Closing Thoughts
Gokul Vishwanathan, PhD
Director, Research and Sustainability
t 202-452-8975 / c 202-843-5128
https://www.linkedin.com/in/gokul-vishwanathan-1906301b/
1140 Connecticut Ave. NW
Suite 1075
Washington, DC 20036
Contact Information
E-mail: [email protected]