ghent youth soccer project talent identification growth and maturation age effects in soccer
TRANSCRIPT

Ghent Youth Soccer Project
Talent identification
Growth and maturation
Age effects in soccer

Ghent Youth Soccer Project
Development of a
Multidisciplinary Talent Identification and Training Model
in Youth Soccer
Purposes GYSP
1. Training model in youth soccer during adolescence: problem of maturation
2. Talent identification: multidisciplinary
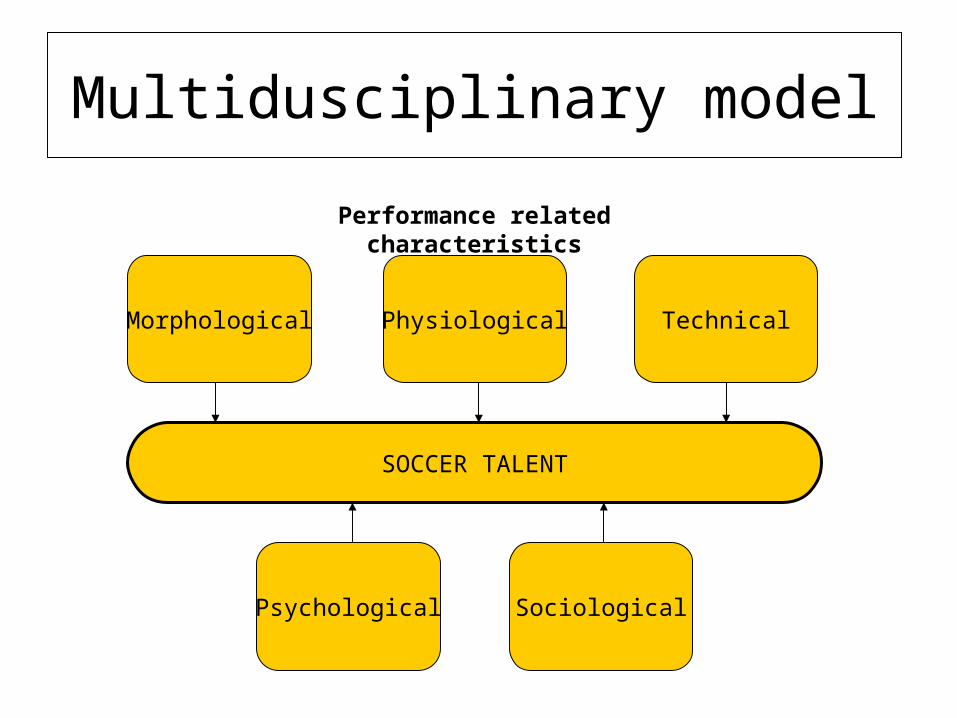
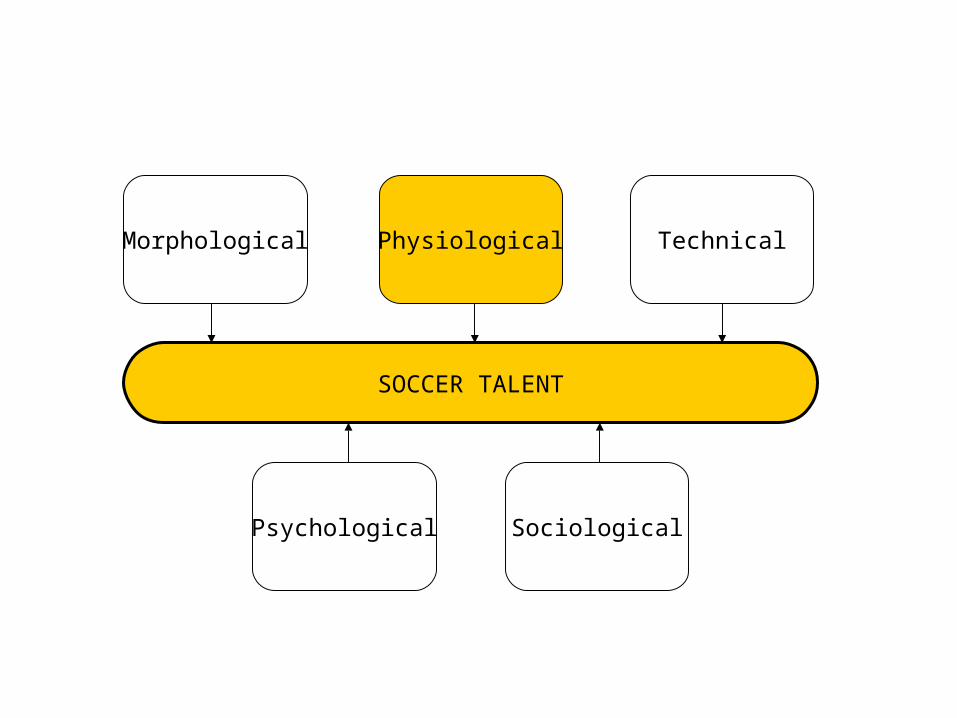
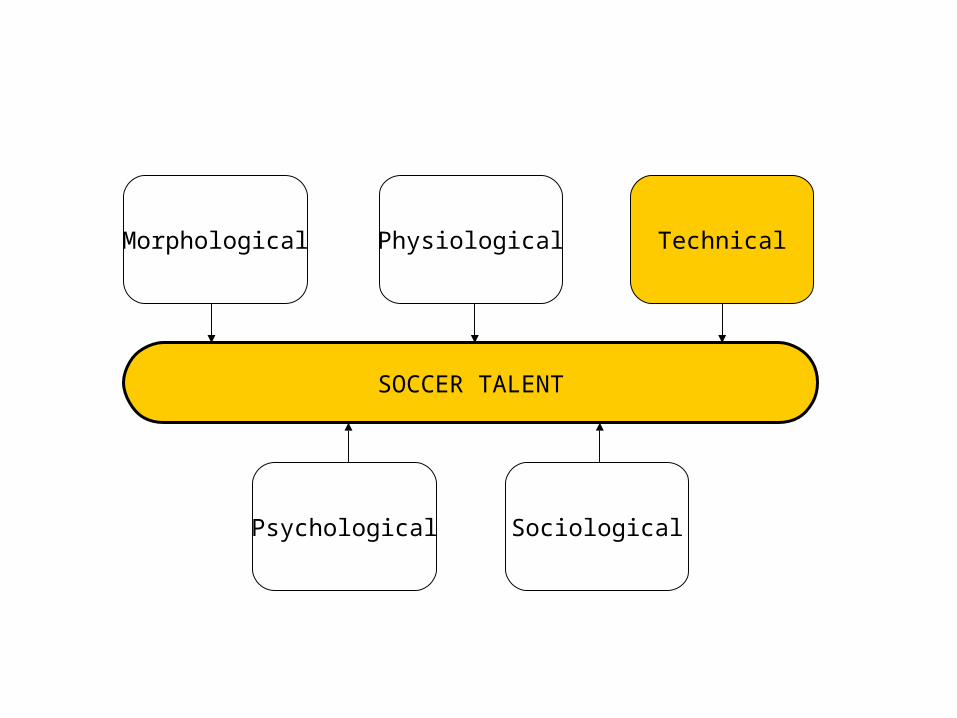
Multidusciplinary model
Psychological Sociological
SOCCER TALENT
Morphological Physiological Technical
Performance related characteristics
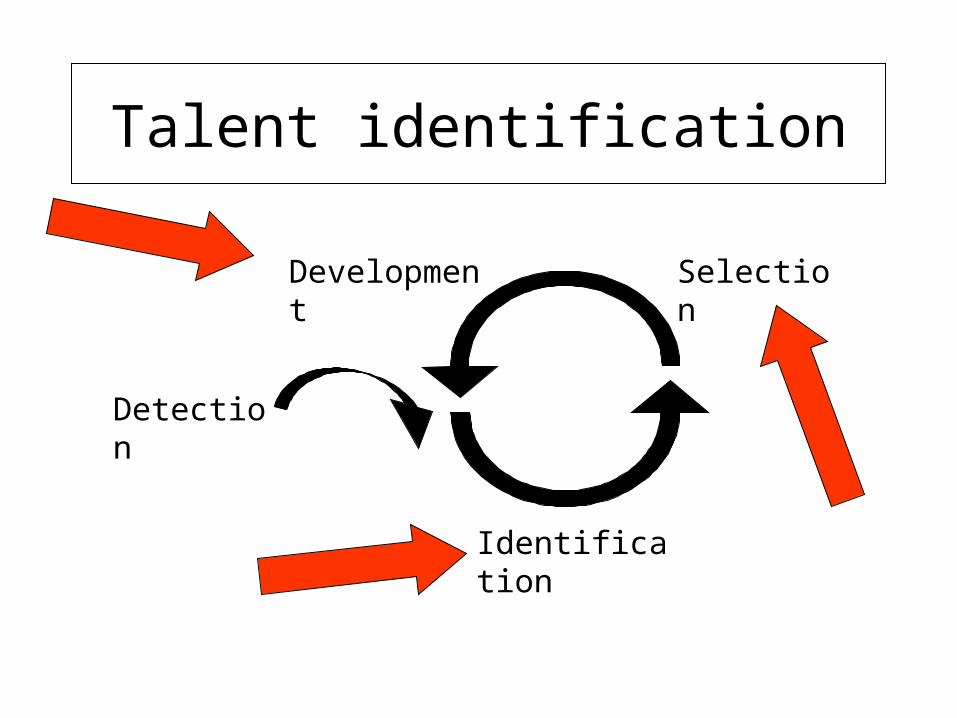
Talent identification
Detection
Identification
SelectionDevelopment
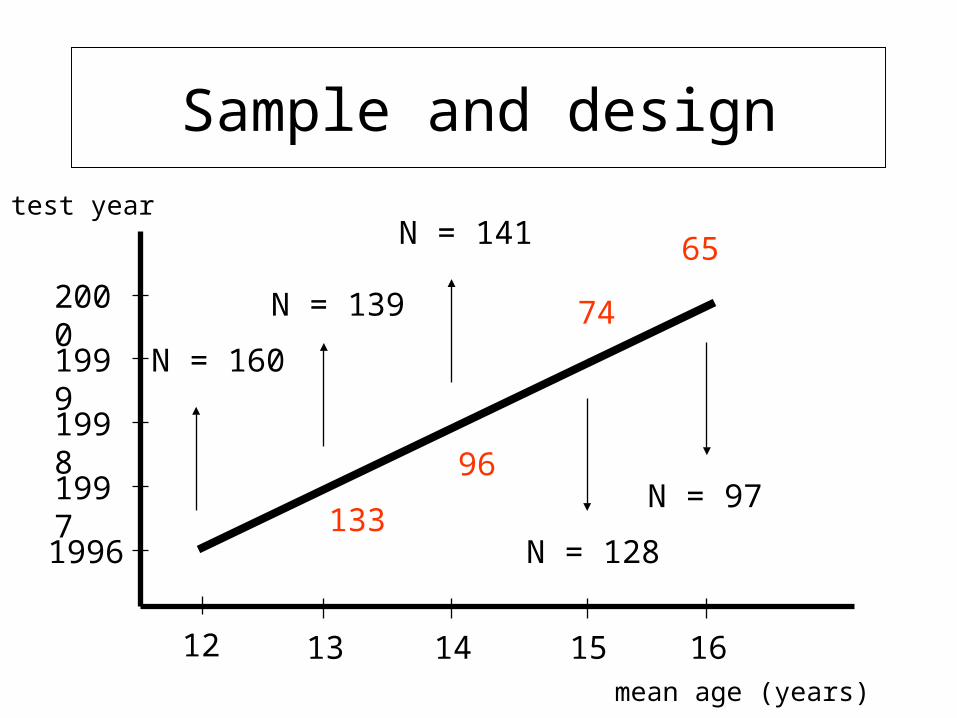
Sample and design
mean age (years)
test year
12 13
1996
1997
N = 160
14 15 16
2000
1999
1998
N = 139
N = 141
N = 128
N = 97133
96
74
65
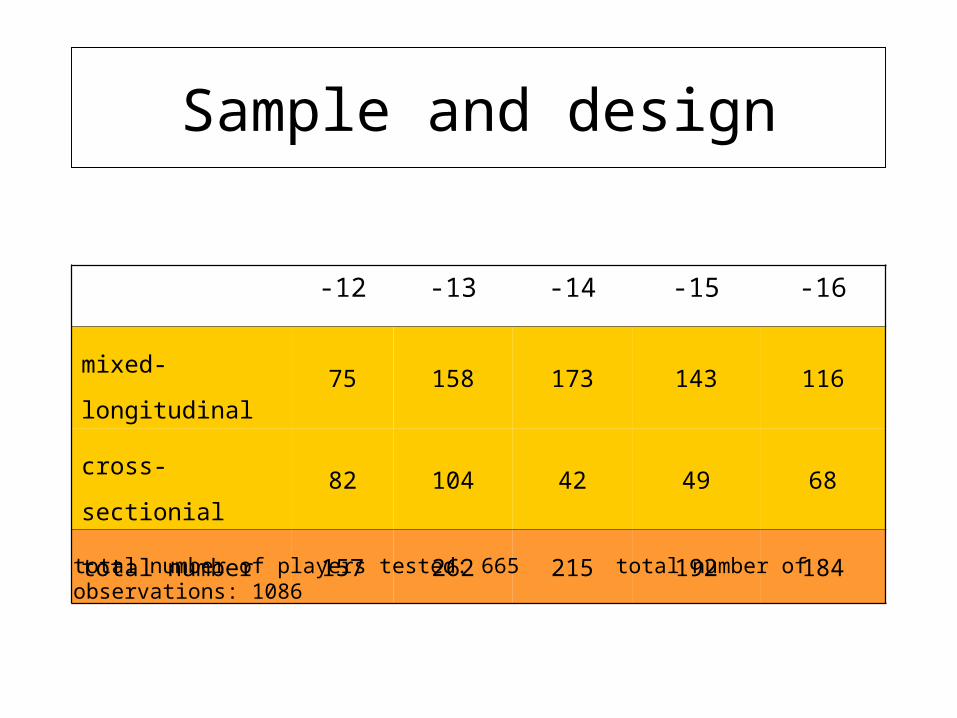
Sample and design
-12 -13 -14 -15 -16
mixed-longitudinal 75 158 173 143 116
cross-sectionial 82 104 42 49 68
total number 157 262 215 192 184
total number of players tested: 665 total number of observations: 1086

Psychological Sociological
SOCCER TALENT
Morphological Physiological Technical

• Height and weight
• 10 skinfolds
• Breadth measurements
• Circumferences
• Skeletal maturation (TW2)
• Secundary sexual characteristics (Tanner stages)
Psychological Sociological
SOCCER TALENT
Morphological Physiological Technical
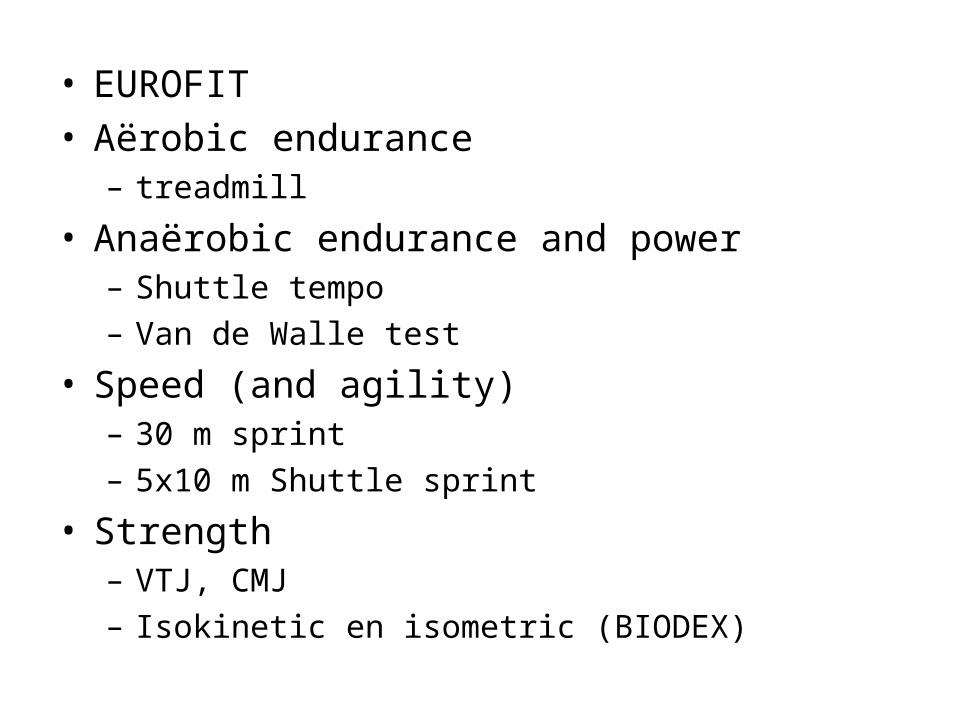
• EUROFIT• Aërobic endurance
– treadmill
• Anaërobic endurance and power– Shuttle tempo
– Van de Walle test
• Speed (and agility)– 30 m sprint
– 5x10 m Shuttle sprint
• Strength– VTJ, CMJ
– Isokinetic en isometric (BIODEX)
Psychological Sociological
SOCCER TALENT
Morphological Physiological Technical
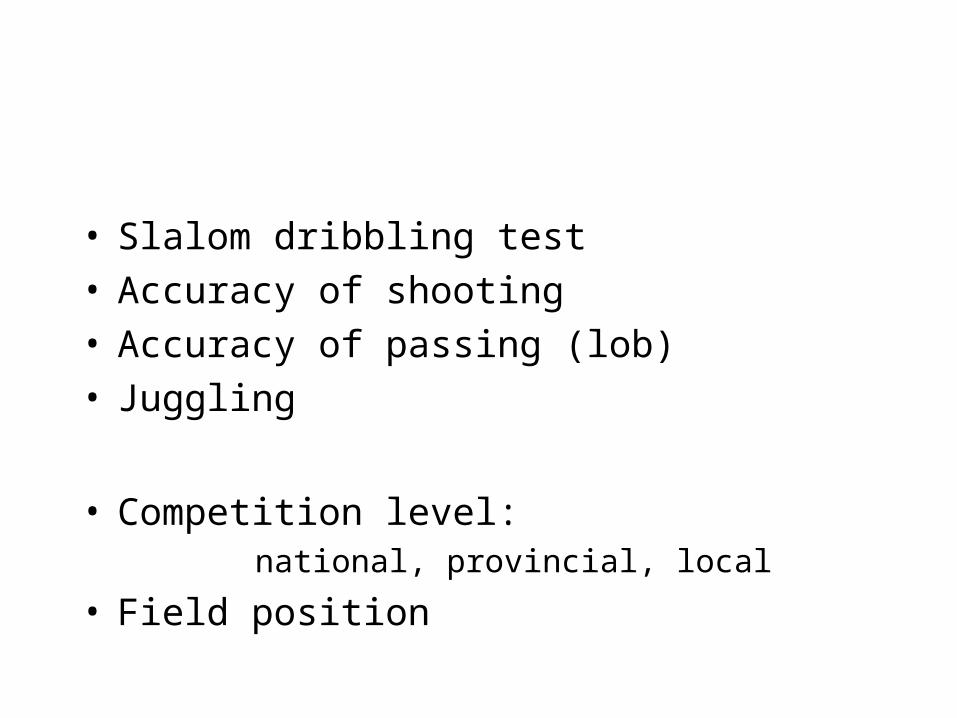
• Slalom dribbling test• Accuracy of shooting• Accuracy of passing (lob)• Juggling
• Competition level:national, provincial, local
• Field position

Psychological Sociological
SOCCER TALENT
Morphological Physiological Technical
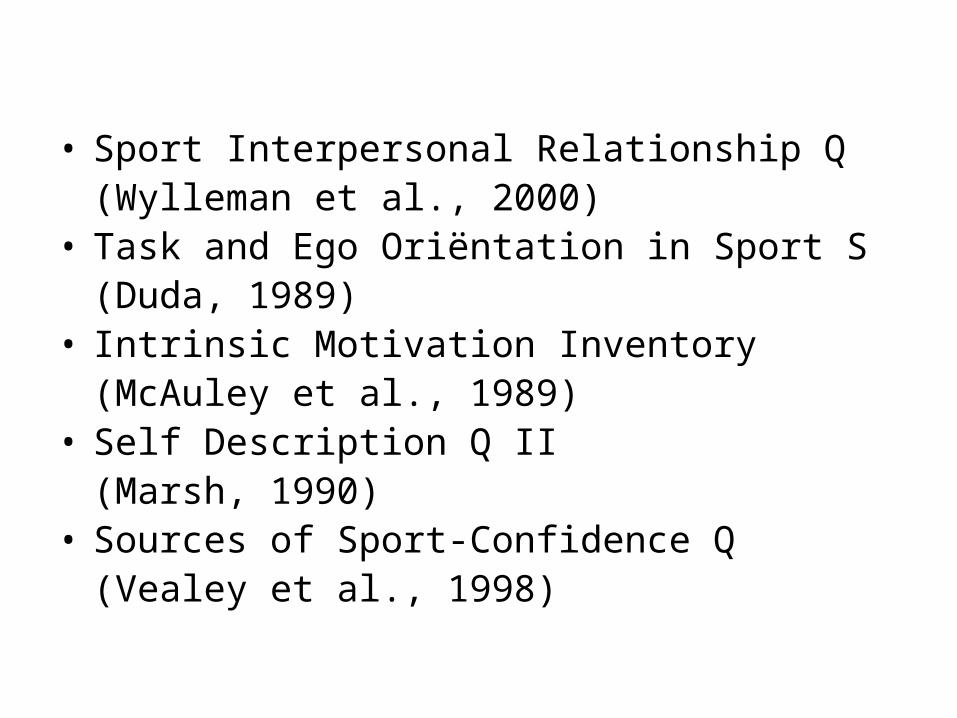
• Sport Interpersonal Relationship Q(Wylleman et al., 2000)
• Task and Ego Oriëntation in Sport S(Duda, 1989)
• Intrinsic Motivation Inventory(McAuley et al., 1989)
• Self Description Q II(Marsh, 1990)
• Sources of Sport-Confidence Q(Vealey et al., 1998)
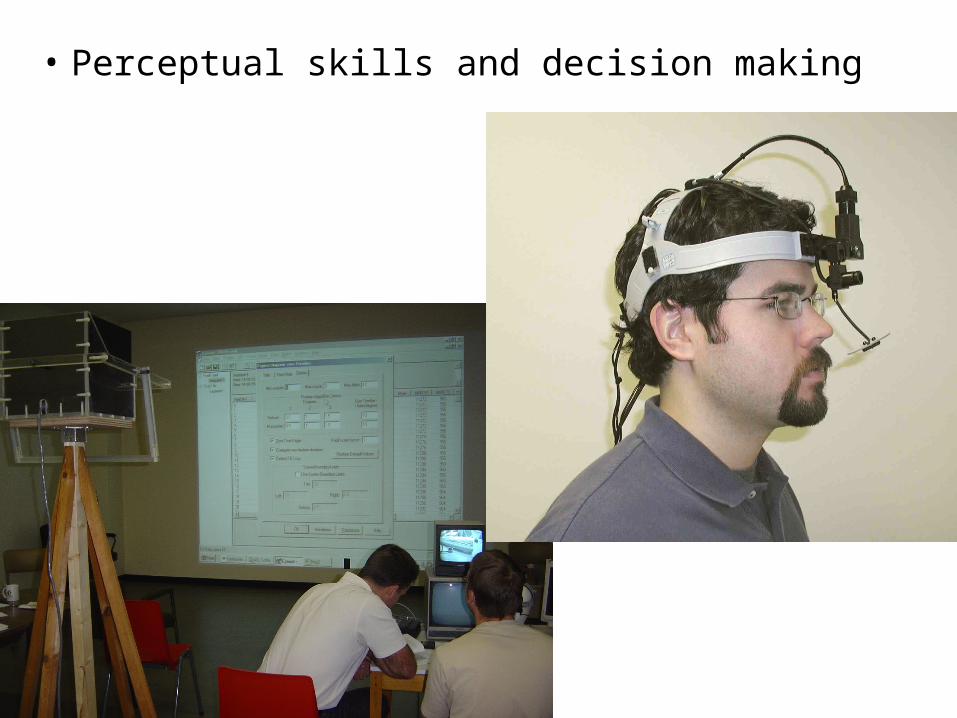
• Perceptual skills and decision making

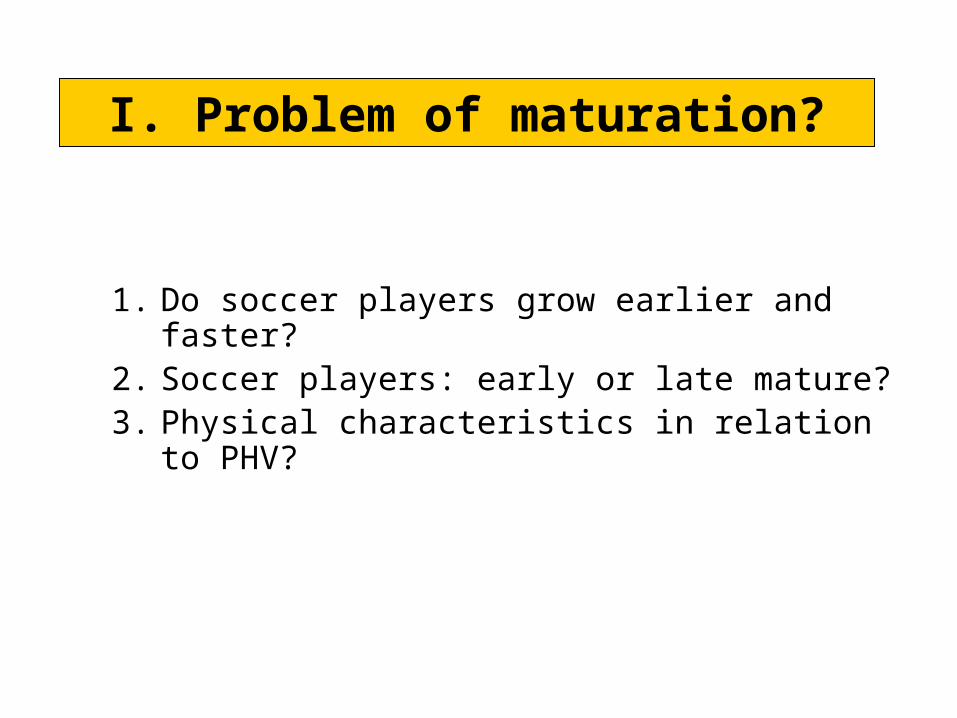
1. Do soccer players grow earlier and faster?2. Soccer players: early or late mature?3. Physical characteristics in relation to
PHV?
I. Problem of maturation?
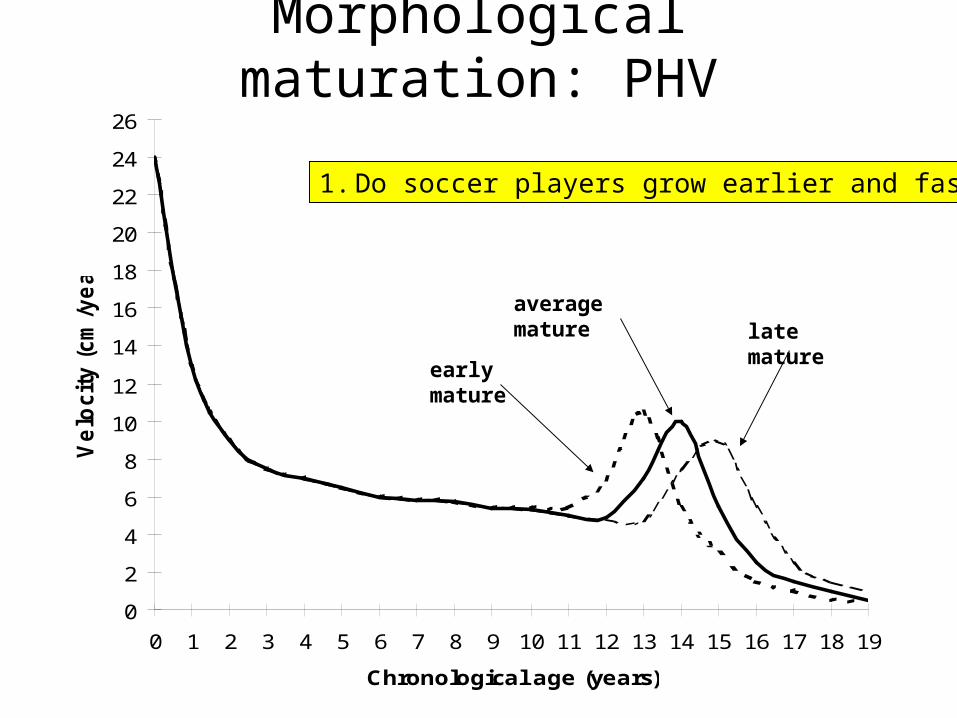
Morphological maturation: PHV
0
2
4
6
8
10
12
14
16
18
20
22
24
26
0 1 2 3 4 5 6 7 8 9 10 11 12 13 14 15 16 17 18 19
Chronological age (years)
Ve
locit
y (
cm
/ye
ar)
early mature
average maturelate mature
1. Do soccer players grow earlier and faster?
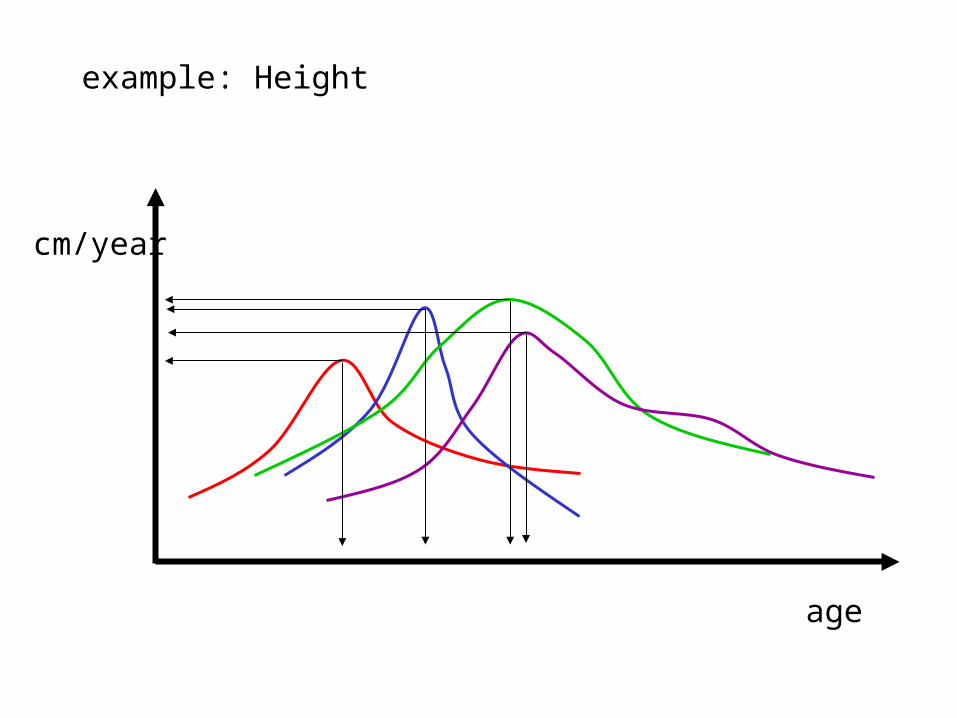
age
cm/year
example: Height
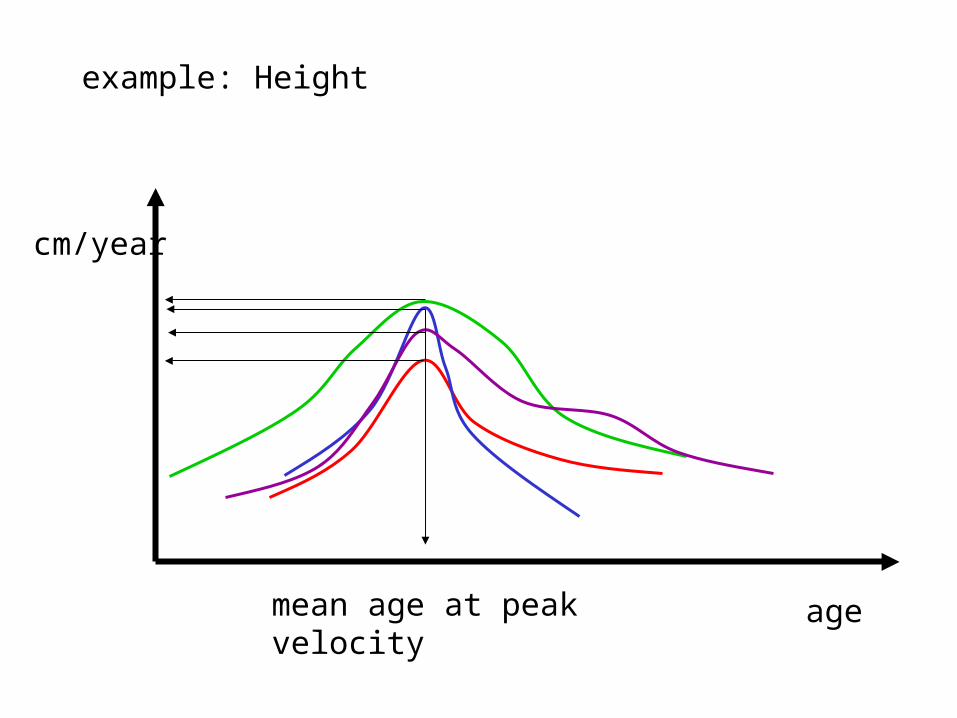
age
cm/year
mean age at peak velocity
example: Height

Height and weight
0
2
4
6
8
10
12
-18 -12 -6 PHV 6 12 18
Months from PHV
He
igh
t (c
m/y
ea
r)
0
2
4
6
8
10
12
-18 -12 -6 PHV 6 12 18
We
igh
t (k
g/y
ea
r)
height
weightAPHV = 13.8 years
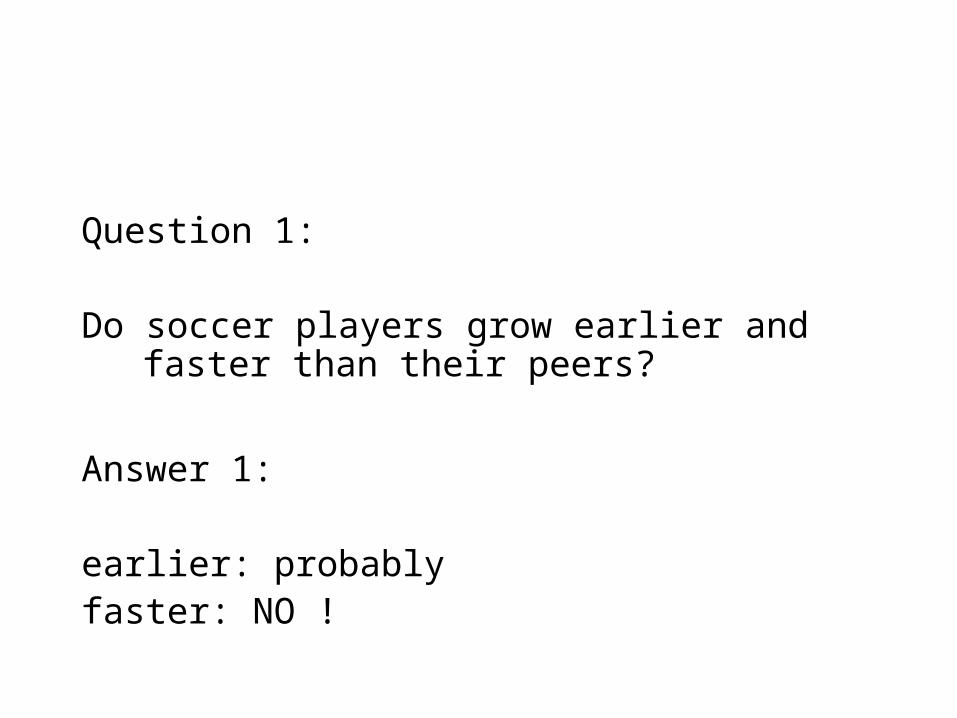
Question 1:
Do soccer players grow earlier and faster than their peers?
Answer 1:
earlier: probablyfaster: NO !

CL=12.0 jaar
SL=9.0 jaar
Height=143.1 cm
CL=12.6 jaar
SL=13.5 jaar
Height=165.0 cm
2. Soccer players: early or late mature?
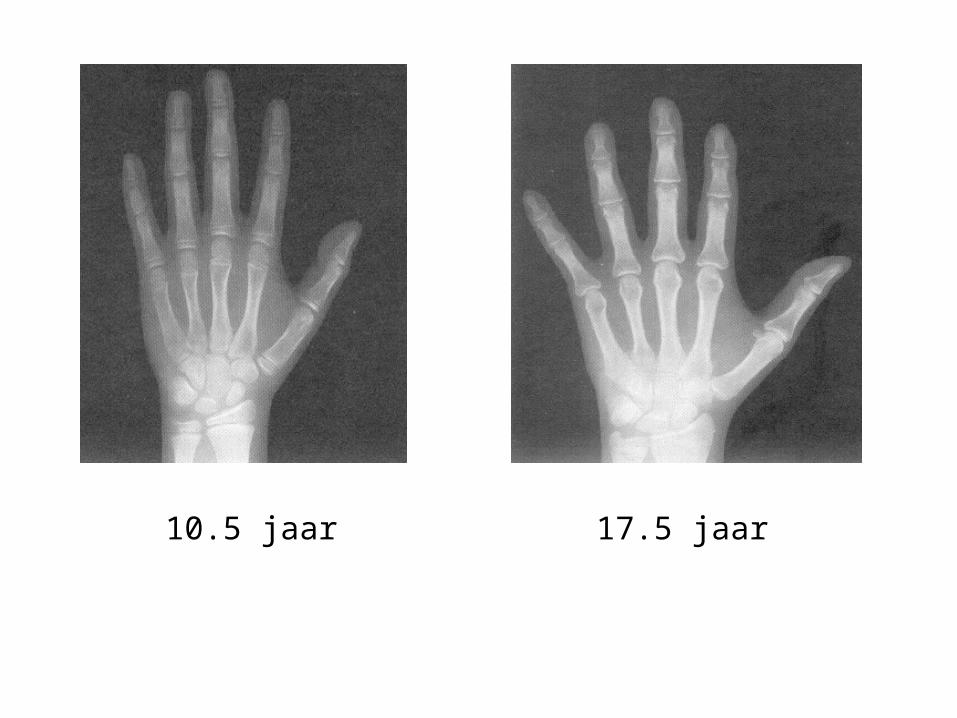
10.5 jaar 17.5 jaar
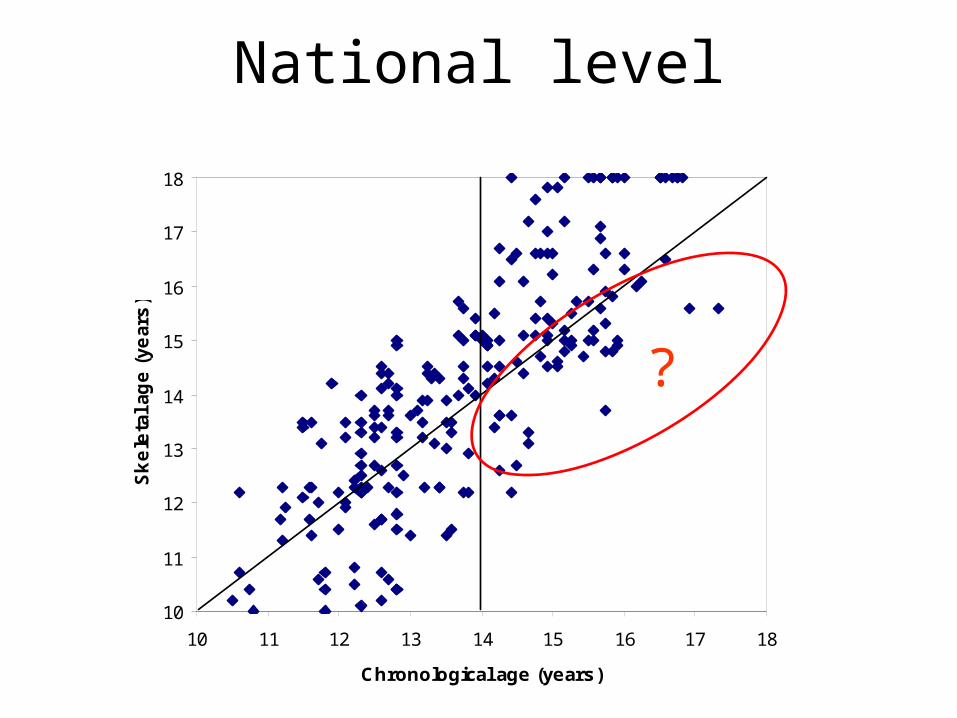
National level
10
11
12
13
14
15
16
17
18
10 11 12 13 14 15 16 17 18
Chronological age (years)
Sk
ele
tal ag
e (
ye
ars
)
?
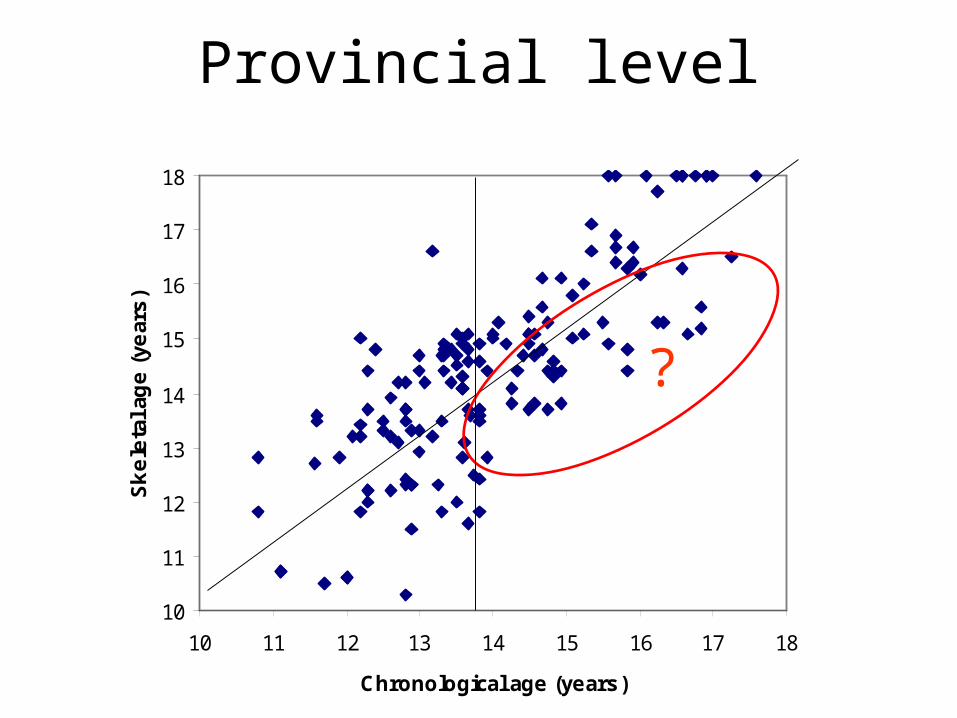
Provincial level
10
11
12
13
14
15
16
17
18
10 11 12 13 14 15 16 17 18
Chronological age (years)
Sk
ele
tal a
ge
(ye
ars
)
?

Local level
10
11
12
13
14
15
16
17
18
10 11 12 13 14 15 16 17 18
Chronological age (years)
Ske
leta
l a
ge
(ye
ars
)
?

Question 2:
Soccer players: early or late mature?
Answer 2:
on average early mature

0
2
4
6
8
10
12
14
16
18
20
22
24
26
0 1 2 3 4 5 6 7 8 9 10 11 12 13 14 15 16 17 18 19
Chronological age (years)
Ve
locit
y (
cm
/ye
ar)
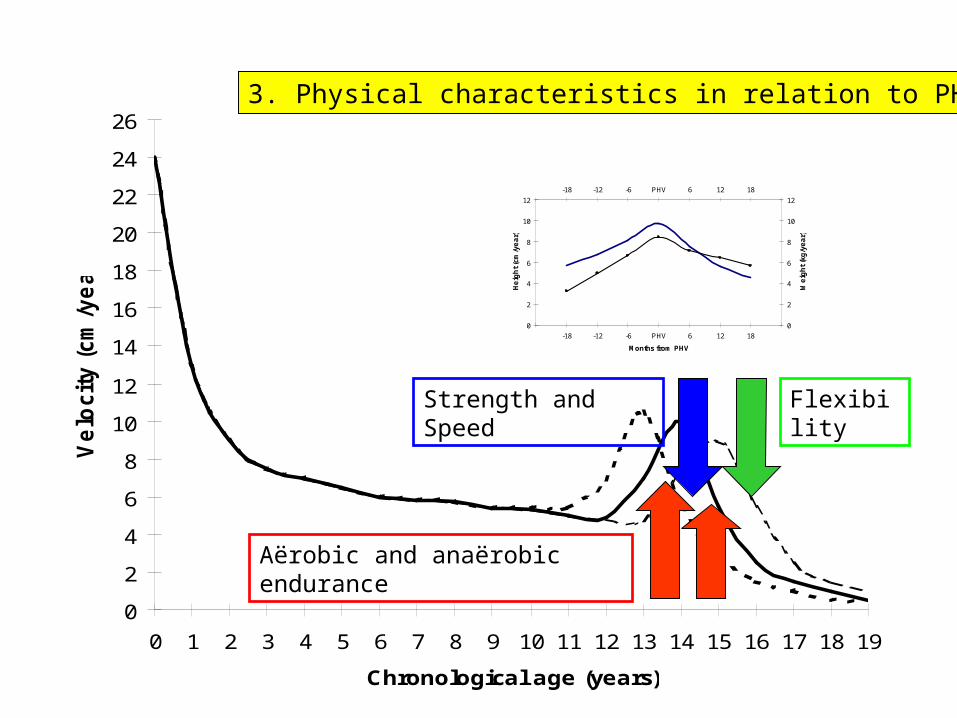
3. Physical characteristics in relation to PHV?
0
2
4
6
8
10
12
-18 -12 -6 PHV 6 12 18
Months from PHV
He
igh
t (c
m/y
ea
r)
0
2
4
6
8
10
12
-18 -12 -6 PHV 6 12 18
We
igh
t (k
g/y
ea
r)

age
cm/year
example: Standing Broad Jump

age
cm/year
mean age at peak velocity
example: Standing Broad Jump

Explosive strength
0,0
2,0
4,0
6,0
8,0
10,0
12,0
-18 -12 -6 PHV 6 12 18
Months from PHV
SB
J cm
/ye
ar
0,0
1,0
2,0
3,0
4,0
5,0
6,0
VT
J cm
/ye
ar
SBJ
VTJ
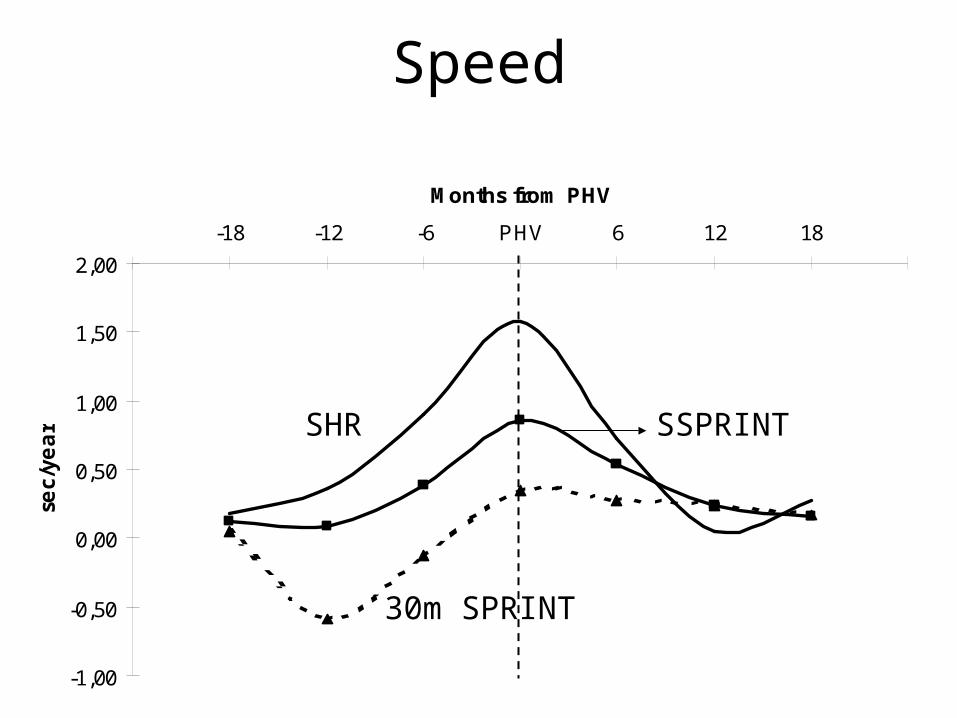
Speed
-1,00
-0,50
0,00
0,50
1,00
1,50
2,00
-18 -12 -6 PHV 6 12 18
Months from PHV
sec/
yea
r SHR SSPRINT
30m SPRINT

Aërobic and anaërobic endurance
-0,50
0,00
0,50
1,00
1,50
2,00
-18 -12 -6 PHV 6 12 18
Months from PHV
ES
HR
min
/ye
ar
0,00
0,50
1,00
1,50
2,00
2,50
3,00
3,50
4,00
ST
EM
PO
se
c/ye
ar
ESHR
STEMPO
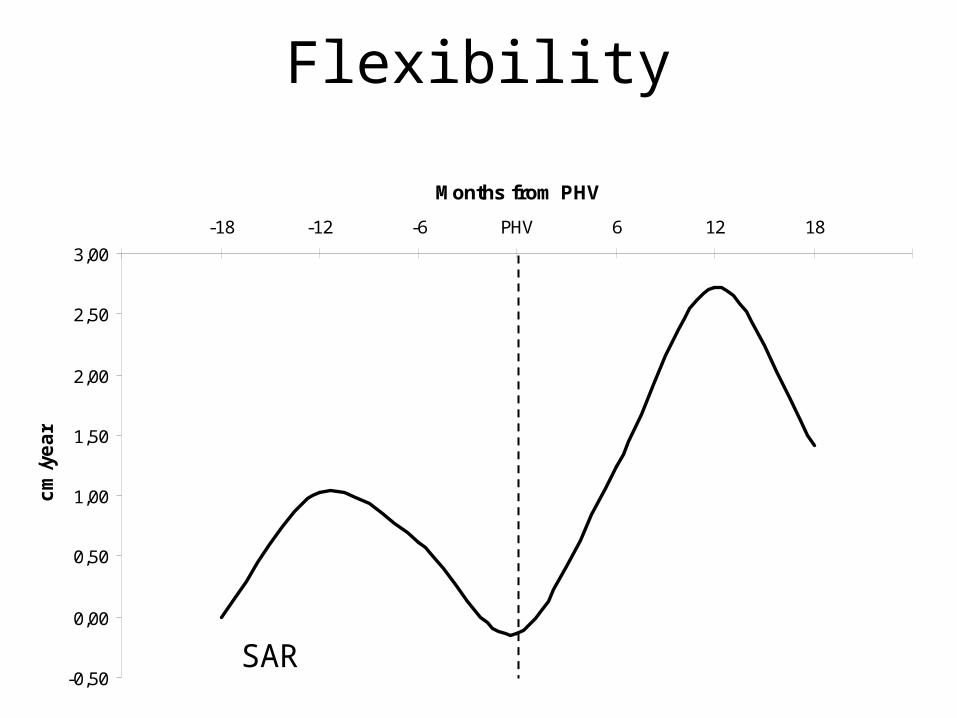
Flexibility
-0,50
0,00
0,50
1,00
1,50
2,00
2,50
3,00
-18 -12 -6 PHV 6 12 18
Months from PHV
cm
/ye
ar
SAR
0
2
4
6
8
10
12
14
16
18
20
22
24
26
0 1 2 3 4 5 6 7 8 9 10 11 12 13 14 15 16 17 18 19
Chronological age (years)
Ve
locit
y (
cm
/ye
ar)
3. Physical characteristics in relation to PHV?
0
2
4
6
8
10
12
-18 -12 -6 PHV 6 12 18
Months from PHV
He
igh
t (c
m/y
ea
r)
0
2
4
6
8
10
12
-18 -12 -6 PHV 6 12 18
We
igh
t (k
g/y
ea
r)
Aërobic and anaërobic endurance
Strength and Speed Flexibility
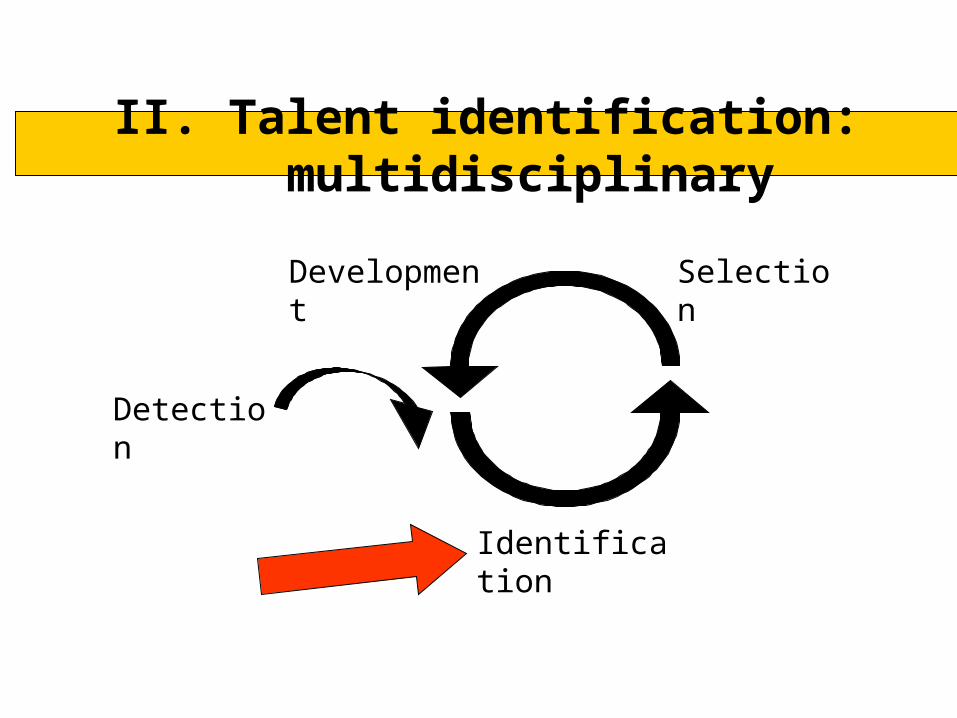
II. Talent identification: multidisciplinary
Detection
Identification
SelectionDevelopment

Aërobic endurance
Variable Age National Provincial Local Diference
ESHR (min) -12 7.9 ± 0.9 8.0 ± 0.7 7.2 ± 1.3 n.s.
-13 8.6 ± 1.5 8.1 ± 1.6 7.7 ± 1.4 N><G
-14 9.6 ± 1.4 9.2 ± 1.0 8.2 ± 1.4 N,P><G
-15 10.7 ± 1.2 9.5 ± 1.4 8.7 ± 1.6 N><P><G
-16 10.9 ± 1.5 10.3 ± 2.1 8.9 ± 1.7 N,P><G

Aërobic endurance: VO2max
Variable Age National Provincial Local Diference
VO2max -12 55.9 ± 7.0 60.2 ± 4.8 53.9 ± 5.8 P><G
(ml/kg/min) -13 57.0 ± 4.6 57.2 ± 6.8 53.1 ± 4.6 N,P><G
-14 57.3 ± 5.7 56.8 ± 4.3 53.2 ± 4.9 N,P><G
-15 59.5 ± 4.9 56.5 ± 4.0 53.4 ± 6.3 N,P><G
-16 57.4 ± 4.6 56.1 ± 4.2 54.7 ± 3.3 N><G
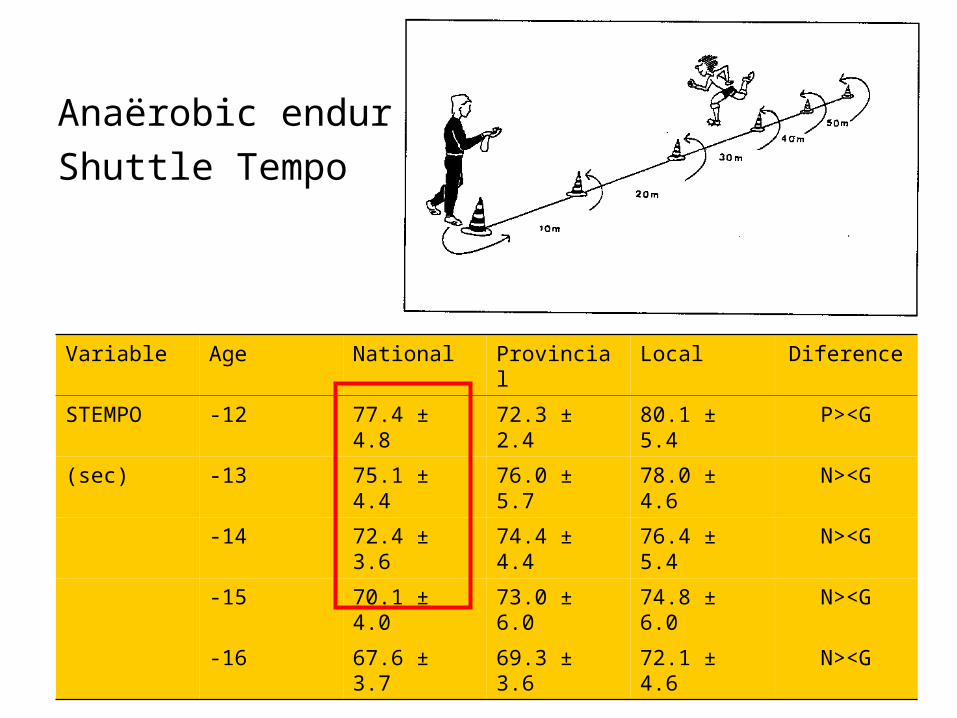
Anaërobic endurance:
Shuttle Tempo
Variable Age National Provincial Local Diference
STEMPO -12 77.4 ± 4.8 72.3 ± 2.4 80.1 ± 5.4 P><G
(sec) -13 75.1 ± 4.4 76.0 ± 5.7 78.0 ± 4.6 N><G
-14 72.4 ± 3.6 74.4 ± 4.4 76.4 ± 5.4 N><G
-15 70.1 ± 4.0 73.0 ± 6.0 74.8 ± 6.0 N><G
-16 67.6 ± 3.7 69.3 ± 3.6 72.1 ± 4.6 N><G
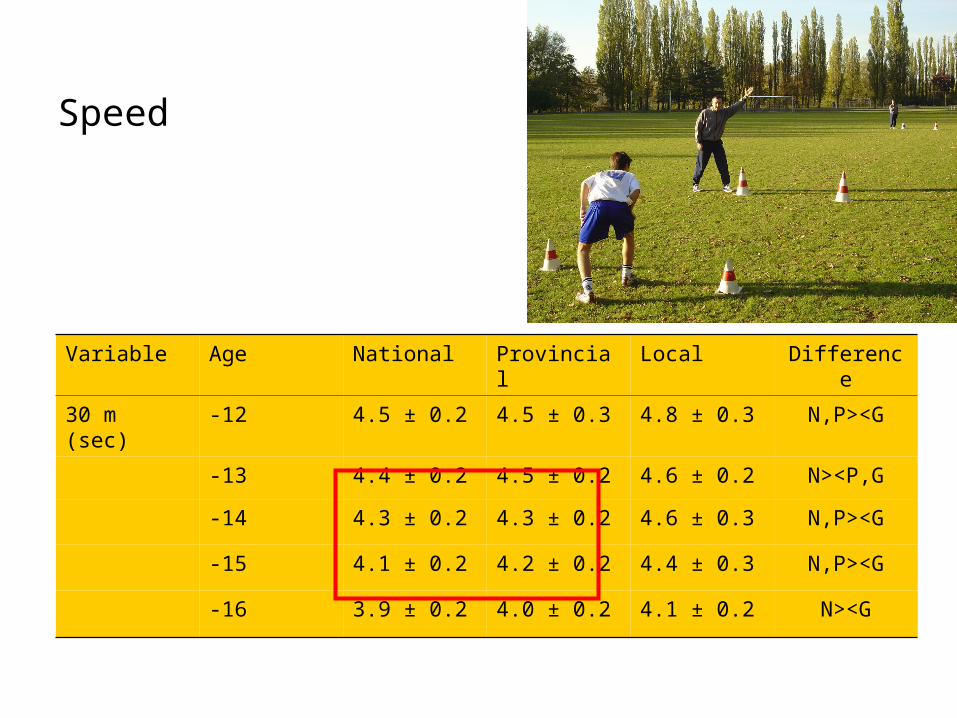
Speed
Variable Age National Provincial Local Difference
30 m (sec) -12 4.5 ± 0.2 4.5 ± 0.3 4.8 ± 0.3 N,P><G
-13 4.4 ± 0.2 4.5 ± 0.2 4.6 ± 0.2 N><P,G
-14 4.3 ± 0.2 4.3 ± 0.2 4.6 ± 0.3 N,P><G
-15 4.1 ± 0.2 4.2 ± 0.2 4.4 ± 0.3 N,P><G
-16 3.9 ± 0.2 4.0 ± 0.2 4.1 ± 0.2 N><G
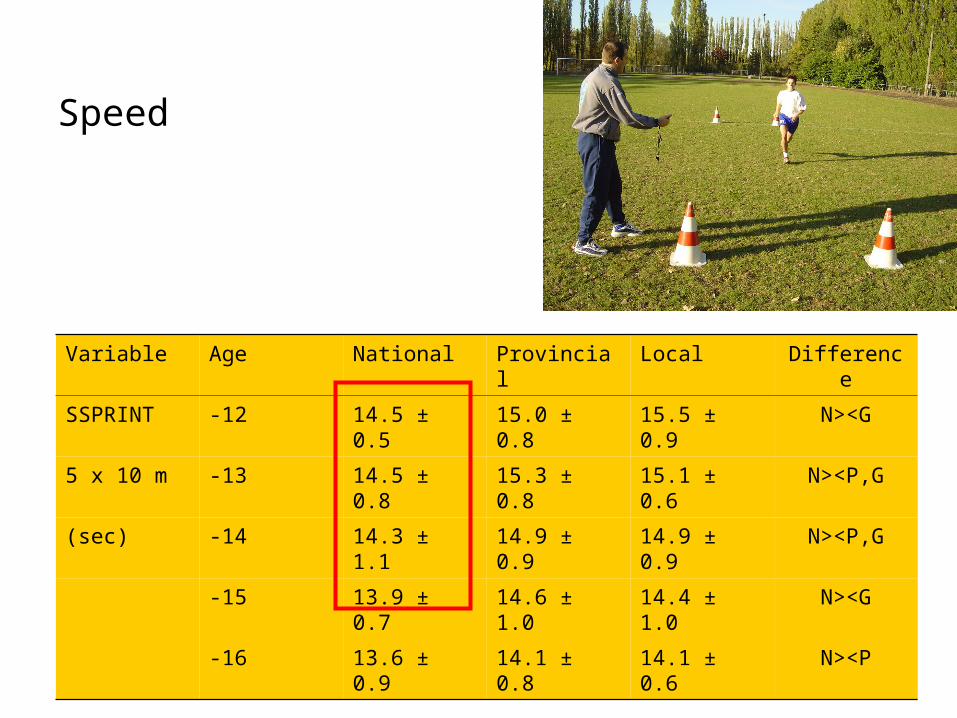
Speed
Variable Age National Provincial Local Difference
SSPRINT -12 14.5 ± 0.5 15.0 ± 0.8 15.5 ± 0.9 N><G
5 x 10 m -13 14.5 ± 0.8 15.3 ± 0.8 15.1 ± 0.6 N><P,G
(sec) -14 14.3 ± 1.1 14.9 ± 0.9 14.9 ± 0.9 N><P,G
-15 13.9 ± 0.7 14.6 ± 1.0 14.4 ± 1.0 N><G
-16 13.6 ± 0.9 14.1 ± 0.8 14.1 ± 0.6 N><P

Strength
Variable Age National Provincial Local Difference
VTJ (m) -12 32.4 ± 4.5 34.1 ± 5.3 30.0 ± 5.0 ns
-13 33.7 ± 4.8 32.9 ± 5.1 30.6 ± 4.4 N><G
-14 37.0 ± 5.1 37.0 ± 4.4 34.3 ± 5.4 N,P><G
-15 40.4 ± 4.7 40.0 ± 5.3 35.7 ± 5.7 N,P><G
-16 44.8 ± 5.0 45.5 ± 5.8 40.0 ± 6.5 N,P><G

Flexibility
Variable Age National Provincial Local Difference
SAR (cm) -12 19.3 ± 5.4 17.6 ± 5.3 19.0 ± 5.5 n.s.
-13 19.1 ± 6.1 18.3 ± 6.7 18.6 ± 5.0 n.s.
-14 20.4 ± 6.1 18.0 ± 6.9 18.1 ± 6.2 n.s.
-15 21.9 ± 7.3 17.3 ± 8.3 17.3 ± 6.3 N><P,G
-16 22.8 ± 6.9 19.8 ± 8.2 15.5 ± 7.8 N><G
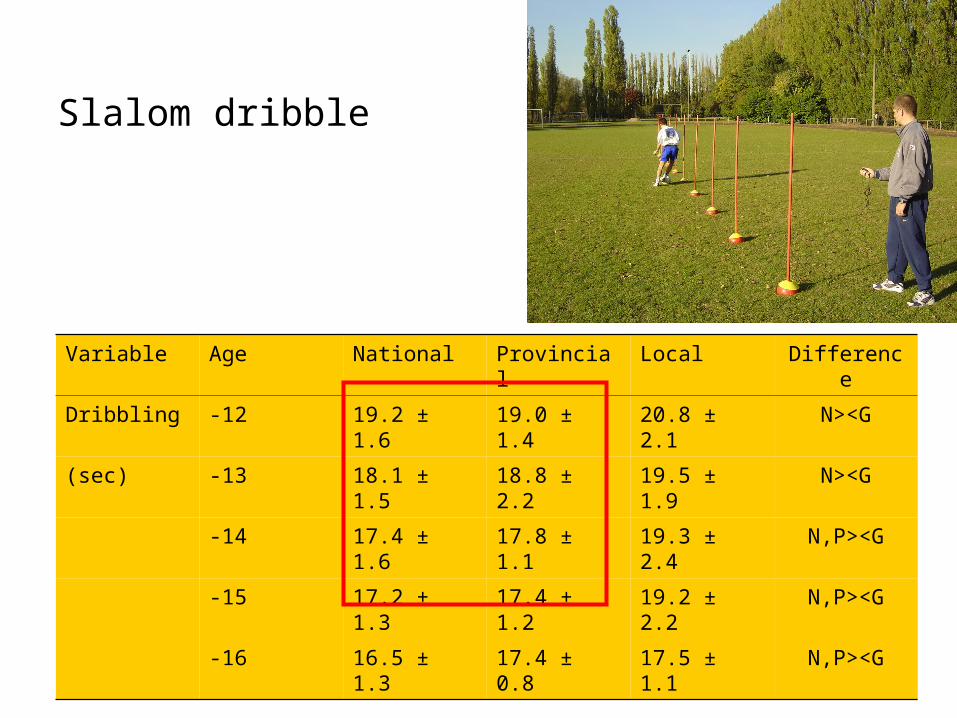
Slalom dribble
Variable Age National Provincial Local Difference
Dribbling -12 19.2 ± 1.6 19.0 ± 1.4 20.8 ± 2.1 N><G
(sec) -13 18.1 ± 1.5 18.8 ± 2.2 19.5 ± 1.9 N><G
-14 17.4 ± 1.6 17.8 ± 1.1 19.3 ± 2.4 N,P><G
-15 17.2 ± 1.3 17.4 ± 1.2 19.2 ± 2.2 N,P><G
-16 16.5 ± 1.3 17.4 ± 0.8 17.5 ± 1.1 N,P><G
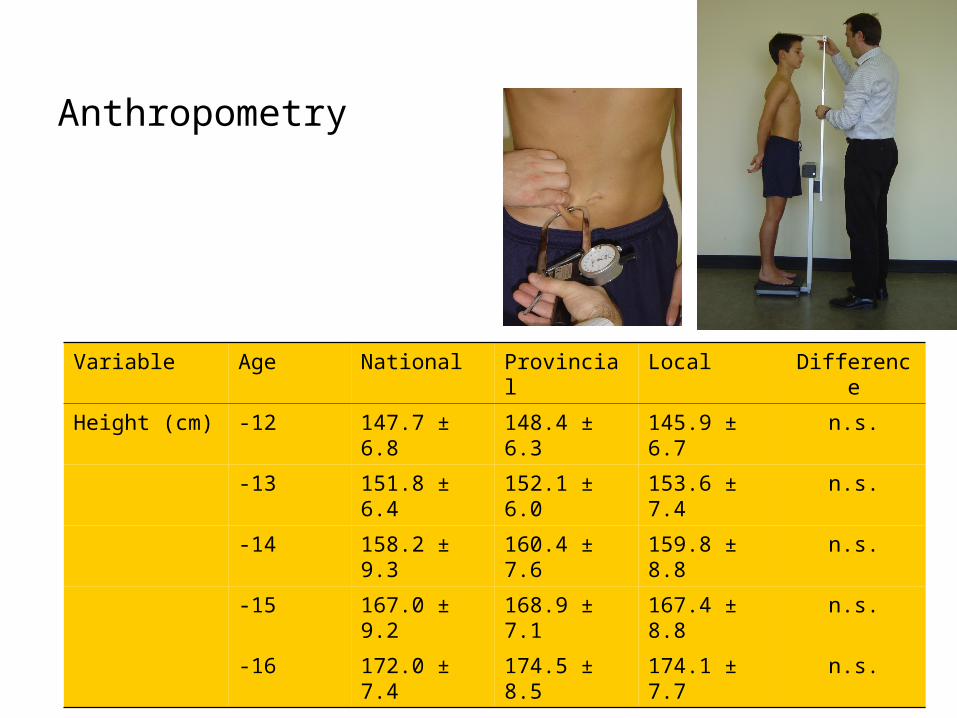
Anthropometry
Variable Age National Provincial Local Difference
Height (cm) -12 147.7 ± 6.8 148.4 ± 6.3 145.9 ± 6.7 n.s.
-13 151.8 ± 6.4 152.1 ± 6.0 153.6 ± 7.4 n.s.
-14 158.2 ± 9.3 160.4 ± 7.6 159.8 ± 8.8 n.s.
-15 167.0 ± 9.2 168.9 ± 7.1 167.4 ± 8.8 n.s.
-16 172.0 ± 7.4 174.5 ± 8.5 174.1 ± 7.7 n.s.
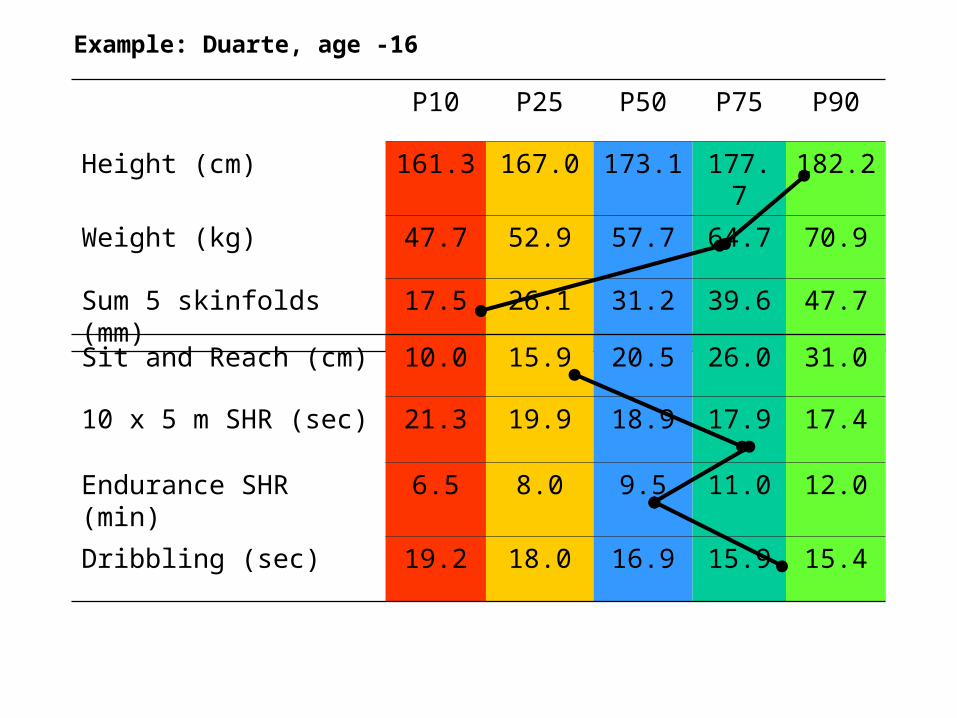
P10 P25 P50 P75 P90
Height (cm) 161.3 167.0 173.1 177.7 182.2
Weight (kg) 47.7 52.9 57.7 64.7 70.9
Sum 5 skinfolds (mm) 17.5 26.1 31.2 39.6 47.7
Example: Duarte, age -16
Sit and Reach (cm) 10.0 15.9 20.5 26.0 31.0
10 x 5 m SHR (sec) 21.3 19.9 18.9 17.9 17.4
Endurance SHR (min) 6.5 8.0 9.5 11.0 12.0
Dribbling (sec) 19.2 18.0 16.9 15.9 15.4

www.bvlo.be

The effects of task constraints on visual search behaviour and decision-making skill in youth soccer players
Roel Vaeyens, Matthieu Lenoir, Mark Williams,
Liesbeth Mazyn & Renaat Philippaerts
(Journal of Sport and Exercise Psychology, 2005, submitted)
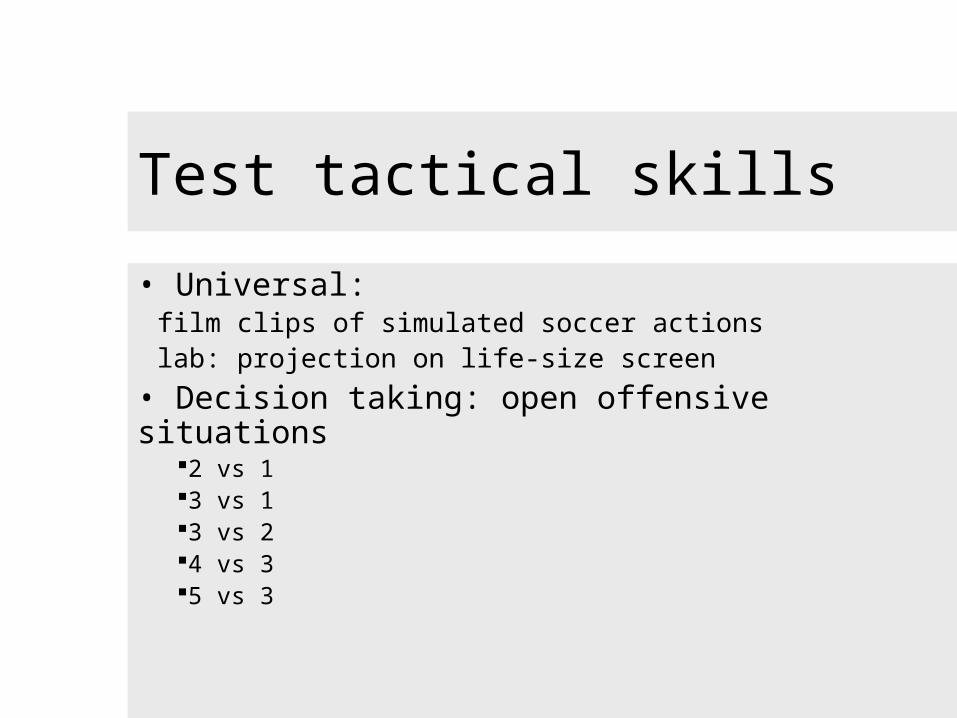
Test tactical skills
• Universal:film clips of simulated soccer actionslab: projection on life-size screen
• Decision taking: open offensive situations2 vs 13 vs 13 vs 24 vs 35 vs 3


RT: general vs soccer specific
600
700
800
900
1000
1100
1200
1300
control local national topGroup
0
100
200
300
400
500
600
700

Mean decision time per group and situation
500
600
700
800
900
1000
1100
1200
1300
1400
2 vs 1 3 vs 1 3 vs 2 4 vs 3 5 vs 3Situation
Tij
d (m
sec)
controllocalnationaltop
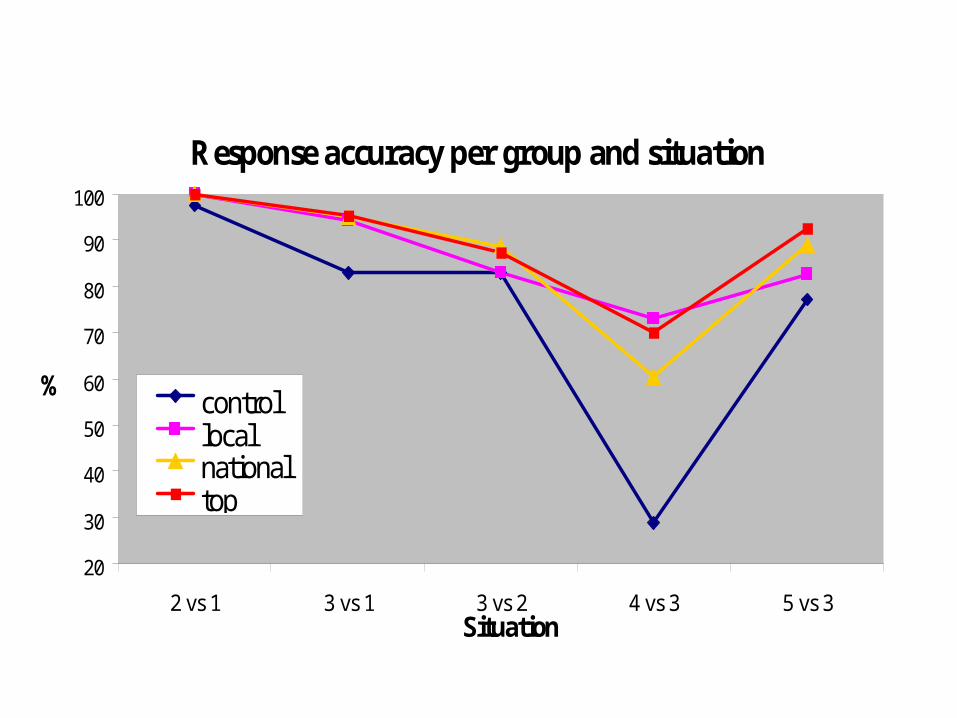
Response accuracy per group and situation
20
30
40
50
60
70
80
90
100
2 vs 1 3 vs 1 3 vs 2 4 vs 3 5 vs 3Situation
%controllocalnationaltop
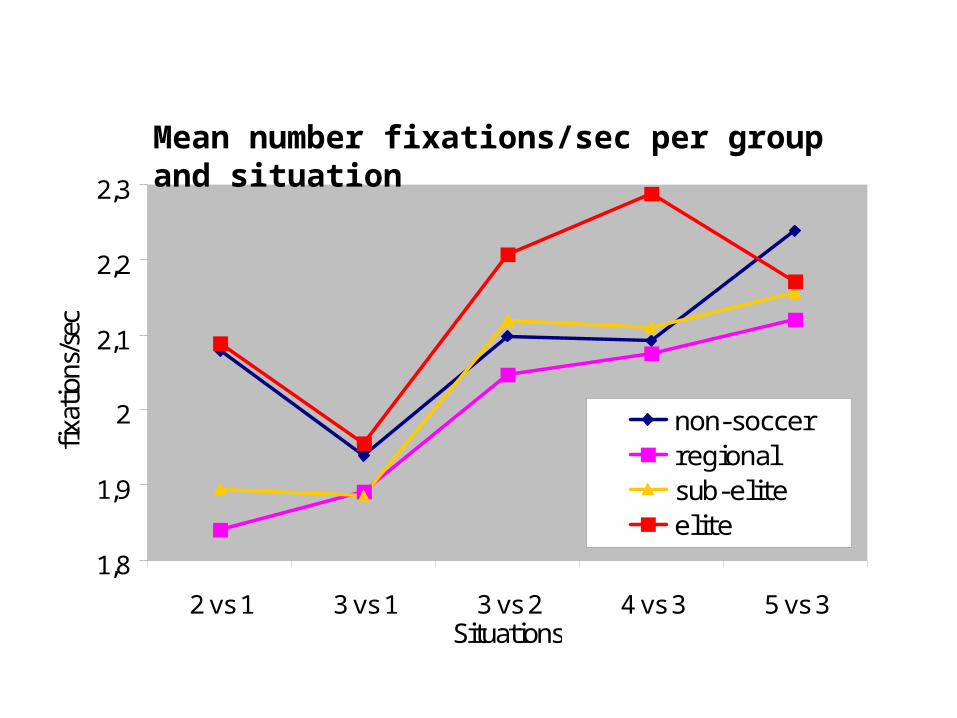
1,8
1,9
2
2,1
2,2
2,3
2 vs 1 3 vs 1 3 vs 2 4 vs 3 5 vs 3Situations
fixa
tions
/sec
non-soccerregionalsub-eliteelite
Mean number fixations/sec per group and situation
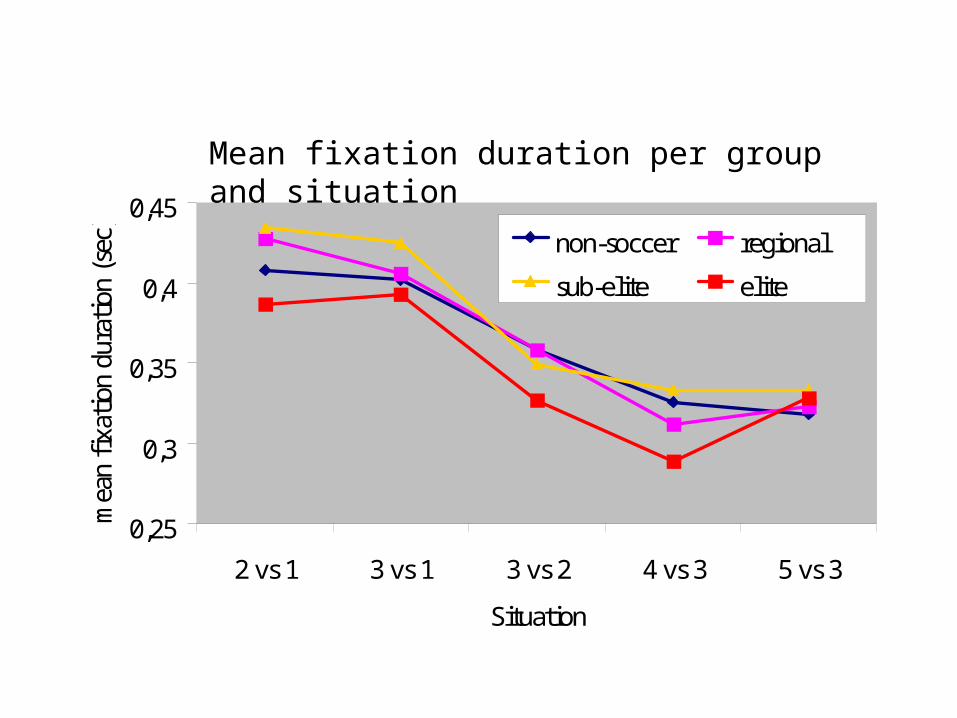
0,25
0,3
0,35
0,4
0,45
2 vs 1 3 vs 1 3 vs 2 4 vs 3 5 vs 3
Situation
mea
n fi
xati
on d
urat
ion
(sec
)
non-soccer regional
sub-elite elite
Mean fixation duration per group and situation
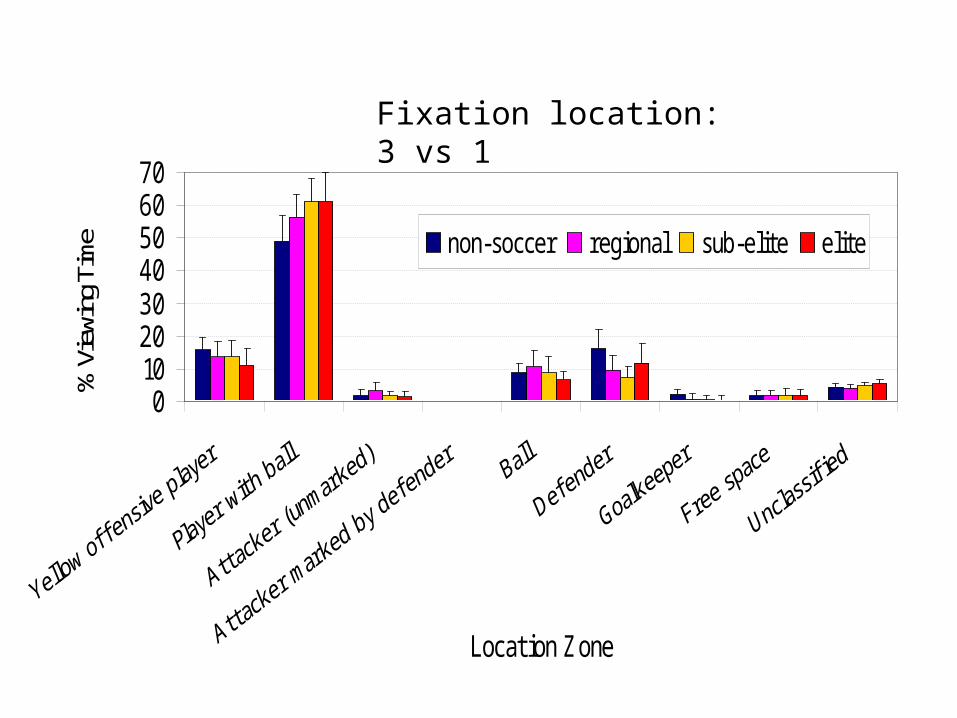
010203040506070
Location Zone
% V
iewi
ng T
ime non-soccer regional sub-elite elite
Fixation location: 3 vs 1
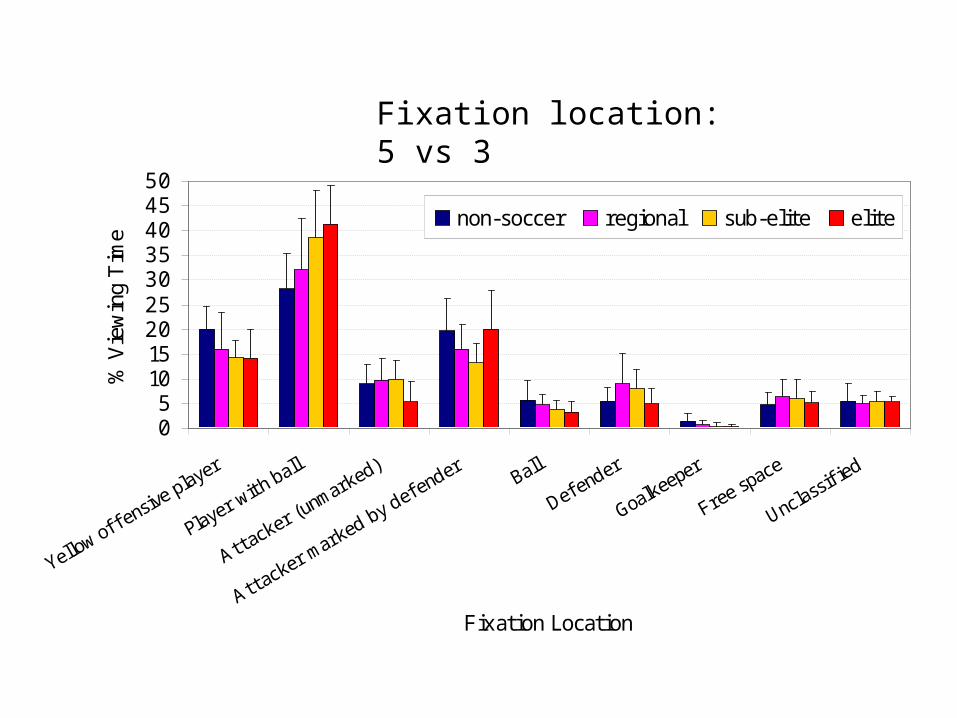
05
101520253035404550
Fixation Location
% V
iew
ing
Tim
e
non-soccer regional sub-elite elite
Fixation location: 5 vs 3

II. Talent identification: multidisciplinary
Detection
Identification
SelectionDevelopment
Selection of younger players in 1st team?
The Belgian caseEvaluation of the ‘under-21 rule’ Do young
adult (U-21) soccer players benefit?
Roel Vaeyens – Renaat Philippaerts
Ghent University
Dept. Movement and Sports Sciences

Methods
• Official match data from Royal Belgian Football Association
• 2e national (D2) + 3e national A (D3)• 4 seasons
– 1998-1999– 1999-2000– 2000-2001– 2001-2002
• 53 teams – 2138 players
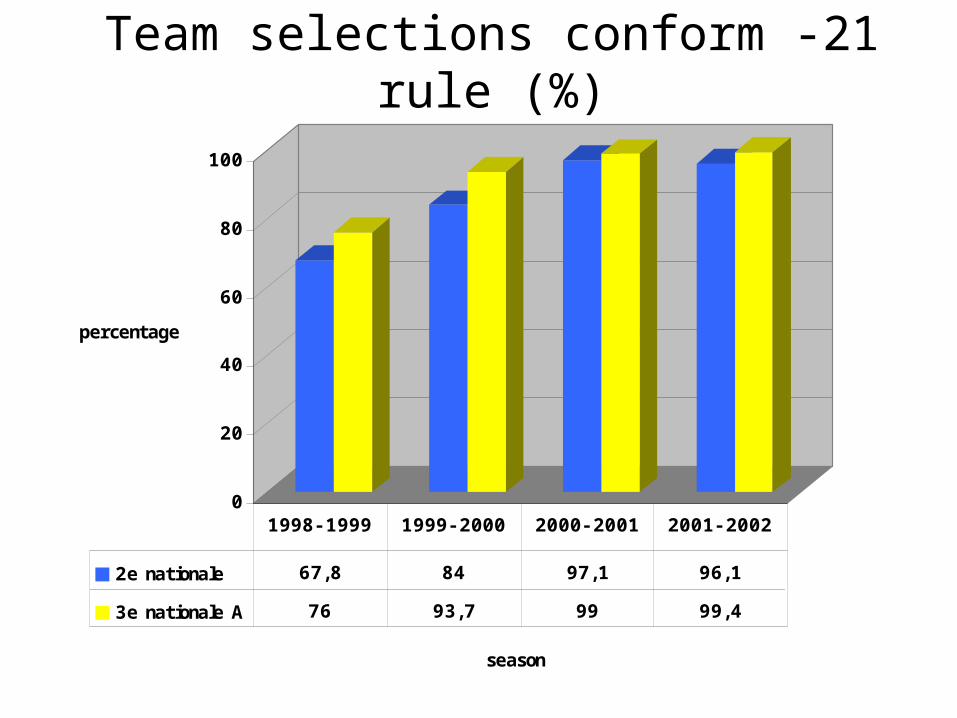
Team selections conform -21 rule (%)
0
20
40
60
80
100
percentage
season
2e nationale 67,8 84 97,1 96,1
3e nationale A 76 93,7 99 99,4
1998- 1999 1999- 2000 2000- 2001 2001- 2002
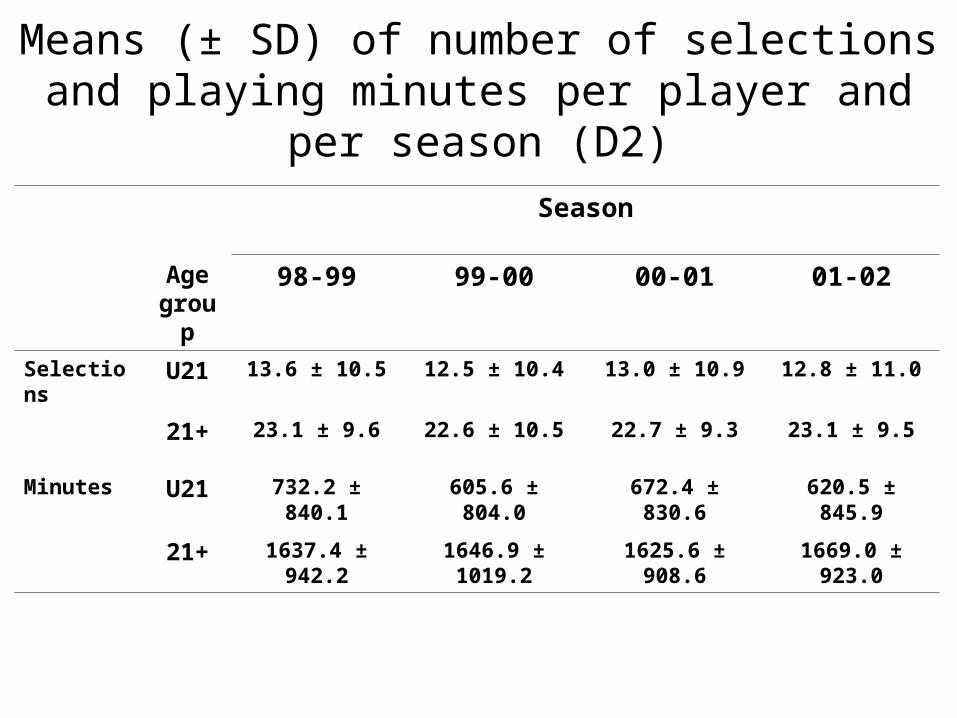
Means (± SD) of number of selections and playing minutes per player and per season (D2)
Season
Agegroup
98-99 99-00 00-01 01-02
Selections U21 13.6 ± 10.5 12.5 ± 10.4 13.0 ± 10.9 12.8 ± 11.0
21+ 23.1 ± 9.6 22.6 ± 10.5 22.7 ± 9.3 23.1 ± 9.5
Minutes U21 732.2 ± 840.1 605.6 ± 804.0 672.4 ± 830.6 620.5 ± 845.9
21+ 1637.4 ± 942.2 1646.9 ± 1019.2 1625.6 ± 908.6 1669.0 ± 923.0
Conclusions
• Teams in conformity with the U-21 rule• Rather large variation within and between teams• No increase in playing opportunities for young adult
players in 1st team• Solutions:
– change in mentality of trainers-coaches, clubs
– better youth education programme