ghana energy situation report q1, 2014...page|1!!! ghana energy situation report q1, 2014 pricing...
TRANSCRIPT
Page | 1
Ghana Energy Situation Report Q1, 2014
PRICING AND DEREGULATION OF THE ENERGY SECTOR IN GHANA: CHALLENGES & PROSPECTS
By Theo Acheampong1, Africa Economics; Festus Ankrah, IMANI
1. Introduction
A cursory look at the current power situation in Ghana, against the background of the
challenges many Ghanaians face accessing constant and reliable electricity supply for domestic
and industrial activities, should reveal that the load shedding exercise (a.k.a ‘Dumsor-Dumsor’)
we experienced during the first half of 2013 and which is forecasted to persist in the medium
term beyond 2013 to 2015 though on a reduced scope is primarily a self-imposed one. This is
largely because of the State’s inability to provide the right incentives and a misaligned
regulatory structure, which together have failed to attract the much needed investments into an
electricity supply sector still dependent on legacy infrastructure. Ghana’s electricity supply
market currently has an estimated 10 to 15% year-on-year demand growth boosted by
increasing domestic and industrial demand. It is imperative therefore that the nation finds new
generation sources which can satisfy this demand, whilst revamping the transmission and
distribution infrastructure to cope with the increased throughput.
As Ghana seeks to expand its industrial base in the country’s quest to transform its economic
fortunes, the reliable supply of energy, primarily electricity supply, will be the crucial factor and
catalyst for industrial development which in the process will lift many out of poverty. The 2010
Wholesale Power Reliability Assessment reporti estimated that Ghana loses between 2 to 6% of
GDP annually not including a number of indirect costs of lost economic output due to insufficient
wholesale power supply. Thus, the economic costs of inadequate power supply cannot be
underestimated. The promised changes of the liberalized electricity markets as part of the IMF-
World Bank Structural Adjustment Programmes started in the late 1990s which aims to bring
increased private sector investments and expand capacity are yet to be realised due to an
inefficient setup of the regulatory structures compounded by low tariff pricing options and gross
wastage leading to sub-optimal outcomes for both consumers and the utilities companies almost
20 years down the line.
1 PhD Student in Economics at the University of Aberdeen, United Kingdom. He can be reached at: [email protected]
Page | 2
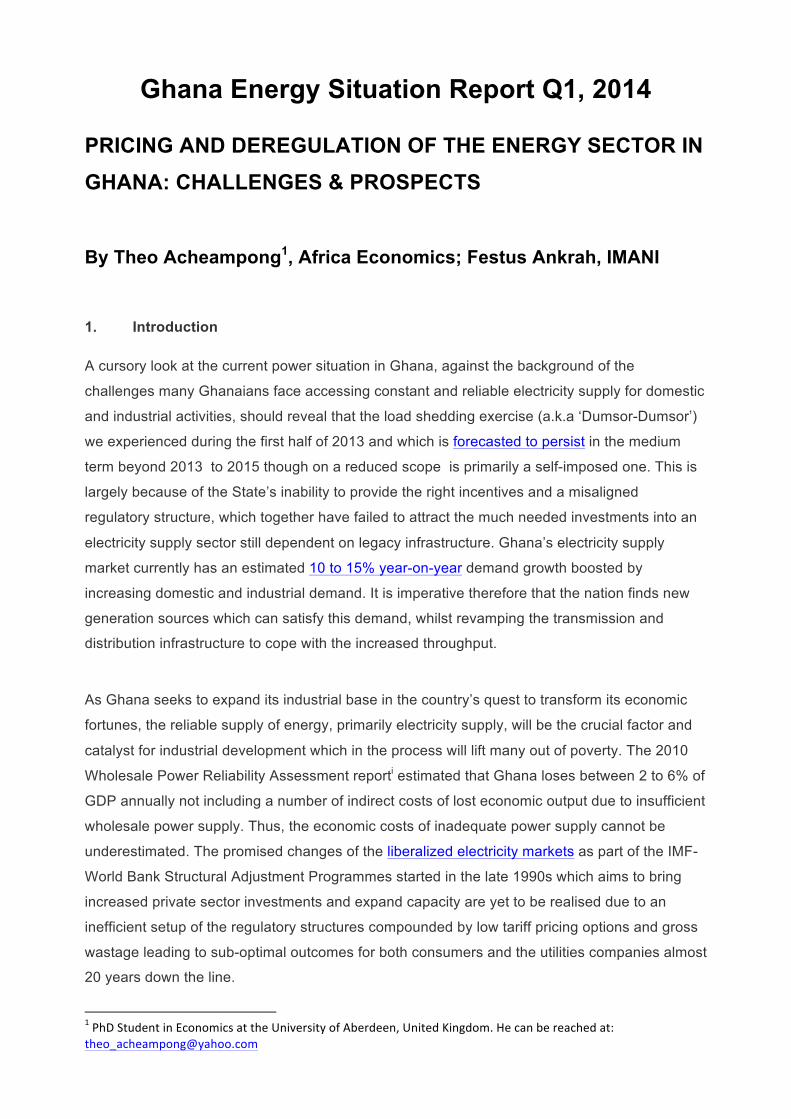
Figure 1: Ghana Power Demand Forecast, 2000 – 2025
Source: Tullow Oil Report, 2008ii
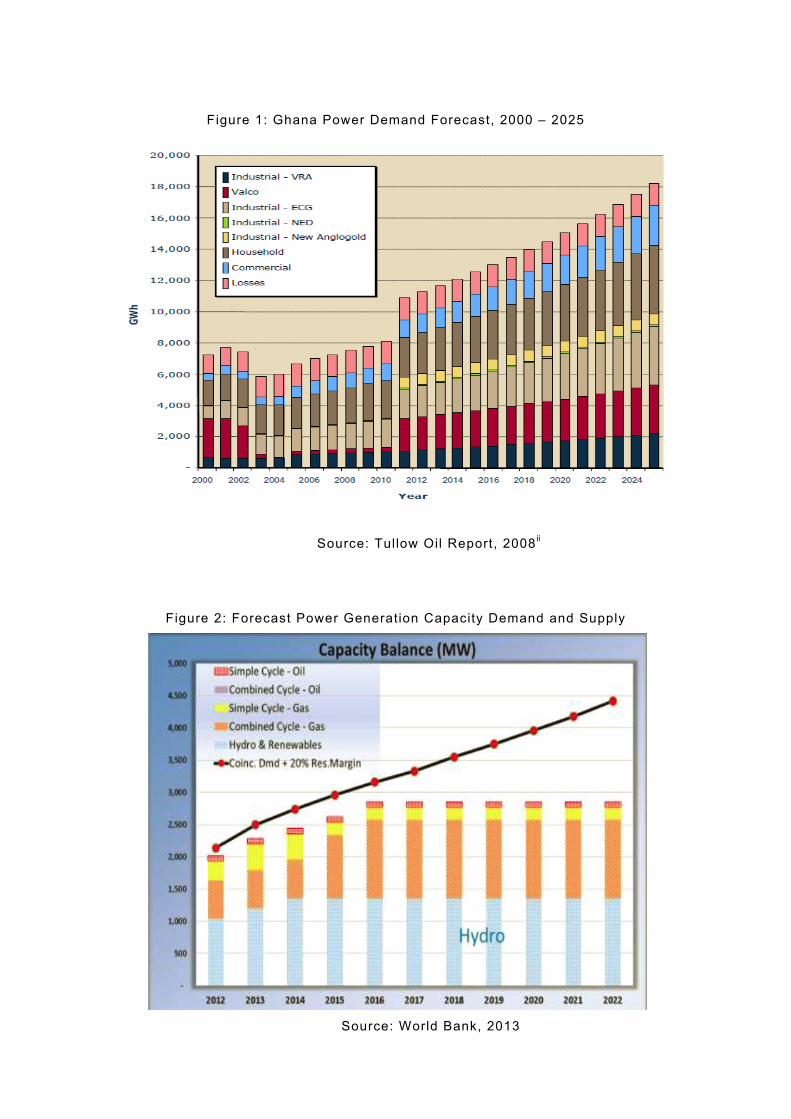
Figure 2: Forecast Power Generation Capacity Demand and Supply
Source: World Bank, 2013

Page | 3
2. The Current Generation Mix
Using public domain data from the Volta River Authority and other public agenciesiii, the total
installed and effective capacity in Ghana as at December 2013 stood at 2,814 and 2,492
megawatts (MW) respectively.iv The bulk of this supply, comprising about 50% of this generation
capacity, comes from hydro-based sources inclusive of the yet to be fully commissioned Bui
hydro project. These hydroelectric plants convert water trapped in a dam into electrical energy
by using the gravitational force of flowing water to turn a turbine coupled to a generator. The
remaining 50% of Ghana’s energy supply comes from thermal based plants which function by
converting energy stored in fossil fuels such as oil and natural gas into electrical energy.
Table 1: Installed and Effective Generation Capacity
Plants Installed Capacity
(MW)
Effective Capacity
(MW) Type Fuel Type
Akosombo Hydro Station 1,020 1001 Hydro Water
Kpong Hydro Station 160 120 Hydro Water
Bui Hydro Dam 400 133 Hydro Water
Takoradi Power Company (TAPCO) (T1) 330 330 Thermal LCO/Gas
Takoradi International Company (TICO) (T2) 220 220 Thermal LCO/Gas
Takoradi Thermal Plant (T3) 132 132 Thermal LCO/Gas
Tema Thermal 1 Power Plant (TT1PP) 110 110 Thermal LCO/Gas
Tema Thermal 2 Power Plant (TT2PP) 50 50 Thermal DFO/Gas
Mines Reserve Plant (MRP) 80 80 Thermal DFO
Sunon Asogli 200 200 Thermal Gas
CENIT 110 110 Thermal LCO/Gas
Navrongo Solar Farm 2 2 Renewable Solar
Total 2,814 MW 2,492 MW

Page | 4
Data: Various Sources
Figure 3: Ghana's Effective Installed Generation Sources as at December, 2013.
Data: Various Sources
Recent generation problems returned us to a partial load sharing regime in January 2014. Local
media reported in January 2014 that the Electricity Company of Ghana (ECG), the power
distributor had to temporarily cut down supplies because of supply constraints from Ghana Grid
Company (GRIDco), the network and transmission coordinator. For example, the shut in of
production from two units at Bui, low gas pressure from the plants at Tema and operational
issues at TAPCO forced about 200MW of load to be shed on 10 January 2014. Some of these
generation problems have persisted throughout the month and led to between 30 and 200MW
being shed as requested leaving very little to meet the 10% reserve requirement.v This further
strengthens the case to double up generation efforts by reforming the tariff pricing regime and
properly incentivising producers to make an economic return in order to ensure energy security.
3. Power Economics: What Goes into Electricity Pricing?
The economics of power generation focuses on the generative capacity of typically an
integrated natural monopolyvi where the installed plant type plays a critical factor in determining
end-user tariffs. Supply normally comes from two plant types: Plant type 1 provides the base
load to meet the minimum underlying demand that utilities must provide to consumers
contingent on the daily demand schedule. These plants have high fixed capital expenditures
(CAPEX) and low marginal operational expenditures (OPEX). An example of such supply
comes from hydro plants such as Akosombo and/or the VRA operated Combined Cycle Gas
Turbine (CCGT) plants in Takoradi. Plant type 2 has lower fixed costs but higher marginal

Page | 5
operating costs and is used to support peak demand. Examples of such are the 127 diesel
generator sets with capacities of between 1 and 2.2 MW that were imported by the NPP
government at a cost of $101 million during the 2007 power crises to augment the supply
shortfall. Other plant types that could be considered are mid-merit plants. Like the base load
plants, they typically also have high levels of safety and reliability but their generation costs and
capacity factors are intermediate ranging between base load and peaking plants.
Figure 4: Typical Electric Load Curve
In all of these discussions, an important component to consider is the load factor. The load
factor, a measure of output compared to the maximum installed capacity which could be
produced, helps us understand the overload of the power supply system. In Ghana, the
combined load factor currently stands at about 90 percent during peak demand with an average
off-peak load of about 75 percent.vii Thus, a higher factor implies average supply is only
marginally below peak demand. A factor of 100 percent at peak demand leaves very little room
for manoeuvre in the event of any demand shock to the supply system. The nation-wide
blackout experienced in February 2012 was partially down to the overload of the supply system
which at the time had only reserve margin of 6MW instead of the conventional 160 megawatts
or about 10 per cent of total system demand.
Page | 6
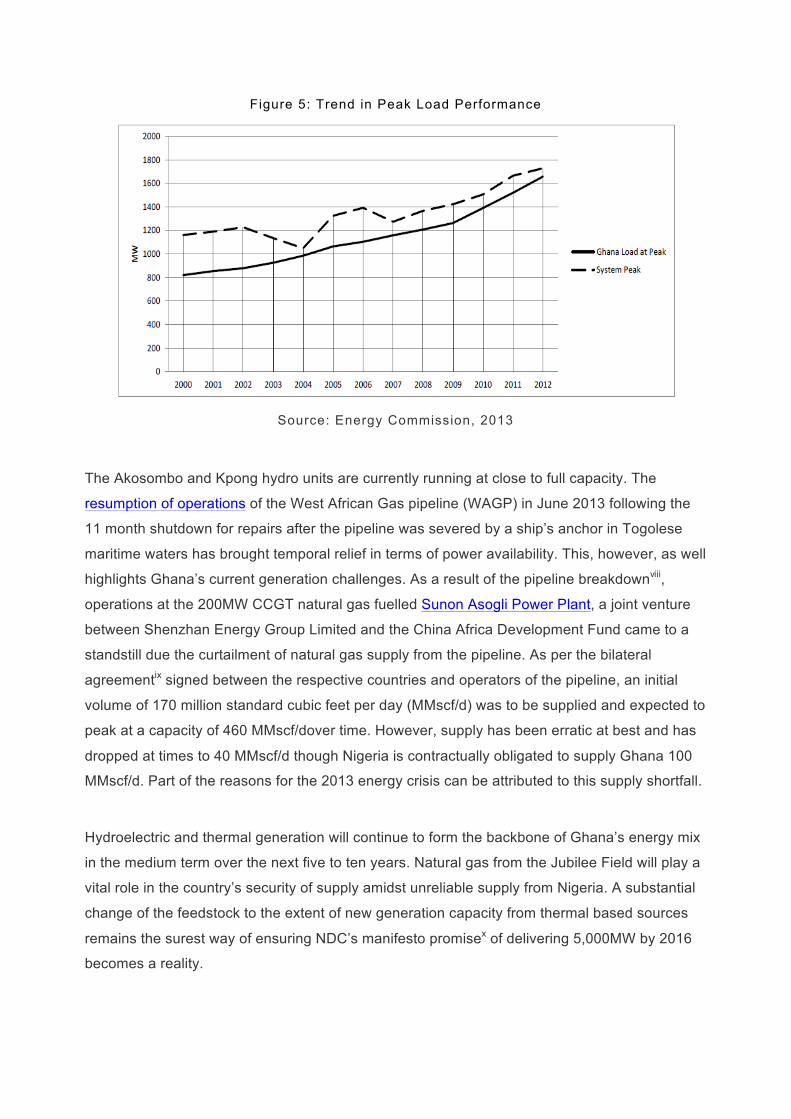
Figure 5: Trend in Peak Load Performance
Source: Energy Commission, 2013
The Akosombo and Kpong hydro units are currently running at close to full capacity. The
resumption of operations of the West African Gas pipeline (WAGP) in June 2013 following the
11 month shutdown for repairs after the pipeline was severed by a ship’s anchor in Togolese
maritime waters has brought temporal relief in terms of power availability. This, however, as well
highlights Ghana’s current generation challenges. As a result of the pipeline breakdownviii,
operations at the 200MW CCGT natural gas fuelled Sunon Asogli Power Plant, a joint venture
between Shenzhan Energy Group Limited and the China Africa Development Fund came to a
standstill due the curtailment of natural gas supply from the pipeline. As per the bilateral
agreementix signed between the respective countries and operators of the pipeline, an initial
volume of 170 million standard cubic feet per day (MMscf/d) was to be supplied and expected to
peak at a capacity of 460 MMscf/dover time. However, supply has been erratic at best and has
dropped at times to 40 MMscf/d though Nigeria is contractually obligated to supply Ghana 100
MMscf/d. Part of the reasons for the 2013 energy crisis can be attributed to this supply shortfall.
Hydroelectric and thermal generation will continue to form the backbone of Ghana’s energy mix
in the medium term over the next five to ten years. Natural gas from the Jubilee Field will play a
vital role in the country’s security of supply amidst unreliable supply from Nigeria. A substantial
change of the feedstock to the extent of new generation capacity from thermal based sources
remains the surest way of ensuring NDC’s manifesto promisex of delivering 5,000MW by 2016
becomes a reality.

Page | 7
4. Demand Side Load Management
Demand Side Load Management (DSLM) is critical if the country’s power system is to operate
at efficiency to reduce the supply burden experienced especially at peak times. Good demand
side management calls for the introduction of energy policies that ensure efficiency thus
reducing the substantial need for new generation and transmission capacity. The National
Energy Policyxi has a goal of “having an efficient production and transportation as well as end-
use efficiency and conservation”. The challenge of “inefficient energy pricing” due to the
distorted nature of the market caused by energy subsidies and under-recoveries, “inadequate
budgetary financing for energy conservation and efficiency” and “limited awareness of energy
conservation measures” militates against a successful DSLM strategy. However, a mix of
conventional as well as novel approaches using both active and passive demand reduction
strategies would serve a great cause towards ensuring an optimal demand balance.
In this regard, we implore the Energy Foundation and Energy Commission to be more active in
playing a leading role in championing the introduction of energy efficiency programmes and the
reforms which were initiated some years back. These efficiency programmes enacted through
mandatory policy initiatives should focus on the reduction electricity usage at the Ministries,
Departments and Agencies (MDAs) through frequent energy audits and remote monitoring. For
example, it should be made mandatory for all air conditioners, lighting systems and computer
processing units to be switched off when not in use. In addition, the installation of Compact
Fluorescent Lights (CFLs) that provide similar levels of luminance at lower energy use ought to
be utilized at the national level and made a matter of reinforced policy priority. All of these if
enacted within a comprehensive energy sector demand management strategy can greatly
reduce the peak load demand to optimal levels where current demand would meet supply as
well as the reserve margin to meet any contingency requirements.
Also, the current ratio of distribution losses to transmission which reflects years of under
recovery and investment in the bulk distribution systems is unacceptable and needs to be
rectified. For example, the ratio of distribution to transmission losses has averaged 22% over
the past ten years with the trend showing very little appreciable decline. The net effect of this is
that almost 22% of the total power generated cannot be accounted for in Ghana. The Electricity
Company of Ghana attributes this to technical and commercial losses. ECG’s technical losses
are mainly attributable to inadequate equipment capacity and old and obsolete cables.
Commercial losses have been identified as due to illegal connections, metering problems, billing
and collection challenges.

Page | 8
Figure 6: Electricity Transmission and Distribution Losses in Ghana
5. Regulatory Challenges: Paying the Market Price for Power
It remains quite clear that Public Utilities Regulatory Commission’s (PURC) current mechanism
for determining electricity prices which on paper is good actually serves a great disincentive for
investments in especially the generation and transmission sectors. The Power Sector Reform
Programme which started in 1995 in an attempt to rationalize Ghana’s power sector by bringing
competition and efficiency setup the Energy Commission as the licensing authority to regulate
the technical operations of utilities and the PURC as the body responsible for setting tariffs to
ensure competition and international best standards. However, these two institutions have left
more to be desired as some of the key benchmarks set have not been achieved. Act 538 which
set up the PURC stipulates the Commission to consult with stakeholders comprising both the
utilities and consumers before approving price increment. The consultation and engagement
process with consumers has often not been satisfactory. In March 2013, the Association of
Ghana Industries (AGI) protested against the VRA’s intended implementation of a regulation
that sought to increase energy costs to industry by over 75 percent. In their defence, the AGI
cited Legislative Instrument (LI) 1937xii which states that “electricity generated from Akosombo
and Kpong hydro dams shall not be subjects of a bilateral contract.” There were also mass
protestations by the general populace when electricity tariffs were increased by a cut-throat
78.9% in October 2013 after 2 years of price stagnation.

Page | 9
The Independent Power Producers (IPPs) who generate the majority of the thermal power
component of our electricity supply have cited their inability to meet the performance standards
set by the regulator based on which a price review is premised in addition to other market
factors to tariff under recovery. On 11 February 2013xiii, the major service providers cited under-
pricing of utilities as one of their major worries and attributed their inability to meet these
performance standards to declines in capital investments due to under recoveries. This has
drastically affected the cash flow of the IPPs and impacted on their current and future capital
budgeting and investment programmes.
A major contributory factor to the under recoveries by the IPPs who entered the market
following the liberalization of the electricity sector has been the inefficient market structure
where full operational costs including a capital recovery factor are not guaranteed in the tariffs
set by the PURC. The quarterly automatic tariff-adjustment formula introduced by the PURC in
2011 which incorporates fluctuations in crude/gas prices, foreign exchange rates, the
hydrothermal generation mix, and changes in the consumer price index has not been
implemented to the letter because government often interferes in the market price setting
mechanism. Government often promises to absorb the price mark-up instead of passing it on
the consumer but delays in paying the distributors these subsidies. As at December 2012, the
total Government of Ghana stock of energy arrears stood at GH¢420.99 million comprising of
GH¢239.89 million indebtedness to VRA; ECG GH¢107.7 million; and the Northern Electricity
Distribution Company GH¢73.37 million. Most of these have subsequently been cleared by the
government under the Energy Sector Arrears Clearance initiative.xiv The policy of subsidized
tariffs has distorted the current pricing regime to the extent that full cost recovery by the IPPs
has become near impossible. As a result, the market has become one in which the IPPs have
an incentive to sell power to VRA in off-taker agreements rather than as competitors. An
efficient competitive setup would have brought down the wholesale price of electricity ultimately
leading to greater consumer welfare on account of the reduction in the deadweight inefficient
losses currently being bundled and passed on to consumers.
Many of the provisions of Legislative Instrument (LI) 1937 are yet to be met 5 years after its
ratification by parliament. The establishment of the Wholesale Electricity Market structure under
clauses 5 and 7 are yet to be implemented. In the absence of a spot market for power, bilateral
contracts serve as the main negotiation tool for settlement. However, the legislations stipulate a
pricing approach based on a merit-order dispatch system where the short run (SR) marginal
cost of supply of the individual producers forms the pricing basis. Thus, plants with the lowest
SR marginal costs such as Akosombo and Kpong are initially brought on stream to meet
demand followed by the thermal units such as TICO and Sunon Asogli. Though it could be

Page | 10
argued that government has prioritized universal access to electricity as a major poverty
alleviating tool, it is imperative that the market price of electricity includes the full costs incurred
by operators including a return on investment to ensure long term security of supply. Credit and
liquidity risks are very high in the Ghanaian electricity sector because the subsidy component
which comes from government though budgeted on an annual basis has never been paid to the
IPPs on time coupled with non-payment of bills by some industrial and commercial consumers.
These have the potential of severely disrupting investment decisions and expanding the
infrastructure base to meet future energy demand.
Another yet to be resolved issue is the role of Jubilee gas in meeting domestic energy demand
and how its pricing will affect end-user tariffs. Generally, Jubilee gas is supposed to lower the
unit operating costs of the CCGT plants that currently run on crude or light cycle oil. However,
the gas pricing policy by Ghana National Gas Company (GNGC) needs to ensure that capital
costs expensed on the Jubilee Field are fully recovered. Therefore, the pricing of the gas is
unlikely to be dramatically lower in the short to medium term of 5 years and may be comparable
to supplies from Nigeria through the WAGP until the capital costs are fully expensed. Gas from
the Jubilee Field is expected to last 20 years with an estimated production of 120 MMscf/d of
associated gas produced and a net of 80 MMscf/d. Phase 2 of the Jubilee expansion project is
expected to raise this output to 160 MMscf/d by 2016 and 400 MMscf/d by 2025.
Figure 7: Ghana Gas demand forecast
Source: World Bank, 2013

Page | 11
6. Conclusions
What currently exists in Ghana is a semi-liberalised electricity industry dominated by two state-
owned natural monopolies (VRA and ECG) and a weak regulator that has political interference
from the State thus preventing it from effectively setting the pricing regime. The main issues that
need to be addressed in the short to medium term over the next 5 years are:
a) Expand effective capacity to at least 3,500MW to meet demand and reserve
requirements for the next 4 years
b) Sort out the messy tariff system to give incentives for the IPPs to produce and compete
at the wholesale level – i.e. the Automatic Adjustment Formula
c) Focus attention on expanding the distribution infrastructure with a fully costed action
plan with private sector participation under a Private Public Partnership (PPP) scheme
d) Rigorously enforce regulatory governance to ensure consumers are protected from
arbitrary price mark ups and inefficiencies from the utilities being passed onto them.
e) Have an enforceable policy mandate in place for the introduction of energy efficiency
programmes especially at the MDAs using energy audits and remote monitoring
systems.
Overall, a review of the regulatory framework to ensure competition should increase efficiencies,
ensure price guaranties by curbing abuse of market power due to collusive and arbitrary pricing
by the utilities ultimately culminating in better consumer welfare.
Published by IMANI Center for Policy & Education on behalf of the Authors.

Page | 12
7. End Notes
i Power Systems and Energy Consulting (PESC) report available at: http://www.gridcogh.com/site/downloads/27a623e256c7d94a7dce43d5ef82d3e3GridCoReportFinal.pdf ii See: http://www.tullowoil.com/files/pdf/ghana/Jubilee-‐gas-‐commercialisation.pdfii iii See: http://vraghana.com/resources/facts.php iv Mega Watt measures the unit of energy and is the standard term measure for bulk electricity. One megawatt is equal to 1 million watts or 1,000 kilowatts. v See: http://www.myjoyonline.com/news/2014/January-‐28th/inadequate-‐supply-‐forces-‐ecg-‐to-‐ration-‐power-‐tarzan-‐exposes-‐vra.php vi Natural monopolies are usually associated with industries (e.g. utilities) where there is a high ratio of fixed (sunk) costs to variable costs. These high capital costs can be a strong barrier to entry for competitors. As such, overall societal welfare is maximized because having multiple firms operating in such an industry tends to be economically inefficient as economies of scale don’t abound until the firm is large relative to the market size. vii See: http://www.esmap.org/sites/esmap.org/files/P099234_AFR_Monitoring%20Performance%20of%20Electric%20Utilities_Tallapragada_0.pdf viii See: http://www.ventures-‐africa.com/2012/10/west-‐african-‐gas-‐pipeline-‐to-‐miss-‐target-‐due-‐to-‐vandalization/ ix See: http://wagpco.com/index.php?option=com_content&view=article&id=122&Itemid=85 xSee: http://www.johnmahama.org/sites/default/files/downloads/NDC-‐2012-‐Manifesto_0.pdf xi National Energy Policy available at: http://ghanaoilwatch.org/images/laws/national_energy_policy.pdf xii See: http://www.purc.com.gh/purc/sites/default/files/li1937.pdf xiii See: http://www.ghanaweb.com/GhanaHomePage/NewsArchive/artikel.php?ID=264671 xiv See http://www.mofep.gov.gh/sites/default/files/reports/energy_sector_arrears_clearance_plan.pdf