getting the most from your act explore reporting package … · getting the most from your act...
TRANSCRIPT

6
Getting the Most from your ACT Explore
Reporting Package
January, 2015

8
Meredith Townley
Learning Management Team
Phone: 319.333.9430
www.act.org/learning-at-act

9 9
Workshop Objectives Introduction
Describe ACT’s definition of college and career
readiness
Explain ACT’s K−Career Continuum and how
ACT Explore fits
Find key data points in the ACT Explore Student
and Summary Profile Reports
Translate data into insights about curriculum,
instruction and support at the district, school,
and classroom levels

10 10
Workshop Agenda
College and Career Readiness
Student Score Report
Break
Profile Summary Report
Item Response Summary Report
Early Intervention Rosters
Reflections

12
Workshop Materials
Workbook
Road Map
13
What does College and Career
Readiness mean to you?
13
Introduction College and Career Readiness

14
Defining
College and
Career
Readiness
p. 5

15 15
ACT’s Definition of College and Career Readiness
College and Career Readiness is the level
of preparation a student needs
to be equipped to enroll and succeed –
without remediation – in a
credit-bearing, first-year course
at a two-year or four-year institution,
trade school, or technical school.
p. 5

16 16
In the next decade, nearly two-thirds of
new jobs created in the U.S. will require
some post-secondary education or
considerable on-the-job training.
Preparation for College and Career
Prepare all students for
success, no matter
which path they choose
after graduation.

17 17
ACT K through Career Solutions
ACT Explore/ACT Plan
18 18
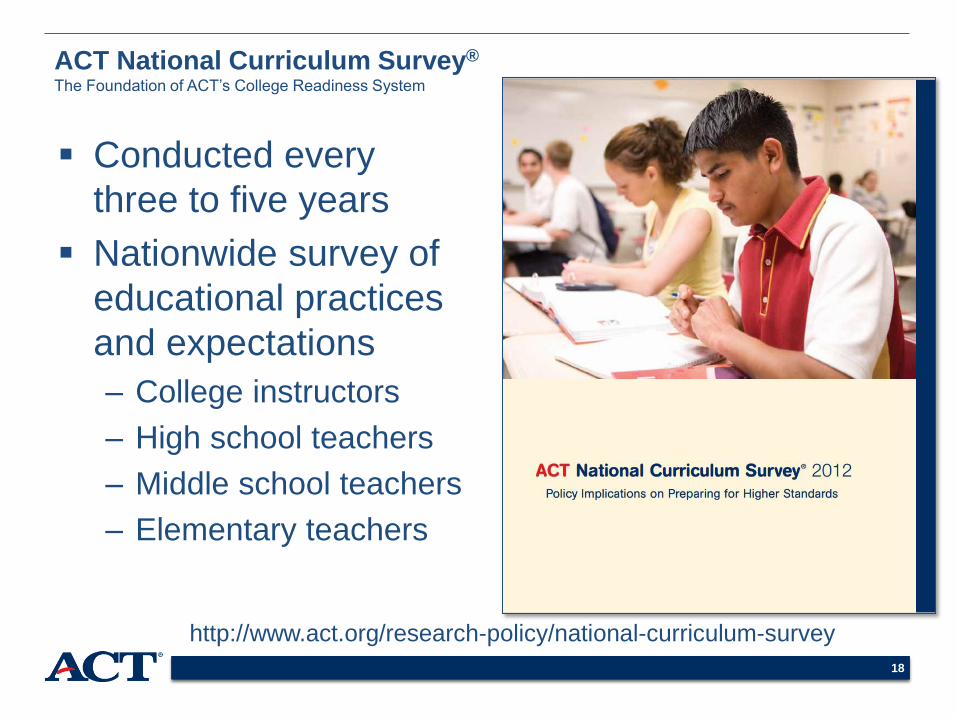
http://www.act.org/research-policy/national-curriculum-survey
ACT National Curriculum Survey®
The Foundation of ACT’s College Readiness System
Conducted every
three to five years
Nationwide survey of
educational practices
and expectations
– College instructors
– High school teachers
– Middle school teachers
– Elementary teachers

20
English
Mathematics
Reading
Science
ACT’s Longitudinal Assessment System
Writing

21
25
32
36
English
Mathematics
Reading
Science
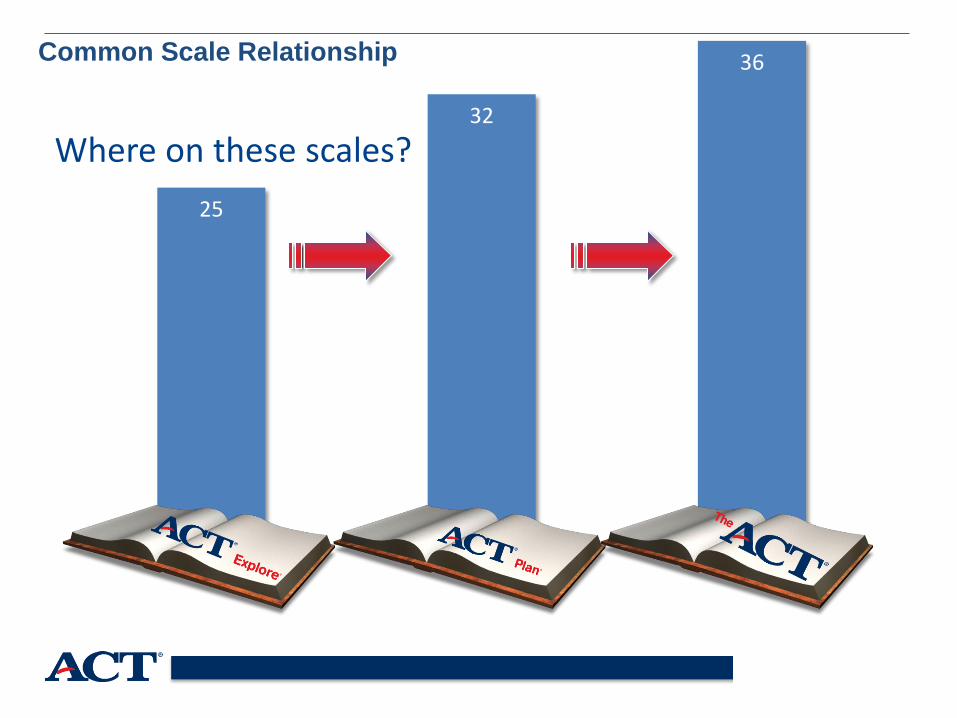
Common Scale Relationship
Writing

22
25
32
36 Common Scale Relationship

23 23
Longitudinal Assessments ACT Curriculum-Based Assessments
p. 5
24
25
32
36 Common Scale Relationship
Where on these scales?

26 26
ACT’s College Readiness Benchmarks
Test College Course 8th Grade 9th Grade
English English Composition 13 14 15 18
Math College Algebra 17 18 19 22
Reading Social Sciences 16 17 18 22
Science Biology 18 19 20 23
Empirically derived
50% likelihood of achieving a B or higher
Or about a 75% likelihood of achieving a C or higher in the
corresponding credit-bearing college course
p. 3

28 28
Condition of College and Career Readiness, 2014 State Results
Percent of 2014 ACT-Tested High School Graduates
by Number of ACT College Readiness Benchmarks Attained
http://www.act.org/newsroom/data/2014/states/pdf/Arizona.pdf
29 29
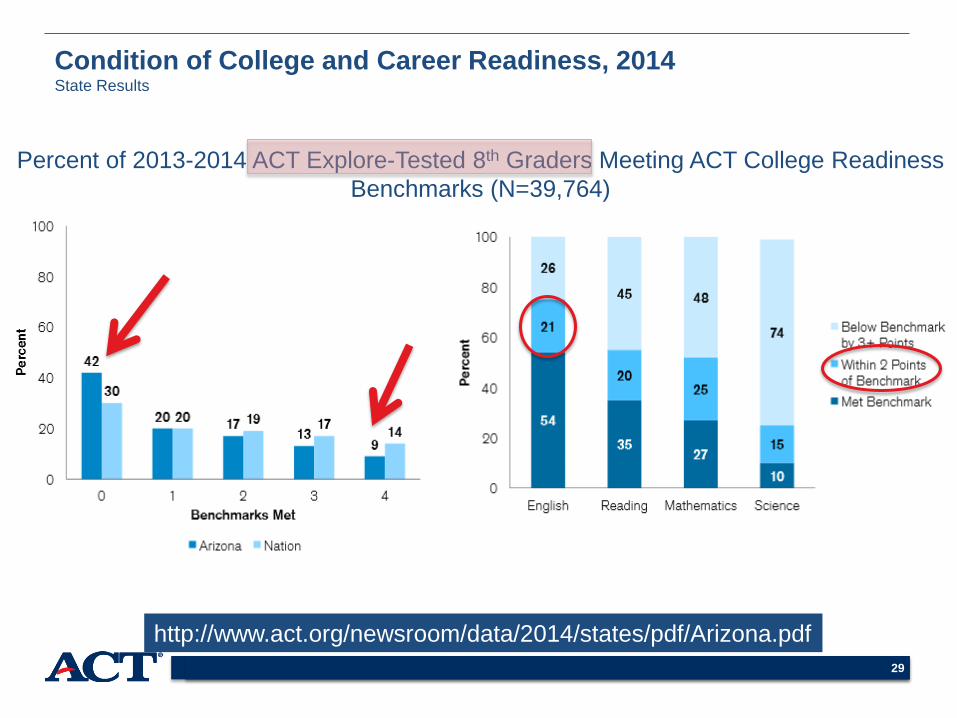
Condition of College and Career Readiness, 2014 State Results
Percent of 2013-2014 ACT Explore-Tested 8th Graders Meeting ACT College Readiness
Benchmarks (N=39,764)
http://www.act.org/newsroom/data/2014/states/pdf/Arizona.pdf

31 31
http://www.act.org/research/policymakers/reports/ForgottenMiddle.html
The Forgotten Middle Key Finding
Eighth-grade
academic
achievement is the
best predictor of
college and career
readiness by high
school graduation.

32 32
The Forgotten Middle Key Findings
Improvement in eighth-grade academic
achievement and being on target for
college and career readiness in eighth
grade are more beneficial than any high
school-level academic enhancement.
Being on target for college and career
readiness in eighth grade puts students on
a trajectory for success.
http://www.act.org/research/policymakers/reports/ForgottenMiddle.html

37 37
Student
Score
Report

40
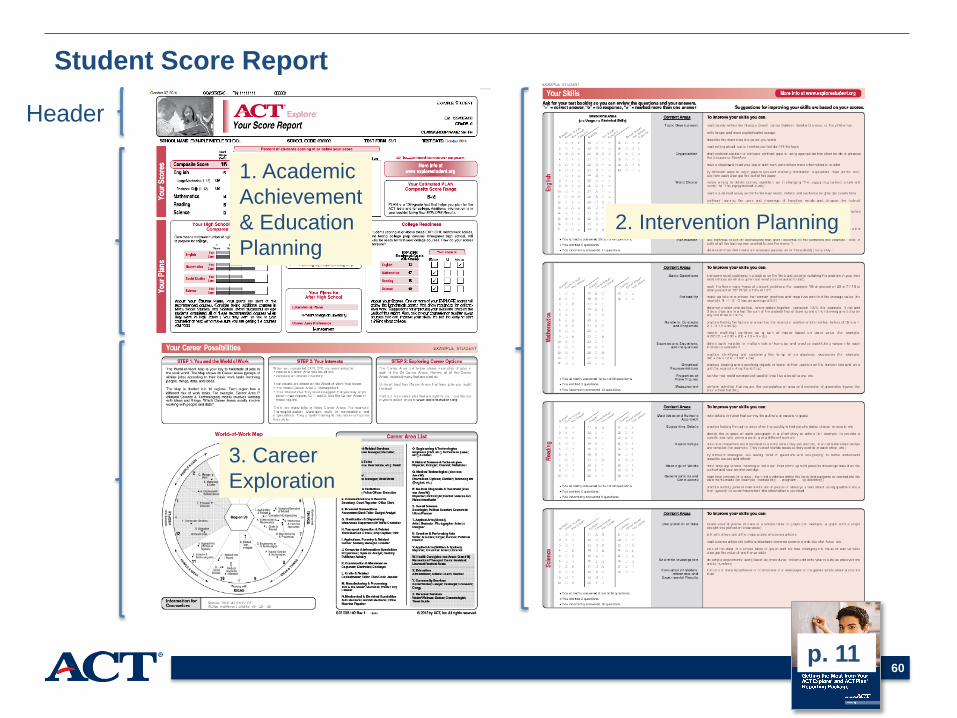
Student Score Report
Header
3. Career
Exploration
1. Academic
Achievement
& Education
Planning
2. Intervention Planning
p. 10

41
Report Header Student Information
Student’s
Name
Student’s
Grade Level
Student’s
School
Test Form
Test Date
p. 10

42
1. Academic Achievement and Education Planning: Your Scores Student Scores and Norms
p. 10
43
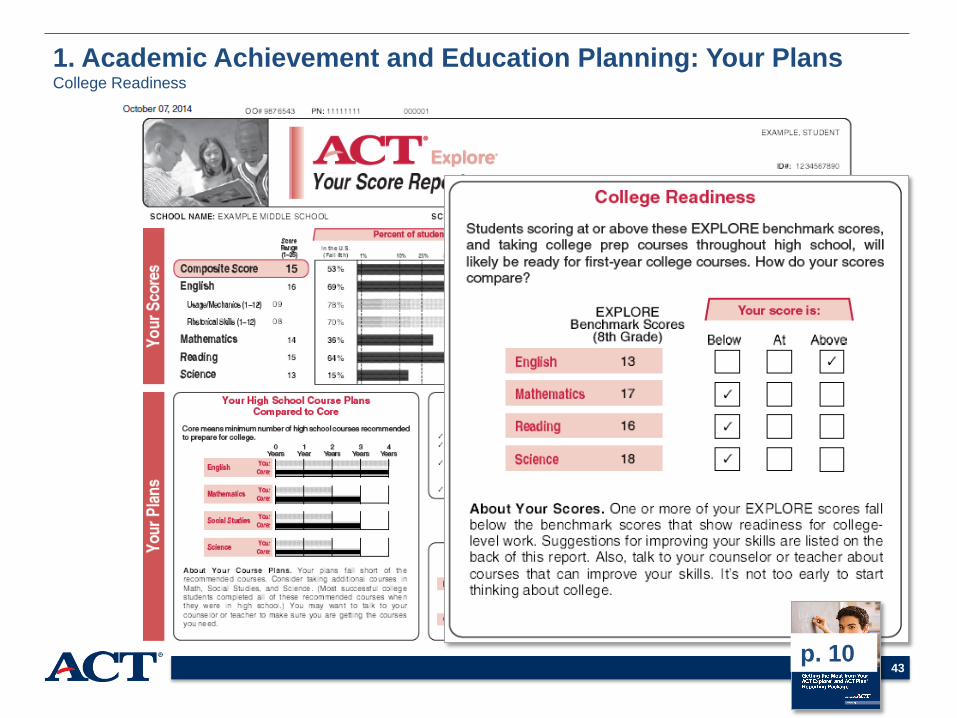
1. Academic Achievement and Education Planning: Your Plans College Readiness
p. 10

44
Is the student on
target?
What action can be
taken to increase
college readiness?
Where does the student
need intervention?
1. Academic Achievement and Education Planning: Your Plans College Readiness
p. 10

45
1. Academic Achievement and Education Planning: Your Plans College Readiness
p. 10
46
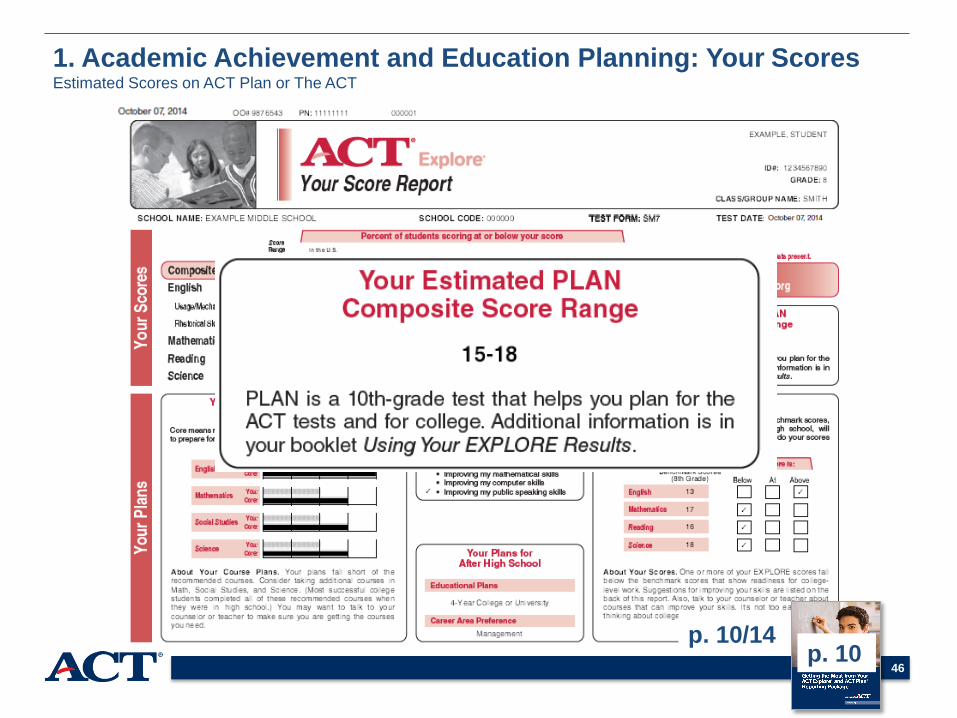
1. Academic Achievement and Education Planning: Your Scores Estimated Scores on ACT Plan or The ACT
p. 10/14 p. 10
47
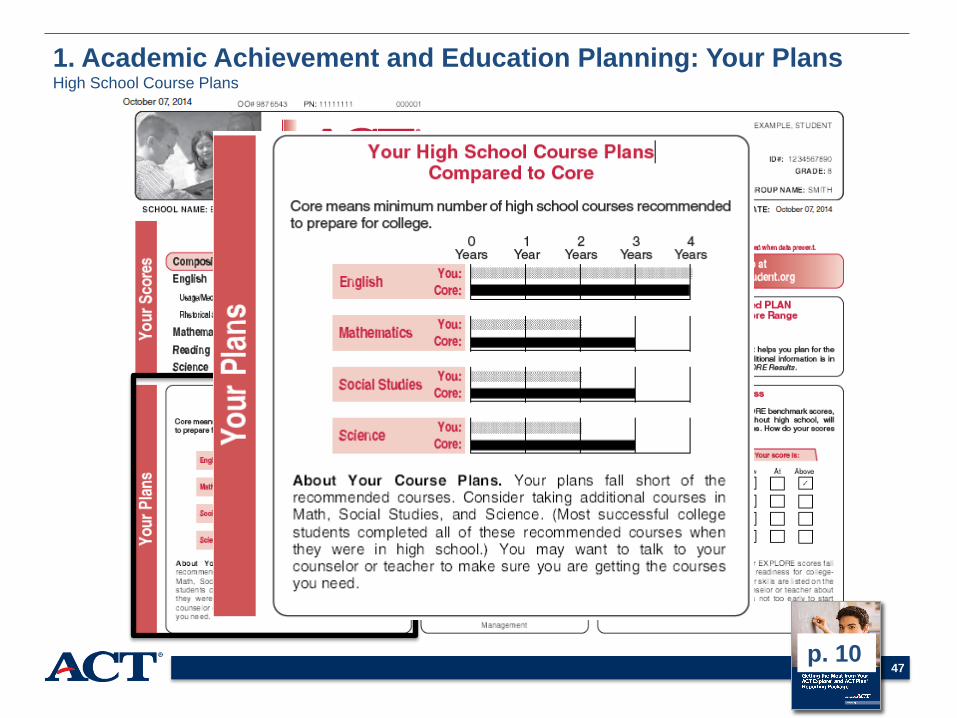
1. Academic Achievement and Education Planning: Your Plans High School Course Plans
p. 10

48
1. Academic Achievement and Education Planning: Your Plans Reported Needs
p. 10

49 49
1. Academic Achievement and Education Planning: Your Plans Additional Information
p. 10

50
2. Intervention Planning: Your Skills Item Response Summary and Suggestions for Improvement
p. 12
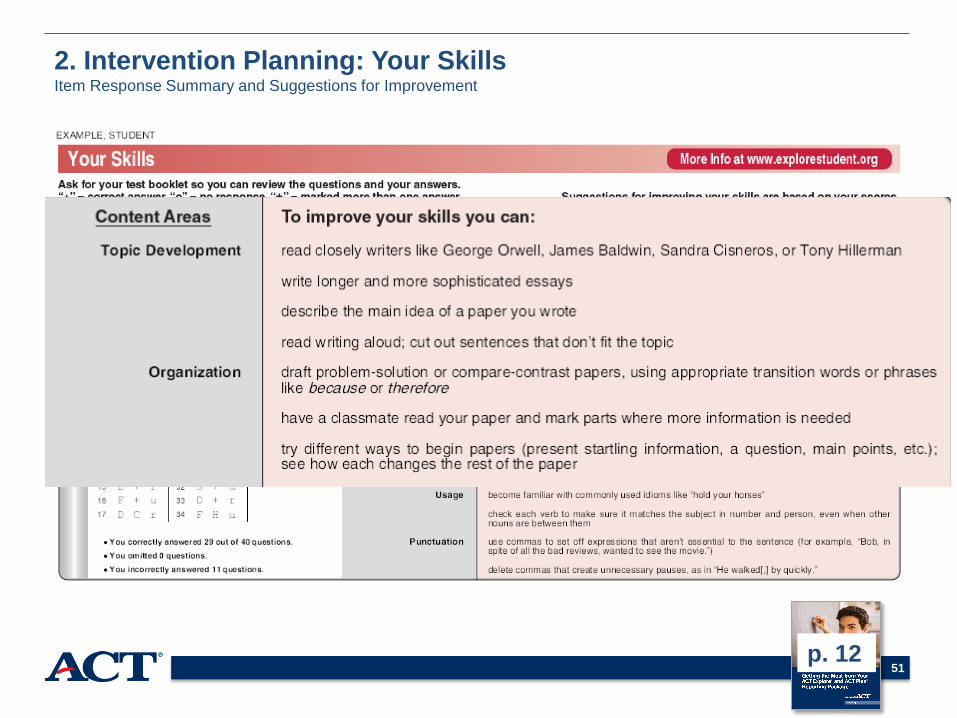
51
2. Intervention Planning: Your Skills Item Response Summary and Suggestions for Improvement
p. 12

52
3. Career Exploration: Your Career Possibilities World of Work
p. 11

53
3. Career Exploration: Your Career Possibilities World of Work
p. 11

54
3. Career Exploration: Your Career Possibilities World of Work
p. 11
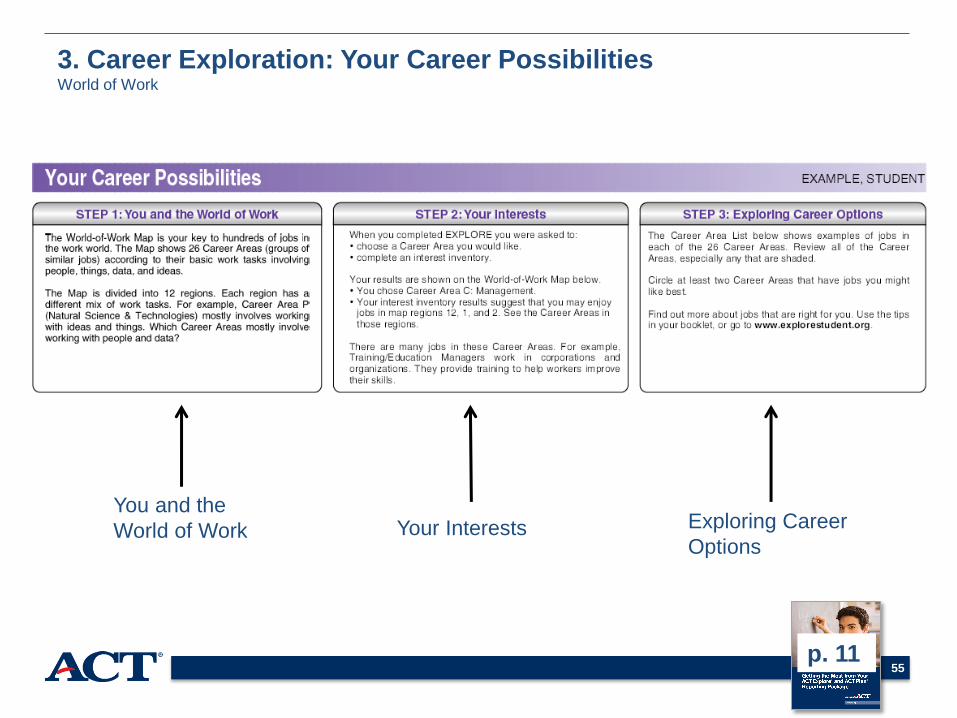
55
You and the
World of Work Your Interests Exploring Career
Options
3. Career Exploration: Your Career Possibilities World of Work
p. 11

56 56 p. 11

57 57 p. 11

58 58 p. 11

59
3. Career Exploration: Your Career Possibilities World of Work
p. 11
60
Student Score Report
Header
3. Career
Exploration
1. Academic
Achievement
& Education
Planning
2. Intervention Planning
p. 11

63
Student Resources
www.explorestudent.org

64
One-Minute
Review
Record your thoughts:
a) What insights have you gained
from examining your Student
Score Reports?
b) How does this impact what you
are doing?
c) What is your Plan of Action for
using and sharing data?
Stand
Share with someone new
S T R E T C H

68 68
Profile
Summary
Report
p. 19

69 69
Profile Summary Report
Aggregates data
from Student
Score Reports
p. 19
71 71
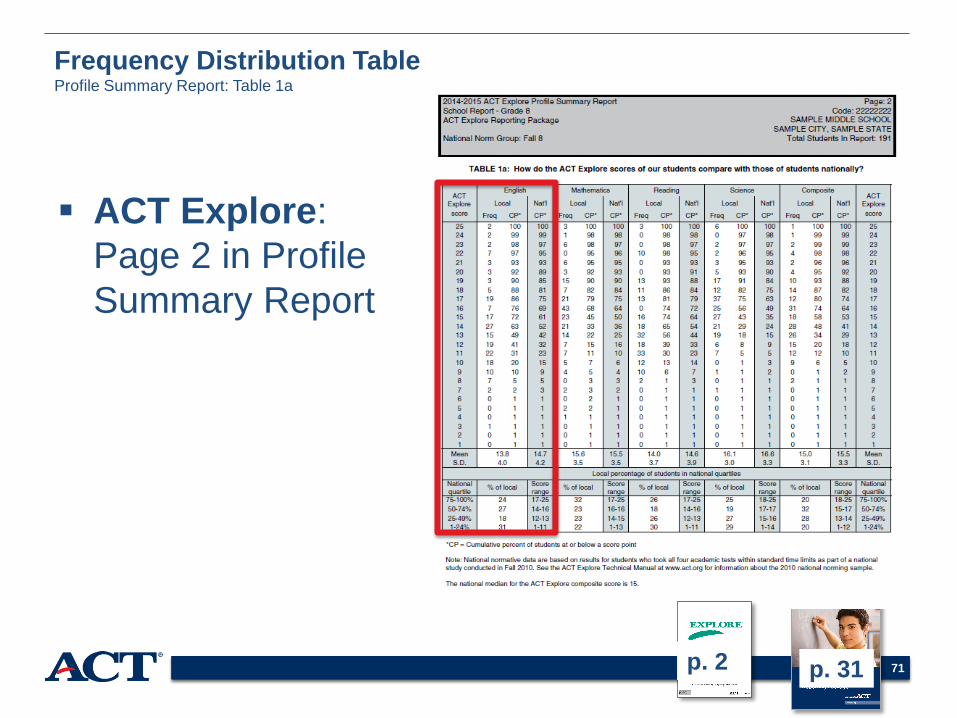
Frequency Distribution Table Profile Summary Report: Table 1a
ACT Explore:
Page 2 in Profile
Summary Report
p. 31 p. 2
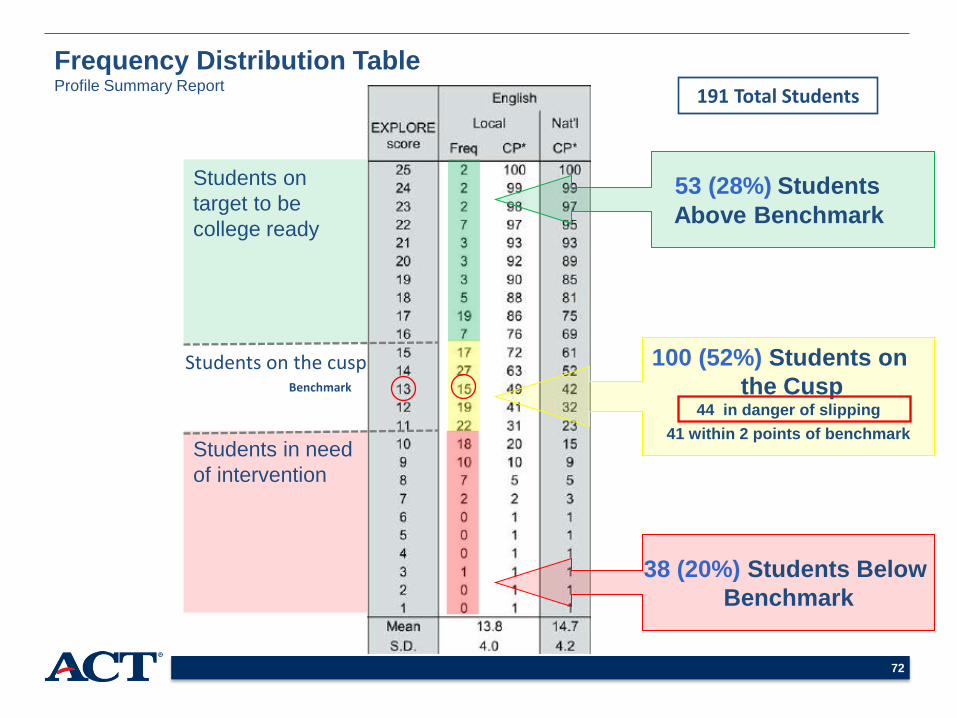
72
Students on
target to be
college ready
38 (20%) Students Below
Benchmark
53 (28%) Students
Above Benchmark
100 (52%) Students on
the Cusp 44 in danger of slipping
41 within 2 points of benchmark
Benchmark
Students on the cusp
191 Total Students
Students in need
of intervention
Frequency Distribution Table Profile Summary Report
74 74
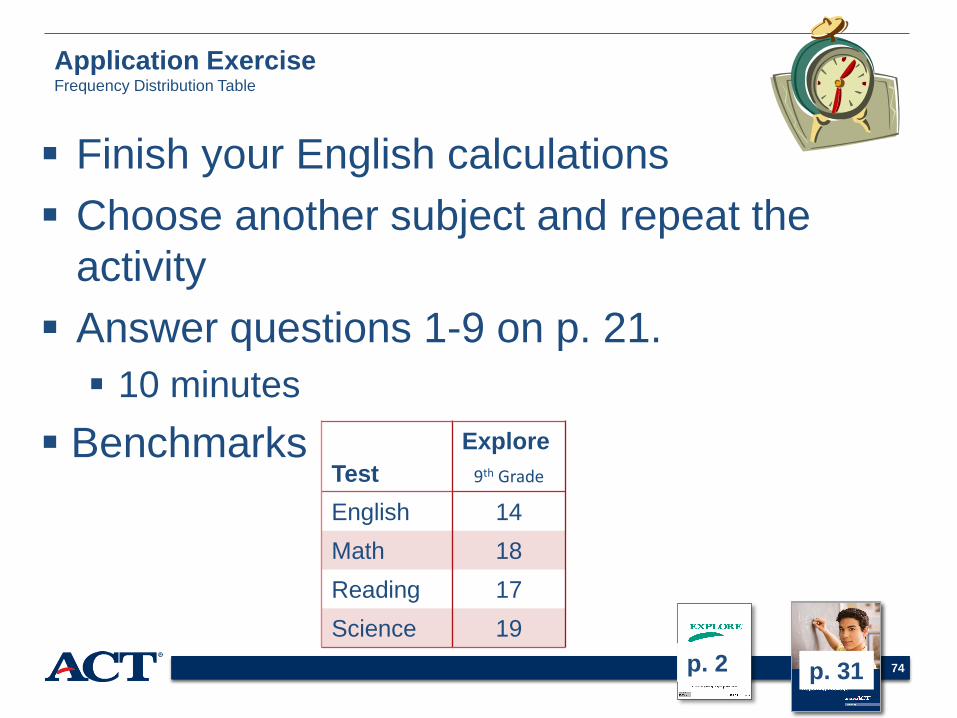
Application Exercise Frequency Distribution Table
Finish your English calculations
Choose another subject and repeat the
activity
Answer questions 1-9 on p. 21.
10 minutes
Benchmarks
p. 31
p. 31 p. 2
Test
Explore
9th Grade
English 14
Math 18
Reading 17
Science 19

75 75
Knowledge and skills by score
level
Help interpret scores
ACT College and Career Readiness Standards
Know and are ready to learn
next www.act.org/standard
ACT’s College and Career Readiness Standards

76 76
Knowledge and skills by score
level
Help interpret scores
ACT College and Career Readiness Standards
Know and are ready to learn
next www.act.org/standard
ACT’s College and Career Readiness Standards
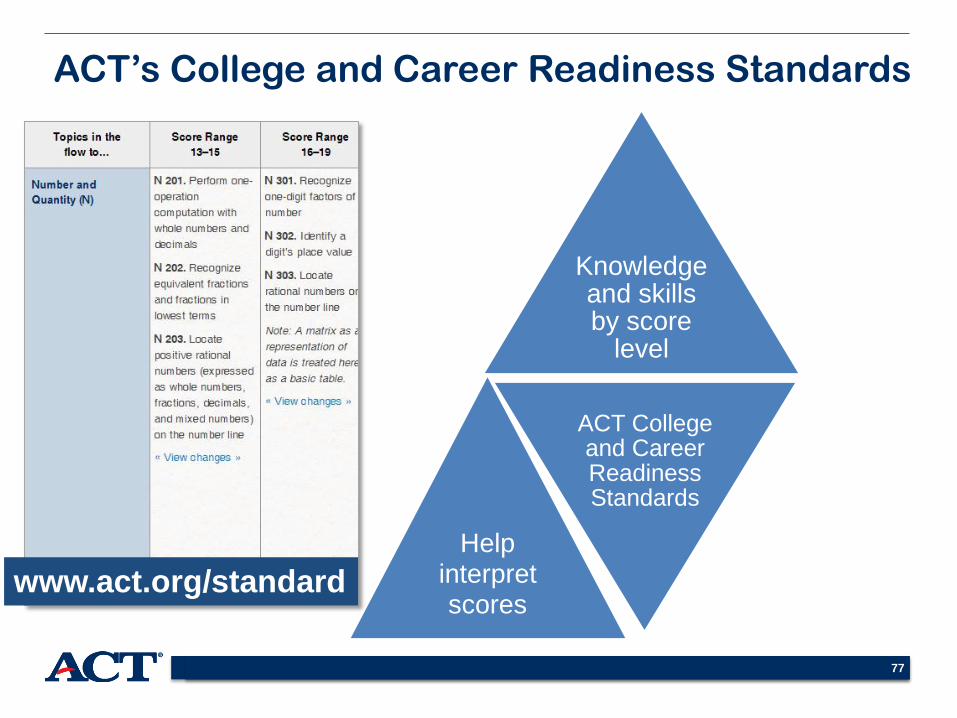
77 77
Knowledge and skills by score
level
Help interpret scores
ACT College and Career Readiness Standards
Know and are ready to learn
next www.act.org/standard
ACT’s College and Career Readiness Standards
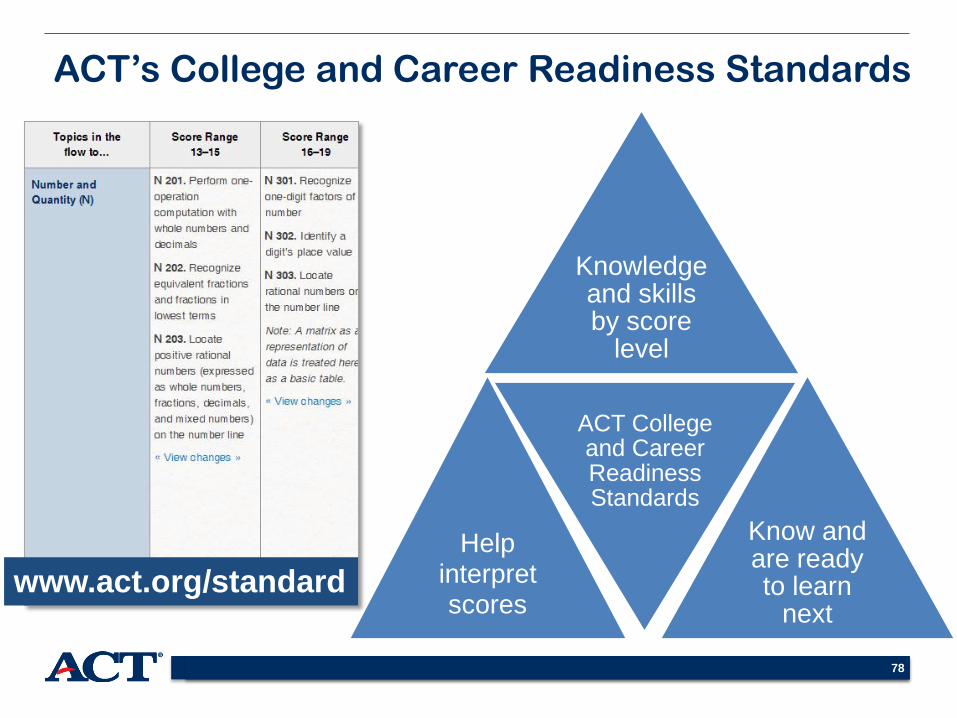
78 78
Knowledge and skills by score
level
Help interpret scores
ACT College and Career Readiness Standards
Know and are ready to learn
next www.act.org/standard
ACT’s College and Career Readiness Standards

79 79
www.act.org/standard
ACT’s College and Career Readiness Standards

80 80
Stra
nd
www.act.org/standard
ACT’s College and Career Readiness Standards

81 81
Statements that describe
what students are likely
to know and be able to do
Stra
nd
www.act.org/standard
ACT’s College and Career Readiness Standards

82 82
Statements that describe
what students are likely
to know and be able to do
Stra
nd
www.act.org/standard
ACT’s College and Career Readiness Standards
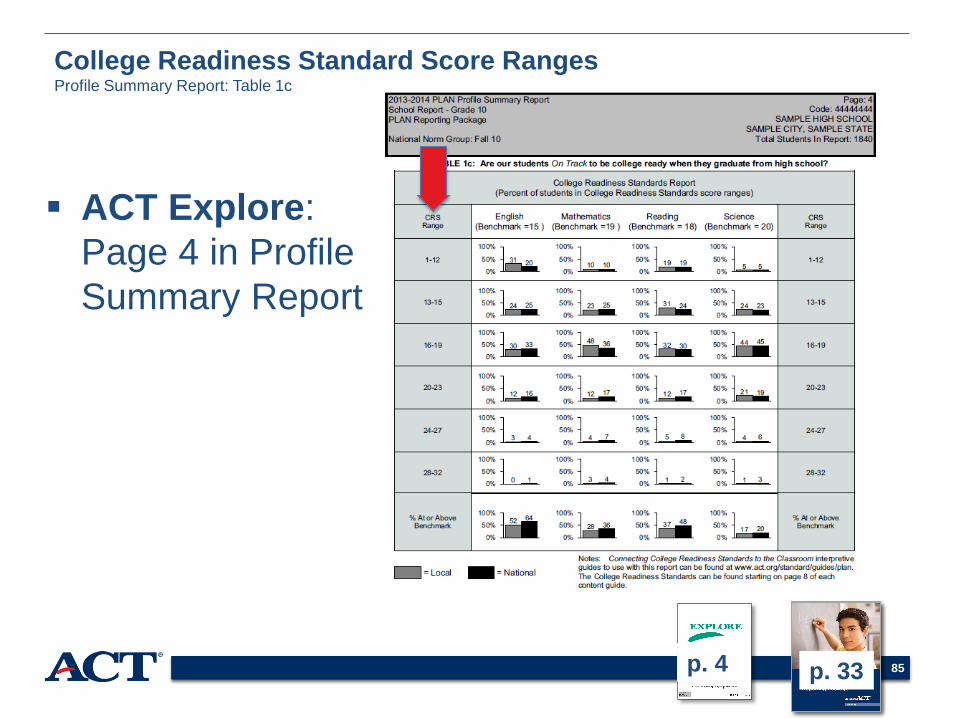
85 85
College Readiness Standard Score Ranges Profile Summary Report: Table 1c
ACT Explore:
Page 4 in Profile
Summary Report
p. 33
p. 33 p. 4
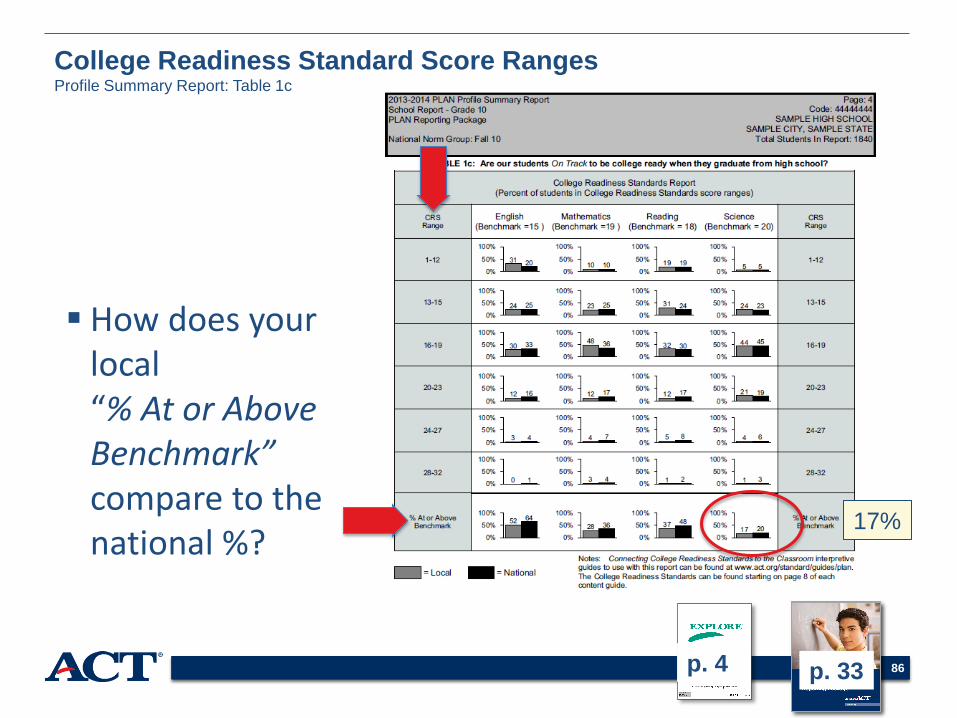
86 86
College Readiness Standard Score Ranges Profile Summary Report: Table 1c
17%
p. 33
How does your local “% At or Above Benchmark” compare to the national %?
p. 33 p. 4

87 87
College Readiness Standard Score Ranges Profile Summary Report: Table 1c
17%
44%
p. 33
Which ranges?
Which College Readiness Standards are your students most proficient?
p. 33 p. 4

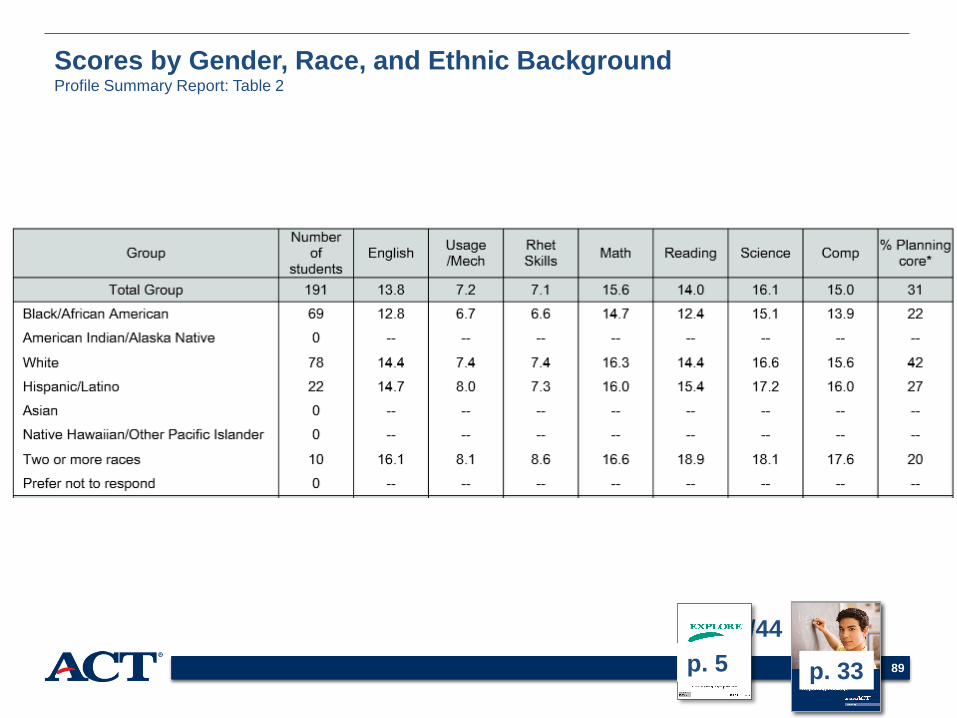
88 88
Scores by Gender, Race, and Ethnic Background Profile Summary Report: Table 2
p. 34/44 p. 33
Where are the instructional gaps?
ACT Explore:
Page 5 in
Profile
Summary
Report
p. 33 p. 5
89 89
Scores by Gender, Race, and Ethnic Background Profile Summary Report: Table 2
p. 34/44 p. 33
p. 33 p. 5

91 91
Scores by Educational Plans and Need for Help Profile Summary Report: Table 3/4
p. 36
ACT Explore:
Page 6 in
Profile
Summary
Report
p. 36 p. 6

92 92
What are the future educational plans of your students?
How can you encourage and support these educational plans?
Educational Plans Profile Summary Report: Table 3
p. 6 p. 36 p. 6

93 93
Educational Plans and Needs Profile Summary Report: Table 4
What areas of need have students’ expressed?
Are you providing programs or services to meet students’ needs?
p. 6 p. 36 p. 6
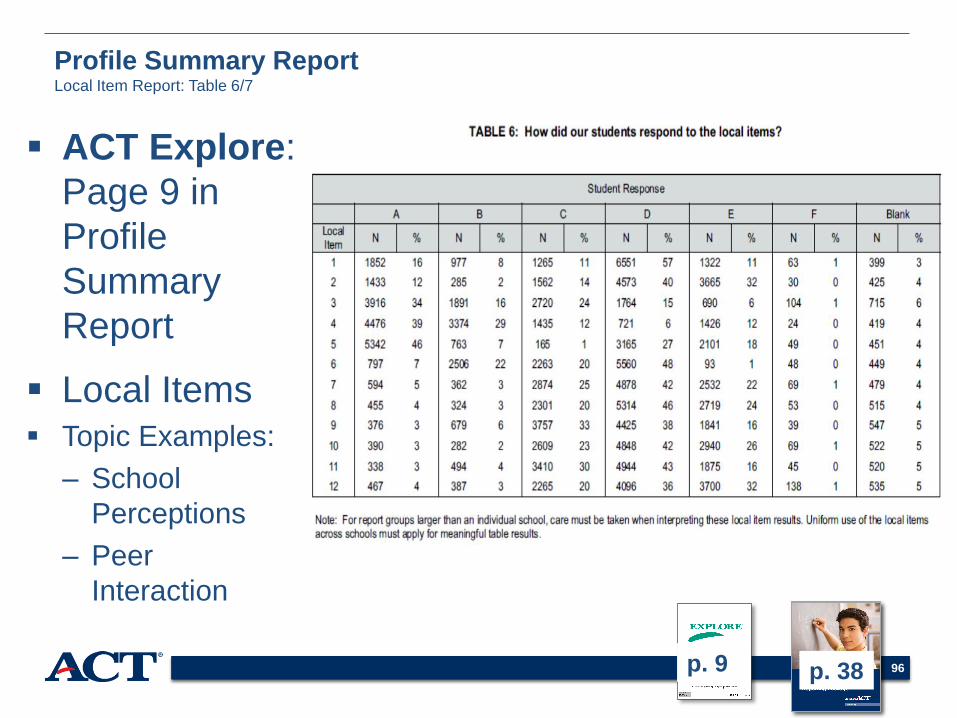
96 96
Profile Summary Report Local Item Report: Table 6/7
Local Items
Topic Examples:
– School
Perceptions
– Peer
Interaction
ACT Explore:
Page 9 in
Profile
Summary
Report
p. 38 p. 9

97 97
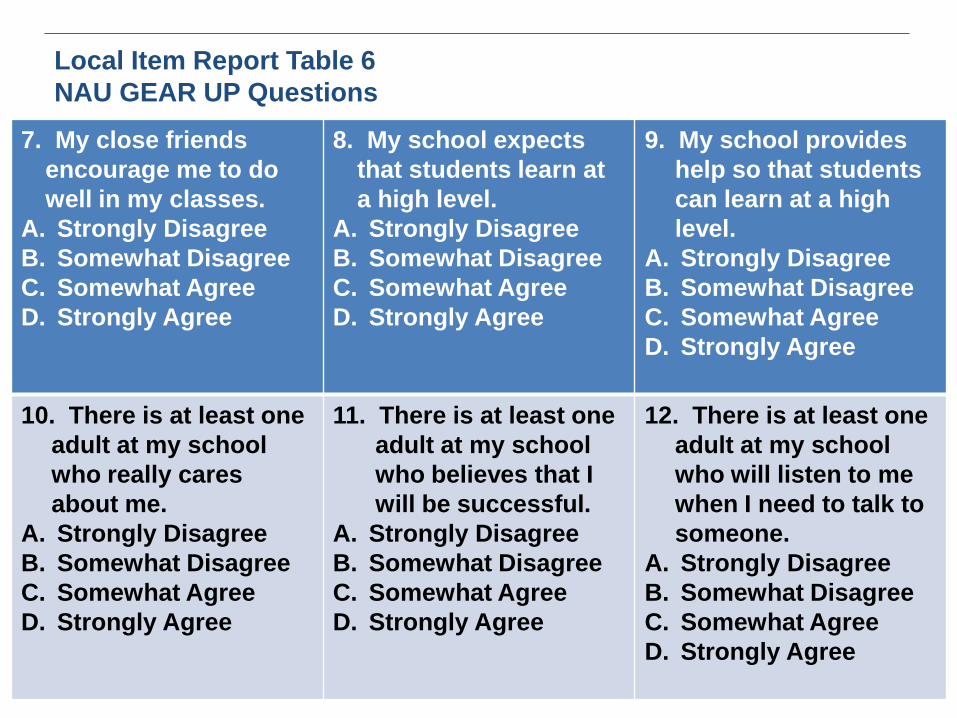
Local Item Report Table 6
NAU GEAR UP Questions
1. People at my school
care if I am absent.
A. Strongly Disagree
B. Somewhat Disagree
C. Somewhat Agree
D. Strongly Agree
2. I fit in with the
students at my
school.
A. Strongly Disagree
B. Somewhat Disagree
C. Somewhat Agree
D. Strongly Agree
3. In my school, students
have a say in decisions
that affect them at
school.
A. Strongly Disagree
B. Somewhat Disagree
C. Somewhat Agree
D. Strongly Agree
4. Most of my teachers
respect my ability to
make good
decisions.
A. Strongly Disagree
B. Somewhat Disagree
C. Somewhat Agree
D. Strongly Agree
5. My close friends and
I spend time talking
about our future after
high school.
A. Strongly Disagree
B. Somewhat Disagree
C. Somewhat Agree
D. Strongly Agree
6. Most of my close
friends want to go to
college after high
school.
A. Strongly Disagree
B. Somewhat Disagree
C. Somewhat Agree
D. Strongly Agree
98 98
7. My close friends
encourage me to do
well in my classes.
A. Strongly Disagree
B. Somewhat Disagree
C. Somewhat Agree
D. Strongly Agree
8. My school expects
that students learn at
a high level.
A. Strongly Disagree
B. Somewhat Disagree
C. Somewhat Agree
D. Strongly Agree
9. My school provides
help so that students
can learn at a high
level.
A. Strongly Disagree
B. Somewhat Disagree
C. Somewhat Agree
D. Strongly Agree
10. There is at least one
adult at my school
who really cares
about me.
A. Strongly Disagree
B. Somewhat Disagree
C. Somewhat Agree
D. Strongly Agree
11. There is at least one
adult at my school
who believes that I
will be successful.
A. Strongly Disagree
B. Somewhat Disagree
C. Somewhat Agree
D. Strongly Agree
12. There is at least one
adult at my school
who will listen to me
when I need to talk to
someone.
A. Strongly Disagree
B. Somewhat Disagree
C. Somewhat Agree
D. Strongly Agree
Local Item Report Table 6
NAU GEAR UP Questions

99 99
Profile Summary Report Additional information
Profile Summary Report also includes:
– Relation between scores & coursework (Tables
3/4 Explore)
– Relation between scores and career/
educational plans and interests (Tables 5a & 5b)

102 102
Item Response
Summary Report
p. 25

104 104
Provides data on
the item-by-item
performance of
your students.
Useful for
curriculum review
when used with the
test booklet.

105 105
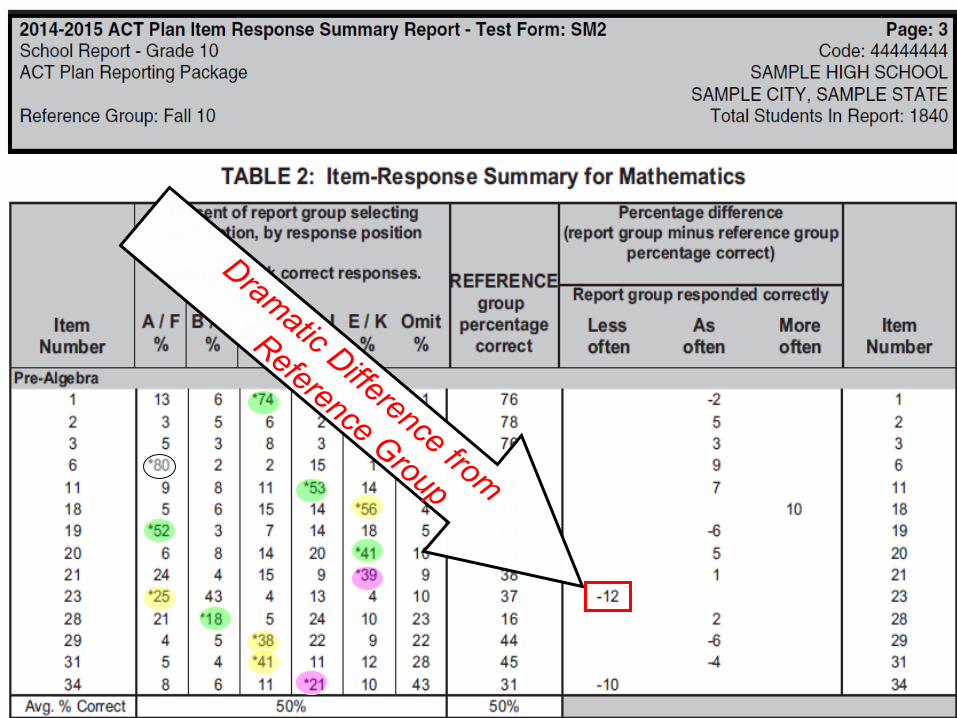
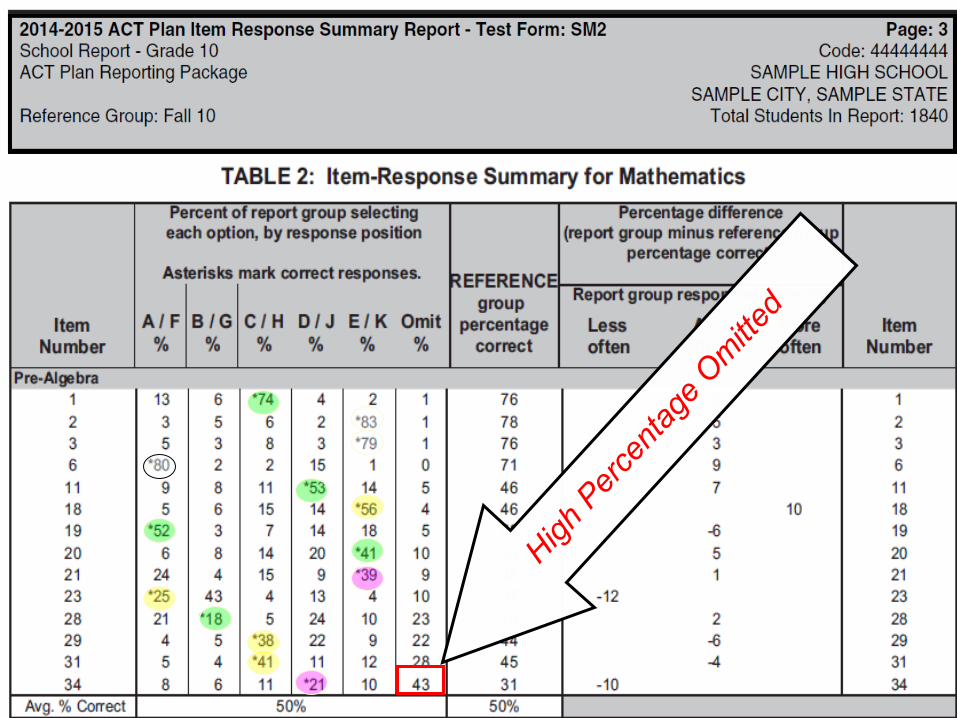
Item Response Summary Report Introduction
Test Form

106
Item Response Summary Report
p. 53

107
Item Response Summary Report
p. 53

108 108
Application Exercise Item Response Summary Report
Pick 1 content area.
Circle the *asterisked numbers (correct answers)
for each question.
Use your highlighters to mark only the circled
numbers:
No Mark 75%+
Green 50-74%
Yellow 25-49%
Pink 0-24%
p. 51

110
Replace image with what is in the workbook and fix the color coding key to match

111 111
Look for Patterns
Do any situations occur more frequently for some domains than
others?
Analysis Application Exercise
113

114
115

118 p. 62
Early
Intervention
Rosters

120
School-level reports
that identify students
who fall into three
categories:
Roster 1:
Educational Plans
Roster 2:
Below 10th percentile
Roster 3:
Need Help
122 122
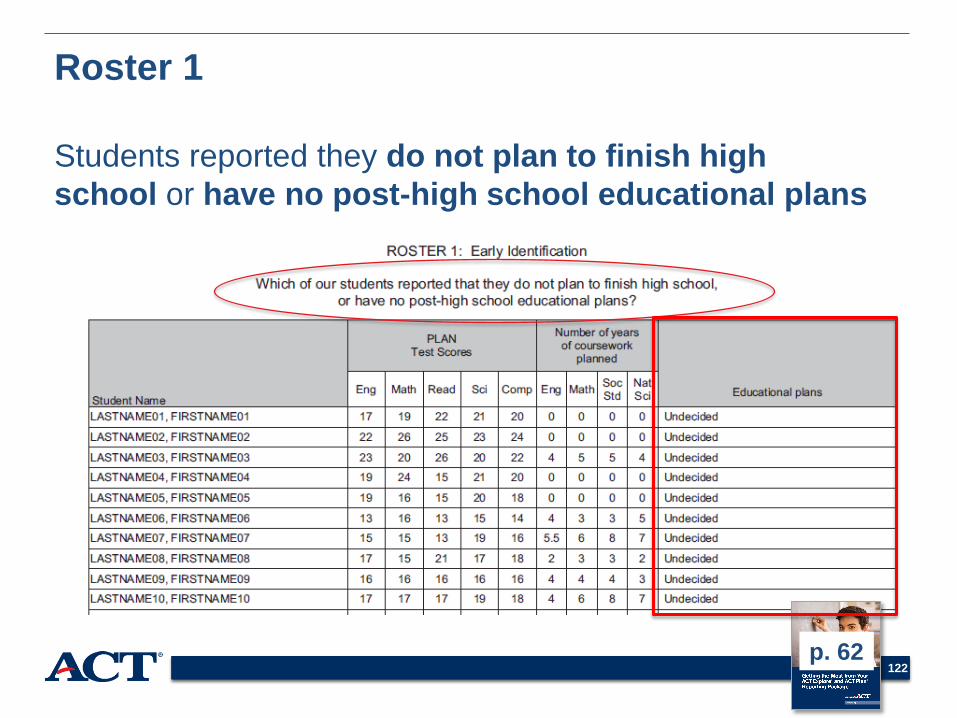
Roster 1
Students reported they do not plan to finish high
school or have no post-high school educational plans
p. 62

123 123
Roster 1
Students reported they do not plan to finish high
school or have no post-high school educational plans
p. 62
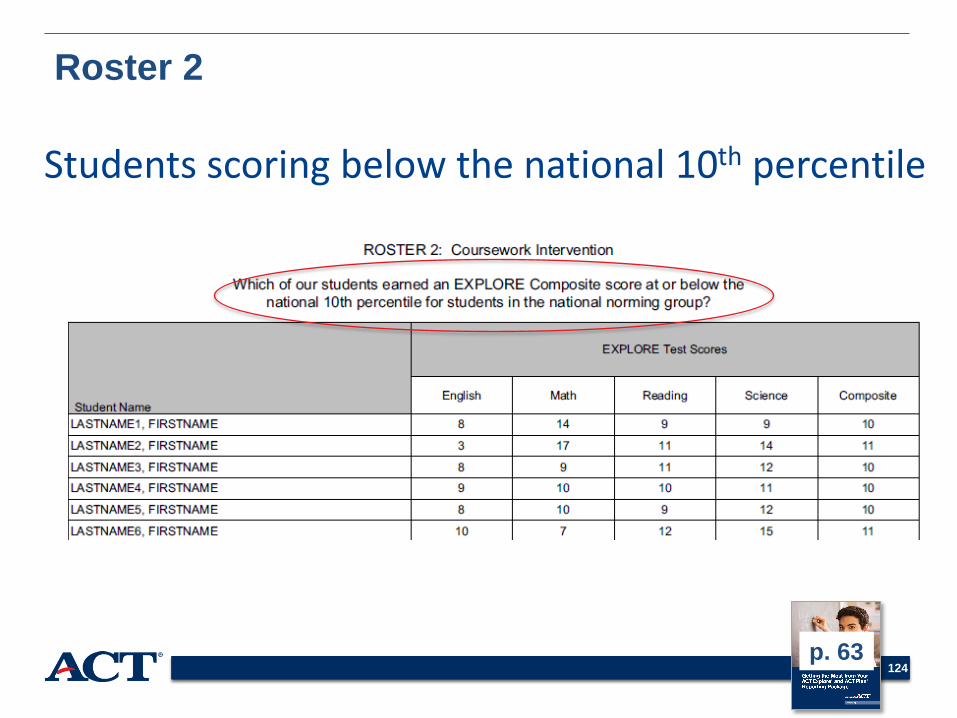
124 124
Roster 2
Students scoring below the national 10th percentile
p. 63
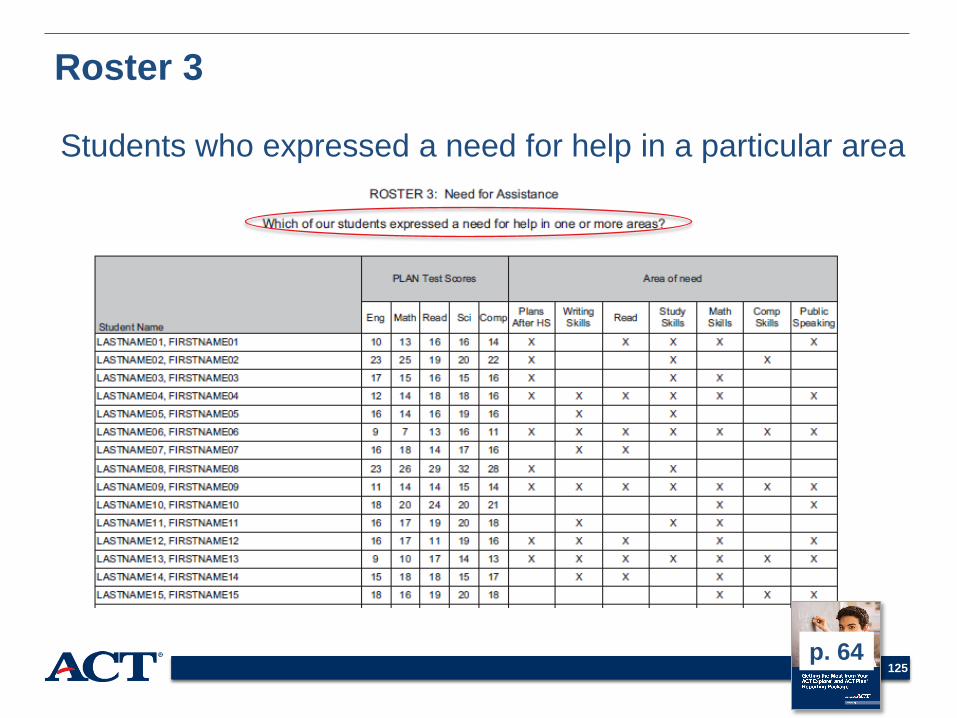
125 125
Roster 3
Students who expressed a need for help in a particular area
p. 64

135
Wrap Up
Student Score Report
• Individual Report for each student
Summary Report
• Summary of all the individual student reports
Item Summary Report
• Item by Item performance of your students
Early Intervention Rosters
• School-level reports that identify students in specific categories

136
Wrap Up
Student Score Report
• Individual Report for each student
Profile Summary Report
• Summary of all the individual student reports
Item Summary Report
• Item by Item performance of your students
Early Intervention Rosters
• School-level reports that identify students in specific categories

137
Wrap Up
Student Score Report
• Individual Report for each student
Profile Summary Report
• Summary of all the individual student reports
Item Summary Report
• Item by Item performance of your students
Early Intervention Rosters
• School-level reports that identify students in specific categories
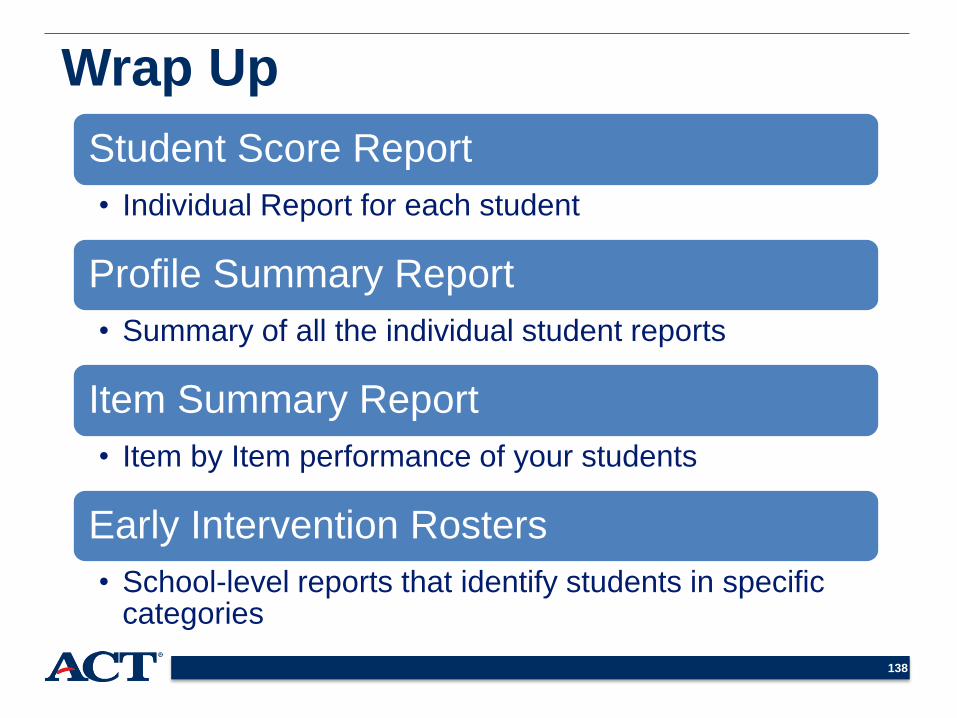
138
Wrap Up
Student Score Report
• Individual Report for each student
Profile Summary Report
• Summary of all the individual student reports
Item Summary Report
• Item by Item performance of your students
Early Intervention Rosters
• School-level reports that identify students in specific categories
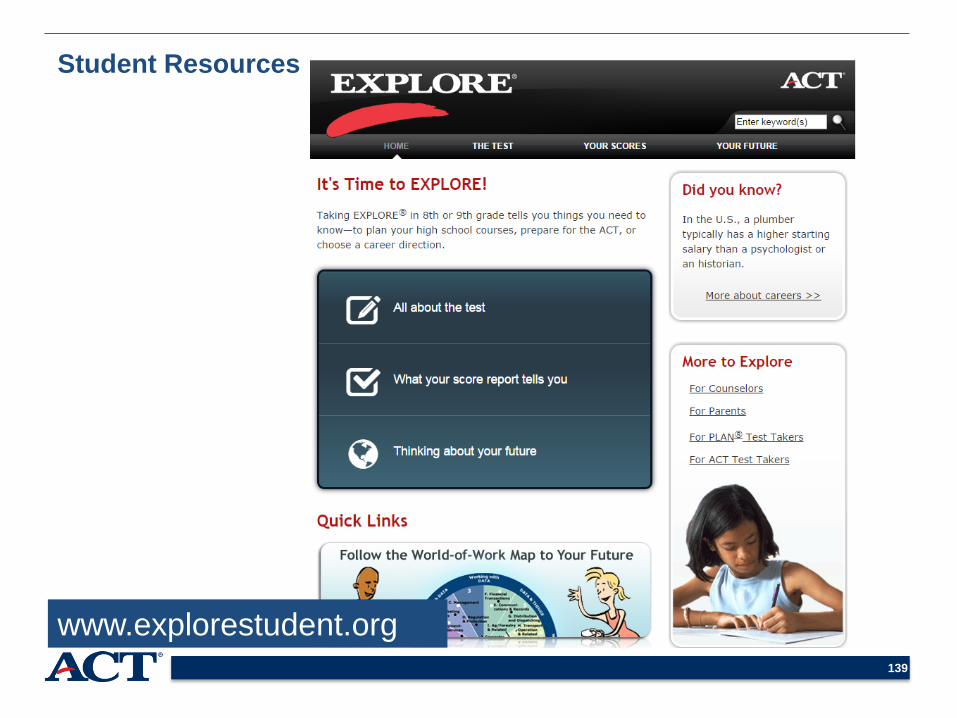
139
Student Resources
www.explorestudent.org

140 140
ACT Resources for Students ACT Profile
www.actprofile.org

141 141
Certificate of Completion
p. 93