getting started tutorial: identifying hardware issues started tutorial: identifying hardware issues...
TRANSCRIPT

Getting Started Tutorial: IdentifyingHardware IssuesIntel® VTune™ Amplifier XE 2011 for Windows* OS
C++ Sample Application Code
Document Number: 326708-001
Legal Information


ContentsLegal Information................................................................................5Overview..............................................................................................7
Chapter 1: Navigation Quick Start
Chapter 2: Identifying Hardware IssuesVisual Studio* IDE: Choose Project and Build Application..............................14Standalone GUI: Build Application and Create New Project............................17Run General Exploration Analysis...............................................................20Interpret Results......................................................................................21Analyze Code..........................................................................................24Resolve Issue..........................................................................................25Resolve Next Issue...................................................................................28
Chapter 3: Summary
Chapter 4: Key Terms
Contents
3

Getting Started Tutorial: Identifying Hardware Issues
4

Legal InformationINFORMATION IN THIS DOCUMENT IS PROVIDED IN CONNECTION WITH INTEL PRODUCTS. NO LICENSE,EXPRESS OR IMPLIED, BY ESTOPPEL OR OTHERWISE, TO ANY INTELLECTUAL PROPERTY RIGHTS ISGRANTED BY THIS DOCUMENT. EXCEPT AS PROVIDED IN INTEL'S TERMS AND CONDITIONS OF SALE FORSUCH PRODUCTS, INTEL ASSUMES NO LIABILITY WHATSOEVER AND INTEL DISCLAIMS ANY EXPRESS ORIMPLIED WARRANTY, RELATING TO SALE AND/OR USE OF INTEL PRODUCTS INCLUDING LIABILITY ORWARRANTIES RELATING TO FITNESS FOR A PARTICULAR PURPOSE, MERCHANTABILITY, OR INFRINGEMENTOF ANY PATENT, COPYRIGHT OR OTHER INTELLECTUAL PROPERTY RIGHT.
A "Mission Critical Application" is any application in which failure of the Intel Product could result, directly orindirectly, in personal injury or death. SHOULD YOU PURCHASE OR USE INTEL'S PRODUCTS FOR ANY SUCHMISSION CRITICAL APPLICATION, YOU SHALL INDEMNIFY AND HOLD INTEL AND ITS SUBSIDIARIES,SUBCONTRACTORS AND AFFILIATES, AND THE DIRECTORS, OFFICERS, AND EMPLOYEES OF EACH,HARMLESS AGAINST ALL CLAIMS COSTS, DAMAGES, AND EXPENSES AND REASONABLE ATTORNEYS' FEESARISING OUT OF, DIRECTLY OR INDIRECTLY, ANY CLAIM OF PRODUCT LIABILITY, PERSONAL INJURY, ORDEATH ARISING IN ANY WAY OUT OF SUCH MISSION CRITICAL APPLICATION, WHETHER OR NOT INTEL ORITS SUBCONTRACTOR WAS NEGLIGENT IN THE DESIGN, MANUFACTURE, OR WARNING OF THE INTELPRODUCT OR ANY OF ITS PARTS.
Intel may make changes to specifications and product descriptions at any time, without notice. Designersmust not rely on the absence or characteristics of any features or instructions marked "reserved" or"undefined". Intel reserves these for future definition and shall have no responsibility whatsoever for conflictsor incompatibilities arising from future changes to them. The information here is subject to change withoutnotice. Do not finalize a design with this information
The products described in this document may contain design defects or errors known as errata which maycause the product to deviate from published specifications. Current characterized errata are available onrequest. Contact your local Intel sales office or your distributor to obtain the latest specifications and beforeplacing your product order. Copies of documents which have an order number and are referenced in thisdocument, or other Intel literature, may be obtained by calling 1-800-548-4725, or go to: http://www.intel.com/design/literature.htm
Intel processor numbers are not a measure of performance. Processor numbers differentiate features withineach processor family, not across different processor families. Go to: http://www.intel.com/products/processor_number/
BlueMoon, BunnyPeople, Celeron, Celeron Inside, Centrino, Centrino Inside, Cilk, Core Inside, E-GOLD,Flexpipe, i960, Intel, the Intel logo, Intel AppUp, Intel Atom, Intel Atom Inside, Intel Core, Intel Inside, IntelInsider, the Intel Inside logo, Intel NetBurst, Intel NetMerge, Intel NetStructure, Intel SingleDriver, IntelSpeedStep, Intel Sponsors of Tomorrow., the Intel Sponsors of Tomorrow. logo, Intel StrataFlash, Intel vPro,Intel XScale, InTru, the InTru logo, the InTru Inside logo, InTru soundmark, Itanium, Itanium Inside, MCS,MMX, Moblin, Pentium, Pentium Inside, Puma, skoool, the skoool logo, SMARTi, Sound Mark, Stay With It,The Creators Project, The Journey Inside, Thunderbolt, Ultrabook, vPro Inside, VTune, Xeon, Xeon Inside, X-GOLD, XMM, X-PMU and XPOSYS are trademarks of Intel Corporation in the U.S. and/or other countries.
*Other names and brands may be claimed as the property of others.
Microsoft, Windows, Visual Studio, Visual C++, and the Windows logo are trademarks, or registeredtrademarks of Microsoft Corporation in the United States and/or other countries.
Microsoft product screen shot(s) reprinted with permission from Microsoft Corporation.
Copyright (C) 2010-2012, Intel Corporation. All rights reserved.
5

Getting Started Tutorial: Identifying Hardware Issues
6

Overview
Discover how to use the General Exploration analysis of the Intel® VTune™ Amplifier XE to identify thehardware-related issues in your application such as data sharing, cache misses, branch misprediction, andothers.
About ThisTutorial
This tutorial uses the sample matrix application and guides you through basic stepsrequired to analyze the code for general hardware issues on the Intel® microarchitecturecode name Nehalem.
EstimatedDuration
10-15 minutes.
LearningObjectives
After you complete this tutorial, you should be able to:
• Choose an analysis target.• Run the General Exploration analysis for Intel microarchitecture code name Nehalem.• Understand the event-based performance metrics.• Identify the types of the most critical hardware issues for the application as a whole.• Identify the modules/functions that caused the most critical hardware issues.• Analyze the source code to locate the most critical code lines.• Identify the next steps of the performance analysis to get more detailed results.
MoreResources
• Intel® Parallel Studio XE tutorials (HTML, PDF): http://software.intel.com/en-us/articles/intel-software-product-tutorials/
• Intel® Parallel Studio XE support page: http://software.intel.com/en-us/articles/intel-parallel-studio-xe/
7

Getting Started Tutorial: Identifying Hardware Issues
8

Navigation Quick Start 1 Intel® VTune™ Amplifier XE, an Intel® Parallel Studio XE tool, provides information on code
performance for users developing serial and multithreaded applications on Windows* and Linux* operatingsystems. VTune Amplifier XE helps you analyze the algorithm choices and identify where and how yourapplication can benefit from available hardware resources.
VTune Amplifier XE AccessTo access the VTune Amplifier XE in the Visual Studio* IDE: From the Windows* Start menu, choose IntelParallel Studio XE 2011 > Parallel Studio XE 2011 with [VS2008 | VS2010].
To access the Standalone VTune Amplifier XE GUI, do one of the following:
• From the Windows* Start menu, choose Intel Parallel Studio XE 2011 > Intel VTune Amplifier XE2011.
• From the Windows* Start menu, choose Intel Parallel Studio XE 2011 > Command Prompt >Parallel Studio XE > IA-32 Visual Studio [2008 | 2010] mode to set your environment, then typeamplxe-gui.
VTune Amplifier XE/Visual Studio* IDE Integration
9

Use the VTune Amplifier XE toolbar to configure and control result collection.
VTune Amplifier XE results *.amplxe show up in the Solution Explorer under the MyAmplifier XE Results folder. To configure and control result collection, right-click the projectin the Solution Explorer and select the Intel VTune Amplifier XE 2011 menu from the pop-up menu. To manage previously collected results, right-click the result (for example,r002hs.amplxe) and select the required command from the pop-up menu.
Use the drop-down menu to select a viewpoint, a preset configuration of windows/panes for ananalysis result. For each analysis type, you can switch among several preset configurations tofocus on particular performance metrics.
Click the buttons on navigation toolbars to change window views and toggle window panes onand off.
In the Timeline pane, analyze the thread activity and transitions presented for the user-modesampling and tracing analysis results (for example, Hotspots, Concurrency, Locks and Waits) oranalyze the distribution of the application performance per metric over time for the event-based sampling analysis results (for example, Memory Access, Bandwidth Breakdown).
Use the Call Stack pane to view call paths for a function selected in the grid.
Use the filter toolbar to filter out the result data according to the selected categories.
Standalone VTune Amplifier XE GUI
1 Getting Started Tutorial: Identifying Hardware Issues
10

Use the VTune Amplifier XE menu to control result collection, define and view projectproperties, and set various options.
Use the VTune Amplifier XE toolbar to configure and control result collection.
Use the Project Navigator to manage your VTune Amplifier XE projects and collected analysisresults. Click the Project Navigator button on the toolbar to enable/disable the ProjectNavigator.
Use the VTune Amplifier XE result tabs to manage result data. You can view or change theresult file location from the Project Properties dialog box.
Use the drop-down menu to select a viewpoint, a preset configuration of windows/panes foran analysis result. For each analysis type, you can switch among several preset configurationsto focus on particular performance metrics. Click the yellow question mark icon to read theviewpoint description.
Switch between window tabs to explore the analysis type configuration options and collecteddata provided by the selected viewpoint.
Use the Grouping drop-down menu to choose a granularity level for grouping data in the grid.
Use the filter toolbar to filter out the result data according to the selected categories.
Navigation Quick Start 1
11

1 Getting Started Tutorial: Identifying Hardware Issues
12
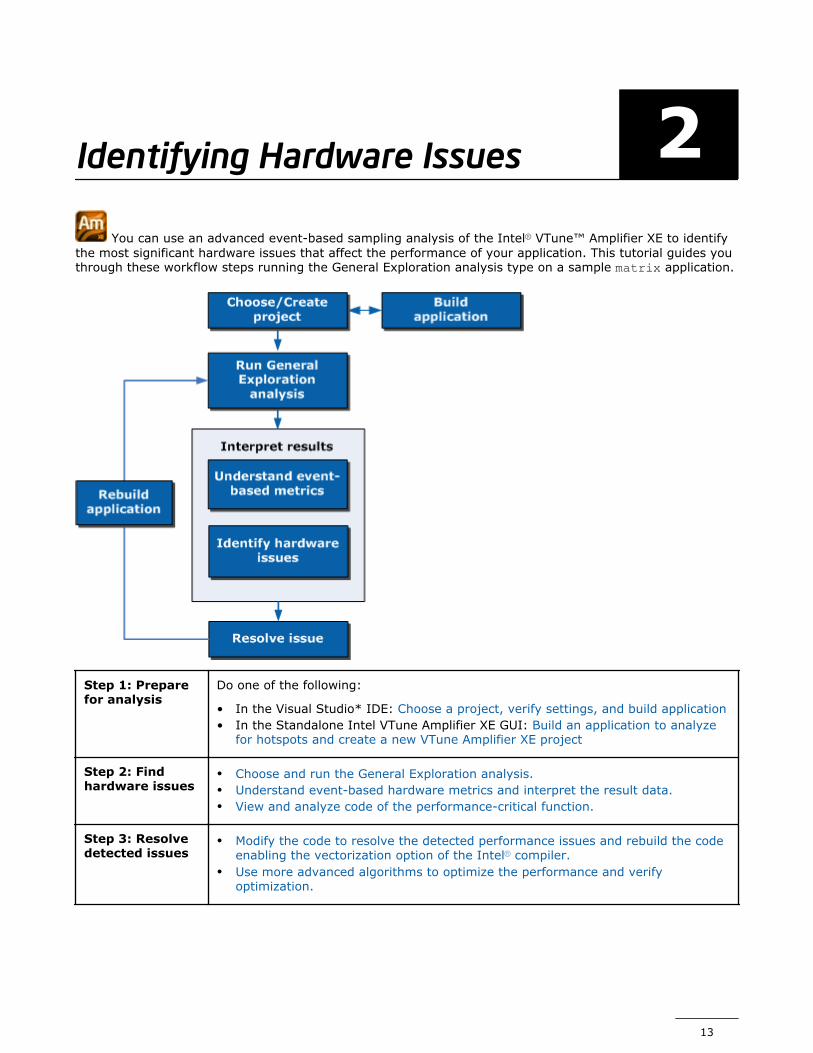
Identifying Hardware Issues 2 You can use an advanced event-based sampling analysis of the Intel® VTune™ Amplifier XE to identify
the most significant hardware issues that affect the performance of your application. This tutorial guides youthrough these workflow steps running the General Exploration analysis type on a sample matrix application.
Step 1: Preparefor analysis
Do one of the following:
• In the Visual Studio* IDE: Choose a project, verify settings, and build application• In the Standalone Intel VTune Amplifier XE GUI: Build an application to analyze
for hotspots and create a new VTune Amplifier XE project
Step 2: Findhardware issues
• Choose and run the General Exploration analysis.• Understand event-based hardware metrics and interpret the result data.• View and analyze code of the performance-critical function.
Step 3: Resolvedetected issues
• Modify the code to resolve the detected performance issues and rebuild the codeenabling the vectorization option of the Intel® compiler.
• Use more advanced algorithms to optimize the performance and verifyoptimization.
13

Optimization NoticeIntel's compilers may or may not optimize to the same degree for non-Intel microprocessors for optimizations that arenot unique to Intel microprocessors. These optimizations include SSE2, SSE3, and SSSE3 instruction sets and otheroptimizations. Intel does not guarantee the availability, functionality, or effectiveness of any optimization onmicroprocessors not manufactured by Intel. Microprocessor-dependent optimizations in this product are intended foruse with Intel microprocessors. Certain optimizations not specific to Intel microarchitecture are reserved for Intelmicroprocessors. Please refer to the applicable product User and Reference Guides for more information regarding thespecific instruction sets covered by this notice.
Notice revision #20110804
Visual Studio* IDE: Choose Project and Build Application
Before you start analyzing hardware issues affecting the performance of your application, do thefollowing:
1. Get software tools.2. Choose a project.3. Configure the Microsoft* symbol server.4. Verify optimal compiler/linker options.5. Build the target in the release mode.
• The steps below are provided for Microsoft Visual Studio* 2010. Steps for other versions of VisualStudio IDE or for the standalone version of the Intel® VTune™ Amplifier XE 2011 may slightly differ.
• Steps provided by this tutorial are generic and applicable to any application. You may choose tofollow the proposed workflow using your own application.
Get Software ToolsYou need the following tools to try tutorial steps yourself using the matrix sample application:
• VTune Amplifier XE, including sample applications• .zip file extraction utility• Supported compiler (see Release Notes for more information)
Acquire Intel VTune Amplifier XE
If you do not already have access to the VTune Amplifier XE, you can download an evaluation copy from http://software.intel.com/en-us/articles/intel-software-evaluation-center/.
Install and Set Up VTune Amplifier XE Sample Applications
1. Copy the matrix.zip file from the <install-dir>\samples\<locale>\C++\ directory to a writabledirectory or share on your system. The default installation path is C:\Program Files\Intel\VTuneAmplifier XE 2011\ (on certain systems, instead of Program Files, the directory name is ProgramFiles (x86)).
2. Extract the sample from the .zip file.
• Samples are non-deterministic. Your screens may vary from the screen captures shown throughoutthis tutorial.
• Samples are designed only to illustrate the VTune Amplifier XE features; they do not represent bestpractices for creating code.
Choose a ProjectChoose a project with the analysis target in the Visual Studio IDE as follows:
1. From the Visual Studio menu, select File > Open > Project/Solution....
2 Getting Started Tutorial: Identifying Hardware Issues
14

The Open Project dialog box opens.2. In the Open Project dialog box, browse to the location where you extracted the
matrix_vtune_amp_xe.zip file and select the matrix.sln file.
The solution is added to Visual Studio and shows up in the Solution Explorer. VTune Amplifier XEautomatically inherits Visual Studio settings and uses the currently opened project as a target projectfor performance analysis.
When you choose a project in Visual Studio IDE, the VTune Amplifier XE automatically creates theconfig.amplxeproj project file and sets the matrix application as an analysis target in the projectproperties.
Configure the Microsoft* Symbol ServerConfigure the Visual Studio environment to download the debug information for system libraries so that theVTune Amplifier XE can properly identify system functions and classify/attribute functions.
1. Go to Tools > Options....
The Options dialog box opens.2. From the left pane, select Debugging > Symbols.3.
In the Symbol file (.pdb) locations field, click the button and specify the following address:http://msdl.microsoft.com/download/symbols.
4. Make sure the added address is checked.5. In the Cache symbols in this directory field, specify a directory where the downloaded symbol files
will be stored.
Identifying Hardware Issues 2
15

6. Click Ok.
Verify Optimal Compiler/Linker OptionsConfigure Visual Studio project properties to generate the debug information for your application so that theVTune Amplifier XE can open the source code.
1. Select the matrix project and go to Project > Properties.2. From the matrix Property Pages dialog box, select Configuration Properties > General and make
sure the selected Configuration (top of the dialog) is Active(Release).3. From the matrix Property Pages dialog box, select C/C++ > General pane and specify the Debug
Information Format as Program Database (/Zi).
4. From the matrix Property Pages dialog box, select Linker > Debugging and set the GenerateDebug Info option to Yes (/DEBUG).
2 Getting Started Tutorial: Identifying Hardware Issues
16

5. Click OK.
Build the Target in the Release ModeBuild the target in the Release mode with full optimizations, which is recommended for performance analysis.
1. Go to the Build > Configuration Manager... dialog box and select the Release mode for your targetproject.
2. From the Visual Studio menu, select Build > Build matrix.
The matrix.exe application is built.
Key TermsTarget
Next StepRun General Exploration Analysis
Standalone GUI: Build Application and Create New Project
Before you start analyzing hardware issues affecting the performance of your application, do thefollowing:
1. Get software tools.2. Build application.
If you build the code in Visual Studio*, make sure to:
• Configure the Microsoft* symbol server.• Verify optimal compiler/linker options.• Build the target in the release mode.
3. Create a VTune Amplifier XE project.
Get Software ToolsYou need the following tools to try tutorial steps yourself using the matrix sample application:
Identifying Hardware Issues 2
17

• VTune Amplifier XE, including sample applications• .zip file extraction utility• Supported compiler (see Release Notes for more information)• Text editor
Acquire Intel VTune Amplifier XE
If you do not already have access to the VTune Amplifier XE, you can download an evaluation copy from http://software.intel.com/en-us/articles/intel-software-evaluation-center/.
Install and Set Up VTune Amplifier XE Sample Applications
1. Copy the matrix.zip file from the <install-dir>\samples\<locale>\C++\ directory to a writabledirectory or share on your system. The default installation path is C:\Program Files\Intel\VTuneAmplifier XE 2011\ (on certain systems, instead of Program Files, the directory name is ProgramFiles (x86)).
2. Extract the sample from the .zip file.
• Samples are non-deterministic. Your screens may vary from the screen captures shown throughoutthis tutorial.
• Samples are designed only to illustrate the VTune Amplifier XE features; they do not represent bestpractices for creating code.
Configure the Microsoft* Symbol ServerConfigure the Visual Studio environment to download the debug information for system libraries so that theVTune Amplifier XE can properly identify system functions and classify/attribute functions.
NOTE The steps below are provided for Microsoft Visual Studio* 2010. Steps for other versions ofVisual Studio IDE may differ slightly.
1. Go to Tools > Options....
The Options dialog box opens.2. From the left pane, select Debugging > Symbols.3.
In the Symbol file (.pdb) locations field, click the button and specify the following address:http://msdl.microsoft.com/download/symbols.
4. Make sure the added address is checked.5. In the Cache symbols in this directory field, specify a directory where the downloaded symbol files
will be stored.
2 Getting Started Tutorial: Identifying Hardware Issues
18

6. Click Ok.
Verify Optimal Compiler/Linker OptionsConfigure Visual Studio project properties to generate the debug information for your application so that theVTune Amplifier XE can open the source code.
1. Select the matrix project and go to Project > Properties.2. From the matrix Property Pages dialog box, select Configuration Properties > General and make
sure the selected Configuration (top of the dialog) is Release.3. From the matrix Property Pages dialog box, select C/C++ > General pane and specify the Debug
Information Format as Program Database (/Zi).
4. From the matrix Property Pages dialog box, select Linker > Debugging and set the GenerateDebug Info option to Yes (/DEBUG).
Identifying Hardware Issues 2
19

Build the Target in the Release ModeBuild the target in the Release mode with full optimizations, which is recommended for the performanceanalysis.
1. Go to the Build > Configuration Manager... dialog box and select the Release mode for your targetproject.
2. From the Visual Studio menu, select Build > Build matrix.
The matrix.exe application is built.
Create a VTune Amplifier XE Project
1. From the Start menu select Intel Parallel Studio XE 2011 > Intel VTune Amplifier XE 2011 tolaunch the VTune Amplifier XE GUI client.
2. Create a new project via File > New > Project....
The Create a Project dialog box opens.3. Specify the project name matrix that will be used as the project directory name and click the Create
Project button.
By default, the VTune Amplifier XE creates a project directory under the %USERPROFILE%\MyDocuments\My Amplifier XE Projects directory and opens the Project Properties: Target dialogbox.
4. In the Target: Application to Launch pane, browse to the matrix.exe application and click OK.
Key TermsTarget
Next StepRun General Exploration Analysis
Run General Exploration Analysis
2 Getting Started Tutorial: Identifying Hardware Issues
20

After building the target, you can run it with the Intel® VTune™ Amplifier XE to analyze itsperformance. In this tutorial, you run the General Exploration analysis on the Intel® Core™ i7 processorbased on the Intel® microarchitecture code name Nehalem. The General Exploration analysis type helpsidentify the widest scope of hardware issues that affect the application performance. This analysis type isbased on the hardware event-based sampling collection.
To run the analysis:
1.From the VTune Amplifier XE toolbar, click the New Analysis button.
The New Amplifier XE Result tab opens with the Analysis Type configuration window active.2. From the analysis tree on the left, select the Advanced Intel(R) Microarchitecture Code Name
Nehalem Analysis > General Exploration analysis type.3. Click the Start button on the right to run the analysis.
The VTune Amplifier XE launches the matrix application that calculates matrix transformations and exits.The VTune Amplifier XE finalizes the collected data and opens the results in the Hardware Issues viewpoint.
NOTE To make sure the performance of the application is repeatable, go through the entire tuningprocess on the same system with a minimal amount of other software executing.
Key Terms
• Finalization• Viewpoint
Next StepInterpret Results
Interpret Results
Identifying Hardware Issues 2
21

When the application exits, the Intel® VTune™ Amplifier XE finalizes the results and opens theHardware Issues viewpoint that consists of the Summary window, Bottom-up window, and Timeline pane. Tointerpret the collected data and understand where you should focus your tuning efforts for the specifichardware, do the following:
1. Understand the event-based metrics2. Identify the hardware issues that affect the performance of your application
NOTE The screenshots and execution time data provided in this tutorial are created on a system withfour CPU cores. Your data may vary depending on the number and type of CPU cores on your system.
Understand the Event-based MetricsClick the Summary tab to explore the data provided in the Summary window for the whole applicationperformance.
Elapsed time is the wall time from the beginning to the end of the collection. Treat this metric asyour basic performance baseline against which you will compare subsequent runs of theapplication. The goal of your optimization is to reduce the value of this metric.
Event-based performance metrics. Each metric is an event ratio provided by Intel architects.
Mouse over the yellow icon to see the metric description and formula used for the metriccalculation.
2 Getting Started Tutorial: Identifying Hardware Issues
22

Values calculated for each metric based on the event count. VTune Amplifier XE highlights thosevalues that exceed the threshold set for the corresponding metric. Such a value highlighted inpink signifies an application-level hardware issue.
The text below a metric with the detected hardware issue describes the issue, potential cause andrecommendations on the next steps, and displays a threshold formula used for calculation. Mouseover the truncated text to read a full description.
Quick look at the summary results discovers that the matrix application has the following issues:
• CPI (Clockticks per Instructions Retired) Rate• Retire Stalls• LLC Miss• LLC Load Misses Serviced by Remote DRAM• Execution Stalls• Data Sharing
Identify the Hardware IssuesClick the Bottom-up tab to open the Bottom-up window and see how each program unit performs againstthe event-based metrics. Each row represents a program unit and percentage of the CPU cycles used by thisunit. Program units that take more than 5% of the CPU time are considered hotspots. This means that byresolving a hardware issue that, for example, took about 20% of the CPU cycles, you can obtain 20%optimization for the hotspot.
By default, the VTune Amplifier XE sorts data in the descending order by Clockticks and provides thehotspots at the top of the list.
You see that the multiply1 function is the most obvious hotspot in the matrix application. It has thehighest event count (Clockticks and Instructions Retired events) and most of the hardware issues were alsodetected during execution of this function.
Identifying Hardware Issues 2
23
NOTE Mouse over a column header with an event-based metric name to see the metric description.Mouse over a highlighted cell to read the description of the hardware issue detected for the programunit.
For the multiply1 function, the VTune Amplifier XE highlights the same issues (except for the Data Sharingissue) that were detected as the issues affecting the performance of the whole application:
• CPI Rate is high (>1). Potential causes are memory stalls, instruction starvation, branch misprediction,or long-latency instruction. To define the cause for your code, explore other metrics in the Bottom-upwindow.
• The Retire Stalls metric shows that during the execution of the multiply1 function, about 90% (0.902)of CPU cycles were waiting for data to arrive. This may result from branch misprediction, instructionstarvation, long latency operations, and other issues. Once you have located the stalled instructions inyour code, analyze metrics such as LLC Miss, Execution Stalls, Remote Accesses, Data Sharing, andContested Accesses. You can also look for long-latency instructions like divisions and string operations tounderstand the cause.
• LLC misses metric shows that about 60% (0.592) of CPU cycles were spent waiting for LLC load missesto be serviced. Possible optimizations are to reduce data working set size, improve data access locality,blocking and consuming data in chunks that fit in the LLC, or better exploit hardware prefetchers.Consider using software prefetchers but beware that they can increase latency by interfering with normalloads and can increase pressure on the memory system.
• LLC Load Misses Serviced by Remote DRAM metric shows that 34% (0.340) of cycles were spentservicing memory requests from remote DRAM. Wherever possible, try to consistently use data on thesame core or at least the same package, as it was allocated on.
• Execution Stalls metric shows that 54% (0.543) of cycles were spent with no micro-operationsexecuted. Look for long-latency operations at code regions with high execution stalls and try to usealternative methods or lower latency operations. For example, consider replacing div operations withright-shifts or try to reduce the latency of memory accesses.
Key Terms
• Baseline• Elapsed time• Event-based metrics• Viewpoint
Next StepAnalyze Code
Analyze Code
You identified a hotspot function with a number of hardware issues. Double-click the multiply1function in the Bottom-up window to open the source code:
2 Getting Started Tutorial: Identifying Hardware Issues
24

The table below explains some of the features available in the Source pane when viewing the event-basedsampling analysis data.
Source pane displaying the source code of the application, which is available if the function symbolinformation is available. The code line that took the highest number of Clockticks samples ishighlighted. The source code in the Source pane is not editable.
Values per hardware event attributed to a particular code line. By default, the data is sorted by theClockticks event count. Focus on the events that constitute the metrics identified as performance-critical in the Bottom-up window. To identify these events, mouse over the metric column headerin the Bottom-up window. Drag-and-drop the columns to organize the view for your convinience.VTune Amplifier XE remembers yours settings and restores them each time you open theviewpoint.
Hotspot navigation buttons to switch between code lines that took a long time to execute.
Source file editor button to open and edit your code in the default editor.
Assembly button to toggle in the Assembly pane that displays assembly instructions for theselected function.
In the Source pane for the multiply1 function, you see that line 39 took the most of the Clockticks eventsamples during execution. This code section multiplies matrices in the loop but ineffectively accesses thememory. Focus on this section and try to reduce the memory issues.
Key TermsEvent skid
Next StepResolve Issue
Resolve Issue
Identifying Hardware Issues 2
25

In the Source pane, you identified that in the multiply1 function the code line 39 resulted in thehighest values for the Clockticks event. To solve this issue, do the following:
1. Change the multiplication algorithm and, if using the Intel® compiler, enable vectorization.2. Re-run the analysis to verify optimization.
Change Algorithm
NOTE The proposed solution is one of the multiple ways to optimize the memory access and is usedfor demonstration purposes only.
1. Open the matrix.c file from the Source Files of the matrix project.
For this sample, the matrix.c file is used to initialize the functions used in the multiply.c file.2. In line 90, replace the multiply1 function name with the multiply2 function.
This new function uses the loop interchange mechanism that optimizes the memory access in the code.
The proposed optimization assumes you may use the Intel® C++ Compiler to build the code. Intelcompiler helps vectorize the data, which means that it uses SIMD instructions that can work withseveral data elements simultaneously. If only one source file is used, the Intel compiler enablesvectorization automatically. The current sample uses several source files, that is why the multiply2function uses #pragma ivdep to instruct the compiler to ignore assumed vector dependencies. Thisinformation lets the compiler enable the Supplemental Streaming SIMD Extensions (SSSE).
3. Save files and rebuild the project using the compiler of your choice.
If you have the Intel® Composer XE installed, you may use it to build the project with the Intel® C++Compiler XE. To do this, select Intel Composer XE > Use Intel C++... from the Visual StudioProject menu and then Build > Rebuild matrix.
2 Getting Started Tutorial: Identifying Hardware Issues
26

Verify Optimization
1.From the VTune Amplifier XE toolbar, click the New Analysis button and select Quick Intel(R)Microarchitecture Code Name Nehalem - General Exploration Analysis.
VTune Amplifier XE reruns the General Exploration analysis for the updated matrix target and createsa new result, r001ge, that opens automatically.
2. In the r001ge result, click the Summary tab to see the Elapsed time value for the optimized code:
You see that the Elapsed time has reduced from 56.740 seconds to 9.122 seconds and the VTuneAmplifier XE now identifies only two types of issues for the application performance: high CPI RateandRetire Stalls.
Key Terms
• Elapsed time• Event-based metrics
Next StepResolve Next Issue
Optimization NoticeIntel's compilers may or may not optimize to the same degree for non-Intel microprocessors for optimizations that arenot unique to Intel microprocessors. These optimizations include SSE2, SSE3, and SSSE3 instruction sets and otheroptimizations. Intel does not guarantee the availability, functionality, or effectiveness of any optimization onmicroprocessors not manufactured by Intel. Microprocessor-dependent optimizations in this product are intended foruse with Intel microprocessors. Certain optimizations not specific to Intel microarchitecture are reserved for Intelmicroprocessors. Please refer to the applicable product User and Reference Guides for more information regarding thespecific instruction sets covered by this notice.
Identifying Hardware Issues 2
27

Optimization Notice
Notice revision #20110804
Resolve Next Issue
You got a significant performance boost by optimizing the memory access for the multiply1 function.According to the data provided in the Summary window for your updated result, r001ge, you still have highCPI rate and Retire Stalls issues. You can try to optimize your code further following the steps below:
1. Analyze results after optimization2. Use more advanced algorithms3. Verify optimization
Analyze Results after OptimizationTo get more details on the issues that still affect the performance of the matrix application, switch to theBottom-up window:
You see that the multiply2 function (in fact, updated multiply1 function) is still a hotspot. Double-clickthis function to view the source code and click both the Source and Assembly buttons on the toolbar toenable the Source and Assembly panes.
2 Getting Started Tutorial: Identifying Hardware Issues
28

In the Source pane, the VTune Amplifier XE highlights line 53 that took the highest number of Clocktickssamples. This is again the section where matrices are multiplied. The Assembly pane is automaticallysynchronized with the Source pane. It highlights the basic blocks corresponding to the code line highlightedin the Source pane. If you compiled the application with the Intel® Compiler, you can see that highlightedblock 156 includes vectorization instructions added after your previous optimization. All vectorizationinstructions have the p (packed) postfix (for example, mulpd). You may use the /Qvec-report3 option ofthe Intel compiler to generate the compiler optimization report and see which cycles were not vectorized andwhy. For more details, see the Intel compiler documentation.
Use More Advanced Algorithms
1. Open the matrix.c file from the Source Files of the matrix project.2. In line 90, replace the multiply2 function name with the multiply3 function.
This function enables uploading the matrix data by blocks.
Identifying Hardware Issues 2
29

3. Save the files and rebuild the project.
Verify Optimization
1.From the VTune Amplifier XE toolbar, click the New Analysis button and select Quick Intel(R)Microarchitecture Code Name Nehalem - General Exploration Analysis.
VTune Amplifier XE reruns the General Exploration analysis for the updated matrix target and createsa new result, r002ge, that opens automatically.
2. In the r002ge result, click the Summary tab to see the Elapsed time value for the optimized code:
2 Getting Started Tutorial: Identifying Hardware Issues
30

You see that the Elapsed time has reduced a little: from 9.122 seconds to 8.896 seconds but thehardware issues identified in the previous run, CPI Rateand Retire Stalls, stayed practically the same.This means that there is more room for improvement and you can try other, more effective,mechanisms of matrix multiplication.
Key Terms
• Elapsed time• Event-based metrics
Identifying Hardware Issues 2
31

2 Getting Started Tutorial: Identifying Hardware Issues
32

Summary 3 You have completed the Identifying Hotspot Issues tutorial. Here are some important things to
remember when using the Intel® VTune™ Amplifier XE to analyze your code for hardware issues:Step Tutorial Recap Key Tutorial Take-aways
1. Prepare for analysis. If you used the Visual Studio*IDE: You selected the matrixproject as an analysis target , setup your environment to enablegenerating symbol informationfor system libraries and yourbinary files, and built the targetin the Release mode.
If you used the standalone GUI:You set up your environment toenable generating symbolinformation for system librariesand your binary files, built thetarget in the Release mode, andcreated the VTune Amplifier XEproject for your analysis target.
• Configure the Microsoft*symbol server and yourproject properties to get themost accurate results forsystem and user binaries andto analyze the performance ofyour application at the codeline level.
• Use the Project Properties:Target tab to choose andconfigure your analysis target.For Visual Studio* projects,the analysis target settingsare inherited automatically.
2. Find hardware issues You ran the General Explorationanalysis that monitors how yourapplication performs against a setof event-based hardware metricsas follows:
• Analyzed the data provided inthe Hardware Issuesviewpoint, explored the event-based metrics, identified theareas where your sampleapplication had hardwareissues, and found the exactfunction with poorperformance per metrics thatcould be a good candidate forfurther analysis.
• Analyzed the code for thehotspot function identified inthe Bottom-up window andlocated the hotspot line thatgenerated a high number ofCPU Clockticks.
• Use the Analysis Typeconfiguration window tochoose, configure, and run theanalysis. You may choosebetween a predefined analysistype like the GeneralExploration type used in thistutorial, or create a newcustom analysis type and addevents of your choice. Formore details on the customcollection, see the Creating aNew Analysis Type topic in theproduct online help.
• See the Details section of theGeneral Explorationconfiguration pane to get thelist of processor events usedfor this analysis type.
3. Resolve detected issues You solved the memory accessissue for the sample applicationby interchanging the loops andsped up the execution time. You
• Start analyzing theperformance of yourapplication from the Summarywindow to explore the event-based performance metrics forthe whole application. Mouse
33

Step Tutorial Recap Key Tutorial Take-aways
also considered using the Intelcompiler to enable instructionvectorization.
You tried optimizing themechanism of matrixmultiplication and obtained 0.2seconds of optimization in theapplication execution time.
over the yellow help icons toread the metric descriptions.Use the Elapsed time value asyour performance baseline.
• Move to the Bottom-upwindow and analyze theperformance per function.Focus on the hotspots -functions that took the highestClockticks event count. Bydefault, they are located atthe top of the table. Analyzethe hardware issues detectedfor the hotspot functions.Hardware issues arehighlighted in pink. Mouseover a highlighted value toread the issues descriptionand see the thresholdformula.
• Double-click the hotspotfunction in the Bottom-uppane to open its source codeat the code line that took thehighest Clockticks eventcount.
• Consider using Intel®Compiler, part of the Intel®Composer XE, to vectorizeinstructions. Explore thecompiler documentation formore details.
Next step: Prepare your own application(s) for analysis. Then use the VTune Amplifier XE to findhardware issues and fix them.
Optimization NoticeIntel's compilers may or may not optimize to the same degree for non-Intel microprocessors for optimizations that arenot unique to Intel microprocessors. These optimizations include SSE2, SSE3, and SSSE3 instruction sets and otheroptimizations. Intel does not guarantee the availability, functionality, or effectiveness of any optimization onmicroprocessors not manufactured by Intel. Microprocessor-dependent optimizations in this product are intended foruse with Intel microprocessors. Certain optimizations not specific to Intel microarchitecture are reserved for Intelmicroprocessors. Please refer to the applicable product User and Reference Guides for more information regarding thespecific instruction sets covered by this notice.
Notice revision #20110804
3 Getting Started Tutorial: Identifying Hardware Issues
34

Key Terms 4baseline: A performance metric used as a basis for comparison of the application versions before and afteroptimization. Baseline should be measurable and reproducible.
Elapsed time:The total time your target ran, calculated as follows: Wall clock time at end of application– Wall clock time at start of application.
event-based metrics: Event ratios with their own threshold values. VTune Amplifier XE collects event data,calculates the ratios, and provides the results in the corresponding columns of the Bottom/up/Top-down Treewindows and in the Summary window. As soon as the performance of a program unit per metric exceeds thethreshold, the VTune Amplifier XE marks this value as a performance issue (in pink) and providesrecommendations how to fix it. For the full list of metrics used by the VTune Amplifier XE, see the HardwareEvent-based Metrics topic in the online help.
event skid: An event detected not exactly on the code line that caused the event. Event skids may evenresult in a caller function event being recorded in the callee function. See the online help for more details.
finalization: A process during which the Intel® VTune™ Amplifier XE converts the collected data to adatabase, resolves symbol information, and pre-computes data to make further analysis more efficient andresponsive.
hotspot: A section of code that took a long time to execute. Some hotspots may indicate bottlenecks andcan be removed, while other hotspots inevitably take a long time to execute due to their nature.
target: A target is an executable file you analyze using the Intel® VTune™ Amplifier XE.
viewpoint: A preset result tab configuration that filters out the data collected during a performance analysisand enables you to focus on specific performance problems. When you select a viewpoint, you select a set ofperformance metrics the VTune Amplifier XE shows in the windows/panes of the result tab. To select the
required viewpoint, click the button and use the drop-down menu at the top of the result tab.
35

4 Getting Started Tutorial: Identifying Hardware Issues
36