getting serious about analytics: better insights, better outcomes
TRANSCRIPT
Alternate Letter Brochure Title
Alternate Letter Brochure Title
Alternate Letter Brochure Title
Preferred Letter Brochure Title
1
4
3
6
2
Type should not be set to the left of the arrow.
Box indicates tagline and lockup signature clear space.Getting Serious About Analytics: Better Insights, Better Outcomes Plenty of companies have analytical capabilities in a few pockets of their organization. Here’s a quant manifesto for the more ambitious: Develop analytical muscle in multiple parts of the enterprise to solve the issues that matter most for high performance.
By Dave Rich, Brian McCarthy and Jeanne Harris

2 | Getting Serious About Analytics: Better Insights, Better Outcomes
Data, data everywhere, but to what purpose?
Recognizing the obstacles old and new
An initial diagnostic
Cross-functional analytics: A retailer woos back lapsed customers
Becoming thoroughly analytical
Behind the magic of analytics
Questions for managers
3
6
8
9
10
16
17
Table of contents
3
Data, data everywhere, but to what purpose?
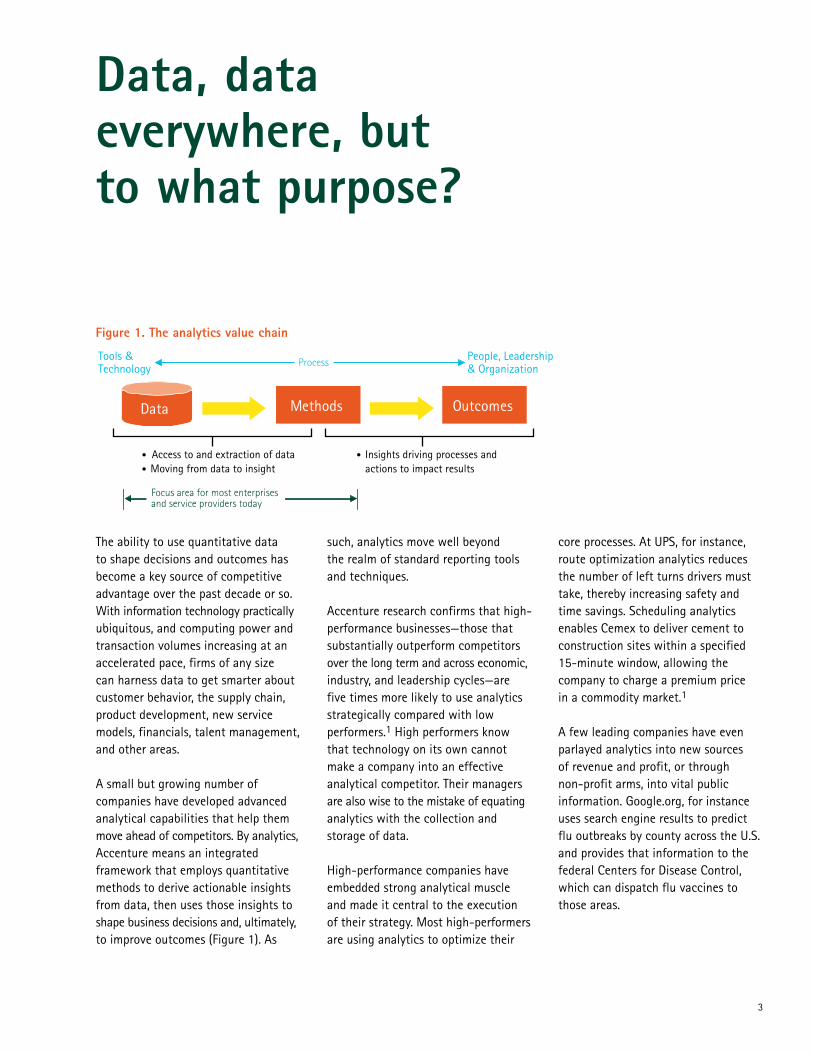
Figure 1. The analytics value chain
The ability to use quantitative data to shape decisions and outcomes has become a key source of competitive advantage over the past decade or so. With information technology practically ubiquitous, and computing power and transaction volumes increasing at an accelerated pace, firms of any size can harness data to get smarter about customer behavior, the supply chain, product development, new service models, financials, talent management, and other areas.
A small but growing number of companies have developed advanced analytical capabilities that help them move ahead of competitors. By analytics, Accenture means an integrated framework that employs quantitative methods to derive actionable insights from data, then uses those insights to shape business decisions and, ultimately, to improve outcomes (Figure 1). As
such, analytics move well beyond the realm of standard reporting tools and techniques.
Accenture research confirms that high- performance businesses—those that substantially outperform competitors over the long term and across economic, industry, and leadership cycles—are five times more likely to use analytics strategically compared with low performers.1 High performers know that technology on its own cannot make a company into an effective analytical competitor. Their managers are also wise to the mistake of equating analytics with the collection and storage of data.
High-performance companies have embedded strong analytical muscle and made it central to the execution of their strategy. Most high-performers are using analytics to optimize their
Data Methods Outcomes
Tools &Technology
People, Leadership & Organization
• Insights driving processes and actions to impact results
• Access to and extraction of data• Moving from data to insight
Focus area for most enterprisesand service providers today
Process
core processes. At UPS, for instance, route optimization analytics reduces the number of left turns drivers must take, thereby increasing safety and time savings. Scheduling analytics enables Cemex to deliver cement to construction sites within a specified 15-minute window, allowing the company to charge a premium price in a commodity market.1
A few leading companies have even parlayed analytics into new sources of revenue and profit, or through non-profit arms, into vital public information. Google.org, for instance uses search engine results to predict flu outbreaks by county across the U.S. and provides that information to the federal Centers for Disease Control, which can dispatch flu vaccines to those areas.
By contrast, for most companies, data remains an underused and under-appreciated asset. Recent Accenture research, based on a survey of more than 600 C-level and other senior executives of large companies in the U.S. and U.K., describes the extent and contours of the problem.
Over the past few years, many companies have been investing in reporting and business intelligence technology solutions to improve decision-making. However, Accenture research indicates that eight out of ten of those companies are not achieving desired goals, largely because they have not developed an analytical capability to manage the vast quantity of information available and to support smarter, more transparent decision-making.
Worse still, only one in 12 of the respondents had achieved their anticipated return on investments for these technology solutions. Currently, many companies are focusing on basic analysis using standard reporting tools and techniques that include backward-looking or static information: 41 percent of the U.S.-based companies and 23 percent of U.K.-based companies are focusing their resources on basic analytics. Fully two-thirds of U.S. companies surveyed acknowledge that they need to improve their analytical capabilities, especially in the area of hiring people with the right analytical skills.
4 | Getting Serious About Analytics: Better Insights, Better Outcomes
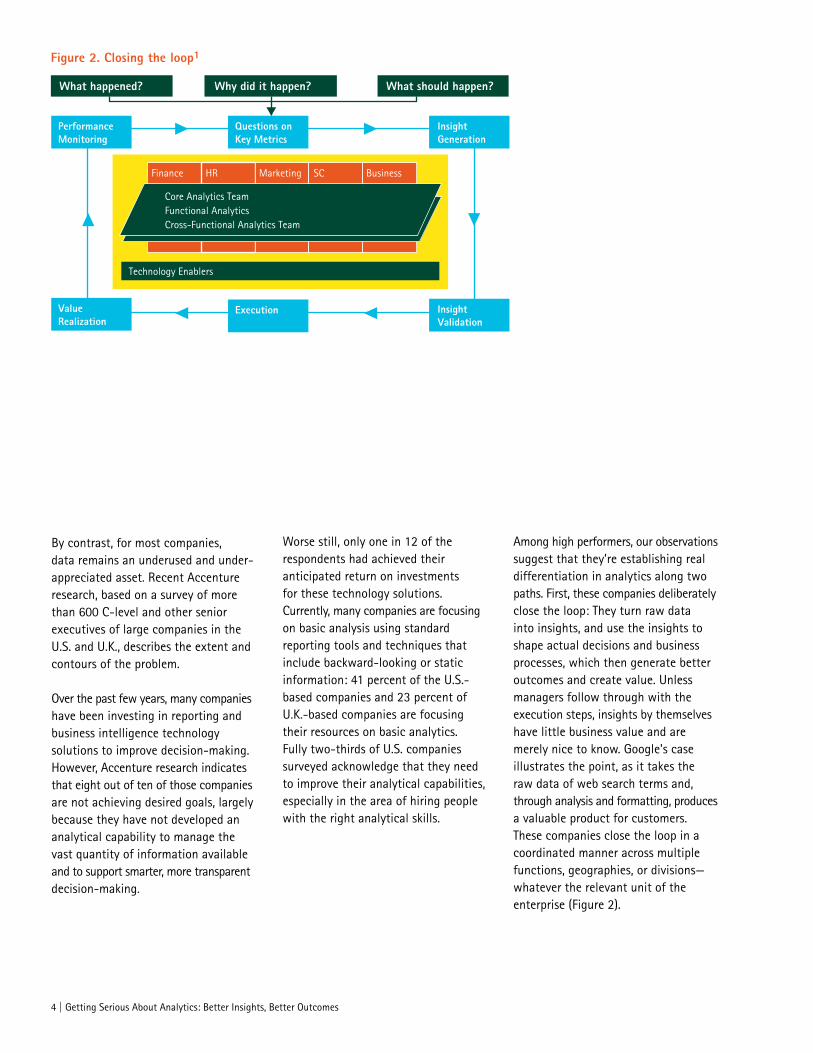
Among high performers, our observations suggest that they’re establishing real differentiation in analytics along two paths. First, these companies deliberately close the loop: They turn raw data into insights, and use the insights to shape actual decisions and business processes, which then generate better outcomes and create value. Unless managers follow through with the execution steps, insights by themselves have little business value and are merely nice to know. Google’s case illustrates the point, as it takes the raw data of web search terms and, through analysis and formatting, produces a valuable product for customers. These companies close the loop in a coordinated manner across multiple functions, geographies, or divisions—whatever the relevant unit of the enterprise (Figure 2).
Figure 2. Closing the loop1
Technology Enablers
Finance HR Marketing SC Business
Performance Monitoring
Questions on Key Metrics
Value Realization
Insight Validation
InsightGeneration
Core Analytics TeamFunctional AnalyticsCross-Functional Analytics Team
What happened? Why did it happen? What should happen?
Execution

5
Figure 3. Moving up the analytical curve1
Competitive Advantage
Sophistication of Intelligence
Optimization
Predictive Modeling
Forecasting/extrapolation
Statistical Analysis
Alerts
Query/drill down
Ad hoc Reports
Standard Reports
What is the best that can happen?
What will happen next?
What if these trends continue?
Why is this happening?
What actions are needed?
What exactly is the problem?
How many, how often, where?
What happened?
PredictiveAnalytics
DescriptiveAnalytics
As managers become more fluent and comfortable with analytics, this discipline can address progressively more sophisticated questions in the realm of forecasting and optimization, such as those shown in Figure 3. The second path to differentiation among high performers, then, is to move up the analytical curve, so that they can use predictive analyses to gain insights into what a company should do in response to changing scenarios. This involves not just technical tools but also an organizational focus on the areas that will spur competitive advantage—as UPS and Cemex have chosen to do with their logistics optimization.
6 | Getting Serious About Analytics: Better Insights, Better Outcomes
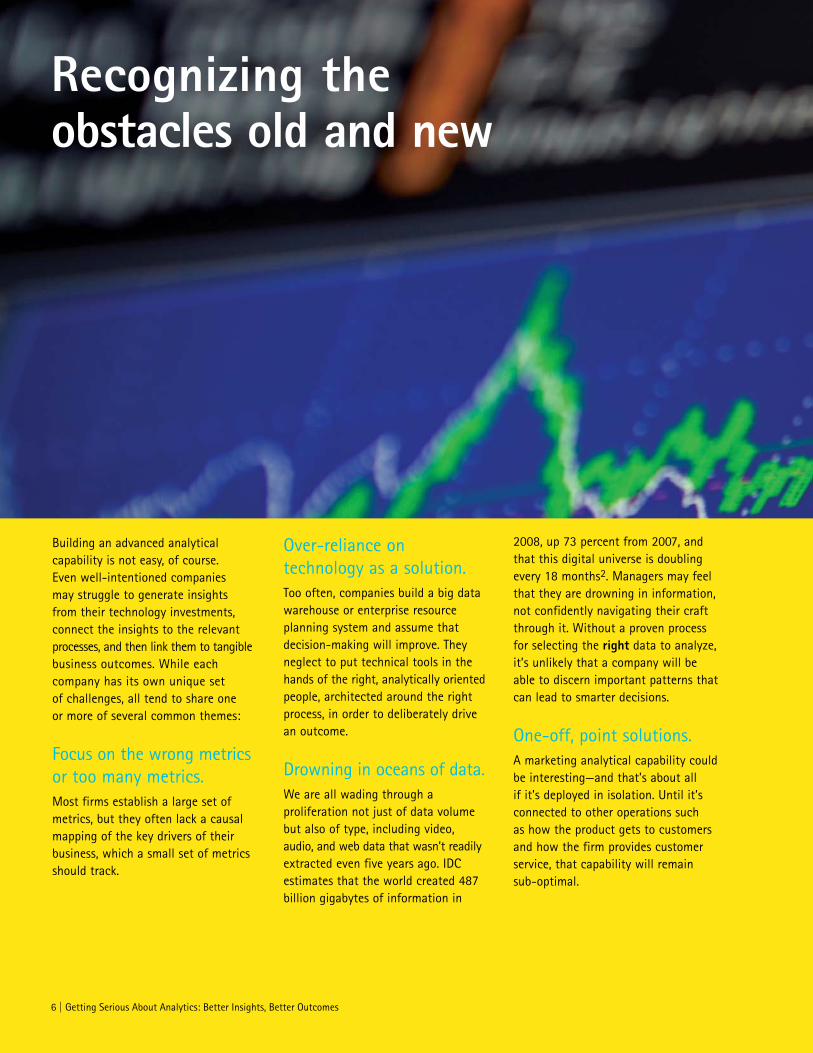
Recognizing the obstacles old and new
Building an advanced analytical capability is not easy, of course. Even well-intentioned companies may struggle to generate insights from their technology investments, connect the insights to the relevant processes, and then link them to tangible business outcomes. While each company has its own unique set of challenges, all tend to share one or more of several common themes:
Focus on the wrong metrics or too many metrics. Most firms establish a large set of metrics, but they often lack a causal mapping of the key drivers of their business, which a small set of metrics should track.
Over-reliance on technology as a solution. Too often, companies build a big data warehouse or enterprise resource planning system and assume that decision-making will improve. They neglect to put technical tools in the hands of the right, analytically oriented people, architected around the right process, in order to deliberately drive an outcome.
Drowning in oceans of data. We are all wading through a proliferation not just of data volume but also of type, including video, audio, and web data that wasn’t readily extracted even five years ago. IDC estimates that the world created 487 billion gigabytes of information in
2008, up 73 percent from 2007, and that this digital universe is doubling every 18 months2. Managers may feel that they are drowning in information, not confidently navigating their craft through it. Without a proven process for selecting the right data to analyze, it’s unlikely that a company will be able to discern important patterns that can lead to smarter decisions.
One-off, point solutions. A marketing analytical capability could be interesting—and that’s about all if it’s deployed in isolation. Until it’s connected to other operations such as how the product gets to customers and how the firm provides customer service, that capability will remain sub-optimal.
7
Cultural resistance. Many managers, while reluctant to say so, rely primarily on intuition and experience rather than fact-based analysis. A recent Accenture survey found that 40 percent of business decisions are still made based on judgment alone, partly because of the absence of good data.3 This is particularly true of managers who came of age 30 or 40 years ago, because their college and on-the-job training typically lacked quantitative rigor, and computing was not a part of their daily lives. While experience and intuition are valuable assets, they remain limited until combined with relevant data.
None of these are completely new challenges. But they have become more corrosive in today’s multi-polar world, one characterized by multiple centers of economic power and activity. Faster communications have allowed business functions to be dispersed geographically and have also brought a vast array of service activities, many located in emerging markets, within the scope of international trade. Competitors are proliferating in countries that once could offer only low labor costs and now are moving up the value chain with their offerings. New customer segments are proliferating as well, as customers in emerging regions become wealthier and more demanding on their own terms.
Complexity is one challenge in a multi-polar world; velocity is the other, where missing the shift of value to a new customer segment means mounting an expensive come-from-behind response. Accenture research shows that one attribute shared by high-performance companies is the speed with which managers make decisions, typically in close proximity to their customers. High performers get the right information into the hands of the right people who can act quickly at a local level.4 That reinforces the need for analytical capabilities close to the customer—which in practice means distributed in many parts of an organization, if not throughout the entire enterprise.

8 | Getting Serious About Analytics: Better Insights, Better Outcomes
An initial diagnostic
The route to building an analytical capability will depend on the level of analytical maturity currently within the organization. A consumer packaged goods company accustomed to innovating through market basket analytics will have a different set of issues, challenges, and questions than will a bank that may not even know its credit exposure on a daily basis. An electric utility accustomed to doing two physical meter readings per year will likely not be prepared to take advantage of the rollout of a smart grid that allows for several meter reads per hour. Therefore, a useful first step is a diagnostic to determine the company’s current maturity and where the gaps lie, as shown in Figure 4.
Companies at Stage 1, or “analytical novices,” should aim to boost the quality of data or technical tools. Poor data quality is prevalent around the globe, and needs to be addressed before investing in analytics. If dirty data is an issue at your organization, it’s essential to determine what is the highest priority data for executing the core strategy, and then to validate, clean, and consolidate that data. Also, Stage 1 or 2 firms are often short of people with advanced analytical skills, the specialists with the know-how to make a real difference. These firms should recruit talent carefully or investigate how to offshore select pieces of their analytics function to a high-skill region such as Bangalore.
Companies that are further along have already improved the quality of data and brought analytics specialists on board. But analytics is not woven into their business processes, and analytical solutions usually are done only in sections of the company. For these companies, expanding analytics across functions wherever possible and aligning specialists to the highest-value projects and the right roles will yield the largest performance gains.5 (For a case study, see the sidebar, “Cross-Functional Analytics: A Retailer Woos Back Lapsed Customers with Analytics.”) The long-term goal for any firm at any level of maturity: embed analytics as an enterprise-wide capability.
Figure 4. The stages of analytical maturity1,5
Stages
People
Process
Technology
Organization
Stage 1Analytical NovicesAnalytical skills do not exist
Analytical process does not exist
Missing/poor quality data, multiple defines, un-integrated systems
Limited insight into customers, markets and competitors
Stage 2Localized AnalyticsPockets of isolated analysts (may be in Finance, SCM or Marketing/CRM, etc.)
Disconnected, very narrow focus
Recent transaction data un-integrated, missing important information. Isolated BI/analytic efforts
Autonomous activity builds experience and confidence using analytics; creates new analytically based insights
Stage 3Analytical AspirationsAnalysts in multiple areas of business but with limited interaction
Mostly separate analytics processes. Building enterprise level plan
Proliferation of business intelligence (BI) tools. Data marts/ data warehouse established/expands
Coordinated; establish enterprise performance metrics, build analytically based insights
Stage 4Analytical CompaniesSkills exist, but often not aligned to right level/right role
Some embedded analytics processes
High quality data. Have an enterprise BI plan/strategy, IT processes, and governance principles in place
Change program to develop integrated analytical processes and applications and build analytical capabilities
Stage 5Analytical CompetitorsHighly skilled, leveraged, mobilized, centralized, out-sourced grunt work
Fully embedded and much more integrated analytics processes
Enterprise-wide BI/BA architecture largely implemented
Deep strategic insights, continuous renewal and improvement
9
Cross-functional analytics: A retailer woos back lapsed customers Most business problems touch multiple parts of a company, so an analytically based solution will be effective only if it involves each of the relevant units. The case of a major retail chain illustrates the point. The retailer had a very high market share in the U.S. and faced slowing growth. More than one-third of customers were lapsing, that is, after shopping at the chain they did not return for more than two years. Customer surveys uncovered four main reasons for this situation:
• The product often was not on the shelf in stores.
• Sales staff often was not available to help the customer.
• The product was not assorted, bundled, or priced appropriately.
• The overall experience and interaction with employees was poor.
With the survey results pointing the way, the retailer built an analytics program to address key metrics around each of the four issues.
Looking at product availability, the metric tended to be fairly static at 95 percent on average. Digging deeper, however, revealed a more volatile picture: Slow-moving products were always available but fast-moving products had just 30 percent availability. Further analysis of this distribution by product, geographic region, and channel resulted in changes to demand planning processes. The firm examined fast-moving products according to geographic market, using web analytics to assess what customers were looking for on a weekly basis, in order to better predict demand.
To get a handle on labor scheduling, the analytical pros analyzed sales by customer segment, store, and hour of the day. They could see patterns such as the fact that affluent males tended to shop on Tuesday, Wednesday, or Thursday nights between 6 and 9 p.m. During those times, the retailer would schedule more staff for certain sections of the stores. Staffing was tweaked for eight segments and also by season.
For pricing and assortment issues, the retailer combined assortment and space analytics to look at the effectiveness of product adjacencies and the overall shopping basket. Purchase path analytics were deployed to understand the next likely purchase by each demographic segment and the time lag between those purchases. The team also analyzed profit margin leakage. For instance, analysis of the statistical distribution of cashier price overrides looked for the exceptions that were more than a reasonable tolerance from the mean. These cases resulted from either fraud (cashiers giving away the product to friends) or poor training (cashiers were too focused on being customer-friendly, to the detriment of the business).
Unacceptably high employee turnover signaled a lack of employee engagement, which degraded the overall customer experience. Reducing turnover was a difficult challenge across an employee base of over 100,000. So the team broke the analysis down by key role and examined a number of attributes by role, such as recruiting costs, training costs, sales productivity, tenure, and supervisory relationship. They calculated a “time to break even” measure by role
that incorporated the costs and the sales generated by employee as well as the capital cost hurdle for making that investment. Two of the most skilled roles in the stores were turning over faster than they were breaking even, and the economic impact for these two roles made up 60 percent of the total impact of employee turnover on customer retention and financial results.
Multi-function analytics have given the retailer a fact-based and feasible program to reverse customer lapsing. By highlighting the areas of greatest significance, analytics trump guess-work about where the problem and solution might lie. That allows managers to sharply focus scarce resources, with greater confidence that they will see a high return on investment.
10 | Getting Serious About Analytics: Better Insights, Better Outcomes
Becoming thoroughly analytical
Using results from the diagnostic, companies can lay the groundwork for a basic, robust or truly advanced analytical capability. Our observations of high-performance companies, initially detailed in the book Competing on Analytics: The New Science of Winning, suggest that effective analytics are built on a three-part foundation: disciplined processes to ensure that valuable insights and recommendations are generated, acted on, and their effectiveness measured; the right people with the right skills to identify the insights and put them to work; and technology that ensures data integrity, quality, and accessibility. At the majority of companies, technology gets most of the attention, while process and people get short shrift.1 Let’s examine each in turn.
Disciplined, repeatable processesHigh-performance companies integrate analysis into everyday business processes—the methods by which work gets done, decisions get made, and economic value is created. In Accenture’s recent survey, fewer than one in five respondents report that their company uses a repeatable analytical approach. Developing a repeatable, closed-loop process that leverages data and analytical methods to generate insights thus should be a high priority for most companies.
To generate insights, managers start with hypotheses about the shape of a business problem and possible solutions. By analyzing data they usually already possess, managers can then confirm or reject each hypothesis. The resulting
insight might then be tested in a pilot program or a small sample to validate its effectiveness before being widely deployed.
At the start of any test and wider rollout, it’s critical to get input from all the functions or stakeholders that need to be involved in order to mitigate risks and ensure the greatest positive impact. For instance, if a retailer sees an opportunity around an ad promotion for a “smart” kitchen appliance, the retailer will want to consider whether it has enough components in place on the shelf; enough sales people trained in this relatively complex product and staffed at the right stores at the right times; and enough service staff trained to handle customers’ follow-up questions. Without the active participation of the people who run those functions, the retailer risks not just limiting sales but also tarnishing its brand.
11
Consider the case of how car rental company Avis Europe used analytics in its reservation process to improve its financials with a test in London that then rolled out more widely.5 Profitability in the car rental business depends on distributing an exact number of cars to the right places for the customers who will pay the best price. Traditionally, Avis Europe would rely on the experience, “gut,” and judgment of its fleet managers, asking them to study data in the reservation system each week to predict which areas would have the greatest demand. Using this approach year after year, the company eventually fell into a rut. Every Friday morning one station manager would transport a truckload of cars from Heathrow airport to downtown London in anticipation of the weekend rush—without a clear idea of how many cars were actually needed.
To make better and more transparent decisions about fleet distribution, the company tested an analytical program in the reservation process. Within a year, the program was able to use data from Avis’s reservation system to forecast exactly where cars should be sent. Rather than move from Heathrow to London on Friday morning, the program might forecast that the fleet would be best organized by transporting four cars from Heathrow and another four from nearby Stansted airport. Aside from improving fleet management, the system also suggested ways to optimize reservations. During busy seasons, reservations may be restricted to customers renting for a minimum of three days; that way, cars would be more likely to be available for the most profitable customers. Similarly, the system helps managers to predict when a certain station might run out of cars, enabling them to raise prices in advance. By embedding analytics directly into everyday decision-making, the company increased its fleet utilization by two points, or about $19 million.
When aiming to improve a business process, remember that the power of analytics derives from making connections—recognizing patterns in customer demand or business activities, isolating the drivers of performance, and anticipating the effects of decisions. To make connections, you have to look beyond the immediate task and evaluate what happens upstream and downstream. Consider the challenge of improving the return on advertising spend. The solution will be most compelling when spend can be optimized across different channels, geographies, and the full range of products. Analytics thus should connect the entire marketing process, rather than being focused on just one or two phases of it.
As we describe in the book, Analytics at Work: Smarter Decisions, Better Results, analytics typically work best with a cross-functional approach, since most business problems touch multiple areas of a company. For a health payer, traditional, widely used batch claim processing drives poor cash management and increases administrative costs and customer complaints. The better solution, a real- time adjudication process, is complex enough that it requires analytics and collaboration among several areas—from prioritizing transactions, to retraining technicians, to shifting resources away from adjustments and appeals and toward customer service at the provider’s office.5
Initial applications of analytics are often one-time efforts that are inherently limited in effect. But as analytics become familiar and more routine, managers can learn from each initiative, codify them, and integrate the analytics into work processes. This more industrial approach takes time up front, but eventually offers the benefit of almost instantaneous decisions.
The right people, properly led and organizedGetting the right people working on the right set of problems is one of the most important building blocks of an effective analytical capability. And this is also a key challenge for Accenture survey respondents. Of all the potential targets for greater investment, the top area cited by the respondents is “investing in people with the right analytical skills”. As Hal Varian, chief economist of Google, said to an interviewer recently, “The sexy job in the next ten years will be statisticians.”6
Taking a broad analytical approach to business requires significant changes in culture, process, behavior, and skills for many employees. Such changes call senior executives to become genuine advocates—and champions—of analytics and fact-based decision-making. The ideal primary advocate is the CEO, as is the case with such analytical exemplars as Rich Fairbank at Capital One, Reed Hastings at Netflix, and Jeff Bezos at Amazon.com. Fred Smith, when he founded FedEx, insisted that a network of state-of-the-art information systems—a melange of laser scanners, bar codes, software, and electronic connections—be erected alongside the air and vehicle networks. As Smith puts it: “The information about a package is as important as the package itself.”7
An accountable leader manages analytics capabilities centrally at high-performance businesses. Candidates for this role are typically the CFO, CMO, COO, or CIO, but the title is less important than personal characteristics, including a strong analytical acumen and a bias to use analytical information to guide strategic decisions.
12 | Getting Serious About Analytics: Better Insights, Better Outcomes
Companies should recruit and organize analytical staff based on skill sets and the type of analysis they will conduct on the job. In the new book Analytics at Work: Smarter Decisions, Better Results, we distinguish four types of analytical people who are critical to business success5:
• Analytical champions are executive decision-makers who understand how analytical techniques and technologies, such as trending, forecasting, and predictive modeling can help achieve business objectives.
• Analytical professionals create advanced analytical applications by developing statistical models and algorithms to be used by others in the organization.
• Analytical semi-professionals apply the models and algorithms developed by professionals on behalf of the rest of the business.
• Analytical amateurs need some understanding of analytics to do their jobs successfully, such as a warehouse manager who follows data-based advice about optimal inventory levels.
Staffing each of the four groups with people who have the requisite technical and business skills—such as coaching, consulting, or business design expertise—represents a challenge. Companies will likely have to hire in order to scale up their analytical capabilities. Retraining, say, accountants to become versed in advanced financial analytics rarely works.
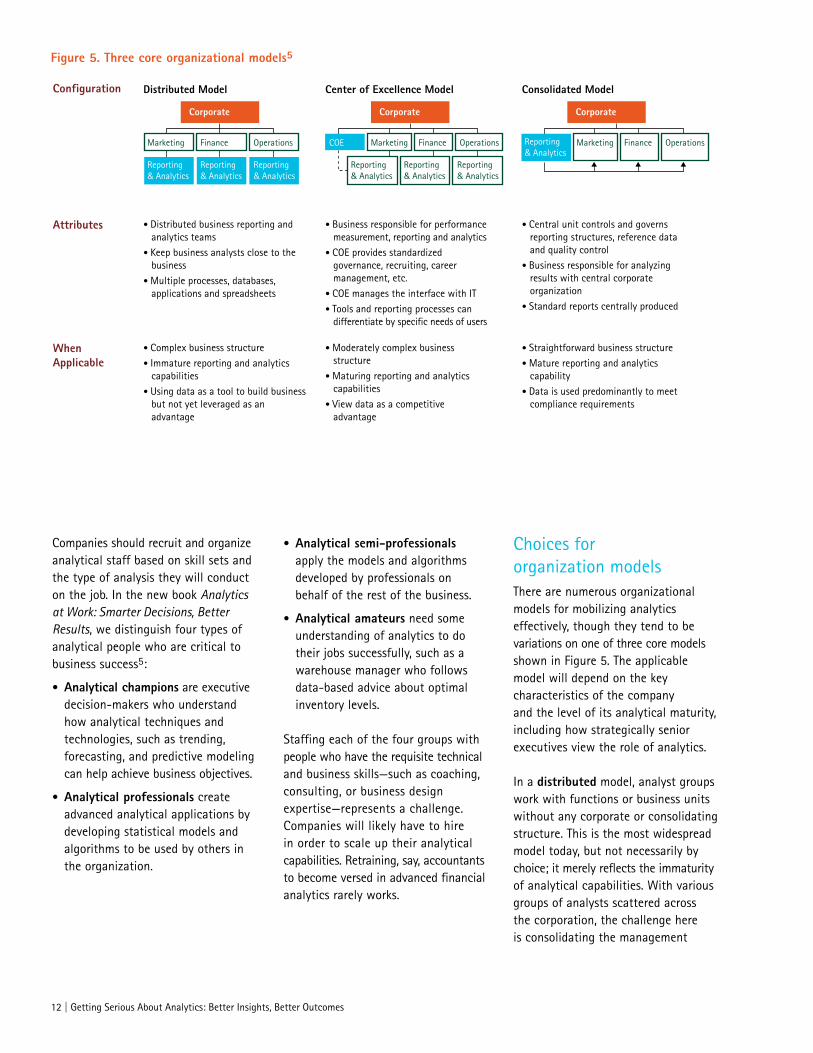
Choices for organization modelsThere are numerous organizational models for mobilizing analytics effectively, though they tend to be variations on one of three core models shown in Figure 5. The applicable model will depend on the key characteristics of the company and the level of its analytical maturity, including how strategically senior executives view the role of analytics.
In a distributed model, analyst groups work with functions or business units without any corporate or consolidating structure. This is the most widespread model today, but not necessarily by choice; it merely reflects the immaturity of analytical capabilities. With various groups of analysts scattered across the corporation, the challenge here is consolidating the management
Figure 5. Three core organizational models5
Distributed Model Center of Excellence Model Consolidated Model
Attributes
Configuration
When Applicable
• Distributed business reporting and analytics teams
• Keep business analysts close to the business
• Multiple processes, databases, applications and spreadsheets
• Complex business structure• Immature reporting and analytics
capabilities• Using data as a tool to build business
but not yet leveraged as an advantage
• Business responsible for performance measurement, reporting and analytics
• COE provides standardized governance, recruiting, career management, etc.
• COE manages the interface with IT• Tools and reporting processes can
differentiate by specific needs of users
• Moderately complex business structure
• Maturing reporting and analytics capabilities
• View data as a competitive advantage
• Central unit controls and governs reporting structures, reference data and quality control
• Business responsible for analyzing results with central corporate organization
• Standard reports centrally produced
• Straightforward business structure• Mature reporting and analytics
capability• Data is used predominantly to meet
compliance requirements
Corporate
Marketing Finance Operations
Reporting & Analytics
Reporting & Analytics
Reporting & Analytics
Reporting & Analytics
Corporate
MarketingCOE Finance Operations
Corporate
Reporting & Analytics
Reporting & Analytics
Reporting & Analytics
Marketing Finance Operations

13
14 | Getting Serious About Analytics: Better Insights, Better Outcomes
of analytical priorities, projects, and resources. It’s only effective in the rare case of a diversified, multi-business corporation in which the businesses have little in common. One variation is a “federated” approach that installs analyst groups in each business unit, sets up a corporate group to drive enterprise initiatives, and coordinates all the groups with clear “guidelines of federation.”
In a center of excellence model, analyst groups reside in business units or functions that have an appetite for analytics, but all groups are members of a corporate center of excellence. This builds a community of analysts who can learn from each other by sharing knowledge and best practices. Sometimes a strong center can also operate as a “program office,” looking across analytical initiatives to advise on project priorities and on how to deploy staff accordingly.
In a consolidated model, all analyst groups report to one corporate organization, even if they are working with business units or functions. Consolidation makes it easier to assign analysts to projects with strategic priority; however, it can create distance between analysts and the business, especially if the analysts are all housed in one corporate location. Candy manufacturer Mars has a centralized “Catalyst” group with long-term funding and that can be deployed strategically to work with any part of the business.5
Regardless of the organizational model chosen, analytical exemplars work diligently to build an organizational capability that goes well beyond the collection of individuals involved. One global company, for instance, has built a strong organizational dynamic capability around brand—from tools to training to business processes—that’s
greater than the sum of each individual currently contributing to the brand. That capability is a powerful contributor to the company’s brand equity and, ultimately, to its market value. Procter & Gamble, an innovator in analyzing household goods, now houses its critical mass of analytical staff in a single organization. This group targets issues of strategic importance to the company, whether they touch marketing, the supply chain, human resources, or another function.5
Technology that everyone can useWe don’t mean to discount the importance of technology; it’s just that the decisions tend to be more straightforward and widely discussed. The type of tools that should be deployed across the organization will depend on the kind of analysis that needs to be completed, data availability and quality, and the skill-sets of the analyst. To assess the needs of an organization, identify and categorize tools based on basic, intermediate, and advanced analytical capabilities, the continuum in Figure 3 can serve as a guide.
In the book Analytics at Work: Smarter Decisions, Better Results, we note that it’s usually most effective to embed analytics through the technologies that employees routinely use, on top of an industrial-strength architecture, rather than through special, stand-alone applications. Analytics can be woven into ongoing work processes in several ways:
Automated decision applications. These applications sense online conditions or data, apply logic or codified knowledge, and make decisions with minimal human intervention. Conditions are best for automating the decision when experts can readily codify the decision rules, a production
system automates the surrounding process, and high-quality data exists in electronic form. These days, automated decision-making is used in a variety of settings, from reordering of product once it goes below safety stock levels, to labor scheduling in retail stores, to monitoring offshore oil wells or vehicle fleets for preventive maintenance. For a fleet of trucks, sensors in transmissions and engines can relay data such as speed, temperature, and oil pressure to computers that run algorithms for predicting potential problems before they occur.5 The automated system thus enables preventative maintenance, extends the life of the vehicle, and drives down repair costs.
Applications for operational and tactical decision-making. Managers rely on analytical applications that are integrated directly into enterprise systems or web applications for tasks such as supply chain optimization, sales forecasting, and measuring advertising effectiveness. Recommendation, planning, and “what if” applications can incorporate nearly real-time information and multiple models to reach an optimal solution that factors in conflicting goals such as profitability and customer satisfaction. Such applications are best suited to clearly-defined, periodic tasks in which most of the information needed is available electronically and predictable. Continental Airlines has used analytics successfully on a number of operational fronts, after it integrated 10 terabytes of data from 25 operational systems into a data warehouse. Analysis of the centralized data produced real-time alerts of delays so customer service agents can reroute incoming frequent fliers onto new flights; better long-term planning for marketing programs; and improved logistics, for instance, planning lucrative routes, then allocating planes and filling flight crews.5
15
Strategic decision-making. To push the performance benefits of analytics across the enterprise, they need to be an integral part of strategic decisions. Indeed, the strategies of some companies are hardly conceivable without advanced analytics. Netflix basically invented the online video business, using analytics to predict which DVDs customers will want to watch next. The casino company Harrah’s Entertainment came under criticism from analysts in the mid-1990s when it began to target individuals rather than large groups like conventioneers. Yet Harrah’s stuck to its strategy, using a database of 5 million individuals to track behavior at a minute level, creating demand a few people at a time. CEO Gary Loveman, an analytics champion, regularly asks employees, “Do we think this is true, or do we know?” Powered by the underlying analytics, Harrah’s strategy has proven robust through an array of economic
and geographic situations, and has handily outperformed competitors during the global downturn.5
Applications to improve innovation. These more advanced analytics include text mining of unstructured data such as SEC filings of competitors and web traffic monitoring to predict litigation action or retail consumer behavior. Another example is a prediction market, which operates on the principle that a crowd, collectively, can often make better decisions than individual managers. When electronics retailer Best Buy wants to know if a new idea is likely to succeed, it may seek the opinion of rank-and-file employees by turning to its internal TagTrade market. TagTrade market allows employees to trade imaginary stocks based on answers to managers’ questions and often proves to be more accurate than the company’s official forecasts.8

16 | Getting Serious About Analytics: Better Insights, Better Outcomes
Behind the magic of analytics
The proliferation of data and ever more powerful computing technologies to crunch the data are propelling analytics to a more prominent role. But technology is just part of the story. It’s the magician, not the hat, who performs magic; data becomes valuable only after it’s shaped by analytical pros and semi-pros into insights, which then inform the decisions and processes that lead to better outcomes.
Fortunately, business leaders with ambitions to compete through analytics have an opportunity now to break through any cultural resistance. For one thing, the prolonged recession has spurred greater reliance on proof of concept before spending or investing, especially proof with a quantitative
basis. In addition, a wave of retirements among older Baby Boomers over the next few years, some of whom never acquired a heavy analytical skill-set, presents an opening to hire more analytically fluent people.
The end game should be an enterprise analytics capability, where the piece parts collaborate to solve problems and insights can be leveraged for maximum impact. No doubt this may require more effort at first, more sponsorship from the senior ranks, and buy-in from more people. Yet enterprise-scale results, whether in revenue growth, profitability, return on capital, customer loyalty, or other measures of value, are what make the effort worthwhile.
17
Questions for managers Process
Have we identified key performance indicators that have proven causal linkages with key strategies and overall company outcomes?
After we generate insights from data, do we test them with a subset of the organization to measure effectiveness?
Do our performance monitoring processes focus less on the past and more on current and future goal attainment?
Do we have closed-loop analytical processes in place?
Do we provide formal analytical process and content training courses?
Have we structured analytical processes to gain efficiency and effectiveness within single functions as well as across the organization?
Technology
Are our data available at the most granular level, such as SKU, part number, and customer?
Do our data include a wide array of formats, such as text, numbers, and pictures?
Are users able to extract data quickly and in desired formats?
Are training and assistance readily available for users?
Have we validated data integrity and quality throughout the organization?
People
Is there is a career progression model for analytical professionals with opportunities to increase skills and deliver value?
Do we have analytical champions with strong business acumen and who can broadly mentor analytical skills?
Are our analytical people proficient in the quantitative disciplines specific to their industry or business function?
Organization
Is analytics organized as a distinct capability?
Do analytical professionals report to the C-level in order to support corporate innovation? Are they deployed to solve functional and business problems?
Do we evaluate analytical needs in the context of the company planning process to support strategies for both mature and emerging business units?
Are there clear roles and responsibilities among IT staff and analytical staff regarding model creation, testing, and insight generation?

18 | Getting Serious About Analytics: Better Insights, Better Outcomes

19
References
About the authors
1 Thomas H. Davenport and Jeanne G. Harris. “Competing on Analytics: The New Science of Winning”, Boston: Harvard Business School Press, 2007
2 “The Diverse and Exploding Digital Universe,” IDC, May 2009
3 “Competing Through Business Analytics to Achieve High Performance,” Accenture Information Management Services, December 2008
4 “When Good Management Shows: Creating Value in an Uncertain Economy,” Accenture, 2008
Dave Rich is managing director for Accenture Analytics and managing director of the Accenture Customer Relationship Management service line. Previously, Mr. Rich served as lead for Accenture’s Electronics and High Tech industry practice, among other leadership roles. For more than three decades, he has helped senior executives at leading companies in many industries address customer-related issues of strategic importance to growth and high performance.
Brian McCarthy is the executive director, Strategy for Accenture Analytics. Mr. McCarthy has more than 16 years of experience in value and performance
5 Thomas Davenport, Jeanne Harris, and Robert Morison, “Analytics at Work: Smarter Decisions, Better Results,” Harvard Business School Press, January 2010
6 ”For Today’s Graduate, Just One Word: Statistics”, The New York Times, August 5, 2009
7 “They’ve Got Mail!”, Fortune, February 7, 2000
8 ”Best Buy Taps ‘Prediction Market’”, The Wall Street Journal, Sept. 16, 2008
management and financial reengineering engagements. Mr. McCarthy’s primary focus is helping executives address key performance management challenges and align their organizations around increasing shareholder value.
Jeanne Harris is an executive research fellow and director of research at the Accenture Institute for High Performance, co-author of the upcoming book Analytics at Work: Smarter Decisions, Better Results. During more than 30 years at Accenture, Jeanne has worked extensively with clients seeking to improve their managerial information, decision-making, analytical and knowledge management capabilities.
Copyright © 2003 Accenture All rights reserved.
Accenture, its logo, and High Performance Delivered are trademarks of Accenture.
Barcode Placement
Copyright © 2010 Accenture All rights reserved.
Accenture, its logo, and High Performance Delivered are trademarks of Accenture.
About AccentureAccenture is a global management consulting, technology services and outsourcing company, with more than 181,000 people serving clients in more than 120 countries. Combining unparalleled experience, comprehensive capabilities across all industries and business functions, and extensive research on the world’s most successful companies, Accenture collaborates with clients to help them become high-performance businesses and governments. The company generated net revenues of US$21.58 billion for the fiscal year ended Aug. 31, 2009. Its home page is www.accenture.com.
About Accenture AnalyticsAccenture Analytics delivers the insights that organizations need to make better business decisions, faster. Our extensive capabilities range from accessing and reporting on data to predictive modeling, forecasting and sophisticated statistical analysis. We have more than 20,000 analytics-skilled people with deep functional, industry, business process and technology experience. At the intersection of business and technology, Accenture Analytics enables organizations to achieve the business outcomes that drive high performance. For more information about Accenture Analytics, visit www.accenture.com/analytics.
AcknowledgementThe authors would like to thank Tiffany Brown for her leadership of the Enterprise Analytics research cited in this paper, and acknowledge the contributions of George Marcotte and Chris Yager to the research effort.