getting on the moves: using dynameq and the us epa moves model to measure the air pollution...
TRANSCRIPT

Getting on the MOVES: Using Dynameq and the US EPA MOVES Model to Measure the Air Pollution
Emissions
TRPC – Smart Corridors Project
Chris BreilandFehr & Peers
September 16, 2011

Outline
• Project Overview, Background and Objectives
• Dynameq Model Development
• Estimating Air Pollution Emissions
• Motor Vehicle Emission Simulator (MOVES)
• Comparison
• Conclusions• Q&A

• TRPC - intergovernmental board made up of local government jurisdictions
• County area - 727 sq miles population - 245,300
• The county’s population is expected to be 373,000 in 2030
• The county is the home of the State’s Capitol, City of Olympia
Overview

Project Background
• Congestion Mitigation and Air Quality (CMAQ) grant
• Options to reduce PM10 through ITS deployment– coordinated signal timing and optimization– transit signal priority (TSP)
• Two strategic corridors were chosen from the Regional Transportation Plan (RTP) that are problematic for Intercity Transit’s on-time performance goals

Study Corridors

• To improve multi-modal transportation operations on the two corridors
• To evaluate signal coordination and optimization
• To evaluate transit signal priority options
• To reduce PM10 (particulate matter) emissions in the corridors.
Project Objectives

• NETWORK– Entire network brought into DTA model from EMME Travel Demand
Model– Refined the Dynameq network to add missing intersections on the
corridors– Modified all centroid connectors for the zones around two corridors to
reflect field conditions– Verified link attributes– Network properties in DTA model: – 800 centroids – 2,500 regular nodes – 8,000 links – 20 transit lines
• TRIP TABLES– Trip tables brought from EMME Travel Demand Model– The modes are SOV, HOV & Truck
Model Development

Model Development
• INTERSECTION CONTROLS– Focused on corridors and a several-block buffer– 81 signals & 67 stop controlled intersections
• INTERSECTION GEOMETRY– Approaches to the intersections were modified to
reflect field conditions– Added right and left turn lane pockets where needed
Model Development
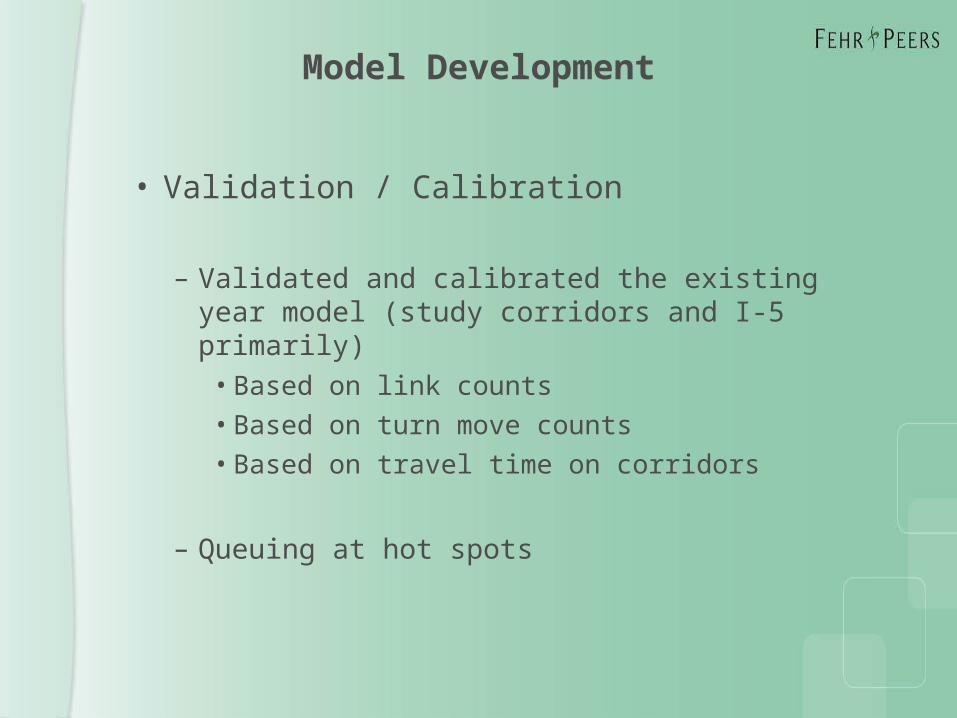
• Validation / Calibration
– Validated and calibrated the existing year model (study corridors and I-5 primarily) •Based on link counts
•Based on turn move counts
•Based on travel time on corridors
– Queuing at hot spots

Model Validation

Air Pollution Emissions and Model Detail
• Air Pollution Highly Sensitive to:
• VMT
• Speed
• Vehicle Type
• Drive Cycle
• DTA versus Static Models

How are Emissions Estimated?
• Air Quality Analysis tools – EMFAC, Mobile6, MOVES

Motor Vehicle Emission Simulator (MOVES)
• State-of-art tool for estimating emission from highway vehicles developed by US Environmental Protection Agency (EPA)
• Highly detailed
• Perfect for Dynameq

MOVES Input Data
Data needs from Dynameq DTA Model
• Link

MOVES Input Data
Data needs from Dynameq DTA Model
• Fleet Mix
Source Type ID Source Type Name
11 Motorcycle
21 Passenger Car
31 Passenger Truck
32 Light Commercial Truck
41 Intercity Bus
42 Transit Bus
43 School Bus
51 Refuse Truck
52 Single Unit Short-haul Truck
53 Single Unit Long-haul Truck
54 Motor Home
61 Combination Short-haul Truck
62 Combination Long-haul Truck

MOVES Input Data
Data needs from Dynameq DTA Model
• Operating Mode Distribution
– for each link, source type and pollutant
opModeID opModeName
0 Braking
1 Idling
11 Low Speed Coasting; VSP< 0; 1<=Speed<25
12 Cruise/Acceleration; 0<=VSP< 3; 1<= Speed<25
13 Cruise/Acceleration; 3<=VSP< 6; 1<=Speed<25
14 Cruise/Acceleration; 6<=VSP< 9; 1<=Speed<25
15 Cruise/Acceleration; 9<=VSP<12; 1<=Speed<25
16 Cruise/Acceleration; 12<=VSP; 1<=Speed<25
21 Moderate Speed Coasting; VSP< 0; 25<=Speed<50
22 Cruise/Acceleration; 0<=VSP< 3; 25<=Speed<50
23 Cruise/Acceleration; 3<=VSP< 6; 25<=Speed<50
24 Cruise/Acceleration; 6<=VSP< 9; 25<=Speed<50
25 Cruise/Acceleration; 9<=VSP<12; 25<=Speed<50
26 Cruise/Acceleration; 12<=VSP; 25<=Speed<50
27 Cruise/Acceleration; 12<=VSP<18; 25<=Speed<50
28 Cruise/Acceleration; 18<=VSP<24; 25<=Speed<50
29 Cruise/Acceleration; 24<=VSP<30; 25<=Speed<50
30 Cruise/Acceleration; 30<=VSP; 25<=Speed<50
33 Cruise/Acceleration; VSP< 6; 50<=Speed
35 Cruise/Acceleration; 6<=VSP<12; 50<=Speed
36 Cruise/Acceleration; 12 <= VSP; 50<=Speed
37 Cruise/Acceleration; 12<=VSP<18; 50<=Speed
38 Cruise/Acceleration; 18<=VSP<24; 50<=Speed
39 Cruise/Acceleration; 24<=VSP<30; 50<=Speed
40 Cruise/Acceleration; 30<=VSP; 50<=Speed

OpMode
Uh-oh!

OpMode
Uh-oh!

New Component for Dynameq to Extract the Necessary MOVES Input Data

OpMode
•300,000 rows

Emissions Calculation Comparisons
2010 Base
VMT PM 10 (g) CO2 (g)
EMME + EMFAC
25,210 1,309 12,420,539
EMFAC
30,029
2,224 17,883,106
Mobile6 1,282 16,591,022
MOVES 997 17,051,387

Concluding Thoughts
• MOVES is new standard
• MOVES is built for a tool like Dynameq
• INRO Dynameq-MOVES component enables analysis
• MOVES very difficult to run
