get in the zone the basics of reading infrared spectrometry … · get in the zone the basics of...
TRANSCRIPT
Get In The Zone
The basics of Reading Infrared Spectrometry Graphs
What You Will Learn This is a tutorial tohelp you learn to recognize and read thepeaks in Infrared SpectrometryGraphs. A Bit About Infrared Molecules are vibrating.When they absorb photons of the appropriate energy changes thisvibration.What Do We Want to Know? Wewanttoknowhowthestructureisrelatedtotheenergythatisabsorbed.Why Should I care? Thiswillletusmakeconclusionsaboutthestructure.What does an IR spectrum show us? FUNCTIONALGROUPS!!!Sooo…what are we looking at? XAXIS:stretchingfrequencyYAXIS:numberofphotonsabsorbedMore detail about the X and Y axis are explained in detail in Dr. Hardinger’s lectures. ThistutorialisfocusedmoreonhowtodeterminethepeaksintheIRspectrum…What are we looking for? PEAKS!Wearelookingfordownwardspikesinthegraph.Why are some peaks bigger than others? Polaritydeterminesthepeak’sstrength.Themorepolaramoleculeis,thestrongerthepeakis.Repetition canalsodetermine strength;manyof the same functional group leads toa largerpeak.How does this help us? Thishelpsusassociatepeakswiththebondedatoms.Prep Work!!! CalculatetheDBE!YouwillneedtolookattheDBEvaluetodeterminethenumberofpibonds.Thiswillhelpyoueliminateanddifferentiateamongfunctionalgroups.

ZONE 1 Thiszonetakesplacebetween3700‐3200cm‐1(onthexaxis)
[citation(a)]
What are we looking for?
Alcohols,terminalalkynes,N‐Hstretches
Tips to Note: Peaksmayvaryinsize.Donotimmediatelyruleoutpeaksbecauseyouthinktheyaretoo
small!
T h e B r e a k d o w n
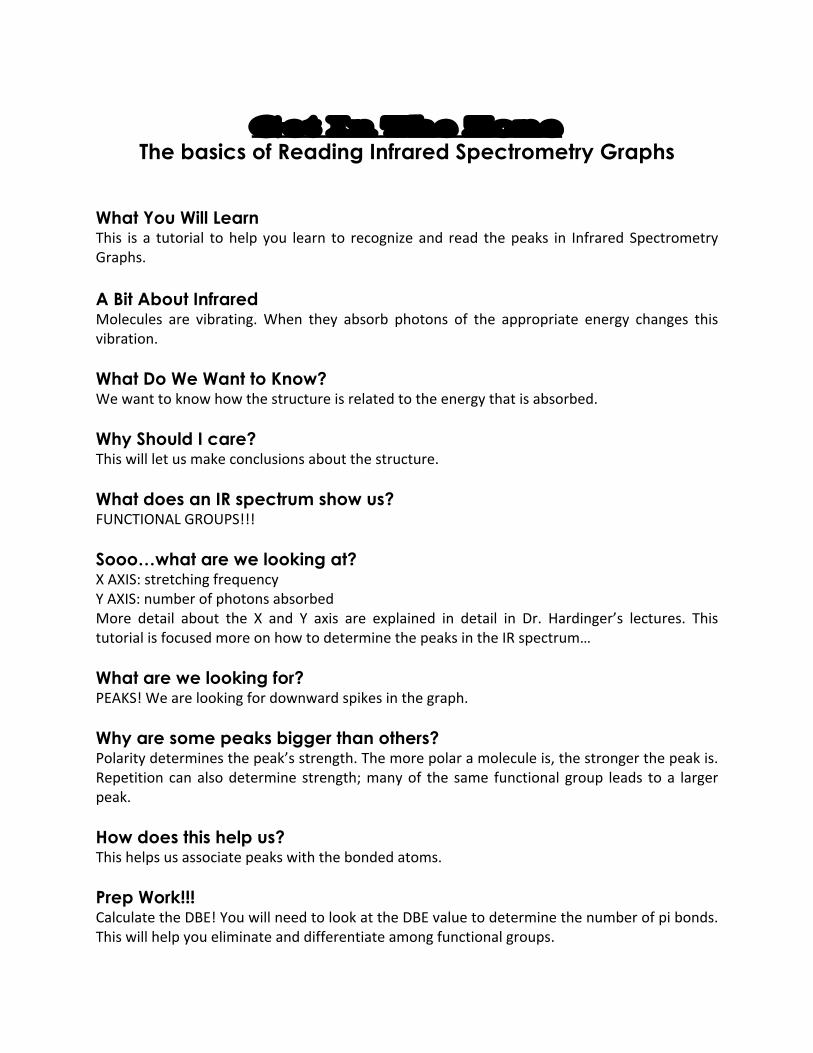
A l c o h o l s ( O – H ) Occuraround3650–3200cm‐1
Alcoholshaveaverydistinctstrongandbroadshape.Whenweseethissortofelongated“U”shapearoundthisregion,weknowthereisanalcoholgroup.Itwillgenerallylooklikethe
portionencircledinthepinkovalbelow.
[citation(a)]
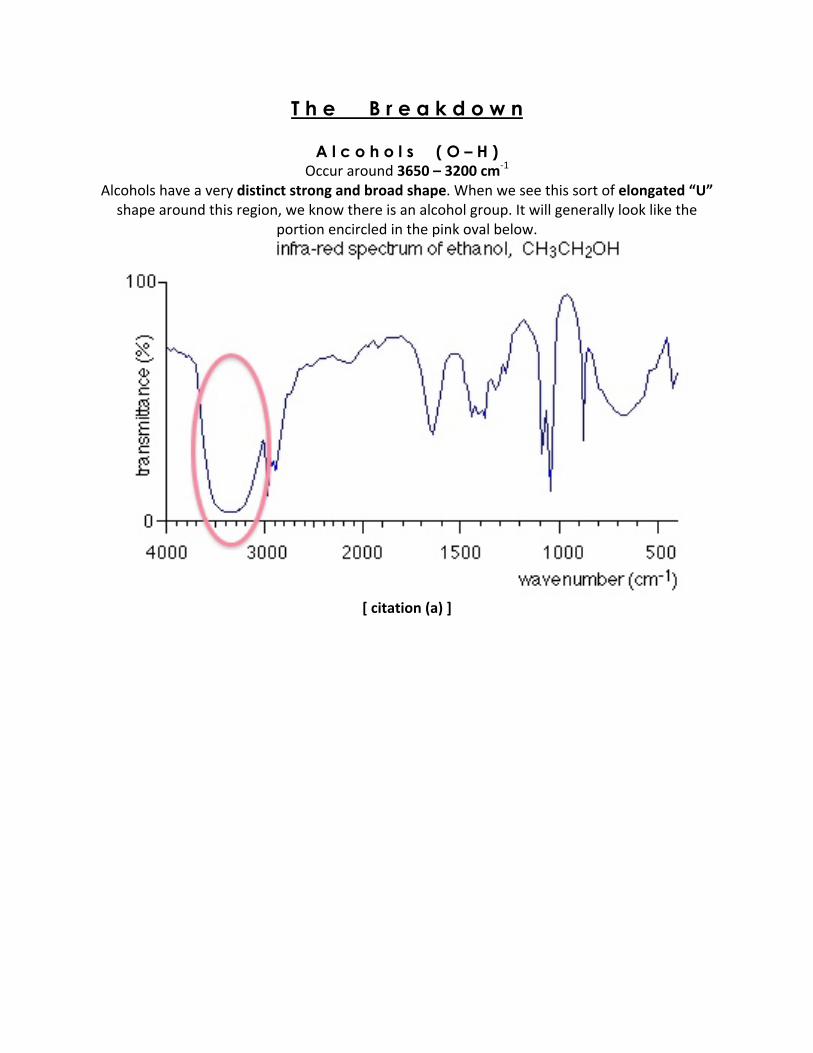
T e r m i n a l A l k y n e s ( = C - H ) Occursaround3340‐3250cm‐1
TerminalAlkynesaregenerallystrongerandsharperinshape.Thepeakwithinthepinkovalbelowisaterminalalkyne.Beonthelookoutforsimilarshapesinthisregion.
[citation(b)]
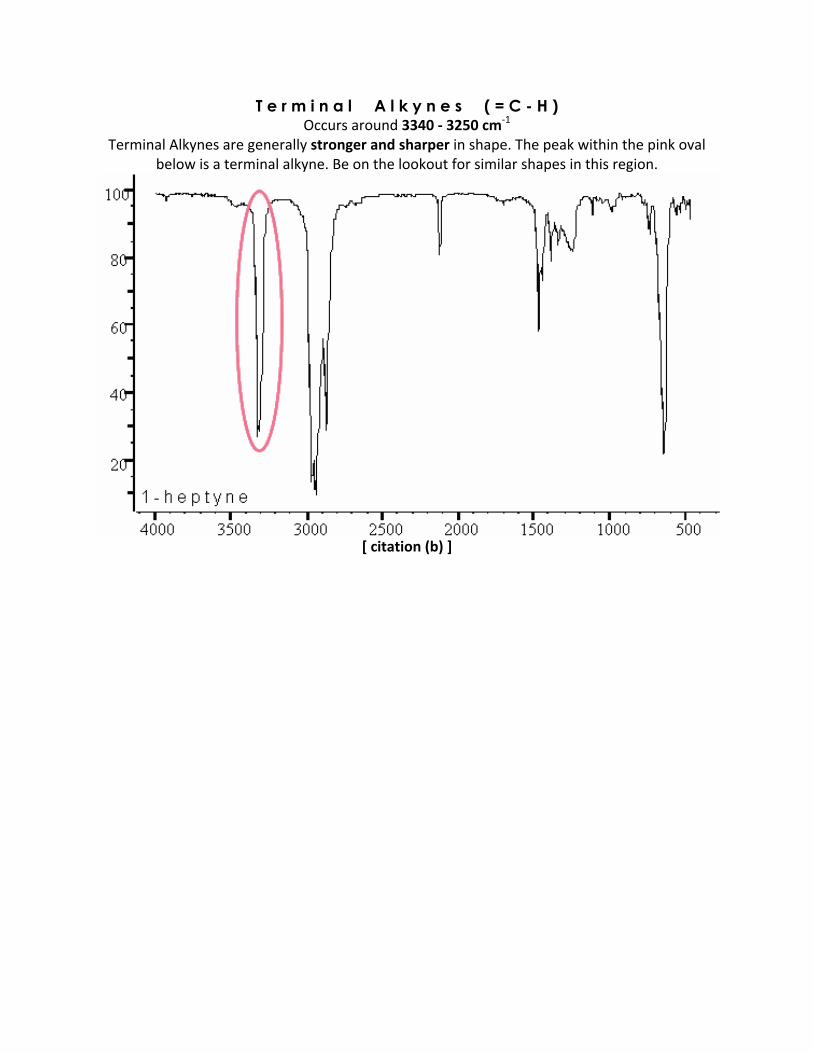
N – H s t r e t c h e s Occursaround3500‐3200cm‐1
N–Hstretchescanmeanaminesoramides,butitdoesnotnecessarilyhavetoindicateeitherofthese.Thesearemediuminintensity,butarebroaderinappearance.
NOTE:Besuretolookatyourmolecularformulatomakesureanitrogenexistsinyourmolecule!AnitrogenisnecessaryfortheexistenceofanN‐Hstretch!
AllthreeofthefollowingareN‐Hstretches.Thefirstshowsaprimaryamine,andthesecondshowsatertiaryamine.ThelastimageshowsanN‐Hstretch,whichissignificantlysmallerthan
intheotherexamples,butstillcounts.
[citation(b)]

[citation(b)]
[citation(c)]

ZONE 2
Thiszonetakesplacebetween3200‐2700cm‐1(onthexaxis)
[citation(a)]
What are we looking for? Sp2carbons,sp3carbons,aldehydes,carboxylicacid
Tips to Note:
LookforC‐Hbondinginthiszone!Weareinorganicchemistry;nearlyeverymoleculethatwedealwithwillinvolveC‐Hbonding.Useyourwritingutensiltomapoutareasandfocusinon
thesespecificareastomakesureyouarereadingthegraphaccurately!

T h e B r e a k d o w n
S p 2 C a r b o n - H y d r o g e n ( C - H ) Occursaround3100‐3000cm‐1
Sp2carbonsmayvaryinsizeandshapeItisimportanttonoteexactlywhereyouseethepeak!Thispeakwilloccurinaverysmallrange,highlightitandnoteitdown!
[ProfessorStevenHardinger’sThinkbook]
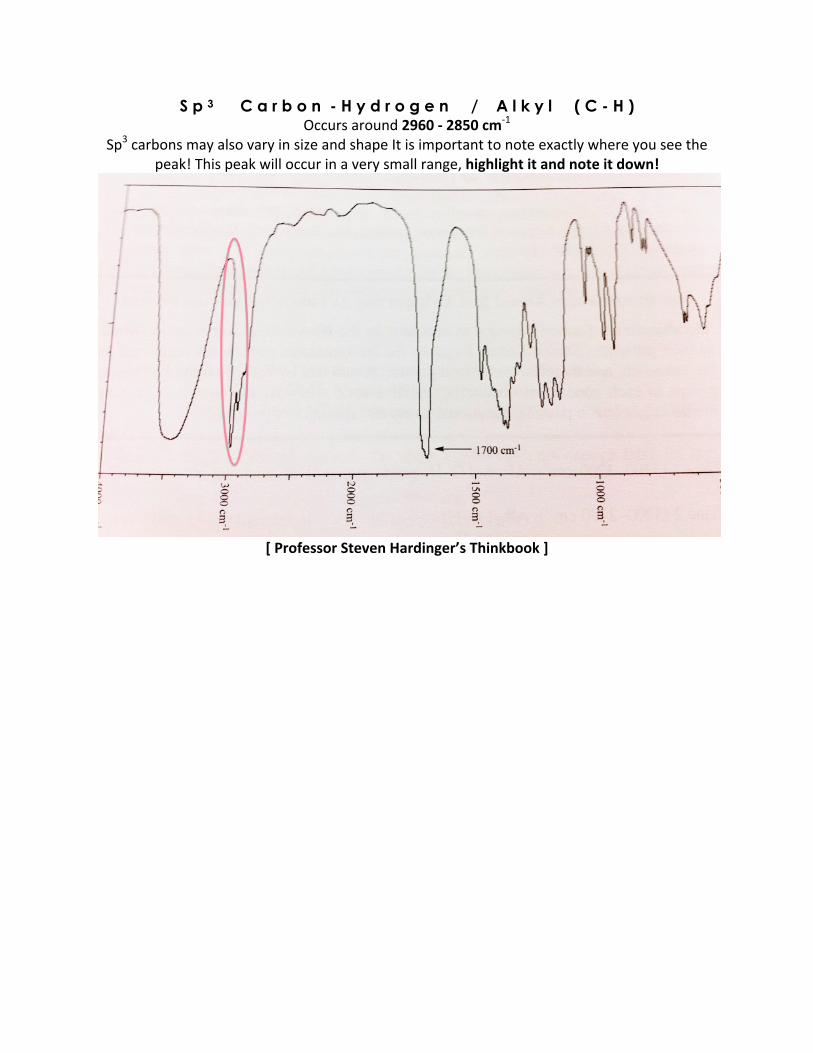
S p 3 C a r b o n - H y d r o g e n / A l k y l ( C - H ) Occursaround2960‐2850cm‐1
Sp3carbonsmayalsovaryinsizeandshapeItisimportanttonoteexactlywhereyouseethepeak!Thispeakwilloccurinaverysmallrange,highlightitandnoteitdown!
[ProfessorStevenHardinger’sThinkbook]
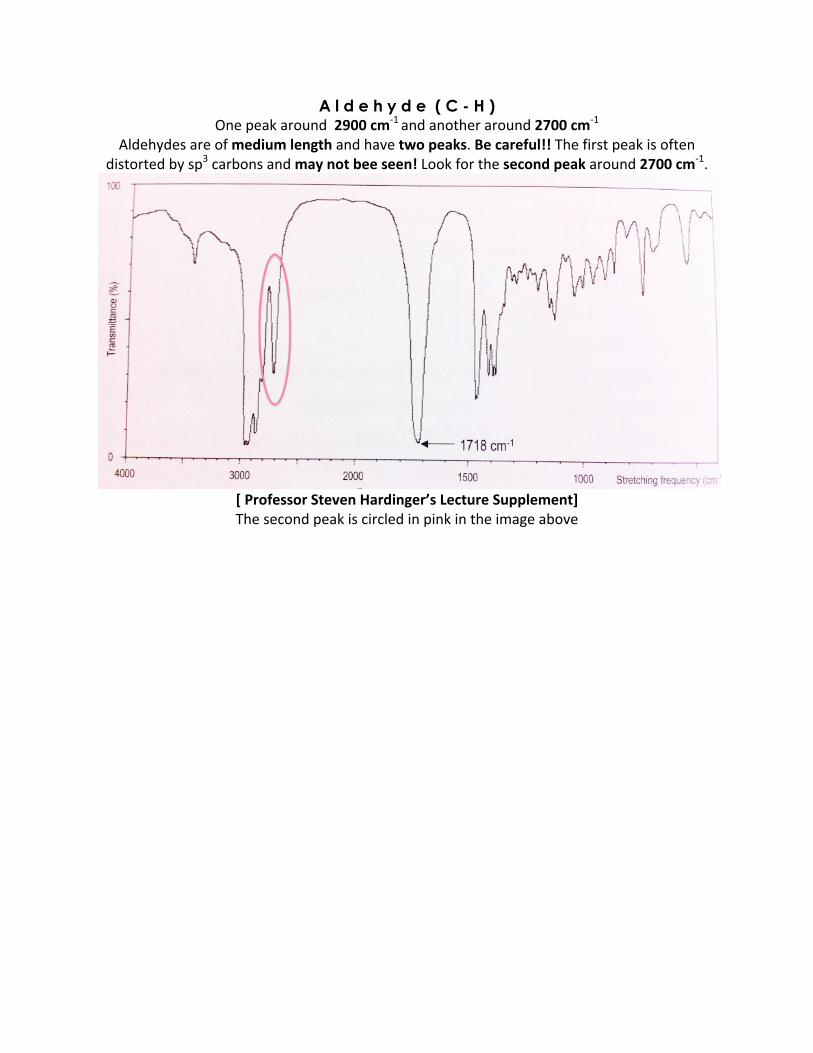
A l d e h y d e ( C - H ) Onepeakaround2900cm‐1andanotheraround2700cm‐1
Aldehydesareofmediumlengthandhavetwopeaks.Becareful!!Thefirstpeakisoftendistortedbysp3carbonsandmaynotbeeseen!Lookforthesecondpeakaround2700cm‐1.
[ProfessorStevenHardinger’sLectureSupplement]Thesecondpeakiscircledinpinkintheimageabove
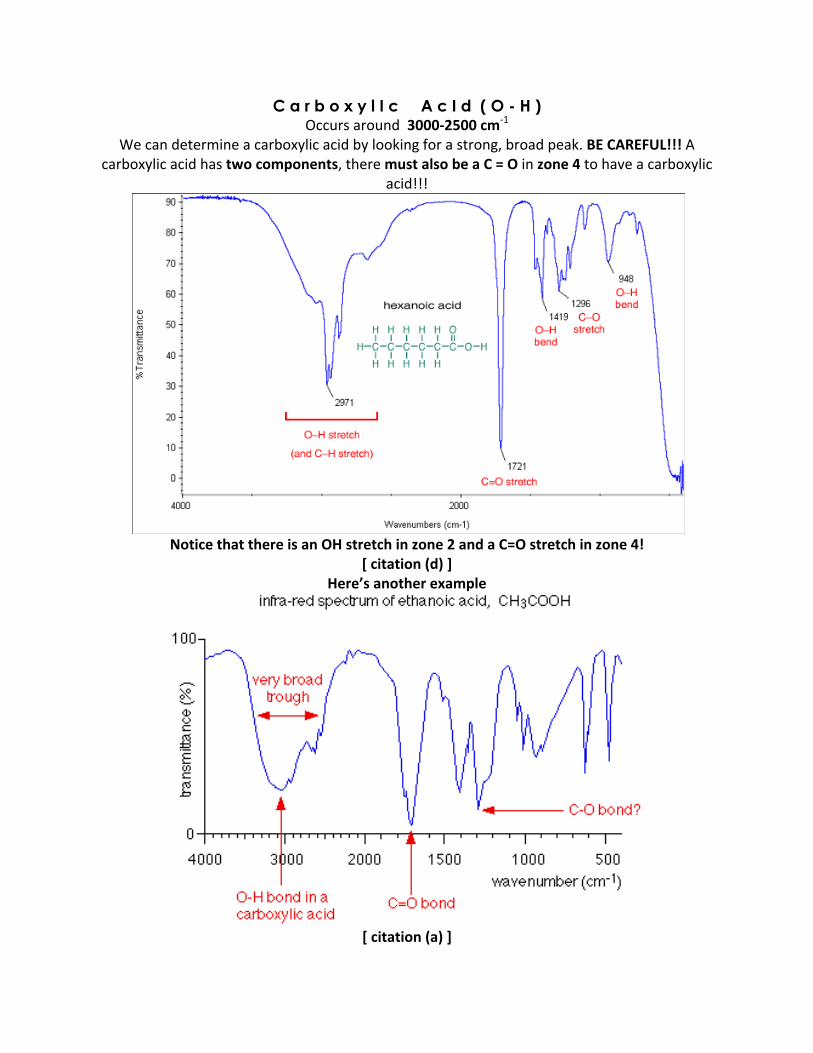
C a r b o x y l I c A c I d ( O - H ) Occursaround3000‐2500cm‐1
Wecandetermineacarboxylicacidbylookingforastrong,broadpeak.BECAREFUL!!!Acarboxylicacidhastwocomponents,theremustalsobeaC=Oinzone4tohaveacarboxylic
acid!!!
NoticethatthereisanOHstretchinzone2andaC=Ostretchinzone4!
[citation(d)]Here’sanotherexample
[citation(a)]

ZONE 3
Thiszonetakesplacebetween2300‐2000cm‐1(onthexaxis)
[citation(a)]
T h e B r e a k d o w n
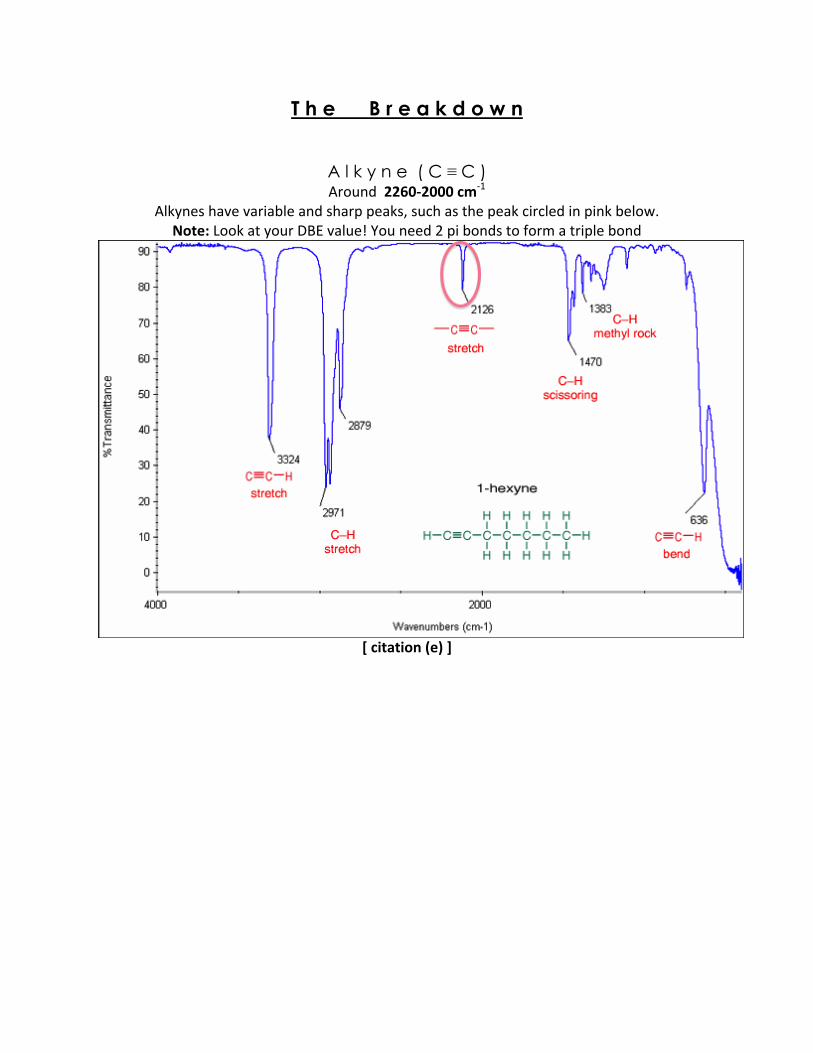
A l k y n e ( C ≡ C ) Around2260‐2000cm‐1
Alkyneshavevariableandsharppeaks,suchasthepeakcircledinpinkbelow.Note:LookatyourDBEvalue!Youneed2pibondstoformatriplebond
[citation(e)]
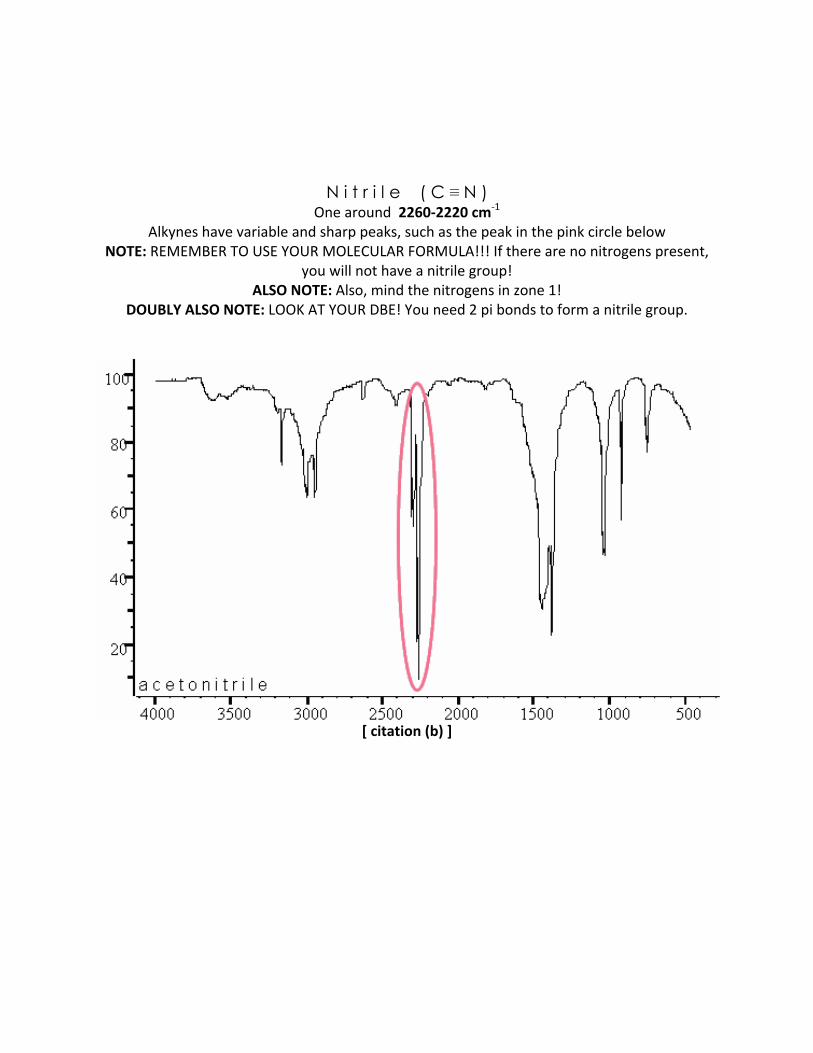
N i t r i l e ( C ≡ N )
Onearound2260‐2220cm‐1Alkyneshavevariableandsharppeaks,suchasthepeakinthepinkcirclebelow
NOTE:REMEMBERTOUSEYOURMOLECULARFORMULA!!!Iftherearenonitrogenspresent,youwillnothaveanitrilegroup!
ALSONOTE:Also,mindthenitrogensinzone1!DOUBLYALSONOTE:LOOKATYOURDBE!Youneed2pibondstoformanitrilegroup.
[citation(b)]
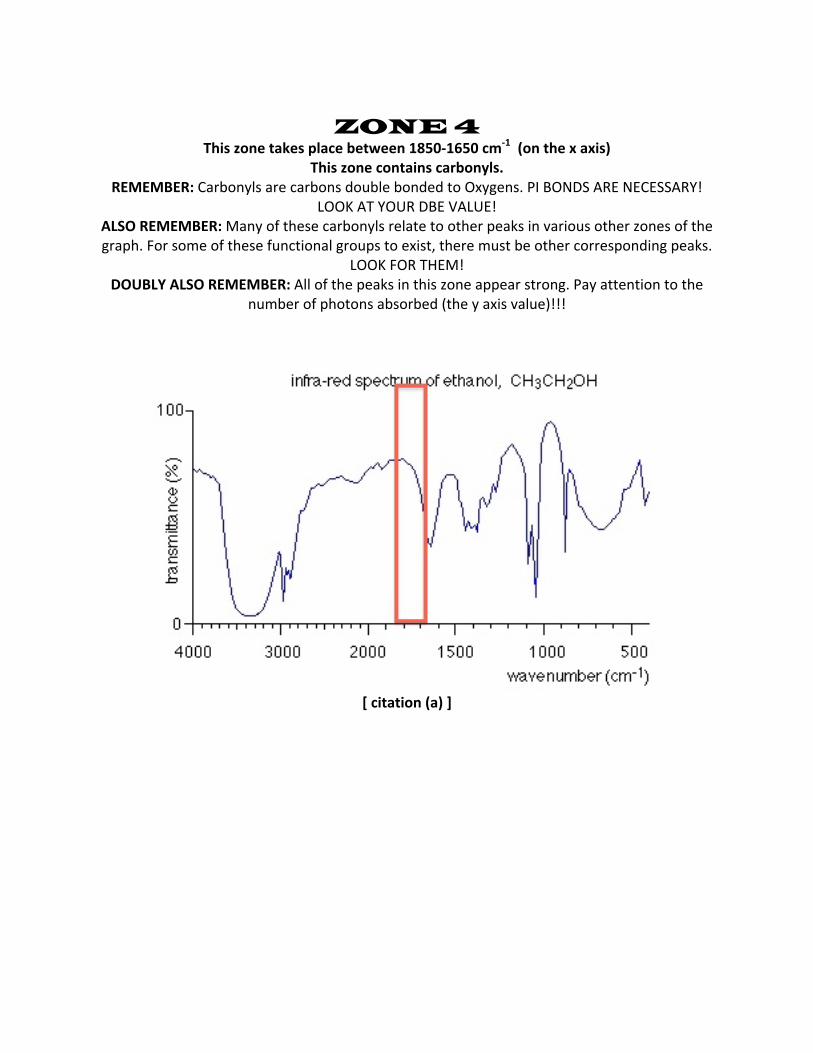
ZONE 4
Thiszonetakesplacebetween1850‐1650cm‐1(onthexaxis)Thiszonecontainscarbonyls.
REMEMBER:CarbonylsarecarbonsdoublebondedtoOxygens.PIBONDSARENECESSARY!LOOKATYOURDBEVALUE!
ALSOREMEMBER:Manyofthesecarbonylsrelatetootherpeaksinvariousotherzonesofthegraph.Forsomeofthesefunctionalgroupstoexist,theremustbeothercorrespondingpeaks.
LOOKFORTHEM!DOUBLYALSOREMEMBER:Allofthepeaksinthiszoneappearstrong.Payattentiontothe
numberofphotonsabsorbed(theyaxisvalue)!!!
[citation(a)]
T h e B r e a k d o w n
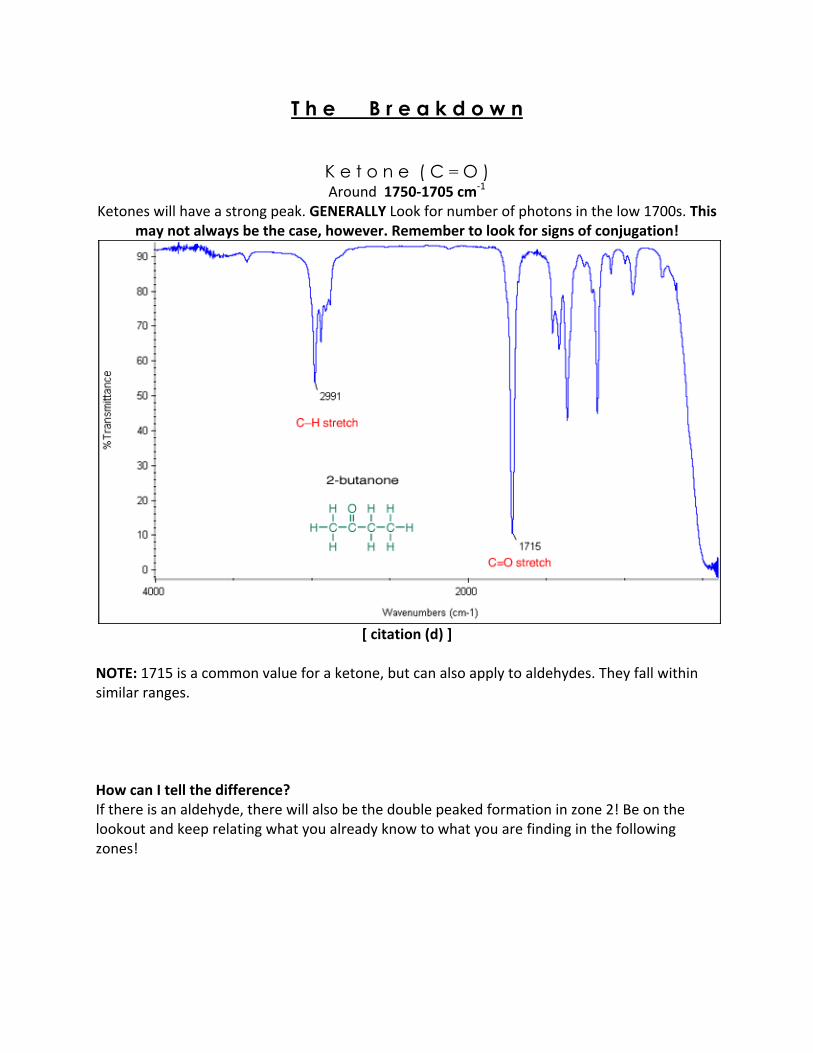
K e t o n e ( C = O ) Around1750‐1705cm‐1
Ketoneswillhaveastrongpeak.GENERALLYLookfornumberofphotonsinthelow1700s.Thismaynotalwaysbethecase,however.Remembertolookforsignsofconjugation!
[citation(d)]
NOTE:1715isacommonvalueforaketone,butcanalsoapplytoaldehydes.Theyfallwithinsimilarranges.HowcanItellthedifference?Ifthereisanaldehyde,therewillalsobethedoublepeakedformationinzone2!Beonthelookoutandkeeprelatingwhatyoualreadyknowtowhatyouarefindinginthefollowingzones!

A l d e h y d e ( C = O )
Around1740‐1720cm‐1Aldehydeswillhaveastrongpeak.Lookinthelow1700s,butGENERALLYclosertothe1720
range.Thismaynotalwaysbethecase,however.Remembertolookforsignsofconjugation!
Noticethealdehydepeakinzone2aswell!
[ProfessorStevenHardingerLectureSupplement]

E s t e r s ( C = O ) Around1750‐1735cm‐1
Esterswillhaveastrongpeak.Numbersaroundthe1740srangearetypical.Thismaynotalwaysbethecase,however.Remembertolookforsignsofconjugation!
[citation(d)]
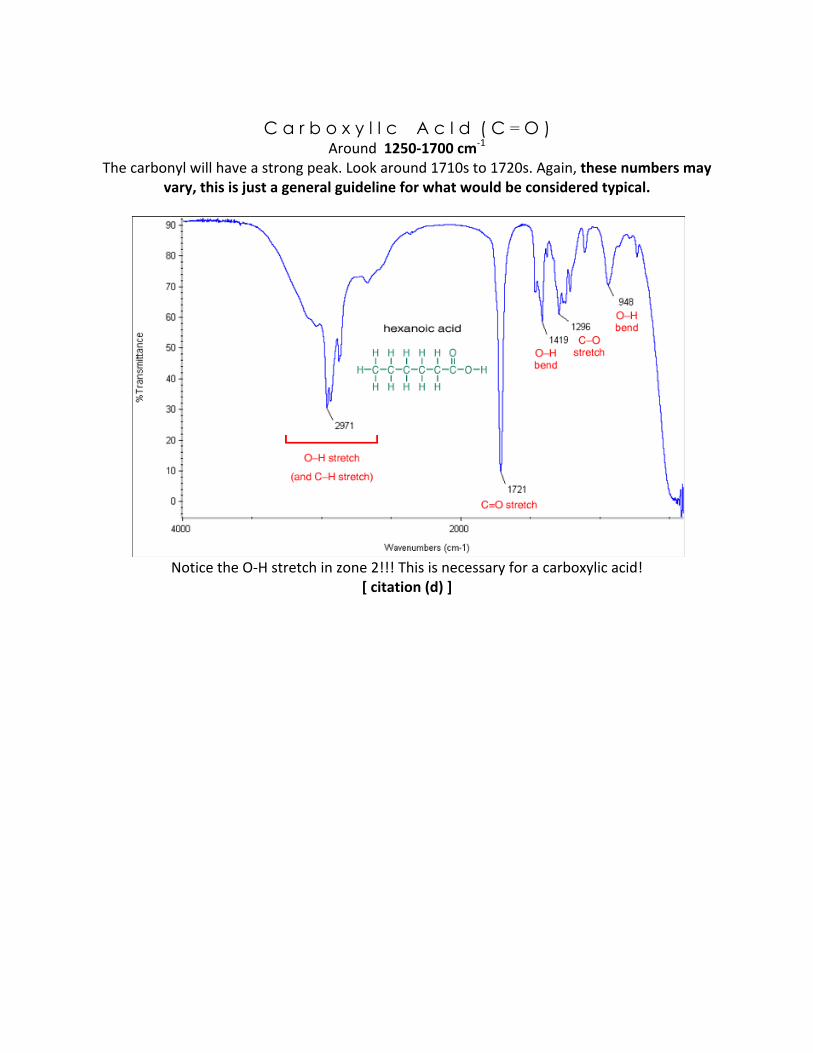
C a r b o x y l I c A c I d ( C = O )
Around1250‐1700cm‐1Thecarbonylwillhaveastrongpeak.Lookaround1710sto1720s.Again,thesenumbersmay
vary,thisisjustageneralguidelineforwhatwouldbeconsideredtypical.
NoticetheO‐Hstretchinzone2!!!Thisisnecessaryforacarboxylicacid!
[citation(d)]
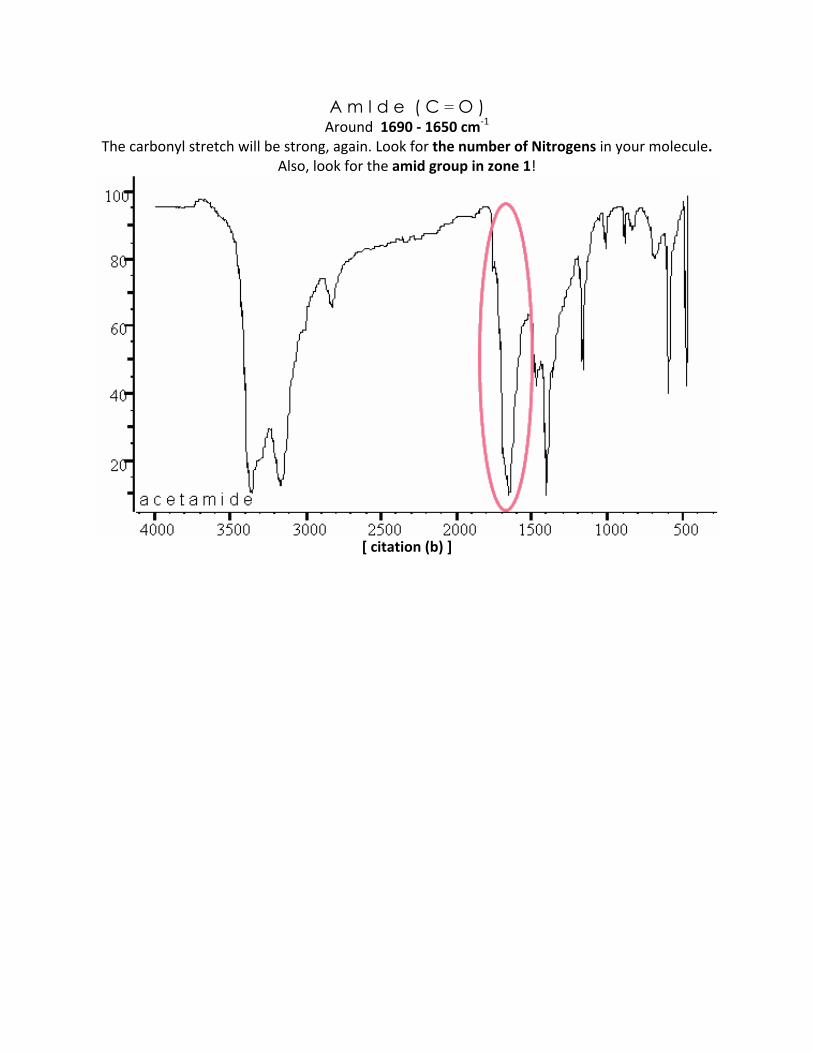
A m I d e ( C = O ) Around1690‐1650cm‐1
Thecarbonylstretchwillbestrong,again.LookforthenumberofNitrogensinyourmolecule.Also,lookfortheamidgroupinzone1!
[citation(b)]

ZONE 5
Thiszonetakesplacebetween1680‐1450cm‐1(onthexaxis)NOTE:Thiszoneincludesdoublebonds!LookatyourDBEvalues!!!
T h e B r e a k d o w n
A l k e n e ( C = C ) Around1680to1620cm‐1
Thispeakmayvary.Itmayhelptohighlightthisregiontobetterseethepeak.CheckyourDBEvalue!
[citation(d)]
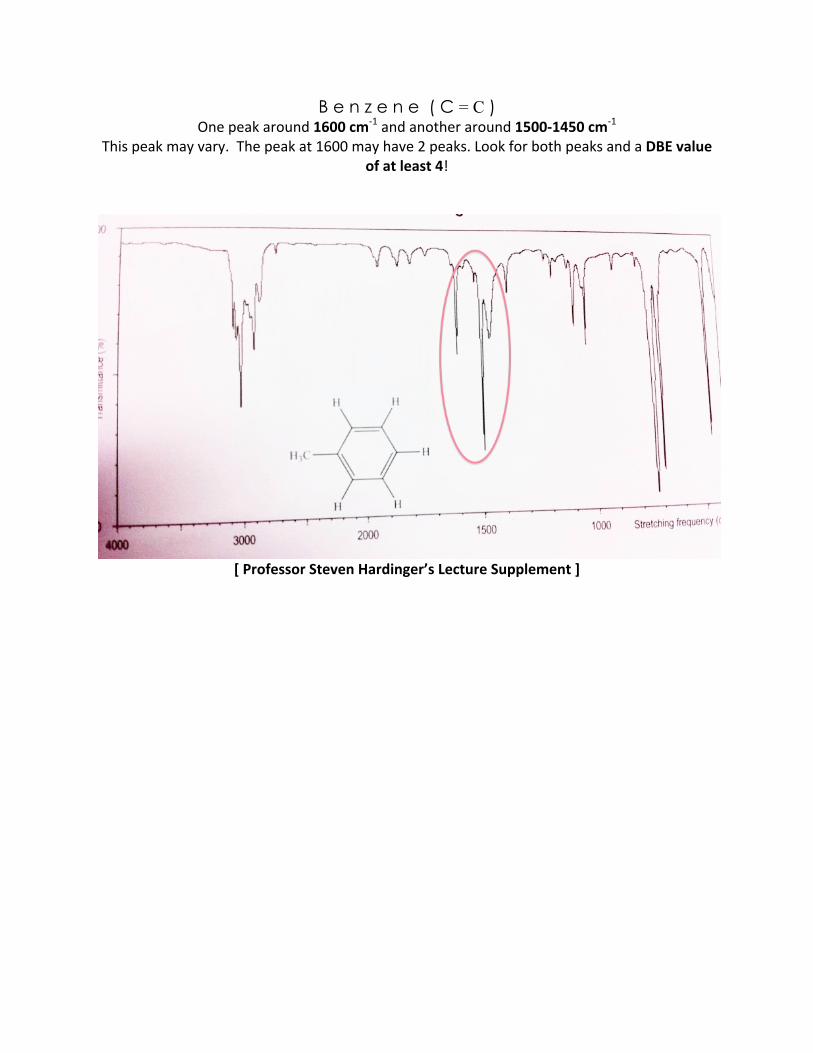
B e n z e n e ( C = C ) Onepeakaround1600cm‐1andanotheraround1500‐1450cm‐1
Thispeakmayvary.Thepeakat1600mayhave2peaks.LookforbothpeaksandaDBEvalueofatleast4!
[ProfessorStevenHardinger’sLectureSupplement]
Additional Notes
BEWAREOFCONJUGATION!!!We remember that conjugation lowers the energy of a molecule. This implies in reading IRgraphsaswell. If functionalgroupsareconjugated, thepibondcanwill lower the stretchingfrequency. More conjugation leads to A lower stretching frequency. You can suspectconjugationwhenpeaksareatthelowerendoftheirrange.HIGHLIGHTTHEZONES!!!When getting used toworkingwith the different zones, itmay be helpful to color code thezonessoyoucanzeroinonspecificareasanddifferentiatepeaksthatway.DON’TWORRYABOUTMEMORIZATION!!!ThetableofzonesandstretchingfrequencieswillbegiventoyouonatestREMEMBERYOURDBEVALUES!!!Pibondingisessentialindeterminingandrulingoutcertainfunctionalgroups.ALWAYSREFERBACKTOTHEFORMULA!!!Iftheformulaisgiventoyou,remembertoreferbacktoit.ThisformulagivesyouESSENTIALinformationontheatomsinvolvedinthemolecule.
Work Cited
(a) Clark,Jim."InterpretingInfra‐redSpectra."InterpretingInfraredSpectra.2000.Web.11May2012.<http://www.chemguide.co.uk/analysis/ir/interpret.html>.
(b) Glagovich,Neil."InfraredSpectroscopy."CHEM316.2012.Web.11May2012.<http://www.chemistry.ccsu.edu/glagovich/teaching/316/index.html>.
(c) Matt."InfraredAbsorbanceSpectroscopy(IR)."MendelSet.Mendelset,19July2011.Web.11May2012.<http://www.mendelset.com/articles/686/infrared‐absorbance‐spectroscopy‐ir>.
(d) "IRSpectroscopyTutorial."IR:CarboxylicAcids.UniversityofColorado,Boulder,ChemistryandBiochemistryDepartment,2011.Web.11May2012.<http://orgchem.colorado.edu/Spectroscopy/irtutor/carbacidsir.html>.
(e) "ChemWiki:TheDynamicChemistryTextbook."ChemWikiDavis.UniversityofCalifornia,Davis,7Oct.2011.Web.11May2012.<http://chemwiki.ucdavis.edu/>.
(f) ProfessorStevenHardinger’sLectureSupplement(g) ProfessorStevenHardinger’sThinkbook