gesture-based continuous authentication for wearable ... · pdf filegesture-based continuous...
TRANSCRIPT

Gesture-based Continuous Authentication for Wearable
Devices: the Google Glass Case ∗
Jagmohan Chauhan1,2, Hassan Jameel Asghar1, Anirban Mahanti1,Mohamed Ali Kaafar1
1National ICT Australia, NICTA, Australia
{Jagmohan.chauhan,hassan.asghar,dali.kaafar,anirban.mahanti}@nicta.com.au2Department of Electrical Engineering and Telecommunications,
UNSW, Sydney, Australia
May 10, 2016
Abstract
We study the feasibility of touch gesture behavioural biometrics for implicit authenticationof users on wearable devices like Google Glass. While such implicit authentication systems havebeen proposed for smartphones, it is unclear whether they are also accurate and computation-ally efficient on wearables such as Glass. For example, the small form factor of Glass introducesconstraints such as small touchpad area, high heat dissipation and smaller battery. To assessfeasibility, we design and implement a continuous authentication system on Glass using two clas-sifiers, SVM with (Gaussian) radial basis function (RBF) kernel, widely employed for continuousauthentication on smartphones, and a new classifier based on Chebyshev’s concentration inequal-ity. The reason for proposing a new classifier is the recurrent observation in recent works on touchgesture based implicit authentication that a block of consecutive gestures is better in classificationaccuracy than a single gesture. This implicitly uses the assumption that the average of featuresfrom a block of gestures is much more likely to be concentrated around the mean. We observethat this assumption is made mathematically exact by concentration inequalities involving sumsof random variables, of which Chebyshev’s inequality is a particular case. We therefore constructa classifier based on this inequality, and show that it achieves comparable accuracy to SVM withRBF kernel. Overall, our experimental results based on data collected from 30 volunteers showthat touch gesture based authentication is feasible both in terms of classification accuracy andcomputational load on wearable devices. Our results show classification accuracy of up to 99%with only 75 training samples using behavioural biometric data from four different types of touchgestures. To show the generalizability of our proposed system, we also tested the performanceof Chebyshev and SVM classifier on smartphones and found the accuracy to be similar to Glassdespite the smaller training size. Finally, our experiments regarding permanence of gestures showsthat the negative impact of changing user behaviour with time on the accuracy of the classifiercan be alleviated by adapting classifier to the newly available training data continuously.
1 Introduction
Current estimates predict that more than 250 million smart wearable devices will be in use by 2018 [1].Today’s wearable market consists of fitness trackers, smartwatches, smartglasses, etc. The wearable
∗ This is the full version of the paper titled Gesture-based Continuous Authentication for Wearable Devices:The Smart Glasses Use Case, accepted for publication in ACNS 2016.
1
arX
iv:1
412.
2855
v8 [
cs.C
R]
9 M
ay 2
016

market is currently in its infancy and is expected to grow at a staggering pace over the next decade.However, for wearables to become a dominant force in the coming years a number of challenges need tobe addressed. Security is one key challenge as wearable devices would likely store sensitive informationsuch as users’ activities and personal health information.
A secure and usable authentication mechanism to restrict access to unauthorized users is a basicrequirement for wearable devices. A straightforward solution is entry-point authentication relyingon personal identification numbers (PINs), passwords or graphical patterns [2]. Every time the userintentionally locks the device or leaves it idle for a (brief) time period, entry-point authentication isrequired to unlock the device. However, frequently prompting the user for entry-point authentication isundesirable as it not only leaves the PIN, password or pattern more susceptible to shoulder-surfing [3,4]and smudge attacks [5], but it also potentially disrupts user’s activities [6, 7]. In fact, to avoid suchinconvenience majority of users do not enable entry-point authentication in the first place. A recentsurvey found that up to 64% of US smartphone users do not use a screen lock on their smartphones [8].Moreover, in comparison to smartphones, unlocking patterns on wearable devices such as the GoogleGlass1 are more vulnerable to shoulder-surfing since the Glass touchpad is easily observable from adistance.
A better alternative is to use implicit and continuous authentication system on the device. Thesystem is called implicit because of its ability to authenticate users based on the actions they wouldcarry out anyway while using the device, which in our case is using the touchpad. The system iscontinuous because it runs in the background without disturbing the user, performs authenticationwhenever user carries out a certain action. The system only asks the user to prove their identity if anintrusion is detected. Provided the continuous authentication method is reliable, this approach reducesthe number of times a legitimate user needs to undergo entry-point authentication. Continuous au-thentication methods are mostly based on behavioural biometrics, as the requirement for implicitnessoften forbids the use of physiological characteristics. For instance, authentication using fingerprintswill suffer from the same problem of frequent prompts.2 Continuous authentication typically consistsof a training phase (or the setup phase) and a testing phase (or the authentication phase). Duringtraining, data pertaining to a specific behavioural biometric, such as typing and voice call patterns, isused to model the legitimate user. Upon authentication, samples from the same behavioural charac-teristics belonging to the user currently using the device are compared against the training model ofa target user to decide whether it is the same user or not. Many continuous authentication schemeshave previously been proposed in the literature for smartphones [4, 10–12].
However, being specifically designed for smartphones, these continuous authentication schemes donot explicitly consider the small form factor of wearables such as Glass in their design. For instance,due to the smaller touchpad size on Glass compared to smartphones, touch gesture based continuousauthentication techniques studied in the context of smartphones (e.g., [4,12–14]) may not yield similarperformance on Glass; a smaller touchpad is likely to show less variation in gestures across differentusers. Other important issues that arise due to small form factor include high heat dissipation andsmaller battery. Previous research shows that running computationally expensive applications runthe risk of high device temperature and high battery usage on Glass [15].
In this paper, we assess the feasibility of continuous authentication on Glass in terms of classifica-tion accuracy and computational load. Towards this goal, we propose a behavioural biometrics basedcontinuous authentication system for Google Glass relying on users’ touch gestures on the device’stouchpad. We model a touch gesture as one or more forces applied on the touchpad by the user’sfinger over the duration of the gesture and use the magnitude and direction of these forces over timeto build our feature space. To authenticate the user, we use two different classifiers based on these fea-tures: the first classifier is support vector machine (SVM) with Gaussian radial basis function (RBF)
1http://www.google.com.au/glass/start/2State-of-the-art fingerprint readers are only accurate if the user’s finger is placed and held for a brief period of time
(violating the principle of implicitness) [9]. Moreover, an implicit reader needs a touchpad equipped with fingerprintsensors which is not the case with commodity wearables. Likewise, certain other physiological characteristics, such asECG, have the potential to be used for implicit authentication, but they require specialized hardware.
2

kernel which is widely proposed for continuous authentication on smartphones, and the second, a newclassifier based on Chebyshev’s concentration inequality. The reason for introducing a new classifier isthat previous research on touch gesture based continuous authentication on smartphones has shownthat during testing (authentication), instead of using features from a single sample of a gesture, usingfeatures from a block of samples of the gesture shows improved classification accuracy [11, 12, 16].That is, the average reading of the feature over the block is used as a single instance for input to theclassifier. We note that this observation implicitly uses the assumption that the average value of afeature over a block is more likely to be concentrated around the mean. The justification of this comesfrom concentration inequalities in probability theory, which give probabilistic bounds on the deviationof the sum of random variables from its true mean. This led us to the use of one such concentrationinequality, the well known Chebyshev’s inequality, and we propose the Chebyshev classifier as a result.
Experiments based on collecting data from 30 volunteers, show that using gestures to continuouslyauthenticate Google Glass is feasible in terms of the trade-off between false positives and false negativesusing both the Chebyshev classifier and SVM with RBF kernel (henceforth simply referred to asSVM).3 We found the classification accuracy of both classifiers to be comparable. The advantage ofthe Chebyshev classifier over SVM however is that it is easier to implement as it does not requireexternal libraries. The high accuracy of our system can be attributed to the identification of a set ofeffective features that can be captured through the touch sensors of Glass and that contain peculiarbehavioural characteristics of the user. One notable feature is the magnitude of the force applied onthe touchpad, which when represented as a time series significantly contributes to high accuracy. Tothe best of our knowledge, we are the first to study the feasibility of touch gesture based continuousauthentication for smart glasses. Note that although at this time Glass is a discontinued product, webelieve our work is still relevant due to three main reasons: (a) there are indications that Glass willbe revived soon;4 (b) there are other smartglasses in the market that are equipped with touchpads,namely RECON, SiME, GlassUP, ORA-S and Icis, (c) although our continuous authentication schemeis proposed for Google Glass, it is generic enough to be extendible to other wearables containing atouchpad or in general any device equipped with a touchpad, such as smartphones or laptops. In fact,we verified the generality of our scheme by running it on publicly available smartphone touch datawhich yielded highly accurate results.
The remainder of this paper is organised as follows. Section 2 discusses related work. Section 3contains a brief background on Google Glass as well as the definitions of important terms used inthis paper. Section 4 describes the proposed system which includes the design goals, architecture, thedata collection process, theoretical model of gestures along with the features extracted from them andfinally, the classifiers. In Section 5, we discuss the evaluation results of our continuous authenticationsystem. The paper concludes with discussion of limitations of our work in Section 6 and closingremarks in Section 7.
2 Related Work
Perhaps the first use of continuous authentication for computer security dates back to the use ofkeystroke dynamics to identify users using keyboards attached to desktop computers [17, 18]. In thecase of mobile devices, various behavioural characteristics have been proposed for authentication suchas location patterns [19], app usage [20], and skin or clothing color [21] (using built-in cameras). Asour focus is on gesture-based continuous authentication on wearables, specifically Google Glass, werestrict the ensuing discussion to closely related work on finger movement pattern based continuousauthentication on smartphones.
Li et al. proposed a continuous authentication scheme for smartphones based on sliding and tapgestures [11]. They distinguish between the portrait and landscape modes of the touchscreen, andemploy features extracted from user gestures such as the position and area of first touch, duration
3The dataset will be available for download at the time of publication.4http://www.theverge.com/2015/11/27/9808016/google-glass-patent-wearable-flexible-band
3

of slide, and average curvature of slide. Likewise, Hui et al. [4] used different touch operationssuch as keystroke, slide, pinch and handwriting to create a continuous authentication scheme onsmartphones. They collected and tested data from 31 individuals and showed that the slide gestureis the best in uniquely classifying users, while handwriting performs the worst from a classificationaccuracy perspective. Similarly, Frank et al. [12] proposed a gesture-based continuous authenticationsystem using a set of 30 touch-based features and tested it on 41 users. Their classifier is able toachieve a median equal error rate of 0% within the same usage session and 2-3% across differentsessions. Other continuous authentication systems include SilentSense [14] where finger movementsand user motion patterns are used. SilentSense uses SVM to achieve 99% accuracy by using threetouch operations in series on Android-based smartphones. LatentGesture [13] is another touch-basedcontinuous authentication system for smartphones and tablets. With a user base of 20 volunteers, theproposed mechanism achieves an accuracy of 97.9% on smartphones and 96.8% on tablets using SVMand random forest classifier.
Khan, Atwater and Hengartner [22] compared six different continuous authentication schemes on300 users. The study revealed many interesting results. Existing schemes are practical with lowoverhead and fast detection; touch based data should be augmented with keystrokes; devices need notbe rooted to use continuous authentication schemes as application-centric schemes can be deployedon phones. Their findings also revealed that mimicry attacks on continuous authentication schemesare possible. A comparison of different classification algorithms used in gesture-based continuousauthentication systems was presented by Serwadda, Phoha and Wang [16] using 190 human subjects.The different classification algorithms evaluated were: linear regression, SVM, random forest, naiveBayes, multilayer perception, k-nearest neighbour, Bayesian network, scaled Manhattan, Euclideanand J48 [16]. The authors found linear regression and SVM to provide the best performance. Sae-Baeet al. [23] developed an algorithm to generate and verify 22 special touch gestures for authenticationby exploiting the movement characteristics of the palm and fingertips of the users on an iPad. Theyachieved 1.28 % EER using k-NN classifier. Zhao et al. [24] used graphical touch gesture features ofthe users to formulate a statistical touch dynamics image (a kind of statistical feature model) for userauthentication on smartphones. In other work, Marcos et al. [25] studied a few pattern recognitionalgorithms such as vector quantization, nearest neighbour, dynamic time warping and hidden Markovmodels for online signature recognition on a database of 330 users.
Existing continuous authentication research on smartphones shows that the general idea is feasibleand deployable on smartphones. In this work, we assess the feasibility of continuous authenticationon wearables by developing a touch gesture based continuous authentication scheme on Google Glass.
3 Background
We provide a brief overview of Google Glasses and then present the terminology used in this paper.
3.1 The Google Glass
Google Glasses, as shown in Figure 1a, contain an optical display mounted on the lens. The displayis a small screen (cf. Figure 1b) which users can navigate either using voice commands, such as ‘okglass,’ or using fingers to tap or swipe on the touchpad located on the side. Users can swipe forwardor backwards to navigate through apps, and alternatively open an app through a tap. Downwardswipes are reserved for cancelling an action or closing an app. Swipes can be performed via one, twoor three fingers. Apart from the tap and swipe gesture, there is also a pinch gesture which can beused to zoom in or out while browsing a website, for instance. The Glass contains built-in gesturebased entry-point authentication which can be enabled through the settings. To use this feature, theuser needs to register a pattern which consists of a series of four gestures. The allowable gestures aretap, forward and backward swipe.
4

(a) Frame (b) Display
Figure 1: The Google Glass (images courtesy of Wikipedia and Google).
3.2 Definitions
For the rest of this paper, a touch gesture or simply a gesture is defined as a tap or a swipe with onefinger on the touchpad. The touchpad is the area of the Glass which is used for interaction throughgestures. For each gesture, the Glass touchpad records a set of data, such as the point of contactwith the touchpad, pressure on the touchpad, etc. The set of data belonging to one gesture is calleda sample. A sample contains one or more subsets of data, called readings, which correspond to datarecorded at different discrete time intervals during the duration of a gesture. Thus, we may say ‘thefirst and second readings of the sample’ to refer to the touch event readings at timestamps 1 and 2,respectively. Each reading contains data corresponding to one or more variables called features. Adistinguishing feature is a feature that is unique to a user. In other words, it is a characteristic thatdefines a user.
In our system, the authentication mechanism takes as input a set of gestures and either (implicitly)accepts or rejects the user depending on whether or not it matches the gestures of the target user. Thetrue positive rate (TPR) is defined as the fraction of times the target user has been correctly accepted.False positive rate (FPR) is defined as the fraction of times the attacker is (wrongly) accepted as thetarget user. Equal error rate (EER) is defined as the rate at which 1 − TPR = FPR. This is widelyused as a performance measure of biometrics-based authentication systems. A related measure is theaverage error rate (AER), which is defined as 1
2 (1 − TPR + FPR). This is useful when the EER isnot known. Receiver operating characteristic (ROC) is a curve that shows the trend of TPR againstFPR. Variability in these measurements is introduced by changing different parameter values of theauthentication system. In general, there is a trade-off between TPR and FPR, and the EER can beused as an indicator of the balance between TPR and FPR.
4 Continuous Authentication for Google Glass
4.1 Design Goals
We expect the following objectives to be achieved by our continuous authentication system:
– Unobtrusive: The system should be able to run without causing any distraction to the userunless required.
– Continuous: The system should run continuously on the device while it is being used and comesinto action when a gesture is given to the system.
– Accurate: The system should achieve high accuracy and detect unauthorized access using theleast number of gestures.
– Efficient: The system should be computationally efficient with low battery use and minimal heatgeneration.
4.2 Architecture
The proposed system architecture, as shown in Figure 2, has a training and a testing phase. A numberof modules are common to both phases. The system first listens for gesture events that are triggered
5

Gesture event
listener
Gesture identifier
Elementary feature
extractor
Derived feature
extractor
Classifier: Model
generator
Classifier:Predictor Attack?
Notify user
Training and Testing
Training
Testing
Gesture event
Rawdata
Basicfeatures
YesFeature
postprocessorDerivedfeatures
Basic features
features
Figure 2: System Architecture
whenever the user performs gestures on the touchpad while carrying out normal tasks on Glass. Oncean event is triggered, elementary features such as the start point and end point of gestures and pressureexerted on the touchpad are extracted from the gestures. From the start and end points of the gesturethus obtained, the particular gesture type (tap, forward, backward or downward swipe) is identified,after which higher-level features belonging to the gesture, e.g., force exerted on the touchpad, arederived through these basic features. Some of the features in our system are derived as a function oftime and require further processing for consistent inter-comparison. After going through this post-processor, our system feeds the resulting features to the classifier. During training, the classifiergenerates different classification models for different gesture combinations. During the testing phase(also known as re-authentication), real-time gesture data from the current user is processed to obtainthe feature sets as above, which are then fed to the classifier for prediction. The predictor uses theappropriate classification model on the basis of the gesture combination employed to predict if thegestures are coming from the legitimate user or an attacker.
There are potentially three different approaches to implement the training (model generation) andthe predictor (testing) component:
– Training is done on Glass to create different classification models and then the predictor com-ponent on the Glass can use the appropriate model for prediction.
– Training on the Cloud and prediction on Glass using the precomputed models downloaded fromthe Cloud.
– Both training and prediction can be done on the Cloud with prediction results being sent toGlass in real time.
For the SVM based classifier used in our study, we consider the second approach as it is the leastdemanding in terms of processing and connectivity requirements, suitable for wearables like Glass.For the Chebyshev classifier, we use the first approach as its model generation only takes tens ofmilliseconds.
4.3 Data Collection
Our study focused on collecting data for four important gestures available in Google Glass: tap,forward swipe, backward swipe, and downward swipe. The user has to use these gestures to operateGlass unless they are using the voice enabled commands. Glass is equipped with the Synaptics T1320touchpad. The touchpad’s x-axis spans the range [0, 1366] and the y-axis is in the range [0, 187]. Wecollected gesture data using a background data collection process. Data was collected on Google Glassversion 18.1 that uses the Android operating system. Like other Android devices, Glass depends onthe Linux kernel for core system services including hardware drivers. In case of a touch gesture event,the touchpad captures the raw data and sends it to the Linux kernel. The kernel packages the raw dataand sends it to the Android library at the upper layer. As we wanted our data collection approach tobe application-agnostic and unobservable to the user, we decided to read the raw touch data valuesfrom the corresponding touchpad device file /dev/input/event3 at runtime. The raw data supplied
6

by the kernel follows the Linux multi-touch protocol [26]. The touch (gesture) information is sentsequentially as separate packets of ABS MT type events. A multi-touch ABS MT packet on Glass lookslike:
0003 0039 00000000
0003 0037 00000000
0003 003a 00000047
0003 0030 00000003
0003 0031 00000002
0003 0034 00000000
0003 0035 00000351
0003 0036 00000066
0000 0002 00000000
0000 0000 00000000
The first byte, i.e., 0003, indicates that it is an ABS MT event. The second byte describes thedata type, e.g 0039 is the ABS MT TRACKING ID which is used to distinguish the number of fingersperforming the gesture. On Glass, this number can be 0, 1 or 2 as it recognises gestures with one, twoor three fingers. 0037 corresponds to the TOOL TYPE which is the finger in our case. 003a indicatesPRESSURE; 0030 and 0031 correspond to the major and minor touch area on the Glass touchpad; 0034shows the orientation; 0035 and 0036 describe the x and y coordinate of the touched area on thetouchpad. Event type 0002 is followed by the event type 0000 which indicate the completion of areading in a sample of a gesture. These two events are of type SYN and follow one after the other.A sample/gesture is said to be complete when two consecutive SYN arrive. The reader can comparethis with the ABS MT packets for Android based smartphones reported in [11]. The type of gesture isdecided by the movement and direction of user’s finger.
We programmed a background process to read the touchpad device file and write the contents toa separate file. A separate file was maintained for each user. We selected 30 volunteers from differentage groups and genders and asked them to use Google Glass for a few hours. More specifically, the30 volunteers consisted of 8 females and 22 males within the 18-45 age bracket. All were colleaguesand students with a computer science background. The users were free to explore Glass as they liked.They could browse the web, take pictures, use the e-mail app, or any application installed on thedevice. Since at the time of our experiments, Google Glass was available as a limited experimentalrelease only, in contrast to user studies on smartphones, users in our study were not familiar with theGlass usage. As a result, they were given a short formal training as to how to operate Glass prior todata collection. Users were not required to use the device continuously. In a nutshell, we asked theusers to use the device in a natural way.
Based on this experiment, we were able to obtain more than 60 samples for taps and forwardswipes for each user as shown in Table 1. The data for backward and downward swipes was much lesson average, with the latter producing the least number of samples. Backward swipe can be used inplace of forward swipe to navigate in the opposite direction. This explains its relatively small usage.Moreover, downward swipes are mostly used for quitting an app, cancelling an action or returning tothe main screen. Therefore, the number of downward swipes obtained was lesser in number. Table 1shows the difference in samples across gestures. The forward swipe is the most used gesture, followedby the tap; downward swipe is the least used gesture. This shows that a normal usage of Glass willhave more taps and forward swipes as compared to the remaining two gestures. The forward swipe isalso the most frequently performed gesture with an average interval of 8 seconds followed by tap withan average interval of 13 seconds.
4.4 Gesture Model and Feature Extraction
In previous works, the standard way of extracting features from gestures is to analyse the data availablefrom the touch sensors and identify any distinguishing features by loosely modelling the gesture asa curve (in case of swipe) or as dwelling (in case of tap). We note that a clearer way of modelling
7

Table 1: Total number of samples, the average sample size per user, minimum sample size and averagetime to perform each gesture obtained for gestures in our user study.
Gesture Total Average Minimum Average
Tap (T) 4932 164.4 60 13Forward swipe (F) 7874 262.46 67 8
Backward swipe (B) 3257 108.56 37 17Downward swipe (D) 1525 50.83 11 32
Fz
R
Figure 3: The tap force.
gestures is to consider an imaginary force (or a collection of forces) that compels the user’s finger toslide or dwell on the touchpad for a brief period of time. Thus, we are essentially looking to measurethe magnitude and source of this force. Our main assumption is that the characteristic of this forceis different for each user. Obviously, we can only measure this force to the extent the available touchsensors allow (for instance, we only get readings at discrete time intervals). However, we believe thatthis way of modelling the gestures gives a better understanding of what type of features we are lookingfor and the relationship between features.
The touchpad is modelled as a rectangle R on a two dimensional xy-plane. The origin of R is thebottom-left corner. We distinguish between two types of gestures, tap (T) and swipe. Swipe is furtherdivided into forward (F), backward (B) and downward (D). We model each gesture as one or moreforces (exerted by user’s finger) acting over a duration of time (the course of a gesture). Our mainassumption is that the magnitude and source of these forces over the time duration of the gestureare characteristics of a user. We then measure the magnitude and source of these forces through thedifferent types of touch metrics available in the form of features. In the following, we show how tapand swipe can be modelled in this way, by identifying the different set of features.
4.4.1 Modelling the Tap Gesture
The tap is characterised by the force applied by the finger on the touchpad. This force, denoted Fz,acts downwards on R, i.e., along the z-axis. This is visualised in Figure 3. Our assumption is thenthat the magnitude and source of this force over the duration of tap are characteristics of a user. Bysource, we mean the point on R where the user taps.
To estimate the magnitude of Fz, we make use of the pressure P and area (size) A readings fromthe touch event. These two give the magnitude of the force as
Fz = PA. (1)
Note that the specific unit of force is irrelevant in our model as long as the definition of force isconsistent across different readings and users. The source of this force is estimated by the coordinates(x, y) of the tap point. Now, since the tap gesture is performed over a time interval, say ∆t, weare also interested in the change in magnitude of the force during this time. Figure 4 visualises thepossible shape of Fz over the duration of tap. As the user performs the tap, we would expect anincrease in the force applied which decreases after reaching a peak. We denote the magnitude of Fzover time as Fz(t), which is essentially a time series. Fz(t) can be calculated over discrete points t inthe interval ∆t through Eq. 1 given the corresponding pressure and area values. The tap duration,
8

∆t
Fz
t
Figure 4: The magnitude of the force curve Fz(t) over the interval ∆t.
Fz
R
Fxy
Figure 5: The two forces active during a swipe.
i.e., ∆t, is also considered a characteristic of Fz, and hence used as a distinguishing feature. Thesefeatures are summarized in Table 2.
4.4.2 Modelling the Swipe Gesture
For ease of presentation, we model a swipe as an upward swipe. With appropriate orientation trans-formation, the model will apply to other types of swipes. We model a swipe as two forces acting on Rsimultaneously. The first is Fz, the force acting downwards on R, as in the case of tap. The secondis a force acting along the xy-plane, denoted Fxy, along the direction of swipe. We assume then thatthe magnitudes and sources of these forces over the duration of swipe are characteristics of a user.These two forces are visualized in Figure 5.
To estimate the source of Fz, we use the start point (x0, y0) and the end point (x1, y1) of the swipe.The source of the force Fxy is estimated as the angle θ between the straight line joining these twopoints and the y-axis as shown in Figure 6. We acknowledge that these directions (sources) should bea function of time over the duration of the swipe. However, at present, we only model this averagenotion of source. To estimate the duration of the forces, in addition to the swipe duration ∆t, we alsoinclude the swipe length l, which is given by the length of the line segment between the start and endpoints of the swipe.
The magnitude of Fz is again estimated as the time series Fz(t), where individual values areobtained as the product of pressure and area (PA) values. The magnitude of Fxy is also modelled asa time series Fxy(t). The difference is that individual values of this time series are estimated throughthe magnitude of velocity at discrete time intervals. The magnitude of velocity between two adjacentpoints is calculated by computing the distance between the two points divided by the time difference.
Table 2 shows the list of features used for both gesture types. We differentiate between two typesof features, i.e., time-series based features and unitary features. The difference between the two isobvious.
4.4.3 Post-processing the Time Series
The time series for the magnitude of force (Fz(t) and Fxy(t)) requires some further processing toobtain consistent and comparable results across different readings. Figure 7 shows two time seriesof the downward force Fz(t) corresponding to two forward swipes from the same user. By lookingat the two, the following observations are evident: (a) the readings of the two time series are not
9

θ
Fxy(x1, y1)
(x0, y0)
R
Figure 6: The source of the force Fxy is estimated through the angle θ.
Table 2: List of Features.Gesture # Feature Symbol
Tap 1. tap point x-coordinate x2. tap point y-coordinate y3. downward force time series Fz(t)4. tap duration ∆t
Swipe 1. start point x-coordinate x02. start point y-coordinate y03. end point x-coordinate x14. end point y-coordinate y15. angle θ6. downward force time series Fz(t)7. planar force time series Fxy(t)8. swipe duration ∆t9. swipe length l
necessarily sampled at equal intervals. You can observe this by looking at the values within the intervalt ∈ [0.08, 0.10]; (b) there are gaps in the readings. For instance, observe the interval t ∈ [0.02, 0.04].Time series 2 does not have a sampled value nearby the third value of time series 1; (c) the two timeseries do not end at the same time. This is understandable as the time duration corresponds to theduration of the swipe which may not necessarily be the same across different swipes.
0.00 0.02 0.04 0.06 0.08 0.10 0.12 0.14 0.16 0.18t
0.000
0.005
0.010
0.015
0.020
0.025
0.030
0.035
0.040
0.045
Fz
series 1series 2
Figure 7: Two time series of the magnitude of force.
In order to get a consistent comparison of time series from different readings, we do the following:(a) we align the first sample of the two time series at time t = 0; (b) we resample each time series atintervals tint = 0.01. This is slightly lower than the system average which is normally around 0.012seconds. Resampling at a time instance t is done by joining two readings on either side of t via a
10
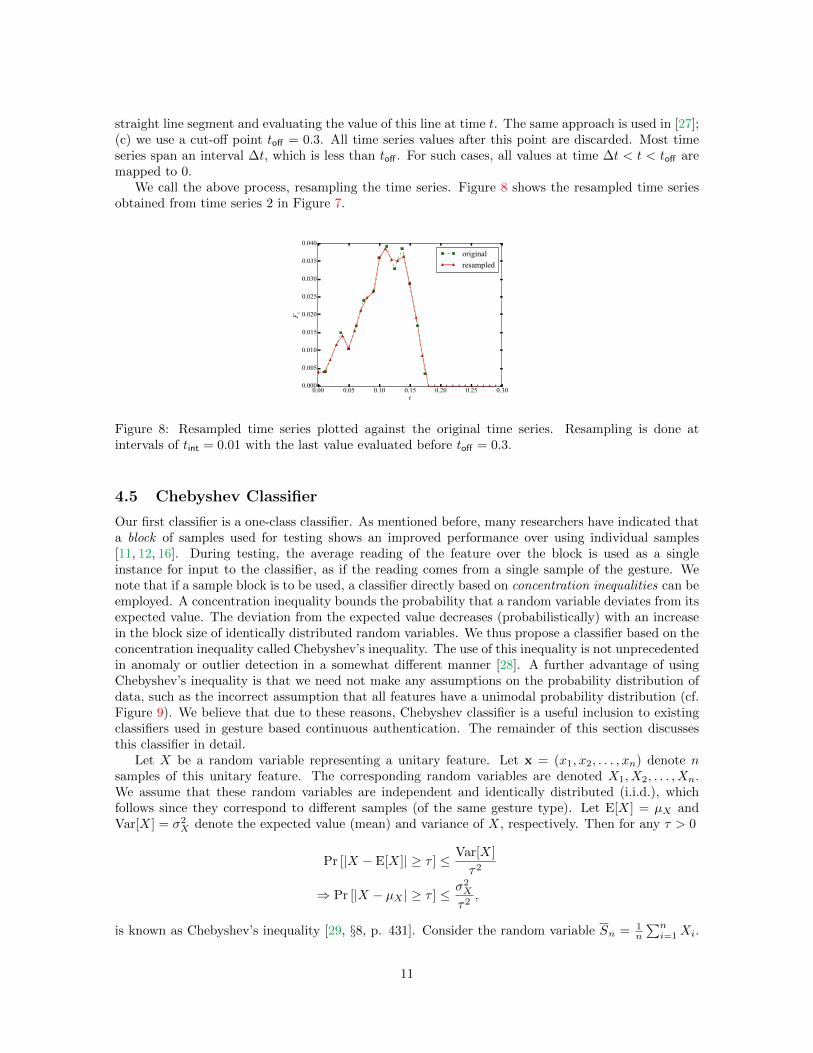
straight line segment and evaluating the value of this line at time t. The same approach is used in [27];(c) we use a cut-off point toff = 0.3. All time series values after this point are discarded. Most timeseries span an interval ∆t, which is less than toff . For such cases, all values at time ∆t < t < toff aremapped to 0.
We call the above process, resampling the time series. Figure 8 shows the resampled time seriesobtained from time series 2 in Figure 7.
0.00 0.05 0.10 0.15 0.20 0.25 0.30t
0.000
0.005
0.010
0.015
0.020
0.025
0.030
0.035
0.040
Fz
originalresampled
Figure 8: Resampled time series plotted against the original time series. Resampling is done atintervals of tint = 0.01 with the last value evaluated before toff = 0.3.
4.5 Chebyshev Classifier
Our first classifier is a one-class classifier. As mentioned before, many researchers have indicated thata block of samples used for testing shows an improved performance over using individual samples[11, 12, 16]. During testing, the average reading of the feature over the block is used as a singleinstance for input to the classifier, as if the reading comes from a single sample of the gesture. Wenote that if a sample block is to be used, a classifier directly based on concentration inequalities can beemployed. A concentration inequality bounds the probability that a random variable deviates from itsexpected value. The deviation from the expected value decreases (probabilistically) with an increasein the block size of identically distributed random variables. We thus propose a classifier based on theconcentration inequality called Chebyshev’s inequality. The use of this inequality is not unprecedentedin anomaly or outlier detection in a somewhat different manner [28]. A further advantage of usingChebyshev’s inequality is that we need not make any assumptions on the probability distribution ofdata, such as the incorrect assumption that all features have a unimodal probability distribution (cf.Figure 9). We believe that due to these reasons, Chebyshev classifier is a useful inclusion to existingclassifiers used in gesture based continuous authentication. The remainder of this section discussesthis classifier in detail.
Let X be a random variable representing a unitary feature. Let x = (x1, x2, . . . , xn) denote nsamples of this unitary feature. The corresponding random variables are denoted X1, X2, . . . , Xn.We assume that these random variables are independent and identically distributed (i.i.d.), whichfollows since they correspond to different samples (of the same gesture type). Let E[X] = µX andVar[X] = σ2
X denote the expected value (mean) and variance of X, respectively. Then for any τ > 0
Pr [|X − E[X]| ≥ τ ] ≤ Var[X]
τ2
⇒ Pr [|X − µX | ≥ τ ] ≤ σ2X
τ2,
is known as Chebyshev’s inequality [29, §8, p. 431]. Consider the random variable Sn = 1n
∑ni=1Xi.
11

Since the Xi’s are i.i.d., we have
E[Sn] =1
n
n∑i=1
E[Xi] =n
nµX = µX ,
and
Var[Sn] = Var
[1
n
n∑i=1
Xi
]=
1
n2Var
[n∑i=1
Xi
]=
1
n2
n∑i=1
Var[Xi] =n
n2σ2X =
σ2X
n.
Using Chebyshev’s inequality on Sn and the above two results, we get
Pr[∣∣Sn − E[Sn]
∣∣ ≥ τ] ≤ Var[Sn]
τ2
⇒ Pr
[∣∣∣∣∣ 1nn∑i=1
Xi − µX
∣∣∣∣∣ ≥ τ]≤ σ2
X
nτ2, (2)
for any τ > 0. A qualitative explanation of this inequality is that as n increases, the average of a
sample is more likely to be concentrated around the mean. Now, let ρ =σ2X
nτ2 . Rearranging we get
τ =σX√nρ
(3)
By specifying a value of ρ in the above equation, i.e., a bound on probability, we can obtain acorresponding threshold τ . This then gives us a straightforward classification method for features:Given a sample x′1, x
′2, . . . , x
′n, purported to be generated from the same distribution as X, we calculate
the sample mean and see if this lies within the threshold τ determined by ρ. If yes, then the sampleis classified as belonging to the target user; otherwise it is rejected.
A number of interesting observations are in order:
– By varying ρ we can correspondingly change the threshold. A high value of ρ, say 1.0, impliesa low value of τ , which in turn means that there may be more false negatives. A lower value ofρ results in a higher value of τ , which may include more false positives. Note further that sinceρ is a bound on probability, it does not necessarily have to be less than or equal to 1.
– The above result is independent of the particular probability distribution of X, as long as themean and expected values are finite. This is important since through our study we saw that notall feature data can be modelled as a simple unimodal probability distribution. As an example,Figure 9 shows the y-coordinates of the end point of a downward swipe.
– As n grows, the accuracy of the classifier increases, since the probability that the sample is awayfrom the mean decreases. Thus, we can use tighter values of the threshold τ for higher valuesof n.
– Inequality 2 gives an upper bound on the true positive rate for a given feature. Thus, forinstance, if we want the true positive rate to be at least 0.8, we can set ρ to be 0.2, and we willget a true positive rate of more than 80 percent. However, we cannot say the same for the falsepositive rate as this depends on the deviation of inter-user data.
– The above result assumes that we know the mean µX and variance σ2X of X. In practice we can
only deduce these through the training data. Thus we approximate µX and σ2X as the training
mean and variance, respectively.
Similarly, for a time-series based feature we can use this classifier with slight modification (seeAppendix A).
12

100 110 120 130 140 150 160 170 180 190y
0
5
10
15
20
25
Fz
Figure 9: Histogram of the y-coordinate of the end points of downward swipe of one user. One cansee that the distribution is likely bimodal.
The essential difference is that since a sample of a time series-based feature consists of a vector ofvalues (each belonging to a unique time interval), we also need to calculate the covariance betweenelements of this vector when calculating sample variance. Thus given an n-element sample x =(x1, x2, . . . , xn) and the parameter ρ, we have the Chebyshev feature classifier f(x, ρ) which outputs1 if the sample belongs to the target user and 0 otherwise. To make an overall decision given samplesfrom a set of m features χ = {x1, . . . ,xm}, we have the following classifier, which we call the Chebyshevclassifier :
g(χ, ρ, ε) =
{1, if
∑mi=1 f(xi, ρ) > εm
0, otherwise(4)
We call ε the decision threshold and εm the decision boundary. Through our experiments we foundε = 2
3 to give the best EER.
4.6 SVM Classifier
The SVM classifier works by dividing data into classes based on a dividing hyperplane (boundary) ora set of hyperplanes whose margins are maximised. Once such a boundary, is found, any unlabeledsample can be classified according to which side of the boundary it lies in. In our case, we used theGaussian radial basis kernel function (RBF) kernel as implemented in the LIBSVM library [30] withtwo classes.
To construct the feature space for SVM, we represented the time series based features as toff
tint= 30
dimensional vectors. The whole feature space of the SVM is then a vector of all unitary features andtime series based features represented in the aforementioned way. Constructed in this way, the SVMclassifier is given training data. To obtain the best classification results, we performed a grid searchwith 10-fold cross validation on the training data to find the optimal values for the parameters Cand γ. Here C > 0 is the penalty parameter and γ is the parameter for the RBF kernel. The gridranges from 2−5 ≤ C ≤ 217 and 25 ≤ γ ≤ 2−17. Notice that the training phase needs data both fromthe legitimate (target) user and other users (represented as the second class). As this type of datarepresents unbalanced data (more data from the second class), we used a weighted scheme SVM.
After a user model has been created by the SVM, the authentication phase or testing phase canbe carried out. Let χ be a set of samples of features to be tested against the user model, where weassume the sample size of each feature to be n ≥ 1. For each feature x ∈ χ with n samples denotedby x = (x1, . . . , xn), the average value 1
n
∑ni=1 xi is used in the final feature vector. Given the feature
vector thus obtained, the system outputs 1 if it believes the samples belong to the target user and 0otherwise.
13

5 Evaluation and Results
5.1 Experimental Setup
To evaluate the performance of our Chebyshev classifier against different number of users, we considerthree sets of users. The first set, denoted U1, and the second set, denoted U2, consists of 10 and20 users respectively. The third set, denoted U3, contains the whole set of 30 users employed in ourstudy. For all user sets, i.e., U1. U2, and U3, our experimental setup is as follows. To obtain theTrue Positive Rate (TPR), we randomly select a target user, and use a random set of 50 samplesfrom this user as the training set. The test set, i.e., the set used for authentication, consists of theremaining samples. Given a fixed value of n, a random sample of length n is obtained from the testset. The decision from the classifier is then logged. This process was repeated 500 times each with anew random target user. Note that due to randomness, the training set for the same user is differentover different trials. Finally, the number of times, out of the 500 tests, the target user was acceptedwas used to compute TPR.
To compute the False Positive Rate (FPR), again a target user was randomly selected and thetraining set was a random sample of 50. The classifier was then given a test sample from a randomattacker selected from U1 (respectively from U2, and U3), excluding the target user. The test samplewas of size n and selected randomly from all the samples of the attacker. This process was alsorepeated 500 times, each with a randomly chosen target user and a randomly chosen attacker. FPRwas calculated as the rate at which the attacker was accepted.
Since the number of available samples for all gestures were not the same (see Table 1), we useddifferent sizes of training sets for different types of gestures. The size of the training set for tap andforward swipe was 50, whereas backward swipe and downward swipe had training set sizes of 25 and10, respectively.5
For the SVM classifier we divided the pool of 30 users into three disjoint sets. The first set, labelledU1, consists of users for whom we had at least 75 samples for all gesture types and is fixed. Theseare identified as target users. The remaining 20 users are modelled as attackers and are assigned totwo sets labelled U2 and U3. U2 consists of 10 attackers while U3 consists of 20 attackers. For eachuser in U1, the training data consists of a random sample of a fixed size from the user’s data. Thisconstitutes positive samples for the target user required for binary class SVM training. The negativesamples for the target user came from the data of the remaining 9 target users in U1. That is, thedata from the remaining 9 users was used in the training phase to model the mock attacker. The dataof the users from U2 (U3) is used to test the false acceptance rate. Note that the assumption here isthat the users in U2 and U3 (modelling attackers) are much more likely to resemble the mock attackerwhose training data was obtained from the 9 users in U1. This assumption has been previously usedin [4].
5.2 Chebyshev Classifier Results
First we would like to empirically determine the decision threshold ε in Eq. 4. For this, we use theuser set U1, and choose tap and forward swipes as gestures for the Chebyshev classifier. Since tap andforward swipes have a total of m = 13 features (cf. Table 2), εm ranges from 6 (majority decision)to 12 (unanimous decision). We construct a ROC curve for each of these cases. For smaller valuesof n, we do not observe a noticeable difference in the curves. However, for larger values of n weobserve that majority decision does not produce the best possible results. Figure 10 shows the ROCcurves when n = 15. The different values of FPR and TPR are obtained by varying the probabilityparameter ρ from Eq. 3 from 1.00 to 0.1 with steps of 0.05. The dashed line in the figure is the linewith TPR = 1− FPR, which meets the ROC curve at the EER value.
5As shown in Table 1, one user had 11 downwards-swipes only. This was problematic as we would have only onetest sample for this user for testing downward-swipes. We excluded this user from the downward swipes evaluation.
14

0.0 0.2 0.4 0.6 0.8 1.0FPR
0.0
0.2
0.4
0.6
0.8
1.0
TPR
εm = 6εm = 7εm = 8εm = 9
εm = 10εm = 11εm = 12
Figure 10: ROC curves for different values of the decision boundary εm from the Chebyshev classifier.
Table 3: The decision boundary corresponding to the decision threshold ε = 23 for different combination
of gestures from the Chebyshev classifier.Combination dεme m
T 3 4F 6 9B 6 9D 6 9
T + F 9 13T + F + B 15 22
T + F + B + D 21 31
We notice significant difference in curves corresponding to εm = 6 and εm = 9. However, wedo not see any improvement with larger values. Since εm = 9 implies ε ≈ 0.69, we use the nearestapproximation ε = 2
3 and the decision boundary dεme for the Chebyshev classifier in Eq. 4. Thiscorresponds to the two-third majority rule. Table 3 shows the decision boundaries for various com-bination of gestures used in our experimental evaluation which are obtained by choosing ε = 2
3 . Thetable indicates that, for instance, if the gesture combination T + F is used for classification, then theChebyshev classifier g outputs 1 (accept) if the Chebyshev feature classifier f outputs 1 for 10 or morefeatures out of 13.
Next, we study the impact of n on the Equal Error Rate (EER). We expect the EER to improvewith increasing n. Figure 11 shows the EER for the combination T + F against different values of nwith the user set U1 (notice that there are n taps and n forward-swipes in each test sample). TheROC curves show improvement as n increases, starting with an EER of about 30% for n = 1 and anEER of around 3% for n = 25. The trend of improving EER with increasing n is shown by all gesturecombinations listed in Table 3. The same observation is valid for the sets U2 and U3.
Table 4 shows the EER for different values of n. We would like to emphasise that for a gesturecombination containing multiple gestures, e.g., T+F, we use the same value of n for each gesture typeonly for exploratory purposes. Hence, it is not required for the user to do a combination of exactly nsamples of each gesture in the gesture combination. In a real setting, our continuous authenticationcan kick in as soon as the gesture combination reaches a minimum of n samples of each gesture type(depending on which gesture combination is used). We observe that the tap gesture as a standalonegesture performs worse in terms of EER as compared to the swipes. The EER of the forward andbackward swipes are comparable, with forward swipes narrowly edging out. The downward swipeperforms worse than the other two swipe types, which is potentially due to fewer data points availablefor training. The EER deteriorates by 3 to 4 percent when using the data sets U2 (20 users) and U3
(30 users) as compared to data set U1 (10 users). However, we do not see a noticeable deterioration in
15

0.0 0.2 0.4 0.6 0.8 1.0FPR
0.0
0.2
0.4
0.6
0.8
1.0
TPR
n = 1n = 3n = 5n = 7
n = 10n = 15n = 25
Figure 11: ROC curves against different sizes of the test sample from the Chebyshev classifier. nrepresents the test sample size.
Table 4: EER for different gesture combinations and values of n from the Chebyshev classifier.Combination Set
nSet
nSet
n1 3 5 7 10 15 25 1 3 5 7 10 1 3 5 7 10
T U1 0.35 0.27 0.23 0.21 0.18 0.16 0.13 U2 0.38 0.32 0.25 0.23 0.19 U3 0.37 0.29 0.25 0.22 0.20F 0.32 0.23 0.15 0.14 0.12 0.07 0.07 0.35 0.23 0.18 0.16 0.13 0.33 0.25 0.18 0.18 0.14B 0.32 0.22 0.17 0.14 0.12 - - 0.34 0.26 0.21 0.18 0.16 0.36 0.28 0.24 0.22 0.19D 0.33 0.26 0.20 0.19 0.17 - - 0.32 0.26 0.20 0.18 0.17 0.34 0.23 0.20 0.20 0.14
T + F 0.29 0.18 0.14 0.09 0.09 0.05 0.03 0.33 0.21 0.16 0.13 0.12 0.32 0.20 0.18 0.14 0.10T + F + B 0.27 0.16 0.09 0.08 0.04 - - 0.30 0.17 0.13 0.11 0.07 0.30 0.22 0.15 0.10 0.07
T + F + B + D 0.25 0.13 0.09 0.07 0.03 - - 0.27 0.13 0.11 0.07 0.06 0.26 0.16 0.09 0.07 0.06
EER when comparing data sets U2 and U3, which suggests that adding more number of users to thesystem does not deteriorate the accuracy of the system by a huge factor. The high deterioration inEER observed between data set U1 and the larger data sets U2 and U3 might be due to the limited sizeof the touchpad of Glass. Indeed, as we shall show in Section 5.6, by using the same number of datasets of users on a smartphone, which comes with a larger touchscreen, we see no such deterioration.Our most important gesture combination is T+F since the bulk of activities on Glass can be performedby a combination of these two gestures. With n = 10 taps and forward swipes each, we get an EERof less than 10%. Due to the limited number of samples obtained in our study we could not extendour results for n = 15 and n = 25 beyond the combinations mentioned in the table.
A final important aspect to consider is the relationship of EER with ρ, the probability parameterin Eq. 3. Ideally, given n, we would be able to use a lookup table to determine the value of ρ thatgives the best performance. The value of ρ should also be independent of the number of users in theuser set to determine EER. Table 5 shows the intervals of ρ values giving the best tradeoff betweenTPR and FPR, i.e., EER, for different gesture combinations and user sets. Since we evaluated theclassifier at discrete ρ values (steps of 0.05), EER was obtained by interpolation; hence the use ofintervals. We can see that for each gesture combination and value of n, the intervals for sets U1 andU2 are either the same or adjacent. The slight difference might be due to the probabilistic nature ofthe simulations. It seems then that the ρ values are not significantly affected by the size of the testset. Since we did not have more data, we could not verify whether this result holds for larger testsets. As the three swipe types have the same set of features, we should expect optimum ρ intervalsto be the same for all swipe types for a given value of n. The table however suggests that this isnot the case. Although the intervals for forward and backward swipes are closer, those for backwardswipes are farther apart. This is most likely due to the difference in the sizes of the training sets forthe three gestures. A final observation is that as n increases the ρ value giving us the EER decreases.To conclude, for a given test set size, i.e., n, and a given gesture combination, we can use a ρ valuewithin the interval specified in Table 5, say the middle value, to obtain optimum performance for theChebyshev classifier.
16

Table 5: The interval of ρ values within which EER lies for different gesture combinations and valuesof n in the Chebyshev classifier.
Combination Setn
1 3 5 7 10 15 25
TU1 [0.45, 0.5] [0.3, 0.35] [0.2, 0.25] [0.15, 0.2] [0.15, 0.2] [0.1, 0.15] [0.1, 0.15]U2 [0.5, 0.55] [0.3, 0.35] [0.25, 0.3] [0.2, 0.25] [0.15, 0.2] - -
FU1 [0.75, 0.8] [0.5, 0.55] [0.35, 0.4] [0.35, 0.4] [0.3, 0.35] [0.25, 0.3] [0.15, 0.2]U2 [0.8, 0.85] [0.5, 0.55] [0.4, 0.45] [0.35, 0.4] [0.3, 0.35] - -
BU1 [0.7, 0.75] [0.4, 0.45] [0.3, 0.35] [0.25, 0.3] [0.2, 0.25] - -U2 [0.8, 0.85] [0.45, 0.5] [0.35, 0.4] [0.3, 0.35] [0.25, 0.3] - -
DU1 [0.5, 0.55] [0.3, 0.35] [0.2, 0.25] [0.15, 0.2] [0.15, 0.2] - -U2 [0.45, 0.5] [0.3, 0.35] [0.2, 0.25] [0.15, 0.2] [0.15, 0.2] - -
T + FU1 [0.8, 0.85] [0.5, 0.55] [0.4, 0.45] [0.35, 0.4] [0.25, 0.3] [0.2, 0.25] [0.15, 0.2]U2 [0.8, 0.85] [0.5, 0.55] [0.45, 0.5] [0.35, 0.4] [0.3, 0.35] - -
T + F + BU1 [0.8, 0.85] [0.5, 0.55] [0.4, 0.45] [0.35, 0.4] [0.3, 0.35] - -U2 [0.85, 0.9] [0.55, 0.6] [0.45, 0.5] [0.35, 0.4] [0.35, 0.4] - -
T + F + B + DU1 [0.75, 0.8] [0.5, 0.55] [0.4, 0.45] [0.3, 0.35] [0.25, 0.3] - -U2 [0.8, 0.85] [0.5, 0.55] [0.4, 0.45] [0.35, 0.4] [0.3, 0.35] - -
5.3 SVM Classification Results
The accuracy of the SVM classifier as measured by the average error rate (AER) is shown in Table 6.The classification accuracy is varied against two parameters: training size |T | and testing size n foreach gesture combination listed in the table. The training set size was varied from 25 to 75 at intervalsof 25. Note that AER for all gesture combinations decreases with increasing training size. This isbecause a larger training data set gives the classification algorithm more information for accurateprediction. However, this may also lead to overfitting, which is indeed the case with downwardswipe with training set of size 75. Overfitting makes the classification model specific to the trainingdata and hence may cause more errors in prediction. The AER of the SVM classifier also improveswith increasing number of test samples, i.e., n. The tap gesture performs the worst amongst all theindividual gestures and forward swipe outperforms all other gestures, which is consistent with theobservation from the Chebyshev classifier. As observed with Chebyshev classifier earlier, the AERdoes not significantly deteriorate with more number of users in the system (U3 against U2), whichsuggests that the feature model used in the proposed system is not highly susceptible to adding morenumber of users to the system. Recall that the set U1 is fixed, and the remaining two sets of users U2
and U3 contain users that are not present in U1. These are assumed to be belonging to the attackers.The scatter plot in Figure 12 shows the TPR and FPR values for training size 50 and varying
testing sample size (n) in the set {1, 3, 5, 7, 10}. The purpose of the figure is to illustrate the differencein accuracy related to different combination of gestures. We can see that the combination T + F+ B + D lies in a region of high TPR and low FPR as compared to the standalone tap gesture.As mentioned before, the tap gesture provides the worst performance. This is understandable sincenot much information (features) can be obtained from a tap as it is a simple and quick user action.This finding is aligned with a previous observation in the smartphone environment [11], and is alsoreplicated in our results on smartphone data (cf. Section 5.6). The prediction accuracy for fourgestures with a training set size of 50 and n = 10 is comparable for both classifiers which suggest thatin terms of accuracy both classifiers are effective on wearables with touchpad dimensions similar toGlass. The classification accuracy improves when more than one gesture is used in combination ascompared to individual gestures. This can be attributed to more features present in a combinationof multiple gestures. For a combination of gestures T + F + B + D (scattered at the top left end ofFigure 12), the AER of the classifier is more than 90%. This provides a positive result that machinelearning techniques can be used to create good gesture based continuous authentication models forwearable devices like Glass.
17
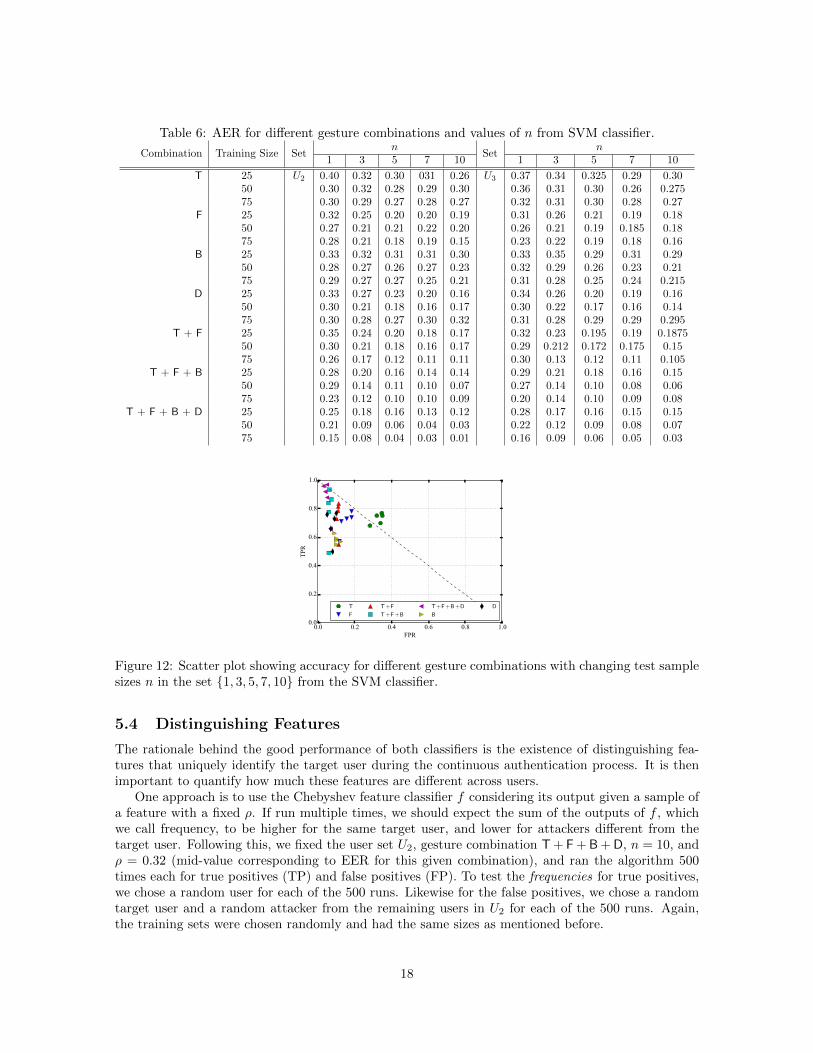
Table 6: AER for different gesture combinations and values of n from SVM classifier.
Combination Training Size Setn
Setn
1 3 5 7 10 1 3 5 7 10
T 25 U2 0.40 0.32 0.30 031 0.26 U3 0.37 0.34 0.325 0.29 0.3050 0.30 0.32 0.28 0.29 0.30 0.36 0.31 0.30 0.26 0.27575 0.30 0.29 0.27 0.28 0.27 0.32 0.31 0.30 0.28 0.27
F 25 0.32 0.25 0.20 0.20 0.19 0.31 0.26 0.21 0.19 0.1850 0.27 0.21 0.21 0.22 0.20 0.26 0.21 0.19 0.185 0.1875 0.28 0.21 0.18 0.19 0.15 0.23 0.22 0.19 0.18 0.16
B 25 0.33 0.32 0.31 0.31 0.30 0.33 0.35 0.29 0.31 0.2950 0.28 0.27 0.26 0.27 0.23 0.32 0.29 0.26 0.23 0.2175 0.29 0.27 0.27 0.25 0.21 0.31 0.28 0.25 0.24 0.215
D 25 0.33 0.27 0.23 0.20 0.16 0.34 0.26 0.20 0.19 0.1650 0.30 0.21 0.18 0.16 0.17 0.30 0.22 0.17 0.16 0.1475 0.30 0.28 0.27 0.30 0.32 0.31 0.28 0.29 0.29 0.295
T + F 25 0.35 0.24 0.20 0.18 0.17 0.32 0.23 0.195 0.19 0.187550 0.30 0.21 0.18 0.16 0.17 0.29 0.212 0.172 0.175 0.1575 0.26 0.17 0.12 0.11 0.11 0.30 0.13 0.12 0.11 0.105
T + F + B 25 0.28 0.20 0.16 0.14 0.14 0.29 0.21 0.18 0.16 0.1550 0.29 0.14 0.11 0.10 0.07 0.27 0.14 0.10 0.08 0.0675 0.23 0.12 0.10 0.10 0.09 0.20 0.14 0.10 0.09 0.08
T + F + B + D 25 0.25 0.18 0.16 0.13 0.12 0.28 0.17 0.16 0.15 0.1550 0.21 0.09 0.06 0.04 0.03 0.22 0.12 0.09 0.08 0.0775 0.15 0.08 0.04 0.03 0.01 0.16 0.09 0.06 0.05 0.03
0.0 0.2 0.4 0.6 0.8 1.0FPR
0.0
0.2
0.4
0.6
0.8
1.0
TPR
T
F
T +F
T +F +B
T +F +B +D
B
D
Figure 12: Scatter plot showing accuracy for different gesture combinations with changing test samplesizes n in the set {1, 3, 5, 7, 10} from the SVM classifier.
5.4 Distinguishing Features
The rationale behind the good performance of both classifiers is the existence of distinguishing fea-tures that uniquely identify the target user during the continuous authentication process. It is thenimportant to quantify how much these features are different across users.
One approach is to use the Chebyshev feature classifier f considering its output given a sample ofa feature with a fixed ρ. If run multiple times, we should expect the sum of the outputs of f , whichwe call frequency, to be higher for the same target user, and lower for attackers different from thetarget user. Following this, we fixed the user set U2, gesture combination T + F + B + D, n = 10, andρ = 0.32 (mid-value corresponding to EER for this given combination), and ran the algorithm 500times each for true positives (TP) and false positives (FP). To test the frequencies for true positives,we chose a random user for each of the 500 runs. Likewise for the false positives, we chose a randomtarget user and a random attacker from the remaining users in U2 for each of the 500 runs. Again,the training sets were chosen randomly and had the same sizes as mentioned before.
18

0 5 10 15 20 25 30Features
0
100
200
300
400
500
Freq
uenc
y
TP FP
Figure 13: The TP and FP frequencies obtained via the Chebyshev feature classifier f for all features.
The frequencies obtained for the different features are depicted graphically in Figure 13. Thex-axis shows 31 features (4 for tap plus 9 each for forward, backward and downward swipes). In caseof TP, the frequencies are all above 400 for tap, forward and backward swipes. The frequencies arebelow the 400 mark for downward swipes. This can be seen in the figure where the last nine featuresbelong to the downward swipe. The reason for this difference is likely to be the small training set sizefor downward swipes, i.e., 10. In contrast features belonging to taps and forward swipes have trainingset size of 50, whereas the backward swipe features used training sets of size 25. This also explains theslightly lower frequencies for backward swipe features as compared to tap and forward swipes. We canalso observe that the frequencies of FP are lower than the corresponding TP frequencies. This is trueeven for the case of downward swipes. These results suggest that all the features we consider here areto be included in the classification process as it seems each of them is able to effectively distinguishbetween users.
5.5 Comparison of the two classifiers
Our results so far have shown high accuracy of both classifiers with comparable number of gesturesneeded for both classifiers. To present a comprehensive comparison of the two classifiers in terms ofclassification accuracy, we use EER readings from the Chebyshev classifier based on the set of 20 users,i.e., the set U2 shown in Table 4, and we use the AER readings from SVM based on training set of size50.6 Recall that for Chebyshev classifier, the training set size was 50 for taps and forward swipes andeven less for other gestures (combinations). We first consider n = 10 for the purpose of our comparison.By looking at Tables 4 and 6 we can see that compared to the SVM classifier, Chebyshev’s error rateis lower for taps, forward swipes and backward swipes. For all other combinations the two classifiershave similar error rates. For other values of n, we observe that the SVM classifier performs slightlybetter when n = 1, but the Chebyshev classifier’s performance rapidly improves with increasing n,outperforming SVM in the three aforementioned gesture types. For combination of gestures, theperformance of the two is very similar.
To compare the computational overhead of the two classifiers, we evaluated the time taken duringtraining and testing. More specifically, we calculated the time taken for model generation (i.e., thetime after features have been extracted from the training set and until classifier parameters are set)and prediction (i.e., the time after features from the test sample(s) have been extracted and untila decision is made). Both these components are illustrated in Figure 2. For this purpose, we firstimplemented both components of the two classifiers on a desktop computer. The SVM classifier wasimplemented in Java (via LIBSVM), whereas we used Python to implement the Chebyshev classifier.The results of the model generation and prediction time are shown in Table 7.
6Note that when 1−TPR = FPR, as it is the case with EER, then AER and EER are the same and hence comparable.
19

Table 7: Model generation and prediction time (in milliseconds) for gestures on a PC.Tap Swipe
Chebyshev Model 11 20Chebyshev Predictor 0.04 0.095
SVM Model 38,000 49,000SVM Predictor 9 9.4
Table 8: Model generation and prediction time (in milliseconds) for different gesture combinations onGlass.
T F T + F T + F + B T + F + B + D
Chebyshev150 325 499 838 1,172
ModelChebyshev
0.80 0.32 1.13 1.89 2.74Predictor
SVM24 40 70 90 110
Predictor
Not surprisingly, for both the classifiers model generation takes longer than prediction. For bothmodel generation and prediction, the Chebyshev classifier is many orders of magnitude faster thanSVM. More importantly, model generation time is significantly higher for the SVM classifier. On Glass,this will take even more time as it is inferior to a standard desktop computer in terms of processingpower. This suggests that using SVM for training on Glass can be computationally expensive in termsof power and heat generation.
However, two important points need to be considered here. First, high model generation time isnot inherent to SVM. In fact, it is due to the use of the RBF kernel; a linear SVM is likely to yieldmuch lower model generation time. Secondly, we do not consider the high model generation time as adrawback of the SVM classifier, as (a) model generation is done infrequently and as such it is not a biglimitation, (b) as mentioned before, model generation can be outsourced to the Cloud. As a result, weuse only the prediction component of SVM on Glass, outsourcing the training to the Cloud. Similarobservation would apply to any classifier that uses an expensive training module. Therefore, we choseto implement only the predictor component of SVM on Glass to check the actual performance. Theclassification models were generated offline on a desktop computer and loaded on to the Glass. On theother hand, for Chebyshev classifier we implemented both the model generator and predictor on Glass.The results from our experiment are shown in Table 8. As can be seen, Chebyshev is faster than SVMin terms of prediction time with the added advantage of having a very small time for model generationon Glass. Having said that, the prediction time for SVM is also small enough to be practical. Themain advantage of using the Chebyshev classifier, in our opinion, is its ease of implementation (as itrequires standard functions and therefore does not require external libraries).
The advantage of Chebyshev classifier over SVM in terms of model generation time is due to thefact that the system parameter in the former, i.e., τ , is only significantly dependent on the test samplesize n, which can be obtained through a lookup table. In other words, the system parameter is notdependent on any particular training set. Chebyshev classifier’s fast training time has some secondarybenefits. For instance, it allows for randomized trials to check the performance of the system (interms of EER) with a random training set each time, since training takes only a few milliseconds.Moreover, together with randomness, Chebyshev’s feature classifier gives us another way to evaluatethe usefulness, in terms of distinguishing capabilities, of individual features as done in Section 5.4,instead of relying on other metrics such as conditional probabilities [4] and two-sample Kolmogorov-Smirnov tests [11].
20

Table 9: EER for different gesture combinations and values of n from the Chebyshev classifier onsmartphone data.
Combination Setn
Setn
Setn
1 3 5 7 10 1 3 5 7 10 1 3 5 7 10
T U1 0.43 0.30 0.24 0.23 0.15 U2 0.39 0.27 0.21 0.18 0.15 U3 0.36 0.26 0.22 0.17 0.16F 0.17 0.05 0.06 0.03 0.03 0.16 0.07 0.07 0.06 0.04 0.16 0.10 0.07 0.07 0.04B 0.20 0.13 0.12 0.11 0.09 0.16 0.12 0.10 0.11 0.10 0.22 0.15 0.11 0.10 0.11D 0.20 0.11 0.08 0.06 0.06 0.21 0.13 0.09 0.08 0.07 0.18 0.10 0.09 0.08 0.07
T + F 0.16 0.09 0.06 0.04 0.03 0.16 0.08 0.05 0.05 0.04 0.16 0.08 0.06 0.04 0.05T + F + B 0.15 0.05 0.02 0.03 0.03 0.12 0.04 0.02 0.02 0.02 0.12 0.05 0.04 0.03 0.02
T + F + B + D 0.09 0.03 0.01 0.02 0.01 0.08 0.03 0.02 0.01 0.01 0.09 0.03 0.02 0.01 0.02
Table 10: AER for different gesture combinations and values of n from SVM classifier on smarthponedata.
Combination Setn
Setn
1 3 5 7 10 1 3 5 7 10
T U2 0.43 0.41 0.38 036 0.35 U3 0.44 0.40 0.385 0.38 0.36F 0.12 0.06 0.055 0.045 0.04 0.10 0.055 0.0475 0.045 0.0425B 0.21 0.14 0.12 0.115 0.11 0.19 0.16 0.15 0.11 0.105D 0.14 0.085 0.07 0.05 0.035 0.125 0.08 0.06 0.05 0.05
T + F 0.28 0.19 0.10 0.05 0.0375 0.27 0.19 0.08 0.05 0.0325T + F + B 0.19 0.10 0.06 0.04 0.035 0.20 0.105 0.05 0.04 0.03
T + F + B + D 0.15 0.10 0.045 0.03 0.0275 0.20 0.105 0.04 0.0375 0.02
5.6 Generalization: Results on Smartphone Data
To test the generalizability of our proposed system on other devices which allow touch-based interac-tion, we checked the accuracy of the Chebyshev and SVM classifiers on smartphone gesture data. Weused publicly available smartphone gesture data which was collected by the authors [4].7 The dataconsists of 120 taps, and 20 forward, backward and downward-swipes each for 31 users. We chose30 of the 31 users for our study. We further fixed training size of 50 for taps and 10 for all swipegestures. The rest of the data was used as the testing set. The results of applying Chebyshev andSVM on the smartphone data are shown in Table 9 and Table 10, respectively. As before, in case ofthe Chebyshev classifier, we divided the 30 users such that the first 10 users comprised the set U1,first 20 comprised the set U2 and all 30 comprised the set U3. The rest of the process to find the truepositives and false positives is the same as mentioned in Section 5.2. Similarly, for the SVM classifier,we selected 10 users for the set U1, 9 of which are used to model the mock attacker. The sets U2 andU3 are constructed similar to their counterparts in Section 5.1.
The trends observed in the results for both the classifiers on the smartphone data remain similar toGlass data. We observe that the accuracy of the system increases with increasing testing size, i.e., n.The system is able to achieve accuracy of 98%-99% with n ≥ 7 with all 4 gestures combined. We alsoobserved two marked differences in the accuracy of the classifier between the smartphone data andGlass data. First, the accuracy of the system on all the swipe gestures on the smartphone is betterthan Glass. This is despite the fact that the number of samples used in training size for smartphonedata (10) is smaller than Glass (50 for Chebyshev and 25, 50, 75 for SVM). However, this might alsobe due to the fact that the total number of swipe gestures were 20 in the smartphone data. Secondly,the accuracy of the system is less impacted with increasing number of users on smartphone than Glass.We believe that the two aforementioned differences might be due to the difference in touchpad size ofthe two devices. Bigger touchpad size allows for more variation in the gesture patterns and therebyincreasing the ability of the system to differentiate between multiple users accurately. It also suggeststhat higher accuracy can be achieved on smartphones compared to Glass with smaller number ofgestures, i.e., n, as is clear from the tables.
7The data is available from http://xuhui.me/.
21
Day 1 Day 2 Day 3 Day 7 Day 140.0
0.2
0.4
0.6
0.8
1.0
(a) T (Chebyshev)
Day 1 Day 2 Day 3 Day 7 Day 140.0
0.2
0.4
0.6
0.8
1.0
(b) F (Chebyshev)
Day 1 Day 2 Day 3 Day 7 Day 140.0
0.2
0.4
0.6
0.8
1.0
(c) B (Chebyshev)
Day 1 Day 2 Day 3 Day 7 Day 140.0
0.2
0.4
0.6
0.8
1.0
(d) D (Chebyshev)
Day 1 Day 2 Day 3 Day 7 Day 140.0
0.2
0.4
0.6
0.8
1.0
(e) T (SVM)
Day 1 Day 2 Day 3 Day 7 Day 140.0
0.2
0.4
0.6
0.8
1.0
(f) F (SVM)
Day 1 Day 2 Day 3 Day 7 Day 140.0
0.2
0.4
0.6
0.8
1.0
(g) B (SVM)
Day 1 Day 2 Day 3 Day 7 Day 140.0
0.2
0.4
0.6
0.8
1.0
(h) D (SVM)
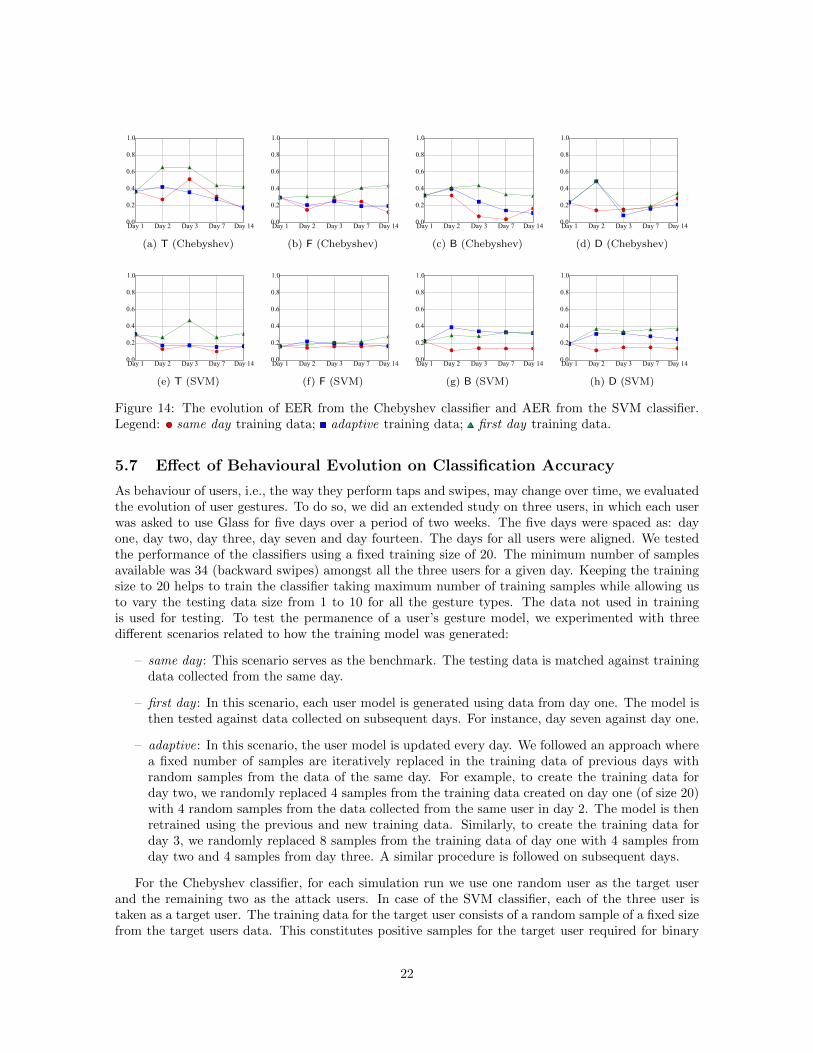
Figure 14: The evolution of EER from the Chebyshev classifier and AER from the SVM classifier.Legend: same day training data; adaptive training data; first day training data.
5.7 Effect of Behavioural Evolution on Classification Accuracy
As behaviour of users, i.e., the way they perform taps and swipes, may change over time, we evaluatedthe evolution of user gestures. To do so, we did an extended study on three users, in which each userwas asked to use Glass for five days over a period of two weeks. The five days were spaced as: dayone, day two, day three, day seven and day fourteen. The days for all users were aligned. We testedthe performance of the classifiers using a fixed training size of 20. The minimum number of samplesavailable was 34 (backward swipes) amongst all the three users for a given day. Keeping the trainingsize to 20 helps to train the classifier taking maximum number of training samples while allowing usto vary the testing data size from 1 to 10 for all the gesture types. The data not used in trainingis used for testing. To test the permanence of a user’s gesture model, we experimented with threedifferent scenarios related to how the training model was generated:
– same day : This scenario serves as the benchmark. The testing data is matched against trainingdata collected from the same day.
– first day : In this scenario, each user model is generated using data from day one. The model isthen tested against data collected on subsequent days. For instance, day seven against day one.
– adaptive: In this scenario, the user model is updated every day. We followed an approach wherea fixed number of samples are iteratively replaced in the training data of previous days withrandom samples from the data of the same day. For example, to create the training data forday two, we randomly replaced 4 samples from the training data created on day one (of size 20)with 4 random samples from the data collected from the same user in day 2. The model is thenretrained using the previous and new training data. Similarly, to create the training data forday 3, we randomly replaced 8 samples from the training data of day one with 4 samples fromday two and 4 samples from day three. A similar procedure is followed on subsequent days.
For the Chebyshev classifier, for each simulation run we use one random user as the target userand the remaining two as the attack users. In case of the SVM classifier, each of the three user istaken as a target user. The training data for the target user consists of a random sample of a fixed sizefrom the target users data. This constitutes positive samples for the target user required for binary
22

class SVM training. The negative samples for the target user come from the data of the remainingtwo target users. The attackers data come from a fixed set of three users who did not participate inthe evolution study and whose data was collected for earlier experiments.
The results are shown in Figure 14 for both the classifiers. Note that the focus here is not onauthentication accuracy as the number of users is small and the training data is also small but tocompare how accuracy is impacted over a period of time under different scenarios. As expected, thesame day scenario achieves the highest accuracy amongst all the scenarios for a given day. We can alsoobserve that the accuracy of the first day scenario is the worst, suggesting that the touch biometricsis not quite stable over time and hence an adaptive approach should be considered to maintainhigh accuracy with time. Using adaptive approach in our experiments clearly shows performanceimprovements over first day scenario especially for Chebyshev classifier.
6 Some Limitations and Discussion
We discuss some limitations of our work and directions for future research. In terms of our experi-mental design, we did not impose any restrictions on how the Glass is to be used by the volunteers aswe wanted to mimic natural use. It could be the case that the user’s gesture patterns while walkingwould be different as compared to when the user is in a sitting posture. We believe that this differenceis not likely to be as profound as smartphone usage, since the Glass is mounted on the user’s head andis relatively more stable as compared to holding a smartphone. These subtleties are an interestingarea of study for future work.
The focus of our research has been touch gesture based continuous authentication. As we indicatedbefore, the user can also operate Glass by using voice commands. Thus, the continuous authenticationsystem can be augmented by including voice characteristics as distinguishing features. Similarly, oneor more of the other sensors available on Glass, such as the accelerometer, can be used to enhancethe feature space. This includes the use of gestures with multiple fingers as well as pinch. We did notinclude these gesture types in our system since they are infrequently used.
Lastly, our use of the Chebyshev classifier needs to be explored further from different angles. Sincethe Chebyshev classifier is based on a concentration inequality, namely Chebyshev’s inequality, it willbe interesting to employ other concentration inequalities such as Hoeffding or Bernstein’s inequalitiesto compare the results. Likewise, Chebyshev classifier can be employed for continuous authenticationon smartphones to see if its performance is still comparable to other classifiers, such as SVM with RBFkernel and linear regression. Furthermore, the voting based approach used for the overall Chebyshevclassifier, e.g., two-thirds majority decision, can be replaced by other ways to combine the resultsfor individual features. Since the performance of a classifier is also significantly dependent on thefeatures being used, it will be interesting to expand on the feature model introduced in this paper.For instance, one may model the swipe feature as an interaction between the two forces (downwardand planar), instead of assuming the two forces as acting separately as is done in the work. A resultingfeature could be a three dimensional magnitude of force over time.
7 Conclusion
In this paper, we study the feasibility of continuous authentication on Google Glass by developingand implementing a gesture based continuous authentication system. Due to smaller touchpad sizeand relatively meagre resources of the Glass hardware (CPU, memory, battery) compared to modernsmartphones, it is not straightforward to assume that gesture based implicit authentication systemsproposed for smartphones would yield high classification accuracy and computational load on Glass.The results of our study indicate that gesture based continuous authentication is both computationallyand accuracy-wise feasible on wearables.
Among other contributions of our work, the most notable one is the proposal of a new classifier
23

based on Chebyshev’s concentration inequality, which can be an interesting inclusion to other classifiersused in the field of implicit authentication. Chebyshev classifier originates from the observation fromprevious work that the use of block of samples (as compared to individual samples) of a gestureimproves classification. Concentration inequalities, such as Chebyshev’s inequality over n randomvariables, explains this relationship in probability. Our secondary contributions include modellingtouch gestures in a new way from which we extract new features such as downward (as measured bypressure and area readings) and planar (as measured by velocity readings) force as a function of time.
24

References
[1] CCS Insight. Smartwatches and Smart Bands Dominate Fast-Growing Wearables Market.CCS Insight, http://www.telegraph.co.uk/technology/internet-security/10925223/
Wearable-tech-how-hackers-could-turn-your-most-private-data-against-you.html,viewed 30 October 2014, 2014.
[2] Sebastian Uellenbeck, Markus Durmuth, Christopher Wolf, and Thorsten Holz. Quantifying theSecurity of Graphical Passwords: The Case of Android Unlock Patterns. In Proceedings of the2013 ACM SIGSAC Conference on Computer & Communications Security, CCS ’13, pages161–172, New York, NY, USA, 2013. ACM.
[3] Florian Schaub, Ruben Deyhle, and Michael Weber. Password Entry Usability and ShoulderSurfing Susceptibility on Different Smartphone Platforms. In Proceedings of the 11th InternationalConference on Mobile and Ubiquitous Multimedia, MUM ’12, pages 13:1–13:10, New York, NY,USA, 2012. ACM.
[4] Hui Xu, Yangfan Zhou, and Michael R. Lyu. Towards Continuous and Passive Authentication viaTouch Biometrics: An Experimental Study on Smartphones. In Symposium On Usable Privacyand Security, SOUPS ’14, pages 187–198, Menlo Park, CA, July 2014. USENIX Association.
[5] Adam J. Aviv, Katherine Gibson, Evan Mossop, Matt Blaze, and Jonathan M. Smith. SmudgeAttacks on Smartphone Touch Screens. In Proceedings of the 4th USENIX Conference on Offen-sive Technologies, WOOT ’10, pages 1–7, Berkeley, CA, USA, 2010. USENIX Association.
[6] Ulrich Burgbacher and Klaus Hinrichs. An Implicit Author Verification System for Text MessagesBased on Gesture Typing Biometrics. In Proceedings of the SIGCHI Conference on HumanFactors in Computing Systems, CHI ’14, pages 2951–2954, New York, NY, USA, 2014. ACM.
[7] Noam Ben-Asher, Niklas Kirschnick, Hanul Sieger, Joachim Meyer, Asaf Ben-Oved, and SebastianMoller. On the Need for Different Security Methods on Mobile Phones. In Proceedings of the13th International Conference on Human Computer Interaction with Mobile Devices and Services,MobileHCI ’11, pages 465–473, New York, NY, USA, 2011. ACM.
[8] Consumer Reports Magazine. Keep your phone safe: How to protect yourself from wirelessthreats. Consumer Reports, http://consumerreports.org/privacy0613, viewed 30 October2014, 2013.
[9] Markus Jakobsson, Elaine Shi, Philippe Golle, and Richard Chow. Implicit Authentication forMobile Devices. In Proceedings of the 4th USENIX Conference on Hot Topics in Security, Hot-Sec’09, pages 9–9, Berkeley, CA, USA, 2009. USENIX Association.
[10] Markus Jakobsson, Elaine Shi, Philippe Golle, and Richard Chow. Implicit Authentication forMobile Devices. In Proceedings of the 4th USENIX Conference on Hot Topics in Security, HotSec’09, pages 9–9, Berkeley, CA, USA, 2009. USENIX Association.
[11] Lingjun Li, Xinxin Zhao, and Guoliang Xue. Unobservable Re-authentication for Smartphones.In 20th Annual Network and Distributed System Security Symposium, NDSS ’13. The InternetSociety, 2013.
[12] Mario Frank, Ralf Biedert, Eugene Ma, Ivan Martinovic, and Dawn Song. Touchalytics: Onthe Applicability of Touchscreen Input as a Behavioral Biometric for Continuous Authentication.IEEE Transactions on Information Forensics and Security, 8(1):136–148, 2013.
25

[13] Premkumar Saravanan, Samuel Clarke, Duen Horng (Polo) Chau, and Hongyuan Zha. Latent-Gesture: Active User Authentication Through Background Touch Analysis. In Proceedings of theSecond International Symposium of Chinese CHI, Chinese CHI ’14, pages 110–113, New York,NY, USA, 2014. ACM.
[14] Cheng Bo, Lan Zhang, Xiang-Yang Li, Qiuyuan Huang, and Yu Wang. SilentSense: Silent UserIdentification via Touch and Movement Behavioral Biometrics. In Proceedings of the 19th AnnualInternational Conference on Mobile Computing & Networking, MobiCom ’13, pages 187–190,New York, NY, USA, 2013. ACM.
[15] Robert LiKamWa, Zhen Wang, Aaron Carroll, Felix Xiaozhu Lin, and Lin Zhong. Draining ourglass: An energy and heat characterization of google glass. In Proceedings of 5th Asia-PacificWorkshop on Systems, APSys ’14, pages 10:1–10:7, New York, NY, USA, 2014. ACM.
[16] Abdul Serwadda, Vir V. Phoha, and Zibo Wang. Which Verifiers Work?: A Benchmark Eval-uation of Touch-based Authentication Algorithms. In IEEE 6th International Conference onBiometrics: Theory, Applications and Systems, BTAS ’13, pages 1–8. IEEE, 2013.
[17] Rick Joyce and Gopal Gupta. Identity Authorization Based on Keystroke Latencies. Communi-cations of the ACM, 33(2):168–176, February 1990.
[18] Fabian Monrose and Aviel Rubin. Authentication via Keystroke Dynamics. In Proceedings of the4th ACM Conference on Computer and Communications Security, CCS ’97, pages 48–56, NewYork, NY, USA, 1997. ACM.
[19] Eiji Hayashi, Sauvik Das, Shahriyar Amini, Jason Hong, and Ian Oakley. CASA: Context-awareScalable Authentication. In Proceedings of the Ninth Symposium on Usable Privacy and Security,SOUPS ’13, pages 3:1–3:10, New York, NY, USA, 2013. ACM.
[20] Hassan Khan and Urs Hengartner. Towards Application-centric Implicit Authentication onSmartphones. In Proceedings of the 15th Workshop on Mobile Computing Systems and Ap-plications, HotMobile ’14, pages 10:1–10:6, New York, NY, USA, 2014. ACM.
[21] Koichiro Niinuma, Unsang Park, and Anil K. Jain. Soft Biometric Traits for Continuous User Au-thentication. IEEE Transactions on Information Forensics and Security, 5(4):771–780, December2010.
[22] Hassan Khan, Aaron Atwater, and Urs Hengartner. A comparative evaluation of implicit authen-tication schemes. In Research in Attacks, Intrusions and Defenses, volume 8688 of RAID ’14,pages 255–275, Berlin, 2014. Springer International Publishing.
[23] N. Sae-Bae, N. Memon, and K. Isbister. Investigating multi-touch gestures as a novel biometricmodality. In Biometrics: Theory, Applications and Systems (BTAS), 2012 IEEE Fifth Interna-tional Conference on, pages 156–161, Sept 2012.
[24] Xi Zhao, Tao Feng, Weidong Shi, and I.A. Kakadiaris. Mobile user authentication using statisticaltouch dynamics images. Information Forensics and Security, IEEE Transactions on, 9(11):1780–1789, Nov 2014.
[25] Marcos Faundez-Zanuy. On-line signature recognition based on vq-dtw. Pattern Recogn.,40(3):981–992, March 2007.
[26] Henrik Rydberg. Multi-touch (MT) Protocol. The Linux Kernel Archives, https://www.kernel.org/doc/Documentation/input/multi-touch-protocol.txt, viewed 30 October 2014, 2014.
26

[27] Muhammad Shahzad, Alex X. Liu, and Arjmand Samuel. Secure Unlocking of Mobile TouchScreen Devices by Simple Gestures: You Can See It but You Can Not Do It. In Proceedingsof the 19th Annual International Conference on Mobile Computing, MobiCom ’13, pages 39–50,New York, NY, USA, 2013. ACM.
[28] B. G. Amidan, T. A. Ferryman, and S. K. Cooley. Data Outlier Detection using the ChebyshevTheorem. In IEEE Aerospace Conference, pages 3814–3819, 2005.
[29] Sheldon M. Ross. A First Course in Probability. Prentice Hall, 4 edition, 2002.
[30] Chih-Chung Chang and Chih-Jen Lin. LIBSVM: A Library for Support Vector Machines. ACMTrans. Intell. Syst. Technol., 2(3):27:1–27:27, May 2011.
A Chebyshev’s Inequality for Time-series based Features
LetX be the random variable representing a time-series feature, and letX1, X2, . . . , Xn denote randomvariables corresponding to n samples of the time-series feature. Each Xi is the sequence
(Xi(1), Xi(2), . . . , Xi(m)),
where m = toff
tint. For toff = 0.3 and tint = 0.01, we have m = 30. For all 1 ≤ j ≤ m we have that
E[X1(j)] = E[X2(j)] = · · · = E[Xn(j)] = µX(j),
andVar[X1(j)] = Var[X2(j)] = · · · = Var[Xn(j)] = σ2
X(j).
Furthermore, for all 1 ≤ j ≤ m and 1 ≤ k ≤ m with j 6= k,
Cov[X1(j), X1(k)] = · · · = Cov[Xn(j), Xn(k)] = ζX(j),X(k).
For 1 ≤ i ≤ n, define
Yi =
m∑j=1
Xi(j),
and finally let
Sn =
n∑i=1
Yi.
According to the definition of Yi, we have that
E[Y1] = · · · = E[Yn] =
m∑j=1
µX(j) = µY ,
and
Var[Y1] = · · · = Var[Yn] =
m∑j=1
σ2X(j) +
∑j 6=k
ζX(j),X(k)
= σ2Y .
From this it follows that
E[Sn] = n
m∑j=1
µX(j) = nµY
27

and,
Var[Sn] =1
n2
n∑i=1
Var[Yi]
=n
n2
m∑j=1
σ2X(j) +
∑j 6=k
ζX(j),X(k)
=
1
nσ2Y .
Now applying Chebyshev’s inequality on Sn and using the above results we get
Pr
∣∣∣∣∣∣ 1nn∑i=1
m∑j=1
Xi(j)− µY
∣∣∣∣∣∣ ≥ τ ≤ σ2
Y
nτ2. (5)
Compare this with Inequality 2. Here, we sum up all m data points of the time series. Our assumptionis that the jth data point in the time series has the same distribution across samples. On the otherhand, the m data points are not independent of each other within a time series. We, therefore, needto evaluate their covariances. Chebyshev’s inequality can then be used for classification by summingup all time series data points for n samples and checking whether the average is concentrated aroundthe target mean. The means µX(j), variances σ2
X(j) and covariances ζX(j),X(k) are estimated throughthe training data.
B Frequencies of Features from Chebyshev Feature Classifier
Table 11 shows the frequencies obtained for the different features. Amongst all the types of features,the downward swipe angles, i.e., θD, have the least frequency difference of 29. All other features showa frequency difference of above 75. The highest frequency difference is shown by the x-coordinate ofthe tap point which was 284.
Table 11: The sum of outputs (frequency) of the Chebyshev feature classifier f over 500 trials.
Gesture FeatureT F B D
TP FP TP FP TP FP TP FP
Tap x 451 167 - - - - - -y 434 348 - - - - - -
Fz(t) 449 255 - - - - - -∆t 434 350 - - - - - -
Swipe x0 - - 456 185 428 179 362 109y0 - - 444 330 421 343 379 201x1 - - 458 199 430 176 352 110y1 - - 445 284 433 290 356 274θ - - 446 368 413 272 361 332
Fz(t) - - 448 195 420 213 384 190Fxy(t) - - 451 183 435 222 364 180
∆t - - 441 271 416 267 355 191l - - 456 204 419 216 366 216
28