germany - wordpress.com€¦ · source: bp energy outlook 2016. 54% 46% clean dirty 8% 93% france...
TRANSCRIPT
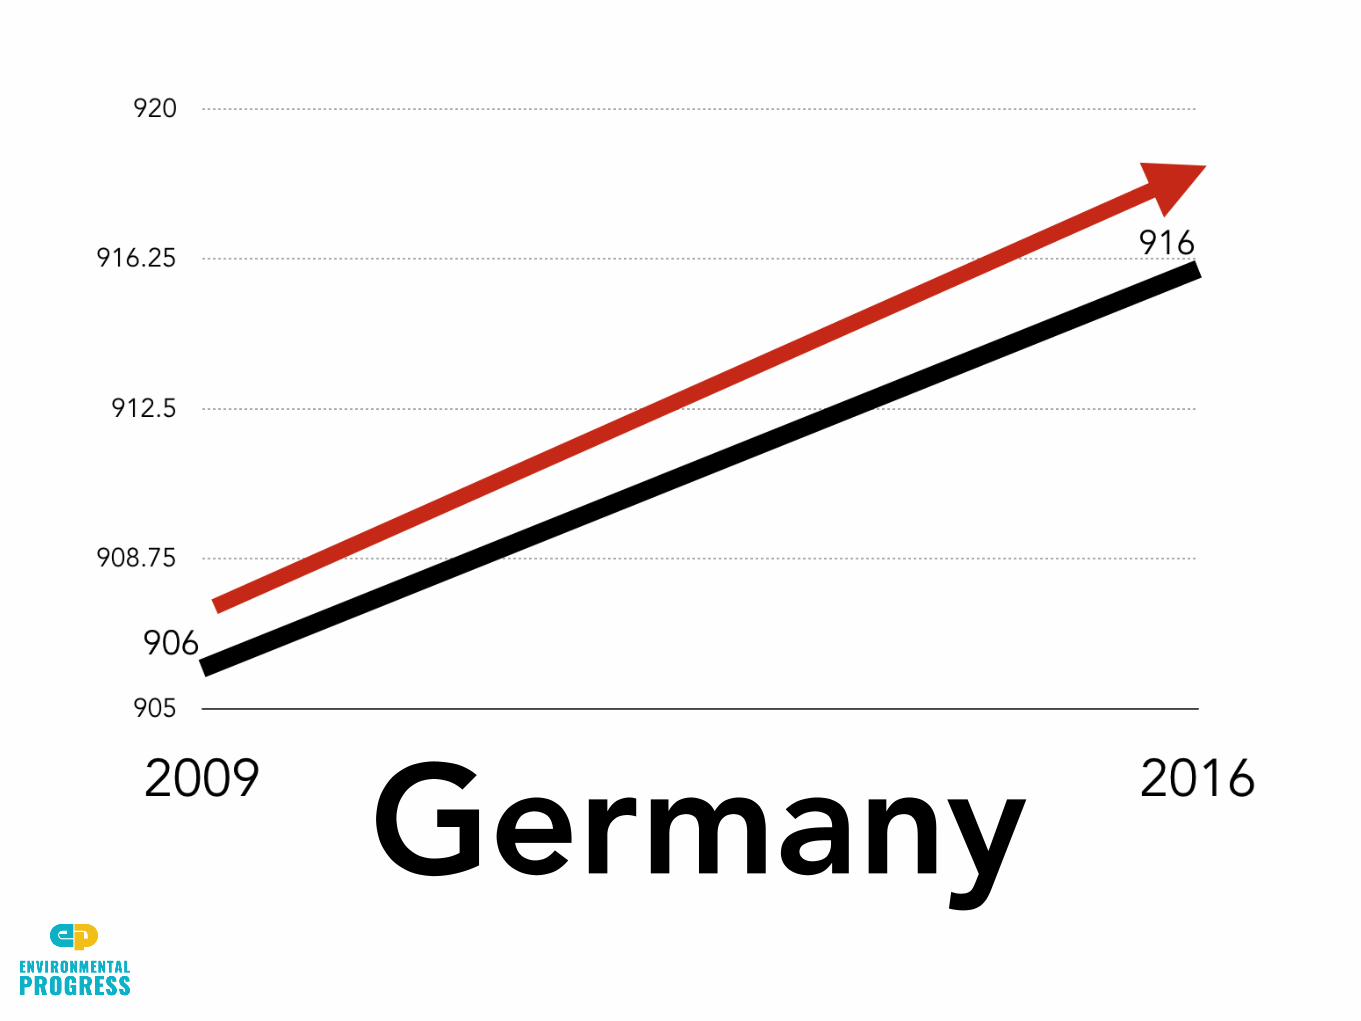
Germany
905
908.75
912.5
916.25
920
2009 2016
906
916
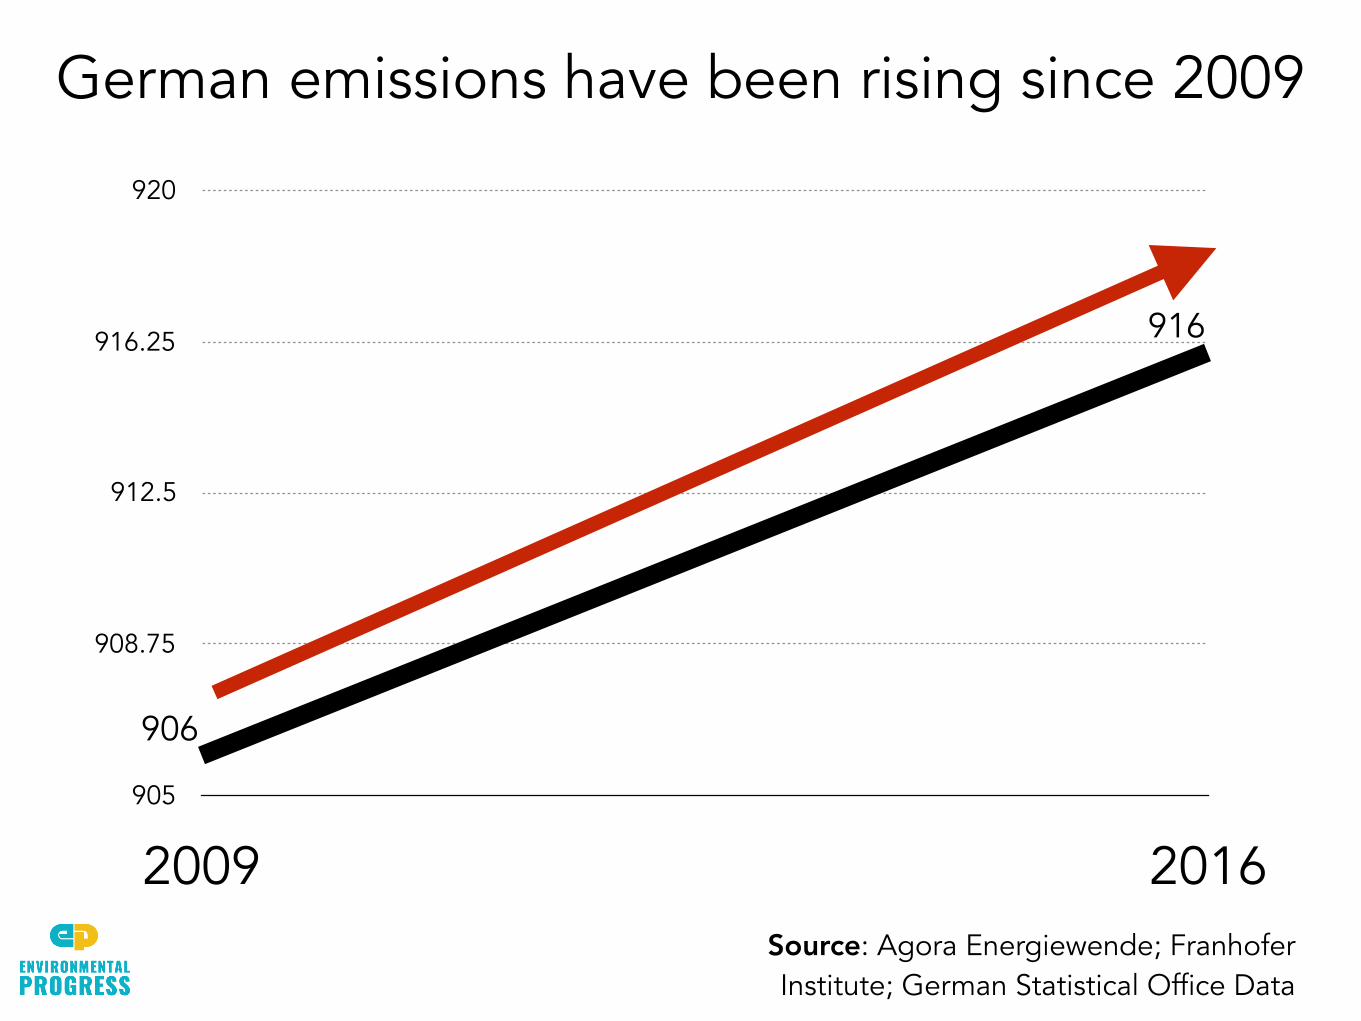
German emissions have been rising since 2009
Source: Agora Energiewende; Franhofer Institute; German Statistical Office Data
Cha
nge
(TW
h)
-9
-4.5
0
4.5
9
13.5
18
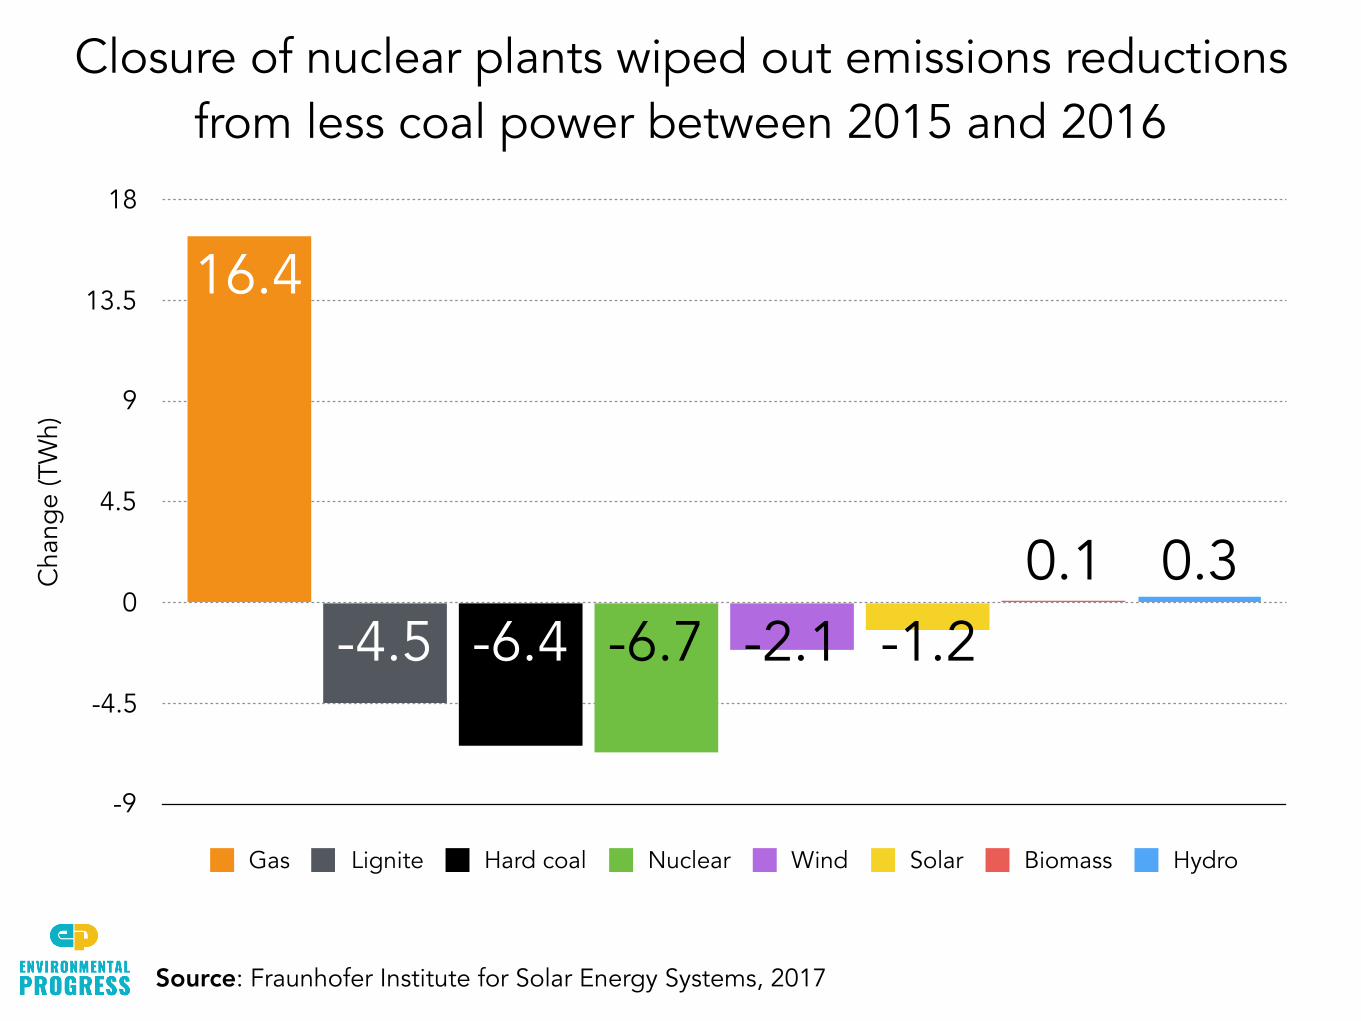
0.30.1-1.2-2.1-6.7-6.4-4.5
16.4
Gas Lignite Hard coal Nuclear Wind Solar Biomass Hydro
Closure of nuclear plants wiped out emissions reductions from less coal power between 2015 and 2016
Source: Fraunhofer Institute for Solar Energy Systems, 2017
TWh
0
10
20
30
40
2015 2016
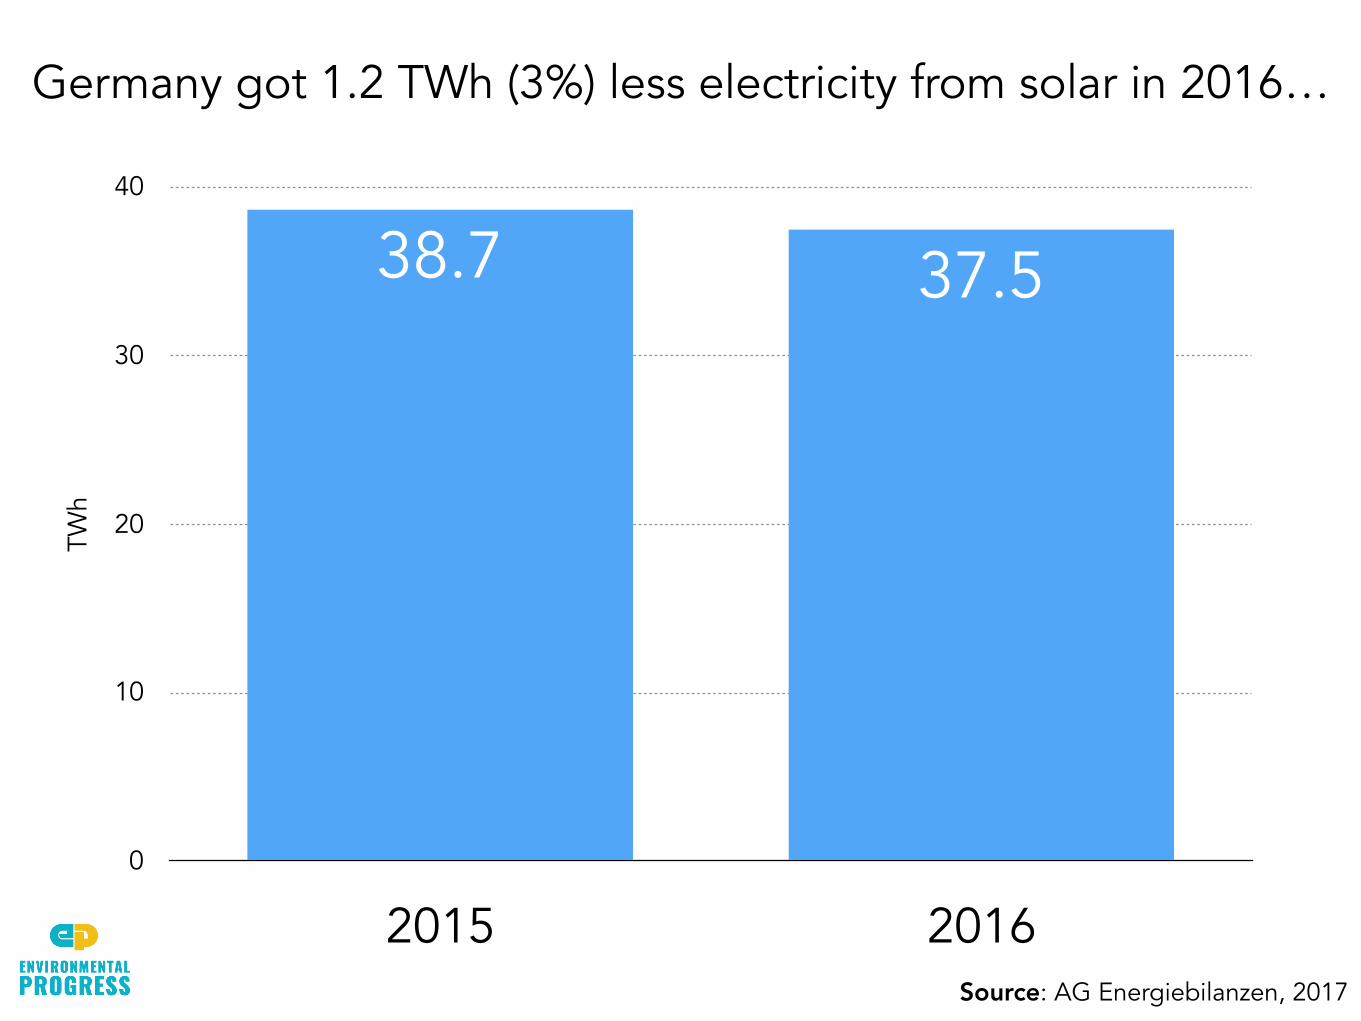
37.538.7
Germany got 1.2 TWh (3%) less electricity from solar in 2016…
Source: AG Energiebilanzen, 2017
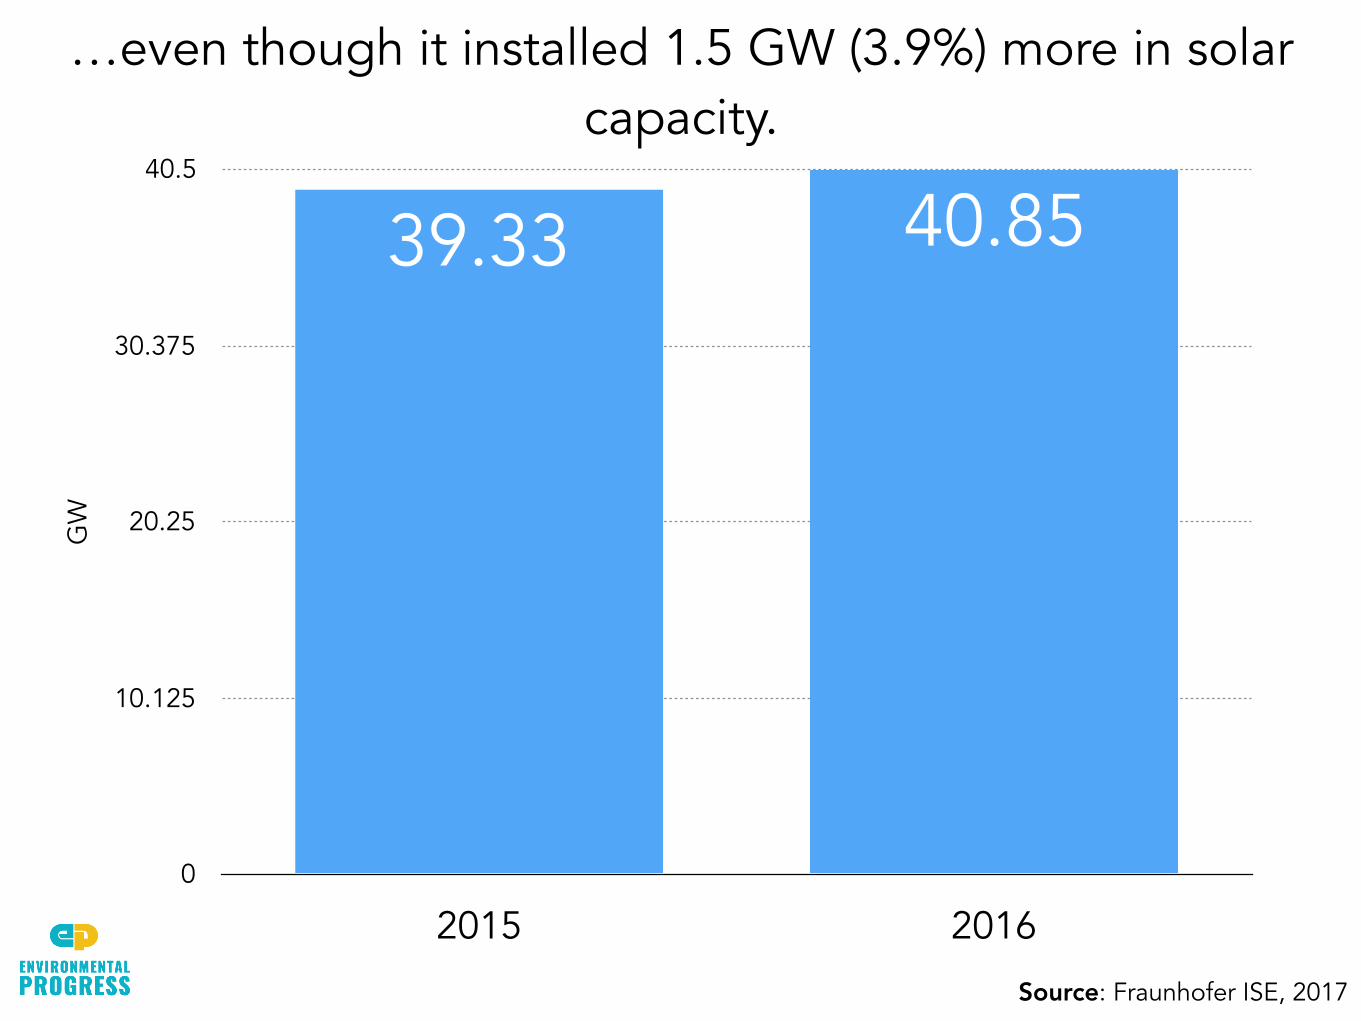
GW
0
10.125
20.25
30.375
40.5
2015 2016
40.8539.33
…even though it installed 1.5 GW (3.9%) more in solar capacity.
Source: Fraunhofer ISE, 2017
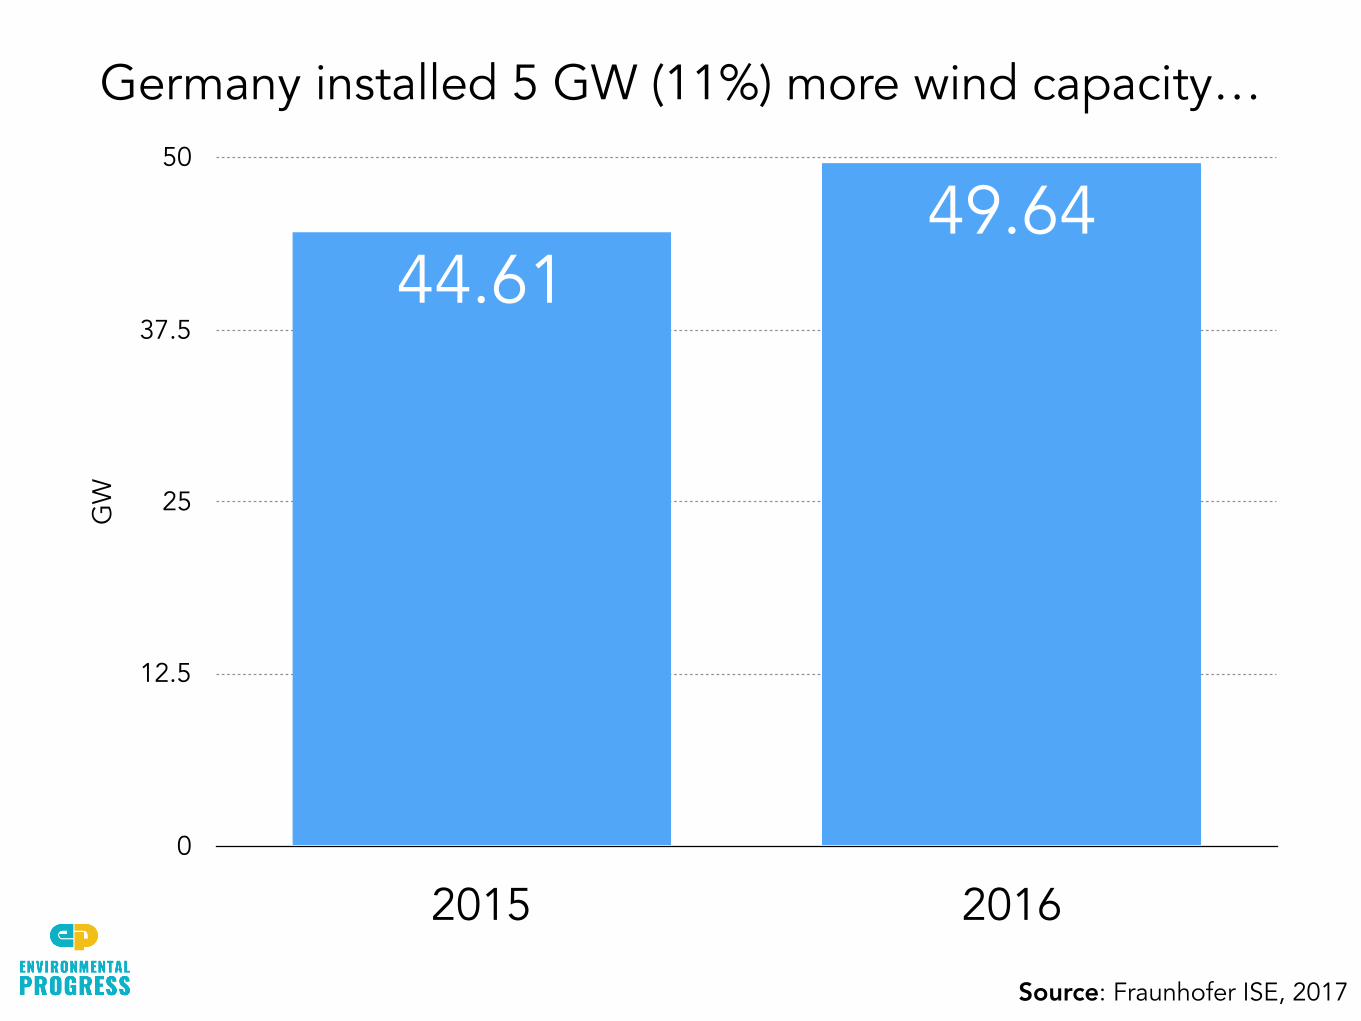
GW
0
12.5
25
37.5
50
2015 2016
49.6444.61
Germany installed 5 GW (11%) more wind capacity…
Source: Fraunhofer ISE, 2017
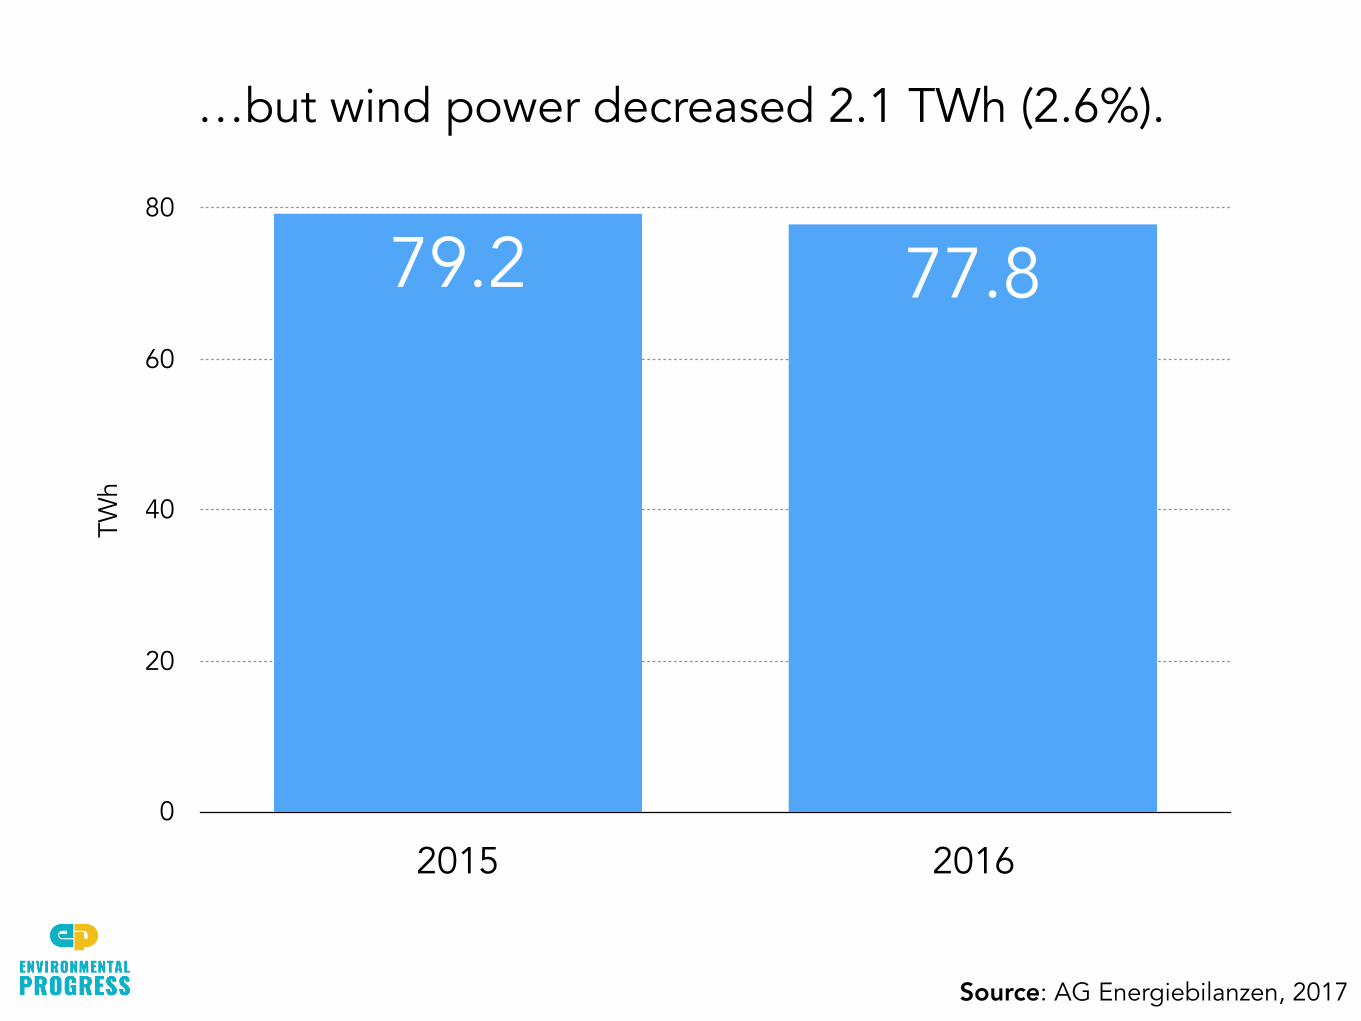
TWh
0
20
40
60
80
2015 2016
77.879.2
…but wind power decreased 2.1 TWh (2.6%).
Source: AG Energiebilanzen, 2017
Why?
Because it wasn’t as sunny or windy in 2016 as in 2015.
What are the implications?
0
10
20
30
40
2016
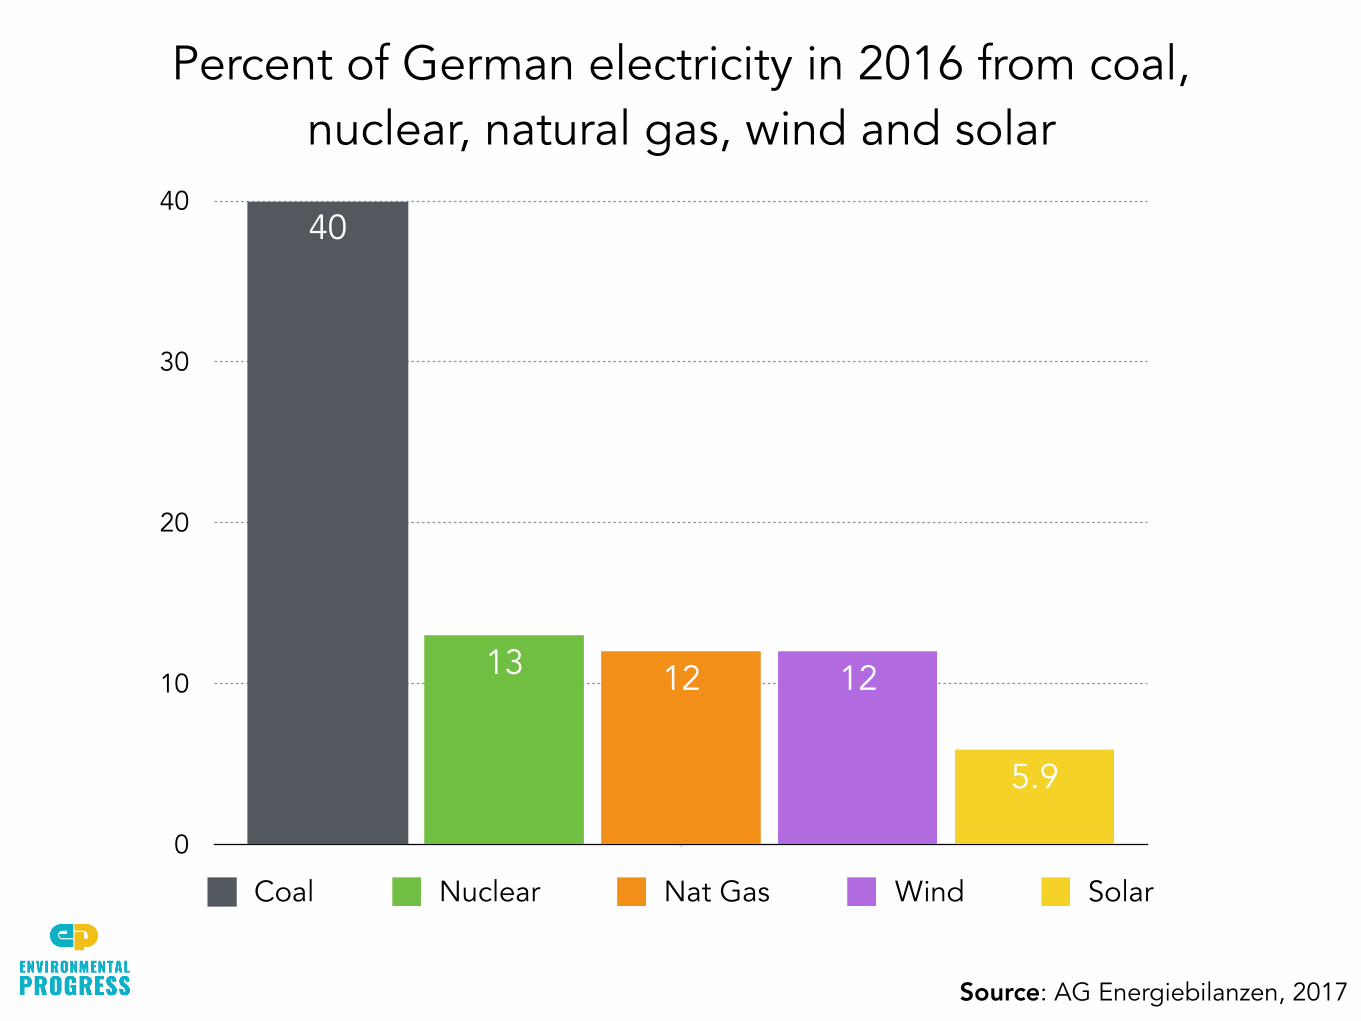
5.9
121213
40
Coal Nuclear Nat Gas Wind Solar
Percent of German electricity in 2016 from coal, nuclear, natural gas, wind and solar
Source: AG Energiebilanzen, 2017
GW
0
16.25
32.5
48.75
65
2016 2030 goal
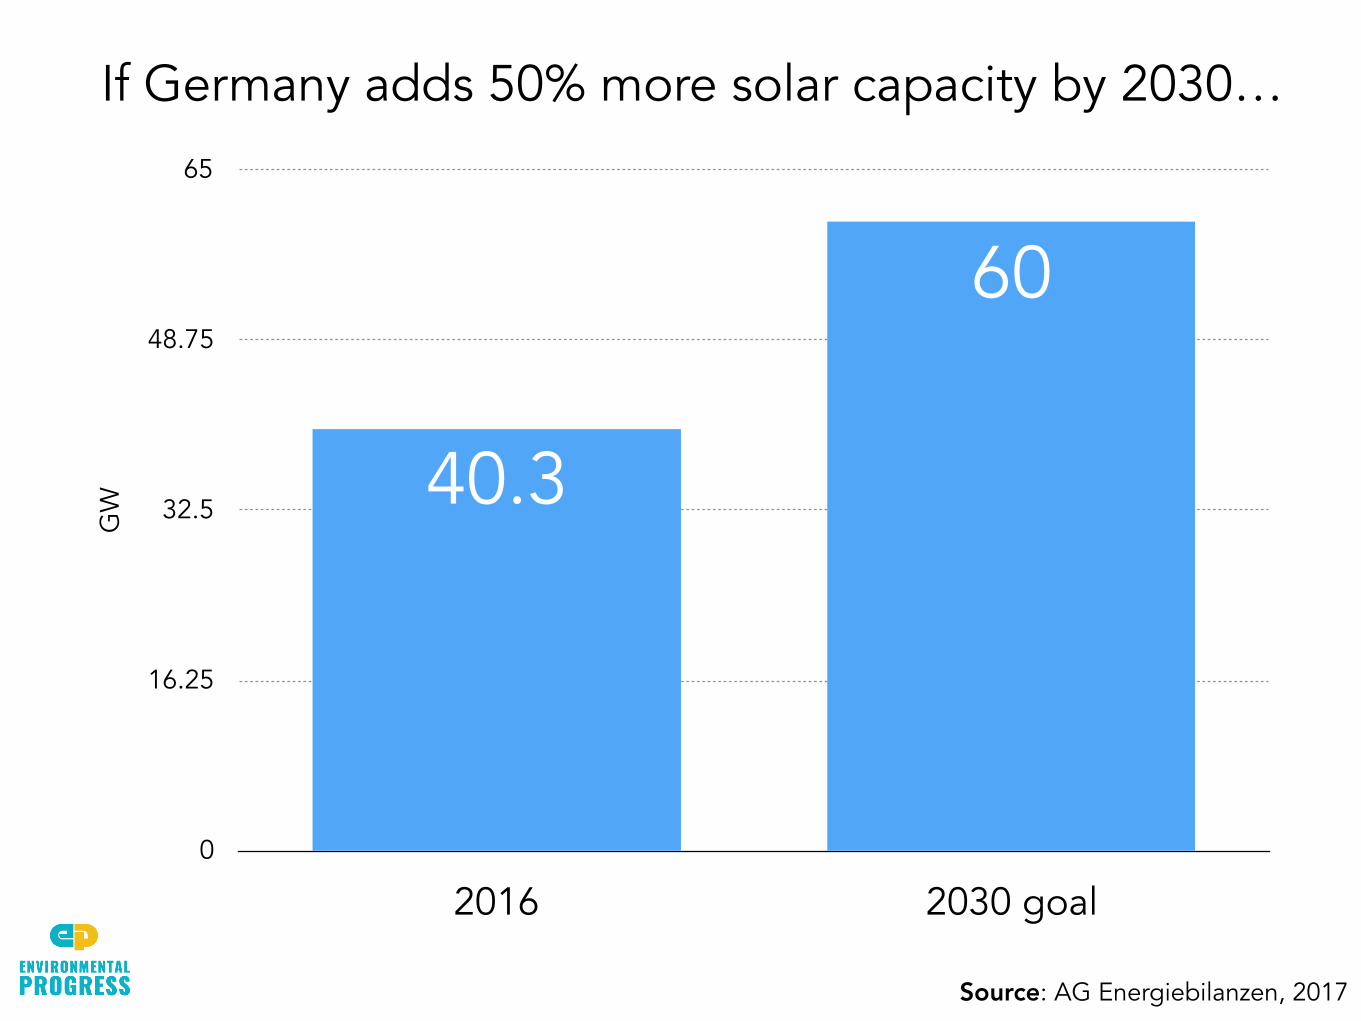
60
40.3
If Germany adds 50% more solar capacity by 2030…
Source: AG Energiebilanzen, 2017
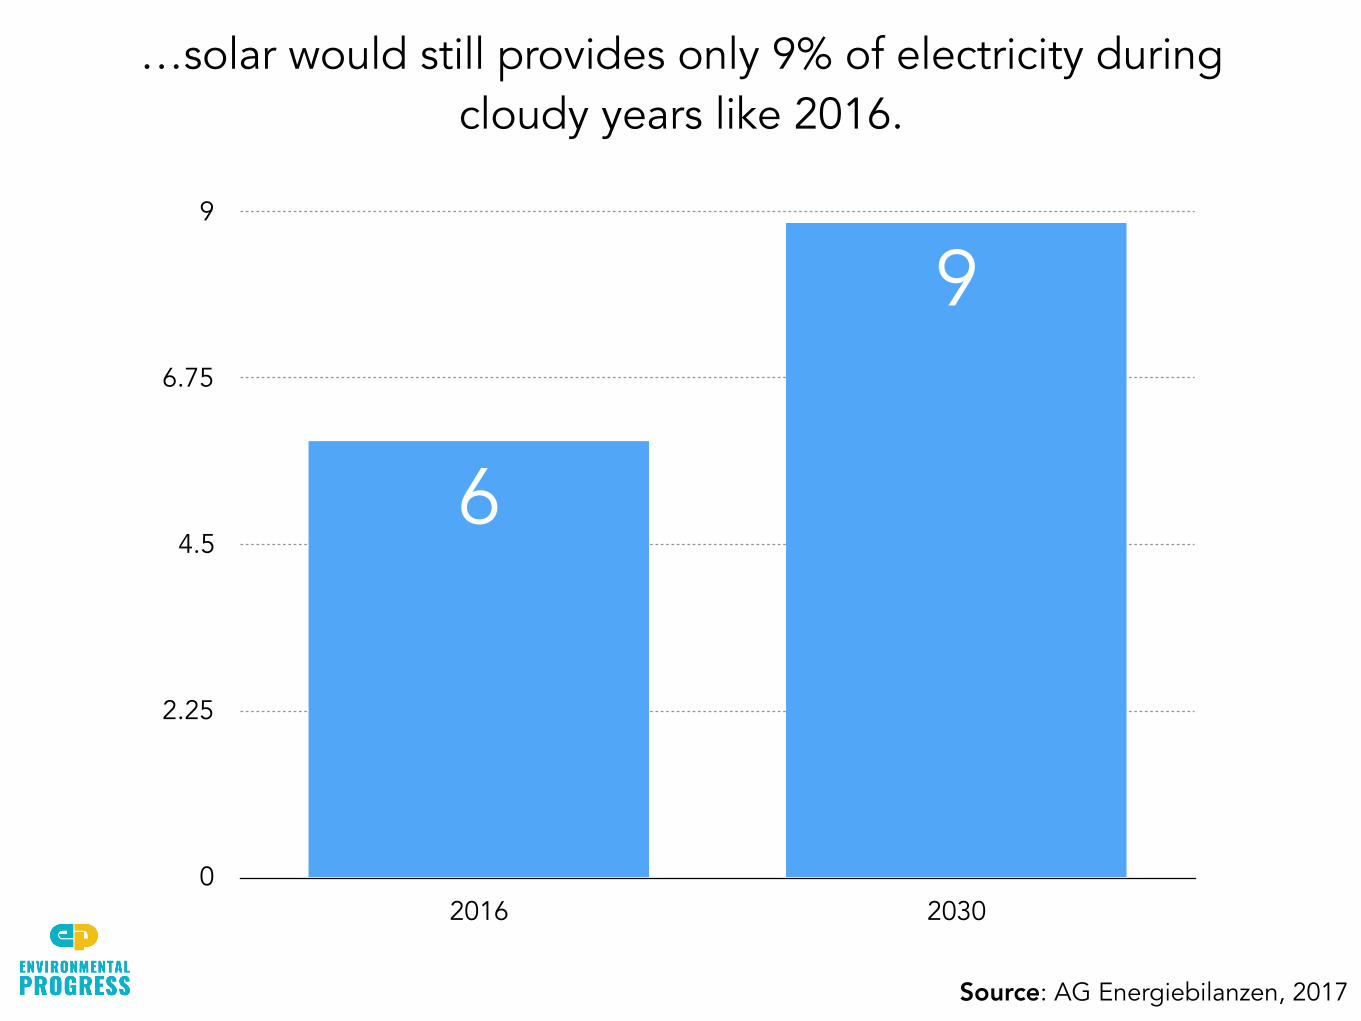
0
2.25
4.5
6.75
9
2016 2030
9
6
…solar would still provides only 9% of electricity during cloudy years like 2016.
Source: AG Energiebilanzen, 2017
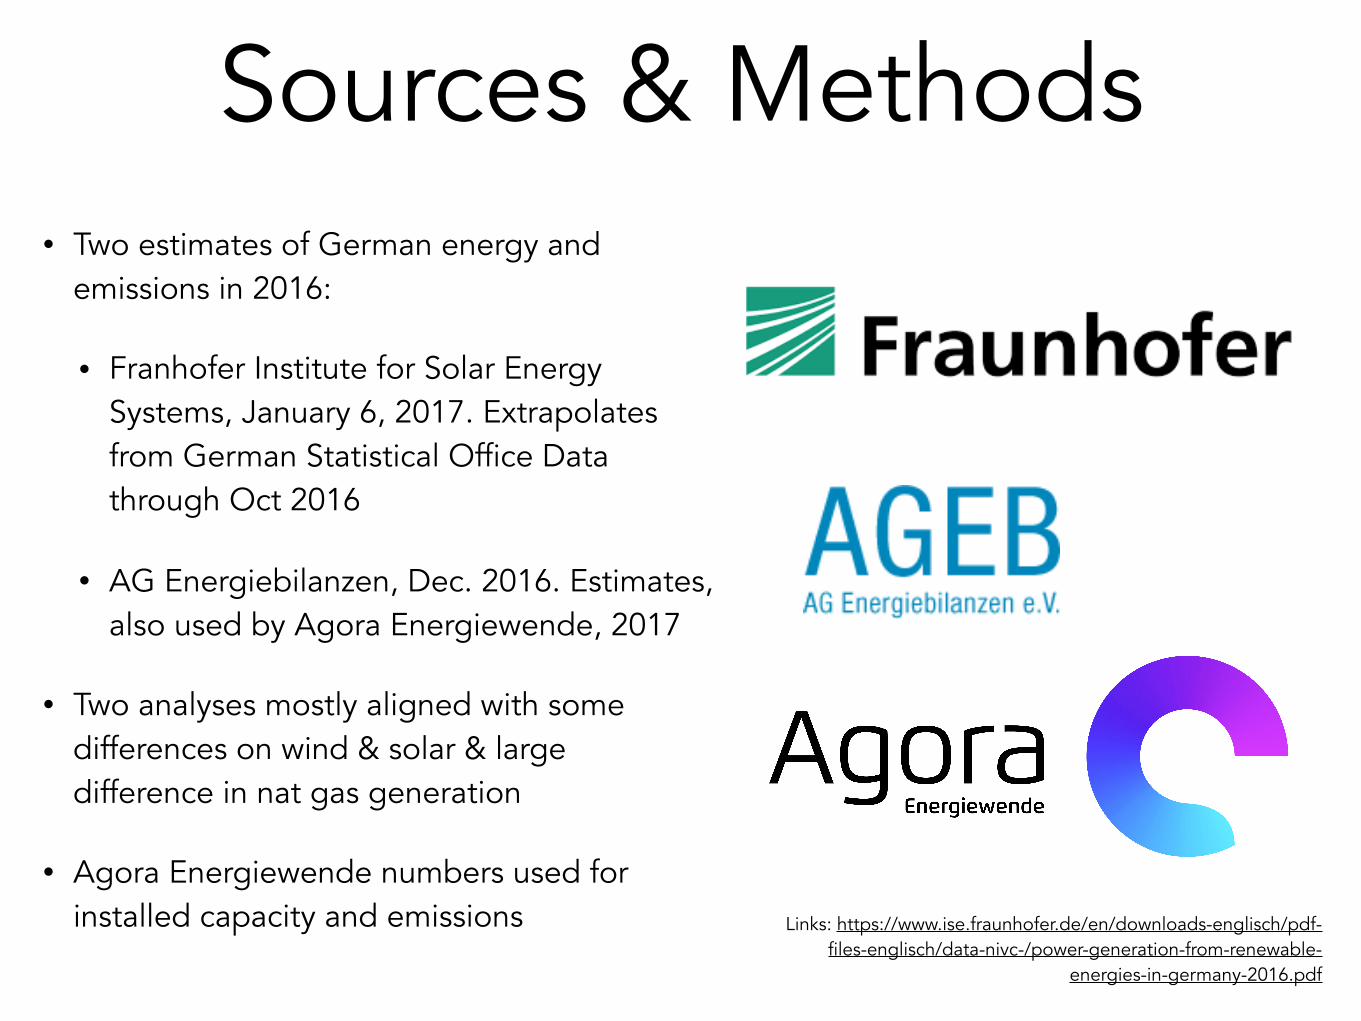
Sources & Methods• Two estimates of German energy and
emissions in 2016:
• Franhofer Institute for Solar Energy Systems, January 6, 2017. Extrapolates from German Statistical Office Data through Oct 2016
• AG Energiebilanzen, Dec. 2016. Estimates, also used by Agora Energiewende, 2017
• Two analyses mostly aligned with some differences on wind & solar & large difference in nat gas generation
• Agora Energiewende numbers used for installed capacity and emissions Links: https://www.ise.fraunhofer.de/en/downloads-englisch/pdf-
files-englisch/data-nivc-/power-generation-from-renewable-energies-in-germany-2016.pdf
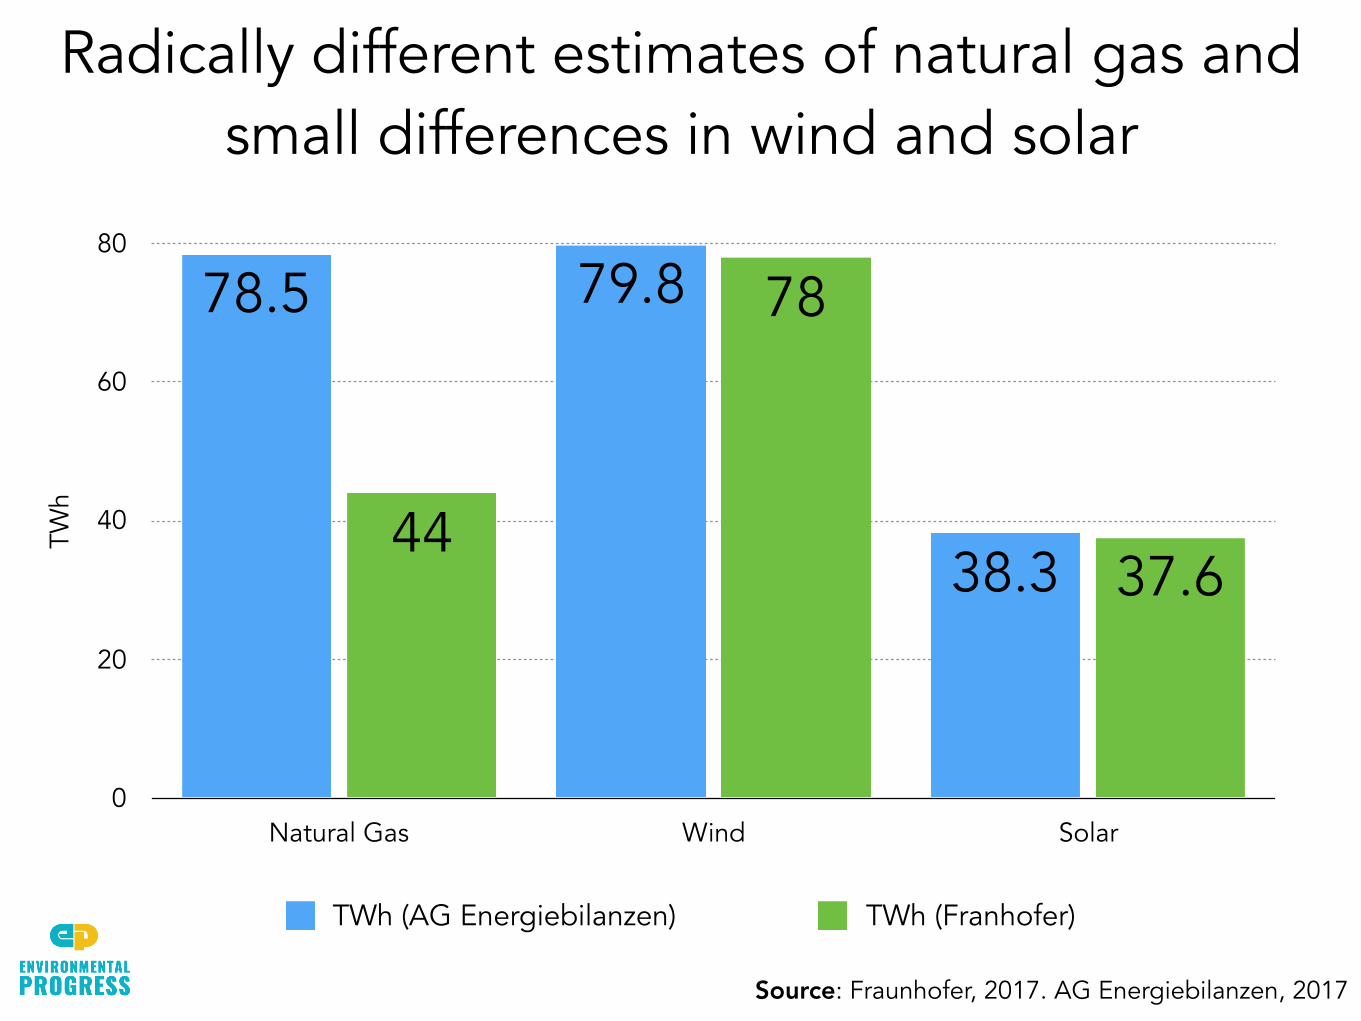
TWh
0
20
40
60
80
Natural Gas Wind Solar
37.6
78
4438.3
79.878.5
TWh (AG Energiebilanzen) TWh (Franhofer)
Radically different estimates of natural gas and small differences in wind and solar
Source: Fraunhofer, 2017. AG Energiebilanzen, 2017
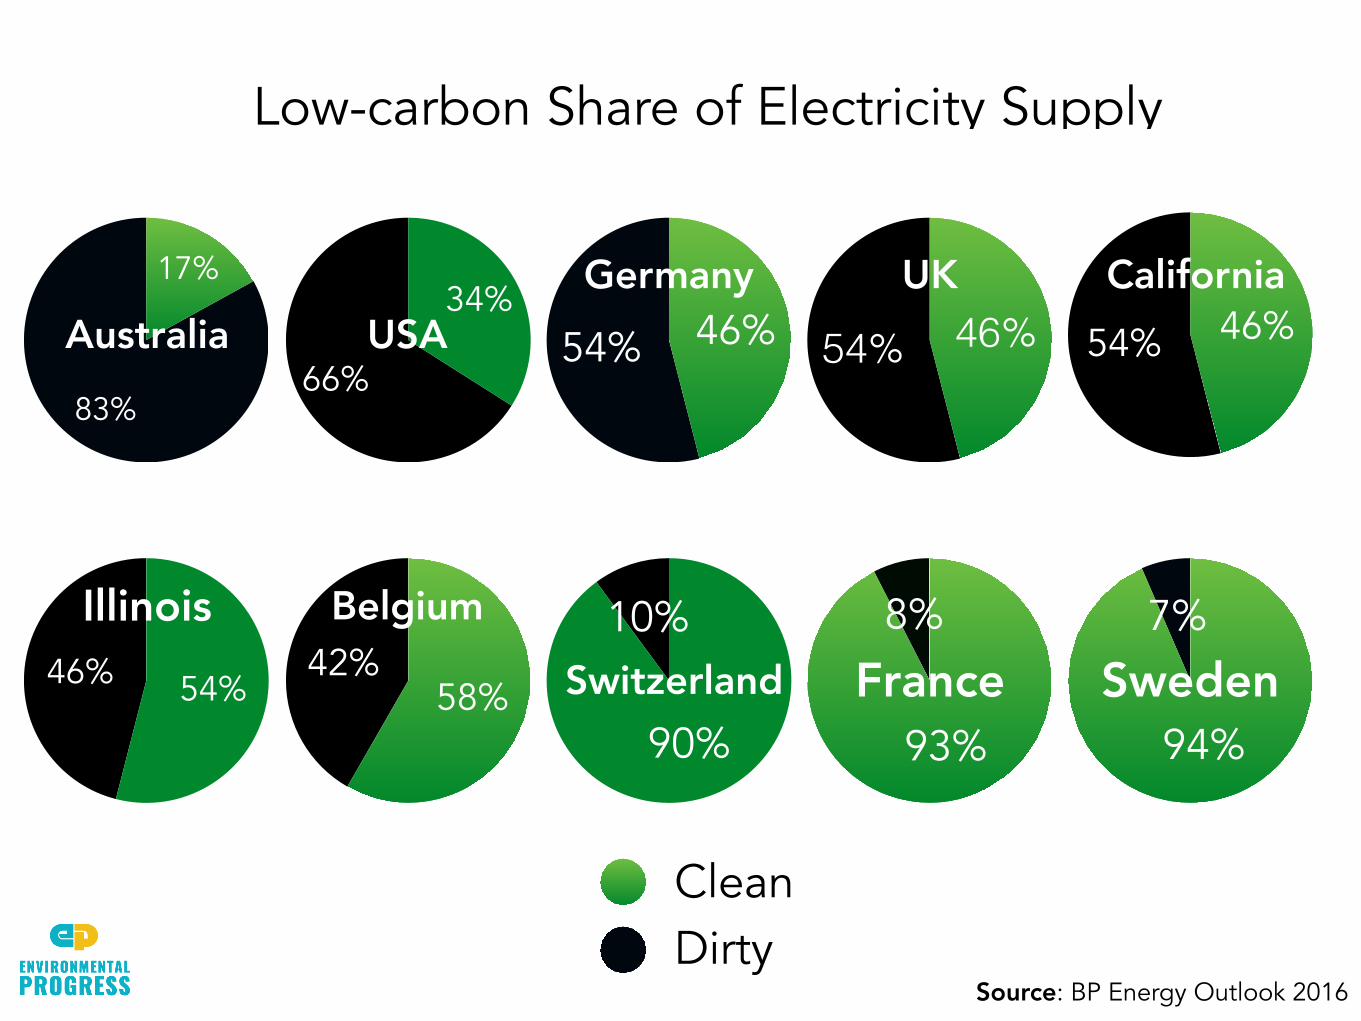
54% 46%
CleanDirty
7%
94%
8%
93%
Low-carbon Share of Electricity Supply
10%
90%
Germany
SwedenFranceSwitzerland
54% 46%UK
42%58%
Belgium
66%
34%USA
83%
17%
Australia 54% 46%California
46% 54%
Illinois
Source: BP Energy Outlook 2016
54%46%
Clean Dirty
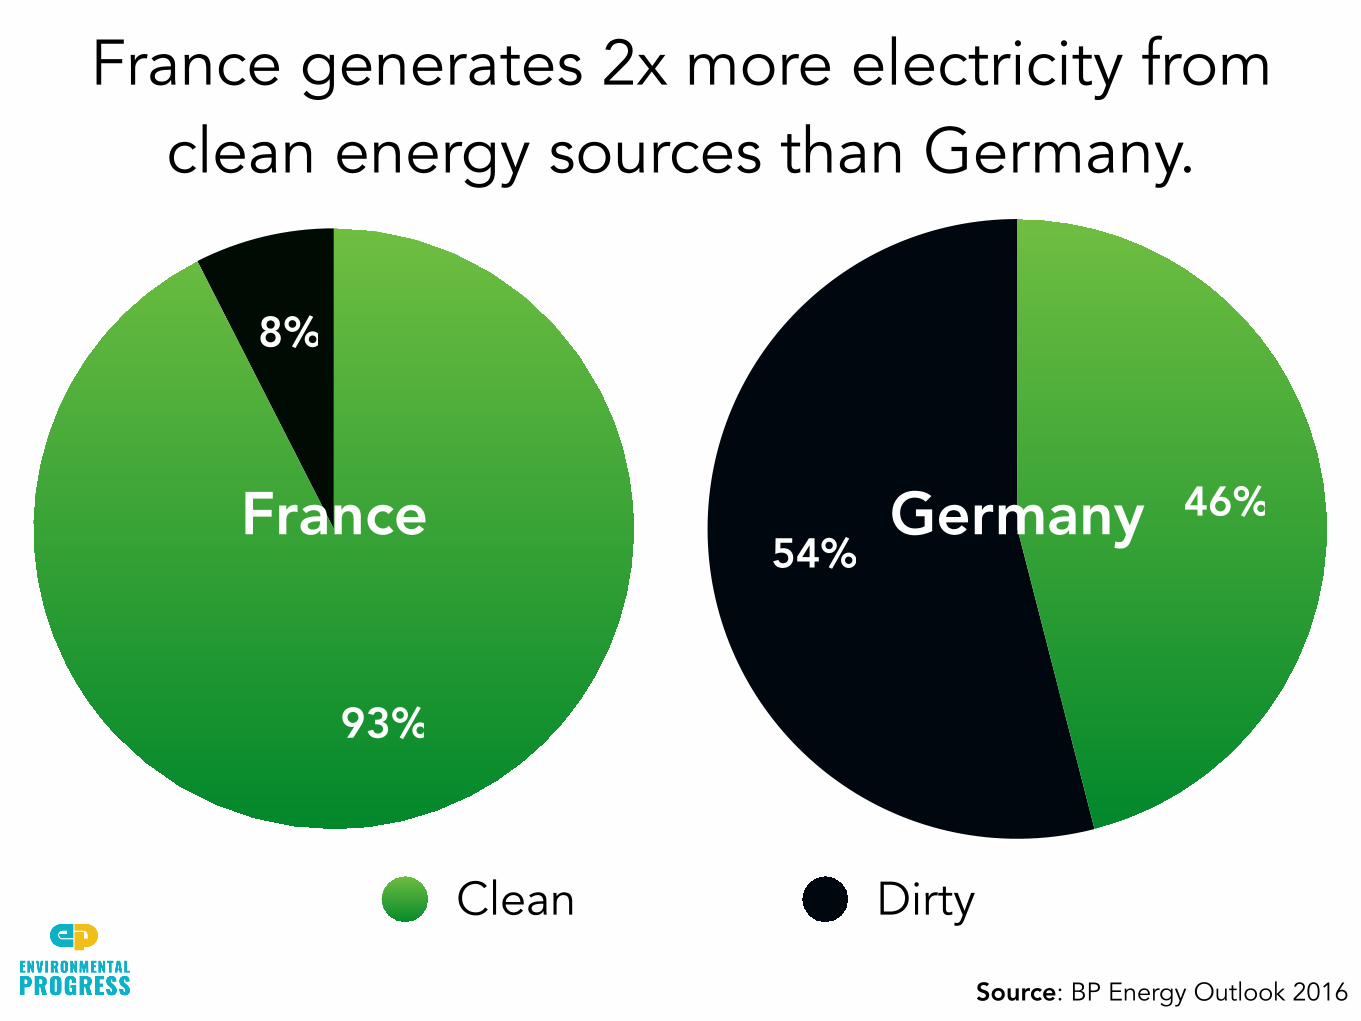
8%
93%
France generates 2x more electricity from clean energy sources than Germany.
GermanyFrance
Source: BP Energy Outlook 2016
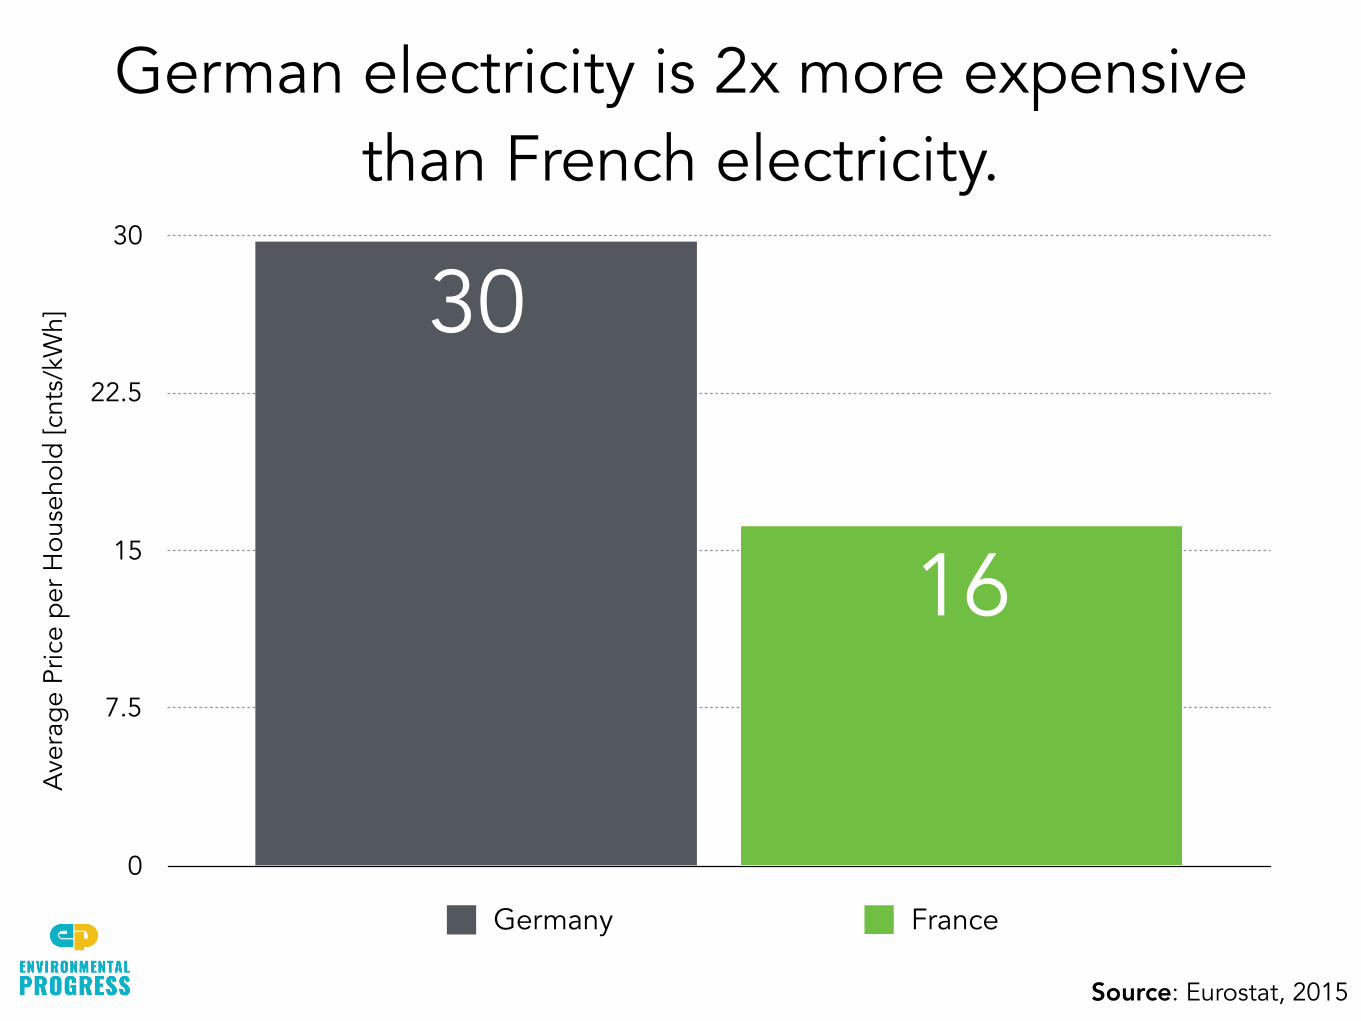
German electricity is 2x more expensive than French electricity.
Ave
rage
Pric
e pe
r Hou
seho
ld [c
nts/
kWh]
0
7.5
15
22.5
30
16
30
Germany France
Source: Eurostat, 2015
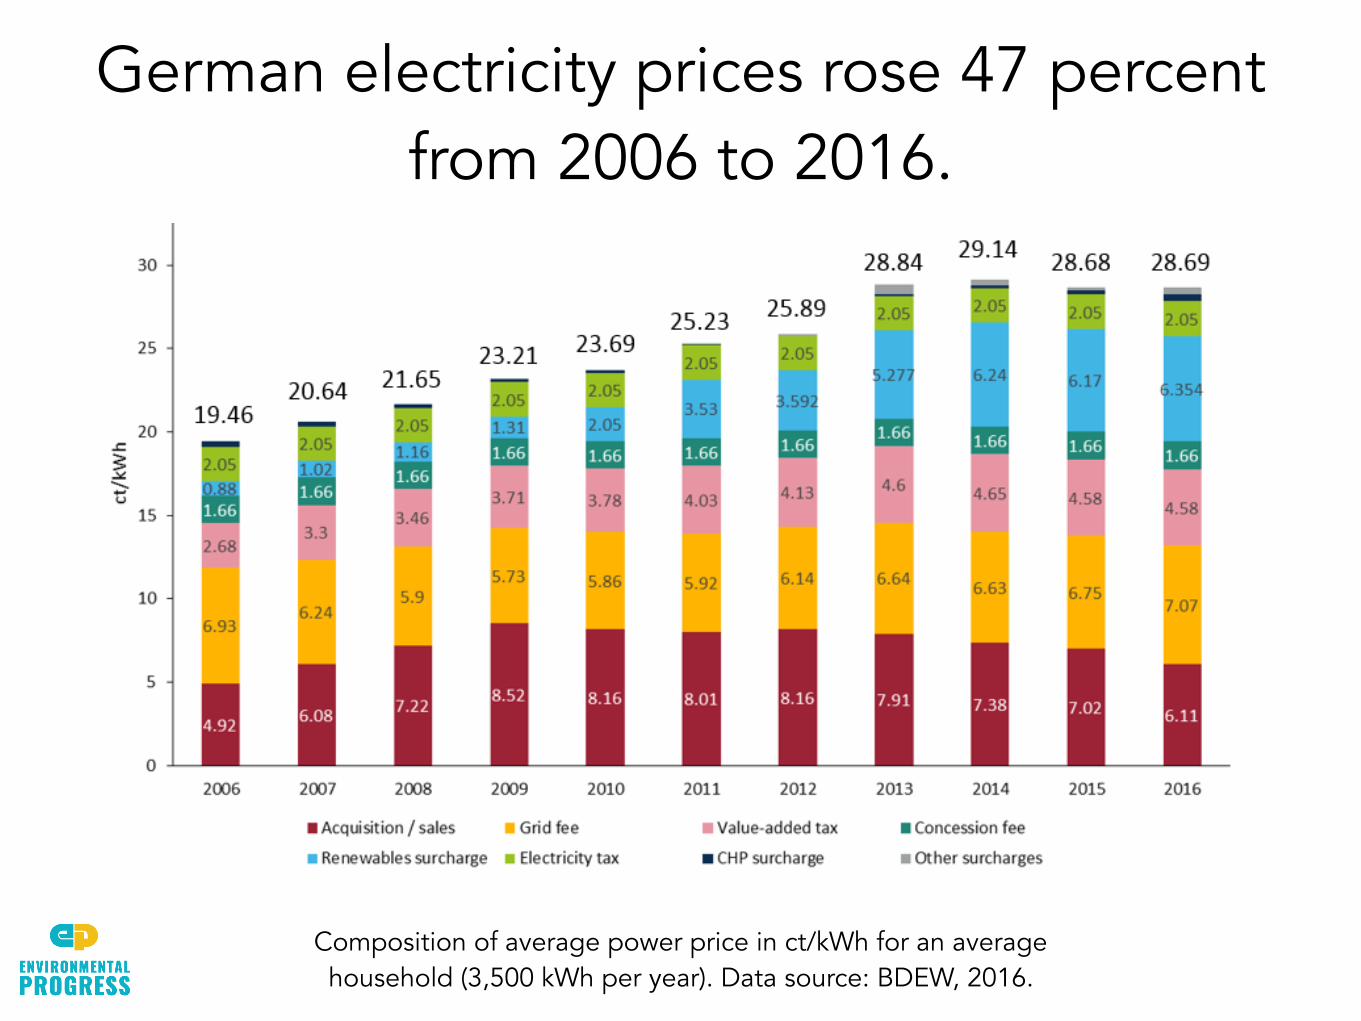
German electricity prices rose 47 percent from 2006 to 2016.
Composition of average power price in ct/kWh for an average household (3,500 kWh per year). Data source: BDEW, 2016.