germanium partitioning in silicon during rapid solidification · pdf filegermanium...
TRANSCRIPT

Germanium partitioning in silicon during rapid solidification D. P. Bruncoa) and Michael 0. Thompson Department of Materials Science and Engineering, Cornell University Ithaca, New York 14853
D. E. Hoglund and M. J. Aziz Division of Applied Sciences, Harvard University Cambridge, Massachusetts 02138
H.-J. Gossmann AT&T Bell Laboratories, Murray Hill, New Jersey 07974
(Received 3 October 1994; accepted for publication 11 April 1995)
Pulsed laser melting experiments were performed on Ge,Sir-, alloys (x60.10) with regrowth velocities ranging from 0.25 to 3.9 m/s. Analysis of post-solidification Ge concentration profiles, along with time-resolved melt depth measurements, allowed determination of the liquid-phase diffusivity Dt for Ge in Si and the dependence of the Ge partition coefficient k on interface velocity u . A Dt of 2.5X lo-” cm”/s was measured. The k vs v data were analyzed using various models for partitioning, including both the dilute and nondilute Continuous Growth Models (CGM). Extrapolating to zero velocity using the partitioning models, an equilibrium partition coefficient of approximately 0.45 was obtained. Best fitting of partitioning data to the nondilute CGM yields a diffusive speed of 2.5 m/s. These measurements quantify previous indications of partitioning observed in other studies of pulsed laser processed Ge$+ --x alloys. 0 1995 American Institute of Physics.
I. INTRODUCTION
The behavior at the solid/liquid interface during rapid solidification of binary alloys can be substantially different than during conventional solidification processing. Under normal conditions, solute partitioning at the interface is in accordance with the equilibrium phase diagram, even when significant concentration and temperature gradients exist in the adjacent phases.’ This condition of local interfacial equi- librium, however, can be violated during rapid solidification. In this case solute atoms have insufficient time for equilib- rium partitioning before being engulfed by the solidifying matrix. Solute segregation is characterized by the partition coefficient k, defined as the ratio of the atomic fraction of solute in the solid X, to that in the liquid XI at the interface jk = X, /XI). In general k is a function of interface velocity v and ranges from its equilibrium value k, during slow solidi- fication to a value thought to approach unity at sufficiently high solidification velocities.
Several models have been proposed for the velocity de- pendence of solute partitioning, but the Continuous Growth Model (CGM)’ has proved particularly successful in describ- ing the k(v) relation in a number of systems.3-6 For Henrian solutions, the nondilute CGM expression for k may be writ- ten as
W,X,,v)= K,(T)+[1-K,(T)]X,+VIv~
1 +v/vp 9 (1)
where T is the interface temperature, K, is the equilibrium partition coefficient for the solute (Ge) divided by that for the solvent (Si) [K,(T) =k,(T)lks’(T)], and the “diffusive speed” vg is conceptually defined as the ratio of the solute
‘)Electronic mail: [email protected]
diffisivity at the interface to the interface width. This expres- sion is most typically used in its dilute limit, where it sim- plifies to2
r
At v=uD, k is in mid-transition between k, and unity. In addition to a velocity dependence, nonequilibrium partition- ing has been observed to depend upon the crystallographic orientation of the growing solid. In the Aperiodic Stepwise Growth Model (ASGM),7 Goldman and Aziz extended the. CGM to include these orientational effects and described the behavior of k for Bi impurities in Si. The model has since been successfully applied to the orientational dependences of several other impurities in Si.sT9
Technological applications employing rapid solidifica- tion often exploit the solute trapping behavior at high veloci- ties to achieve structures not readily attainable with conven- tional processing. Pulsed laser crystallization of Ge,Sir-, alloys (x50.2) is one such application and has been studied by many groups for producing device-quality thin films.” In these studies, an initially amorphous layer of either pure Ge”-‘4 or GeSi al10y’~-~* on Si is laser melted and rapidly solidified, resulting in strained heteroepitaxial growth of Ge,Sit -,/Si under appropriate conditions. Despite the short duration of the melt (typically 50 - 100 ns), Ge diffusion in the liquid is significant and, in fact, critical for homogeniza- tion in most of the reported works. While liquid-state diffu- sion is often beneficial, Ge partitioning at the interface dur- ing solidification is invariably detrimental. In reported pulsed laser crystallization experiments, qualitative indications of segregation have been observed in the GelSi system,‘2*‘3 with segregation effects quite dramatic in some cases.11*14*16 Proper interpretation and understanding of these results re- quire quantitative measurements of both the Ge diffusion co-
J. Appl. Phys. 78 (3), 1 August 1995 0021-8979/95/78(3)/i 575/8/$6.00 Q 1995 American Institute of Physics 1575 Downloaded 22 Jul 2003 to 128.103.60.225. Redistribution subject to AIP license or copyright, see http://ojps.aip.org/japo/japcr.jsp

efficient in the liquid phase DL and the velocity dependence of Ge partitioning k(v j. +Si(Ge) film
In addition to its interest for technological applications, GeSi alloys are also a nearly ideal system to study laser- induced phase transformations and to examine theories of rapid solidification.‘~9~‘9,20 For example, early measurements of solute partitioning performed on both the Si and Ge rich sides of the phase diagram were used to distinguish between two theories with identical predictions (under certain as- sumptions) for the velocity dependence of k, but different predictions for composition dependence.” These early ex- periments were performed at high velocities (with little par- titioning) where accurate, quantitative measurements are dif- ficult. More recently, Reitano et CZL.**~ studied the partitioning of Ge and other impurities in single-crystal Si. They found k’s consistent with the ASGM7 for As, Ga, In, Sb, and Sn impurities in silicon, but inconsistent for Ge in Si. Thus, this work also serves to provide quantitative Dl and k(u) data for this important model system and to explain the anomalous result for Ge in Si observed by Reitano.’
Al contact
-1 mmh
(b) pulsed XeCl laser (308 nm, 30 ns)
1 1 1 1 1 1
In this paper, we present our measurements of Dl and k(u) for Ge in Si. The k(u) data are fit to many of the partitioning models in the literature, including both the dilute and nondilute CGM. With the CGM models, we find a.dif- fusive speed of approximately 2.5 m/s and compare this to values for other impurities in silicon. We also extrapolate to zero velocity the fits of the k(u) data to obtain an equilib- rium partition coefficient of approximately 0.45. To our knowledge, this is the first time partitioning models have been extrapolated to equilibrium conditions to determine k,. Additionally, we provide estimates of k during pulsed laser assisted heteroepitaxy of Ge,Si,-,/Si, and we report results of a revised analysis of data from Reitano and co-workers.’
c-w CO2 heatlng laser
FIG. 1. (a) Top view of TCM sample. (b) Schematic of SOI sample irradia- tion and TCM data collection. A bias voltage V, of 25 V, and 50 R. source R, and load RL resist9rs were used. Figure for SOS sample irradiation is similar, except the SiO, /Si substrate/graphite paint is replaced by the sap- phire substrate.
Ii. EXPERIMENT
Laser melting and solidification experiments were per- formed with a variety of silicon-on-insulator (SOI) and silicon-on-sapphire (SOS) samples. The SO1 substrates con- sisted of (100) oriented Si on about 1 pm of thermally oxi- dized silicon while SOS substrates were (100) Si on ( 1102) A&O, . The Si film thicknesses ranged from 0.2 to 0.6 ,um. For low Ge concentrations, SO1 and SOS substrates were ion impla@ed with 76Ge at 80 keV, a 7” tilt, and a 5 X 1015 cm-’ dose. Rutherford backscattering spectrometry (RBS) showed the implant to be well-described by an Edge- worth distribution”’ using a projected range of 59 nm, a straggle of 22 run, a skewness of 0.45, and a kurtosis of 3.1. This corresponds to a peak Ge concentration of 1.8 at.% at a depth of 53 run. Higher Ge concentrations were obtained with deposited films. SOS substrates with 50 nm epitaxial Ge,Sil --x (x=0.04 and 0.10) films were grown by Molecular Beam Epitaxy (MBEj at a deposition pressure below 5 X lo- lo Tom Th: Si was evaporated from an electron beam source and the Ge was coevaporated from a Knudsen cell. An additional SOS substrate had a 50 nm amorphous Ge0.0$io.9(, layer grown by electron beam evaporation at a pressure of 5X 10e7 Ton:
Using microelectronics fabrication techniques, the samples were processed for transient conductance measure- ments (TCM)~~J~ to provide time-resolved melt depth infor- mation. The implmted samples were first patterned with 350 nm thick Al contact pads and then implanted under the pre- scribed conditions. The Si(Ge) layer was patterned with pho- toresist and reactively ion etched (SF6/OZ plasma) into a me- andering path resistor with a length-to-width (L/w) ratio of 65 and a confined area of 1 X I mrn2[Fig. l(a)]. Following Si(Ge) patterning, the samples were anneaIed at 500 “C for 30 min to minimize contact resistance to the Al pads. The samples with deposited Ge,Sil-, films on SOS were pro- cessed similarly, but with the Al deposited after the Ge,S&-, deposition and patterning. ’ ”
The patterned samples were irradiated with a single pulse from a XeCI excimer laser (308 nm; 30 ns J?WHM) with simultaneous measurements of transient sample con- ductance [Fig. l(b)]. The TCM technique exploits the large conductivity difference between the semiconducting solid and the metallic liquid to determine time-resolved melt depths during laser processing. The small amount of conduc- tion from the hot solid was subtracted’0*23 before using the TCM data in subsequent analysis. Laser fluences were cho- sen to give melt depths of typically 150 to 200 nm. To access slower regrowth velocities, some samples were preheated from the backside for a few seconds with a CO2 laser (10.6 pm). To aid coupling of infrared laser energy to sample heat- ing, the backsides of the SO1 wafers were coated with carbon paint; such coating was unnecessary for the SOS substrates. During regrowth, velocities were not constant but slowed as the interface approached the surface. For consistency, veloci-
1576 J. Appl. Phys., Vol. 78, No. 3, 1 August 1995 Brunco et al.
Downloaded 22 Jul 2003 to 128.103.60.225. Redistribution subject to AIP license or copyright, see http://ojps.aip.org/japo/japcr.jsp

ties reported in this work correspond to v at melt depths of 50 nm.
Rutherford backscattering with 2 MeV 4He in a grazing exit angle configuration was used to measure concentration profiles before and after laser irradiation. Experimental post- irradiation RBS spectra were compared with those generated by simulations of Ge liquid-phase diffusion and pa&tioning at the solidniquid interface. The simulations employed a moving interface Crank-Nicolson algorithm and required in- puts of the initial Ge concentration profile, the melt depth vs time history, D, for Ge in silicon, and an expression for k(v). To reflect the v dependence of k, Eq. (2) was used with k, set to a nominal value of 0.4 and the value of vD allowed to vary. Because each experiment samples only a small range of velocities, the exact analytical form of k(v) is not significant. To a large degree, the use of tli6 dilute CGM equation simply guarantees a reasonable estimate for dkldu about the average u (and thus, k) for a particular regrowth experiment. These diffusion and partitioning simulations pro- duced final Ge concentration profiles that were compared to experimental RBS data using the analysis program RlJMP.24
Depth (nm) 150 100 0
120 I (4
I I I
80 = Irradiated: v = 1.52 m/s
9 El 60 8
- -Simulation: Fix D,
RBS Channel
A nonlinear least squares search algorithm was used to obtain best fit values for Dl and vD for each irradiated sample. The difference between the experimental and simu- lated RBS profiles at each channel was divided by the statis- tical uncertainty (dc) and then squared. These squares were summed over the channels in the RBS data for the Ge peak, and this sum was minimized by appropriately varying Dl and vD. Occasionally, poor fitting resulted when using our TCM data directly for melt depth profiles. To improve the fit for these cases, we scaled the melt depths obtained from TCM by up to 10% of the original values. This repre- sents the magnitude of the uncertainty in the conductance measurements. Such scaling was found to have a minimal, but beneficial effect on overall fitting results. After initially fitting all the data with both D, and uD free to vary, the DI values were averaged (result: Dl=2.5X 10m4 cm*/s), and the simulations were performed again with Dl fixed and vD al- lowed as a fitting parameter. The k(v) data presented in this work correspond to the fixed Dl simulations.
100 Time (ns)
FIG. 2. (a) Experimental and simulated RBS spectra for an implanted SOS sample with a peak melt depth of 190 nm and a r&growth velocity of 1.52 m/s. Solid curve: best fit obtained varying DI (2.19X lo-” cm%) and uD i2.88 m/s). Dashed curve: best fit obtained with Dl fixed (2.5X10m4 cm’/s) and varying uD (2.81 m/s). (b) Raw melt history (dashed) and data corrected for hot solid conduction (solid).
In making these measurements, an accurate RBS detec- tor calibration is critical.” For large values of k, a small Ge surface peak results and small errors in calibrating the RBS channel number for backscattering from surface Ge can lead to non-negligible errors in k. Fortunately, the presence of surface Si and Ge allows the samples to be essentially self- calibrating. The Ge peak “leading edge” from optimized simulated RBS spectra were compared with experimental spectra to verify proper detector calibration. If necessary, the calibration was adjusted and the analysis was performed again to find new optimized Dl and vD values. This process was repeated until a reliable, self-consistent detector calibra- tion was obtained.
7hGe and correspond to a total depth of approximately 200 nm. An Edgeworth distribution was fit to the as-implanted RBS spectrum (collected with a different scattering geom- etry) and is shown in the figure for reference.
In Fig. 2(b) the raw conductance data (converted to an equivalent liquid thickness) and the actual liquid thickness (corrected for solid conductior? and smoothed for numerical stability) are shown. These example data correspond to a sample preheated by a CO2 laser and irradiated at a fluence of 0.50 J/m2.
III. RESULTS
Typical segregation measurements and simulations for a laser irradiated, ion implanted SOS sample are shown in Fig. 2(a). The RBS spectra show only scattering events from the
Following irradiation, the Ge protile broadens by diffu- sion and is segregated to the surface as shown by the experi- mental data points in Fig. 2(a). Using the measured initial concentration profile [Fig. 2(a)] and corrected melt history [Fig. 2(b)] as inputs, a best fit simulation to the post- solidification spectrum yielded a DI of 2.19X lo-” cm2/s with a vD of 2.88 m/s. This simulation is shown by the solid curve in Fig. 2(a).
For all samples, the liquid diffusivities were determined in a similar manner, and Fig. 3 summarizes these data. Given
J. Appl. Phys., Vol. 78, No. 3, 1 August 1995 Brunco et a/. 1577 Downloaded 22 Jul 2003 to 128.103.60.225. Redistribution subject to AIP license or copyright, see http://ojps.aip.org/japo/japcr.jsp
0 0
*
X Average D, A
------G-x---- Q 4 --------- 0
Q VA*, 0
I X e-beam 4% Ge / SOS * MBE4% Ge/SOS I
1 OMBElO%Ge/SOS 1
1 2 3
Velocity (m/s)
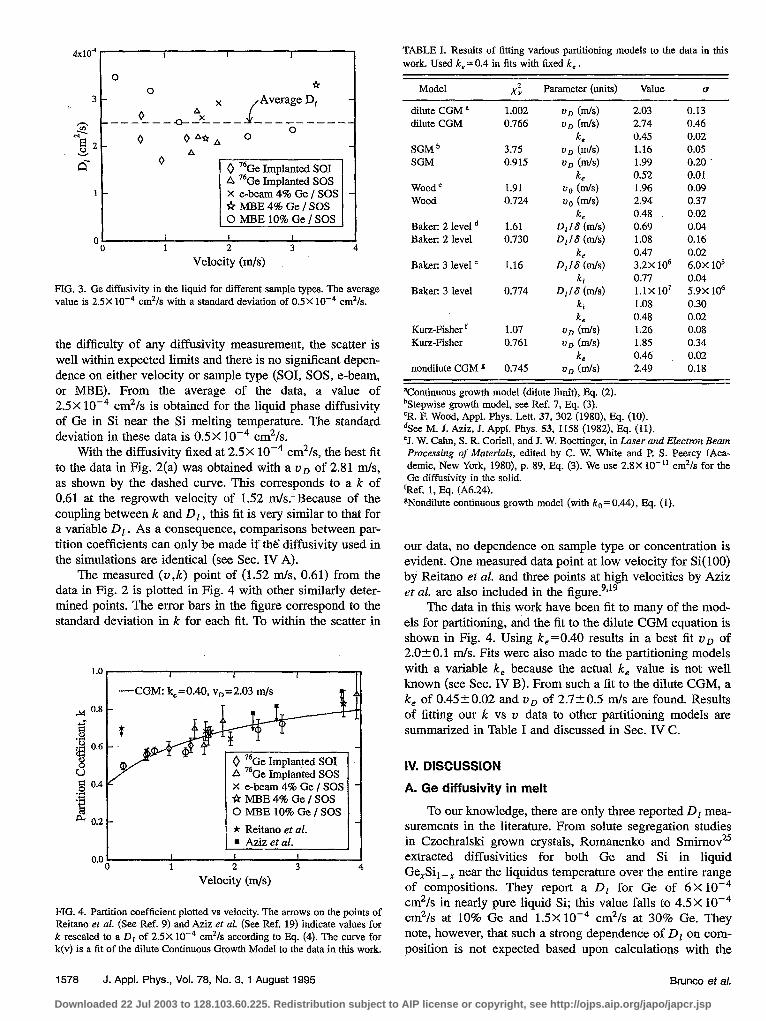
FIG. 3. Ge diffusivity in the liquid for different sample types. The average value is 2.5X low4 cmz/s with a standard deviation of 0.5X 10m4 cmz/s.
the difficulty of any diffusivity measurement, the scatter is well within expected limits and there is no significant depen- dence on either velocity or sample type (SOI, SOS, e-beam, or MBE). From the average of the data, a value of 2.5X 10e4 cmzls is obtained for the liquid phase diffusivity of Ge in Si near the Si melting temperature. The standard deviation in these data is 0.5X 10m4 cm’ls.
with the diffusivity fixed at 2.5 X 10d4 cm’/s, the best fit to the data in Fig. 2(a) was obtained with a uo of 2.81 m/s, as shown by the dashed curve. This corresponds to a k of 0.61 at the regrowth velocity of 1.52 m/s.-Because of the coupling between k and Dl, this fit is very similar to that for a variable D, . As a consequence, comparisons between par- tition coefficients can only be made if thg diffusivity used in the simulations are identical (see Sec. IV A).
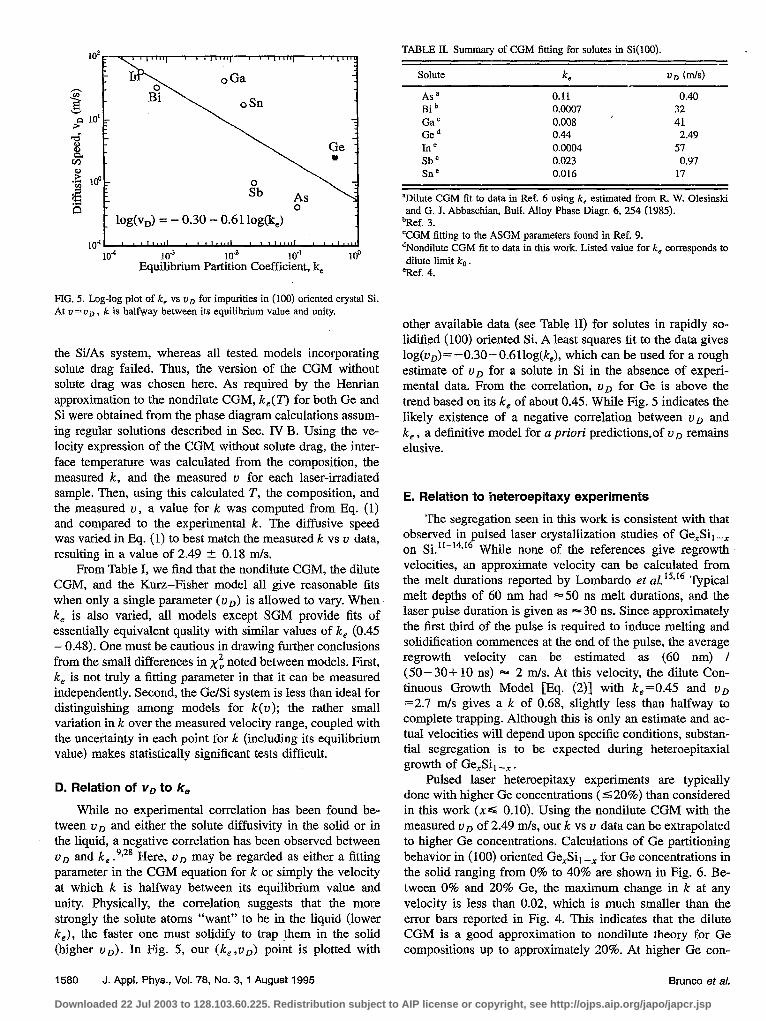
The measured (u ,k) point of (1.52 m/s, 0.61) from the data in Fig. 2 is plotted in Fig. 4 with other similarly deter- mined points. The error bars in the figure correspond to the standard deviation in k for each fit. To within the scatter in
A 0.8 - ,.
8
i”.6 u $j 0.4 c
:3 5 a 0.2 -
-CGM: k,=O.40, v,=2.03 m/s
X e-beam 4% Ge / SOS ir MBE4%Ge/SOS 0 MBE 10% Ge / SOS
* Reitano et al.
0.0 0
= Aziz et al. I I I 1 2 3 4
Velocity (m/s)
PIG. 4. Partition coefficient plotted vs velocity. The arrows on the points of Reitano et cl. (See Ref. 9) and Aziz t-r al. (See Ref. 19) indicate values for k resealed to a Dr of 25X 10m4 cmz/s according to Eq. (4). The curve for k(v) is a fit of the dilute Continuous Growth Model to the data in this work.
1578 J. Appl. Phys., Vol. 78, No. 3, 1 August 1995 Brunco et al.
TABLE I. Results of fitting various partitioning models to the data in this work. Used k,= 0.4 in fits with fixed k, .
Model 2 XV Parameter (units) Value o-
dilute CGM a 1.002 VII Ws) 2.03 0.13 dilute CGM 0.766 ug Ws) 2.74 0.46
k 0.45 0.02 SGM b 3.75 VD Ws) 1.16 0.05 SGM 0.915 VD Ws) 1.99 0.20
ke 0.52 0.01 Wood ’ 1.91 uo (m/s) 1.96 0.09 Wood 0.724 vo W) 2.94 0.37
ke 0.48 0.02 Baker: 2 level d 1.61 zl,/6 (m/s) 0.69 0.04 Baker: 2 level 0.730 D116 (m/s) 1.08 0.16
k 0.47 0.02 Baker: 3 level ’ 1.16 D,lS (m/s) 3.2X lo6 6.0X 10s
ki 0.77 0.04 Baker: 3 level 0.774 D,/S (m/s, 1.1x IO7 5.9x lo6
k, 1.08 0.30 k 0.48 0.02
Kurz-Fisher f 1.07 ug (m/s) 1.26 0.08 Kurz-Fisher 0.761 UD (m/s) 1.85 0.34
k, 0.46 0.02 nondilute CGM s 0.745 un (m/s) 2.49 0.18
BContinuous growth model (dilute limit), Bq. (2). bStepwise growth model, see Ref. 7, Eq. (3). CR. E Wood, Appl. Phys. Lett. 37, 302 (1980), Eq. (10). dSee M. J. Aziz, I. Appl. Phys. 53, I158 (1982). Eq. (11). 7. W. Cahn, S. R. Coriell, and J. W. Boettinger, in Laser and Electron Beam Processing of Materials, edited by C. W. White and P. S. Peercy (Aca- demic, New York, 1980), p. 89, Bq. (3). We use 2.8X lo-” cm*/s for the Ge diffusivity in the solid.
fRef. 1, Eq. (A6.24). sNortdilute continuous growth model (with ko=0.44), Eq. (1).
our data, no dependence on sample type or concentration is evident. One measured data point at low velocity for Si( 100) by Reitano et al. and three points at high velocities by Aziz et al. are also included in the figure?,r9
The data in this work have been fit to many of the mod- els for partitioning, and the fit to the dilute CGM equation is shown in Fig. 4. Using k,=0.40 results in a best fit uo of 2.OkO.l m/s. Fits were also made to the partitioning models with a variable k, because the actual k, value is not well known (see Sec. IV B). From such a fit to the dilute CGM, a k, of 0.45 4 0.02 and ug of 2.7? 0.5 m/s are found. Results of fitting our k vs u data to other partitioning models are summarized in Table I and discussed in Sec. IV C.
IV. DISCUSSION
A. Ge diffusivity in melt
To our knowledge, there are only three reported DI mea- surements in the literature. From solute segregation studies in Czochralski grown crystals, Romanenko and Smimov25 extracted diffusivities for both Ge and Si in liquid Ge,Sit --x near the liquidus temperature over the entire range of compositions. They report a Dl for Ge of 6X 10v4 cm2/s in nearly pure liquid Si; this value falls to 4.5X low4 cm’/s at 10% Ge and 1.5X 10m4 cm*/s at 30% Ge. They note, however, that such a strong dependence of Dl on com- position is not expected based upon calculations with the
Downloaded 22 Jul 2003 to 128.103.60.225. Redistribution subject to AIP license or copyright, see http://ojps.aip.org/japo/japcr.jsp

Einstein-Stokes equation. Additionally, they indicate a large degree of uncertainty in their Dl measurements. Considering the differences in regrowth velocities (ml vs =lO-” m/s) and techniques for measuring Dl, a factor of about 2.5 be- tween the DI given here and by Romanenko and Smirnov is not surprising. Another reported D, is 4 X lo-” cm2/s by Aziz et aLI using a similar technique to that used here. More recently, Reitano et al9 contributed a Dl of 3 X loo4 cm’/s. Their experiments, conducted to determine the effect of crystallographic orientation on k(u), used measured melt durations and heat flow calculations to estimate melt depth profiles and used a somewhat different analysis technique than that presented here.
A simple approximation can be made to show how an error in D, affects the measurement of k. In practice, the area of the surface peak in the solute concentration profile is ex- perimentally observable [as, for example, in Fig. 2(a)], and k is extracted primarily from the magnitude of this peak. For a smaller value of k, more solute is swept to the surface and a larger surface peak results. During steady-state solidification, the amount A of excess solute in the surface peak for a growing solid of composition C, is simply’
A=C, $1 :. i i
From this equation, we find that for a fixed C, the same surface peak area will result by using either k, , D, , and v1 or kZ, D2, and v2, provided that
k2=k@)(z)[ I+(22 -l)k’]-‘.
Applying this equation to the data of Aziz,r9 their k’s determined with a Dl of 4 X loo4 cm’fs can be approxi- mately converted to k’s (at the same velocity) using the Dl determined in this work. That is, their reported k’s of 0.78, 0.82, and 0.90 correspond to values of 0.69, 0.74, and 0.85 (see Fig. 4) for our Dl of 2.5X low4 cm’/& With this correc- tion, those earlier measurements are almost identical to re- sults reported in this work. However, the 0.70 value reported by Reitano et aL9 with D, =3.0X 10F4 cm21s is reduced only to a k of 0.66 for our liquid diffusivity. While this brings it closer to our observed k(v) curve, a significant difference is still apparent.
B. Equilibrium partition coefficient
In previous sections, a value of 0.40 has been used for the equilibrium partition coefficient; this is higher than the values of 0.33 or 0.3 typically used.9V’9 There is considerable uncertainty in k, with published values ranging from 0.25 to 0.45. The primary reference for a “direct” measurement of the phase diagram is the 1939 paper by StGhr and Klemm,a6 from which k, values of 0.25 at 10% Ge and 0.32 at 20% Ge may be extracted. However, their phase diagram is inconsis- tent with a general relation valid for all solutions in the dilute limit.’ The equilibrium partition coefficient in the dilute limit k0 is related to the liquidus slope m, the solvent’s enthalpy of fusion A Hf , and the solvent’s fusion temperature Tf by
mAHf ko=l-F.
f (5)
Taking a liquidus slope of - 185 K at 10% Ge from St&r and Klemm’s GeSi phase diagram, a value of 0.60 is calcu- lated for kO, which is very different than their reported k, of 0.25. This discrepancy indicates the care that must be taken in choosing the value for k, .
The GeSi phase diagram was reviewed by Olesinski and Abbaschian” in 1984. In their review, they used free energy of fusion functions for the pure components and varied regu- lar solution parameters to best fit the original St&r-Klemm data plus a few points measured in 1955 from the Ge rich side of the phase diagram. Their calculated phase diagram with this regular solution approximation matched experimen- tal points well using liquid and solid interaction parameters, fi2, and R, , of 6.50 and 3.50 kJ/mole, respectively. Our cal- culations with these parameters give a k0 of 0.44, with the equilibrium partition coefficient not changing appreciably until the Ge composition in the liquid exceeds about 60%. This is very similar to the experimental results seen by Ro- manenko and Smirnov.Z They observed a nearly constant k, for Ge of about 0.45 with a scatter of about O..OS over the composition range from 10 to about 60% Ge in the melt.
In light of the uncertainty concerning the Stohr-Klemm data on the silicon rich side of the phase diagram and the above discussion, the assumption of k,=0.4 used in our analysis seems reasonable. Moreover, if we assume the va- lidity of the dilute CGM equation in describing k(v), the extrapolation of our data to zero velocity provides an inde- pendent measurement of k, . This k, value of 0.4510.02 is consistent with the k0 of 0.44 calculated using published thermodynamic parameters.” Extrapolations to k, for other models are given in Table I. All models except the Stepwise Growth Model give k,‘s between 0.45 and 0.48. The anoma- lous k, for the SGM is not surprising because this model poorly fits both our k(v) data (high xt) and data for Bi in Si.’
Finally, we note that the extrapolation of k(v) to a rea- sonable k, provides a good check on, and further verification of, the overall validity of our measured k vs v characteristic.
C. Models for partitioning
Many models have been proposed for the dependence of k on interface velocity. Table I presents fitting results for some of these models to the measured k(v) data shown in Fig. 4. These fits were weighted by the error bars shown in the figure, and the reduced cm-squared values ,y”, given in the table provide a measure of the “goodness” of the fit. Except for the nondilute CGM, fits for all models were done with both a presumed k, of 0.40 and with k, allowed to vary.
The fitting procedure for the nondilute CGM2 was con- siderably more involved, largely because an estimate for the interfacial temperature was required. The nondilute CGM has expressions for both the partitioning and velocity “inter- face response functions,” and the velocity expression comes in two versions: “with solute drag” and “without solute drag.” The theory without solute drag has recently been shown by Kittl et aL5 to model well the interface kinetics in
J. Appt. Phys., Vol. 78, No. 3, 1 August 1995 Brunco et al. 1579 Downloaded 22 Jul 2003 to 128.103.60.225. Redistribution subject to AIP license or copyright, see http://ojps.aip.org/japo/japcr.jsp
IO2 I”“, 2 - ‘,I”‘, I r ~,~~I~, 6 8 1,” TABLE II. Summary of CGM fitting for solutes in Si(100).
F
g - I2 10’ 7 > : ^ -
B : a? -
d Ibi lo&‘,) = - 0.30 - 0.61 log&)
1 lo-‘1 a 8 1’1111’ 0 ‘*‘ll~*’ ’ 11’1111’ 8 8 -rrJ
lOA 10-J lo-2 10-l 100 Equilibrium Partition Coefficient, k,
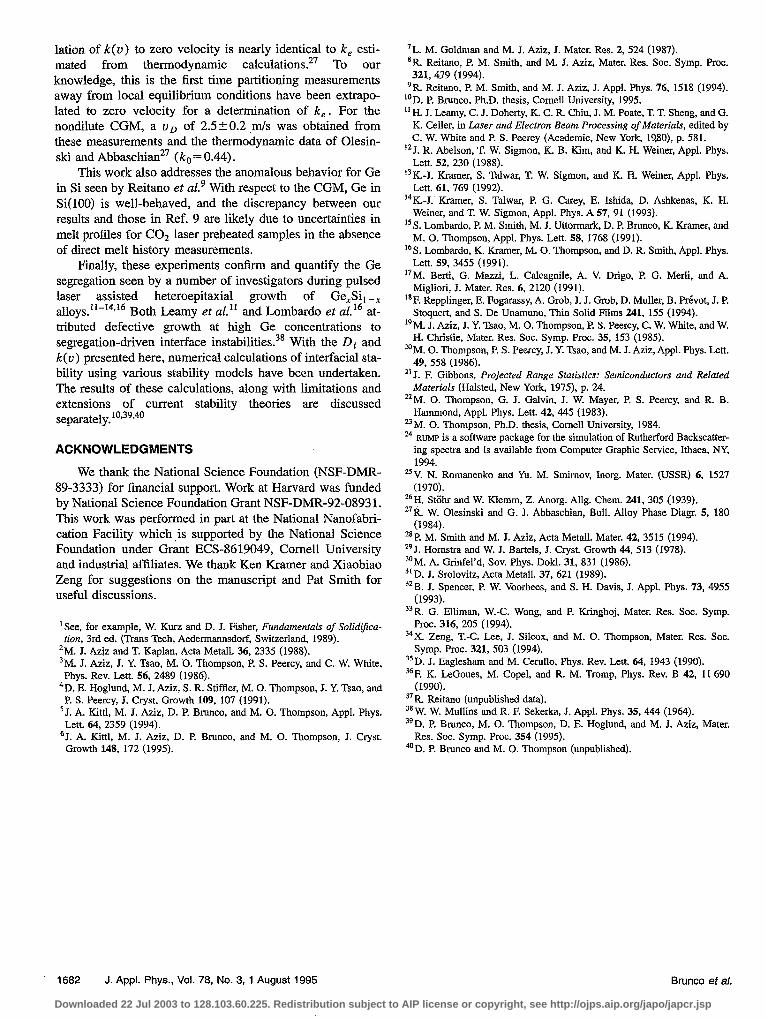
FIG. 5. Log-log plot of k, vs uD for impurities in (100) oriented crystal Si. At u = uo , k is halfway between its equilibrium value and unity.
the WAS system, whereas all tested models incorporating solute drag failed. Thus, the version of the CGM without solute drag was chosen here. As required by the Henrian approximation to the nondilute CGM, k,(T) for both Ge and Si were obtained from the phase diagram calculations assum- ing regular solutions described in Sec. IV B. Using the ve- locity expression of the CGM without solute drag, the inter- face temperature was calculated from the composition, the measured k, and the measured v for each laser-irradiated sample. Then, using this calculated T, the composition, and the measured v, a value for k was computed from Eq. (1) and compared to the experimental k. The diffusive speed was varied in Eq. (1) to best match the measured k vs v data, resulting in a value of 2.49 2 0.18 m/s.
From Table I, we find that the nondilute CGM, the dilute CGM, and the Kurz-Fisher model all give reasonable fits when only a single parameter (vr,) is allowed to vary. When k, is also varied, all models except SGM provide fits of essentially equivalent quality with similar values of k, (0.45 - 0.48). One must be cautious in drawing further conclusions from the small differences in x”, noted between models. First, k, is not truly a fitting parameter in that it can be measured independently. Second, the Ge/Si system is less than ideal for distinguishing among models for k<v); the rather small variation in k over the measured velocity range, coupled with the uncertainty in each point for k (including its equilibrium value) makes statistically significant tests difficult.
D. Relation of w, to k,
While no experimental correlation has been found be- tween vD and either the solute diffusivity in the solid or in the liquid, a negative correlation has been observed between VD and k, .9’28 Here, bD may be regarded as either a fitting parameter in the CGM equation for k or simply the velocity at which k is halfway between its equilibrium value and unity. Physically, the correlation suggests that the more strongly the solute atoms “want” to be in the liquid (lower k,), the faster one must solidify to trap -them in the solid (higher u D). m Fig. 5, our (k, ,v D> point is plotted with
Solute ke ULI w4
Asa 0.11 0.40 Bib 0.0007 32 Gac 0.008 I 41 Ge* 0.44 2.49 In ’ 0.0004 57 Sb= 0.023 0.97 SnC 0.016 17
aDilute CGM fit to data in Ref. 6 using k, estimated from R. W. Olesinski and G. J. Abbaschian, Bull. Ahoy Phase Diagr. 6, 254 (1985).
bRef. 3. %GM fitting to the ASGM parameters found in Ref. 9. kondilute CGM fit to data in this work. Listed value for k, corresponds to dilute limit k, .
“Ref. 4.
other available data (see Table II) for solutes in rapidly so- lidified (100) oriented Si. A least squares fit to the data gives log(uo)=-0.30-0.6llog(k,), which can be used for a rough estimate of vD for a solute in Si in the absence of experi- mental data. From the correlation, vD for Ge is above the trend based on its k, of about 0.45. While Fig. 5 indicates the likely existence of a negative Correlation between vD and k, ) a definitive model for a priori predictions.of uD remains elusive.
E. Relation to heteroepitaxy experiments
The segregation seen in this work is consistent with that observed in ulsed laser crystallization studies of Ge$i, -x on Si.“-‘4*1 B While none of the references give regrowth velocities, an approximate velocity can be calculated from the melt durations reported by Lombard0 et al.r5Vr6 Typical melt depths of 60 nm had -50 ns melt durations, and the laser pulse duration is given as = 30 ns. Since approximately the first third of the pulse is required to induce melting and solidification commences at the end of the pulse, the average regrowth velocity can be estimated as (60 run) / (50- 30+ 10 ns) m 2 m/s. At this velocity, the dilute Con- tinuous Growth Model [Eq. (2)] with k,=0.45 and uo =2.7 m/s gives a k of 0.68, slightly less than halfway to complete trapping. Although this is only an estimate and ac- tual velocities will depend upon specific conditions, substan- tial segregation is to be expected during heteroepitaxial growth of: GexSll -x.
Pulsed laser heteroepitaxy experiments are typically done with higher Ge concentrations ((20%) than considered in this work (x< 0.10). Using the nondilute CGM with the measured vD of 2.49 m/s, our k vs v data can be extrapolated to higher Ge concentrations. Calculations of Ge partitioning behavior in (100) oriented Ge,Sir -X for Ge concentrations in the solid ranging from 0% to 40% are shown in Fig. 6. Be- tween 0% and 20% Ge, the maximum change in k at any velocity is less than 0.02, which is much smaller than the error bars reported in Fig. 4. This indicates that the dilute CGM is a good approximation to nondilute theory for Ge compositions up to approximately 20%. At higher Ge con-
1580 J. Appl. Phys., Vol. 78, No. 3, 1 August 1995 Brunco et al.
Downloaded 22 Jul 2003 to 128.103.60.225. Redistribution subject to AIP license or copyright, see http://ojps.aip.org/japo/japcr.jsp

Velocity (m/s)
FIG. 6. Calculations of k(v,X,) for Ge in Ge,Si,-,(lOO) using the nondi- lute Continuous Growth Model without solute drag.
centrations, deviations from the dilute limit become more apparent.
It is important to consider the validity of extending these measurements using SO1 and SOS substrates (with relatively high defect densities) to heteroepitaxial growth on essentially perfect Si(100) substrates. Possible differences due to Si seed material for regrowth are addressed to some extent by using both SOS and SO1 substrates, for which the crystal quality of the Si layers differ. (Si substrates were not used because direct measurements of melt history via TCM are not possible.g*22) To within the scatter of the data in Fig. 4, no dependence on seed material was observed in the k vs v data. Also, three different sources of Ge. were used in this work: a 76Ge implant (clean), MBE grown Ge,Si, -x (clean), and e-beam Ge,Sil-, grown in a multi-user chamber in which evaporants can change on a daily basis (some con- tamination likely). Still, no significant differences were seen in the k vs v data.
A second concern is the effect of stress on equilibrium partitioning. To examine this, the phase diagram for strained, heteroepitaxial Ge,Sil -x on Si(100) was calculated. For these calculations, the strain energy due to heteroepitaxy, E=~c~~(~E~+E~)I-~c~~(E~+~EJIE~)], was added to the free energy of the solid where the elastic constants cu were obtained from Horn&a and Bartel? and 11 and cL are the parallel and perpendicular strain components in the GeSi film. While k, did decrease for strained Ge,Sil-, as com- pared to unstrained material, the decrease was comparatively small. For example, less than a 9% drop in the value of k, was found at X,Tt,- -0.25, with lesser effects at lower com- positions. For more details on these calculations, consult Ap- pendix A of Ref. 10.
Strain may additionally influence k through its potential effect on interface morphology. For a planar interface, strain can be destabilizing because interface roughening allows for partial reIaxation in the peaks of the roughened regions.30-32 Such roughening has been observed for both solid phase epitaxy33*34 and molecular beam epitaxy35.36 of GeSi alloys on Si. The is also some evidence of roughening during so- lidification of SiGe al10ys.‘~ However, there is currently no
detailed theoretical or experimental work characterizing the role of strain on interface morphology during rapid solidifi- cation, and it is not yet possible to estimate the degree of roughening, if any, that occurs during our laser-induced rapid solidification experiments.
In the event of substantial interface roughening, a slight re-interpretation of our analysis may be necessary because the solute diffusion and partitioning simulations used to de termine k assumed planar interfaces. However, even for a rough interface, our reported values for k still do characterize the net redistribution of Ge resulting from rapid solidifica- tion, regardless of the nature of the interface. Thus for cal- culations of post-solidification profiles resulting from laser melting, the k’s reported here are the relevant values.
F. Discrepancy with the data of Reitano et al.
There is substantial discrepancy between our k vs v characteristic and the (k= 0.70, v = 0.23 m/s) point of Reit- ano et al.’ We reviewed Reitano’s raw experimental data37 in an attempt to resolve this difference. The RBS detector in the original spectrum was recalibrated using the method dis- cussed in Sec. II, resulting in a slightly different calibration. Also, there was some uncertainty in the original melt profile. Because direct measurements of melt history via TCMZ2 are not possible with single-crystal Si substrates, Reitano et al. estimated the melt profile by matching numerical heat Bow calculations to the measured melt duration. The significant CO2 laser preheating for their Ge-implanted Si sample re- sulted in a less reliable melt profile estimate due to the less well-known Si properties at high temperatures used in calcu- lations. We determined the melt history in a different fashion. Heat flow calculations were used to generate the shape of the melt profile. Simulations of liquid phase diffusion and inter- facial partitioning were then carried out with Reitano’s mea- sured melt duration and our Dl of 2.5X 10d4 cm2/s. Melt depth and vD were varied to best fit the experimental post- melt Ge concentration profile. From these simulations, a k of 0.63 was obtained for the regrowth velocity of 0.34 m/s. This can be compared to the CGM fit to our data (k,= 0.45, uD=2.74 m/s), which yields a k of 0.51 at 0.34 m/s.
While the difference between k’s of 0.63 and 0.51 re- mains significant, it is no longer irreconcilable. The necessity of estimating the melt profile for Reitano’s work could, in large part, account for the discrepancy. Additionally, as noted in Sec. IV E, there may be small effects due to differences between growth from a Si(100) wafer and growth from SOS and SO1 materials.
V. CONCLUSIONS
We report the most detailed study to date of nonequilib- rium partitioning in Ge,Sil -x alloys. Three different sources for Ge, compositions up to lo%, and a number of sample types were employed in this study. To within the resolution of these experiments, our results can be summarized by a liquid diffusivity for Ge of 2.5X 10e4 cm2/s and a k(u) given by the dilute CGM with a diffusive speed of 2.7kO.5 m/s and a k, of 0.4520.02. These data are consis- tent with previous measurements of k(u), I9 and the extrapo-
J. Appl. Phys., Vol. 78, No. 3, 1 August 1995 Brunco et al. 1581 Downloaded 22 Jul 2003 to 128.103.60.225. Redistribution subject to AIP license or copyright, see http://ojps.aip.org/japo/japcr.jsp
lation of k(v) to zero velocity is nearly identical to k, esti- mated from thermodynamic calculations.” To our knowledge, this is the first time partitioning measurements away from local equilibrium conditions have been extrapo- lated to zero velocity for a determination of k, . For the nondilute CGM, a vo of 2.52 0.2 ,m/s was obtained from these measurements and the thermodynamic data of Olesin- ski and Abbaschian27 (ko= 0 44) . .
This work also addresses the anomalous behavior for Ge in Si seen by Reitano et aLg With respect to the CGM, Ge in Si(100) is well-behaved, and the discrepancy between our results and those in Ref. 9 are likely due to uncertainties in melt profiles for CO;? laser preheated samples in the absence of direct melt history measurements.
Finally, these experiments confirm and quantify the Ge segregation seen by a number of investigators during pulsed laser assisted heteroepitaxial growth of Ge,Sit --x alloys. tt-t4,r6 Both Leamy et al.” and Lombard0 et aLI at- tributed defective growth at high Ge concentrations to segregation-driven interface instabilities.38 With the DI and k(v) presented here, numerical calculations of interfacial sta- bility using various stability models have been undertaken. The results of these calculations, along with limitations and extensions of current stability theories are discussed separately.‘“*39,40
ACKNOWLEDGMENTS
We thank the National Science Foundation (NSF-DMR- 89-3333) for financial support. Work at Harvard was funded by National Science Foundation Grant NSF-DMR-92-0893 1. This work was performed in part at the National Nanofabri- cation Facility which.is supported by the National Science Foundation under Grant ECS-8619049, Cornell University and industrial affiliates. We thank Ken Kramer and Xiaobiao Zeng for suggestions on the manuscript and Pat Smith for useful discussions.
‘See, for example, W. Kurz and D. J. Fisher, Fundamentals of Solidijka- tion, 3rd ed. (Tram Tech, Aedermannsdorf, Switzerland, 1989).
‘M. J. Aziz and T. Kaplan, Acta Metall. 36, 2335 (1988). 3M. J. Aziz, J. Y. Tsao, M. 0. Thompson, P S. Peercy, and C. W. White,
Phys. Rev. Lett. 56, 2489 (1986). ‘D. E. Hoglund, M. J. Aziz, S. R. Stiffler, M. 0. Thompson, J. Y. ?Sao, and
P. S. Peercy, J. Cryst. Growth 109, 107 (1991). ‘J. A. Kittl, M. J. Aziz, D. P. Brunco, and M. 0. Thompson, Appl. Phys.
L&t. 64, 2359 (1994). 6J. A. Kittl, M. J. Aziz, D. P. Bnmco, and M. 0. Thompson, J. Cryst.
Growth 148, 172 (1995).
7L. M. Goldman and M. J. Aziz, I. Mater. Res. 2, 524 (1987). *R. Reitano, P. M. Smith, and M. J. Aziz, Mater. Res. Sot. Symp. Proc. 321, 479 (1994).
‘R. Reitano, P. M. Smith, and M. J. Aziz, 5. Appl. Phys. 76, 1518 (1994). “D. P. Brunco, Ph.D. thesis, Cornell University, 1995. ‘t H. J. Leamy, C. J. Doherty, K. C. R. Chiu, J. M. Poate, T. T. Sheng, and G.
K. Celler, in Laser and Electron Beam Processing of Materink, edited by C. W. White and P S. Peercy (Academic, New York, l%oj, p. 581.
“J. R. Abelson, ‘I?. W. Sigmon, K. B. Kim, and K. H. Weiner, Appl. Phys. Lett. 52, 230 (1988).
13K.-J. Kramer, S. Talwar, T. W. Sigmon, and K. H. Weiner, Appl. Phys. Lett. 61, 769 (1992).
14K.-J. Kramer, S. Talwar, P G. Carey, E. Ishida, D. Ashkenas, K. H. Weiner, and T. W. Sigmon, Appl. Phys. A 57, 91 (1993).
“S. Lombardo, P. M. Smith, M. J. Uttormark, D. P. Brunco, K. Kramer, and M. 0. Thompson, Appl. Phys. Lett. 58, 1768 (1991).
“S. Lombardo, K. Kramer, M. 0. Thompson, and D. R. Smith, Appl. Phys. Lat. 59, 3455 (1991).
17M Berti, G. Mazzi, L. Calcagnile, A. V. Drigo, P. G. Merli, and A. Ggliori, J. Mater. Res. 6, 2120 (1991).
‘*F Repplinger, E. Fogarassy, A. Grob, J. J. Grob, D. Muller, B. Privot, J. P Stoquert, and S. De Unamuno, Thin Solid Films 241, 155 (1994).
“‘M J Aziz, J. Y. Tsao, M. 0. Thompson, P. S. Peercy, C. W. White, and W. H.‘Christie, Mater. Res. Sot. Symp. Proc. 35, 153 (1985).
“M. 0. Thompson, P. S. Peercy, J. Y. Lao, and M. J. Aziz, Appl. Phys. Lett. 49,558 (1986).
” 3. F. Gibbons, Projected Range Statistics: Semiconductors and Related Materials (Hal&d, New York, 1975), p. 24.
“M. 0. Thompson, G. J. Galvin, J. W. Mayer, P. S. Peercy, and R. B. Hammond, Appl. Phys. Lett. 42, 445 (1983).
uM. 0. Thompson, Ph.D. thesis, Cornell University, 1984. 24 RUMP is a software package for the simulation of Rutherford Backscatter-
ing spectra and is available from Computer Graphic Service, Ithaca, NY, 1994.
=V. N. Romanenko and Yu. M. Smimov, lnorg. Mater. (USSR) 6, 1527 (1970).
26H. St&r and W. Klemm, 2. Anorg. Allg. Chem. 241, 305 (1939). “R W Olesinski and G. J. Abbaschian, Bull. Alloy Phase Diagr. 5, 180
(i9.984). z*P. M. Smith and M. J. Aziz, Acta Metall. Mater. 42, 3515 (1994). *‘J. Hornstra and W. J. Bartels, .I. Cryst. Growth 44, 513 (1978). sOM. A. Grinfel’d, Sov. Phys. Dokl. 31, 831 (1986). “D. J. Srolovitz, Acta Metall. 37, 621 (1989). “B. J. Spencer, P W. Voorhees, and S. H. Davis, J. Appl. Phys. 73, 4955
(1993). 33R. G. Elliman, W.-C. Wong, and P. Kringhoj, Mater. Res. Sot. Symp.
Proc. 316, 205 (1994). 34X Zeng T.-C. Lee, J. Silcox, and M. 0. Thompson, Mater. Res. Sot.
Symp. Pioc. 321, 503 (1994). “D. J. Eaglesham and M. Cerullo, Phys. Rev. Len. 64, 1943 (1990). 36F. K. LeGoues, M. Copel, and R. M. Tromp, Phys. Rev. B 42, 11690
11990). 37R Reitano (unpublished data). 38W. W. Mullins and R. E Sekerka, J. Appl. Phys. 35, 444 (1964). 39D P Brunco, M. 0. Thompson, D. E. Hoglund, and M. 3. Aziz, Mater.
Rk’Soc. Symp. Proc. 354 (1995). ‘@D. P. Brunco and M. 0. Thompson (unpublished).
1582 J. Appl. Phys., Vol. 78, No. 3, 1 August 1995 Brunco ef al.
Downloaded 22 Jul 2003 to 128.103.60.225. Redistribution subject to AIP license or copyright, see http://ojps.aip.org/japo/japcr.jsp