geotechnical & foundation engineering studies of aditional .... basic. appl. sci. res.,...
TRANSCRIPT

J. Basic. Appl. Sci. Res., 3(1s)662-684, 2013
© 2013, TextRoad Publication
ISSN 2090-4304 Journal of Basic and Applied
Scientific Research www.textroad.com
Corresponding author: Ahmad Adib, Master of Mine Exploration Engineering, Azad University South Tehran Branch, Tehran, Iran, E-mail: [email protected]
Geotechnical & Foundation Engineering Studies of Aditional Structures of Phase 12 of South Pars (Tombak Region)
Ahmad Adib1 and Alireza Ashofteh2
1Assistant Professor of Mining Engineering Department, Azad University South Tehran Branch, Tehran, Iran, 2Master of Mine Exploration Engineering, Azad University South Tehran Branch, Tehran, Iran,
Received: June 10 2013 Accepted: July 8 2013
ABSTRACT
This article is for presenting the final results of soil investigation and geotechnical studies at the site of S.P.G.D. PH-12, Tombak region. For studies of S.P.G.D. PH-12 project, 20 boreholes and 10 test pits are bored or excavated in offshore and onshore facilities location. This article presents the results of the geotechnical investigation for offshore facilities area consisting 6 boreholes. This article contains the results of in-situ and laboratory geotechnical investigations and foundation engineering analyses. The site geological aspects; physical and geotechnical characteristics and geotechnical parameters of soil layers; allowable soil bearing capacity of various foundation types; settlement considerations and soil lateral pressures are evaluated. KEYWORDS: Geotechnical, South Pars, Structure, Tombak.
1. INTRODUCTION
The project area is located at south of Iran, 17 km east of Kangan Port. Figure 1 shows the location of the project area. Also the satellite view of the site is shown in Figure 2. In this project, the filling material is filled in the sea in order to prepare the sea as a location for offshore structures. Figure 3 shows the process of filling the sea with proper filling materials. Also, Figures 4 shows the prepared ground in the sea, which will be used for the offshore structures foundations. The geotechnical studies have been performed to recognize the properties of the filling materials and the subsurface soil layers below the original sea bed. The main aims of these studies are as follows:
Study the stratification, and determination of thickness of the underlying strata. Evaluation of the groundwater table level. Evaluation of filling material thicknesses. Evaluation of geotechnical parameters of subsurface layers. Calculation of allowable bearing capacity for different foundations. Assessment of lateral earth pressure coefficients.
2. Investigation Procedure
In order to achieve the project objectives, total number of 6 boreholes (BH-115 to BH-120) has been drilled in offshore location. All boreholes were drilled with continuous coring method by rotary machine. The Standard Penetration Tests (SPT) has been performed in the boreholes during the drilling processes. Soil mechanic tests as grain size distribution, Hydrometry, Atterberg limits, Specific gravity, Direct shear, Triaxial and Chemical analyses tests have been performed on samples obtained from boreholes.
Fig. 1. Vicinity of the project site
662

Adib and Ashofteh, 2013
Fig. 2. Site location on the satellite photo (Photo date Nov. 2002)
Fig. 3. The process of filling the sea with proper filling materials (Photo date 2008)
Fig. 4. Prepared ground in the sea for offshore structures location
3. Geology of the Project Area
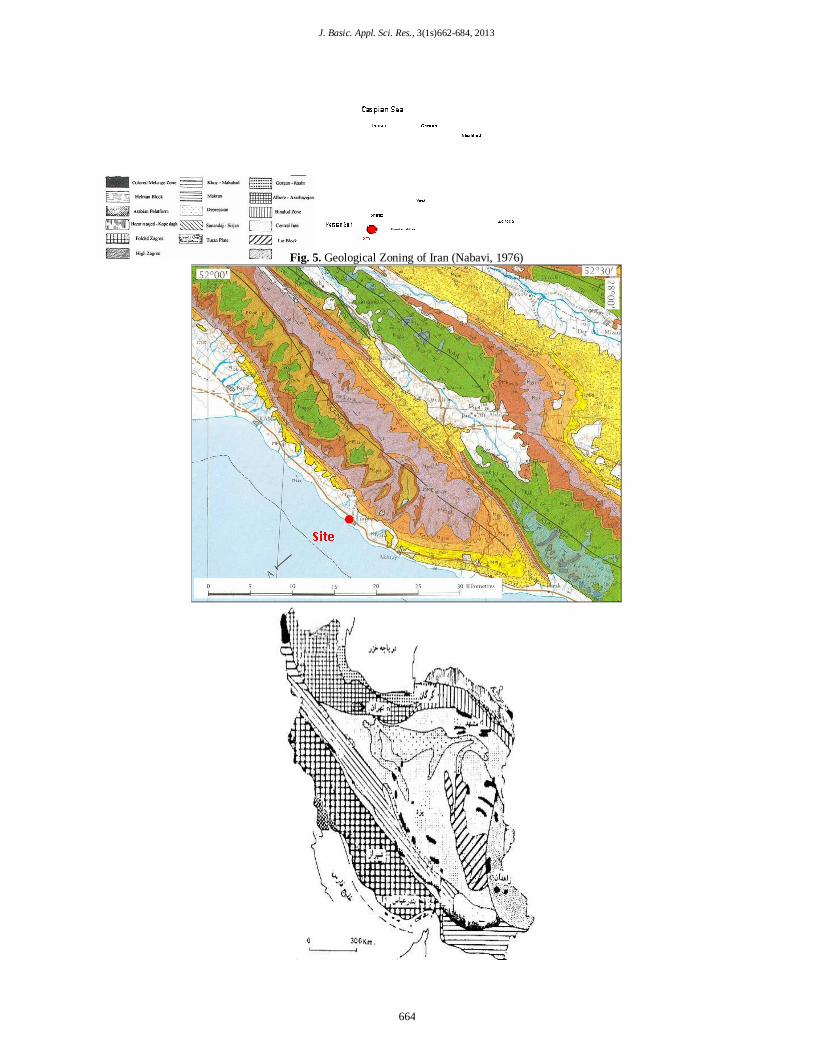
According to geological Zoning of Iran (Nabavi, 1976), shown in Figure 5, project area is located in folded Zagros zone. Zagros fold-thrust belt is a part of Alpine-Himalayan system that is considered as the result of collision between the continental Arabian Plate. Location of the area is shown in Figure 6. The project area is located of south flank of Kangan anticline. So bedding surface dip is to south side Figure 7. In project area and around, there are 3 important geology formations as follow: 3.1. Aghajari formation
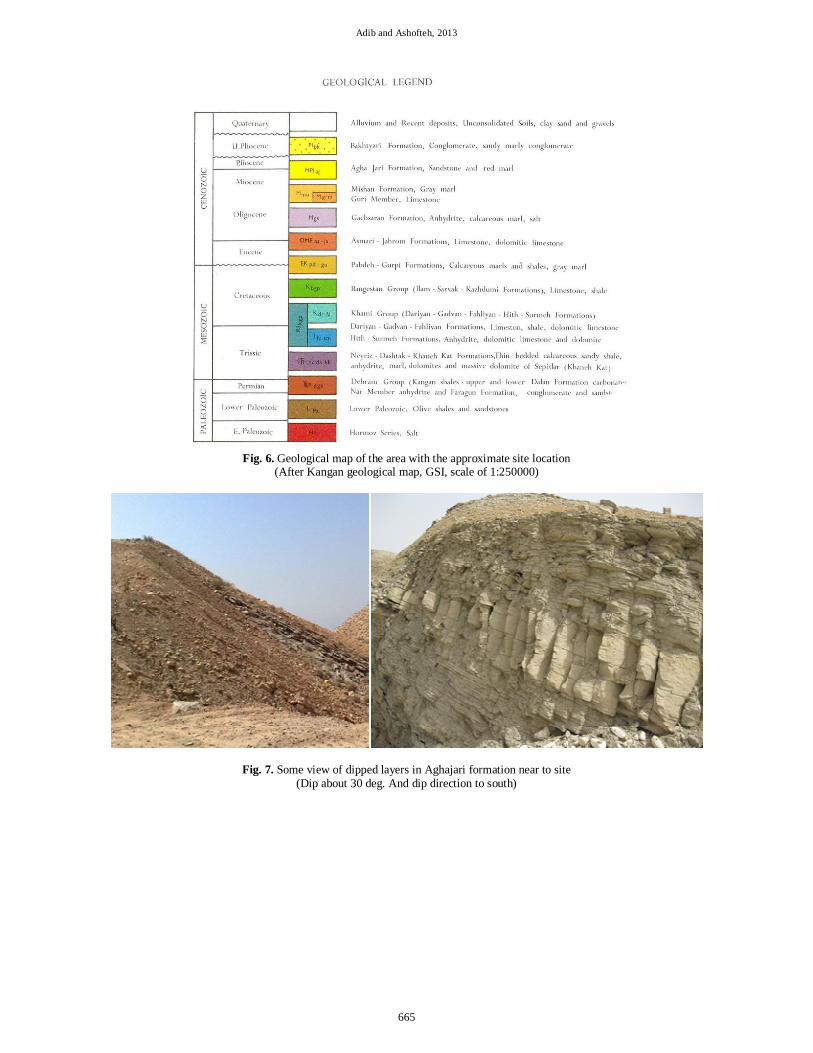
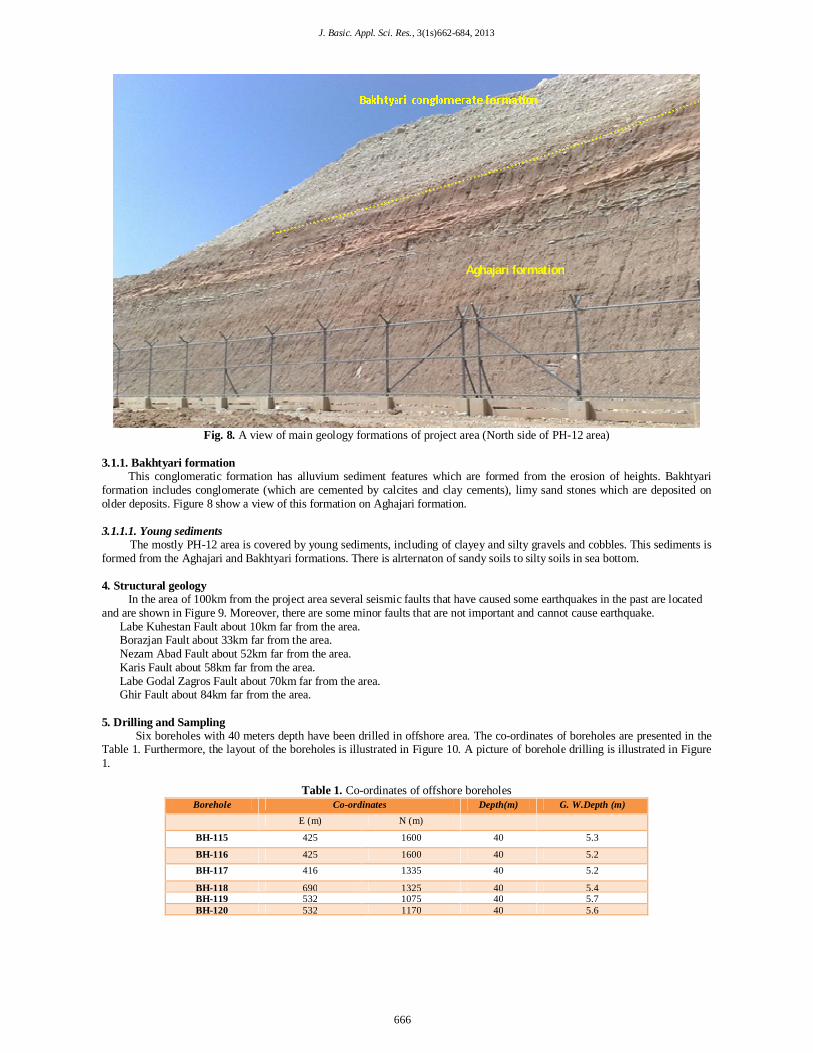
Aghajari formation is the oldest sedimentary unit belonging to the Mio-Pliocene and containing blends of red Marl, brown fine Sandstone with cross bedding, reddish brown Siltstone and occasional gray marl layers. Thin layers of gypsum are seen in whole formation. Hence it is not astonishing to see clay, marl and siltstone layers with gypsum in undisturbed samples from Aghajari formation. Figure 8 show a view of this formation.
663
J. Basic. Appl. Sci. Res., 3(1s)662-684, 2013
Fig. 5. Geological Zoning of Iran (Nabavi, 1976)
664
Adib and Ashofteh, 2013
Fig. 6. Geological map of the area with the approximate site location
(After Kangan geological map, GSI, scale of 1:250000)
Fig. 7. Some view of dipped layers in Aghajari formation near to site (Dip about 30 deg. And dip direction to south)
665
J. Basic. Appl. Sci. Res., 3(1s)662-684, 2013
Fig. 8. A view of main geology formations of project area (North side of PH-12 area)
3.1.1. Bakhtyari formation
This conglomeratic formation has alluvium sediment features which are formed from the erosion of heights. Bakhtyari formation includes conglomerate (which are cemented by calcites and clay cements), limy sand stones which are deposited on older deposits. Figure 8 show a view of this formation on Aghajari formation. 3.1.1.1. Young sediments
The mostly PH-12 area is covered by young sediments, including of clayey and silty gravels and cobbles. This sediments is formed from the Aghajari and Bakhtyari formations. There is alrternaton of sandy soils to silty soils in sea bottom. 4. Structural geology
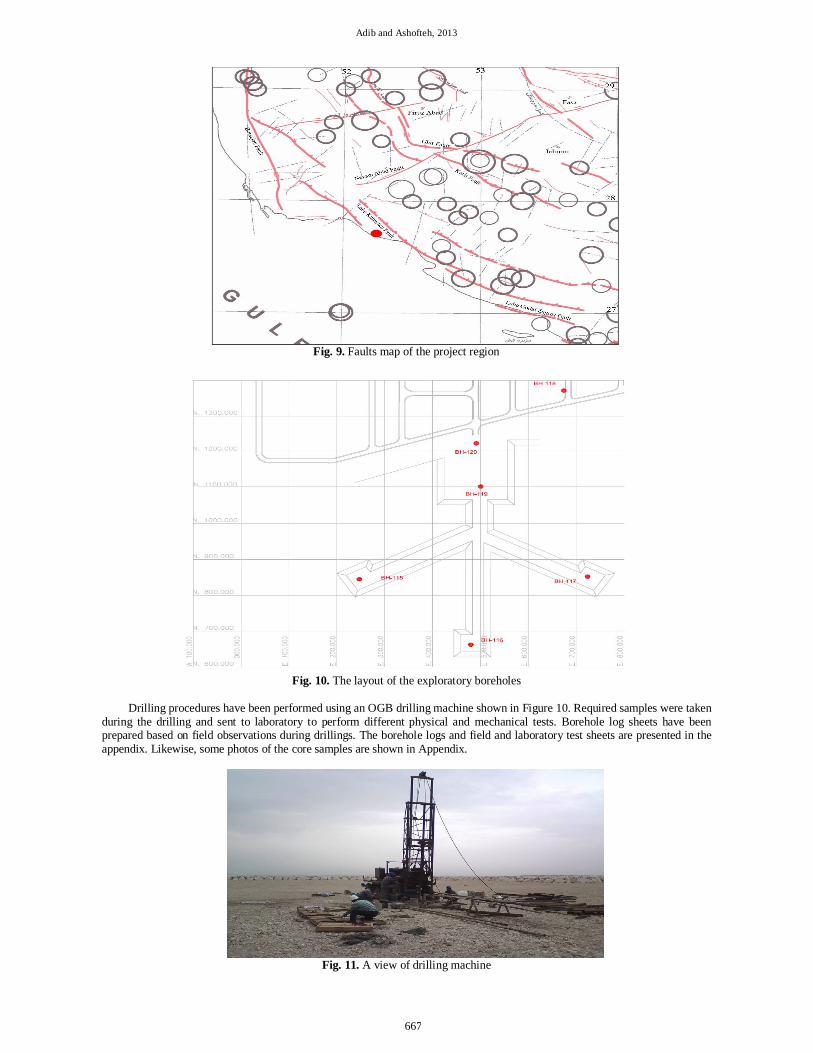
In the area of 100km from the project area several seismic faults that have caused some earthquakes in the past are located and are shown in Figure 9. Moreover, there are some minor faults that are not important and cannot cause earthquake.
Labe Kuhestan Fault about 10km far from the area. Borazjan Fault about 33km far from the area. Nezam Abad Fault about 52km far from the area. Karis Fault about 58km far from the area. Labe Godal Zagros Fault about 70km far from the area. Ghir Fault about 84km far from the area.
5. Drilling and Sampling
Six boreholes with 40 meters depth have been drilled in offshore area. The co-ordinates of boreholes are presented in the Table 1. Furthermore, the layout of the boreholes is illustrated in Figure 10. A picture of borehole drilling is illustrated in Figure 1.
Table 1. Co-ordinates of offshore boreholes
Borehole Co-ordinates Depth(m) G. W.Depth (m) E (m) N (m)
BH-115 425 1600 40 5.3
BH-116 425 1600 40 5.2 BH-117 416 1335 40 5.2
BH-118 690 1325 40 5.4 BH-119 532 1075 40 5.7 BH-120 532 1170 40 5.6
Aghajari formation
666
Adib and Ashofteh, 2013
Fig. 9. Faults map of the project region
Fig. 10. The layout of the exploratory boreholes
Drilling procedures have been performed using an OGB drilling machine shown in Figure 10. Required samples were taken
during the drilling and sent to laboratory to perform different physical and mechanical tests. Borehole log sheets have been prepared based on field observations during drillings. The borehole logs and field and laboratory test sheets are presented in the appendix. Likewise, some photos of the core samples are shown in Appendix.
Fig. 11. A view of drilling machine
667
J. Basic. Appl. Sci. Res., 3(1s)662-684, 2013
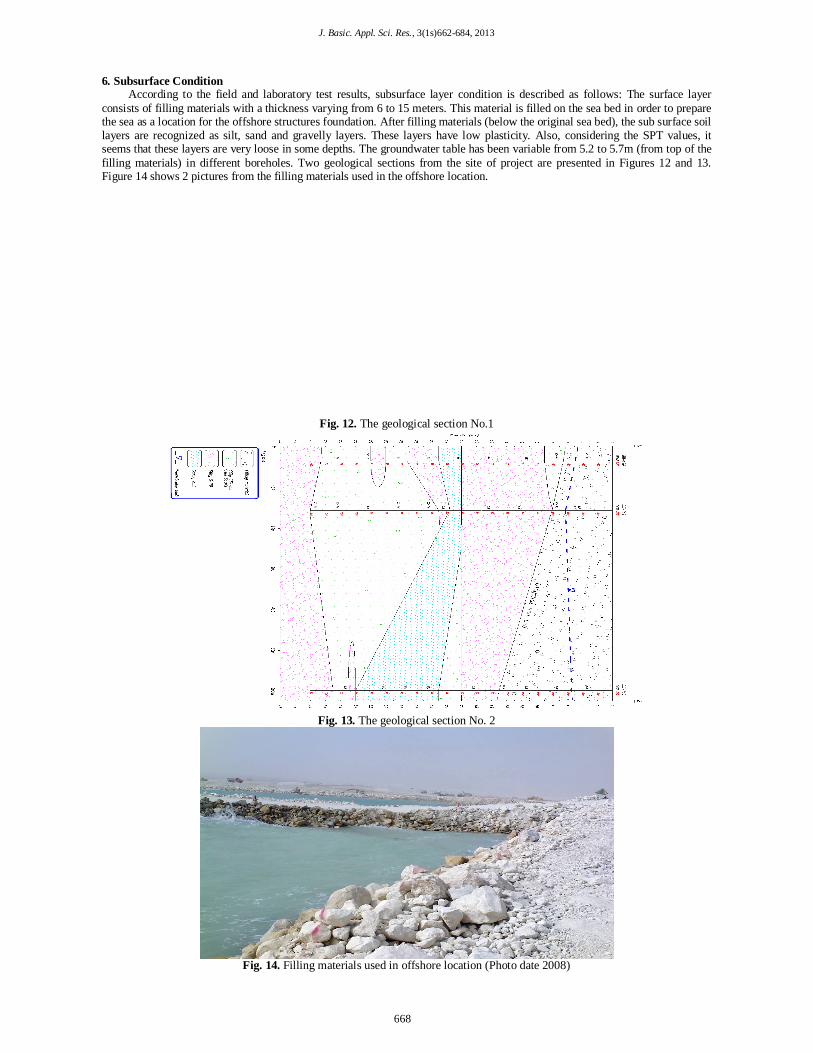
6. Subsurface Condition According to the field and laboratory test results, subsurface layer condition is described as follows: The surface layer
consists of filling materials with a thickness varying from 6 to 15 meters. This material is filled on the sea bed in order to prepare the sea as a location for the offshore structures foundation. After filling materials (below the original sea bed), the sub surface soil layers are recognized as silt, sand and gravelly layers. These layers have low plasticity. Also, considering the SPT values, it seems that these layers are very loose in some depths. The groundwater table has been variable from 5.2 to 5.7m (from top of the filling materials) in different boreholes. Two geological sections from the site of project are presented in Figures 12 and 13. Figure 14 shows 2 pictures from the filling materials used in the offshore location.
Fig. 12. The geological section No.1
Fig. 13. The geological section No. 2
Fig. 14. Filling materials used in offshore location (Photo date 2008)
668
Adib and Ashofteh, 2013
7. In-Situ Tests In-situ tests Include Standard Penetration Test and Field permeability test. 7.1. Standard Penetration Test (SPT)
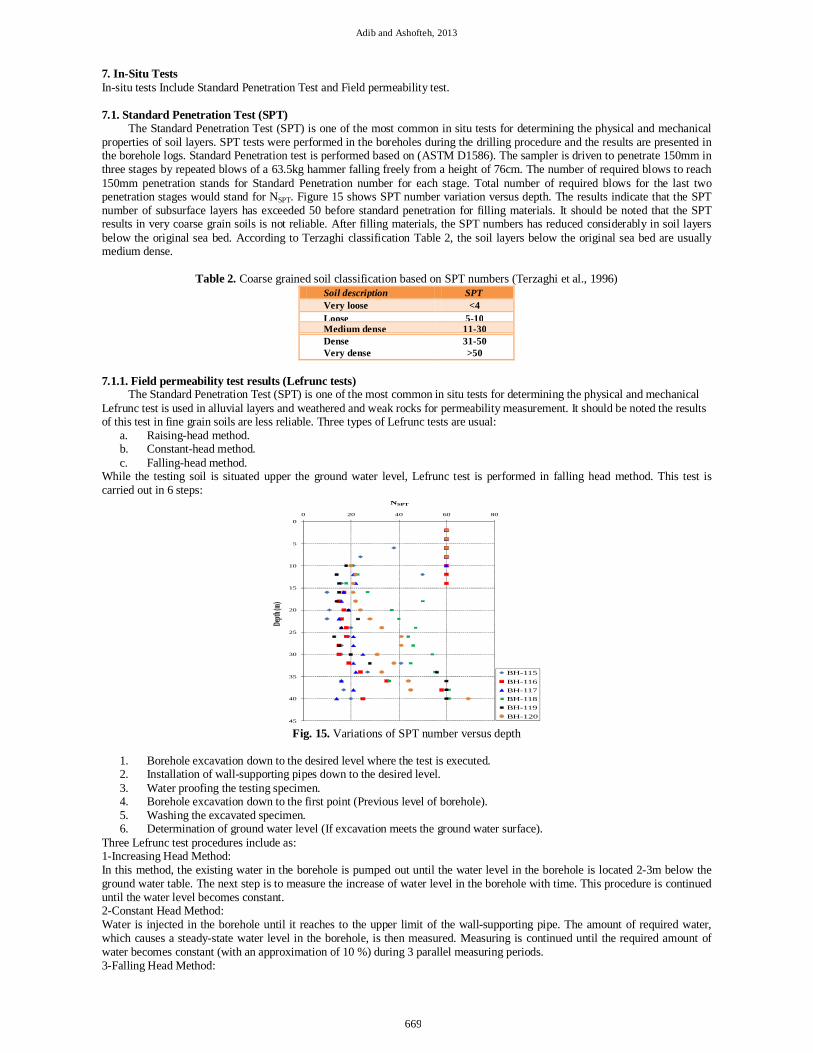
The Standard Penetration Test (SPT) is one of the most common in situ tests for determining the physical and mechanical properties of soil layers. SPT tests were performed in the boreholes during the drilling procedure and the results are presented in the borehole logs. Standard Penetration test is performed based on (ASTM D1586). The sampler is driven to penetrate 150mm in three stages by repeated blows of a 63.5kg hammer falling freely from a height of 76cm. The number of required blows to reach 150mm penetration stands for Standard Penetration number for each stage. Total number of required blows for the last two penetration stages would stand for NSPT. Figure 15 shows SPT number variation versus depth. The results indicate that the SPT number of subsurface layers has exceeded 50 before standard penetration for filling materials. It should be noted that the SPT results in very coarse grain soils is not reliable. After filling materials, the SPT numbers has reduced considerably in soil layers below the original sea bed. According to Terzaghi classification Table 2, the soil layers below the original sea bed are usually medium dense.
Table 2. Coarse grained soil classification based on SPT numbers (Terzaghi et al., 1996)
Soil description SPT Very loose <4 Loose 5-10 Medium dense 11-30 Dense Very dense
31-50 >50
7.1.1. Field permeability test results (Lefrunc tests)
The Standard Penetration Test (SPT) is one of the most common in situ tests for determining the physical and mechanical Lefrunc test is used in alluvial layers and weathered and weak rocks for permeability measurement. It should be noted the results of this test in fine grain soils are less reliable. Three types of Lefrunc tests are usual:
a. Raising-head method. b. Constant-head method. c. Falling-head method.
While the testing soil is situated upper the ground water level, Lefrunc test is performed in falling head method. This test is carried out in 6 steps:
0
5
10
15
20
25
30
35
40
45
0 20 40 60 80
Depth
(m)
NSPT
BH-115BH-116BH-117BH-118BH-119BH-120
Fig. 15. Variations of SPT number versus depth
1. Borehole excavation down to the desired level where the test is executed. 2. Installation of wall-supporting pipes down to the desired level. 3. Water proofing the testing specimen. 4. Borehole excavation down to the first point (Previous level of borehole). 5. Washing the excavated specimen. 6. Determination of ground water level (If excavation meets the ground water surface).
Three Lefrunc test procedures include as: 1-Increasing Head Method: In this method, the existing water in the borehole is pumped out until the water level in the borehole is located 2-3m below the ground water table. The next step is to measure the increase of water level in the borehole with time. This procedure is continued until the water level becomes constant. 2-Constant Head Method: Water is injected in the borehole until it reaches to the upper limit of the wall-supporting pipe. The amount of required water, which causes a steady-state water level in the borehole, is then measured. Measuring is continued until the required amount of water becomes constant (with an approximation of 10 %) during 3 parallel measuring periods. 3-Falling Head Method:
669
J. Basic. Appl. Sci. Res., 3(1s)662-684, 2013
Test begins after cutting-off water injection to the borehole. The reduction of borehole water level is then measured with time. It is recommended to measure water level reducing/increasing in the time periods of 1, 2, 3, 4, 5, and 10 minutes, and it shall be repeated for 2 other 10 minutes periods of time. Lefrunc test results are presented in Table 3.
Table 3. Field permeability test results
Borehole Depth (m) Type of soil K (cm/s) Constant Head Falling Head
BH-115 11.0-12.0 GM 1.4E-03 1.8E-04 BH-116 8.0-9.0 GM 1.0E-03 1.3E-03 BH-117 8.0-9.0 GC 8.8E-04 9.9E-04 BH-118 8.0-9.0 GC 1.0E-04 1.0E-04 BH-119 21.0-21.5 SM 7.4E-04 5.2E-04 BH-120 8.5-9.5 GM 2.0E-04 1.7E-04
8. Laboratory Test Results
The samples have been used for performing different physical, chemical and mechanical tests. Test sheets are presented in appendix. In this section, the results of laboratory tests are presented and conclusions are made to suggest geotechnical parameters for different soil layers based on laboratory and field test results and engineering judgments. 8.1. Grain Size Analysis, Liquid and Plastic Limits
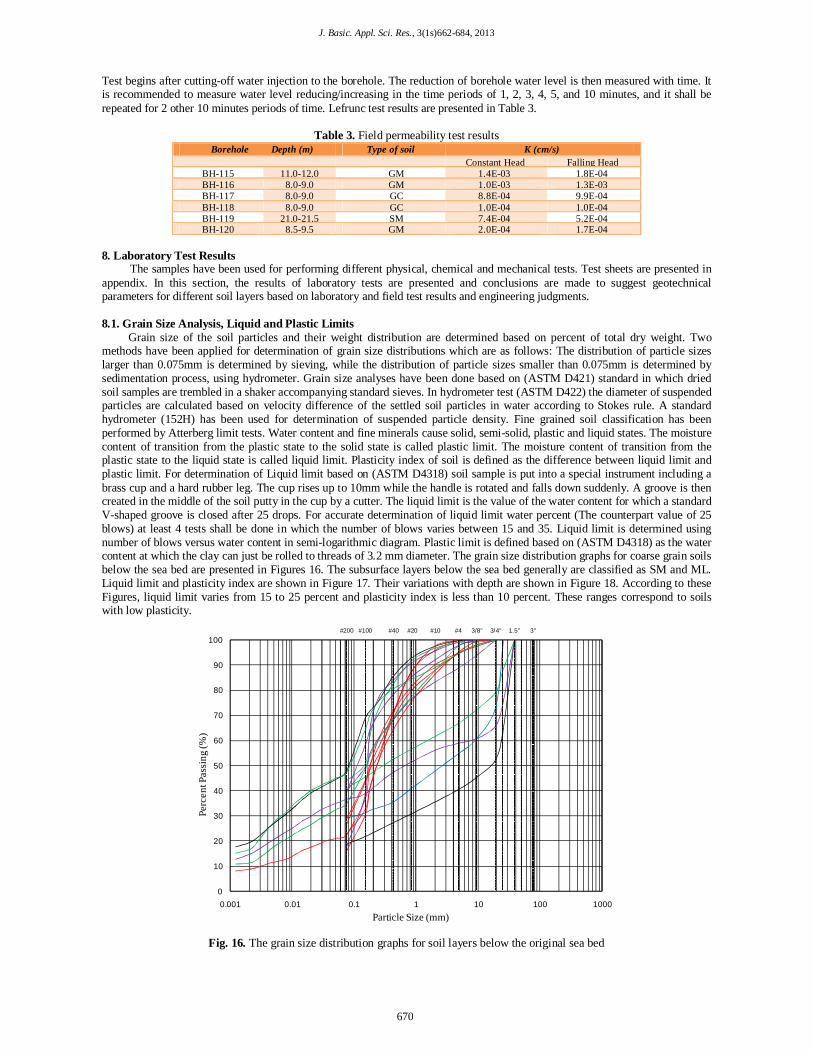
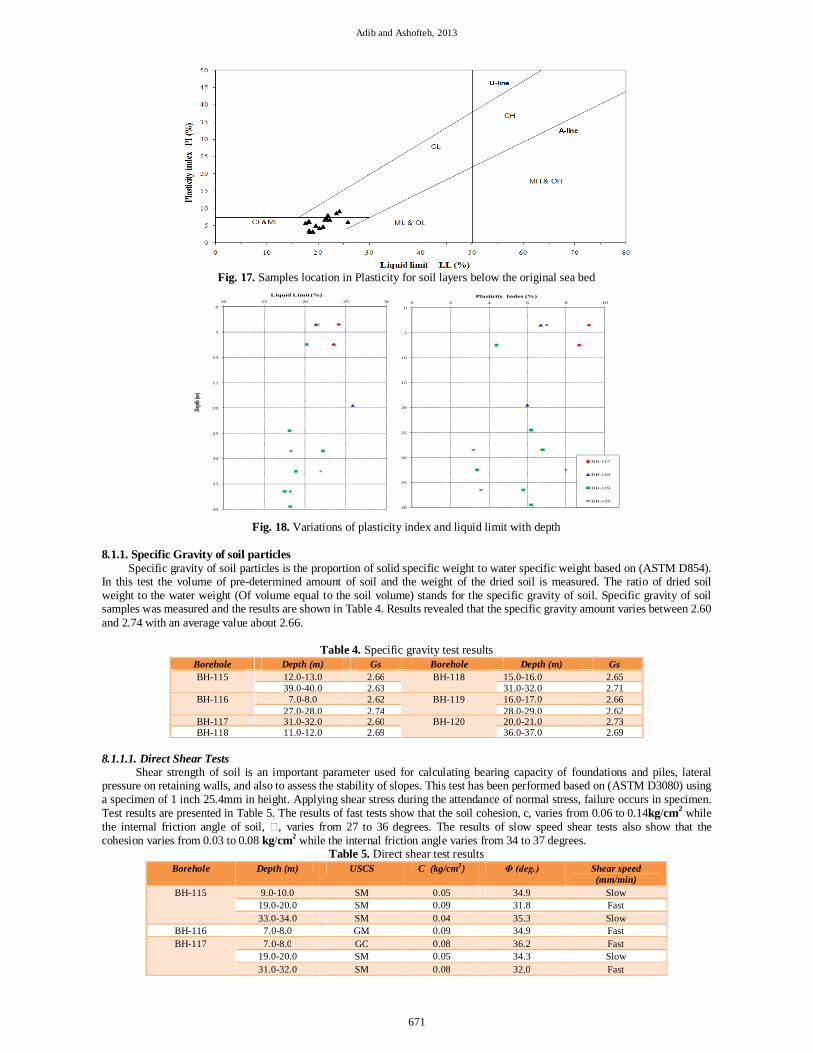
Grain size of the soil particles and their weight distribution are determined based on percent of total dry weight. Two methods have been applied for determination of grain size distributions which are as follows: The distribution of particle sizes larger than 0.075mm is determined by sieving, while the distribution of particle sizes smaller than 0.075mm is determined by sedimentation process, using hydrometer. Grain size analyses have been done based on (ASTM D421) standard in which dried soil samples are trembled in a shaker accompanying standard sieves. In hydrometer test (ASTM D422) the diameter of suspended particles are calculated based on velocity difference of the settled soil particles in water according to Stokes rule. A standard hydrometer (152H) has been used for determination of suspended particle density. Fine grained soil classification has been performed by Atterberg limit tests. Water content and fine minerals cause solid, semi-solid, plastic and liquid states. The moisture content of transition from the plastic state to the solid state is called plastic limit. The moisture content of transition from the plastic state to the liquid state is called liquid limit. Plasticity index of soil is defined as the difference between liquid limit and plastic limit. For determination of Liquid limit based on (ASTM D4318) soil sample is put into a special instrument including a brass cup and a hard rubber leg. The cup rises up to 10mm while the handle is rotated and falls down suddenly. A groove is then created in the middle of the soil putty in the cup by a cutter. The liquid limit is the value of the water content for which a standard V-shaped groove is closed after 25 drops. For accurate determination of liquid limit water percent (The counterpart value of 25 blows) at least 4 tests shall be done in which the number of blows varies between 15 and 35. Liquid limit is determined using number of blows versus water content in semi-logarithmic diagram. Plastic limit is defined based on (ASTM D4318) as the water content at which the clay can just be rolled to threads of 3.2 mm diameter. The grain size distribution graphs for coarse grain soils below the sea bed are presented in Figures 16. The subsurface layers below the sea bed generally are classified as SM and ML. Liquid limit and plasticity index are shown in Figure 17. Their variations with depth are shown in Figure 18. According to these Figures, liquid limit varies from 15 to 25 percent and plasticity index is less than 10 percent. These ranges correspond to soils with low plasticity.
3"1.5"3/4"3/8"#4#10#20#40#100#200
0
10
20
30
40
50
60
70
80
90
100
0.001 0.01 0.1 1 10 100 1000
Perc
ent P
assi
ng (%
)
Particle Size (mm)
Fig. 16. The grain size distribution graphs for soil layers below the original sea bed
670
Adib and Ashofteh, 2013
Fig. 17. Samples location in Plasticity for soil layers below the original sea bed
0
5
10
15
20
25
30
35
40
10 15 20 25 30
Depth
(m)
Liquid Limit (%)
0
5
10
15
20
25
30
35
40
0 2 4 6 8 10Plasticity Index (%)
BH-117
BH-118
BH-119
BH-120
Fig. 18. Variations of plasticity index and liquid limit with depth
8.1.1. Specific Gravity of soil particles
Specific gravity of soil particles is the proportion of solid specific weight to water specific weight based on (ASTM D854). In this test the volume of pre-determined amount of soil and the weight of the dried soil is measured. The ratio of dried soil weight to the water weight (Of volume equal to the soil volume) stands for the specific gravity of soil. Specific gravity of soil samples was measured and the results are shown in Table 4. Results revealed that the specific gravity amount varies between 2.60 and 2.74 with an average value about 2.66.
Table 4. Specific gravity test results Borehole Depth (m) Gs Borehole Depth (m) Gs BH-115 12.0-13.0 2.66 BH-118 15.0-16.0 2.65
39.0-40.0 2.63 31.0-32.0 2.71 BH-116 7.0-8.0 2.62 BH-119 16.0-17.0 2.66
27.0-28.0 2.74 28.0-29.0 2.62 BH-117 31.0-32.0 2.60 BH-120 20.0-21.0 2.73 BH-118 11.0-12.0 2.69 36.0-37.0 2.69
8.1.1.1. Direct Shear Tests
Shear strength of soil is an important parameter used for calculating bearing capacity of foundations and piles, lateral pressure on retaining walls, and also to assess the stability of slopes. This test has been performed based on (ASTM D3080) using a specimen of 1 inch 25.4mm in height. Applying shear stress during the attendance of normal stress, failure occurs in specimen. Test results are presented in Table 5. The results of fast tests show that the soil cohesion, c, varies from 0.06 to 0.14kg/cm2 while the internal friction angle of soil, �, varies from 27 to 36 degrees. The results of slow speed shear tests also show that the cohesion varies from 0.03 to 0.08 kg/cm2 while the internal friction angle varies from 34 to 37 degrees.
Table 5. Direct shear test results Borehole Depth (m) USCS C (kg/cm2) Φ (deg.) Shear speed
(mm/min) BH-115 9.0-10.0 SM 0.05 34.9 Slow
19.0-20.0 SM 0.09 31.8 Fast 33.0-34.0 SM 0.04 35.3 Slow
BH-116 7.0-8.0 GM 0.09 34.9 Fast BH-117 7.0-8.0 GC 0.08 36.2 Fast
19.0-20.0 SM 0.05 34.3 Slow 31.0-32.0 SM 0.08 32.0 Fast
671
J. Basic. Appl. Sci. Res., 3(1s)662-684, 2013
BH-118 11.0-12.0 SM 0.04 34.1 Slow 27.0-28.0 ML 0.14 27.1 Fast
BH-119 16.0-17.0 SM 0.06 29.0 Fast 39.0-40.0 GC-GM 0.03 37.1 Slow
BH-120 20.0-21.0 ML 0.12 27.2 Fast 36.0-37.0 GM 0.08 35.1 Slow
8.1.1. 1.1. Triaxial Tests
Triaxial compression tests have been performed based on (ASTM D-3282). This test is the most reliable test for determining the shear parameters of soils. In unconsolidated-undrained triaxial test (UU), the specimen would not allow to be drained during consolidation and the shear phases. In consolidated undrained (CU) method, specimen is primarily consolidated to a given pressure and after complete dissipation of the excess pore water pressure (Uc); the axial load will be increased till reaching failure. During the shear phase the drainage is not available, which results in formation of excess pore water pressure (Ud). Triaxial compression test results are presented in Table 6. According to the test results, in CU condition, the cohesion varies from 0.11 to 0.14kg /cm2 and the internal friction angle is about 29.0 to 30.0 degrees. Also, the result of UU condition shows that the cohesion is equal to 0.37kg/cm2 and the internal friction angle is about 9 degrees.
Table 6. The results of the Triaxial compression tests
Borehole Depth (m) USCS Classification Type of test C (kg/cm2) φ (deg.) BH-115 25.0-26.0 ML UU 0.37 9.4 BH-117 31.0-32.0 SM CU 0.14 28.6 BH-119 24.0-25.0 `GC-GM CU 0.11 30.4
8.1.1. 1.1.1. Soil Chemical Analyses
Chemical analysis has been performed on 5 samples and the results are presented in Table 7. Test results show that sulfate amount varies between 0.37% and 0.82% while chloride ion amount varies between 0.12% and 0.60%. Moreover, the PH value varies between 8.4 and 8.6. According to the Iranian concrete code (ABA) the soil can be categorized in "severe" class regarding its total sulfate content, but considering the special location and type of the project its necessary to categorize it in "extra severe" class. Regarding the high amounts of chloride and sulfates in southern Iranian islands, due to the obligations of Iranian concrete code, application of cement type II and consideration of the particular provisions of concrete for south costal regions (Based on Iranian concrete code) is necessary. Furthermore, consideration of ACI concrete code provisions for similar conditions is alternatively possible. In this case, Portland cement or mixed Portland cement like the slag Portland cement and mixed Portland cement with natural and artificial Pozzuolana can be applied.
Table 7. Soil chemical test results Borehole Depth (m) pH (%)SO 2
3 (%)Cl-
CaCO3(%) Organic
material % BH - 115 12.0-13.0 8.6 0.56 0.60 90.55 0.47 BH – 117 7.0-8.0 8.6 0.46 0.47 94.05 0.20 BH – 118 11.0-12.0 8.4 0.37 0.12 92.05 0.47 BH – 119 12.0-13.0 8.5 0.82 0.13 90.06 0.20 BH – 120 7.0-8.0 8.4 0.39 0.19 95.51 0.17
The test results of chemical analyses on groundwater samples obtained from boreholes are presented in Table 8.
Table 8. Chemical analysis results of groundwater samples Borehole pH )( ppmCl )(2
4 ppmSO
Ec (µmhos/cm)
BH-115 7.3 7082 2652 16360 BH-116 7.3 6812 2670 16240 BH-117 7.3 7298 2680 17490 BH-118 7.0 4757 2722 12520 BH-119 7.4 6812 2615 15240 BH-120 7.3 6325 2706 14190
9. Geotechnical Parameteres of Subsurface Layers
This section includes the evaluation of the geotechnical parameters of subsurface layers. Based on laboratory and in-situ test results, our engineering judgment, and local experiences from the nearby project sites; the properties of each layer are estimated. The subsurface layers can be separated to 3 main layers. These layers are described as follows:
Layer 1: Filling materials which their thickness is variable between 6 to 15 meters in different points. It is clear that by going far from the shore, the depth of water and consequently the thickness of filling materials should be increased.
Layer 2: Below the filling material which means the soil layers under original sea bed, sandy layers are recognized. These sandy layers usually continued to a depth about 20 meters from top of the filling materials.
Layer 3: Below the above mentioned sandy layers, the soil layers are usually recognized as silty layers. These layers are almost deposited in depth from 20 to 30 meters.
Layer 4: Below the depth of 30 meters, usually sandy and gravelly layers are recognized. The geotechnical parameters for different layer are presented in Table 9.
672
Adib and Ashofteh, 2013
Table 9. Geotechnical parameters of layers 4 3 2 1 Layer Number
mostly sand & Gravel
mostly silt
Sand Filling material Type
0.06 ~ 0.10 0.07 ~ 0.10 0.05 ~ 0.07 0~0.05 Cohesion CCU (Kg/cm2)
24 ~ 26 20 ~ 22 22 ~ 24 26 ~ 28 Internal friction angle (degree) 1.70 ~ 1.75 1.65 ~ 1.75 1.65 ~ 1.70 1.75 ~ 1.85 Dry unit weight (gr/cm3) 0.34 ~ 0.36 0.38 ~ 0.40 0.35 ~ 0.38 0.30 Poisson Ratio 250 ~ 350 200 ~ 250 150 ~ 250 250 ~ 300 Elastic modulus (Kg/cm2)
10. Allowable Bearing Capacity of shallow Foundations
The allowable bearing capacity of shallow footings with consideration of soil shear strength values and consideration of the allowable settlements are evaluated for strip footings with different values of L/B ratios. 10.1. Evaluation of Allowable Bearing Capacity Based on Soil Shear Strength Parameters
When shear forces are applied to a soil mass, the soil deforms and the deformation increases by an increase in the shear force value till reaching the failure state. There are different methods for calculating the ultimate bearing capacity (qu). In this project the Meyerhof (1963) method is applied. The Meyerhof equation to assess the ultimate bearing capacity is as follows:
qult= C.Nc.Sc.dc + Q. Nq.Sq.dq + 0.5 B. .N .S .d Where C stands for the soil cohesion, Q is the soil stress at the foundation level and B is the foundation width. Nc ,Nq ,N are
dimensionless coefficients which are functions of internal friction angle. The shape factors CS , qS and S are calculated as follows:
LBkS pc 2.01
LBkS pq 1.01
LBkS p 1.01
The depth factors dc ، dq ، d are calculated as follows:
BDkd pc 2.01
BDkd pq 1.01
BDkd p1.01
Where D is the effective depth of foundation (The distance between the bottom of the foundation and the stable soil elevation), B is the foundation width, L is the foundation length
)2
45(tan 2 pk
When the stress in foundation level (q) is subtracted from the achieved ultimate bearing capacity, the net ultimate foundation bearing capacity can be obtained: qult(net)= qult The allowable bearing capacity is calculated by dividing the net ultimate foundation bearing capacity into the safety factor of 3:
s
netultnetallow F
qq )(
)(
10.1.1. Foundation Settlement The total settlement of foundation consists of immediate and consolidation settlements. The immediate vertical settlement
of a semi-infinite homogeneous isotropic soil mass of linear stress-strain behavior, beneath the foundation under a uniform pressure can be expressed as:
Fo IFFE
BqH )1
21(121
2
Where 0q is the foundation contact pressure, E is the deformation modulus and is the Poisson’s ratio. Other coefficients are as follows:
673

J. Basic. Appl. Sci. Res., 3(1s)662-684, 2013
radsin tan 1
tan2
1
11
11.
111
1-22
12
22
22
22
222
1
NMN
MMF
NMM
NMMLn
NMM
NMMLnMF
i
ii
Fcorner for L center;for 2
Fcorner for ;Fcenter for 2BB ,
BHN ,
BLM where
LL
B
Fig. 19. Influence factor (IF) for footing with the depth of D and dimension of B×L (Bowles, 1985) Evaluation of the consolidation settlement is on the basis of the consolidation test results. Regarding the low permeability of clays, excess pore water pressure dissipation and therefore the consolidation process take much time. The applied criterion to calculate the consolidation settlement (ΔH) is as follows: ΔH= H mv Δσ Where H is the thickness of the clay layers, mv is coefficient of volume compressibility and Δσ is vertical effective stress variation due to foundation loads at the center point of the layer. Total settlements are the sum of immediate and consolidation settlements which should be restricted to allowable settlement. 10.1.1.1. Bearing Capacity of Shallow Footings With due consideration to the bearing capacity correlations and settlement consideration, the allowable bearing capacities of footings are assessed, when the footings are supposed to be buried in filling material layer. Following, the graphs of bearing capacity are presented in Figures 20 to 22. The footing length to width ratio for the square, rectangular and strip footings are 1, 2 and 5 respectively. The graphs are presented on the basis of allowable settlement value of 2.54 centimeter.
0
0.2
0.4
0.6
0.8
1
1.2
1.4
1.6
1.8
2
2.2
2.4
2.6
2.8
3
0.5 1.0 1.5 2.0 2.5 3.0 3.5 4.0 4.5 5.0 5.5
Allo
wabl
e Bea
ring
Cap
acity
(kg/
cm2 )
Foundation Width (m)
Allowable Bearing Capacity (Square footing)L/B=1 , Allowable settlement: 2.54 cm
Df=2.0m
Df=1.5m
Df=1.0m
Df=0.5m
Fig. 20. Allowable bearing capacity of square footings (L/B=1)
674

Adib and Ashofteh, 2013
0.5
0.7
0.9
1.1
1.3
1.5
1.7
1.9
2.1
2.3
2.5
0.5 1.0 1.5 2.0 2.5 3.0 3.5 4.0 4.5 5.0 5.5
Allo
wab
le B
eari
ng C
apac
ity (k
g/cm
2 )
Foundation Width (m)
Allowable Bearing Capacity (Rectangular Footing)L/B=2 , Allowable settlement: 2.54 cm
Df=2.0m
Df=1.5m
Df=1.0m
Df=0.5m
Fig. 21. Allowable bearing capacity of rectangle footings (L/B=2)
0
0.2
0.4
0.6
0.8
1
1.2
1.4
1.6
1.8
2
2.2
2.4
0.5 1.0 1.5 2.0 2.5 3.0 3.5 4.0 4.5 5.0 5.5
Allo
wab
le B
eari
ng C
apac
ity (k
g/cm
2 )
Foundation Width (m)
Allowable Bearing Capacity (Strip footing)L/B=5 , Allowable settlement:2.54 cm
Df=2.0m
Df=1.5m
Df=1.0m
Df=0.5m
Fig. 22. Allowable bearing capacity of strip footings (L/B=5)
Determination of the embedded foundation depth of single footings is important. The value of the net pressure depends on the soil layer depth on the footing, in bearing capacity analyses. Figure 23 shows the embedded depth of single and strip footings. As shown, the value of embedded depth is the sum of Dc and excess slab thickness (tfloor).
Fig. 23. The embedded depth in bearing capacity calculations of single and strip footings
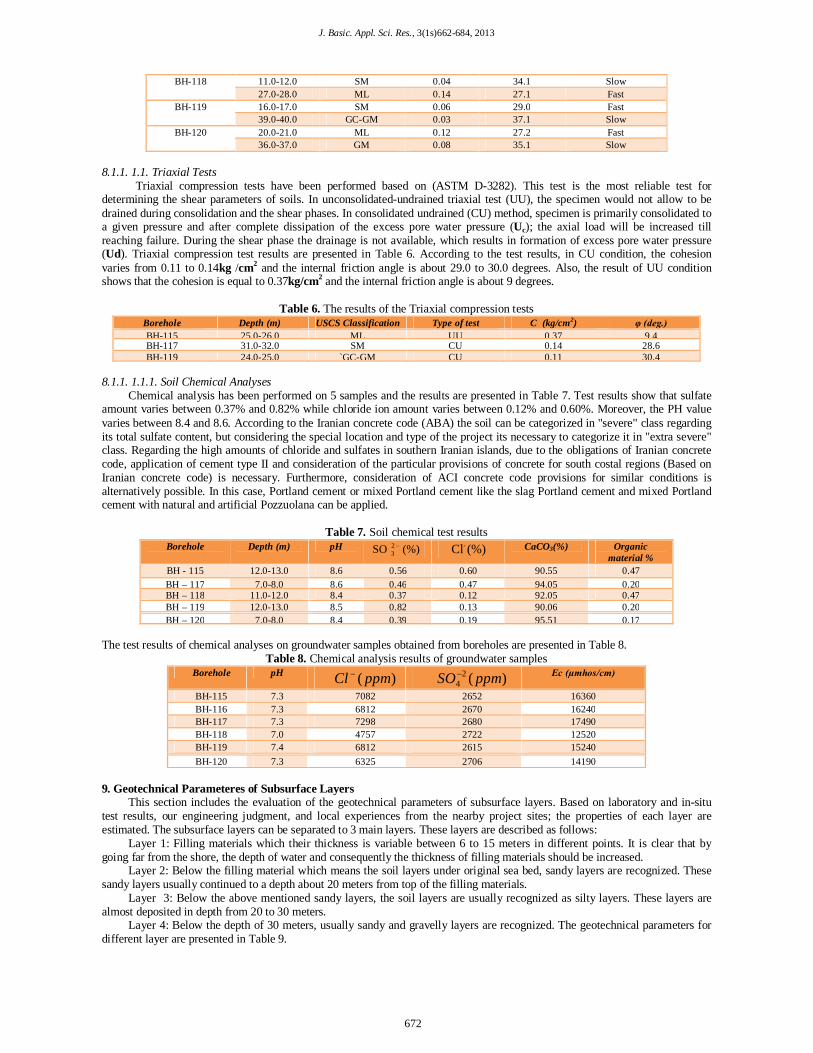
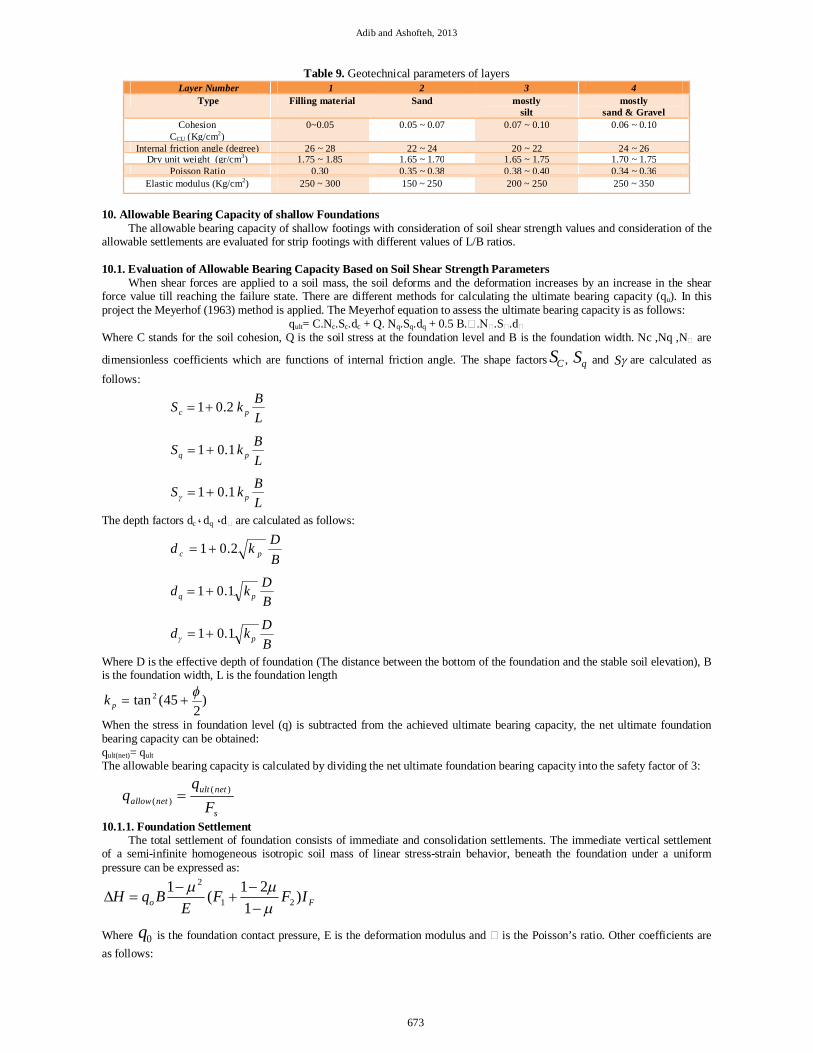
10.1.1. 1.1. Determination of bearing capacity of mat foundations
Mat or Raft footings are surface footings which are applied when the bearing capacity of single footings are insufficient. In mat foundations, the settlement mainly controls the bearing capacity rather than the soil strength parameters. The calculation of bearing capacity of mat foundations is similar to the calculation procedures in surface footings but the increasing effect of bearing capacity is decreased by diminishing coefficient. The bearing capacity of mat foundations are calculated for 1 and 2 inches allowable settlement. Following, the bearing capacity graphs are presented for square and rectangular foundations.
675
J. Basic. Appl. Sci. Res., 3(1s)662-684, 2013
0
0.4
0.8
1.2
1.6
2
5 6 7 8 9 10 11
Allo
wabl
e Bea
ring
Cap
acity
(kg/c
m2 )
Foundation Width (m)
Allowable Bearing Capacity (MAT Footing)(L/B=1)
S=5.08cm
S=2.54cm
Fig. 24. Allowable bearing capacity of square mat foundation (L/B=1)
0
0.4
0.8
1.2
1.6
2
5 6 7 8 9 10 11
Allo
wab
le Be
arin
g Ca
pacit
y (k
g/cm
2 )
Foundation Width (m)
Allowable Bearing Capacity (MAT Footing)(L/B=2)
S=5.08cm
S=2.54cm
Fig. 25. Allowable bearing capacity of rectangular mat foundation (L/B=2)
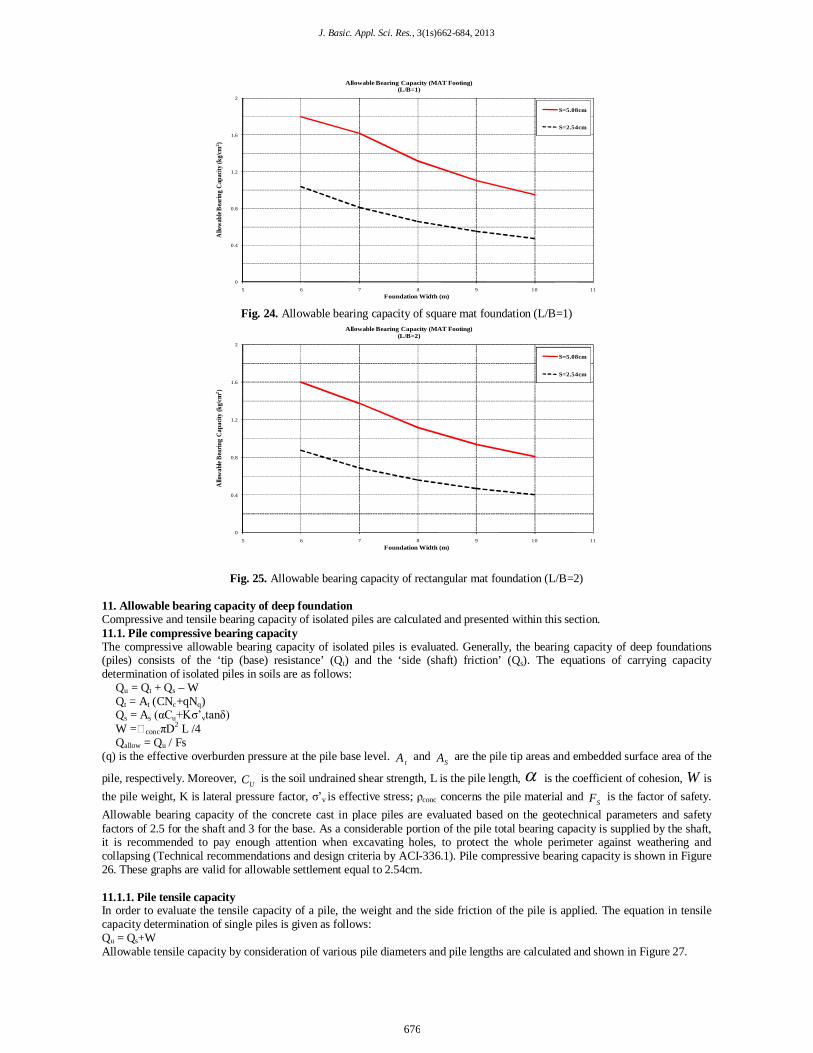
11. Allowable bearing capacity of deep foundation Compressive and tensile bearing capacity of isolated piles are calculated and presented within this section. 11.1. Pile compressive bearing capacity The compressive allowable bearing capacity of isolated piles is evaluated. Generally, the bearing capacity of deep foundations (piles) consists of the ‘tip (base) resistance’ (Qt) and the ‘side (shaft) friction’ (Qs). The equations of carrying capacity determination of isolated piles in soils are as follows:
Qu = Qt + Qs – W Qt = At (CNc+qNq) Qs = As (αCu+Kσ’vtanδ) W = concπD2 L /4 Qallow = Qu / Fs
(q) is the effective overburden pressure at the pile base level. tA and
SA are the pile tip areas and embedded surface area of the
pile, respectively. Moreover, UC is the soil undrained shear strength, L is the pile length, is the coefficient of cohesion, W is the pile weight, K is lateral pressure factor, σ’v is effective stress; ρconc concerns the pile material and
SF is the factor of safety. Allowable bearing capacity of the concrete cast in place piles are evaluated based on the geotechnical parameters and safety factors of 2.5 for the shaft and 3 for the base. As a considerable portion of the pile total bearing capacity is supplied by the shaft, it is recommended to pay enough attention when excavating holes, to protect the whole perimeter against weathering and collapsing (Technical recommendations and design criteria by ACI-336.1). Pile compressive bearing capacity is shown in Figure 26. These graphs are valid for allowable settlement equal to 2.54cm. 11.1.1. Pile tensile capacity In order to evaluate the tensile capacity of a pile, the weight and the side friction of the pile is applied. The equation in tensile capacity determination of single piles is given as follows: Qu = Qs+W Allowable tensile capacity by consideration of various pile diameters and pile lengths are calculated and shown in Figure 27.
676
Adib and Ashofteh, 2013
0
20
40
60
80
100
120
140
160
0.3 0.4 0.5 0.6 0.7 0.8 0.9 1 1.1
Allo
wabl
e Bea
ring C
apac
ity (t
on)
Pile Diameter (m)
L=30m
L=25m
L=20m
Fig. 26. Allowable bearing capacities of concrete cast in place piles
0
20
40
60
80
100
120
0.3 0.4 0.5 0.6 0.7 0.8 0.9 1 1.1
Allo
wabl
e Ten
sile C
apac
ity (t
on)
Pile Diameter (m)
L=30m
L=25m
L=20m
Fig. 27. Allowable tensile capacity of concrete cast in place piles
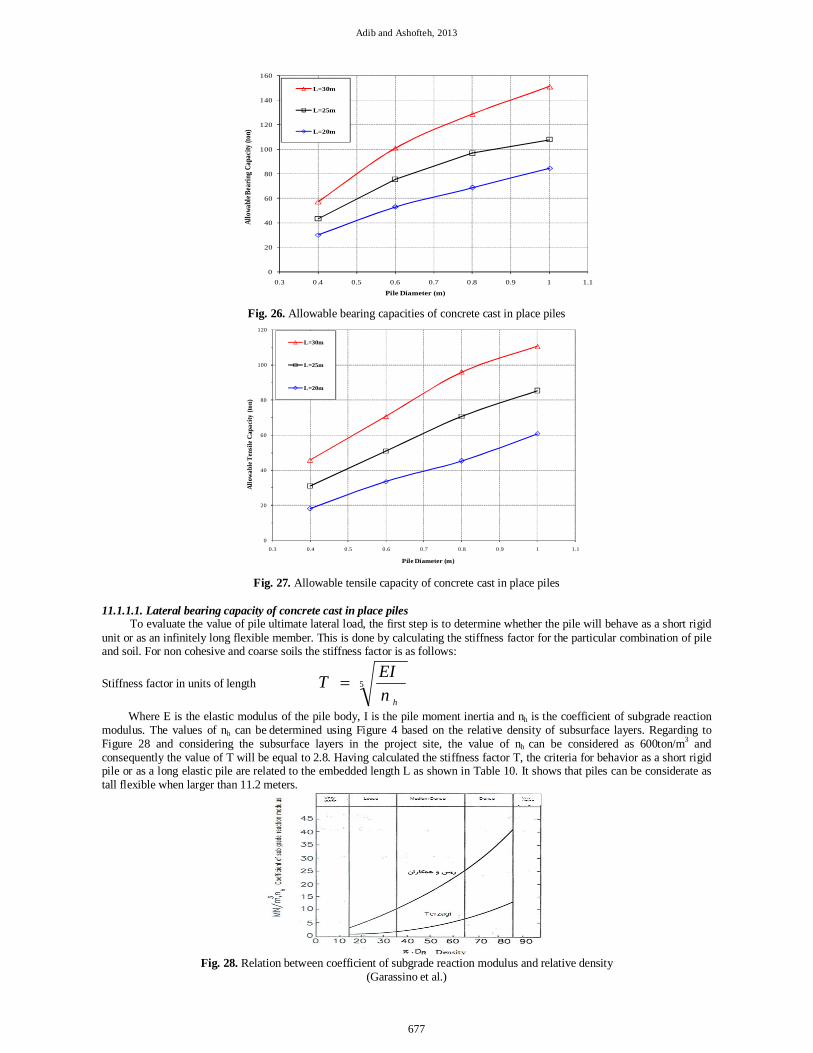
11.1.1.1. Lateral bearing capacity of concrete cast in place piles
To evaluate the value of pile ultimate lateral load, the first step is to determine whether the pile will behave as a short rigid unit or as an infinitely long flexible member. This is done by calculating the stiffness factor for the particular combination of pile and soil. For non cohesive and coarse soils the stiffness factor is as follows:
Stiffness factor in units of length 5
hnEIT
Where E is the elastic modulus of the pile body, I is the pile moment inertia and nh is the coefficient of subgrade reaction
modulus. The values of nh can be determined using Figure 4 based on the relative density of subsurface layers. Regarding to Figure 28 and considering the subsurface layers in the project site, the value of nh can be considered as 600ton/m3 and consequently the value of T will be equal to 2.8. Having calculated the stiffness factor T, the criteria for behavior as a short rigid pile or as a long elastic pile are related to the embedded length L as shown in Table 10. It shows that piles can be considerate as tall flexible when larger than 11.2 meters.
Fig. 28. Relation between coefficient of subgrade reaction modulus and relative density
(Garassino et al.)
677

J. Basic. Appl. Sci. Res., 3(1s)662-684, 2013
Table 10. Criterion to indicate piles as ‘tall flexible’ or ‘short rigid’ Pile Type Soil Modulus
Linearly increasing Constant Rigid (free head) L ≤ 2T L ≤ 2R Elastic (free head) L ≥ 4T L ≥ 3.5R
Regarding the presented criterion, we can approximately consider the piles as tall flexible type, within the present project. The depth to point of fixity (zf) for structural models can be calculated with the following equation:
Tz f 8.1
So, the value of Zf is equal to 5.04. After the depth of fixity (Zf), the pile can be supposed as fix and rigid in lateral bearing capacity calculations. Following relation can be used for estimating the deflection of a pile under fix head condition and a horizontal lateral load equal to H: Deflection = y = H(e+Zf)3/(12EI) Where: E and I are determined based on the pile material properties; e and Zf are shown in figure 29; Also, the following relation can be used in order to estimate the ultimate lateral pressure on the soil caused by lateral movement of the pile:
2T
MB
THAp g
ppz
Where pA and pB are determined based on the soil properties in different depths.
Fig. 29. Behavior of different piles under lateral loading
Considering the results and the presented relations, the allowable lateral bearing capacity variation of piles is presented in
figure 30 supposing e=0, and based on the assumption that only the horizontal load is acting on the pile and the value of moment is negligible. It is clear that the maximum moment created in the pile, should be less than yielding moment.
0
10
20
30
40
50
60
70
0.3 0.4 0.5 0.6 0.7 0.8 0.9 1 1.1
Lat
eral
Bea
ring
Cap
acity
(Ton
)
Pile Diameter (m)
(Fix Head Condition)
X=5.08 cm
X=2.54 cm
Fig. 30. Allowable Lateral bearing capacities of cast in place piles for fix head condition
678
Adib and Ashofteh, 2013
12. Lateral Soil Pressures 12.1. Static Conditions The soil pressure exerting on retaining walls is the function of various parameters. Generally, the coefficients of active, passive and at rest soil pressures can be calculated using the soil internal friction angle by the following equations:
sin10 K
)2
45(tan 2 aK )
245(tan2 pK
Coefficients of lateral soil pressures for different zones are suggested as follows:
Layer 0K aK pK
Filling materials 0.59 0.42 2.37
original sea bed 0.65 0.49 2.03
0k is applied whenever the wall is assumed not to have any motion, otherwise ak and pk must be taken into account. It should
be noted that when both ak and pk coefficients are used simultaneously, the amount of pk must be reduced to half, due to the differences in the amounts of strains needed to lead the soil into active and passive conditions. 12.1.1. Dynamic (earthquake) Conditions
The dynamic lateral soil pressures are calculated based on the Monano-Okabe method for pseudo static forces using constant vertical and horizontal accelerations. The constant horizontal acceleration is defined as gKa hh in which hK is the earthquake horizontal pressure. In this method the wall moves enough till the shear strength reaches its yield value on the shear surface. In this method, the value of seismic active lateral force exceeds the static active lateral force; while the value of seismic passive force is less than the static passive lateral force. The Coefficients of dynamic lateral soil pressures are defined as follows: (KAE: Coefficient of dynamic active lateral pressure, KPE: Coefficient of dynamic passive lateral pressure)
)().()()(1)(..
)(
2
2
SinSinSinSinSinSinCos
Sink AE
)().()()(1)90(..
)(
2
2
SinSinSinSinSinSinCos
SinkPE
v
h
kk
Tan1
1
Dynamic active lateral force )1(1/2KP 2aeae VKH
Dynamic passive lateral force )1(1/2KP 2pepe VKH
In which is the embankment slope behind the wall, is the wall slope and is the angle of friction between the wall and
the soil. Based on the above equations, if 15.0hK and 0.0vK and and are 0 and 90 degrees respectively, and by
assuming 2/ for the active conditions and 0.0 for the passive conditions, the Coefficients of dynamic lateral soil pressures are as follows:
Layer AEK PEK
Filling materials 0.51 2.12 Original sea bed layers 0.58 1.80
13. Subgrade Reaction Modulus of footings 13.1. Vertical Reaction Modulus A. Static Case
The subgrade reaction modulus (Ks) is defined as the exerted stress to the soil mass to form a deformation of unit value. In the present project, with due consideration to the value of deformation modulus, the following equation is proposed to assess the subgrade reaction modulus.
679
J. Basic. Appl. Sci. Res., 3(1s)662-684, 2013
)1( 2
BEKs
In accordance to Terzaghi’s equations, Ks value can be calculated for various foundation dimensions by means of the following equations: For fine grained soils:
BB
KK pspsq For square footings
mBL
KK sqsr 5.1
5.0 For rectangular and strip footings
And for coarse grained soils: 2
2
BBB
KK psps For square footings
mBL
KK sqsr 5.1
5.0 For rectangular and strip footings
Where Ksp: Loading plate subgrade reaction modulus. Ksq : Square footing subgrade reaction modulus. Ksr : Rectangular footing subgrade reaction modulus. B : Foundation width. L : Foundation length. Bp : Plate's width/diameter.
The above equations are empirical equations suitable for small dimensions of footings, thus for larger dimensions, the following equation can be used:
ks=1.2qa Where qa stands for the allowable bearing capacity for the allowable total settlement of 2.54cm. If the allowable settlement is considerate more than 2.54cm, then the value of 1.2 should be reduced in linear manner.
B. Dynamic Case The vertical response of a rigid circular foundation can be assessed by means of a ‘concentrated mass-spring-dash pot’ system (If appropriate coefficients for the stiffness of spring and dash pot are applied) and on the basis of theory of elasticity. Following equation is applied for the purpose:
14 0Grkzd
Lismar and Richard (1966)
In which µ is the soil Poisson Ratio, G is the shear modulus and r is the circular foundation radius with the equivalent area. The value of G can be obtained from the geo-seismic test results presented earlier. However, as the seismic tests are accomplished with small strains, the soil shear modulus for machinery foundation can be calculated by the following equation:
)1(2
EG
As an example, by considering the value of 250Kg/cm2 for the elastic modulus and the value of 0.35 for the Poisson Ratio; the shear modulus will be equal to 93Kg/cm2. By assuming the circular foundation equivalent radius of 1m, the dynamic subgrade vertical modulus will be 57200kg/cm. 14. The Friction Angle between the Concrete and the Material After the recommendations of Bowels about the concrete walls in case of smooth steel frame application; the friction angle between the soil and the concrete will be 8.0~6.0 . So, the friction angle between soil and the concrete is proposed as follows:
Layer
Filling materials 18 ~ 19 Original sea bed layers
15 ~ 16
680
Adib and Ashofteh, 2013
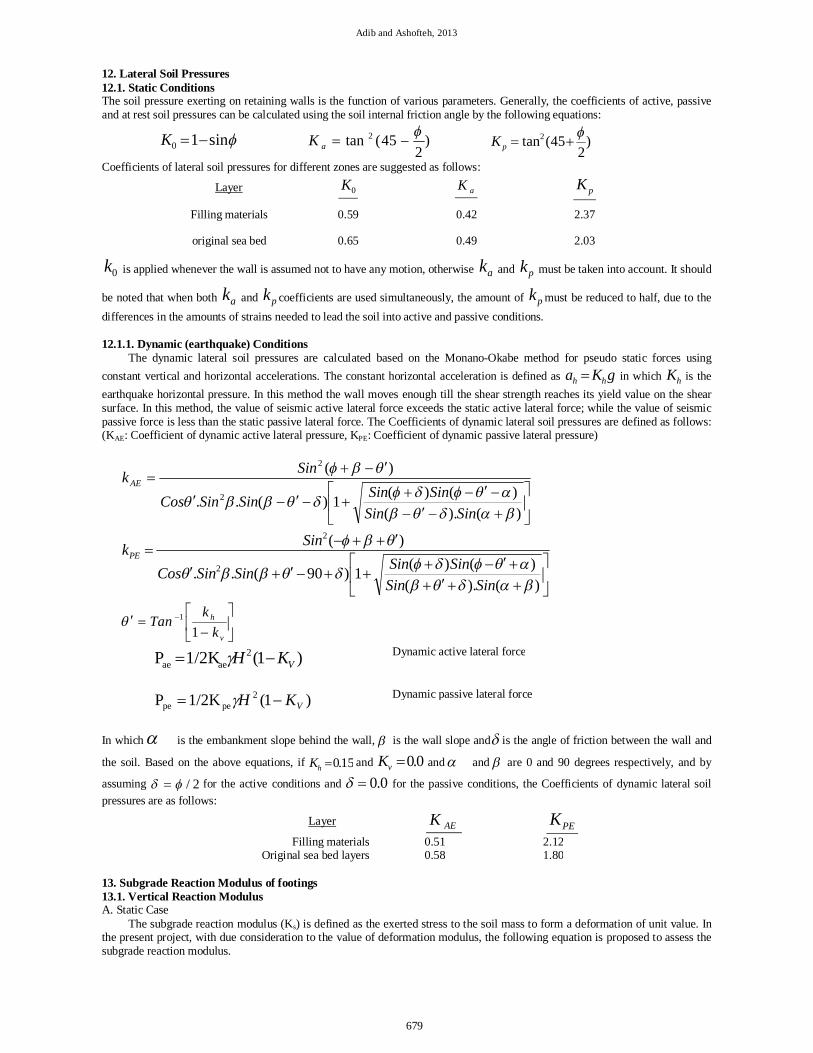
15. Stability Analysis Based on the available information, the stability analysis is performed for the embankment of filling materials and the result
is shown in Figure 31. The safety factor of stability is equal to 1.22.
Fig. 31. The result of slope stability analysis
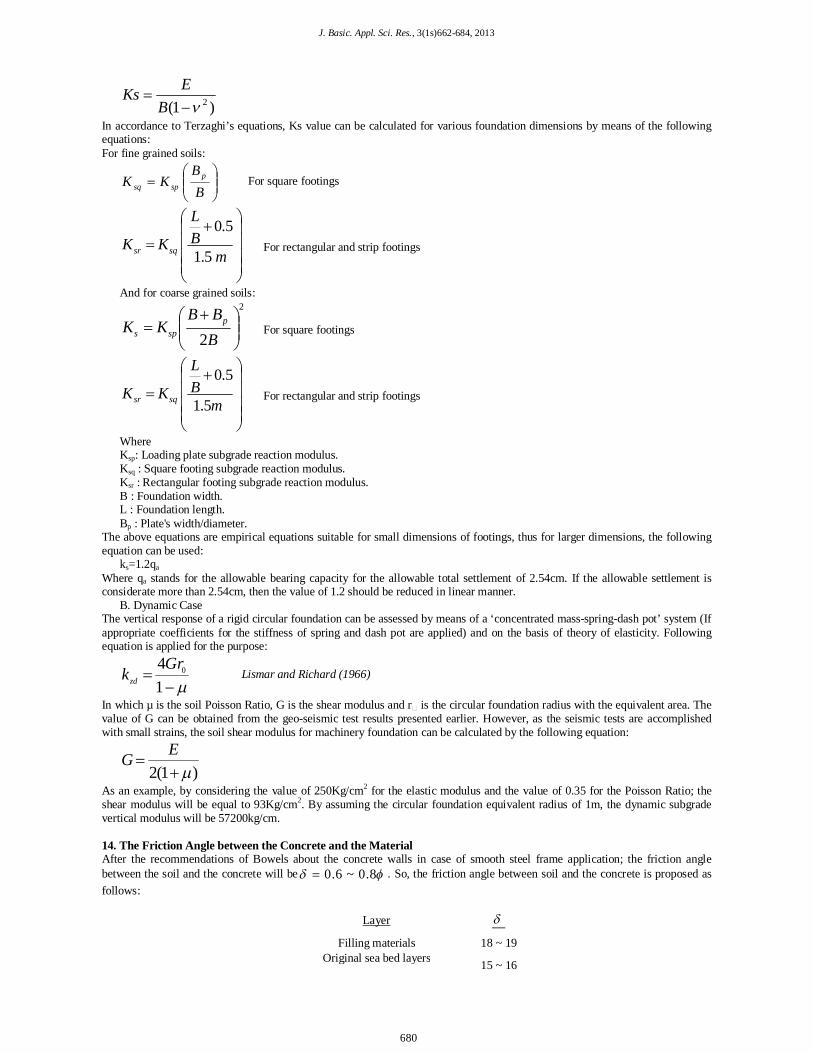
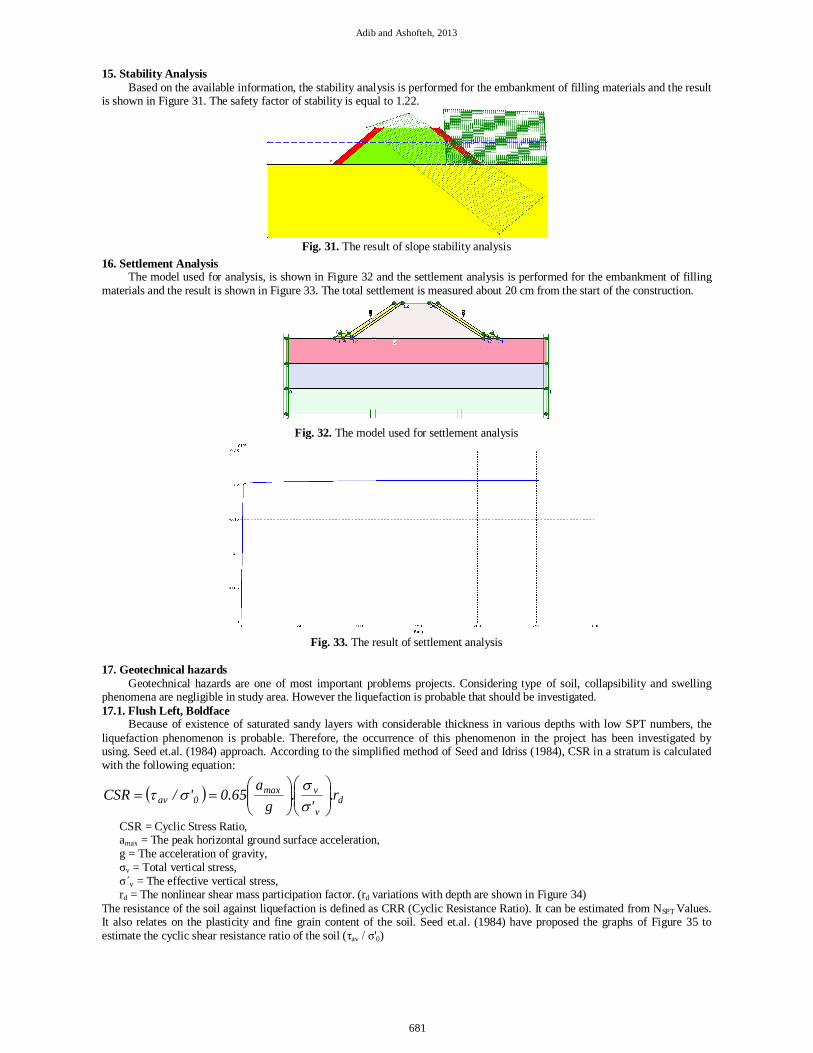
16. Settlement Analysis The model used for analysis, is shown in Figure 32 and the settlement analysis is performed for the embankment of filling
materials and the result is shown in Figure 33. The total settlement is measured about 20 cm from the start of the construction.
Fig. 32. The model used for settlement analysis
Fig. 33. The result of settlement analysis
17. Geotechnical hazards
Geotechnical hazards are one of most important problems projects. Considering type of soil, collapsibility and swelling phenomena are negligible in study area. However the liquefaction is probable that should be investigated. 17.1. Flush Left, Boldface
Because of existence of saturated sandy layers with considerable thickness in various depths with low SPT numbers, the liquefaction phenomenon is probable. Therefore, the occurrence of this phenomenon in the project has been investigated by using. Seed et.al. (1984) approach. According to the simplified method of Seed and Idriss (1984), CSR in a stratum is calculated with the following equation:
dv
vmax0av r.
'.
ga
65.0'/CSR
CSR = Cyclic Stress Ratio, amax = The peak horizontal ground surface acceleration, g = The acceleration of gravity, σv = Total vertical stress, σ΄v = The effective vertical stress, rd = The nonlinear shear mass participation factor. (rd variations with depth are shown in Figure 34)
The resistance of the soil against liquefaction is defined as CRR (Cyclic Resistance Ratio). It can be estimated from NSPT Values. It also relates on the plasticity and fine grain content of the soil. Seed et.al. (1984) have proposed the graphs of Figure 35 to estimate the cyclic shear resistance ratio of the soil (τav / σ'0)
681

J. Basic. Appl. Sci. Res., 3(1s)662-684, 2013
Fig. 34. rd Results From Response Analyses, Seed et al. (1984)
Fig. 35. Correlation between Equivalent Uniform Cyclic Stress Ratio and NSPT (M≈7.5)
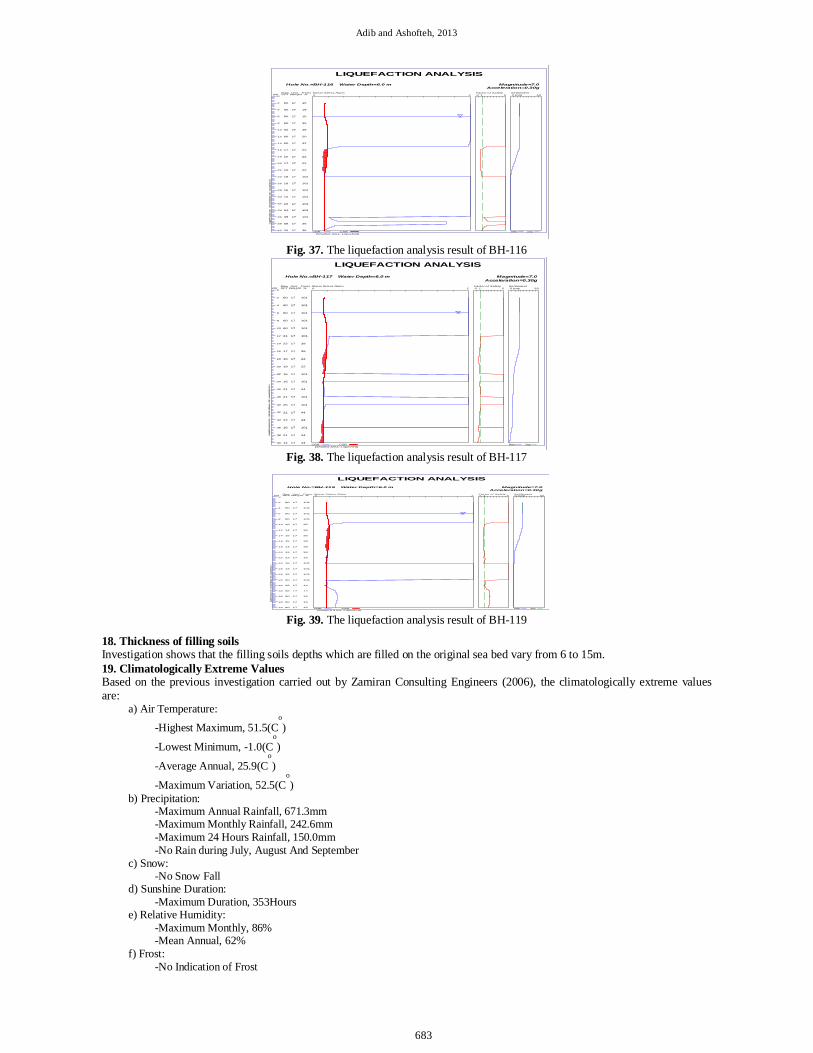
Now, the safety factor against liquefaction is defined as the ratio of CRR to CSR. F.S<1 means the liquefaction
phenomenon will occur. In this study, the liquefaction analyses have been performed using the LiqufyPro software (Version 2.4 from CivilTech Company). The analysis results for different boreholes are presented in Figures 36 to 40. The results have shown that the liquefaction risk is critical in sandy layers below the original sea bed. Based on the results, it is recommended to use shallow foundations with widths less than 3 meters. It should be noted that piles and wide shallow foundations will lose their bearing capacity during liquefaction phenomenon.
60 17 101
60 17 101
38 17 101
24 17 101
21 17 101
50 17 101
16 17 28
10 17 28
15 17 47
11 17 47
10 17 101
20 17 101
19 17 101
16 17 101
16 17 101
41 17 101
27 17 26
16 17 26
17 17 101
20 17 101
Lique
fyPro V
ersion
2.4A
C
ivilT
ech S
oftw
are U
SA w
ww.
civiltec
h.co
m
LIQUEFACTION ANALYSISHole No.=BH-115 Water Depth=6.0 m Magnitude=7.0
Acceleration=0.30gRaw Unit FinesSPT Weight %(m)
0
2
4
6
8
10
12
14
16
18
20
22
24
26
28
30
32
34
36
38
40
Shear Stress Ratio
CRR CSR(Shaded Area: Liquefied)
0 2Factor of Safety0 51
Settlement
Wet Dry
0 (cm) 50
Fig. 36. The liquefaction analysis result of BH-115
682
Adib and Ashofteh, 2013
60 17 15
60 17 15
60 17 15
60 17 35
60 17 35
60 17 20
60 17 32
17 17 22
15 17 22
17 17 22
16 17 22
18 17 101
18 17 101
15 17 101
15 17 101
19 17 101
24 17 101
35 17 101
58 17 36
25 17 36
LiquefyPro Version 2.4A CivilTech Software USA www.civiltech.com
LIQUEFACTION ANALYSISHole No.=BH-116 Water Depth=6.0 m Magnitude=7.0
Acceleration=0.30gRaw Uni t FinesSPT Weight %(m)
0
2
4
6
8
10
12
14
16
18
20
22
24
26
28
30
32
34
36
38
40
Shear Stress Ratio
CRR CSR(Shaded Area: Liquefied)
0 2Factor of Safety0 51
Settlement
Wet Dry
0 (cm) 50
Fig. 37. The liquefaction analysis result of BH-116
60 17 101
60 17 101
60 17 101
60 17 101
60 17 101
21 17 101
22 17 39
17 17 39
16 17 22
19 17 22
15 17 101
16 17 101
21 17 44
21 17 101
25 17 101
21 17 44
22 17 44
16 17 101
21 17 44
14 17 44
LiquefyP
ro Version 2.4A CivilTech So
ftware USA
www.civ
iltech.com
LIQUEFACTION ANALYSISHole No.=BH-117 Water Depth=6.0 m Magnitude=7.0
Acceleration=0.30gRaw Unit FinesSPT Weight %(m)
0
2
4
6
8
10
12
14
16
18
20
22
24
26
28
30
32
34
36
38
40
Shear Stress Ratio
CRR CSR(Shaded Area: Liquefied)
0 2Factor of Safety0 51
Settl ement
Wet Dry
0 (cm) 50
Fig. 38. The liquefaction analysis result of BH-117
60 17 101
60 17 101
60 17 101
60 17 101
18 17 35
14 17 35
15 17 35
15 17 39
14 17 39
19 17 39
23 17 15
16 17 101
13 17 101
15 17 101
20 17 101
28 17 14
56 17 14
60 17 15
60 17 15
60 17 15
LiquefyPro Version 2.4A CivilTech Software USA www.civiltech.com
LIQUEFACTION ANALYSISHole No.=BH-119 Water Depth=6.0 m Magnitude=7.0
Acceleration=0.30gRaw Uni t FinesSPT Weight %(m)
0
2
4
6
8
10
12
14
16
18
20
22
24
26
28
30
32
34
36
38
40
Shear Stress Ratio
CRR CSR(Shaded Area: Liquefied)
0 2Factor of Safety0 51
Settlement
Wet Dry
0 (cm) 50
Fig. 39. The liquefaction analysis result of BH-119
18. Thickness of filling soils Investigation shows that the filling soils depths which are filled on the original sea bed vary from 6 to 15m. 19. Climatologically Extreme Values Based on the previous investigation carried out by Zamiran Consulting Engineers (2006), the climatologically extreme values are:
a) Air Temperature:
-Highest Maximum, 51.5(Co)
-Lowest Minimum, -1.0(Co)
-Average Annual, 25.9(Co)
-Maximum Variation, 52.5(Co)
b) Precipitation: -Maximum Annual Rainfall, 671.3mm -Maximum Monthly Rainfall, 242.6mm -Maximum 24 Hours Rainfall, 150.0mm -No Rain during July, August And September
c) Snow: -No Snow Fall
d) Sunshine Duration: -Maximum Duration, 353Hours
e) Relative Humidity: -Maximum Monthly, 86% -Mean Annual, 62%
f) Frost: -No Indication of Frost
683

J. Basic. Appl. Sci. Res., 3(1s)662-684, 2013
g) Wind: (At 10.0m Elevation) -Predominant Wind Speed, 5.53m/sec -Predominant Wind Direction NW-SE -Gust Speed Recorded, 79.2km/hr Max. Anticipated, 100 km/hr
-Gust Direction at 130o Bearing
h) Barometric Pressure at 14.0m Level: -Maximum 1017.9MBS in January -Minimum 995.9MBS in July
20. Conclusion and Recommendations 1. The most important results and suggestions are as follows: 2. According to the field and laboratory test results, subsurface layer conditions are described as follows: The surface layer
consists of filling materials with a maximum thickness about 15m. These filling materials are filled in the sea, so by going far from the shore, their thickness will be increased. After this layer usually sandy layers and then silty and gravelly layers are recognized subsequently. These layers are usually loose to medium dense.
3. With respect to the geotechnical properties of the subsurface layers, the allowable bearing capacities of single footings, mat footings and deep foundations (Pile) have been calculated.
4. With respect to the local weather conditions, the freezing depth can be neglected. Thus a minimum embedment depth of 0.5m is recommended for the shallow footings.
5. Within the foundation construction period, the soil beneath the foundation should be inspected and the quality should be approved by a qualified inspector.
6. According to Iranian code of practice for seismic resistant design of buildings, Standard No. 2800 (3rd edition), the seismic hazard of study area is severe and design base earthquake acceleration (less than 10% probability occurrence at 50 years) of study area is 0.30g.
7. As a considerable portion of the pile total bearing capacity is supplied by the shaft, it is recommended to pay enough attention when excavating holes, to protect the whole perimeter against weathering and collapsing (Technical recommendations and design criteria by ACI-336.1).
8. It is supposed that the filling material layer is compacted well and has a good uniformity. The geotechnical parameters, bearing capacities values and etc. are valid based on this assumption.
9. Based on the geotechnical results, the sandy soil layers below the original sea bed are sensitive to liquefaction. It should be noted that the piles and wide shallow foundations will lose their bearing capacity during liquefaction. So, it is recommended to use shallow foundations with widths less than 3m.
REFERENCES
1- Taher Rajaee, Vahid Nourani, Mohammad Zounemat-Kermani and Ozgur Kisi, 2011. River Suspended Sediment Load
Prediction: Application of ANN and Wavelet Conjunction Model. Journal of Hydrologic Engineering, ASCE, Volume 16, No. 8, Agust 1, 613-627.
2- Rajaee, T., Mirbagheri, S.A., Nourani, V., Alikhani, A., 2010. Prediction of daily suspended sediment load using wavelet and neuro-fuzzy combined model. International Journal of Environmental Science and Technology (IJEST), 7 (1), 93-110, Winter.
3- Bathurst, R.J., Keshavarz, A., Zarnani, S. and Take, A. (2007). A simple displacement model for response analysis of EPS geofoam seismic buffers. Soil Dynamics and Earthquake Engineering, Vol. 27: 344-353.
4- Jahanandish, M., and Keshavarz, A. (2005). Seismic Bearing Capacity of Foundations on Reinforced Soil Slopes, Geotextiles and Geomembrains, Vol. 23 (1) : 1-25.
5- Jahanandish, M., and Keshavarz, A. (2004). Stability of Axially Symmetric Slopes in Soil Engineering, Proceedings of International Conference on Geotechnical Engineering, Beirut, 19-22 May 2004
6- Jahanandish, M., and Keshavarz, A. (2004). Evaluation of Critical Load Distribution of Foundations on Slopes by the Zero Extension Line Method. Proceedings of the 4th International Conference on LANDSLIDES, SLOPE STABILITY & THE SAFETY OF INFRASTRUCTURES, Kuala Lumpur, Malaysia, 2004
7- M. Gharouni e nik, Designing an Underground Lead and Zink Mine Using In-Situ Initial State of Stresses, Rock Stress and Earthquakes - Xie (ed.), Taylor & Francis Group, London, ISBN 978-0-415-60165-8.2010.
8- Ali Mansourkhaki, A.Arabani, ”Rational analysis of asphalt corrugation at Intersections” Journal of Engineering Volume 11 No2, Calcutta, India, April 2001.
9- Ali Mansourkhaki. M.Ameri. M.Arabani, “Determination of cohesion and friction angle of Asphalt Concrete based on Uniaxial and indirect tensile test. ”Int,J.Engng. IUST, 12 No2 (2001).
10- Mansour Khaki, Ali. and Reza Moayedfar, "The development of the composed probability model to estimate the rate of household trip production (Case study of Karaj city)", International Journal of Civil Engineering (IJCE), Vol. 2, No. 2, pp. 72-77, June 2004.
11- Ali Mansourkhaki , Sahryar Afandizadeh, Reza Moayedfar, "Developing The Composed Probability Model to Predict Household Trip Production", Transport, Vilnius Gediminas Technical University,Lithuanian Academy of Science,2009 24(1).
12- Ali Mansourkhaki ,M.Hosseaini,A.Shariat,(2003) Evaluating the efficiency of urban Transportation System in the aftermath of Earthquake in Large populated Cities,International Journal of Engineering Science,Iran University of science and Technology.
13- Mansour khaki, A. , shariat mohymany , A. and S.H. sadati " Determining the Hydrologic Index for prioritization of the strengthening the components of transportation Network against flood ( Golestan province case study)" , Journal of Applied sciences Research , RJAS, 5(10) : 1714-1720 , 2009.
14- Mansour khaki, A. , shariat mohymany , A. and S.H. sadati, " Development an Accessibitiyy approach to rank the transportation Network components during the occurrence of flood crisis ( Golestan province case study) ", Australian Journal of Basic and Applied Sciences, 2229 AJBAS, 2010.
684