geotechnical engineers ing
TRANSCRIPT

3
Vmdash
DREDGING OF PCB-CONTAMINATED SEDIMENTSNEW BEDFORD HARBORACUSHNET
RIVER ESTUARY MA
GEOTECHNICAL ENGINEERS ING
SDMS DocID 51982
DREDGING OF PCB-CONTAMINATED SEDIMENTS NEW BEDFORD HARBORACUSHNET
RIVER ESTUARY MA
Submitted to
New England Governors Conference Inc Boston Massachusetts
Submitted by
Geotechnical Engineers Inc 1017 Main Street
Winchester Massachusetts 01890
Project 82990 September 7 1982
ampMCampiJJM Richard W Turnbull Ronald C Hirschfeld Engineering Geologist Principal
The views and statements contained in this publication are solely those of the authors and do not represent the official views or policies of the New England Governors Conference its member states other state agencies the Water Resources Council its members agencies or other federal agencies
TABLE OF CONTENTS
Page No
LIST OF TABLES
LIST OF FIGURES
1 EXECUTIVE SUMMARY 1
2 INTRODUCTION 4
21 Purpose 4 22 Scope 4 23 Authorization 5 24 Background 5
3 CHARACTERIZATION OF SEDIMENTS 7
31 General Geology 7 32 Surface Sediments 7 33 Sedimentation Rates 8 34 PCB Contamination 8 35 Metals 9 36 Classification 10 37 Impacts on Dredging and Transportation 11
4 DREDGING bullbull 12
41 Mechanical Dredge 12 42 Hydraulic Dredges 13 43 Pneumatic Dredges 13 44 Silt Curtains 14
5 TRANSPORTATION OF DREDGED MATERIAL 15
51 Floating Slurry Pipeline 15 52 Barge 15 53 Truck or Rail 15
6 DISPOSAL OPTIONS 17
61 General bull 17 62 Incineration 17 63 Chemical Landfill 17 64 Other Disposal Options 18
TABLE OF CONTENTS (Concluded)
Page No
7 CASE HISTORIES IN CONTAMINATED SEDIMENTS 21
71 Upper Hudson River New York 21 72 Waukegan Harbor Illinois 21 73 Duwamish Water Seattle Harbor Washington bull 23 74 California Aqueduct 23 75 James River Virginia 24 76 Contacts For Case Studies 25
8 CONCLUSIONS 28
9 REFERENCES 29
TABLES
FIGURES
APPENDIX
LIST OF TABLES
Table 1 - EstimatedContaminated Volumes and PCS Recovery
Table 2 - Results of Bulk Analysis of Sediment Samples
Table 3 - Classification of Dredge or Fill Material by Chemical Constituents
Table 4 - Classification of Dredge or Fill Material by Physical Characteristics
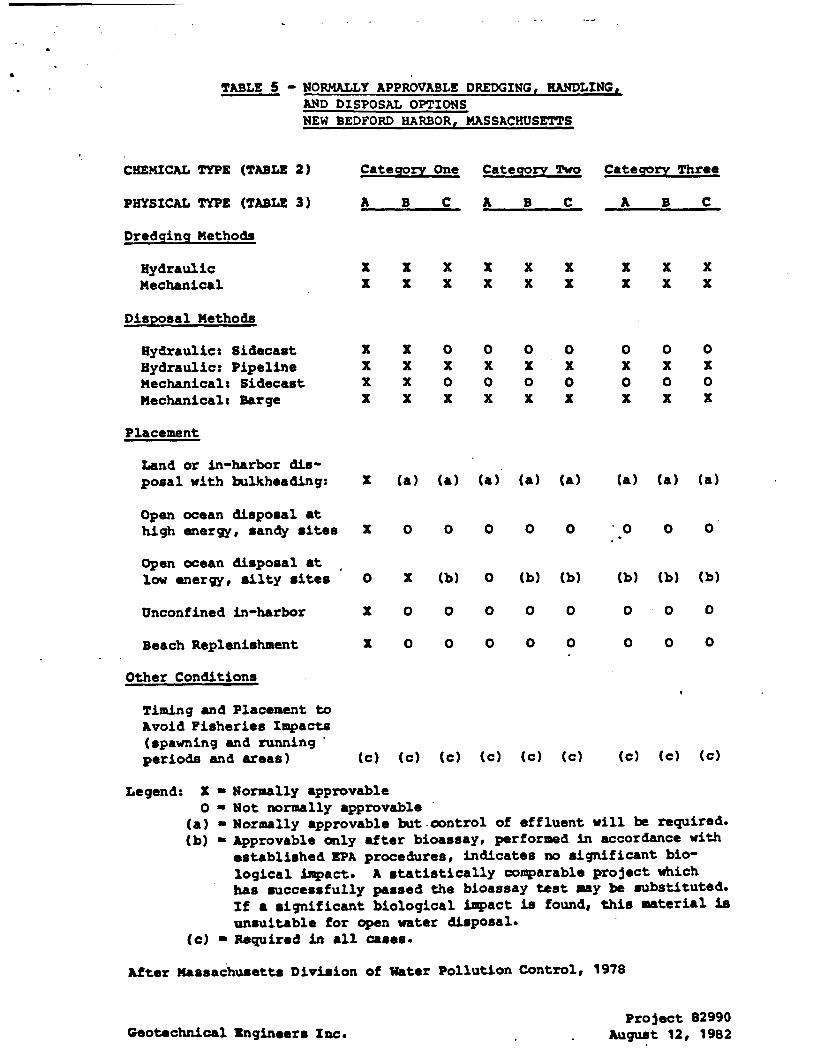
Table 5 - Normally Approvable Dredging Handling and Disposal Options
LIST OF FIGURES
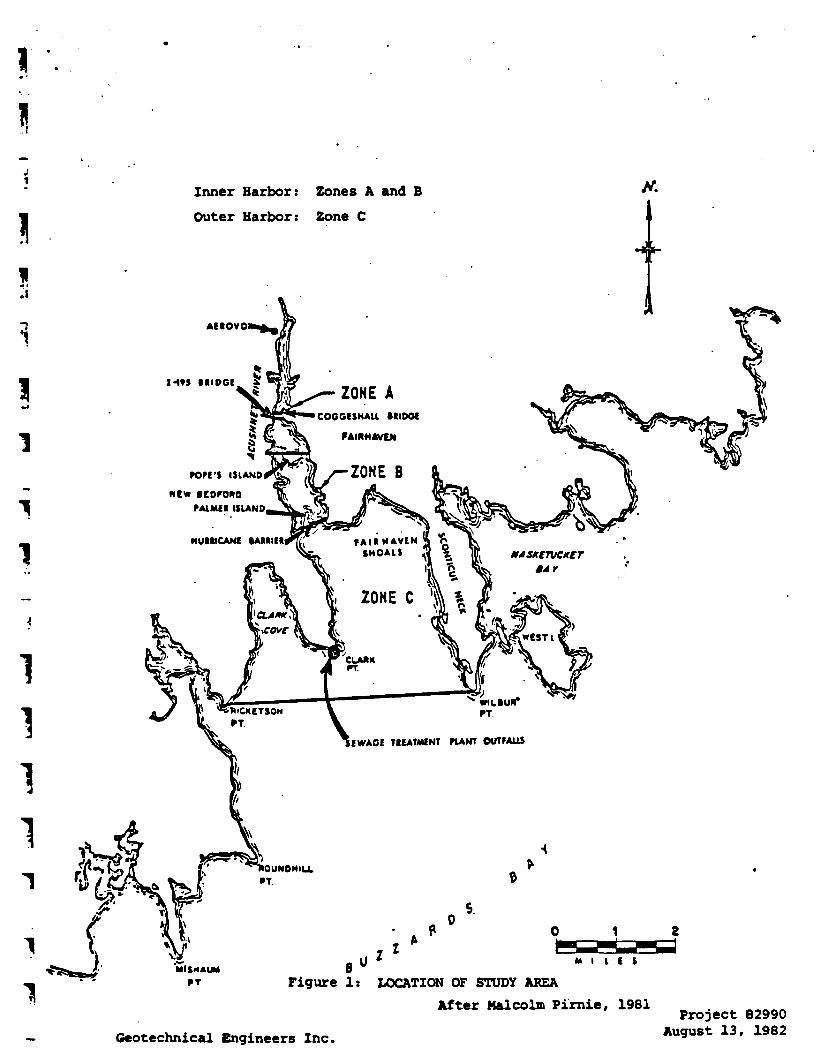
Fig 1 - Location of Study Area
Fig 2 - Location of Sampling Stations in Acushnet River
Fig 3 - Mechanical Dredges
Fig 4 - Mechanical Dredges
Fig 5 - Watertight Grab Bucket
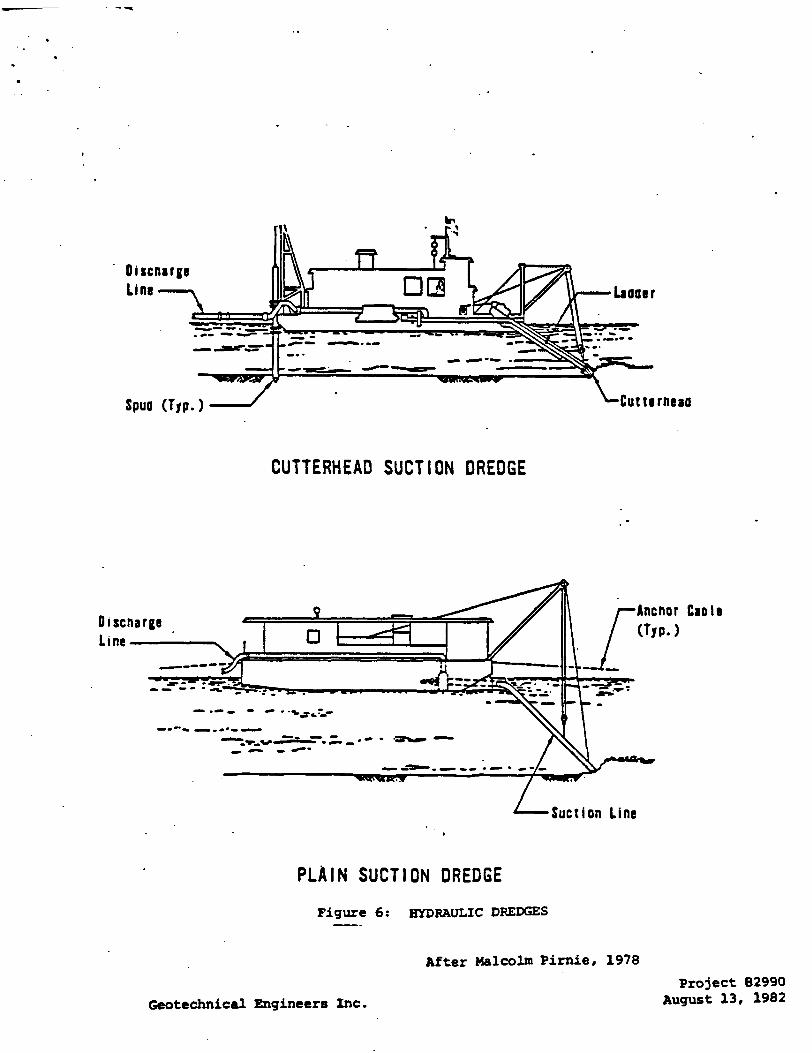
Fig 6 - Hydraulic Dredges
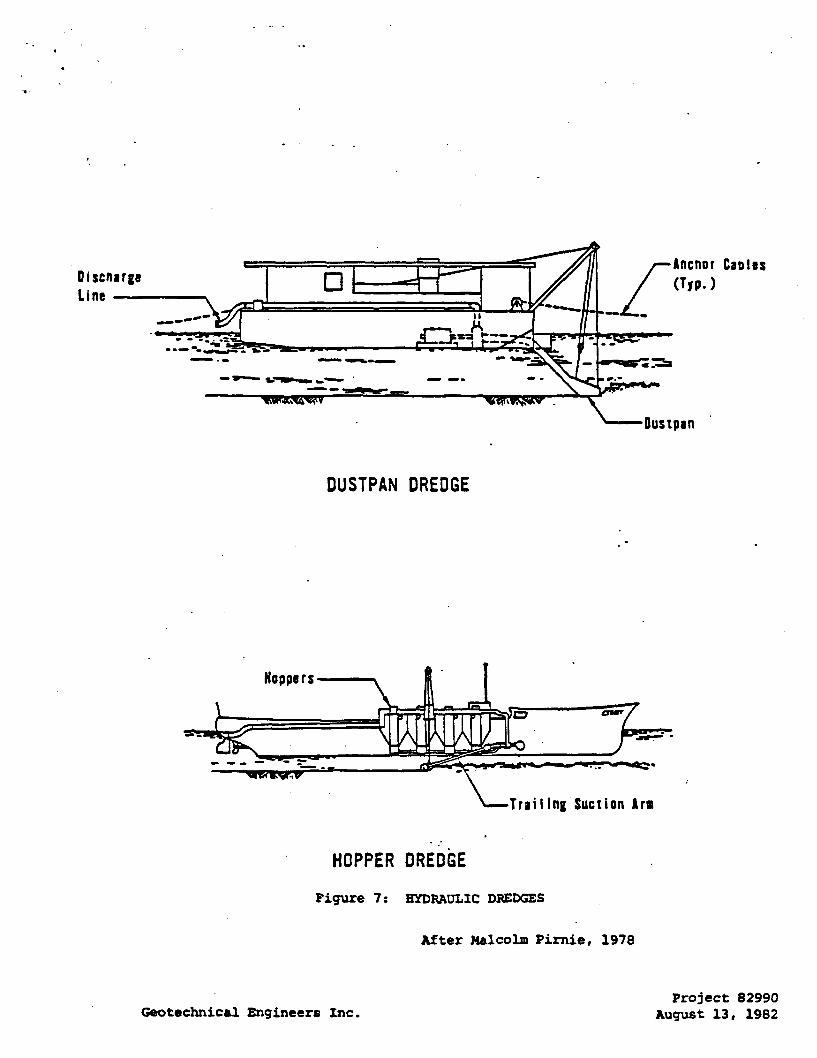
Fig 7 - Hydraulic Dredges
Fig 8 - Pneumatic Pump
Fig 9 - Oozer Pump Operation
Fig 10 - Typical Secure Land Burial Facility For Contaminated Dredge Spoils
1 EXECUTIVE SUMMARY
The purpose of this investigation was to identify feasible dredging techniques for the removal of sediments contaminated with polychlorinated biphenyls (PCBs) from the New Bedford Harbor and Acushnet River Estuary This investigation included laboratory testing on sediments obtained from the tidal flats near a historic source of PCB contamination and a literature review of the history of PCB contamination in the general area local sediment characteristics and dredging transporting and disposing of contaminated sediments
This investigation was sponsored by the New England Governors Conference Inc with primary funding from the U S Water Resources Council secondary funding and technical guidance from the Massachusetts Office of Coastal Zone Management and in kind services contributed by the five coastal New England states and New York This work is part of a larger analysis of dredge management needs in New England
Information developed during this and previous studies indishycate that surface sediments of the Acushnet River Estuary and New Bedford Harbor are contaminated with high levels of PCBs from two industrial operations and a wastewater treatment facility The area of contamination extends from the tidal flats at the northernmost extreme of the estuary in the inner harbor to an area in the vicinity of the New Bedford municipal wastewater outshyfall in the outer harbor a distance of over six miles These sediments contain PCBs in levels up to 190000 ppm or 19 pershycent Contamination has caused eighteen thousand acres to be closed to lobstering and a lesser yet significant area to be closed to the-taking of finfish and shellfish
PCBs are only slightly soluble in water and -are readily adsorbed from aqueous solutions and held strongly in place by fine-grained sediments Therefore the mobility of these conshytaminants when sediments are moved will depend greatly upon the amount of resuspension of the sediments during dredging and transportation To minimize environmental impacts dredging and transportation techniques must be selected to minimize resuspenshysion of contaminated sediments
Surface sediments consist primarily of black organic silts and clays Vertical movement of PCBs within the fine-grained surface sediments is likely to be low Although the vertical extent of PCB contamination throughout the harbor is not precishysely known data indicate that PCBs are most concentrated in the top 10 cm and are not likely to be present in elevated conshycentrations at depths greater than about 1 m
-2shy
Surface sediments are most likely to be classified as Category Three Type C by the Mass Division of Water Pollution Control due to the excessively high contents of PCBs copper lead zinc chromium and other metals (Category Three) and due to the generally high percentage of silt clay oil and grease and water (Type C)
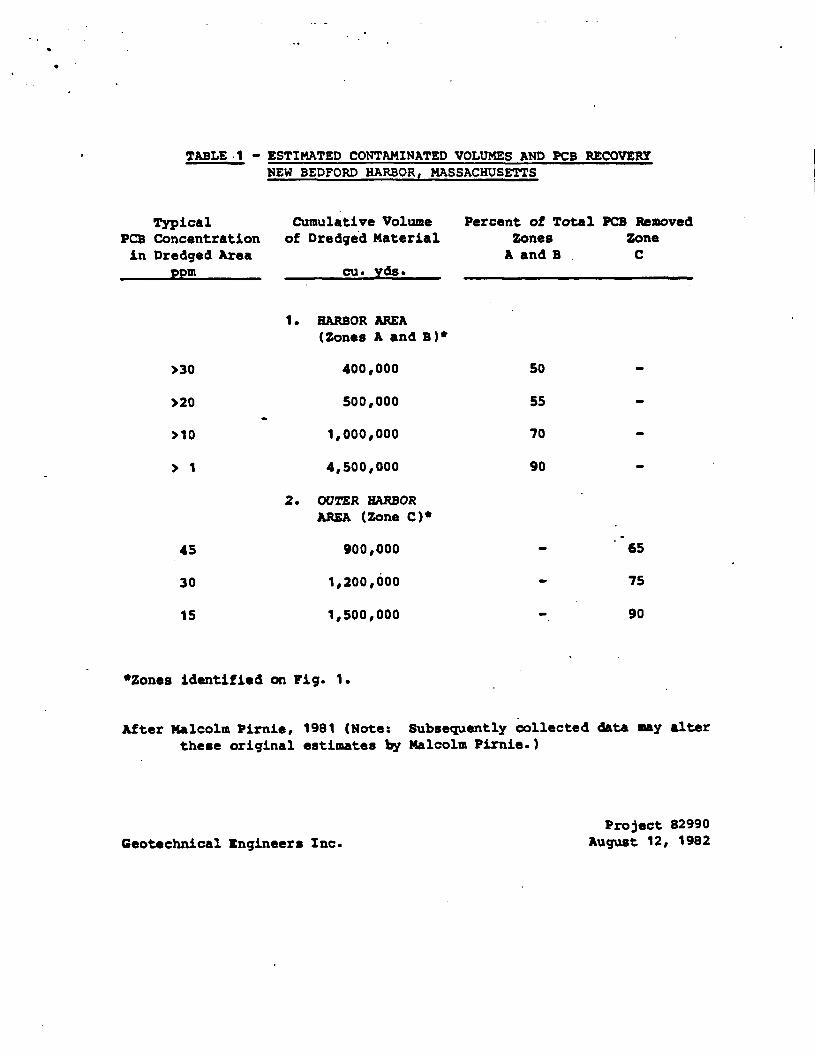
Assuming that an average of 2 ft of surface sediment is conshytaminated it is estimated that to remove 90 of the PCBs from the inner harbor would require dredging about 4-12 million cu yds of material removal of 90 of the PCBs from the outer harshybor would require dredging an additional volume of about 1-12 million cu yds of contaminated sediments
The primary dredging types include mechanical hydraulic and pneumatic Each of the three general dredging types could be used in an environmentally safe manner with the pneumatic and hydraulic dredge methods providing the least chance for resuspenshysion of sediments Watertight mechanical (clamshell) methods may also be environmentally safe when used in conjunction with silt curtains
Dredged material is transported generally by pipeline barge truck or rail depending on the dredge type and distance to the disposal site
Dredge spoils (and other materials) containing 50 ppro or greater of PCBs are regulated by the EPA EPA specifies three alternate disposal methods for such materials which include much of the harbor sediments (1) incineration (2) disposal in an approved chemical landfill and (3) some other disposal method approved by the EPA Regional Administrator
Incineration of dredged material is technically feasible but would likely be prohibitively expensive
There are at present no chemical landfills in New England approved by the EPA for disposal of PCB dredge spoils The closhysest approved chemical landfills are about 500 miles from the project area in New York State and disposal space in those cheshymical landfills is extremely limited Even if disposal space is available at the New York landfills transportation and disposal costs would likely be prohibitively expensive
Among the other disposal options the most feasible options at this time appear to be open water or land disposal at sites specially set aside for dredged spoils Land disposal in a proshyperly engineered clay encapsulated excavation or pile with leachate collection and treatment systems would provide adequate
-3shy
environmental isolation of contaminated sediments Open ocean dumping of sediments does not provide the level of containment as an encapsulated landfill but would remove the materials to a more remote environment
Although technical solutions are available it is impossible to recommend a specific dredging transportation and disposal option until a disposal site is identified This is because dredging and transportation techniques are directly tied to each other and to the ultimate disposal site
Further input from the public and the many federal state and local regulatory agencies will be required to select a disposal site or sites before meaningful recommendations regarding dredging and transportation techniques can be made Cost benefit analysis between several disposal site alternatives and associated dredging and transportation techniques should then be performed
-4shy
2 INTRODUCTION
21 Purpose
The purpose of this investigation was to identify feasible dredging techniques for the removal of contaminated sediments from the New Bedford Harbor and Acushnet River Estuary and to complement ongoing dredge spoil studies being made by state federal and private organizations in the area It was also the intent of this investigation to obtain more detailed knowledge about sediment characteristics in the -tidal flats north of the inner harbor and general knowledge about the rest of the harbor sediments (Figs 1 and 2)
22
This investigation was divided into two major tasks Task I consisted of collecting and analyzing available information on the physical and chemical characteristics of the contaminated sediments in the estuary In addition laboratory tests were performed on seven sediment samples which were obtained from the tidal flats near a historic source of contamination These tests included
a Bulk analysis for metals oil and grease shy
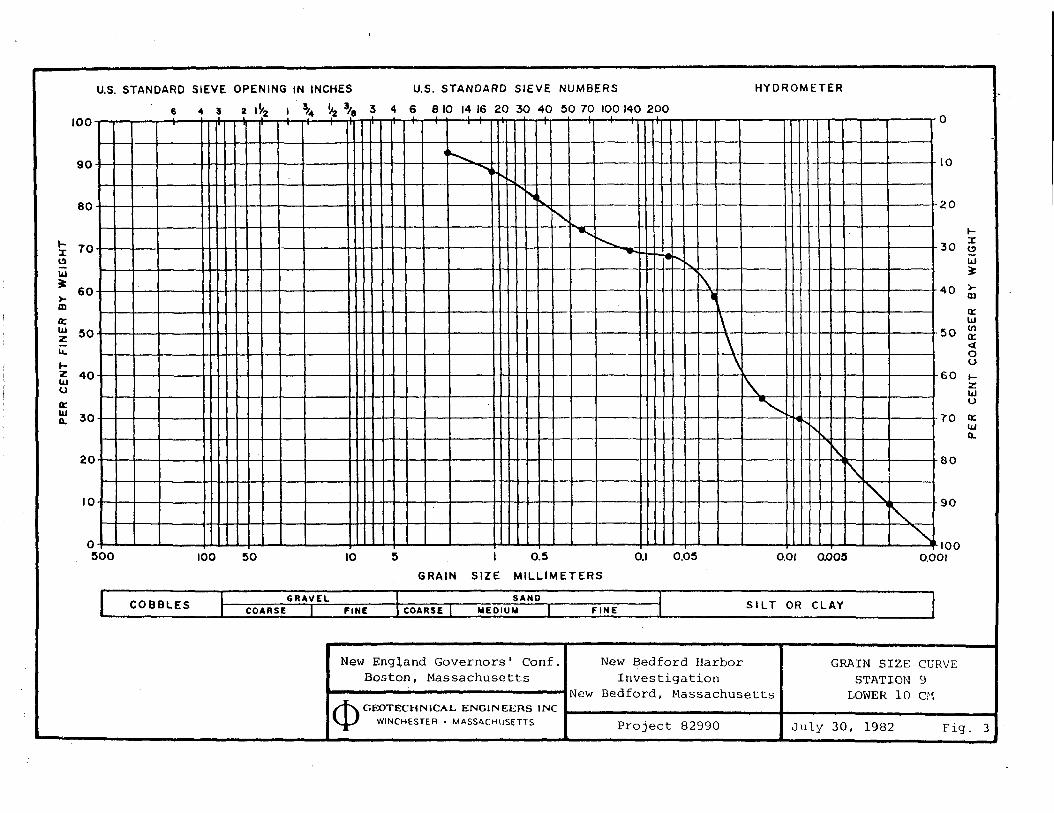
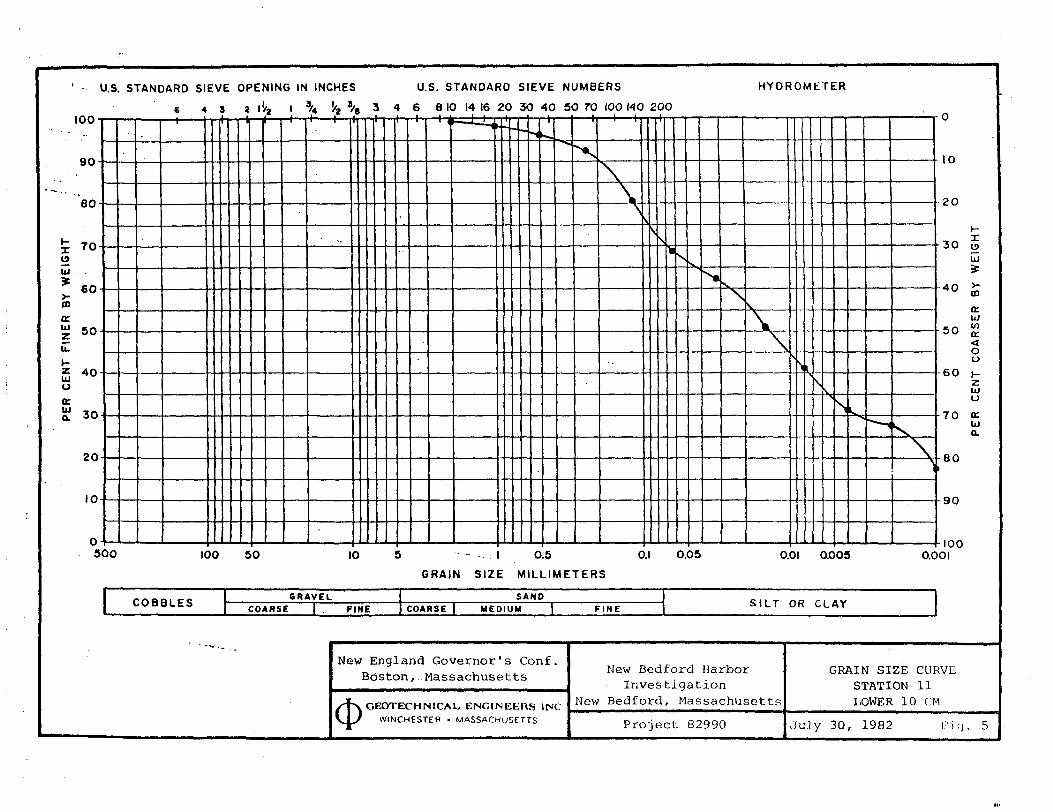
b Grain-size analysis
c Composite elutriate tests for metals oil and grease and PCBs
d Composite EP toxicity test
e Solid phase bioassay
The results of the laboratory testing program are discussed in detail in the Appendix
Task II consisted of a literature review to identify and evaluate available dredging techniques to provide preliminary recommendations on methodologies available to dredge and transport contaminated sediments from the estuary in an environshymentally safe manner In addition we took a general look at some of the options available for disposing of the dredged sedishyments
Funding for the collection of samples was provided by Massashychusetts Office of Coastal Zone Management
-5shy
23 Authorization
Work performed for this investigation was authorized by a contract dated June 24 1982 between the New England Governors Conference Inc and Geotechnical Engineers Inc
24 Background
The New England Governors Conference Inc (NEGC) with primary funding from the U S Water Resources Council and in kind services contributed by the five coastal New England states and New York has been charged with the task of concluding the New EnglandNew York Long Range Dredge Management Study origishynally begun by the former New England River Basins Commission The primary goals of the Dredge Management Program are to idenshytify and assess the effects of dredging on each state and region develop procedures for use by the states in setting priorities for dredging projects and develop long-range regional and subreshygional dredge management strategies As part of this program the NEGC in conjunction with the Massachusetts Office of Coastal Zone Management has elected to focus on investigating dredging techniques for the PCB-contaminated sediments in the New Bedford HarborAcushnet River Estuary
New Bedford Massachusetts is a port city located on Buzzards Bay approximately 55 miles south of Boston- With a population of 98500 New Bedford is Massachusetts fourth largest municipality
A major source of contamination in the harbor sediments is polychlorinated biphenyls or PCBs PCBs are a class of comshypounds produced by the chlorination of biphenyls and are registered in the U S under the trade name Aroclor PCB comshypounds are only slightly soluble in water lipids oils and organic solvents and are resistant to both heat and biological degradation They have been used principally in the electrical industry in capacitors and transformers (MDPW undated)
Extensive PCB contamination of New Bedford Harbor (Fig 1) was documented in 1976 when the Environmental Protection Agency conducted a New England-wide PCB survey and found high levels of PCBs in various harbor locations Testing revealed that two industrial operations were discharging wastewaters containing PCBs to New Bedford Harbor by direct discharge and indirectly via the New Bedford Municipal wastewater treatment facilityDischarge from one of the industrial operations has been nearly eliminated while discharge from the others has been signifishycantly reduced however the discharge of PCBs from New Bedfords municipal wastewater treatment plant remains significant Recent
-6shy
studies have shown that 300 to 700 pounds of PCBs are being discharged per year (Weaver 1982)
The area of PCB contamination extends from the northernmost extreme of the Acushnet River Estuary to an area in the vicinity of the New Bedford municipal wastewater outfall a distance of over six miles The Division of Water Pollution Control and Coast Guard have been mapping PCB concentrations in the Harbor and in Buzzards Bay (Acushnet River Estuary PCB Commission 1982) The sediments underlying the entire 985-acre inner harbor contain high levels of PCBs Most of the heavily contaminated sediment (greater than 50 ppm) is north of the 1-195 bridge and is found in the top 2 feet of the harbor sediments The harbor sediments contain PCBs in levels up to 190000 parts per million or 19 percent concentrations in the thousands of ppm are common in the tidal flats near the Aerovox Incorporated plant (Weaver 1982) These sediments exceed the federal hazardous waste crishyteria by several orders of magnitude
The water column in New Bedford Harbor has been measured to contain PCBs in the parts per billion range (well in excess of EPAs 1 part per trillion guideline) (Weaver 1982)
Widespread contamination of the Acushnet River Estuary environs has resulted in the accumulation of PCBs in many marine species Eighteen thousand acres have been closed to the harshyvesting of lobsters due to PCB pollution Lesser yet signifishycant areas are closed to the taking of finfish and shellfish Finfish in the area have been found to contain concentrations exceeding 150 ppm (The FDA standard for edible finfish and shellfish is 5 ppm) Limited human blood analyses suggest that the blood of heavy fish eaters and industrially exposed indivishyduals contain elevated levels of PCBs (Weaver 1982)
Concern over uptake and accumulation by most of these orgashynisms is directed to unknown chronic effects bioaccumulation in complex food webs and particularly chronic effects on human consumers Some of the effects on human health that may be attributable to low-level exposures to PCBs are abnormal fatishygue abdominal pain numbness of limbs swelling of joints chroshynic cough headaches dermatological abnormalities and anemia The International Agency for Research in Cancer believes that there is enough suggestive evidence to regard PCBs as carshycinogenic pending confirmatory evidence (Weaver 1982)
Because of the documented toxicity of PCBs and the demonstrated potential for their biological accumulation dredging transportation and disposal methods for sediments conshytaminated with high levels of PCBs must be selected to minimize further transport and biological exposure to these materials
bullSediment containing 50 ppm or greater of PCBs must be regulated by the EPA
-7shy
3 CHARACTERIZATION OF SEDIMENTS
31 General Geology
The seabed in the study area consists of the drowned valley of the Acushnet River which cuts a NNW-SSE trending trough from New Bedford Harbor to Buzzards Bay A drowned tributary of the Acushnet separates Sconticut Neck from the smaller ridge which forms Fairhaven Shoals Another drowned tributary of the Acushnet extends around Clark Point Peninsula and into Clark Cove The seabed in the estuary and harbor area is generally shallower than about 25 ft with the exception of the harbor chanshynel which is dredged to about 30 ft (Sumraerhayes 1977)
Test borings by the U S Army Corps of Engineers (ACE) indicate that bedrock in the area consists of granitic gneiss which is overlain by 8 to 9 ft of glacial till andor 6 to 9 ft of gravelly sediment These materials in turn are buried by varying thicknesses of sands and silts
Sediments are generally thinnest over topographic highs and thickest in troughs Where bedrock is deepest in the buried channel of the Acushnet and dredging has not occurred up to 60 ft of unconsolidated sediments have accumulated Sediment thicknesses in dredged areas are substantially thinner
32 Surface Sediments
Muddy sediments (silt and clay) cover the floor of the drowned valley of the Acushnet River and occupy topographic depressions while sand and gravel or bare rock occur on the subshymarine ridges- Surface sediments are usually darker finer-grained shellier and contain more organic matter than the buried sediments -The New England Division of the U S Army Corps of Engineers (unpublished report) analyzed 15 cores collected from the harbor and navigation channel and found that all of the samples examined except three were classified as a black orgashynically enriched silt with more than 70 percent fines (mud) (Summerhayes 1977)
As part of this investigation surface samples were obtained from the tidal flats north of the inner harbor (Pig 2) These samples consisted primarily of oily organic sandy silts Percent fines ranged from 45 to close to 100 and averaged over 75
The major depocenter of mud in the drowned Acushnet Valley is in the inner harbor (Zones A and B on Fig 1) Surface silts
Fines are soil particles that pass through a No 200 mesh sieve the openings of which are 74 microns (0074 ram) square
-8shy
are thickest near the head of the harbor north of the New Bedford-Fairhaven Bridge where there is up to 15 ft of dark organically enriched silt Much of the navigation channel is floored with muddy sediment except near the hurricane barrier where sandy sediments occur probably because tidal currents are strong enough to prevent the settling of fines Organic muds in the navigation channel are believed to contain substantial amounts of gas produced by the decay of organic matter Similar organically enriched muds form a low mound around the sewer outshyfall off of Clark Point (Summerhayes 1977)
On the ridge crests and on the steeply sloping margins of the outer harbor are fine sands and gravels Where gravel-sized material is present in muddy samples it is usually in the form of whole or fragmented mollusk shells These coarse deposits and the muddy sediments flooring the depressions are separated in several places by narrow transitional zones where muddy sands and muddy gravels occur These transitional sediments take the place of muds in the depressions that run up into Clarks Cove and east of Fairhaven Shoals
33 Sedimentation Rates
Summerhayes 1977 states that silt and clay are being transported into the estuary in suspension by landward-moving bottom currents that are driven by wave and tidal energy These fine sediments come from Buzzards Bay but may originate out on the continental shelf Before the entrance to the harbor was almost completely blocked by a hurricane barrier these sedishyments were accumulating in the harbor at rates of about 1-2 cmyr in the deeps and less than 05 cmyr in the shallows Construction of the barrier in 1966 reduced the efficiency of tidal flushing causing the rate of siltation to increase The present rate of sedimentation in the deeper portions of the harshybor is estimated to be 4 cmyr (Summerhayes 1977)
34 PCS Contamination
PCB was formerly discharged at two locations in New Bedford One discharge was on the west side of the Acushnet River north of the Coggeshall Street Bridge The second discharge was south of the hurricane barrier on the west side of the outer harbor Quantities of PCBs are at present being discharged in effluent from the New Bedford Wastewater Treatment Plant on Clark Point (Weaver 1982)
Biota exhibit the highest PCB levels in the harbor area and decreasing levels seaward The median PCB values of lobsters and bottom feeding fish in the harbor area are greater than the
-9shy
FDA limit of 5 ppm wet weight Outside the harbor area median PCB values generally drop below the FDA limit although many samples still exceed 5 ppm (Malcolm Pirnie 1981)
The geographical extent of the PCB contamination in the harbor and into Buzzards Bay and the depth of the contamination vertically into the sediments is not precisely known Howeverf sampling and PCB testing conducted by the U S Coast Guard Providence RI confirm extremely high levels of PCBs in the top 10 cm of surface sediments of the tidal flats (Fig 2) near a historic PCB source area north of the inner harbor The greatest concentrations of PCBs appear to be located in the tidal flats near Aerovox in the channel north of the Coggeshall Street Bridge on the west side of the inner harbor near Popes Island on the east side of the inner harbor near Fairhaven Marine in the flats southwest of Palmer Island in the northwest portion of the outer harbor and in the sediments at the end of the wastewater treatment plant outfall (Malcolm Pirnie 1981)
Sufficiently extensive sampling has not yet been completed to determine the precise extent of PCB distribution in the estuary and harbor Therefore a meaningful PCB concentration contour map could not be prepared However it is known that PCBs are strongly bound to the solid phase in typical sediment-water systems and have an affinity for fine-grained sediments Therefore it is reasonable to expect that major concentrations of PCBs will be present where there are significant accumulashytions of fine-grained sediments ie the deeper parts of the harbor
Malcolm Pirnie Inc 1981 estimated volumes of conshytaminated bed material in the Acushnet River-New Bedford Harbor area based on a depth of contamination of 2 ft and a depth of removal by dredging of 3 ft Dredged material volumes and PCB recovery for inner and outer harbor dredging are presented on Table 1
35 Metals
Heavy Metals Distribution - The sediments in New Bedford Harbor and the navigation channel contain significant quantities of heavy metals resulting from industrial discharges The most enriched sediments are surface deposits of silt and clay The large surface areas of these fine-grained particles tend to adsorb pollutants and incorporate them into the sediment (Summerhayes 1977)
As part of this study bulk analyses of surface sediments were performed on 14 sediment samples collected from the tidal
-10shy
flats In the Acushnet River Estuary in the vicinity of a historic source of contamination as discussed in the Appendix
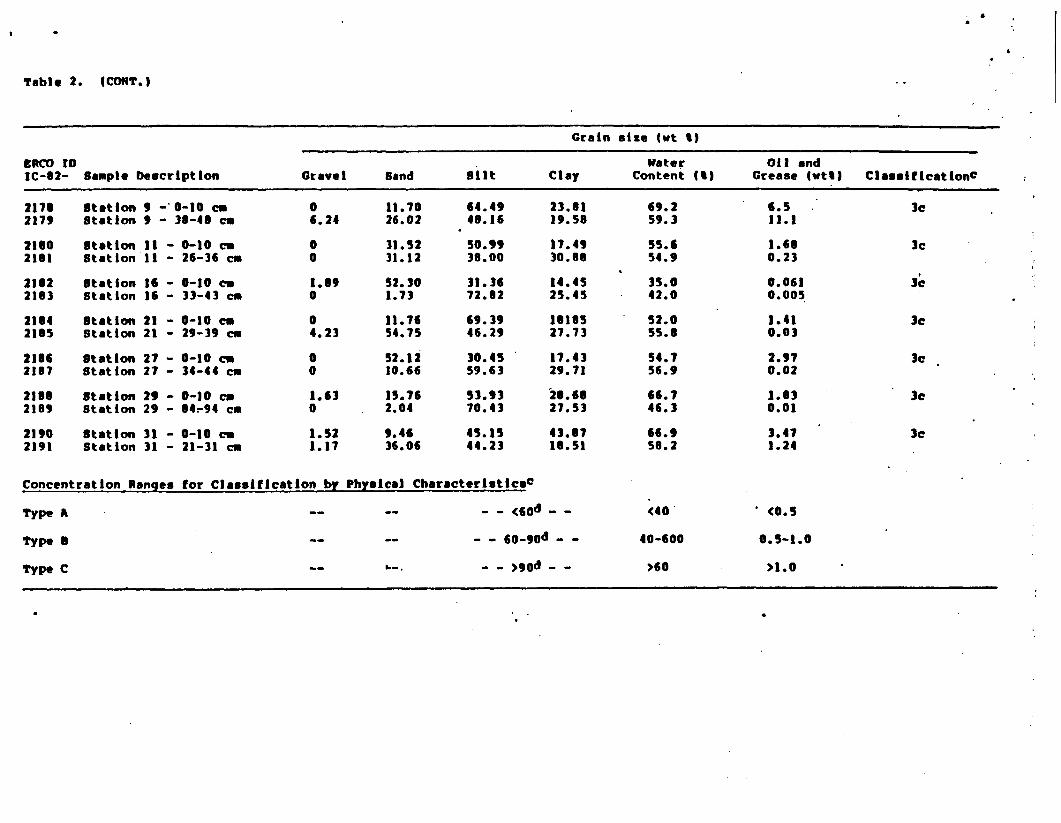
The results of the bulk analyses indicate high conshycentration of metals at all but 2 of the 14 sampling stations (Table 2) Particularly high concentrations of copper lead and zinc were found at eight stations cadmium and chromium at six stations Concentrations of zinc exceeded 3500 ppm (dry weight) at four stations copper exceeded 1000 ppm at three stations and lead equaled or exceeded 1000 ppm at three stations
This data correlates well with data by Summerhayes 1977 who found that the principal contaminants in the inner harbor are copper chromium lead and zinc Copper was the most abundant metal Chromium copper and zinc were reported to locally comprise more than one percent of the dry weight of sediments in the harbor The Division of Water Pollution Control sampling data indicate that the sediments just north and south of the Coggeshall Street Bridge are most enriched by metals Copper occurs in greatest concentrations just south of the bridge in close proximity to a metal discharge on the western bank Near the Coggeshall Street Bridge as much as 8054 parts per million of copper was in one sample The thickest copper-rich deposits are in deeper parts of the harbor the copper-rich deposits are thinner in shallower areas and seaward (Summerhayes 1977)
The navigation channel also contains metal-enriched sedishyments although not at levels as high as the inner harbor Moving away from the channel metal concentrations in sediments indicate no enrichment above typical background levels measured in central Buzzards Bay (Malcolm Pirnie 1981)
Although there is a net landward movement of silt and clay in bottom currents contaminated sediments still slowly migrate from the harbor probably by eddy diffusion of resuspended parshyticles Summerhayes 1977 estimates that 24 percent of the metals discharged into the inner harbor have been transported to Buzzards Bay by this mechanism and have formed a carpet 10 to 20 cm thick in some areas of Buzzards Bay
36 Classification
The Massachusetts Division of Water Pollution Control has adopted certain criteria for classifying dredged material based on chemical and physical characteristics These criteria were adopted in 1978 to provide interim guidance for the evaluation of dredging and dredge material disposal projects in Massachusetts waters
-11shy
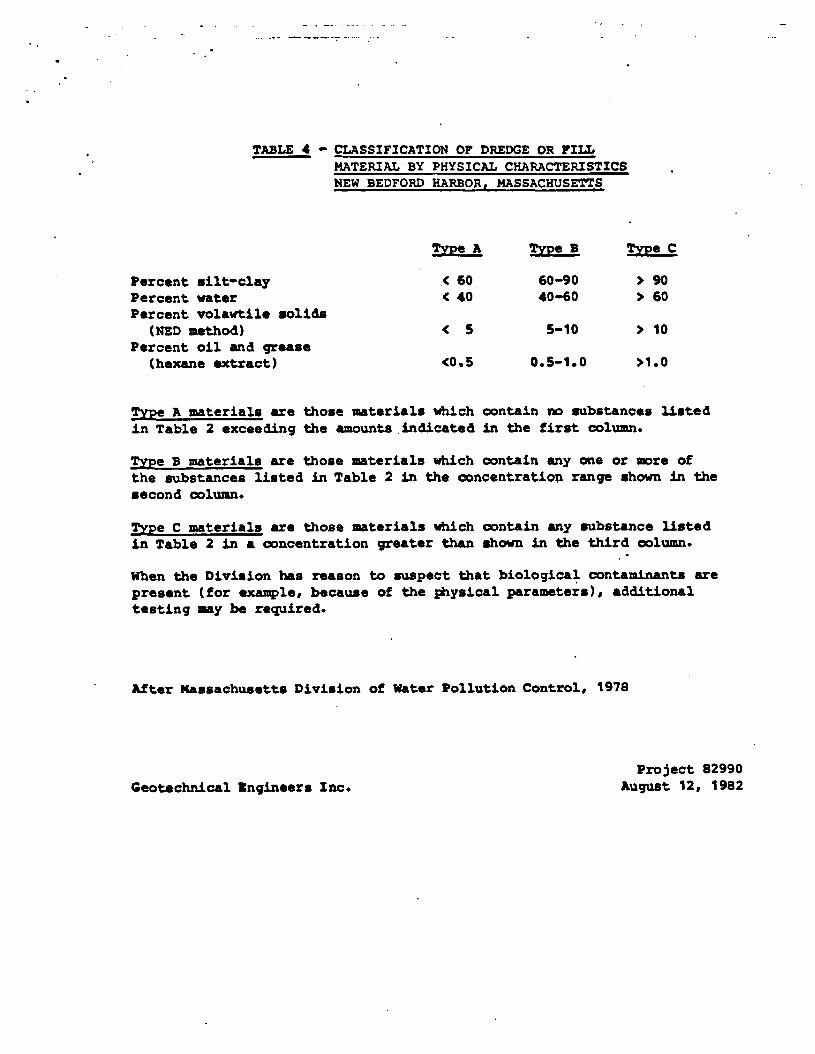
Table 3 presents the classification of dredge spoils by chemical constituents and Table 4 presents classification by physical characteristics
Based on the excessively high content of PCBs copper lead zinc chromium and other metals most of the estuary and harbor surface sediments would be classified Category Three on Table 3 the generally high percentage of silt clay oil and grease and water would classify the sediments as Type C on Table 4
37 Impacts on Dredging and Transportation
The presence of PCBs and heavy metals in sediments raises concern about the release of these materials into the environment and their effects on public health and environmental quality However under most conditions PCBs and heavy metals are only slightly soluble in water easily adsorbed from aqueous solushytions and strongly held in place by fine-grained sediments Therefore the mobility of these contaminants when sediments are moved will depend greatly upon the amount of resuspension of the contaminated sediments during -dredging and transportation which in turn will vary with the dredging and transportation techshyniques employed
All types of dredging cause agitation and some resuspenshysion of sediments The increased suspended load in nearby waters can create a threat to water quality because of the presence of heavy metals and PCBs Resuspended PCBs tend to concentrate in organic materials such as wood chips and oils and form a scum on the waters surface Because the harbor sediments contain such materials PCBs will be released into the water column during the dredging process The magnitude of this release will depend upon the amount of sediment disturbance and resuspension that takes place Dredging and transportation techniques must be selected to minimize resuspension of contaminated sediments thereby minimizing environmental impacts
Table 5 identifies the normally approvable techniques for dredging filling placing and disposing of dredged materials of various classifications From Table 5 we see that for Category Three Type C material the normally approvable methods of dredging are hydraulic and mechanical Normally approvabledisposal methods include pipeline andor barge sidecast disposalwill not normally be approvable
The relative merits of these and other less common dredging and transportation techniques are discussed in Chapters 4 and 5
-12shy
4 DREDGING
The types of dredges in use today can be divided into three categories mechanical hydraulic and pneumatic Descriptions of these three types are presented below with discussions about their applicability to the cleanup of the New Bedford Harbor
When assessing the various methods it is important to understand that dredging contaminated sediments is a specialized form of dredging The objective is to completely remove a speshycified layer of material while minimizing resuspension of material into the water column It is also desirable to minimize the quantity of material to be transported and handled at the disposal site
41 Mechanical Dredges
Mechanical dredges include the dipper clamshell chain bucket and dragline dredges (Figs 3 and 4) The common feature of mechanical dredges is that they dig into and scoop up the sediment Mechanical dredges are typically barge-mounted and use a derrick and system of cables for maneuvering the scoop The dredged material is lifted above the waterline and is generally deposited into a hopper barge
The primary advantage of dredging sediments by mechanical methods is the relatively small disturbance to the dredged material caused by the dredging ie the sediments are not thoroughly stirred up and mixed with free water This reduces the total amount of material to be handled and transported Mechanical dredging also reduces the amount of contaminated water to be treated and reduces or possibly eliminates the need for an intermediate settling basin before final disposal
However conventional mechanical dredges have several major disadvantages which generally preclude their use for conshytaminated sediment removal The scoops or buckets are open at the top and leak at the bottom so that there is generally a significant amount of spillage and resuspension of contaminated sediment as the dredge material is lifted up through the water column Also it is difficult to control the location and depth of penetration of the scoop bucket when it is operated by cables This results in uneven removal of the contaminated sediment layer
There have been recent attempts to modify the mechanical dredging system to overcome these disadvantages For example
-13shy
Mitsubishi Steel Mfg Co Ltd has developed a closed-type clamshell bucket designed specifically for contaminated sediment removal (Fig 5) It uses hard rubber seals along the shell edges to prevent leakage and according to a company brochure has a cover (presumably to minimize spillage) and a built-in mechanism to prevent overdredging It is not known whether the specialized clamshell has been used in an application similar to the proposed New Bedford Harbor cleanup
42 Hydraulic Dredges
Hydraulic dredging is performed by disturbing the dredge material with an auger or cutterhead mixing it with water to form a slurry and pumping the slurry to a disposal or transfer site Often mudshields or dustpans are mounted at the intake to reduce the amount of turbidity Hydraulic dredges are usually barge-mounted Passes are made by either swinging the intake in a series of arcs or by advancing the barge in a straight line Common types of hydraulic dredges include cutterhead plain sucshytion dustpan sidecaster hopper and Mudcat (Figs 6 and 7)
Hydraulic dredging is generally the least expensive form of dredging and if controlled can yield relatively low turshybidity in the water column Hydraulic dredging also affords greater control over the location and depth of cut particularly for the straight pass setups as compared to the mechanical dredge
The major disadvantage of hydraulic dredging is the requirement to mix approximately four parts water to one part sediment to form a pumpable slurry This results in a large quantity of contaminated water-soil mixture to be transported and contained Elutriate tests conducted for this study show that excess water will contain large amounts of PCBs adsorbed to parshyticles in suspension Therefore intermediate settling basins and the use of flocculents and water filtration equipment will likely be required to render excess water acceptable for discharge back to the environment
The ability to effectively separate the contaminated sedishyment from the excess water has been demonstrated in the Duwamish Waterway cleanup which is discussed in Section 7 A case history which involves the proposed use of a dustpan hydraulic dredge is also discussed in Section 7 under the section James River Virginia
43 Pneumatic Dredges
Pneumatic dredges use unbalanced hydrostatic head to draw sediment and some water into a submerged containment chamber
-14shy
Compressed air is then used to discharge the sediment into a pipeline to the surface With this method the sediment has conshysiderably less water mixed with it than with hydraulic methods The pneumatic dredge may be suspended from a barge or as discussed in a case study below mounted on a submerged tractor Two commercially available pneumatic dredges are the Amtec Pneumatic Pump dredge originally developed in Italy (Fig 8) and the Oozer Pump dredge developed in Japan (Fig 9)
In addition to the lower quantity of water used in the slurry pneumatic dredges produce relatively low turbidity in the water column Pneumatic dredges also afford good control over the location and depth of cut
The major disadvantages of the pneumatic dredge may be cost and availability Due to the limited experience with pneumatic dredging in this country another disadvantage may be the requirement to provide special training for the work crews at the site
A well-documented cleanup of PCBs using a pneumatic dredge occurred in 1976 in the Duwamish Waterway in Seattle Harbor A second cleanup using pneumatic methods is currently underway in California Both of these case histories are discussed in Section 7 For more details on the various mechanishycal hydraulic and pneumatic dredges available refer to Malcolm Pirnie 1978
44 Silt Curtains
Under certain conditions silt curtains can be used around dredging and disposal operations to contain turbid water Silt curtains are impervious vertical barriers that extend from the water surface to about 1 ft above the sediment level The curshytains typically consist of a flexible nylon-reinforced vinyl fabric that is suspended from a system of floats at the water surface The bottom edge of the curtain is held down by weights
Experience with several installations (JBF Scientific 1976) has shown that when the water current is less than 05 knots the turbidity in the water column outside the curtain can be up to 90 less than the turbidity inside the curtain Silt curtains can be used in currents up to 10 knot however they become much less effective While tidal currents are reported to be as high as 122 cmsec (24 knots) through the harbor entrance (Summerhayes 1977) the use of silt curtains could be considered in those areas of the New Bedford Harbor having current speeds less than 10 knot These areas would have to be determined by an additional investigation
-15shy
5 TRANSPORTATION OF DREDGED MATERIAL
Once dredged the contaminated sediment must be transported safely and efficiently Due to the high cost of long distance transport disposal sites which are located more than a few miles away will require the construction of nearby intershymediate rehandling sites The intermediate sites will be used for separating and treating supernatant water and consolidating the solids Several nodes of transport are discussed below
51 Floating Slurry Pipeline
If hydraulic or pneumatic dredging is used the primary transport mode will be via a floating slurry pipeline Booster pumps may be required along the pipeline to help move the material
When crossing a channel it will be necessary for the pipeline to be depressed to avoid interference with boat traffic Methods for the immediate detection of leaks will need to be developed and the equipment necessary for repairs will need to be readily available Joints between sections of pipe will need to be securely tightened and leak tested The pipeline will need to be anchored securely to prevent excessive deflection caused by wind and currents Also the pipeline will need tobe strong enough to withstand moderate storm conditions During large storms it will be necessary to shut down operations
52 Barge
Barges will be used in conjunction with mechanical dredging to transport material from the dredge to the intershymediate rehandling site or to the final disposal site if it is located near the coast Barges may also be used for transporting between the rehandling site and the final disposal site Barges are not normally used to receive material from hydraulic dredges due to the large quantities of dredged slurry to be handled
Barges can be loaded and unloaded either mechanically as with a crane and clamshell or by hydraulic pumping During loading and unloading care must be taken to avoid spillage over the sides of the barge The holding compartments on each barge must be watertight and covered Bottom dump barges are not suitable for transporting contaminated sediment
53 Truck or Rail
If the final disposal site is located inland trucks or rail cars can be used The trucks will be either tank trucks or
-16shy
large dump trucks rail cars may be either tank cars or hopper cars All trucks or rail cars roust be watertight and covered Frequent checks for leaks on the gates or valves will be required
Hopper cars or dump trucks will be loaded and unloaded mechanically tankers will be loaded and unloaded hydraulically The ability to pump the waste after rehandling will thus affect the selection of tank cars Provisions to clean the exterior of each truck or rail car of any spilled sediment or water before leaving the rehandling or disposal site will be required
-17shy
6 DISPOSAL OPTIONS
euro1 General
Three alternate disposal methods are specified by the EPA for material containing PCBs in concentrations of 50 parts per million to 500 parts per million such as exist in New Bedford-Fairhaven Harbor These methods are incineration disposal in an approved chemical landfill and use of some other disposal method which is approved by the EPA Regional Administrator for the region in which the PCBs are located For other disposal methods applications to the Regional Administrator must indicate that disposal by incineration or cheshymical landfill are not reasonable and that the alternate disposhysal method proposed will provide adequate protection to health and the environment
62 Incineration
Incineration of dredged material is technically and environmentally possible but prohibitively expensive In studies conducted by the New York State Department of Environmental Conservation concerning the cleanup of PCB-contaminated sedishyments it was found that fuel costs alone for the incineration of sediments would have been about $10 per yard TheU S EPAs consulting engineer on the PCB sediment cleanup project in Waukegan IL investigated several incineration technologies and reported that costs for incineration could be well in excess of $100 per cubic yard To remove 90 of the PCBcontamination in the inner harbor would require dredging about 4-12 million cubic yards Further it is believed that available technology would require extensive testing and development to meet EPA requireshyments and transport to a suitable incinerator would increase exposure of the environment to contaminants Incineration therefore is not likely to be a feasible alternative for disposhysal
63 Chemical Landfill
There are eight landfills in the United States which are aproved by the Environmental Protection Agency for disposal of PCB solids which includes dredge spoils There are none in New England The Commonwealth of Massachusetts is currently investishygating a hazardous waste landfill for Massachusetts The possishybility of locating a landfill site exclusively for this project independent of the statewide effort seems unlikely
The closest approved landfills to the New Bedford site are in New York State One is located in Niagara Falls and is
-18shy
operated by SECOS International Incj the other is in Model City and is operated by SCA Chemical Systems Inc Both are approxishymately 500 miles from the project site
The availability of disposal space is extremely limited For example the SECOS facility has currently opened for use a secure landfill cell which is only three acres in size Only a small portion of this area is set aside for PCB-contaminated materials The material disposed of in this facility is usually highly concentrated industrial wastes packed in metal drums for stacking and burial Because of the great demand for disposal sites and the extensive regulatory procedures involved disposal costs would be very high
64 Other Disposal Options
a Biodegradation
Biodegradation was considered as a disposal option for both the Hudson River and Waukegan IL PCB sediment cleanup programs It was found that the possibility of using naturally occurring micro-organisms to reclaim PCB-contaminated dredged spoils was an unproven technology and that sufficient information does not exist to properly assess the feasibility of biodegradashytion as a disposal alternative (U S EPA 1981 and HDPW 1980)
b Open Ocean
Open water disposal of dredged material is commonly practiced in all of the New England Coastal states However under Massachusetts regulations open ocean disposal of Type III-C dredged material is permitted only at low energy silty sites and this only after bioassay performed in accordance with established EPA procedures indicates no significant biological impact If a significant biological impact is found this material is unsuitable for open water disposal A bioassay conducted with sediments from the tidal flats area north of the Inner Harbor indicated a significant biological impact However these materials are the most highly contaminated and would likely be mixed with other less contaminated sediments for disposal As no bioassay data are as yet available for the bulk of the conshytaminated sediments the ocean disposal option should not be precluded
Given the compelling necessity to find a suitable disposal option and the scarcity of viable options and disposal sites ocean disposal may turn out to be a feasible disposal option Adverse environmental effects associated with ocean dumping can be minimized by capping with relatively unconshy
-19shy
taminated materials Further discussion of ocean disposal of contaminated material can be found in Refs 5 15 16 19 20 and 21
c Land or In-Harbor Disposal with Bulkheading
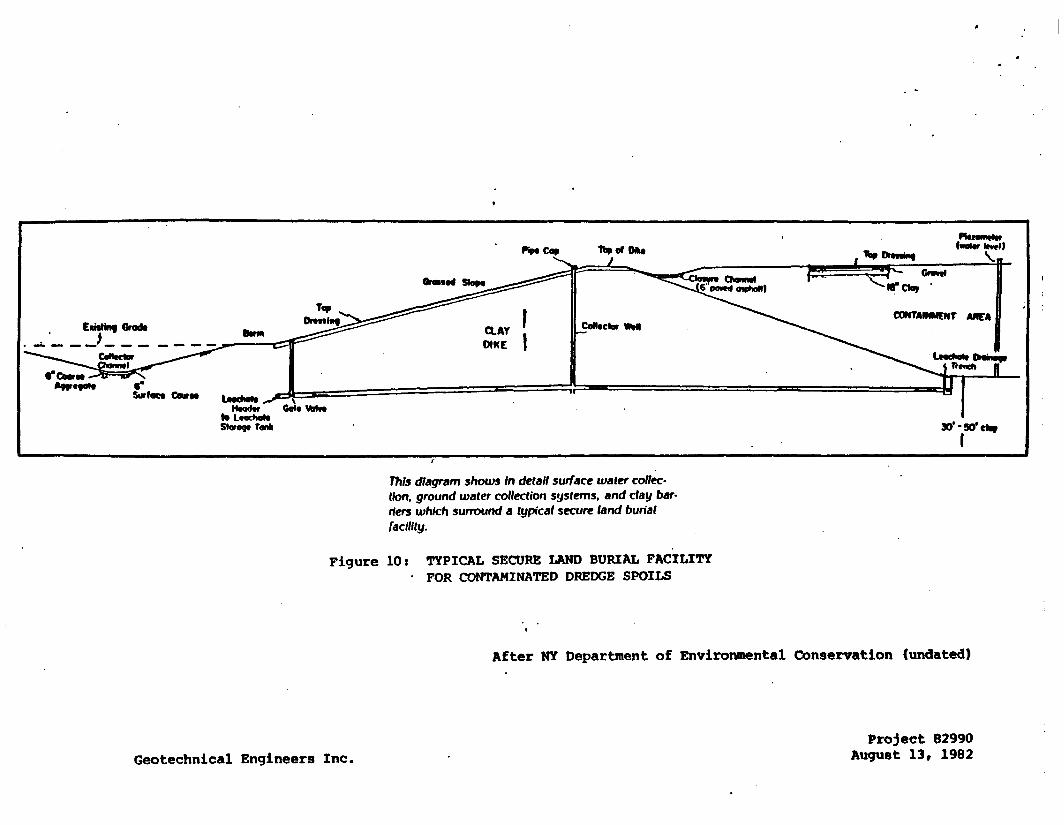
In Massachusetts disposal of Category Three Type C dredge spoils is generally restricted to land or in-harbor disposhysal with bulkheading Contaminated sediments could be contained in a specially engineered encapsulation or contained landfill in such a manner that it is permanently removed from the environshyment This was found to be the most practical method of disposal for the Hudson River cleanup program (Section 7) Major conshysiderations in the design of the Hudson River encapsulation included an impermeable clay dike subgrade and cover with a leachate underdrain collection and treatment system (Fig 10) The relatively impermeable clay materials provide a natural barrier to the migration of water and also provide an excellent barrier to PCS migration as PCBs are known to adhere strongly to fine-grained sediments The leachate underdrain system provides an excellent method of monitoring the performance of the system and of ensuring collection of any percolating contaminants
At the present time no hazardous waste disposal sites are licensed in the Commonwealth However technically upland disposal or temporary storage is a viable disposalalternative for the New Bedford Harbor dredging Preliminary examination of the geohydrologic characteristics of surficial soils indicate that relatively impermeable glacial tills occur along the harbor and extend inland for some distance These materials would likely provide sufficient liner materials for encapsulation due to a high percentage of fines which tend to hold PCBs and decrease permeability Using proper materials and employing design features such as impermeable liners and covers leachate collection and treatment systems settling ponds flocculants and water filtration systems it is likely that one or several effective permanent disposal or temporary storage facilities could be constructed in the New Bedford area
The major problem associated with upland disposal is the absence of a nearby undeveloped open land site large enough to contain the dredge spoils As shown on Table 1 to remove 50 of the PCB contaminated sediments from the inner harbor alone would require storage space for 400000 cubic yards of dredged materials This number would be significantly larger if hydraulic dredging were used as spoils would be mixed with about four parts water to one part sediment
Removal of 90 of the sediments from the inner harbor would require upland storage space for 3500000 cubic yards of
-20shy
dredged materials Again this number would be significantly higher for hydraulic dredge methods A disposal pile 20 ft high would cover at least 108 acres
No upland sites of this size are believed to be available adjacent to the harbor Transporting such large volushymes to sites just outside the harbor area may be cost prohibitive or environmentally unacceptable but should be considered in more detail In addition in-harbor disposal with bulkheading should be considered
-21shy
7 CASE HISTORIES IN CONTAMINATED SEDIMENTS
71 Upper Hudson River New York
Several studies have been recently made to evaluate the feasibility of dredging PCB-contarainated sediments along a 40 mile stretch of the Upper Hudson River (Refs 9 14 23 24 28 29 30 31) The sediments consist primarily of silty sand
For a full dredging effort the total volume of conshytaminated material to be removed is 14500000 cu yds The methods of dredging being considered include the hydraulic cutshyterhead dredge and the mechanical clamshell dredge Cost estimashytes for full dredging which is estimated to achieve 91 to 97 recovery of all PCBs from the study area range from $158 to 306 million (1978 costs) Partial dredging of hot spots (areas with PCS concentrations greater than 50 ppm) is estimated to cost $21 million at 1978 costs Partial dredging will result in the removal of about 36 of the PCBs in the study area with a total volume of dredged contaminated material estimated at one million cubic yards
Land disposal methods are being considered for the final disposal of the spoil Major considerations in the design of the Hudson River project include complete encapsulation with an impermeable clay dike subgrade and cover with a leachate drainage collection and treatment system (Fig 10) Forty potenshytial disposal sites with a total area of 3200 acres have been identified for a full dredging effort The land requirement for contaminated material from the hydraulic system is estimated to be 1120 acres The mechanical system has been estimated to require approximately 720 acres Return flow treatment processes similar to those used for the Duwamish Waterway project are being considered for the supernatant water (Section 73)
72 Waukegan Harbor Illinois
The sediments in Waukegan Harbor Lake Michigan contain some of the highest known concentrations of PCBs in the country with measured concentrations up to 250000 ppm (25) (US EPA 1981) The contaminated sediment area is about 37 acres
The sediments consist of a top soft muck layer an intermediate sand layer and an underlying silty clay layer The muck layer ranges in thickness from 0 to about 105 ft Most of the PCBs are contained in the muck layer and available data show that the contamination extends through the entire thickness of the layer The EPA estimates a total volume of 168000 cubic
-22shy
yards of sediment to be removed This includes all sediment with PCB concentrations greater than 10 ppro
The EPA has proposed that the harbor be dredged by either hydraulic or pneumatic methods Silt curtains would be used to isolate the dredging area The dredged spoils will be transported via pipeline to temporary settling lagoons where it would be dewatered Excess water will be treated to remove resishydual PCBs and returned to the harbor containing PCB conshycentration less than Ippb The dewatered sediments will be removed to a permanent storage facility
Lagoon construction will be similar to that of a secure landfill with impermeable clay liners and leachate collection systems A 6-in-thick layer of sand is being considered for placement above the clay liner to facilitate dewatering of the sediments
Water treatment will consist of (1) settling of the sedishyments in the lagoon (2) allowing excess water to overflow a weir placed at one end of the lagoon into a smaller sedimentation basin where a polymer will be added to coagulate and settle fines (3) pumping the sedimentation basin water through pressure filters and (4) conveying filter effluent through carbon filters to a clear well The water in the clear well will be monitored for PCB content before it is returned to the harbor A 1 ppb limitation of PCB concentration for water returned to the harbor will be maintained
Ultimate disposal plans include a below-ground option with a 5- to 10-ft-thick recompacted clay liner a leachate collection system and treatment system and a 3-ft-thick clay cap surfaced with bituminous pavement or concrete for use as a parking lot The entire facility would be surrounded by a 2-12-ft-thick concrete slurry wall to permit dewatering of the site during excavation (30 ft below ground surface) and to act as an addishytional barrier to contaminant migration
An alternative secure storage facility considered for the Waukegan project included construction of secure lagoons to a height of about 35 ft above ground with similar liners caps and leachate collection systems This above-ground option wouldminimize leaching over time minimize site disruption and material handling and eliminate the need for a slurry wall Disadvantasges of this approach are its relative unsightliness the need for permanent dedication of property to this use only and a long-term maintenance requirement
The estimated cost for the proposed dredging operation including dewatering water treatment loading onto trucks and
-23shy
site restoration is about $10 million Disposal costs would add $6 to $33 million to this amount (1981 costs)
73 Duwaroish Waterway Seattle Harbor Washington
A Pneuma Model 600 pneumatic dredge mounted on a pivoting spud barge was used in 1976 to remove 80-90 of an estimated 27000 cu yd of PCB-contaminated sediment in the Duwamish Waterway in Seattle Harbor The contamination occurred at the end of a pier when a transformer containing PCB was dropped during barge loading The overall area requiring dredging was about 350000 sq ft (8 acres) The depth of dredging was about 2 ft over most of the contaminated area with depths up to 10 ft at the point of spill The complete operation lasted slightly less than two months
Turbidity was monitored downstream during the dredging operation by the University of Washington Department of Oceanography Their final report indicated that the dredging cleanup caused no significant dispersion of PCB into the Duwamish Harbor and estuary
The Pneuma Model 600 was supplied by Amtec Development Company of Chicago Illinois The dredge along with 2000 ft of 10-in ID discharge pipe was transported from Chicago to Seattle by truck The dredge was mounted onto a small boat which was attached perpendicularly to a 120-ft-long pivoting spud barge This enabled the dredge to swing in a large arc during each dredge cut The propellers of the small boat were used to maneuver the dredge back and forth The width of the intake on the pneumatic dredge was 10 ft
The contaminated slurry was mixed with a flocculant (Nalco 17134) and discharged into specially prepared disposal pitslocated approximately one half mile south of the spill The flocculant decreased the settling time of the solids After the solids were settled the supernatant water was run through a Pilterite 1264 MSO filter and an activated charcoal filter It was then discharged back into the Duwamish River Testing by the EPA indicated that general PCB concentration in the sludge was 8-10 ppm The concentration in the supernatant water was 4 partsbillion prior to filtering and 50 partstrillion after filtering
74 California Aqueduct
A large pneumatic dredging operation by the State of California Department of Water Resources is presently underway to remove asbestos-contaminated sediment from the California
-24shy
Aqueduct (Ref 12) The dredged length of the aqueduct is approximately 150 miles The width is approximately 100 ft The volume of material to be dredged is about one million cubic yards
A pneumatic dredge mounted on a remote-controlled undershywater tractor is being used for the dredging Production is presently about 290 cu ydhr with an on-line time of about 20 hrday The dredged material is transported via B-l2-in-ID PVC pipe into disposal pits which have been excavated alongside the aqueduct The free water content of the slurry is about 40 to 55 Turbidity caused by the dredging as measured at monishytoring stations up- and downstream from the dredge has been minimal For this type of contaminant treatment of the water and dredged spoils was deemed unnecessary The water is allowed to percolate through the disposal pits and the pits are covered with fill and planted
The depth of water is about 28 ft The tractor is remote-controlled by a cable which extends from the tractor to ground surface The location of the tractor is monitored by sonar Sensors are mounted near the intake structure of the pneumatic pump to monitor the depth of cut during each pass
Overall operating costs are currently (1982) running about $8 to $10cu yd Since this includes the initial-development costs this figure is expected to come down to about $4 to $5cu yd If a dredging system similar to this is considered for the New Bedford Harbor the added cost of more complex disposal methods must be considered
75 James River Virginia
A study is currently underway by the Norfolk District Corps of Engineers to compare the dredging performance of two types of hydraulic dredges for the removal of sediments in the James River Virginia (Refs 8 34) The sediments have been contaminated with the toxic pesticide Kepone The two dredges to be compared for efficiency are the dustpan and the cutterhead hydraulic dredges The dustpan dredge will be a cutterhead dredge that has been equipped with a 28-ft-wide dustpan and modified for straight line dredging The cutterhead dredge will be a conventional unit using a rotating cutter and making swing arc cuts rather than straight line swaths Both dredges will be maneuvered with a system of cables and winches
A preliminary ACE report by Vann (undated) identifies several advantages of the dustpan dredge Among them are straight line method of dredging constant width of cut constant
-25shy
dredging speed at constant winch speed accurate control of dredging depth maximum containment of material and reduced turshybidity The disadvantages of the dustpan noted in the report were dredging accuracy is difficult to control in soft materials tidal fluctuations necessitate the use of stern anchors and water jets used to break up sediment at the intake cannot be used since the material to be dredged (in the James River) is too soft with a water content of approximately 200 percent
The final results of this comparison have not been published to date
76 Contacts For Case Studies
The following individuals provided much of the information contained in this report regarding the case studies discussed in this section Their assistance is gratefully acknowledged
1 Upper Hudson River New York
James DeZolt State of New York Engineer NYSDEC Room 321 50 Wolf Road Albany NY 12233 518-457-5850
Dr T J Tofflemire New York Dept of Environmental Conservation Bureau of Water Research 50 Wolf Road Albany NY 12233 518-457-7470
Judy Bedard Malcolm Pirnie Inc 2 Corporate Park Drive Box 751 White Plains NY 10602 914-694-2100
-26shy
2 Waukegan Harbor I11inois
Tony Rutter USEPA Region 5 Remedial Response Branch 111 H Jackson Blvd Chicago IL 60604 312-886-6216
Greg Vanderlaan USEPA Region 5 111 W Jackson Blvd Chicago IL 60604 312-886-6217
3 Duwamish Waterway Washington
Joseph BlazevichUSEPA Region 10 1200 6th Avenue Seattle WA 98101 206-442-5840
Dr Spyros Pavlou JRB Associates 13400-B Northup Way Suite 38 Bellevue WA 98005 206-747-7899
Leonard A Juhnke U S Army Corps of Engineers P O Box C-3755 Seattle WA 98124 206-764-3400
4 California Aguaduct
Clifford Lucas State of California Dept of Water Resources P O Box 388 Sacramento CA 95802 916-445-2222
David Harris AMTEC Development Company1550 Berkeley RoadHighland Park IL 60035 312-831-9410
-27shy
James River Virginia
Richard Klein U S ACE Dredging Management Branch 803 Front Street Norfolk VA 23510 804-441-3616
Roger Pruhs U S ACE Dredging Management Branch 803 Front Street Norfolk VA 23510 804-441-3130
-28shy
8 CONCLUSIONS
In this report we have focused on the technical issues associated with dredging the PCB-contaminated sediments of the New Bedford Harbor area We have not addressed the many politishycal issues affecting the cleanup project
Technically environmentally safe methods are available for dredging transporting and disposing of the PCB-contaminated harbor sediments Each of the three general dredging types could be used in an environmentally safe manner with the pneumatic and hydraulic dredge methods providing the least chance for resuspenshysion of sediments Watertight mechanical (clamshell) methods may also be environmentally safe when used in conjunction with silt curtains Transportation methods will depend upon the dredging method used as discussed in Chapter 5
Of the disposal options land disposal in a properly engishyneered clay encapsulated excavation or pile with leachate collecshytion and treatment systems will provide adequate environmental isolation of contaminated sediments However no hazardous waste landfills are licensed in the Commonwealth at the present time Contaminated sediments could also be dumped in the ocean and covered with uncontaminated sediments While this option does not provide the same level of containment as an encapsulated landfill and would involve resuspension of some contaminated materials it has the advantage of removing the materials from the densely populated New Bedford area to a more remote environshyment
Although technical solutions are available it is impossible to recommend a specific dredging transportation and disposal option until a disposal site is identified This is because dredging and transportation techniques are directly tied to each other and to the ultimate disposal site
Further input from the public and the many federal state and local regulators will be required to select a disposhysal site or sites before meaningful recommendations regarding dredging and transportation techniques can be made Cost benefit analysis between several disposal site alternatives and associated dredging and transportation techniques should then be performed
-29shy
9 REFERENCES
1 Acushnet River Estuary PCB Coimaissionr Minutes of Meeting June 29 1982 IDC Conference Office New Bedford MA
2 Amtec Development Co Model 36 Pneumatic Pump brochure 1981
3 Blazevich J K et al Monitoring of Trace Constituents During PCB Recovery Dredging Operations-Duwamish Waterway U S EPA Region X Surveillance and Analysis Division Laboratory Branch August 1977
4 Brown M P PCB Desorption from River Sediments Suspended During Dredging - An Analytical Framework NY Dept of Environmental Conservation April 1981
5 Gambrell R PI Khalid R Ai and Patrick W H Jr Disposal Alternatives for Contaminated Dredged Material As a Management Tool to Minimize Adverse Environmental Effects Louisiana State University Center for Wetland Resources for U S Army Engineers Waterways Experiment Station Technical Report DS-78-8 December 1978
6 Griffin R A and Chian E S K Attenuation of Water-Soluble Polychlorinated Biphenyls by Earth Materials Illinois State Geological Survey Division Urbana Illinois Environmental Geology Notes Number 86 October 1979
7 Hafferty A J Pavlou S P and Bom W Release of Polychlorinated Biphenyls (PCB) in a Salt-Wedge Estuary as Induced by Dredging of Contaminated Sediments The Science of the Total Environmental 8 pp 229-239 Elsevier Scientific Publishing Company Amsterdam The Netherlands 1977
8 Bailer D L Demonstration of Advanced Dredging Technology-Dredging Contaminated Material Kepone James River Virginia Norfolk District U S Army Corps of Engineers undated
9 Betling Lj Horn Ej and Tofflemire J Summary of Hudson River PCB Study Results New York State Dept of Environmental Conservation Technical Paper 151 April 1978 revised July 1978
10 Johanson E E Bowen S Pj and Henry Gj State-of-the-Art Survey and Evaluation of Open-Water Dredged Material
-30shy
Placement Methodology JBF Scientific Corporation for U S Army Engineer Waterway Experiment Station Environmental Effects Laboratory Contract Report D-76-3 April 1976
11 Jones R A and Lee G P Evaluation of the Elutriate Test as a Method of Predicting Contaminant Release During Open-Water Disposal of Dredged Sediments and Environmental Impact of Open-Water Dredged Material Disposal Dept of Environmental Chemistry University of Texas at Dallas for U S Army Waterways Experiment Station August 1978
12 Lucas Clifford - Chief of Civil Maintenance for the State Water Project California Dept of Water Resources Sacremento CA telephone conversation with Roger Brewer Engineer Geotechnical Engineers Inc July 14 1982
13 The Mahoosuc Corporation and Arthur Lerman Associates A Dredge Management Study for the State of Maine - Volume I shyProject Report prepared for Maine Dept of Environmental Protection Augusta Maine May 1982
14 Malcolm Pirnie Inc Dredging of PCB-Contaminated River Bed Materials Upper Hudson River New York N Y State Dept of Environmental Conservation Vols I-III January 1978
bull
15 Malcolm Pirnie Inc Draft Report The Commonwealth of Massachusetts Acushnet River Estuary PCB Study Mass Division of Water Pollution Control Boston MA June 1981
16 Massachusetts Dept of Public Works Environmental Assessment-Replacement of the New Bedford-Fairhaven Bridge New Bedford Massachusetts U S Dept of Transportation and Federal Highway Administration undated (est 1980)
17 Massachusetts Division of Water Pollution Control Regulations for Water Quality Certification for Dredging Dredged Material Disposal and Filling in Waters of the Commonwealth adopted August 28 1978
18 Mitsubishi Steel Mfg Co Ltd Mitsubishi Grab Buckets brochure with cover letter dated December 3 1981
19 New England River Basins Commission Interim Plan for the Disposal of Dredged Material From Long Island Sound August 1980
20 New England River Basins Commission Dredging Management Data and Analysis for the New EnglandLong Island Sound
-31shy^
Regionr Dredging Management Program - Long Range Dredging Study September 1981
21 New England River Basins Commission Narrangansett Bay Case Study Technical and Institutional Constraints to Land and Nearshore Disposal of Dredged Material from Narrangansett Bay Dredging Management Program September 1981
22 New Englcnd River Basins Commission The Dredging Dilemna System Problems and Management Solutions co New England Governors Conference September 1981
23 New York Dept of Environmental Conservation Hudson River PCB Study Description and Detailed Work Plan -Implementation of PCB Settlement Technical Paper No 58 Revised January 1979
24 New York Dept of Environmental Conservation The Hudson River PCB Reclamation Project - An Update undated
25 Pavlou S P and Horn W PCB Removal from the Duwamish River Estuary Implications to the Management Alternative for the Hudson River PCB Cleanup in Annals of the New York Academy of Sciences Vol 320 pp 651-671 1979
26 Pavlou S P et al Release Distribution and Impacts of Polychlorinated Biphenyls (PCB) Induced by Dredged Material Disposal Activities at a Deepwater Estuarine Site Environment International Vol 7 1982
27 Summerhayes C P et al Fine-Grained Sediment and Industrial Waste Distribution and Dispersal in New Bedford Harbor and Western Buzzards Bay Massachusetts Technical Report for the Dept of Commerce National Oceanic and Atmospheric Administration Office of Sea Grant unpublished manuscript April 1977
28 Tofflemire T J Results of the 1978 Barge Sampling in the Hudson River N Y Dept of Environmental Conservation Technical Paper No 60 December 1980
29 Tofflemire T J Hetling L J and Quinn S 0 PCB in the Upper Hudson River Sediment Distributions Water Interactions and Dredging New York State Dept of Environmental Conservation Technical Paper No 55 January 1979
30 Tofflemire T J and Quinn S 0 PCB in the Upper Hudson River Mapping and Sediment Relationships New York State
-32shy
Dept of Environmental Conservation Technical Paper Ho 56 April 1979
31 Tofflemire T Jj Quinn S Oj and Carcich I Gj bullSediment and Water Sampling and Analysis for Toxics Relative to PCS in the Hudson Riverr New York Dept of Environmental Conservation Technical Paper Mo 64 September 1980
32 U S Army Corps of Engineers PCB Cleanup Operations -Duwamish Waterway - Seattle Harbor Washington undated
33 U S EPA The PCB Contamination Problems in Waukegan Illinois Region V Chicago Illinois January 21 1981
34 Vann R G James River Virginia Dredging Demonstration in Contaminated Material (Kepone) Dustpan versus Cutterhead Norfolk District U S Army Corps of Engineers undated
35 Weaver Grant PCB Pollution in the New Bedford Massachusetts Area A Status Report Massachusetts Coastal Zone Management June 1982
i
TABLE 1 - ESTIMATED CONTAMINATED VOLUMES AND PCB RECOVERY NEW BEDFORD HARBOR MASSACHUSETTS
Typical PCB Concentration in Dredged Area
ppm
gt30
gt20
gt10
gt 1
45
30
15
Cumulative Volume of Dredged Material
cu yds
HARBOR AREA (Zones A and B)
400000
500000
1000000
4500000
OUTER HARBOR AREA (Zone C)
900000
1200000
1500000
Percent of Total PCB Removed Zones Zone A and B C
50
55
70
90
65
75
90
2ones identified on Fig 1
After Malcolm Pirnie 1981 (Note Subsequently collected data may alter these original estimates by Malcolm Pirnie)
Project 82990 Geotechnical Engineers Inc August 12 1982
Table 2 (CONTI
Grain size (wt )
BRCO ID IC-82shy Sample Description Gravel Sand Silt Clay
Water Content ()
Oil and Grease (wtlaquo) Classification0
2178 2179
Station 9 -0-10 CM Station 9 shy 38-48 CM
0 624
1170 2602
6449 4816
2381 1958
692 593
65111
3c
2180 2181
Station 11 shyStation 11 shy
0-10 CM 26-36 CM
0 0
3152 3112
5099 3800
1749 3088
556 549
168023
3c
2182 2183
Station 16 shyStation 16 shy
0-10 CM 33-43 CM
189 0
5230 173
3136 7282
1445 2545
350 420
00610005
3c
2184 2185
Station 21 shyStation 21 shy
0-10 CM 29-39 CM
0 423
1176 5475
6939 4629
18185 2773
520 558
141003
3c
2186 2187
Station 27 shyStation 27 shy
0-10 CM 34-44 CM
0 0
5212 1066
3045 5963
1743 2971
547 569
297002
3c
2188 2189
Station 29 shyStation 29 shy
0-10 CM 84r94 CM
163 0
1576 204
5393 7043
2868 2753
667 463
183001
3c
2190 2191
Station 31 shyStation 31 shy
0-10 CM 21-31 CM
152 117
946 3606
4515 4423
4387 1851
669 582
347124
3c
Concentration Ranges for Classification by Physical Characteristics0
Type ft
Type B
Type C
mdash ~
mdash
mdash
mdash -
- shy lt60ltlaquo
- shy 60-90lt)
gt90laquoi
- shy
- shy
lt40
40-600
gt60
ltOS
05-10
gt10
TABLE 3 - CLASSIFICATION OF DREDGE OR FILL MATERIAL BY CHEMICAL CONSTITUENTS NEW BEDFORD HARBOR MASSACHUSETTS
All Units Are In Parts Per Million
Category One Category Two Category Three
Arsenic (As) 10 10-20 20 Cadmium (Cd) 5 5-10 10 Chromium (Cr) 100 100-300 300 Copper (Cu) 200 200-400 400 Lead (Pb) 100 100-200 200 Mercury (Hg) lt 05 05-15 15 Nickel (Ki) lt 50 50-100 100 Polychlorinated Biphenyls (PCS) lt 05 05-10 gt 10 Vanadium (V) lt 75 75-125 gt 125 Zinc (Zn) lt 200 200-400 gt 400
Category One materials are those which contain no chemicals listed in Table 1 in concentrations exceeding those listed in the first column
Category Two materials are those which contain any one or more of the chemicals listed in Table 1 in the concentration range shown in the second column
Category Three materials are those materials which contain any chemical listed in Table 1 in a concentration greater than shown in the third column
After Massachusetts Division of Water Pollution Control 1978
Project 82990 Geotechnical Engineers Inc August 12 1982
TABLE 4 - CLASSIFICATION OF DREDGE OR FILL MATERIAL BY PHYSICAL CHARACTERISTICS NEW BEDFORD HARBOR MASSACHUSETTS
Type A Type B Type C
Percent silt-clay lt 60 60-90 gt 90 Percent water lt 40 40-60 gt 60 Percent volawtile solids
(MED method) lt 5 5-10 gt 10 Percent oil and grease (hexane extract) lt05 05-10 gt10
Type A materials are those materials which contain no substances listed in Table 2 exceeding the amounts indicated in the first column
Type B materials are those materials which contain any one or more of the substances listed in Table 2 in the concentration range shown in the second column
Type C materials are those materials which contain any substance listed in Table 2 in a concentration greater than shown in the third column
When the Division has reason to suspect that biological contaminants are present (for example because of the physical parameters) additional testing may be required
After Massachusetts Division of Water Pollution Control 1978
Project 82990 Geotechnical Engineers Inc August 12 1982
TABLE 5 - NORMALLY IMPROVABLE DREDGING HANDLING AND DISPOSAL OPTIONS NEW BEDFORD HARBOR MASSACHUSETTS
CHEMICAL TYPE (TABLE 2) Category One Category Two Category Three
PHYSICAL TYPE (TABLE 3) A B C A B C A B C
Dredging Methods
Hydraulic Mechanical
X X
X X
X X
X X
X X
X X
X X
X X
X X
Disposal Methods
Hydraulic Sidecast Hydraulic Pipeline Mechanical Sidecast Mechanical Barge
Placement
Land or in-harbor disshyposal with bulkheading (a) (a) (a) (a) (a) (a) (a) (a)
Open ocean disposal at high energy sandy sites
Open ocean disposal at low energy silty sites O X (b) O (b) (b) (b) (b) (b)
Onconfined in-harbor X O O O 0 O O O O
Beach Replenishment X O O O O O O O O
Other Conditions
Timing and Placement to Avoid Fisheries Impacts (spawning and running periods and areas) (c) (c) (c) (c) (c) (c) (c) (c) (c)
Legend X Normally approvable O laquo Not normally approvable
(a) laquo Normally approvable but control of effluent will be required (b) - Approvable only after bioassay performed in accordance with
established EPA procedures indicates no significant bioshylogical iJi$gtact A statistically comparable project which has successfully passed the bioassay test may be substituted If a tignificant biological impact is found this material is unsuitable for open water disposal
(c) laquo Required in all cases
After Massachusetts Division of Water Pollution Control 1978
0XOX
OXOX
0XOX
0XOX
OXOX
0X0 X
OXOX
XXX
X
XXXX
Project 82990 Geotechnical engineers Inc August 12 1982
1I bull
Inner Harbor Zones A and B
Outer Harbor Zone C
POPES ISLAND
NtW bullCDFORO
PAiMEl ISLAND
NUIIICANC IAMIEI
IWAGE TtEATMtNT PUNT OUTFAUS
5
0 W
Figure 1 LOCATION OF STUDY AREA
After Malcolm Pirnie 1981 Project 82990
Geotechnical Engineers Inc August 13 1982
bull too too JOQ too MO VMrV1 4laquod SCALE IN FEET
bull bull TyenraquoO additional ampin I I taktn 300 down ctrMm
Ii laquo-iv laquo
- VVVR- r ^shy
ll -
shy -bull
Figure 2 Location of sampling stations in Acushnet River Stations denoted as bull were occupied by US Coast Guard in April 1982 Stations denoted as 0 were reoccupied by ERCO on July 13 1982 Project 82990 Gcotechnical Engineers Inc August 12 1982
DIPPER DREDGE
CLAMSHELL DREDGE Figure 3 MECHANICAL DREDGES
After Malcolm Pirnie 1978
Geotechnical Engineers Inc
Project 82990 August 13 1982
BUCKET DREDGE
DRAGLINE DREDGE
Figure 4 MECHANICAL DREDGES
After Malcolm Pirnie 1978
Project 82990 Geotechnical Engineers Inc August 13 1982
LINK TYPE LATERAL DREDGING TTPE
MITSUBISHI CLOSED GRAB BUCKET
TWO-PLANE CONTACT METHOD HARD RUBBER METHOD
LIP SEALING METHODS
Figure 5 WATERTIGHT GRAB BUCKET
After Malcolm Pimie 1978 SOURCE M I T S U B I S H I SEIKO CO LTD
Project 82990 Geotechnical Engineers Inc August 13 1982
Oiscnarge Lint Ladder
Spud (Typ) Cutterneaa
CUTTERHEAD SUCTION DREDGE
Anchor Caole Oiscnarge (Tjp) L i n e
Suc t ion Line
PLAIN SUCTION DREDGE
Figure 6 HYDRAULIC DREDGES
After Malcolm Pirnie 1978 Project 82990
August 13 1982 Geotechnical Engineers Inc
Ancnor Cades Discharge (Typ) Line
Dustpan
DUSTPAN DREDGE
Hoppers
Trailing Suction Urn
HOPPER DREDGE
Figure 7 HYDRAULIC DREDGES
After Malcolm Pimie 1978
Project 82990 Geotechnical Engineers Inc August 13 1982
Intake Discharge A a three way valve functions to
create a vacuum in one of the A at its turn the three way valve is
given a command to introduce chambers pressurized air into the chamber
A when ready the inlet valve opens slurry enters Induced either by
A this pressurized air forces the sHjrry down then up and through the
hydrostatic head pressure or wye discharge pipe vacuum
A as the slurry reaches a certain A from the wye discharge the
slurry is conveyed through a level the electronic sensoring pipeline to a disposal area device issues a command to the electronic controller for the three way valve to dose
Figure B PNEUMATIC PUMP
After Aintec 1981
Project 82990 Geotechnical Engineers Inc August 13 1982
Spud
THE TAIAN MARU lin|th 37laquo (1214 ft ) bullIdth I2i (394 ft )
Otpth 3gt (91 ft ) Orraquoft 22s (72 ft )
III I Vitvt bullt Olichirii Studn
mdashOil lraquoiry if Riliisi bull( Air and
Ciipritiid A i r
trillion if VICUUB
SUCTION DISCHARGE
Figure 9 QOZER PUMP OPERATION bdquo ^ After Malcolm Pirnie 1978 Geotechnical Engineers Inc August 13 1982
SOURCE WO CONSTRUCTION CO
Cifatinf Grodt
Contctar
lo Ltochofv Staroqt Tonh
This diagram shows in detail surface water collecshytion ground water collection systems and clay barshyriers which surround a typical secure land buna facility
Figure 10 TYPICAL SECURE LAND BURIAL FACILITY bull FOR CONTAMINATED DREDGE SPOILS
After NY Department of Environmental Conservation (undated)
Project 82990 August 13 1982 Geotechnical Engineers Inc
APPENDIX
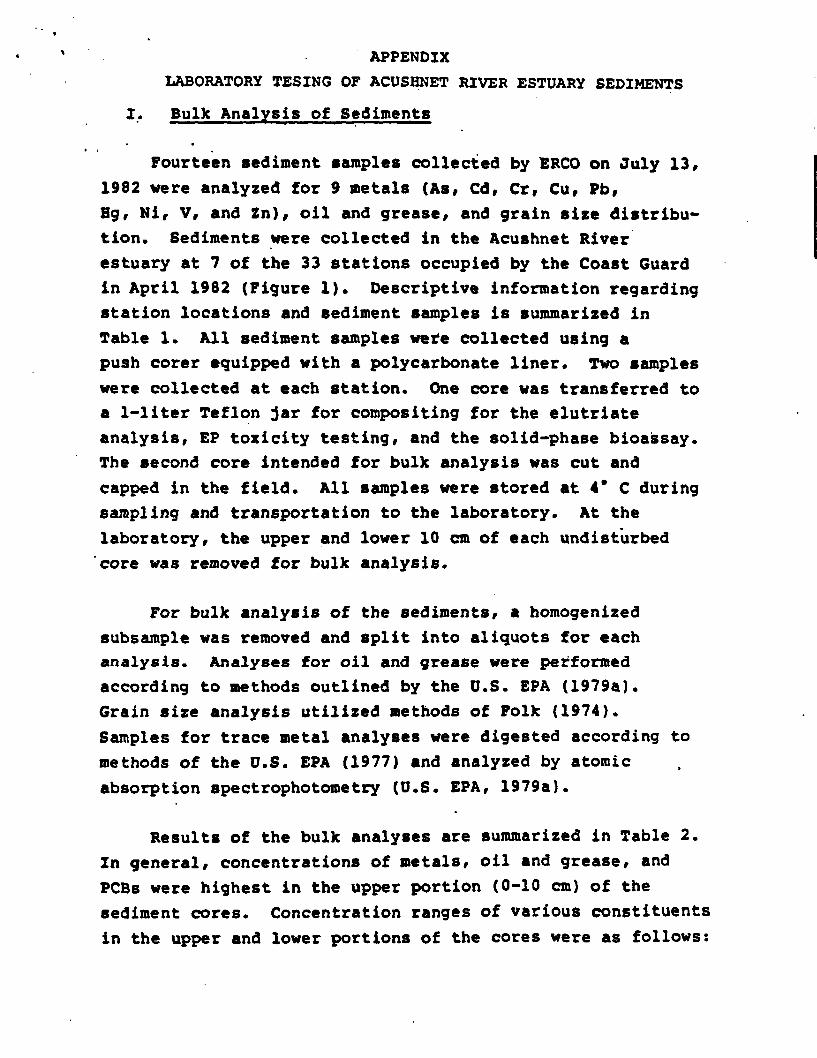
LABORATORY TESING OF ACUSHNET RIVER ESTUARY SEDIMENTS
bull Bulk Analysis of Sediments
Fourteen sediment samples collected by ERCO on July 13 1982 were analyzed for 9 metals (As Cd Cr Cu Pb Eg Nir V and Zn) oil and grease and grain size distribushytion Sediments were collected in the Acushnet River estuary at 7 of the 33 stations occupied by the Coast Guard in April 1982 (Figure 1) Descriptive information regarding station locations and sediment samples is summarized in Table 1 All sediment samples were collected using a push corer equipped with a polycarbonate liner Two samples were collected at each station One core was transferred to a 1-liter Teflon jar for compositing for the elutriate analysis EP toxicity testing and the solid-phase bioassay The second core intended for bulk analysis was cut and capped in the field All samples were stored at 4 C during sampling and transportation to the laboratory At the laboratory the upper and lower 10 cm of each undisturbed core was removed for bulk analysis
For bulk analysis of the sediments a homogenized subsample was removed and split into aliquots for each analysis Analyses for oil and grease were performed according to methods outlined by the US EPA (1979a) Grain size analysis utilized methods of Folk (1974) Samples for trace metal analyses were digested according to methods of the US EPA (1977) and analyzed by atomic absorption spectrophotometry (US EPA 1979a)
Results of the bulk analyses are summarized in Table 2 Zn general concentrations of metals oil and grease and PCBs were highest in the upper portion (0-10 cm) of the sediment cores Concentration ranges of various constituents in the upper and lower portions of the cores were as follows
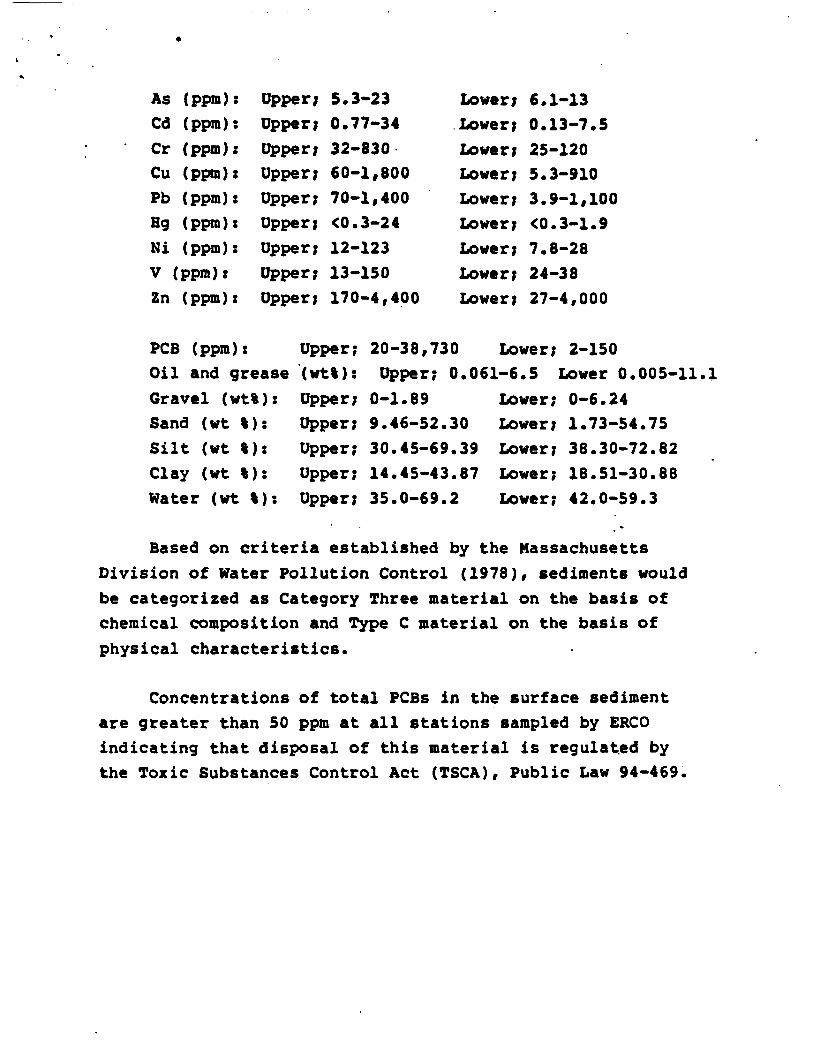
As (ppm) Upper 53-23 Lower 61-13 Cd (ppm) Upper 077-34 Lower 013-75 Cr (ppm) Upper 32-830 Lower 25-120 Cu (ppm) Upper 60-1800 Lower 53-910 Pb (ppm) Upper 70-1400 Lower 39-1100 Bg (ppm) Upper lt03-24 Lower lt03-19 Ni (ppm) Upper 12-123 Lower 78-28 V (ppm) Upper 13-150 Lower 24-38 Zn (ppm) Upper 170-4400 Lower 27-4000
PCB (ppm) Upper 20-38730 Lower 2-150 Oil and grease (wtt) Upper 0061-65 Lower 0005-111 Gravel (wt) Upper 0-189 Lower 0-624 Sand (wt ) Upper 946-5230 Lower 173-5475 Silt (wt ) Upper 3045-6939 Lower 3830-7282 Clay (wt ) Upper 1445-4387 Lower 1851-3088 Water (wt ) Upper 350-692 Lower 420-593
Based on criteria established by the Massachusetts Division of Water Pollution Control (1978) sediments would be categorized as Category Three material on the basis of chemical composition and Type C material on the basis of physical characteristics
Concentrations of total PCBs in the surface sediment are greater than 50 ppm at all stations sampled by ERCO indicating that disposal of this material is regulated by the Toxic Substances Control Act (TSCA) Public Law 94-469
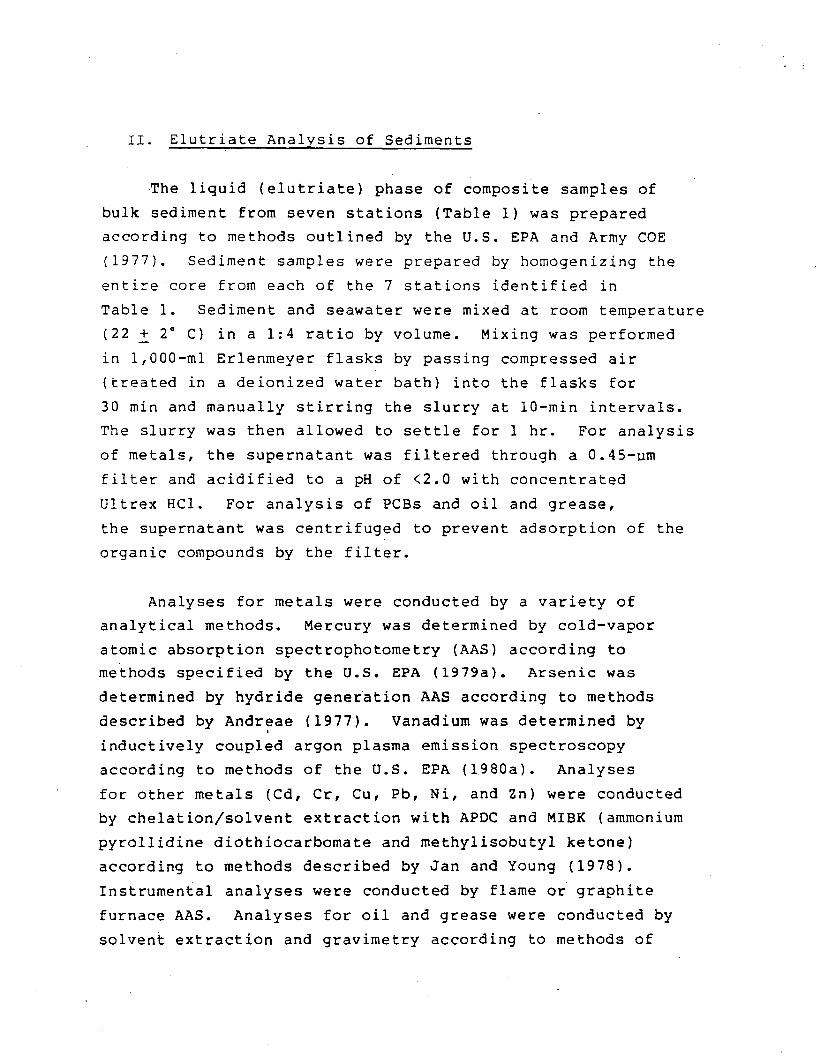
II Elutriate Analysis of Sediments
The liquid (elutriate) phase of composite samples of
bulk sediment from seven stations (Table 1) was prepared
according to methods outlined by the US EPA and Army COE
(1977) Sediment samples were prepared by homogenizing the
entire core from each of the 7 stations identified in
Table 1 Sediment and seawater were mixed at room temperature
(22 + 2 C) in a 14 ratio by volume Mixing was performed
in 1000-ml Erlenmeyer flasks by passing compressed air
(treated in a deionized water bath) into the flasks for
30 min and manually stirring the slurry at 10-min intervals
The slurry was then allowed to settle for 1 hr For analysis
of metals the supernatant was filtered through a 045-um
filter and acidified to a pH of lt20 with concentrated
Ultrex HC1 For analysis of PCBs and oil and grease
the supernatant was centrifuged to prevent adsorption of the
organic compounds by the filter
Analyses for metals were conducted by a variety of
analytical methods Mercury was determined by cold-vapor
atomic absorption spectrophotometry (AAS) according to
methods specified by the US EPA (1979a) Arsenic was
determined by hydride generation AAS according to methods
described by Andreae (1977) Vanadium was determined by
inductively coupled argon plasma emission spectroscopy
according to methods of the US EPA (1980a) Analyses
for other metals (Cd Cr Cu Pb Ni and Zn) were conducted
by chelationsolvent extraction with APDC and MIBK (ammonium
pyrollidine diothiocarbomate and methylisobutyl ketone)
according to methods described by Jan and Young (1978)
Instrumental analyses were conducted by flame or graphite
furnace AAS Analyses for oil and grease were conducted by
solvent extraction and gravimetry according to methods of
the US EPA (1979a) Analyses for PCBs were performed
according to methods of the US EPA (1979b) Samples were
extracted with methylene chloride and analyzed by gas
chromatography with electron capture detection
Results of elutriate analyses are presented in Table 3
Also shown in Table 3 are suggested water quality criteria
(US EPA 1980c) for seven constituents (Cd Cr Cu Hg Ni
Zn and PCBs) in saltwater environments These criteria
have been established for protection of saltwater aquatic
life and are generally lower than equivalent criteria for
freshwater environments Comparisons of constituent concenshy
trations in the sediment elutriates with these levels should
represent a conservative estimate for determination of the
relative potential environmental impact of soluble constituents
released by dredging activities
Concentrations of seven metals (As Cd Cr Pb Hg V
and Zn) in the elutriates (without application of a dilution
factor) were higher than in the Acushnet River water used
for sample preparation Conversely Cu and Ni concentrations
decreased in the elutriates relative to ambient levels The
maximum concentration levels suggested by the criteria (US
CPA 1980c) were not exceeded for any element for which
criteria exist although the 24-hr average level was exceeded
in some cases for Hg Ni and Zn (it should be noted that
no dilution factor was applied to the elutriate concentrations)
Ambient levels of Cu and Ni in the Acushnet River estuary
exceeded the suggested criteria
Concentration of total PCBs in the elutriates exceeded
the ambient level in the Acushnet River water for all
stations except Station 16 In addition concentrations of
total PCBs in the elutriate (without application of a
dilution factor) exceeded both the 24-hr average and maximum
Table 3 Results of elutriate analysis of sediment samples
Concentration (ug1) ERCO ID Oil and Total IC-82shy Sample Description As Cd Cr Cu Pb llg N i V Zn Grease PCBa
2192 Station 9 shy Composite 52 lt010 lt050 lt10 16 043 12 52 29 5000 11000
2193 Station 11 - Composite 55 lt010 36 13 42 lt020 73 55 60 8000 920
2194 Station 16 - Composite 21 lt010 39 12 59 028 64 21 19 350 34
2195 Station 21 - Composite 75 018 060 17 300 lt020 12 75 87 8000 1010
2196 Station 27 - Composite 36 025 18 11 13 043 74 36 21 3300 3360
2197 Station 29 - Composite 73 013 16 12 87 071 11 73 84 900 22
2198 Station 31 - Composite 35 lt010 10 lt10 18 064 91 35 lt25 500 47
Acushnet River Water lt10 lt010 29 62 18 lt020 20 lt10 62 370 61
Criterion13
- 24-hr NA 45 18 40 NA 0025 71 NA 58 NA 0030 - Maximum NA 59 1260 23 NA 37 140 NA 170 NA 10
aPBCs were quantified as Aroclor 1248 and Aroclor 1254
bThese criteria are based on recommendations of US EPA (1980c) for protection of saltwater aquatic life
NA shy None available
concentration levels suggested by the water quality criteria
In the case of Station 9 the elutriate concentration
exceeded the maximum concentration level of the criteria by
a factor of greater than 1000 Ambient levels of PCBs in
the Acushnet River exceeded the 24-hr average concentration
suggested by the criteria
Table 4 Results of EP toxicity testing of composite sediment sample from the New Bedford Harbor
Concentration (ppm) Maximum Contamination Constituent in sample 82-2199 Level (ppm)a
AS Ba Cd Cr Pb Hg Se Ag
Endrin Lindane Methoxychlor Toxaphene 24-D 245-TP Silvex
aEPA (1980b)
0021 0135 0016 0005 0060 lt0050 lt0002 lt0001
lt00001 lt00001 lt0001 lt0001 lt00004 lt00001
50 100 10 50 50 02 10 50
002 04 100 05
100 10
III Analysis of Sediments for EP Toxicity
A single composite sample comprised of equal
amounts of sediment from seven stations (Table 1 was
analyzed for the characteristic of EP toxicity according to
procedures outlined in Appendix II (pp 33127-33128) of the
US EPA (19805)
A 100 g sample was combined with 16 times its weight
of distilled deionized water and maintained at a pH of 50 _+ 02
for 24 hr by addition of 05N acetic acid The sample was
then filtered diluted to volume and analyzed for metals
pesticides and herbicides according to methods described
by the US EPA (1979a 1979b)
Results of the EP toxicity test are presented in
Table 4 Also presented are maximum contamination levels
(MCLs) that have been established for eight metals
pesticides and herbicides (the MCLs are 100 times the
Interim Primary Drinking Water Standards [US EPA 1980b])
Results indicate that the composite sediment sample is EP
non-toxic with respect to metals pesticides and herbicides
Nitex containers to prevent predation by grass shrimp)
Organisms were maintained in uncontaminated media for a
period of 2 days During this time fecal material was
removed from aquaria At the end of the 2-day period all
samples of organisms were split into approximately equal
amounts One of these subsamples was placed in a polyshy
ethylene clean bag and frozen for later analyses for metals
The second subsample was put in solvent-rinsed aluminum foil
and frozen for analyses for organics
Data produced by solid phase bioassays with grass
shrimp hard clams and sandworms are presented in Table 5
Mean survival of organisms exposed for 10 days to the
composite sediment sample was 190 (grass shrimp) 990
(hard clams) and 970 (sandworms)
Analysis of total (combined) survival data for the
three species exposed for 10 days to control (culture)
sediment and the solid phase of the composite sediment
sample is presented in Table 6 Mean survival of control
organisms was greater than 90 thus allowing evaluation of
data from tests with the composite sediment sample These
data indicate that total survival of organisms exposed to
the solid phase of the composite sediment sample was signishy
ficantly less than total survival of organisms exposed to
control sediment (717 versus 967)
IV Results of Solid Phase Bioassay
The composite sediment sample was prepared for biological
testing according to procedures described in Appendix B of
the manual entitled Ecological Evaluation of Proposed
Discharge of Dredged Material into Ocean Waters (US EPA
and US Army COE 1977) Bioassays with sediment were
conducted according to guidelines presented in Appendix F of
the EPA and COE manual for dredged material (US EPA and
US Army COE 1977)
Species tested in the solid phase bioassays were the
grass shrimp (Palaemonetes pugio) hard clam (Mercenaria
mercenaria) and sandworm (Nereis virens) Grass shrinp
were collected in Osterville Massachusetts Hard clams and
sandworms were acquired from commercial suppliers in
respectively Long Island New York and Boston Masschusetts
Animals were acclimated in artificial seawater for at least
3 days prior to initiation of testing All species were
tested in the same aquaria Testing temperature was
20 +_ 1 C Water exchange (artificial seawater) was by the
replacement as compared to the flow-through method
Control (culture) sediment employed in the tests was
collected on July 14 1982 from the subtidal zone off
Manchester Massachusetts The sediment which was collected
by R Boeri and C Smith ERCO consisted primarily of
sand
At the conclusion of the solid-phase bioassays with
grass shrimp hard clams and sandworms all surviving
organisms from each aquarium (replicate) were placed in an
aquarium containing clean sediment-free water and allowed
to void their digestive systems (sand worms were confined in
Table 6 Analysis of total (combined) survival data for grass shrimp (Palaemonetes pugio) hard clams (Mercenaria mercenaria) and sandworrms (Nereis virens) exposed for 10 days to control (culture) sediment and solid phase of composite sediment sample
Step 1 Total Survival Data (From Table 5)
Total Number of Survivors Treatment
(t) Control Composite (Culture) Sediment
Replicate (r) Sediment Sample
1 58 42 2 57 45 3 57 45 4 58 41 5 60 42
Mean (x) 5800 (967) 4300 (717)
Step 2 Cochrans Test for Homogeneity of Variances of Survival Data
Treatment (t) Survival
Mean (x) Variance (S )
Control (culture) sediment Composite Sediment Sample
5800 4300
150 350
C(Cal) = = 350 = 070 ns
IS 500
as compared to C = 091 for a = 005f k = 2 and v = 4
Step 3 Parametric Unpaired t Test of Survival Data (Comtrol Sediment vs Composite Sediment Sample)
Xlfc(cal) = ~X2 = 1500 _
100
as compared to = 1-86 for a = 005 one-tailed hypothesis and df = 8
Table 5 Results of solid phase bioassays with grass shrimp (Palaemonetes pugio) hard clams (Mercenaria mercenaria) and sandworms (Nereis virens)3
Treatment (t)
Number of Survivors30
Control (Culture) Sediment Composite Sediment Sample
Replicate (r)
Grass Shrimp
Hard Clams
Sand-worms Total
Grass Shrimp
Hard Clams
Sand-worms Total
1 18 20 20 58 3 20 19 42
2 18 19 20 57 5 20 20 45
3 18 20 19 57 5 20 20 45
4 18 20 20 58 4 19 18 41
5
Mean (x)
20
1840
20
1980
20
1980
60
5800
2
380
20
1980
20
1940
42
4300
() (920) (990) (990) (967) (190) (490) (970) (717)
aBioassays (10-day tests) were conducted at 20+^ 1 C in 38-liter aquaria Organisms were exposed to each replicate of a treatment in a single aquarium Water in aquaria was exchanged by the replaceshyment as compared to the flow-through method and was aerated A 14-hour light and 10-hour dark photo-period was maintained with cool-white fluorescent bulbs Minimum values of dissolved oxygen and pH recorded during the bioassays were 54 mg1 and 71 respectively Salinity was maintained at 30 ppt
^Twenty (20) individuals of each species were initially exposed to each replicate of a treatment Thus a total of 60 animals was employed in each aquarium
degIn addition to monitoring survival of all species burrowing behavior of sandworms was noted at 2-day Intervals No differences were observed among aquaria
LABORATORY PROCEDURES FOR PREPARING THE COMPOSITE SEDIMENT SAMPLE3
Date of Certifications of Performance of Procedure Implemenshytation of Aquatic Aquatic Laboratory
Procedure Procedure Toxicologist Toxicologist Director
1 Store control sediment (CS) and composite CS 71482 sediment sample (CSS) at 2-4 C in separate containers Mix sediment in each 71382 container as thoroughly as possible
Solid Phase Bioassays
Bioassays should be initiated by July 27 1982 (2 weeks after July 13 1982 date of sediment arrival) Do not be concerned with sophisticated photoperiod Maintain dissolved oxygen in aquaria at gt4 ppm Cover aquaria to prevent salinity changes
2 Remove CS from storage and wet sieve through 1-mm mesh Use minimum volume of 714 artificial sea water [ASW] of salinity 30 ppt for sieving purshyposes Place nonliving material remaining on sieve in appropriate containers
3 Mix CS and allow to settle for 6 hr 714
4 Decant ASW and mix 714 CS as thoroughly as possible
5 Assign treatments (CS and CSS) and replicates (5 r per treatment) 714 to aquaria
6 Randomly position aquaria (10) in environshymental chamber maintained 714 at 20+1C 20+ 1TC
aThis document is a copy of the work sheet that was used during the evaluation The document differs from the work sheet in that dates appear in typed form and certifications were added at a single time after the dates were typed
V LABORATORY PROCEDURES FOR CONDUCTING SOLID-PHASE BIOASSAY
This section contains laboratory procedures for
preparing the composite sediment sample and conducting the
solid phase bioassay
Laboratory Procedures (Continued)
Date of Certifications of Performance of Procedure Implemenshytation of Aquatic Aquatic Laboratory
Procedure Procedure Toxicologist Toxicologist Director
14 During acclimation period remove approshypriate volumes of CSS from storage and wet-sieve each sample through 1-mm mesh into containers Use minishymum volume of ASW for sieving purposes Place nonliving material remaining on sieves in container
15 Mix CSS and allow to settle for 6 hr
16 Decant ASW and mix CSS as thoroughly as possible
17 Place 15 mm of CSS in all but control aquaria Employ basic strategy identified in Step 8
18 Remove remaining CS from storage Warm to test temperashyture (20+1C) Add 15 mm of CS to each control aquarium Employ basic strategy identified in Step 8
19 Replace 75 of ASW 1 hr after addition of CSS and final addition of CS
20 Select 200 grass shrimp from holding tank and randomly distribute into 10 culture dishes
21 Randomly distribute contents of 10 culture dishes into 10 aquaria
716
716
716
716
716
716
716
Laboratory Procedures (Continued)
Date of Certifications of Performance of Procedure Implemenshytation of Aquatic Aquatic Laboratory
Procedure Procedure Toxicologist Toxicologist Director
7 Partially fill aquaria with ASW 714 bull
8 Place 30 mm of CS in each aquarium Fill 1st aquarium to -gt-10mm then 2nd aquarium to -10mm 714 and finally last aquarium to ^10 mm Repeat sequence until aquaria are filled to gt-20 mm Repeat sequence again until aquaria are filled to ~30 mm This procedure will help to ensure that CS in all aquaria is homogeneous Store remaining CS at 2-4C for later use
9 Replace ASW 1 hr after CS has been added to aquaria Do not disturb 714 sediment during replacement
10 Select 200 hard clams from holding tanks and randomly distribute into 714 10 culture dishes Follow same procedure for sandworms
11 Randomly distribute contents of 10 culture 714 dishes into 10 aquaria
12 If necessary replace 75 of AWS 24 hr after animals are introduced Not necessary into aquaria
13 Acclimate animals for 48 hr During this time period remove dead 714-716 animals and replace with live animals
10
US STANDARD SIEVE OPENING IN INCHES US STANDARD SIEVE NUMBERS HYDROMETER
34 3 4 6 8 IO I l6 20 deg 40 50 70 I0degI4deg 20deg6 4 3 2 l2 1 3
100shy
l
^U 5gt_shys
on NL
X bull 20
bullv tshyraquo- 7n I 7O 13 UJ
_-raquo- bull-bullv
bull30 5 UJ Be
finOU
ffi
ltE UJ laquo- 2 50
u K
Nj
bull An^deg
50au
^ 01
cr UJ w
a lt o u
2poundU
o W
An deg
30
vV
s
- An
TO
i_ z UJ o
a UJ
v QL
5-n
in
ns
O A
90
3OO 100 5O IO 5 1 O5 OI OO5 001 O005 OOOI
GRAIN SIZE MILLIMETERS
[ COBBLES GRAVEL
COARSE | FINE COARSE |SAND
MEDIUM | FINE SILT OR CLAY
O
New England Governors Conf New Bedford Harbor GRAIN SIZE CURVE Boston Massachusetts Investigation STATION 9
New Bedford Massachusetts LOWER 10 CM GEOTECHNICAL ENGINEERS 1N(
WINCHESTER bull MASSACHUSETTS Project 82990 ruly 30 1982 Fig 3
US STANDARD SIEVE OPENING IN INCHES US STANDARD SIEVE NUMBERS HYDROMETER
6 4 3 2 I1 1 34 fe 3 4 6 8 IO 14 16 20 3O 40 50 70 100 140 200 100shy mdashI ( raquomdash imdash Mgttrade bullbull shy L gtbulllaquobull
-raquo -raquo
-bull 10
oubull
20
H j_ bull30 5 u UJ
UJ
gtm ltE
60 y
CD
ltX UJ
UL
1-
50 Q
O o
0 ^
bullz UJ o
^ 30
UJ a
A r
in
1sN
bullmdash ~1 IUU
500 100 5O 10 5 O5 OI 005 001 OJ005 0001
GRAIN SIZE MILLIMETERS
COBBLES GRAVEL
COARSE | FINE COARSE
SANO
MEDIUM | FINE SILT OR CLAY
New England Governors Conf New Bedford Harbor GRAIN SIZE CURVE
Boston Massachusetts Investigation STATION 9
New Bedford Massachusetts UPPER 10 CM r^ OGEOTECHNICAL ENGINEEMS IN
WINCHESTER bull MASSACHUSETTS Project 82990 Tu]y 30 1982 Fig 2
20
1 - US STANDARD SIEVE OPENING IN INCHES US STANDARD SIEVE NUMBERS HYDROMETER
6 4 3 Z l2 1 3 4 6 8 10 14 16 20 30 4O 50 70 100 I4O 2OO IOU 1 mdash lt
1 U^ - -_bullbull^ K
N
^V
IO
Of) bull20
^^ H
Vhi- 7ndeg 30 g V^
Vo Hi UJ
gt
B 60 ^
ffl V tr
z iZ
H ^ tIL
Af
1 O
l J
3
0
C
C
OA
RS
ER
O Z U)
^ oec Ny 30 -mdash(^ u Q S
- An i
IO - on
5lt SO IOO 5O 10 5 shy shy O5 OI 005 OOI OjOOS OOOI
GRAIN SIZE MILLIMETERS
COBBLES GRAVEL
COARSE 1 FINE COARSE SAND
MEDIUM FINE SILT OR CLAY
mdash
New England Governors Conf Boston Massachusetts New Bedford Harbor
Investigation GRAIN SIZE CURVE
STATION 11
HK OEOTECHNICAL ENGINEERS INC New Bedford Massachusetts LOWER 10 CM
VJL WINCHESTER bull MASSACHUSETTS Project 82990 July 30 1982 Fiq 5
US STANDARD SIEVE OPENING IN INCHES US STANDARD SIEVE NUMBERS HYDROMETER
6 4 9 2 l2 I 34 2 3 4 6 8 10 14 16 20 3O 40 50 70 100 140 200 IOO-I rmdashi 1 1 i il I I li il r-4 r-l 1 ill 1 il i il i 1 i 1 t l-L-iili i 1 i h 1 hmdash1 1 i i ih i imdashi 1 1 IT i i i imdashi 1 r- rO
bullbull 1gt~gt -
Xyo bull h 10
20 ^s
H 7n 3O Jo HI deg
O bull
UJ IU 3
s A r y~ 60 gt- fin
bullgt v
4 gt
0 c
bull C
OA
RS
ER
8
Z
CD
DC UJ laquon 50 zu H z in 40 so
UJ
(T o
1H 30 7ri o O bullU ^ UJ
bullgt CL
srv v
^^^^ in S -90 V
1
O IUU
5ltDO IOO 5O IO 5 1 05 OI 005 001 0005 0001
GRAIN SIZE MILLIMETERS
GRAVEL SAND COBBLES SILT OR CLAY COARSE 1 FINE COARSE MEDIUM | FINE
New England Governors Conf New Bedford Harbor GRAIN SIZE CURVE
Boston Massachusetts Investigation STATION 11
New Bedford Massachusetts UPPER 10 CM r-OGEOTECHNICAL ENGINEERS IN WINCHESTER MASSACHUSETTS Project 82990 July 30 1982 Fig 4
US STANDARD SIEVE OPENING IN INCHES US STANDARD SIEVE NUMBERS HYDROMETER
6 4 3 a life | 2 3 4 6 8 10 14 16 20 3O 40 50 70 100 140 200
-bulllaquo ~s
V
10
gt
20
H
K- 70 7O bull 30 5I0 U
tu raquo
ACgt 60gtbull 60 U (D
ffi a cc UJ Ui laquon O T
50 bull50 (j 3Uzk lt
u o l- k o
40 Z AA en i_s V Zu
a bull UJ o
Jjraquo 30 s 7 r QC UJ SL Q
^^ bullmdashmdashlaquo n ^N A C
10 bull yu
bull -imdash i i u u 500 IOO 5O IO 5 05 OI 005 001 0005 0001
GRAIN SIZE MILLIMETERS
COBBLES GRAVEL
COARSE | FINE COARSE SAND
MEDIUM FINE SILT OR CLAY
O
New England Governors Conf New Bedford Harbor GRAIN SIZE CURVE Boston Massachusetts Investigation STATION 16
New Bedford Massachusetts LOWER 10 CM GEOTECHNICAL ENGINEERS IN r
WINCHESTER bull MASSACHUSETTS Project 82990 Ji Jly 30 1982 Fiq 7
US STANDARD SIEVE O P E N I N G IN INCHES US S T A N D A R D SIEVE N U M B E R S H Y D R O M E T E R 346 4 3 2 |l_ | bdquo 3 4 6 810 14 16 20 30 40 50 TO 100140 200
lt bull i i i _ _ _ n 100- mdashi - -1 mdashrmdash bull
1 10 9Oshy
80 bull 20 NJ 1shy
1- -ro 30 oI 70 UJ 0
UJ 4O gt~ 60 laquon ^U 03 gt- sCD
^bullx Cf
tr UJ gtv^ UJ KJ-gt 50 OT z 50
V ltt u OSv OH gt N 40 -6O vshyui zo UJ
occ UJ 0 bull 7O CC
UJ a
on w - A n ^ v
l ^ laquo Qf IO
N 500 100 50 IO 5 1 05 OI O05 OOI OOO5 bull OOOI
G R A I N SIZE M I L L I M E T E R S
C O B B L E S G R A V E L
COARSE | F I N E COARSE |S A N D
M E D I U M | F I N E S I L T OR C L A Y
New England Governors Conf GRAIN SIZE CURVE New Bedford Harbor Boston Massachusetts STATION 16
Investigation UPPER 10 CM
New Bedford Massachusetts OGEOTECHNICAL ENGINEERS IN r W I N C H E S T E R bull MASSACHUSETTS Project 82990 J uly 30 1982 Fiq 6
US STANDARD SIEVE OPENING IN INCHES US STANDARD SIEVE NUMBERS HYDROMETER
6 4 3 2 l2 1 S4 a 3a 3 4 6 8 10 K 16 20 3O 40 50 70 100 140 200 100 1 shy
lt 1 -(shy ~1yobull 10
X bulls
on bull 20 ^
HshybullH 70 7O bull 30 oI ^
O UJ UJ t
A n ~ 6deg CO
CD V 60 ^U
V poundT poundC UJ w
50 OT in u z degdeg
lt O O1-
2 4O n i_pound 40
V
O yz UJ Ooc ^ x
IfQ 30 bull 7ft fl OU -( UJ X Q
20 bull A n
10 -goi
0 bull- r i bull i u u 500 100 50 10 5 05 OI OO5 OOI 0005 OOOI
GRAIN SIZE MILLIMETERS
GRAVEL SAND [ COBBLES SILT OR CLAY COARSE ] FINE COARSE | MEDIUM FINE
New England Governors Conf New Bedford Harbor GRAIN SIZE CURVE Boston Massachusetts Investigation STATION 21
New Bedford Massachusetts LOWER 10 CM HK GEOTECHN1CAL ENGINEERS IN r VLJ WINCHESTER bull MASSACHUSETTS Project 82990 July 30 1982 Fiq 9
US STANDARD SIEVE OPENING IN INCHES US STANDARD SIEVE NUMBERS HYDROMETER
346 4 3 2 1 ^ 1 raquo laquo 3 4 6 8 10 14 16 20 3O 40 50 70 100 140 200 100shy
i
bull shy ^ raquo _ 1 L i 1 1
bull ( h-^- ^ laquobullmdash4 l_
1 1
mdashbull=
J _1 ___ ____ 1-1
go bull ---bull
^x 1 0
oubull 20
I-
^X
-rn 70 ^fl in
o UJ
fiOOU
CD
cc UJ laquolaquo
u
V bull 4nHU
50
UJ
~ CD
or UJ
52 lt O
gtshysu (pound
40 ^
fir
o i
2 UJ 0
W -IQ _^LA bull 7rraquo tt
UJ S Q
on - An
^1 lt ^
in
mdash ijltj 5DO IOO 5O IO 5 O5 OI O05 001 0005 OOOI
GRAIN SIZE MILLIMETERS
COBBLES GRAVEL
COARSE | FINE COARSESAND
MEDIUM | FINE SILT OR CLAY
O
New England Governors Conf New Bedford Harbor GRAIN SIZE CURVE
Boston Massachusetts Investigation STATION 21 New Bedford Massachusettb UPPER 10 CM
GEOTECHNICAL ENGINEERS IN r WINCHESTER bull MASSACHUSETTS Project 82990 Tuly 30 1982 Fig 8
US STANDARD SIEVE OPENING IN INCHES US STANDARD SIEVE NUMBERS HYDROMETER 34
3e6 4 3 2 l2 1 2 3 4 6 8 IO 14 16 20 3O 40 50 70 100 140 200 IOOshy 1F- M = -4
ff
mdash~~~v fcvs
10
N s 20
i 70 rushyugt UJ
60 gtshy
CD
s s
V
bull 30
A ndeg
1-
o UJ
gtbull 03
cc aujS U
(-zu0
a
Kn
An 40
V
V
H y
v
503J
An
UJ OT
Qshy
lt o lt_gt i_ z UJ o
pound 30
n
s s fCl DC
Ul a
i
IOshy (an
0 5lt DO 100 50 10 5 1 05 OI 005 001 0005 0001
GRAIN SIZE MILLIMETERS
COBBLES GRAVEL
COARSE j FINE COARSESAND
MEDIUM | FINE SILT OR CLAY
New England Governors Conf New Bedford Harbor GRAIN SIZE CURVE Boston Massachusetts Investigation STATION 27
New Bedford Massachusetts LOWER 10 CM
OGEOTECHNICAL ENGINEERS IN r WINCHESTER bull MASSACHUSETTS Project 82990 July 30 1982 Fig 11
US STANDARD SIEVE O P E N I N G IN INCHES USSTANDARD S I E V E N U M B E R S H Y D R O M E T E R
6 4 3 2 l2 l 34 3laquo 3 4 6 8 10 14 16 20 3O 40 50 70 100 140 200 100shy bull lt shy mdash1
bull l i i r -gt
k
N ltS 10
20
1- 7nI 7O 0 UJ
V 6600
bull 30
- ACl^U
H
o UJ
gt~ m
CD ^ o
ltrui u t-ziLu or if
laquon
4040
30
bulllaquo raquo
N
-50bullJJ
bull fin
7ltgt
UJ w poundg
lt
O o i_ z UJ o ft
lii
Q
o igt-- laquolaquo ft n
mdashi gtmdashraquo ^^
10 X gt 90
500 IOO 50 10 5 1 O5 OI O05 OOI 0005 0001
G R A I N S IZE M I L L I M E T E R S
G R A V E L S A N D[ COBBLES SILT OR CLAYCOARSE | F I N E COARSE M E D I U M F I N E
New England Governors Conf New Bedford Harbor GRAIN SIZE CURVE Boston Massachusetts Investigation STATION 27
New Bedford Massachusetts UPPER 10 CM
OGEOTECHNICAL ENGINEEFXS IN r WINCHESTER bull MASSACHUSETTS Prefect 82990 7uly 30 1982 Fig ] 0
US STANDARD SIEVE OPENING IN INCHES US STANDARD SIEVE NUMBERS HYDROMETER
s46 4 3 2 l2 1 fe 3 4 6 8 10 14 16 20 3O 40 50 70 100 140 200 IOOshy
-lt ^
^ QA v 10
V vgtn Ls - yrgt
tshy
H 70 - ^O Jn X TOshy19 UJ
UJ
A f gtshy 60 6deggtshym
V ltr w laquon z degdeg u 1- k
z An lt Zpound 40
u UJ ce ^ o
s - 7H OLS 30
UJ 0
2O PA
V IQ
~shy
0 5DO IOO 50 IO 5 1 O5 OI - 005 001 OX)05 OOOI
GRAIN SIZE MILLIMETERS
GRAVEL SAND [ COBBLES SILT OR CLAY COARSE 1 FINE COARSE MEDIUM FINE
n m
J
3
0
C
C
OA
RS
ER
B
O
New England Governors Conf New Bedford Harbor GRAIN SIZK CURVE Boston Massachusetts Investiqation STATION 29
New Bedford Massachusetts UPPER 10 CM CEOTECHNICAL ENGINEERS IN r
WINCHESTER bull MASSACHUSETTS Project 82990 July 30 1982 Fiq 12
US STANDARD SIEVE OPENING IN INCHES US STANDARD SIEVE NUMBERS HYDROMETER
6 4 3 2 l 1 2 3a 3 4 6 810 14 16 20 30 40 50 70 100 140 200
100 Tmdashbull bull bull 1 1 i 1mdash 1 i 1mdash rl 1mdash itr i il i il i 1 imdash h-raquo 1 1 iii i 1 bull t i 1 raquoii 1 Ji i ih i-bulllaquoX
imdashi 1 1 1 i i i i i 1 1 r n
s 9O shy 10
k
20
1-^ bullraquo X 7O (9 UJ
finou bull
CO
DC
pound 50shy
30
A r
1 C
g Lu
~gt~
BR
SE
R
UL k
O
l 0
CO
A
J 1 ^
o V UJ oc
0
JJJ 3O 7 n tt Ui Ngts a
Niin shy 90
O mdash mdash mdash i i j j 5ltDO 100 50 10 5 1 05 OI O05 001 OSO5 0001
GRAIN SIZE MILLIMETERS
GRAVEL SAND COBBLES SILT OR CLAY COARSE | FINE COARSE MEDIUM | FINE
New England Governors Conf New Bedford Harbor GRAIN SIZE CURVE
Boston Massachusetts Investigation STATION 29 New Bedford Massachusetts LOWER 10 CM
X-jK GEOTECHN1CAL ENGINEERS INC
1 3 bull
VL WINCHESTER bull MASSACHUSETTS Project 82990 July 30 1982 Fig 13
Table 1 Summary of sampling inforroaiton for sediment samples collected in the Acushnet River estuary on July 13 1982
Hater Core Station Time Depth Sampling Length Sample Processing and Location3 Date (local) (m) Equipment (cm) Preservation Methods Sample Identification
9 71382 1355 1 Push 36 Composite in Teflon jar NB-9 (Composite)-82-2192 corer store at 4 C
9 71382 1400 1 Push 48 Cap core tube store at NB-9 (0-10 cm)-82-2178 corer 4 C NB-9 (38-48 cm)-82-2179
11 71382 1405 12 Push 36 Composite in Teflon jar NB-11 (Composite 1-82-2193 corer store at 4 C
11 71382 1410 12 Push 36 Cap core tube store at NB-11 (0-10 cm)-82-2180 corer 4 C NB-11 (26-36 cm)-82-2181
16 71382 1520 17 Push 27 Composite in Teflon jar NB-16 (Composite) -82-2194 corer store at 4 C
16 71382 1525 17 Push 43 Cap core tube store at NB-16 (0-10cm)-82-2182 corer 4 C NB-16 (33-43 cm)-82-2183
21 71382 1420 1 Push 36 Composite in Teflon jar NB-21 (Composite)-82-2195 corer store at 4 C
21 71382 1425 1 Push 39 Cap core tube store at NB-21 (0-10cm)-82-2184 corer 4 C NB-21 (29-39 cm)-82-2185
27 71382 1445 15 Push 38 Composite in Teflon jar NB-27 (Composite)-82-2196 corer store at 4 C
27 71382 1450 15 Push 44 Cap core tube store at NB-27 (0-10 cm)-82-2186 corer 4 C NB-27 (34-44 cm)-82-2187
29 71382 1500 1 Push 79 Composite in Teflon jar NB-29 (Composite)-82-2197 corer store at 4 C
29 71382 1505 1 Push 94 Cap core tube store at NB-29 (0-10 cm)-82-2188 corer 4 C NB-29 (84-94 cm)-82-2189
31 71382 1435 06 Push 33 Composite in Teflon jar NB-31 (Composite ) -82-2198 corer store at 4 C
31 71382 1440 06 Push 31 Cap core tube store at NB-31 (0-10 cm)-82-2190 corer 4 C NB-31 (21-31 cm)-82-2191
aAll stations were located using navigational markers placed by the Coast Guard Providence Rhode Island
^ifeO-^UV 4^r Vy- bull Aciishnet Tiifn ~rSf~ bull -~ bullbullpoundbullbullbull
0 bull 100 200 300 400
1
SCALE IN FEET
500
OIP |^r-7
Kar i L^ ltlaquo T
-bull bullshy -bull shy - = bullbullbull vr L--V-To5^1
12 33 bull bull Two additional samples I | taken 300 down stream
Figure 1 Location of sampling stations in Acushnet River Stations denoted as bull were occupied by US Coast Guard in April 1982 Stations denoted as (bull) were reoccupied by ERGO on July 13 1982
Table 2 Results of bulk analysis of sediment samples
Concentration (ppm dry weight )a ERCO ID IC-82- Sample Description As Cd Cr Cu Pb Hg Ni V Zn PCBb
2178 Station 9 shy 0-10 cm 16 20 740 1700 930 13 113 150 3600 16700 38370 2179 Station 9 - 38-48 cm 13 69 87 820 1 000 19 23 33 3700 No sample
(13) (75) (120) (910) (1100) (18) (23) (32) (4000)
2180 Station 11 shy 0-10 cm 13 34 716 840 560 11 82 100 1800 1200 320 2181 Station 11 shy 26-36 cm 79 071 36 110 150 009 89 28 200 28
2182 Station 16 - 0-10 cm 53 077 32 60 70 lt03 12 16 170 190 20 2183 Station 16 - 33-43 cm 74 013 25 53 39 lt03 78 24 28 2
2184 Station 21 - 0-10 cm 23 33 680 580 310 lt03 97 133 1000 750 1290 2185 Station 21 - 29-39 cm 94 078 40 27 25 lt03 11 31 69 150
2186 Station 27 - 0-10 cm 93 17 440 730 420 057 76 64 1200 1980 66500 2187 Station 27 - 34-44 cm 99 068 38 20 420 lt03 12 38 51 27
2188 Station 29 - 0-10 cm 13 21 830 1200 130 10 123 13 1400 1130 430 2189 Station 29 - 84-94 cm 81 024 28 64 37 lt03 87 16 31 9
2190 Station 31 - 0-10 cm 22 15 520 1800 1400 24 68 98 4400 2900 1860 2191 Station 31 - 21-31 cm 76 60 83 540 1000 16 28 27 3800 2
(61) (49) (62) (420) (780) (10) (20) (19) (2700)
Concentration Ranges for Classification by Chemical Composition0
Category One lt10 lt5 lt100 lt200 lt100 lt05 lt50 lt75 lt200 lt05
Category Two 10-20 5-10 100-300 200-400 100-200 05-15 50-100 75-125 200-400 05-10
Category Three gt20 gt10 gt300 gt400 gt200 gt15 gt100 gt125 gt400 gt10
Duplicate analyses shown in parentheses
for PCB concentrations were obtained from the US Coast Guard Providence Rhode Island concentrations in the upper portion of the core were determined at the 0-1 and 5-12 to 6-12 depths in the core respectively
cMassachusetts Division of Water Pollution Control (1978) bull^Combined silt-clay percentage
Table 2 (CONT)
Grain size (wt )
ERCO ID IC-82shy Sample Description Gravel Sand Silt Clay
Water Content ()
Oil and Grease (wt) Classification
2178 2179
Station Station
9 - 0-10 cm 9 - 38-48 cm
0 624
1170 2602
6449 4816
2381 1958
692 593
6 1 5 11
3c
2180 2181
Station Station
11 shy11 shy
0-10 cm 26-36 cm
0 0
3152 3112
5099 3800
1749 3088
556 549
1 0 68 23
3c
2182 2183
Station Station
16 shy16 shy
0-10 cm 33-43 cm
189 0
5230 173
3136 7282
1445 2545
350 420
0 0 061 005
3c j)
2184 2185
Station Station
21 shy21 shy
0-10 cm 29-39 cm
0 423
1176 5475
6939 4629
18185 2773
520 558
1 0 41 03
3c
2186 2187
Station Stat ion
27 shy27 shy
0-10 cm 34-44 cm
0 0
5212 1066
3045 5963
1743 2971
547 569
2 0 97 02
3c
2188 2189
Station Station
29 shy29 shy
0-10 cm 84r94 cm
163 0
1576 204
5393 7043
2868 2753
667 463
1 0 83 01
3c
2190 2191
Station Station
31 shy31 shy
0-10 cm 21-31 cm
152 117
946 3606
4515 4423
4387 1851
669 582
3 1 47 24
3c
Concentration Ranges for Classification by Physical Characteristics0
Type A
Type B
mdash
mdash
mdash
mdash
lt60d
- shy 60-90d
- shy
- shy
lt40
40-600
lt05
0 5-10
Type C mdash
shy- - shy gt90d - shy gt60 gt 10
- Text3
- barcode 268640
- barcodetext SDMS DocID 268640

DREDGING OF PCB-CONTAMINATED SEDIMENTS NEW BEDFORD HARBORACUSHNET
RIVER ESTUARY MA
Submitted to
New England Governors Conference Inc Boston Massachusetts
Submitted by
Geotechnical Engineers Inc 1017 Main Street
Winchester Massachusetts 01890
Project 82990 September 7 1982
ampMCampiJJM Richard W Turnbull Ronald C Hirschfeld Engineering Geologist Principal
The views and statements contained in this publication are solely those of the authors and do not represent the official views or policies of the New England Governors Conference its member states other state agencies the Water Resources Council its members agencies or other federal agencies
TABLE OF CONTENTS
Page No
LIST OF TABLES
LIST OF FIGURES
1 EXECUTIVE SUMMARY 1
2 INTRODUCTION 4
21 Purpose 4 22 Scope 4 23 Authorization 5 24 Background 5
3 CHARACTERIZATION OF SEDIMENTS 7
31 General Geology 7 32 Surface Sediments 7 33 Sedimentation Rates 8 34 PCB Contamination 8 35 Metals 9 36 Classification 10 37 Impacts on Dredging and Transportation 11
4 DREDGING bullbull 12
41 Mechanical Dredge 12 42 Hydraulic Dredges 13 43 Pneumatic Dredges 13 44 Silt Curtains 14
5 TRANSPORTATION OF DREDGED MATERIAL 15
51 Floating Slurry Pipeline 15 52 Barge 15 53 Truck or Rail 15
6 DISPOSAL OPTIONS 17
61 General bull 17 62 Incineration 17 63 Chemical Landfill 17 64 Other Disposal Options 18
TABLE OF CONTENTS (Concluded)
Page No
7 CASE HISTORIES IN CONTAMINATED SEDIMENTS 21
71 Upper Hudson River New York 21 72 Waukegan Harbor Illinois 21 73 Duwamish Water Seattle Harbor Washington bull 23 74 California Aqueduct 23 75 James River Virginia 24 76 Contacts For Case Studies 25
8 CONCLUSIONS 28
9 REFERENCES 29
TABLES
FIGURES
APPENDIX
LIST OF TABLES
Table 1 - EstimatedContaminated Volumes and PCS Recovery
Table 2 - Results of Bulk Analysis of Sediment Samples
Table 3 - Classification of Dredge or Fill Material by Chemical Constituents
Table 4 - Classification of Dredge or Fill Material by Physical Characteristics
Table 5 - Normally Approvable Dredging Handling and Disposal Options
LIST OF FIGURES
Fig 1 - Location of Study Area
Fig 2 - Location of Sampling Stations in Acushnet River
Fig 3 - Mechanical Dredges
Fig 4 - Mechanical Dredges
Fig 5 - Watertight Grab Bucket
Fig 6 - Hydraulic Dredges
Fig 7 - Hydraulic Dredges
Fig 8 - Pneumatic Pump
Fig 9 - Oozer Pump Operation
Fig 10 - Typical Secure Land Burial Facility For Contaminated Dredge Spoils
1 EXECUTIVE SUMMARY
The purpose of this investigation was to identify feasible dredging techniques for the removal of sediments contaminated with polychlorinated biphenyls (PCBs) from the New Bedford Harbor and Acushnet River Estuary This investigation included laboratory testing on sediments obtained from the tidal flats near a historic source of PCB contamination and a literature review of the history of PCB contamination in the general area local sediment characteristics and dredging transporting and disposing of contaminated sediments
This investigation was sponsored by the New England Governors Conference Inc with primary funding from the U S Water Resources Council secondary funding and technical guidance from the Massachusetts Office of Coastal Zone Management and in kind services contributed by the five coastal New England states and New York This work is part of a larger analysis of dredge management needs in New England
Information developed during this and previous studies indishycate that surface sediments of the Acushnet River Estuary and New Bedford Harbor are contaminated with high levels of PCBs from two industrial operations and a wastewater treatment facility The area of contamination extends from the tidal flats at the northernmost extreme of the estuary in the inner harbor to an area in the vicinity of the New Bedford municipal wastewater outshyfall in the outer harbor a distance of over six miles These sediments contain PCBs in levels up to 190000 ppm or 19 pershycent Contamination has caused eighteen thousand acres to be closed to lobstering and a lesser yet significant area to be closed to the-taking of finfish and shellfish
PCBs are only slightly soluble in water and -are readily adsorbed from aqueous solutions and held strongly in place by fine-grained sediments Therefore the mobility of these conshytaminants when sediments are moved will depend greatly upon the amount of resuspension of the sediments during dredging and transportation To minimize environmental impacts dredging and transportation techniques must be selected to minimize resuspenshysion of contaminated sediments
Surface sediments consist primarily of black organic silts and clays Vertical movement of PCBs within the fine-grained surface sediments is likely to be low Although the vertical extent of PCB contamination throughout the harbor is not precishysely known data indicate that PCBs are most concentrated in the top 10 cm and are not likely to be present in elevated conshycentrations at depths greater than about 1 m
-2shy
Surface sediments are most likely to be classified as Category Three Type C by the Mass Division of Water Pollution Control due to the excessively high contents of PCBs copper lead zinc chromium and other metals (Category Three) and due to the generally high percentage of silt clay oil and grease and water (Type C)
Assuming that an average of 2 ft of surface sediment is conshytaminated it is estimated that to remove 90 of the PCBs from the inner harbor would require dredging about 4-12 million cu yds of material removal of 90 of the PCBs from the outer harshybor would require dredging an additional volume of about 1-12 million cu yds of contaminated sediments
The primary dredging types include mechanical hydraulic and pneumatic Each of the three general dredging types could be used in an environmentally safe manner with the pneumatic and hydraulic dredge methods providing the least chance for resuspenshysion of sediments Watertight mechanical (clamshell) methods may also be environmentally safe when used in conjunction with silt curtains
Dredged material is transported generally by pipeline barge truck or rail depending on the dredge type and distance to the disposal site
Dredge spoils (and other materials) containing 50 ppro or greater of PCBs are regulated by the EPA EPA specifies three alternate disposal methods for such materials which include much of the harbor sediments (1) incineration (2) disposal in an approved chemical landfill and (3) some other disposal method approved by the EPA Regional Administrator
Incineration of dredged material is technically feasible but would likely be prohibitively expensive
There are at present no chemical landfills in New England approved by the EPA for disposal of PCB dredge spoils The closhysest approved chemical landfills are about 500 miles from the project area in New York State and disposal space in those cheshymical landfills is extremely limited Even if disposal space is available at the New York landfills transportation and disposal costs would likely be prohibitively expensive
Among the other disposal options the most feasible options at this time appear to be open water or land disposal at sites specially set aside for dredged spoils Land disposal in a proshyperly engineered clay encapsulated excavation or pile with leachate collection and treatment systems would provide adequate
-3shy
environmental isolation of contaminated sediments Open ocean dumping of sediments does not provide the level of containment as an encapsulated landfill but would remove the materials to a more remote environment
Although technical solutions are available it is impossible to recommend a specific dredging transportation and disposal option until a disposal site is identified This is because dredging and transportation techniques are directly tied to each other and to the ultimate disposal site
Further input from the public and the many federal state and local regulatory agencies will be required to select a disposal site or sites before meaningful recommendations regarding dredging and transportation techniques can be made Cost benefit analysis between several disposal site alternatives and associated dredging and transportation techniques should then be performed
-4shy
2 INTRODUCTION
21 Purpose
The purpose of this investigation was to identify feasible dredging techniques for the removal of contaminated sediments from the New Bedford Harbor and Acushnet River Estuary and to complement ongoing dredge spoil studies being made by state federal and private organizations in the area It was also the intent of this investigation to obtain more detailed knowledge about sediment characteristics in the -tidal flats north of the inner harbor and general knowledge about the rest of the harbor sediments (Figs 1 and 2)
22
This investigation was divided into two major tasks Task I consisted of collecting and analyzing available information on the physical and chemical characteristics of the contaminated sediments in the estuary In addition laboratory tests were performed on seven sediment samples which were obtained from the tidal flats near a historic source of contamination These tests included
a Bulk analysis for metals oil and grease shy
b Grain-size analysis
c Composite elutriate tests for metals oil and grease and PCBs
d Composite EP toxicity test
e Solid phase bioassay
The results of the laboratory testing program are discussed in detail in the Appendix
Task II consisted of a literature review to identify and evaluate available dredging techniques to provide preliminary recommendations on methodologies available to dredge and transport contaminated sediments from the estuary in an environshymentally safe manner In addition we took a general look at some of the options available for disposing of the dredged sedishyments
Funding for the collection of samples was provided by Massashychusetts Office of Coastal Zone Management
-5shy
23 Authorization
Work performed for this investigation was authorized by a contract dated June 24 1982 between the New England Governors Conference Inc and Geotechnical Engineers Inc
24 Background
The New England Governors Conference Inc (NEGC) with primary funding from the U S Water Resources Council and in kind services contributed by the five coastal New England states and New York has been charged with the task of concluding the New EnglandNew York Long Range Dredge Management Study origishynally begun by the former New England River Basins Commission The primary goals of the Dredge Management Program are to idenshytify and assess the effects of dredging on each state and region develop procedures for use by the states in setting priorities for dredging projects and develop long-range regional and subreshygional dredge management strategies As part of this program the NEGC in conjunction with the Massachusetts Office of Coastal Zone Management has elected to focus on investigating dredging techniques for the PCB-contaminated sediments in the New Bedford HarborAcushnet River Estuary
New Bedford Massachusetts is a port city located on Buzzards Bay approximately 55 miles south of Boston- With a population of 98500 New Bedford is Massachusetts fourth largest municipality
A major source of contamination in the harbor sediments is polychlorinated biphenyls or PCBs PCBs are a class of comshypounds produced by the chlorination of biphenyls and are registered in the U S under the trade name Aroclor PCB comshypounds are only slightly soluble in water lipids oils and organic solvents and are resistant to both heat and biological degradation They have been used principally in the electrical industry in capacitors and transformers (MDPW undated)
Extensive PCB contamination of New Bedford Harbor (Fig 1) was documented in 1976 when the Environmental Protection Agency conducted a New England-wide PCB survey and found high levels of PCBs in various harbor locations Testing revealed that two industrial operations were discharging wastewaters containing PCBs to New Bedford Harbor by direct discharge and indirectly via the New Bedford Municipal wastewater treatment facilityDischarge from one of the industrial operations has been nearly eliminated while discharge from the others has been signifishycantly reduced however the discharge of PCBs from New Bedfords municipal wastewater treatment plant remains significant Recent
-6shy
studies have shown that 300 to 700 pounds of PCBs are being discharged per year (Weaver 1982)
The area of PCB contamination extends from the northernmost extreme of the Acushnet River Estuary to an area in the vicinity of the New Bedford municipal wastewater outfall a distance of over six miles The Division of Water Pollution Control and Coast Guard have been mapping PCB concentrations in the Harbor and in Buzzards Bay (Acushnet River Estuary PCB Commission 1982) The sediments underlying the entire 985-acre inner harbor contain high levels of PCBs Most of the heavily contaminated sediment (greater than 50 ppm) is north of the 1-195 bridge and is found in the top 2 feet of the harbor sediments The harbor sediments contain PCBs in levels up to 190000 parts per million or 19 percent concentrations in the thousands of ppm are common in the tidal flats near the Aerovox Incorporated plant (Weaver 1982) These sediments exceed the federal hazardous waste crishyteria by several orders of magnitude
The water column in New Bedford Harbor has been measured to contain PCBs in the parts per billion range (well in excess of EPAs 1 part per trillion guideline) (Weaver 1982)
Widespread contamination of the Acushnet River Estuary environs has resulted in the accumulation of PCBs in many marine species Eighteen thousand acres have been closed to the harshyvesting of lobsters due to PCB pollution Lesser yet signifishycant areas are closed to the taking of finfish and shellfish Finfish in the area have been found to contain concentrations exceeding 150 ppm (The FDA standard for edible finfish and shellfish is 5 ppm) Limited human blood analyses suggest that the blood of heavy fish eaters and industrially exposed indivishyduals contain elevated levels of PCBs (Weaver 1982)
Concern over uptake and accumulation by most of these orgashynisms is directed to unknown chronic effects bioaccumulation in complex food webs and particularly chronic effects on human consumers Some of the effects on human health that may be attributable to low-level exposures to PCBs are abnormal fatishygue abdominal pain numbness of limbs swelling of joints chroshynic cough headaches dermatological abnormalities and anemia The International Agency for Research in Cancer believes that there is enough suggestive evidence to regard PCBs as carshycinogenic pending confirmatory evidence (Weaver 1982)
Because of the documented toxicity of PCBs and the demonstrated potential for their biological accumulation dredging transportation and disposal methods for sediments conshytaminated with high levels of PCBs must be selected to minimize further transport and biological exposure to these materials
bullSediment containing 50 ppm or greater of PCBs must be regulated by the EPA
-7shy
3 CHARACTERIZATION OF SEDIMENTS
31 General Geology
The seabed in the study area consists of the drowned valley of the Acushnet River which cuts a NNW-SSE trending trough from New Bedford Harbor to Buzzards Bay A drowned tributary of the Acushnet separates Sconticut Neck from the smaller ridge which forms Fairhaven Shoals Another drowned tributary of the Acushnet extends around Clark Point Peninsula and into Clark Cove The seabed in the estuary and harbor area is generally shallower than about 25 ft with the exception of the harbor chanshynel which is dredged to about 30 ft (Sumraerhayes 1977)
Test borings by the U S Army Corps of Engineers (ACE) indicate that bedrock in the area consists of granitic gneiss which is overlain by 8 to 9 ft of glacial till andor 6 to 9 ft of gravelly sediment These materials in turn are buried by varying thicknesses of sands and silts
Sediments are generally thinnest over topographic highs and thickest in troughs Where bedrock is deepest in the buried channel of the Acushnet and dredging has not occurred up to 60 ft of unconsolidated sediments have accumulated Sediment thicknesses in dredged areas are substantially thinner
32 Surface Sediments
Muddy sediments (silt and clay) cover the floor of the drowned valley of the Acushnet River and occupy topographic depressions while sand and gravel or bare rock occur on the subshymarine ridges- Surface sediments are usually darker finer-grained shellier and contain more organic matter than the buried sediments -The New England Division of the U S Army Corps of Engineers (unpublished report) analyzed 15 cores collected from the harbor and navigation channel and found that all of the samples examined except three were classified as a black orgashynically enriched silt with more than 70 percent fines (mud) (Summerhayes 1977)
As part of this investigation surface samples were obtained from the tidal flats north of the inner harbor (Pig 2) These samples consisted primarily of oily organic sandy silts Percent fines ranged from 45 to close to 100 and averaged over 75
The major depocenter of mud in the drowned Acushnet Valley is in the inner harbor (Zones A and B on Fig 1) Surface silts
Fines are soil particles that pass through a No 200 mesh sieve the openings of which are 74 microns (0074 ram) square
-8shy
are thickest near the head of the harbor north of the New Bedford-Fairhaven Bridge where there is up to 15 ft of dark organically enriched silt Much of the navigation channel is floored with muddy sediment except near the hurricane barrier where sandy sediments occur probably because tidal currents are strong enough to prevent the settling of fines Organic muds in the navigation channel are believed to contain substantial amounts of gas produced by the decay of organic matter Similar organically enriched muds form a low mound around the sewer outshyfall off of Clark Point (Summerhayes 1977)
On the ridge crests and on the steeply sloping margins of the outer harbor are fine sands and gravels Where gravel-sized material is present in muddy samples it is usually in the form of whole or fragmented mollusk shells These coarse deposits and the muddy sediments flooring the depressions are separated in several places by narrow transitional zones where muddy sands and muddy gravels occur These transitional sediments take the place of muds in the depressions that run up into Clarks Cove and east of Fairhaven Shoals
33 Sedimentation Rates
Summerhayes 1977 states that silt and clay are being transported into the estuary in suspension by landward-moving bottom currents that are driven by wave and tidal energy These fine sediments come from Buzzards Bay but may originate out on the continental shelf Before the entrance to the harbor was almost completely blocked by a hurricane barrier these sedishyments were accumulating in the harbor at rates of about 1-2 cmyr in the deeps and less than 05 cmyr in the shallows Construction of the barrier in 1966 reduced the efficiency of tidal flushing causing the rate of siltation to increase The present rate of sedimentation in the deeper portions of the harshybor is estimated to be 4 cmyr (Summerhayes 1977)
34 PCS Contamination
PCB was formerly discharged at two locations in New Bedford One discharge was on the west side of the Acushnet River north of the Coggeshall Street Bridge The second discharge was south of the hurricane barrier on the west side of the outer harbor Quantities of PCBs are at present being discharged in effluent from the New Bedford Wastewater Treatment Plant on Clark Point (Weaver 1982)
Biota exhibit the highest PCB levels in the harbor area and decreasing levels seaward The median PCB values of lobsters and bottom feeding fish in the harbor area are greater than the
-9shy
FDA limit of 5 ppm wet weight Outside the harbor area median PCB values generally drop below the FDA limit although many samples still exceed 5 ppm (Malcolm Pirnie 1981)
The geographical extent of the PCB contamination in the harbor and into Buzzards Bay and the depth of the contamination vertically into the sediments is not precisely known Howeverf sampling and PCB testing conducted by the U S Coast Guard Providence RI confirm extremely high levels of PCBs in the top 10 cm of surface sediments of the tidal flats (Fig 2) near a historic PCB source area north of the inner harbor The greatest concentrations of PCBs appear to be located in the tidal flats near Aerovox in the channel north of the Coggeshall Street Bridge on the west side of the inner harbor near Popes Island on the east side of the inner harbor near Fairhaven Marine in the flats southwest of Palmer Island in the northwest portion of the outer harbor and in the sediments at the end of the wastewater treatment plant outfall (Malcolm Pirnie 1981)
Sufficiently extensive sampling has not yet been completed to determine the precise extent of PCB distribution in the estuary and harbor Therefore a meaningful PCB concentration contour map could not be prepared However it is known that PCBs are strongly bound to the solid phase in typical sediment-water systems and have an affinity for fine-grained sediments Therefore it is reasonable to expect that major concentrations of PCBs will be present where there are significant accumulashytions of fine-grained sediments ie the deeper parts of the harbor
Malcolm Pirnie Inc 1981 estimated volumes of conshytaminated bed material in the Acushnet River-New Bedford Harbor area based on a depth of contamination of 2 ft and a depth of removal by dredging of 3 ft Dredged material volumes and PCB recovery for inner and outer harbor dredging are presented on Table 1
35 Metals
Heavy Metals Distribution - The sediments in New Bedford Harbor and the navigation channel contain significant quantities of heavy metals resulting from industrial discharges The most enriched sediments are surface deposits of silt and clay The large surface areas of these fine-grained particles tend to adsorb pollutants and incorporate them into the sediment (Summerhayes 1977)
As part of this study bulk analyses of surface sediments were performed on 14 sediment samples collected from the tidal
-10shy
flats In the Acushnet River Estuary in the vicinity of a historic source of contamination as discussed in the Appendix
The results of the bulk analyses indicate high conshycentration of metals at all but 2 of the 14 sampling stations (Table 2) Particularly high concentrations of copper lead and zinc were found at eight stations cadmium and chromium at six stations Concentrations of zinc exceeded 3500 ppm (dry weight) at four stations copper exceeded 1000 ppm at three stations and lead equaled or exceeded 1000 ppm at three stations
This data correlates well with data by Summerhayes 1977 who found that the principal contaminants in the inner harbor are copper chromium lead and zinc Copper was the most abundant metal Chromium copper and zinc were reported to locally comprise more than one percent of the dry weight of sediments in the harbor The Division of Water Pollution Control sampling data indicate that the sediments just north and south of the Coggeshall Street Bridge are most enriched by metals Copper occurs in greatest concentrations just south of the bridge in close proximity to a metal discharge on the western bank Near the Coggeshall Street Bridge as much as 8054 parts per million of copper was in one sample The thickest copper-rich deposits are in deeper parts of the harbor the copper-rich deposits are thinner in shallower areas and seaward (Summerhayes 1977)
The navigation channel also contains metal-enriched sedishyments although not at levels as high as the inner harbor Moving away from the channel metal concentrations in sediments indicate no enrichment above typical background levels measured in central Buzzards Bay (Malcolm Pirnie 1981)
Although there is a net landward movement of silt and clay in bottom currents contaminated sediments still slowly migrate from the harbor probably by eddy diffusion of resuspended parshyticles Summerhayes 1977 estimates that 24 percent of the metals discharged into the inner harbor have been transported to Buzzards Bay by this mechanism and have formed a carpet 10 to 20 cm thick in some areas of Buzzards Bay
36 Classification
The Massachusetts Division of Water Pollution Control has adopted certain criteria for classifying dredged material based on chemical and physical characteristics These criteria were adopted in 1978 to provide interim guidance for the evaluation of dredging and dredge material disposal projects in Massachusetts waters
-11shy
Table 3 presents the classification of dredge spoils by chemical constituents and Table 4 presents classification by physical characteristics
Based on the excessively high content of PCBs copper lead zinc chromium and other metals most of the estuary and harbor surface sediments would be classified Category Three on Table 3 the generally high percentage of silt clay oil and grease and water would classify the sediments as Type C on Table 4
37 Impacts on Dredging and Transportation
The presence of PCBs and heavy metals in sediments raises concern about the release of these materials into the environment and their effects on public health and environmental quality However under most conditions PCBs and heavy metals are only slightly soluble in water easily adsorbed from aqueous solushytions and strongly held in place by fine-grained sediments Therefore the mobility of these contaminants when sediments are moved will depend greatly upon the amount of resuspension of the contaminated sediments during -dredging and transportation which in turn will vary with the dredging and transportation techshyniques employed
All types of dredging cause agitation and some resuspenshysion of sediments The increased suspended load in nearby waters can create a threat to water quality because of the presence of heavy metals and PCBs Resuspended PCBs tend to concentrate in organic materials such as wood chips and oils and form a scum on the waters surface Because the harbor sediments contain such materials PCBs will be released into the water column during the dredging process The magnitude of this release will depend upon the amount of sediment disturbance and resuspension that takes place Dredging and transportation techniques must be selected to minimize resuspension of contaminated sediments thereby minimizing environmental impacts
Table 5 identifies the normally approvable techniques for dredging filling placing and disposing of dredged materials of various classifications From Table 5 we see that for Category Three Type C material the normally approvable methods of dredging are hydraulic and mechanical Normally approvabledisposal methods include pipeline andor barge sidecast disposalwill not normally be approvable
The relative merits of these and other less common dredging and transportation techniques are discussed in Chapters 4 and 5
-12shy
4 DREDGING
The types of dredges in use today can be divided into three categories mechanical hydraulic and pneumatic Descriptions of these three types are presented below with discussions about their applicability to the cleanup of the New Bedford Harbor
When assessing the various methods it is important to understand that dredging contaminated sediments is a specialized form of dredging The objective is to completely remove a speshycified layer of material while minimizing resuspension of material into the water column It is also desirable to minimize the quantity of material to be transported and handled at the disposal site
41 Mechanical Dredges
Mechanical dredges include the dipper clamshell chain bucket and dragline dredges (Figs 3 and 4) The common feature of mechanical dredges is that they dig into and scoop up the sediment Mechanical dredges are typically barge-mounted and use a derrick and system of cables for maneuvering the scoop The dredged material is lifted above the waterline and is generally deposited into a hopper barge
The primary advantage of dredging sediments by mechanical methods is the relatively small disturbance to the dredged material caused by the dredging ie the sediments are not thoroughly stirred up and mixed with free water This reduces the total amount of material to be handled and transported Mechanical dredging also reduces the amount of contaminated water to be treated and reduces or possibly eliminates the need for an intermediate settling basin before final disposal
However conventional mechanical dredges have several major disadvantages which generally preclude their use for conshytaminated sediment removal The scoops or buckets are open at the top and leak at the bottom so that there is generally a significant amount of spillage and resuspension of contaminated sediment as the dredge material is lifted up through the water column Also it is difficult to control the location and depth of penetration of the scoop bucket when it is operated by cables This results in uneven removal of the contaminated sediment layer
There have been recent attempts to modify the mechanical dredging system to overcome these disadvantages For example
-13shy
Mitsubishi Steel Mfg Co Ltd has developed a closed-type clamshell bucket designed specifically for contaminated sediment removal (Fig 5) It uses hard rubber seals along the shell edges to prevent leakage and according to a company brochure has a cover (presumably to minimize spillage) and a built-in mechanism to prevent overdredging It is not known whether the specialized clamshell has been used in an application similar to the proposed New Bedford Harbor cleanup
42 Hydraulic Dredges
Hydraulic dredging is performed by disturbing the dredge material with an auger or cutterhead mixing it with water to form a slurry and pumping the slurry to a disposal or transfer site Often mudshields or dustpans are mounted at the intake to reduce the amount of turbidity Hydraulic dredges are usually barge-mounted Passes are made by either swinging the intake in a series of arcs or by advancing the barge in a straight line Common types of hydraulic dredges include cutterhead plain sucshytion dustpan sidecaster hopper and Mudcat (Figs 6 and 7)
Hydraulic dredging is generally the least expensive form of dredging and if controlled can yield relatively low turshybidity in the water column Hydraulic dredging also affords greater control over the location and depth of cut particularly for the straight pass setups as compared to the mechanical dredge
The major disadvantage of hydraulic dredging is the requirement to mix approximately four parts water to one part sediment to form a pumpable slurry This results in a large quantity of contaminated water-soil mixture to be transported and contained Elutriate tests conducted for this study show that excess water will contain large amounts of PCBs adsorbed to parshyticles in suspension Therefore intermediate settling basins and the use of flocculents and water filtration equipment will likely be required to render excess water acceptable for discharge back to the environment
The ability to effectively separate the contaminated sedishyment from the excess water has been demonstrated in the Duwamish Waterway cleanup which is discussed in Section 7 A case history which involves the proposed use of a dustpan hydraulic dredge is also discussed in Section 7 under the section James River Virginia
43 Pneumatic Dredges
Pneumatic dredges use unbalanced hydrostatic head to draw sediment and some water into a submerged containment chamber
-14shy
Compressed air is then used to discharge the sediment into a pipeline to the surface With this method the sediment has conshysiderably less water mixed with it than with hydraulic methods The pneumatic dredge may be suspended from a barge or as discussed in a case study below mounted on a submerged tractor Two commercially available pneumatic dredges are the Amtec Pneumatic Pump dredge originally developed in Italy (Fig 8) and the Oozer Pump dredge developed in Japan (Fig 9)
In addition to the lower quantity of water used in the slurry pneumatic dredges produce relatively low turbidity in the water column Pneumatic dredges also afford good control over the location and depth of cut
The major disadvantages of the pneumatic dredge may be cost and availability Due to the limited experience with pneumatic dredging in this country another disadvantage may be the requirement to provide special training for the work crews at the site
A well-documented cleanup of PCBs using a pneumatic dredge occurred in 1976 in the Duwamish Waterway in Seattle Harbor A second cleanup using pneumatic methods is currently underway in California Both of these case histories are discussed in Section 7 For more details on the various mechanishycal hydraulic and pneumatic dredges available refer to Malcolm Pirnie 1978
44 Silt Curtains
Under certain conditions silt curtains can be used around dredging and disposal operations to contain turbid water Silt curtains are impervious vertical barriers that extend from the water surface to about 1 ft above the sediment level The curshytains typically consist of a flexible nylon-reinforced vinyl fabric that is suspended from a system of floats at the water surface The bottom edge of the curtain is held down by weights
Experience with several installations (JBF Scientific 1976) has shown that when the water current is less than 05 knots the turbidity in the water column outside the curtain can be up to 90 less than the turbidity inside the curtain Silt curtains can be used in currents up to 10 knot however they become much less effective While tidal currents are reported to be as high as 122 cmsec (24 knots) through the harbor entrance (Summerhayes 1977) the use of silt curtains could be considered in those areas of the New Bedford Harbor having current speeds less than 10 knot These areas would have to be determined by an additional investigation
-15shy
5 TRANSPORTATION OF DREDGED MATERIAL
Once dredged the contaminated sediment must be transported safely and efficiently Due to the high cost of long distance transport disposal sites which are located more than a few miles away will require the construction of nearby intershymediate rehandling sites The intermediate sites will be used for separating and treating supernatant water and consolidating the solids Several nodes of transport are discussed below
51 Floating Slurry Pipeline
If hydraulic or pneumatic dredging is used the primary transport mode will be via a floating slurry pipeline Booster pumps may be required along the pipeline to help move the material
When crossing a channel it will be necessary for the pipeline to be depressed to avoid interference with boat traffic Methods for the immediate detection of leaks will need to be developed and the equipment necessary for repairs will need to be readily available Joints between sections of pipe will need to be securely tightened and leak tested The pipeline will need to be anchored securely to prevent excessive deflection caused by wind and currents Also the pipeline will need tobe strong enough to withstand moderate storm conditions During large storms it will be necessary to shut down operations
52 Barge
Barges will be used in conjunction with mechanical dredging to transport material from the dredge to the intershymediate rehandling site or to the final disposal site if it is located near the coast Barges may also be used for transporting between the rehandling site and the final disposal site Barges are not normally used to receive material from hydraulic dredges due to the large quantities of dredged slurry to be handled
Barges can be loaded and unloaded either mechanically as with a crane and clamshell or by hydraulic pumping During loading and unloading care must be taken to avoid spillage over the sides of the barge The holding compartments on each barge must be watertight and covered Bottom dump barges are not suitable for transporting contaminated sediment
53 Truck or Rail
If the final disposal site is located inland trucks or rail cars can be used The trucks will be either tank trucks or
-16shy
large dump trucks rail cars may be either tank cars or hopper cars All trucks or rail cars roust be watertight and covered Frequent checks for leaks on the gates or valves will be required
Hopper cars or dump trucks will be loaded and unloaded mechanically tankers will be loaded and unloaded hydraulically The ability to pump the waste after rehandling will thus affect the selection of tank cars Provisions to clean the exterior of each truck or rail car of any spilled sediment or water before leaving the rehandling or disposal site will be required
-17shy
6 DISPOSAL OPTIONS
euro1 General
Three alternate disposal methods are specified by the EPA for material containing PCBs in concentrations of 50 parts per million to 500 parts per million such as exist in New Bedford-Fairhaven Harbor These methods are incineration disposal in an approved chemical landfill and use of some other disposal method which is approved by the EPA Regional Administrator for the region in which the PCBs are located For other disposal methods applications to the Regional Administrator must indicate that disposal by incineration or cheshymical landfill are not reasonable and that the alternate disposhysal method proposed will provide adequate protection to health and the environment
62 Incineration
Incineration of dredged material is technically and environmentally possible but prohibitively expensive In studies conducted by the New York State Department of Environmental Conservation concerning the cleanup of PCB-contaminated sedishyments it was found that fuel costs alone for the incineration of sediments would have been about $10 per yard TheU S EPAs consulting engineer on the PCB sediment cleanup project in Waukegan IL investigated several incineration technologies and reported that costs for incineration could be well in excess of $100 per cubic yard To remove 90 of the PCBcontamination in the inner harbor would require dredging about 4-12 million cubic yards Further it is believed that available technology would require extensive testing and development to meet EPA requireshyments and transport to a suitable incinerator would increase exposure of the environment to contaminants Incineration therefore is not likely to be a feasible alternative for disposhysal
63 Chemical Landfill
There are eight landfills in the United States which are aproved by the Environmental Protection Agency for disposal of PCB solids which includes dredge spoils There are none in New England The Commonwealth of Massachusetts is currently investishygating a hazardous waste landfill for Massachusetts The possishybility of locating a landfill site exclusively for this project independent of the statewide effort seems unlikely
The closest approved landfills to the New Bedford site are in New York State One is located in Niagara Falls and is
-18shy
operated by SECOS International Incj the other is in Model City and is operated by SCA Chemical Systems Inc Both are approxishymately 500 miles from the project site
The availability of disposal space is extremely limited For example the SECOS facility has currently opened for use a secure landfill cell which is only three acres in size Only a small portion of this area is set aside for PCB-contaminated materials The material disposed of in this facility is usually highly concentrated industrial wastes packed in metal drums for stacking and burial Because of the great demand for disposal sites and the extensive regulatory procedures involved disposal costs would be very high
64 Other Disposal Options
a Biodegradation
Biodegradation was considered as a disposal option for both the Hudson River and Waukegan IL PCB sediment cleanup programs It was found that the possibility of using naturally occurring micro-organisms to reclaim PCB-contaminated dredged spoils was an unproven technology and that sufficient information does not exist to properly assess the feasibility of biodegradashytion as a disposal alternative (U S EPA 1981 and HDPW 1980)
b Open Ocean
Open water disposal of dredged material is commonly practiced in all of the New England Coastal states However under Massachusetts regulations open ocean disposal of Type III-C dredged material is permitted only at low energy silty sites and this only after bioassay performed in accordance with established EPA procedures indicates no significant biological impact If a significant biological impact is found this material is unsuitable for open water disposal A bioassay conducted with sediments from the tidal flats area north of the Inner Harbor indicated a significant biological impact However these materials are the most highly contaminated and would likely be mixed with other less contaminated sediments for disposal As no bioassay data are as yet available for the bulk of the conshytaminated sediments the ocean disposal option should not be precluded
Given the compelling necessity to find a suitable disposal option and the scarcity of viable options and disposal sites ocean disposal may turn out to be a feasible disposal option Adverse environmental effects associated with ocean dumping can be minimized by capping with relatively unconshy
-19shy
taminated materials Further discussion of ocean disposal of contaminated material can be found in Refs 5 15 16 19 20 and 21
c Land or In-Harbor Disposal with Bulkheading
In Massachusetts disposal of Category Three Type C dredge spoils is generally restricted to land or in-harbor disposhysal with bulkheading Contaminated sediments could be contained in a specially engineered encapsulation or contained landfill in such a manner that it is permanently removed from the environshyment This was found to be the most practical method of disposal for the Hudson River cleanup program (Section 7) Major conshysiderations in the design of the Hudson River encapsulation included an impermeable clay dike subgrade and cover with a leachate underdrain collection and treatment system (Fig 10) The relatively impermeable clay materials provide a natural barrier to the migration of water and also provide an excellent barrier to PCS migration as PCBs are known to adhere strongly to fine-grained sediments The leachate underdrain system provides an excellent method of monitoring the performance of the system and of ensuring collection of any percolating contaminants
At the present time no hazardous waste disposal sites are licensed in the Commonwealth However technically upland disposal or temporary storage is a viable disposalalternative for the New Bedford Harbor dredging Preliminary examination of the geohydrologic characteristics of surficial soils indicate that relatively impermeable glacial tills occur along the harbor and extend inland for some distance These materials would likely provide sufficient liner materials for encapsulation due to a high percentage of fines which tend to hold PCBs and decrease permeability Using proper materials and employing design features such as impermeable liners and covers leachate collection and treatment systems settling ponds flocculants and water filtration systems it is likely that one or several effective permanent disposal or temporary storage facilities could be constructed in the New Bedford area
The major problem associated with upland disposal is the absence of a nearby undeveloped open land site large enough to contain the dredge spoils As shown on Table 1 to remove 50 of the PCB contaminated sediments from the inner harbor alone would require storage space for 400000 cubic yards of dredged materials This number would be significantly larger if hydraulic dredging were used as spoils would be mixed with about four parts water to one part sediment
Removal of 90 of the sediments from the inner harbor would require upland storage space for 3500000 cubic yards of
-20shy
dredged materials Again this number would be significantly higher for hydraulic dredge methods A disposal pile 20 ft high would cover at least 108 acres
No upland sites of this size are believed to be available adjacent to the harbor Transporting such large volushymes to sites just outside the harbor area may be cost prohibitive or environmentally unacceptable but should be considered in more detail In addition in-harbor disposal with bulkheading should be considered
-21shy
7 CASE HISTORIES IN CONTAMINATED SEDIMENTS
71 Upper Hudson River New York
Several studies have been recently made to evaluate the feasibility of dredging PCB-contarainated sediments along a 40 mile stretch of the Upper Hudson River (Refs 9 14 23 24 28 29 30 31) The sediments consist primarily of silty sand
For a full dredging effort the total volume of conshytaminated material to be removed is 14500000 cu yds The methods of dredging being considered include the hydraulic cutshyterhead dredge and the mechanical clamshell dredge Cost estimashytes for full dredging which is estimated to achieve 91 to 97 recovery of all PCBs from the study area range from $158 to 306 million (1978 costs) Partial dredging of hot spots (areas with PCS concentrations greater than 50 ppm) is estimated to cost $21 million at 1978 costs Partial dredging will result in the removal of about 36 of the PCBs in the study area with a total volume of dredged contaminated material estimated at one million cubic yards
Land disposal methods are being considered for the final disposal of the spoil Major considerations in the design of the Hudson River project include complete encapsulation with an impermeable clay dike subgrade and cover with a leachate drainage collection and treatment system (Fig 10) Forty potenshytial disposal sites with a total area of 3200 acres have been identified for a full dredging effort The land requirement for contaminated material from the hydraulic system is estimated to be 1120 acres The mechanical system has been estimated to require approximately 720 acres Return flow treatment processes similar to those used for the Duwamish Waterway project are being considered for the supernatant water (Section 73)
72 Waukegan Harbor Illinois
The sediments in Waukegan Harbor Lake Michigan contain some of the highest known concentrations of PCBs in the country with measured concentrations up to 250000 ppm (25) (US EPA 1981) The contaminated sediment area is about 37 acres
The sediments consist of a top soft muck layer an intermediate sand layer and an underlying silty clay layer The muck layer ranges in thickness from 0 to about 105 ft Most of the PCBs are contained in the muck layer and available data show that the contamination extends through the entire thickness of the layer The EPA estimates a total volume of 168000 cubic
-22shy
yards of sediment to be removed This includes all sediment with PCB concentrations greater than 10 ppro
The EPA has proposed that the harbor be dredged by either hydraulic or pneumatic methods Silt curtains would be used to isolate the dredging area The dredged spoils will be transported via pipeline to temporary settling lagoons where it would be dewatered Excess water will be treated to remove resishydual PCBs and returned to the harbor containing PCB conshycentration less than Ippb The dewatered sediments will be removed to a permanent storage facility
Lagoon construction will be similar to that of a secure landfill with impermeable clay liners and leachate collection systems A 6-in-thick layer of sand is being considered for placement above the clay liner to facilitate dewatering of the sediments
Water treatment will consist of (1) settling of the sedishyments in the lagoon (2) allowing excess water to overflow a weir placed at one end of the lagoon into a smaller sedimentation basin where a polymer will be added to coagulate and settle fines (3) pumping the sedimentation basin water through pressure filters and (4) conveying filter effluent through carbon filters to a clear well The water in the clear well will be monitored for PCB content before it is returned to the harbor A 1 ppb limitation of PCB concentration for water returned to the harbor will be maintained
Ultimate disposal plans include a below-ground option with a 5- to 10-ft-thick recompacted clay liner a leachate collection system and treatment system and a 3-ft-thick clay cap surfaced with bituminous pavement or concrete for use as a parking lot The entire facility would be surrounded by a 2-12-ft-thick concrete slurry wall to permit dewatering of the site during excavation (30 ft below ground surface) and to act as an addishytional barrier to contaminant migration
An alternative secure storage facility considered for the Waukegan project included construction of secure lagoons to a height of about 35 ft above ground with similar liners caps and leachate collection systems This above-ground option wouldminimize leaching over time minimize site disruption and material handling and eliminate the need for a slurry wall Disadvantasges of this approach are its relative unsightliness the need for permanent dedication of property to this use only and a long-term maintenance requirement
The estimated cost for the proposed dredging operation including dewatering water treatment loading onto trucks and
-23shy
site restoration is about $10 million Disposal costs would add $6 to $33 million to this amount (1981 costs)
73 Duwaroish Waterway Seattle Harbor Washington
A Pneuma Model 600 pneumatic dredge mounted on a pivoting spud barge was used in 1976 to remove 80-90 of an estimated 27000 cu yd of PCB-contaminated sediment in the Duwamish Waterway in Seattle Harbor The contamination occurred at the end of a pier when a transformer containing PCB was dropped during barge loading The overall area requiring dredging was about 350000 sq ft (8 acres) The depth of dredging was about 2 ft over most of the contaminated area with depths up to 10 ft at the point of spill The complete operation lasted slightly less than two months
Turbidity was monitored downstream during the dredging operation by the University of Washington Department of Oceanography Their final report indicated that the dredging cleanup caused no significant dispersion of PCB into the Duwamish Harbor and estuary
The Pneuma Model 600 was supplied by Amtec Development Company of Chicago Illinois The dredge along with 2000 ft of 10-in ID discharge pipe was transported from Chicago to Seattle by truck The dredge was mounted onto a small boat which was attached perpendicularly to a 120-ft-long pivoting spud barge This enabled the dredge to swing in a large arc during each dredge cut The propellers of the small boat were used to maneuver the dredge back and forth The width of the intake on the pneumatic dredge was 10 ft
The contaminated slurry was mixed with a flocculant (Nalco 17134) and discharged into specially prepared disposal pitslocated approximately one half mile south of the spill The flocculant decreased the settling time of the solids After the solids were settled the supernatant water was run through a Pilterite 1264 MSO filter and an activated charcoal filter It was then discharged back into the Duwamish River Testing by the EPA indicated that general PCB concentration in the sludge was 8-10 ppm The concentration in the supernatant water was 4 partsbillion prior to filtering and 50 partstrillion after filtering
74 California Aqueduct
A large pneumatic dredging operation by the State of California Department of Water Resources is presently underway to remove asbestos-contaminated sediment from the California
-24shy
Aqueduct (Ref 12) The dredged length of the aqueduct is approximately 150 miles The width is approximately 100 ft The volume of material to be dredged is about one million cubic yards
A pneumatic dredge mounted on a remote-controlled undershywater tractor is being used for the dredging Production is presently about 290 cu ydhr with an on-line time of about 20 hrday The dredged material is transported via B-l2-in-ID PVC pipe into disposal pits which have been excavated alongside the aqueduct The free water content of the slurry is about 40 to 55 Turbidity caused by the dredging as measured at monishytoring stations up- and downstream from the dredge has been minimal For this type of contaminant treatment of the water and dredged spoils was deemed unnecessary The water is allowed to percolate through the disposal pits and the pits are covered with fill and planted
The depth of water is about 28 ft The tractor is remote-controlled by a cable which extends from the tractor to ground surface The location of the tractor is monitored by sonar Sensors are mounted near the intake structure of the pneumatic pump to monitor the depth of cut during each pass
Overall operating costs are currently (1982) running about $8 to $10cu yd Since this includes the initial-development costs this figure is expected to come down to about $4 to $5cu yd If a dredging system similar to this is considered for the New Bedford Harbor the added cost of more complex disposal methods must be considered
75 James River Virginia
A study is currently underway by the Norfolk District Corps of Engineers to compare the dredging performance of two types of hydraulic dredges for the removal of sediments in the James River Virginia (Refs 8 34) The sediments have been contaminated with the toxic pesticide Kepone The two dredges to be compared for efficiency are the dustpan and the cutterhead hydraulic dredges The dustpan dredge will be a cutterhead dredge that has been equipped with a 28-ft-wide dustpan and modified for straight line dredging The cutterhead dredge will be a conventional unit using a rotating cutter and making swing arc cuts rather than straight line swaths Both dredges will be maneuvered with a system of cables and winches
A preliminary ACE report by Vann (undated) identifies several advantages of the dustpan dredge Among them are straight line method of dredging constant width of cut constant
-25shy
dredging speed at constant winch speed accurate control of dredging depth maximum containment of material and reduced turshybidity The disadvantages of the dustpan noted in the report were dredging accuracy is difficult to control in soft materials tidal fluctuations necessitate the use of stern anchors and water jets used to break up sediment at the intake cannot be used since the material to be dredged (in the James River) is too soft with a water content of approximately 200 percent
The final results of this comparison have not been published to date
76 Contacts For Case Studies
The following individuals provided much of the information contained in this report regarding the case studies discussed in this section Their assistance is gratefully acknowledged
1 Upper Hudson River New York
James DeZolt State of New York Engineer NYSDEC Room 321 50 Wolf Road Albany NY 12233 518-457-5850
Dr T J Tofflemire New York Dept of Environmental Conservation Bureau of Water Research 50 Wolf Road Albany NY 12233 518-457-7470
Judy Bedard Malcolm Pirnie Inc 2 Corporate Park Drive Box 751 White Plains NY 10602 914-694-2100
-26shy
2 Waukegan Harbor I11inois
Tony Rutter USEPA Region 5 Remedial Response Branch 111 H Jackson Blvd Chicago IL 60604 312-886-6216
Greg Vanderlaan USEPA Region 5 111 W Jackson Blvd Chicago IL 60604 312-886-6217
3 Duwamish Waterway Washington
Joseph BlazevichUSEPA Region 10 1200 6th Avenue Seattle WA 98101 206-442-5840
Dr Spyros Pavlou JRB Associates 13400-B Northup Way Suite 38 Bellevue WA 98005 206-747-7899
Leonard A Juhnke U S Army Corps of Engineers P O Box C-3755 Seattle WA 98124 206-764-3400
4 California Aguaduct
Clifford Lucas State of California Dept of Water Resources P O Box 388 Sacramento CA 95802 916-445-2222
David Harris AMTEC Development Company1550 Berkeley RoadHighland Park IL 60035 312-831-9410
-27shy
James River Virginia
Richard Klein U S ACE Dredging Management Branch 803 Front Street Norfolk VA 23510 804-441-3616
Roger Pruhs U S ACE Dredging Management Branch 803 Front Street Norfolk VA 23510 804-441-3130
-28shy
8 CONCLUSIONS
In this report we have focused on the technical issues associated with dredging the PCB-contaminated sediments of the New Bedford Harbor area We have not addressed the many politishycal issues affecting the cleanup project
Technically environmentally safe methods are available for dredging transporting and disposing of the PCB-contaminated harbor sediments Each of the three general dredging types could be used in an environmentally safe manner with the pneumatic and hydraulic dredge methods providing the least chance for resuspenshysion of sediments Watertight mechanical (clamshell) methods may also be environmentally safe when used in conjunction with silt curtains Transportation methods will depend upon the dredging method used as discussed in Chapter 5
Of the disposal options land disposal in a properly engishyneered clay encapsulated excavation or pile with leachate collecshytion and treatment systems will provide adequate environmental isolation of contaminated sediments However no hazardous waste landfills are licensed in the Commonwealth at the present time Contaminated sediments could also be dumped in the ocean and covered with uncontaminated sediments While this option does not provide the same level of containment as an encapsulated landfill and would involve resuspension of some contaminated materials it has the advantage of removing the materials from the densely populated New Bedford area to a more remote environshyment
Although technical solutions are available it is impossible to recommend a specific dredging transportation and disposal option until a disposal site is identified This is because dredging and transportation techniques are directly tied to each other and to the ultimate disposal site
Further input from the public and the many federal state and local regulators will be required to select a disposhysal site or sites before meaningful recommendations regarding dredging and transportation techniques can be made Cost benefit analysis between several disposal site alternatives and associated dredging and transportation techniques should then be performed
-29shy
9 REFERENCES
1 Acushnet River Estuary PCB Coimaissionr Minutes of Meeting June 29 1982 IDC Conference Office New Bedford MA
2 Amtec Development Co Model 36 Pneumatic Pump brochure 1981
3 Blazevich J K et al Monitoring of Trace Constituents During PCB Recovery Dredging Operations-Duwamish Waterway U S EPA Region X Surveillance and Analysis Division Laboratory Branch August 1977
4 Brown M P PCB Desorption from River Sediments Suspended During Dredging - An Analytical Framework NY Dept of Environmental Conservation April 1981
5 Gambrell R PI Khalid R Ai and Patrick W H Jr Disposal Alternatives for Contaminated Dredged Material As a Management Tool to Minimize Adverse Environmental Effects Louisiana State University Center for Wetland Resources for U S Army Engineers Waterways Experiment Station Technical Report DS-78-8 December 1978
6 Griffin R A and Chian E S K Attenuation of Water-Soluble Polychlorinated Biphenyls by Earth Materials Illinois State Geological Survey Division Urbana Illinois Environmental Geology Notes Number 86 October 1979
7 Hafferty A J Pavlou S P and Bom W Release of Polychlorinated Biphenyls (PCB) in a Salt-Wedge Estuary as Induced by Dredging of Contaminated Sediments The Science of the Total Environmental 8 pp 229-239 Elsevier Scientific Publishing Company Amsterdam The Netherlands 1977
8 Bailer D L Demonstration of Advanced Dredging Technology-Dredging Contaminated Material Kepone James River Virginia Norfolk District U S Army Corps of Engineers undated
9 Betling Lj Horn Ej and Tofflemire J Summary of Hudson River PCB Study Results New York State Dept of Environmental Conservation Technical Paper 151 April 1978 revised July 1978
10 Johanson E E Bowen S Pj and Henry Gj State-of-the-Art Survey and Evaluation of Open-Water Dredged Material
-30shy
Placement Methodology JBF Scientific Corporation for U S Army Engineer Waterway Experiment Station Environmental Effects Laboratory Contract Report D-76-3 April 1976
11 Jones R A and Lee G P Evaluation of the Elutriate Test as a Method of Predicting Contaminant Release During Open-Water Disposal of Dredged Sediments and Environmental Impact of Open-Water Dredged Material Disposal Dept of Environmental Chemistry University of Texas at Dallas for U S Army Waterways Experiment Station August 1978
12 Lucas Clifford - Chief of Civil Maintenance for the State Water Project California Dept of Water Resources Sacremento CA telephone conversation with Roger Brewer Engineer Geotechnical Engineers Inc July 14 1982
13 The Mahoosuc Corporation and Arthur Lerman Associates A Dredge Management Study for the State of Maine - Volume I shyProject Report prepared for Maine Dept of Environmental Protection Augusta Maine May 1982
14 Malcolm Pirnie Inc Dredging of PCB-Contaminated River Bed Materials Upper Hudson River New York N Y State Dept of Environmental Conservation Vols I-III January 1978
bull
15 Malcolm Pirnie Inc Draft Report The Commonwealth of Massachusetts Acushnet River Estuary PCB Study Mass Division of Water Pollution Control Boston MA June 1981
16 Massachusetts Dept of Public Works Environmental Assessment-Replacement of the New Bedford-Fairhaven Bridge New Bedford Massachusetts U S Dept of Transportation and Federal Highway Administration undated (est 1980)
17 Massachusetts Division of Water Pollution Control Regulations for Water Quality Certification for Dredging Dredged Material Disposal and Filling in Waters of the Commonwealth adopted August 28 1978
18 Mitsubishi Steel Mfg Co Ltd Mitsubishi Grab Buckets brochure with cover letter dated December 3 1981
19 New England River Basins Commission Interim Plan for the Disposal of Dredged Material From Long Island Sound August 1980
20 New England River Basins Commission Dredging Management Data and Analysis for the New EnglandLong Island Sound
-31shy^
Regionr Dredging Management Program - Long Range Dredging Study September 1981
21 New England River Basins Commission Narrangansett Bay Case Study Technical and Institutional Constraints to Land and Nearshore Disposal of Dredged Material from Narrangansett Bay Dredging Management Program September 1981
22 New Englcnd River Basins Commission The Dredging Dilemna System Problems and Management Solutions co New England Governors Conference September 1981
23 New York Dept of Environmental Conservation Hudson River PCB Study Description and Detailed Work Plan -Implementation of PCB Settlement Technical Paper No 58 Revised January 1979
24 New York Dept of Environmental Conservation The Hudson River PCB Reclamation Project - An Update undated
25 Pavlou S P and Horn W PCB Removal from the Duwamish River Estuary Implications to the Management Alternative for the Hudson River PCB Cleanup in Annals of the New York Academy of Sciences Vol 320 pp 651-671 1979
26 Pavlou S P et al Release Distribution and Impacts of Polychlorinated Biphenyls (PCB) Induced by Dredged Material Disposal Activities at a Deepwater Estuarine Site Environment International Vol 7 1982
27 Summerhayes C P et al Fine-Grained Sediment and Industrial Waste Distribution and Dispersal in New Bedford Harbor and Western Buzzards Bay Massachusetts Technical Report for the Dept of Commerce National Oceanic and Atmospheric Administration Office of Sea Grant unpublished manuscript April 1977
28 Tofflemire T J Results of the 1978 Barge Sampling in the Hudson River N Y Dept of Environmental Conservation Technical Paper No 60 December 1980
29 Tofflemire T J Hetling L J and Quinn S 0 PCB in the Upper Hudson River Sediment Distributions Water Interactions and Dredging New York State Dept of Environmental Conservation Technical Paper No 55 January 1979
30 Tofflemire T J and Quinn S 0 PCB in the Upper Hudson River Mapping and Sediment Relationships New York State
-32shy
Dept of Environmental Conservation Technical Paper Ho 56 April 1979
31 Tofflemire T Jj Quinn S Oj and Carcich I Gj bullSediment and Water Sampling and Analysis for Toxics Relative to PCS in the Hudson Riverr New York Dept of Environmental Conservation Technical Paper Mo 64 September 1980
32 U S Army Corps of Engineers PCB Cleanup Operations -Duwamish Waterway - Seattle Harbor Washington undated
33 U S EPA The PCB Contamination Problems in Waukegan Illinois Region V Chicago Illinois January 21 1981
34 Vann R G James River Virginia Dredging Demonstration in Contaminated Material (Kepone) Dustpan versus Cutterhead Norfolk District U S Army Corps of Engineers undated
35 Weaver Grant PCB Pollution in the New Bedford Massachusetts Area A Status Report Massachusetts Coastal Zone Management June 1982
i
TABLE 1 - ESTIMATED CONTAMINATED VOLUMES AND PCB RECOVERY NEW BEDFORD HARBOR MASSACHUSETTS
Typical PCB Concentration in Dredged Area
ppm
gt30
gt20
gt10
gt 1
45
30
15
Cumulative Volume of Dredged Material
cu yds
HARBOR AREA (Zones A and B)
400000
500000
1000000
4500000
OUTER HARBOR AREA (Zone C)
900000
1200000
1500000
Percent of Total PCB Removed Zones Zone A and B C
50
55
70
90
65
75
90
2ones identified on Fig 1
After Malcolm Pirnie 1981 (Note Subsequently collected data may alter these original estimates by Malcolm Pirnie)
Project 82990 Geotechnical Engineers Inc August 12 1982
Table 2 (CONTI
Grain size (wt )
BRCO ID IC-82shy Sample Description Gravel Sand Silt Clay
Water Content ()
Oil and Grease (wtlaquo) Classification0
2178 2179
Station 9 -0-10 CM Station 9 shy 38-48 CM
0 624
1170 2602
6449 4816
2381 1958
692 593
65111
3c
2180 2181
Station 11 shyStation 11 shy
0-10 CM 26-36 CM
0 0
3152 3112
5099 3800
1749 3088
556 549
168023
3c
2182 2183
Station 16 shyStation 16 shy
0-10 CM 33-43 CM
189 0
5230 173
3136 7282
1445 2545
350 420
00610005
3c
2184 2185
Station 21 shyStation 21 shy
0-10 CM 29-39 CM
0 423
1176 5475
6939 4629
18185 2773
520 558
141003
3c
2186 2187
Station 27 shyStation 27 shy
0-10 CM 34-44 CM
0 0
5212 1066
3045 5963
1743 2971
547 569
297002
3c
2188 2189
Station 29 shyStation 29 shy
0-10 CM 84r94 CM
163 0
1576 204
5393 7043
2868 2753
667 463
183001
3c
2190 2191
Station 31 shyStation 31 shy
0-10 CM 21-31 CM
152 117
946 3606
4515 4423
4387 1851
669 582
347124
3c
Concentration Ranges for Classification by Physical Characteristics0
Type ft
Type B
Type C
mdash ~
mdash
mdash
mdash -
- shy lt60ltlaquo
- shy 60-90lt)
gt90laquoi
- shy
- shy
lt40
40-600
gt60
ltOS
05-10
gt10
TABLE 3 - CLASSIFICATION OF DREDGE OR FILL MATERIAL BY CHEMICAL CONSTITUENTS NEW BEDFORD HARBOR MASSACHUSETTS
All Units Are In Parts Per Million
Category One Category Two Category Three
Arsenic (As) 10 10-20 20 Cadmium (Cd) 5 5-10 10 Chromium (Cr) 100 100-300 300 Copper (Cu) 200 200-400 400 Lead (Pb) 100 100-200 200 Mercury (Hg) lt 05 05-15 15 Nickel (Ki) lt 50 50-100 100 Polychlorinated Biphenyls (PCS) lt 05 05-10 gt 10 Vanadium (V) lt 75 75-125 gt 125 Zinc (Zn) lt 200 200-400 gt 400
Category One materials are those which contain no chemicals listed in Table 1 in concentrations exceeding those listed in the first column
Category Two materials are those which contain any one or more of the chemicals listed in Table 1 in the concentration range shown in the second column
Category Three materials are those materials which contain any chemical listed in Table 1 in a concentration greater than shown in the third column
After Massachusetts Division of Water Pollution Control 1978
Project 82990 Geotechnical Engineers Inc August 12 1982
TABLE 4 - CLASSIFICATION OF DREDGE OR FILL MATERIAL BY PHYSICAL CHARACTERISTICS NEW BEDFORD HARBOR MASSACHUSETTS
Type A Type B Type C
Percent silt-clay lt 60 60-90 gt 90 Percent water lt 40 40-60 gt 60 Percent volawtile solids
(MED method) lt 5 5-10 gt 10 Percent oil and grease (hexane extract) lt05 05-10 gt10
Type A materials are those materials which contain no substances listed in Table 2 exceeding the amounts indicated in the first column
Type B materials are those materials which contain any one or more of the substances listed in Table 2 in the concentration range shown in the second column
Type C materials are those materials which contain any substance listed in Table 2 in a concentration greater than shown in the third column
When the Division has reason to suspect that biological contaminants are present (for example because of the physical parameters) additional testing may be required
After Massachusetts Division of Water Pollution Control 1978
Project 82990 Geotechnical Engineers Inc August 12 1982
TABLE 5 - NORMALLY IMPROVABLE DREDGING HANDLING AND DISPOSAL OPTIONS NEW BEDFORD HARBOR MASSACHUSETTS
CHEMICAL TYPE (TABLE 2) Category One Category Two Category Three
PHYSICAL TYPE (TABLE 3) A B C A B C A B C
Dredging Methods
Hydraulic Mechanical
X X
X X
X X
X X
X X
X X
X X
X X
X X
Disposal Methods
Hydraulic Sidecast Hydraulic Pipeline Mechanical Sidecast Mechanical Barge
Placement
Land or in-harbor disshyposal with bulkheading (a) (a) (a) (a) (a) (a) (a) (a)
Open ocean disposal at high energy sandy sites
Open ocean disposal at low energy silty sites O X (b) O (b) (b) (b) (b) (b)
Onconfined in-harbor X O O O 0 O O O O
Beach Replenishment X O O O O O O O O
Other Conditions
Timing and Placement to Avoid Fisheries Impacts (spawning and running periods and areas) (c) (c) (c) (c) (c) (c) (c) (c) (c)
Legend X Normally approvable O laquo Not normally approvable
(a) laquo Normally approvable but control of effluent will be required (b) - Approvable only after bioassay performed in accordance with
established EPA procedures indicates no significant bioshylogical iJi$gtact A statistically comparable project which has successfully passed the bioassay test may be substituted If a tignificant biological impact is found this material is unsuitable for open water disposal
(c) laquo Required in all cases
After Massachusetts Division of Water Pollution Control 1978
0XOX
OXOX
0XOX
0XOX
OXOX
0X0 X
OXOX
XXX
X
XXXX
Project 82990 Geotechnical engineers Inc August 12 1982
1I bull
Inner Harbor Zones A and B
Outer Harbor Zone C
POPES ISLAND
NtW bullCDFORO
PAiMEl ISLAND
NUIIICANC IAMIEI
IWAGE TtEATMtNT PUNT OUTFAUS
5
0 W
Figure 1 LOCATION OF STUDY AREA
After Malcolm Pirnie 1981 Project 82990
Geotechnical Engineers Inc August 13 1982
bull too too JOQ too MO VMrV1 4laquod SCALE IN FEET
bull bull TyenraquoO additional ampin I I taktn 300 down ctrMm
Ii laquo-iv laquo
- VVVR- r ^shy
ll -
shy -bull
Figure 2 Location of sampling stations in Acushnet River Stations denoted as bull were occupied by US Coast Guard in April 1982 Stations denoted as 0 were reoccupied by ERCO on July 13 1982 Project 82990 Gcotechnical Engineers Inc August 12 1982
DIPPER DREDGE
CLAMSHELL DREDGE Figure 3 MECHANICAL DREDGES
After Malcolm Pirnie 1978
Geotechnical Engineers Inc
Project 82990 August 13 1982
BUCKET DREDGE
DRAGLINE DREDGE
Figure 4 MECHANICAL DREDGES
After Malcolm Pirnie 1978
Project 82990 Geotechnical Engineers Inc August 13 1982
LINK TYPE LATERAL DREDGING TTPE
MITSUBISHI CLOSED GRAB BUCKET
TWO-PLANE CONTACT METHOD HARD RUBBER METHOD
LIP SEALING METHODS
Figure 5 WATERTIGHT GRAB BUCKET
After Malcolm Pimie 1978 SOURCE M I T S U B I S H I SEIKO CO LTD
Project 82990 Geotechnical Engineers Inc August 13 1982
Oiscnarge Lint Ladder
Spud (Typ) Cutterneaa
CUTTERHEAD SUCTION DREDGE
Anchor Caole Oiscnarge (Tjp) L i n e
Suc t ion Line
PLAIN SUCTION DREDGE
Figure 6 HYDRAULIC DREDGES
After Malcolm Pirnie 1978 Project 82990
August 13 1982 Geotechnical Engineers Inc
Ancnor Cades Discharge (Typ) Line
Dustpan
DUSTPAN DREDGE
Hoppers
Trailing Suction Urn
HOPPER DREDGE
Figure 7 HYDRAULIC DREDGES
After Malcolm Pimie 1978
Project 82990 Geotechnical Engineers Inc August 13 1982
Intake Discharge A a three way valve functions to
create a vacuum in one of the A at its turn the three way valve is
given a command to introduce chambers pressurized air into the chamber
A when ready the inlet valve opens slurry enters Induced either by
A this pressurized air forces the sHjrry down then up and through the
hydrostatic head pressure or wye discharge pipe vacuum
A as the slurry reaches a certain A from the wye discharge the
slurry is conveyed through a level the electronic sensoring pipeline to a disposal area device issues a command to the electronic controller for the three way valve to dose
Figure B PNEUMATIC PUMP
After Aintec 1981
Project 82990 Geotechnical Engineers Inc August 13 1982
Spud
THE TAIAN MARU lin|th 37laquo (1214 ft ) bullIdth I2i (394 ft )
Otpth 3gt (91 ft ) Orraquoft 22s (72 ft )
III I Vitvt bullt Olichirii Studn
mdashOil lraquoiry if Riliisi bull( Air and
Ciipritiid A i r
trillion if VICUUB
SUCTION DISCHARGE
Figure 9 QOZER PUMP OPERATION bdquo ^ After Malcolm Pirnie 1978 Geotechnical Engineers Inc August 13 1982
SOURCE WO CONSTRUCTION CO
Cifatinf Grodt
Contctar
lo Ltochofv Staroqt Tonh
This diagram shows in detail surface water collecshytion ground water collection systems and clay barshyriers which surround a typical secure land buna facility
Figure 10 TYPICAL SECURE LAND BURIAL FACILITY bull FOR CONTAMINATED DREDGE SPOILS
After NY Department of Environmental Conservation (undated)
Project 82990 August 13 1982 Geotechnical Engineers Inc
APPENDIX
LABORATORY TESING OF ACUSHNET RIVER ESTUARY SEDIMENTS
bull Bulk Analysis of Sediments
Fourteen sediment samples collected by ERCO on July 13 1982 were analyzed for 9 metals (As Cd Cr Cu Pb Eg Nir V and Zn) oil and grease and grain size distribushytion Sediments were collected in the Acushnet River estuary at 7 of the 33 stations occupied by the Coast Guard in April 1982 (Figure 1) Descriptive information regarding station locations and sediment samples is summarized in Table 1 All sediment samples were collected using a push corer equipped with a polycarbonate liner Two samples were collected at each station One core was transferred to a 1-liter Teflon jar for compositing for the elutriate analysis EP toxicity testing and the solid-phase bioassay The second core intended for bulk analysis was cut and capped in the field All samples were stored at 4 C during sampling and transportation to the laboratory At the laboratory the upper and lower 10 cm of each undisturbed core was removed for bulk analysis
For bulk analysis of the sediments a homogenized subsample was removed and split into aliquots for each analysis Analyses for oil and grease were performed according to methods outlined by the US EPA (1979a) Grain size analysis utilized methods of Folk (1974) Samples for trace metal analyses were digested according to methods of the US EPA (1977) and analyzed by atomic absorption spectrophotometry (US EPA 1979a)
Results of the bulk analyses are summarized in Table 2 Zn general concentrations of metals oil and grease and PCBs were highest in the upper portion (0-10 cm) of the sediment cores Concentration ranges of various constituents in the upper and lower portions of the cores were as follows
As (ppm) Upper 53-23 Lower 61-13 Cd (ppm) Upper 077-34 Lower 013-75 Cr (ppm) Upper 32-830 Lower 25-120 Cu (ppm) Upper 60-1800 Lower 53-910 Pb (ppm) Upper 70-1400 Lower 39-1100 Bg (ppm) Upper lt03-24 Lower lt03-19 Ni (ppm) Upper 12-123 Lower 78-28 V (ppm) Upper 13-150 Lower 24-38 Zn (ppm) Upper 170-4400 Lower 27-4000
PCB (ppm) Upper 20-38730 Lower 2-150 Oil and grease (wtt) Upper 0061-65 Lower 0005-111 Gravel (wt) Upper 0-189 Lower 0-624 Sand (wt ) Upper 946-5230 Lower 173-5475 Silt (wt ) Upper 3045-6939 Lower 3830-7282 Clay (wt ) Upper 1445-4387 Lower 1851-3088 Water (wt ) Upper 350-692 Lower 420-593
Based on criteria established by the Massachusetts Division of Water Pollution Control (1978) sediments would be categorized as Category Three material on the basis of chemical composition and Type C material on the basis of physical characteristics
Concentrations of total PCBs in the surface sediment are greater than 50 ppm at all stations sampled by ERCO indicating that disposal of this material is regulated by the Toxic Substances Control Act (TSCA) Public Law 94-469
II Elutriate Analysis of Sediments
The liquid (elutriate) phase of composite samples of
bulk sediment from seven stations (Table 1) was prepared
according to methods outlined by the US EPA and Army COE
(1977) Sediment samples were prepared by homogenizing the
entire core from each of the 7 stations identified in
Table 1 Sediment and seawater were mixed at room temperature
(22 + 2 C) in a 14 ratio by volume Mixing was performed
in 1000-ml Erlenmeyer flasks by passing compressed air
(treated in a deionized water bath) into the flasks for
30 min and manually stirring the slurry at 10-min intervals
The slurry was then allowed to settle for 1 hr For analysis
of metals the supernatant was filtered through a 045-um
filter and acidified to a pH of lt20 with concentrated
Ultrex HC1 For analysis of PCBs and oil and grease
the supernatant was centrifuged to prevent adsorption of the
organic compounds by the filter
Analyses for metals were conducted by a variety of
analytical methods Mercury was determined by cold-vapor
atomic absorption spectrophotometry (AAS) according to
methods specified by the US EPA (1979a) Arsenic was
determined by hydride generation AAS according to methods
described by Andreae (1977) Vanadium was determined by
inductively coupled argon plasma emission spectroscopy
according to methods of the US EPA (1980a) Analyses
for other metals (Cd Cr Cu Pb Ni and Zn) were conducted
by chelationsolvent extraction with APDC and MIBK (ammonium
pyrollidine diothiocarbomate and methylisobutyl ketone)
according to methods described by Jan and Young (1978)
Instrumental analyses were conducted by flame or graphite
furnace AAS Analyses for oil and grease were conducted by
solvent extraction and gravimetry according to methods of
the US EPA (1979a) Analyses for PCBs were performed
according to methods of the US EPA (1979b) Samples were
extracted with methylene chloride and analyzed by gas
chromatography with electron capture detection
Results of elutriate analyses are presented in Table 3
Also shown in Table 3 are suggested water quality criteria
(US EPA 1980c) for seven constituents (Cd Cr Cu Hg Ni
Zn and PCBs) in saltwater environments These criteria
have been established for protection of saltwater aquatic
life and are generally lower than equivalent criteria for
freshwater environments Comparisons of constituent concenshy
trations in the sediment elutriates with these levels should
represent a conservative estimate for determination of the
relative potential environmental impact of soluble constituents
released by dredging activities
Concentrations of seven metals (As Cd Cr Pb Hg V
and Zn) in the elutriates (without application of a dilution
factor) were higher than in the Acushnet River water used
for sample preparation Conversely Cu and Ni concentrations
decreased in the elutriates relative to ambient levels The
maximum concentration levels suggested by the criteria (US
CPA 1980c) were not exceeded for any element for which
criteria exist although the 24-hr average level was exceeded
in some cases for Hg Ni and Zn (it should be noted that
no dilution factor was applied to the elutriate concentrations)
Ambient levels of Cu and Ni in the Acushnet River estuary
exceeded the suggested criteria
Concentration of total PCBs in the elutriates exceeded
the ambient level in the Acushnet River water for all
stations except Station 16 In addition concentrations of
total PCBs in the elutriate (without application of a
dilution factor) exceeded both the 24-hr average and maximum
Table 3 Results of elutriate analysis of sediment samples
Concentration (ug1) ERCO ID Oil and Total IC-82shy Sample Description As Cd Cr Cu Pb llg N i V Zn Grease PCBa
2192 Station 9 shy Composite 52 lt010 lt050 lt10 16 043 12 52 29 5000 11000
2193 Station 11 - Composite 55 lt010 36 13 42 lt020 73 55 60 8000 920
2194 Station 16 - Composite 21 lt010 39 12 59 028 64 21 19 350 34
2195 Station 21 - Composite 75 018 060 17 300 lt020 12 75 87 8000 1010
2196 Station 27 - Composite 36 025 18 11 13 043 74 36 21 3300 3360
2197 Station 29 - Composite 73 013 16 12 87 071 11 73 84 900 22
2198 Station 31 - Composite 35 lt010 10 lt10 18 064 91 35 lt25 500 47
Acushnet River Water lt10 lt010 29 62 18 lt020 20 lt10 62 370 61
Criterion13
- 24-hr NA 45 18 40 NA 0025 71 NA 58 NA 0030 - Maximum NA 59 1260 23 NA 37 140 NA 170 NA 10
aPBCs were quantified as Aroclor 1248 and Aroclor 1254
bThese criteria are based on recommendations of US EPA (1980c) for protection of saltwater aquatic life
NA shy None available
concentration levels suggested by the water quality criteria
In the case of Station 9 the elutriate concentration
exceeded the maximum concentration level of the criteria by
a factor of greater than 1000 Ambient levels of PCBs in
the Acushnet River exceeded the 24-hr average concentration
suggested by the criteria
Table 4 Results of EP toxicity testing of composite sediment sample from the New Bedford Harbor
Concentration (ppm) Maximum Contamination Constituent in sample 82-2199 Level (ppm)a
AS Ba Cd Cr Pb Hg Se Ag
Endrin Lindane Methoxychlor Toxaphene 24-D 245-TP Silvex
aEPA (1980b)
0021 0135 0016 0005 0060 lt0050 lt0002 lt0001
lt00001 lt00001 lt0001 lt0001 lt00004 lt00001
50 100 10 50 50 02 10 50
002 04 100 05
100 10
III Analysis of Sediments for EP Toxicity
A single composite sample comprised of equal
amounts of sediment from seven stations (Table 1 was
analyzed for the characteristic of EP toxicity according to
procedures outlined in Appendix II (pp 33127-33128) of the
US EPA (19805)
A 100 g sample was combined with 16 times its weight
of distilled deionized water and maintained at a pH of 50 _+ 02
for 24 hr by addition of 05N acetic acid The sample was
then filtered diluted to volume and analyzed for metals
pesticides and herbicides according to methods described
by the US EPA (1979a 1979b)
Results of the EP toxicity test are presented in
Table 4 Also presented are maximum contamination levels
(MCLs) that have been established for eight metals
pesticides and herbicides (the MCLs are 100 times the
Interim Primary Drinking Water Standards [US EPA 1980b])
Results indicate that the composite sediment sample is EP
non-toxic with respect to metals pesticides and herbicides
Nitex containers to prevent predation by grass shrimp)
Organisms were maintained in uncontaminated media for a
period of 2 days During this time fecal material was
removed from aquaria At the end of the 2-day period all
samples of organisms were split into approximately equal
amounts One of these subsamples was placed in a polyshy
ethylene clean bag and frozen for later analyses for metals
The second subsample was put in solvent-rinsed aluminum foil
and frozen for analyses for organics
Data produced by solid phase bioassays with grass
shrimp hard clams and sandworms are presented in Table 5
Mean survival of organisms exposed for 10 days to the
composite sediment sample was 190 (grass shrimp) 990
(hard clams) and 970 (sandworms)
Analysis of total (combined) survival data for the
three species exposed for 10 days to control (culture)
sediment and the solid phase of the composite sediment
sample is presented in Table 6 Mean survival of control
organisms was greater than 90 thus allowing evaluation of
data from tests with the composite sediment sample These
data indicate that total survival of organisms exposed to
the solid phase of the composite sediment sample was signishy
ficantly less than total survival of organisms exposed to
control sediment (717 versus 967)
IV Results of Solid Phase Bioassay
The composite sediment sample was prepared for biological
testing according to procedures described in Appendix B of
the manual entitled Ecological Evaluation of Proposed
Discharge of Dredged Material into Ocean Waters (US EPA
and US Army COE 1977) Bioassays with sediment were
conducted according to guidelines presented in Appendix F of
the EPA and COE manual for dredged material (US EPA and
US Army COE 1977)
Species tested in the solid phase bioassays were the
grass shrimp (Palaemonetes pugio) hard clam (Mercenaria
mercenaria) and sandworm (Nereis virens) Grass shrinp
were collected in Osterville Massachusetts Hard clams and
sandworms were acquired from commercial suppliers in
respectively Long Island New York and Boston Masschusetts
Animals were acclimated in artificial seawater for at least
3 days prior to initiation of testing All species were
tested in the same aquaria Testing temperature was
20 +_ 1 C Water exchange (artificial seawater) was by the
replacement as compared to the flow-through method
Control (culture) sediment employed in the tests was
collected on July 14 1982 from the subtidal zone off
Manchester Massachusetts The sediment which was collected
by R Boeri and C Smith ERCO consisted primarily of
sand
At the conclusion of the solid-phase bioassays with
grass shrimp hard clams and sandworms all surviving
organisms from each aquarium (replicate) were placed in an
aquarium containing clean sediment-free water and allowed
to void their digestive systems (sand worms were confined in
Table 6 Analysis of total (combined) survival data for grass shrimp (Palaemonetes pugio) hard clams (Mercenaria mercenaria) and sandworrms (Nereis virens) exposed for 10 days to control (culture) sediment and solid phase of composite sediment sample
Step 1 Total Survival Data (From Table 5)
Total Number of Survivors Treatment
(t) Control Composite (Culture) Sediment
Replicate (r) Sediment Sample
1 58 42 2 57 45 3 57 45 4 58 41 5 60 42
Mean (x) 5800 (967) 4300 (717)
Step 2 Cochrans Test for Homogeneity of Variances of Survival Data
Treatment (t) Survival
Mean (x) Variance (S )
Control (culture) sediment Composite Sediment Sample
5800 4300
150 350
C(Cal) = = 350 = 070 ns
IS 500
as compared to C = 091 for a = 005f k = 2 and v = 4
Step 3 Parametric Unpaired t Test of Survival Data (Comtrol Sediment vs Composite Sediment Sample)
Xlfc(cal) = ~X2 = 1500 _
100
as compared to = 1-86 for a = 005 one-tailed hypothesis and df = 8
Table 5 Results of solid phase bioassays with grass shrimp (Palaemonetes pugio) hard clams (Mercenaria mercenaria) and sandworms (Nereis virens)3
Treatment (t)
Number of Survivors30
Control (Culture) Sediment Composite Sediment Sample
Replicate (r)
Grass Shrimp
Hard Clams
Sand-worms Total
Grass Shrimp
Hard Clams
Sand-worms Total
1 18 20 20 58 3 20 19 42
2 18 19 20 57 5 20 20 45
3 18 20 19 57 5 20 20 45
4 18 20 20 58 4 19 18 41
5
Mean (x)
20
1840
20
1980
20
1980
60
5800
2
380
20
1980
20
1940
42
4300
() (920) (990) (990) (967) (190) (490) (970) (717)
aBioassays (10-day tests) were conducted at 20+^ 1 C in 38-liter aquaria Organisms were exposed to each replicate of a treatment in a single aquarium Water in aquaria was exchanged by the replaceshyment as compared to the flow-through method and was aerated A 14-hour light and 10-hour dark photo-period was maintained with cool-white fluorescent bulbs Minimum values of dissolved oxygen and pH recorded during the bioassays were 54 mg1 and 71 respectively Salinity was maintained at 30 ppt
^Twenty (20) individuals of each species were initially exposed to each replicate of a treatment Thus a total of 60 animals was employed in each aquarium
degIn addition to monitoring survival of all species burrowing behavior of sandworms was noted at 2-day Intervals No differences were observed among aquaria
LABORATORY PROCEDURES FOR PREPARING THE COMPOSITE SEDIMENT SAMPLE3
Date of Certifications of Performance of Procedure Implemenshytation of Aquatic Aquatic Laboratory
Procedure Procedure Toxicologist Toxicologist Director
1 Store control sediment (CS) and composite CS 71482 sediment sample (CSS) at 2-4 C in separate containers Mix sediment in each 71382 container as thoroughly as possible
Solid Phase Bioassays
Bioassays should be initiated by July 27 1982 (2 weeks after July 13 1982 date of sediment arrival) Do not be concerned with sophisticated photoperiod Maintain dissolved oxygen in aquaria at gt4 ppm Cover aquaria to prevent salinity changes
2 Remove CS from storage and wet sieve through 1-mm mesh Use minimum volume of 714 artificial sea water [ASW] of salinity 30 ppt for sieving purshyposes Place nonliving material remaining on sieve in appropriate containers
3 Mix CS and allow to settle for 6 hr 714
4 Decant ASW and mix 714 CS as thoroughly as possible
5 Assign treatments (CS and CSS) and replicates (5 r per treatment) 714 to aquaria
6 Randomly position aquaria (10) in environshymental chamber maintained 714 at 20+1C 20+ 1TC
aThis document is a copy of the work sheet that was used during the evaluation The document differs from the work sheet in that dates appear in typed form and certifications were added at a single time after the dates were typed
V LABORATORY PROCEDURES FOR CONDUCTING SOLID-PHASE BIOASSAY
This section contains laboratory procedures for
preparing the composite sediment sample and conducting the
solid phase bioassay
Laboratory Procedures (Continued)
Date of Certifications of Performance of Procedure Implemenshytation of Aquatic Aquatic Laboratory
Procedure Procedure Toxicologist Toxicologist Director
14 During acclimation period remove approshypriate volumes of CSS from storage and wet-sieve each sample through 1-mm mesh into containers Use minishymum volume of ASW for sieving purposes Place nonliving material remaining on sieves in container
15 Mix CSS and allow to settle for 6 hr
16 Decant ASW and mix CSS as thoroughly as possible
17 Place 15 mm of CSS in all but control aquaria Employ basic strategy identified in Step 8
18 Remove remaining CS from storage Warm to test temperashyture (20+1C) Add 15 mm of CS to each control aquarium Employ basic strategy identified in Step 8
19 Replace 75 of ASW 1 hr after addition of CSS and final addition of CS
20 Select 200 grass shrimp from holding tank and randomly distribute into 10 culture dishes
21 Randomly distribute contents of 10 culture dishes into 10 aquaria
716
716
716
716
716
716
716
Laboratory Procedures (Continued)
Date of Certifications of Performance of Procedure Implemenshytation of Aquatic Aquatic Laboratory
Procedure Procedure Toxicologist Toxicologist Director
7 Partially fill aquaria with ASW 714 bull
8 Place 30 mm of CS in each aquarium Fill 1st aquarium to -gt-10mm then 2nd aquarium to -10mm 714 and finally last aquarium to ^10 mm Repeat sequence until aquaria are filled to gt-20 mm Repeat sequence again until aquaria are filled to ~30 mm This procedure will help to ensure that CS in all aquaria is homogeneous Store remaining CS at 2-4C for later use
9 Replace ASW 1 hr after CS has been added to aquaria Do not disturb 714 sediment during replacement
10 Select 200 hard clams from holding tanks and randomly distribute into 714 10 culture dishes Follow same procedure for sandworms
11 Randomly distribute contents of 10 culture 714 dishes into 10 aquaria
12 If necessary replace 75 of AWS 24 hr after animals are introduced Not necessary into aquaria
13 Acclimate animals for 48 hr During this time period remove dead 714-716 animals and replace with live animals
10
US STANDARD SIEVE OPENING IN INCHES US STANDARD SIEVE NUMBERS HYDROMETER
34 3 4 6 8 IO I l6 20 deg 40 50 70 I0degI4deg 20deg6 4 3 2 l2 1 3
100shy
l
^U 5gt_shys
on NL
X bull 20
bullv tshyraquo- 7n I 7O 13 UJ
_-raquo- bull-bullv
bull30 5 UJ Be
finOU
ffi
ltE UJ laquo- 2 50
u K
Nj
bull An^deg
50au
^ 01
cr UJ w
a lt o u
2poundU
o W
An deg
30
vV
s
- An
TO
i_ z UJ o
a UJ
v QL
5-n
in
ns
O A
90
3OO 100 5O IO 5 1 O5 OI OO5 001 O005 OOOI
GRAIN SIZE MILLIMETERS
[ COBBLES GRAVEL
COARSE | FINE COARSE |SAND
MEDIUM | FINE SILT OR CLAY
O
New England Governors Conf New Bedford Harbor GRAIN SIZE CURVE Boston Massachusetts Investigation STATION 9
New Bedford Massachusetts LOWER 10 CM GEOTECHNICAL ENGINEERS 1N(
WINCHESTER bull MASSACHUSETTS Project 82990 ruly 30 1982 Fig 3
US STANDARD SIEVE OPENING IN INCHES US STANDARD SIEVE NUMBERS HYDROMETER
6 4 3 2 I1 1 34 fe 3 4 6 8 IO 14 16 20 3O 40 50 70 100 140 200 100shy mdashI ( raquomdash imdash Mgttrade bullbull shy L gtbulllaquobull
-raquo -raquo
-bull 10
oubull
20
H j_ bull30 5 u UJ
UJ
gtm ltE
60 y
CD
ltX UJ
UL
1-
50 Q
O o
0 ^
bullz UJ o
^ 30
UJ a
A r
in
1sN
bullmdash ~1 IUU
500 100 5O 10 5 O5 OI 005 001 OJ005 0001
GRAIN SIZE MILLIMETERS
COBBLES GRAVEL
COARSE | FINE COARSE
SANO
MEDIUM | FINE SILT OR CLAY
New England Governors Conf New Bedford Harbor GRAIN SIZE CURVE
Boston Massachusetts Investigation STATION 9
New Bedford Massachusetts UPPER 10 CM r^ OGEOTECHNICAL ENGINEEMS IN
WINCHESTER bull MASSACHUSETTS Project 82990 Tu]y 30 1982 Fig 2
20
1 - US STANDARD SIEVE OPENING IN INCHES US STANDARD SIEVE NUMBERS HYDROMETER
6 4 3 Z l2 1 3 4 6 8 10 14 16 20 30 4O 50 70 100 I4O 2OO IOU 1 mdash lt
1 U^ - -_bullbull^ K
N
^V
IO
Of) bull20
^^ H
Vhi- 7ndeg 30 g V^
Vo Hi UJ
gt
B 60 ^
ffl V tr
z iZ
H ^ tIL
Af
1 O
l J
3
0
C
C
OA
RS
ER
O Z U)
^ oec Ny 30 -mdash(^ u Q S
- An i
IO - on
5lt SO IOO 5O 10 5 shy shy O5 OI 005 OOI OjOOS OOOI
GRAIN SIZE MILLIMETERS
COBBLES GRAVEL
COARSE 1 FINE COARSE SAND
MEDIUM FINE SILT OR CLAY
mdash
New England Governors Conf Boston Massachusetts New Bedford Harbor
Investigation GRAIN SIZE CURVE
STATION 11
HK OEOTECHNICAL ENGINEERS INC New Bedford Massachusetts LOWER 10 CM
VJL WINCHESTER bull MASSACHUSETTS Project 82990 July 30 1982 Fiq 5
US STANDARD SIEVE OPENING IN INCHES US STANDARD SIEVE NUMBERS HYDROMETER
6 4 9 2 l2 I 34 2 3 4 6 8 10 14 16 20 3O 40 50 70 100 140 200 IOO-I rmdashi 1 1 i il I I li il r-4 r-l 1 ill 1 il i il i 1 i 1 t l-L-iili i 1 i h 1 hmdash1 1 i i ih i imdashi 1 1 IT i i i imdashi 1 r- rO
bullbull 1gt~gt -
Xyo bull h 10
20 ^s
H 7n 3O Jo HI deg
O bull
UJ IU 3
s A r y~ 60 gt- fin
bullgt v
4 gt
0 c
bull C
OA
RS
ER
8
Z
CD
DC UJ laquon 50 zu H z in 40 so
UJ
(T o
1H 30 7ri o O bullU ^ UJ
bullgt CL
srv v
^^^^ in S -90 V
1
O IUU
5ltDO IOO 5O IO 5 1 05 OI 005 001 0005 0001
GRAIN SIZE MILLIMETERS
GRAVEL SAND COBBLES SILT OR CLAY COARSE 1 FINE COARSE MEDIUM | FINE
New England Governors Conf New Bedford Harbor GRAIN SIZE CURVE
Boston Massachusetts Investigation STATION 11
New Bedford Massachusetts UPPER 10 CM r-OGEOTECHNICAL ENGINEERS IN WINCHESTER MASSACHUSETTS Project 82990 July 30 1982 Fig 4
US STANDARD SIEVE OPENING IN INCHES US STANDARD SIEVE NUMBERS HYDROMETER
6 4 3 a life | 2 3 4 6 8 10 14 16 20 3O 40 50 70 100 140 200
-bulllaquo ~s
V
10
gt
20
H
K- 70 7O bull 30 5I0 U
tu raquo
ACgt 60gtbull 60 U (D
ffi a cc UJ Ui laquon O T
50 bull50 (j 3Uzk lt
u o l- k o
40 Z AA en i_s V Zu
a bull UJ o
Jjraquo 30 s 7 r QC UJ SL Q
^^ bullmdashmdashlaquo n ^N A C
10 bull yu
bull -imdash i i u u 500 IOO 5O IO 5 05 OI 005 001 0005 0001
GRAIN SIZE MILLIMETERS
COBBLES GRAVEL
COARSE | FINE COARSE SAND
MEDIUM FINE SILT OR CLAY
O
New England Governors Conf New Bedford Harbor GRAIN SIZE CURVE Boston Massachusetts Investigation STATION 16
New Bedford Massachusetts LOWER 10 CM GEOTECHNICAL ENGINEERS IN r
WINCHESTER bull MASSACHUSETTS Project 82990 Ji Jly 30 1982 Fiq 7
US STANDARD SIEVE O P E N I N G IN INCHES US S T A N D A R D SIEVE N U M B E R S H Y D R O M E T E R 346 4 3 2 |l_ | bdquo 3 4 6 810 14 16 20 30 40 50 TO 100140 200
lt bull i i i _ _ _ n 100- mdashi - -1 mdashrmdash bull
1 10 9Oshy
80 bull 20 NJ 1shy
1- -ro 30 oI 70 UJ 0
UJ 4O gt~ 60 laquon ^U 03 gt- sCD
^bullx Cf
tr UJ gtv^ UJ KJ-gt 50 OT z 50
V ltt u OSv OH gt N 40 -6O vshyui zo UJ
occ UJ 0 bull 7O CC
UJ a
on w - A n ^ v
l ^ laquo Qf IO
N 500 100 50 IO 5 1 05 OI O05 OOI OOO5 bull OOOI
G R A I N SIZE M I L L I M E T E R S
C O B B L E S G R A V E L
COARSE | F I N E COARSE |S A N D
M E D I U M | F I N E S I L T OR C L A Y
New England Governors Conf GRAIN SIZE CURVE New Bedford Harbor Boston Massachusetts STATION 16
Investigation UPPER 10 CM
New Bedford Massachusetts OGEOTECHNICAL ENGINEERS IN r W I N C H E S T E R bull MASSACHUSETTS Project 82990 J uly 30 1982 Fiq 6
US STANDARD SIEVE OPENING IN INCHES US STANDARD SIEVE NUMBERS HYDROMETER
6 4 3 2 l2 1 S4 a 3a 3 4 6 8 10 K 16 20 3O 40 50 70 100 140 200 100 1 shy
lt 1 -(shy ~1yobull 10
X bulls
on bull 20 ^
HshybullH 70 7O bull 30 oI ^
O UJ UJ t
A n ~ 6deg CO
CD V 60 ^U
V poundT poundC UJ w
50 OT in u z degdeg
lt O O1-
2 4O n i_pound 40
V
O yz UJ Ooc ^ x
IfQ 30 bull 7ft fl OU -( UJ X Q
20 bull A n
10 -goi
0 bull- r i bull i u u 500 100 50 10 5 05 OI OO5 OOI 0005 OOOI
GRAIN SIZE MILLIMETERS
GRAVEL SAND [ COBBLES SILT OR CLAY COARSE ] FINE COARSE | MEDIUM FINE
New England Governors Conf New Bedford Harbor GRAIN SIZE CURVE Boston Massachusetts Investigation STATION 21
New Bedford Massachusetts LOWER 10 CM HK GEOTECHN1CAL ENGINEERS IN r VLJ WINCHESTER bull MASSACHUSETTS Project 82990 July 30 1982 Fiq 9
US STANDARD SIEVE OPENING IN INCHES US STANDARD SIEVE NUMBERS HYDROMETER
346 4 3 2 1 ^ 1 raquo laquo 3 4 6 8 10 14 16 20 3O 40 50 70 100 140 200 100shy
i
bull shy ^ raquo _ 1 L i 1 1
bull ( h-^- ^ laquobullmdash4 l_
1 1
mdashbull=
J _1 ___ ____ 1-1
go bull ---bull
^x 1 0
oubull 20
I-
^X
-rn 70 ^fl in
o UJ
fiOOU
CD
cc UJ laquolaquo
u
V bull 4nHU
50
UJ
~ CD
or UJ
52 lt O
gtshysu (pound
40 ^
fir
o i
2 UJ 0
W -IQ _^LA bull 7rraquo tt
UJ S Q
on - An
^1 lt ^
in
mdash ijltj 5DO IOO 5O IO 5 O5 OI O05 001 0005 OOOI
GRAIN SIZE MILLIMETERS
COBBLES GRAVEL
COARSE | FINE COARSESAND
MEDIUM | FINE SILT OR CLAY
O
New England Governors Conf New Bedford Harbor GRAIN SIZE CURVE
Boston Massachusetts Investigation STATION 21 New Bedford Massachusettb UPPER 10 CM
GEOTECHNICAL ENGINEERS IN r WINCHESTER bull MASSACHUSETTS Project 82990 Tuly 30 1982 Fig 8
US STANDARD SIEVE OPENING IN INCHES US STANDARD SIEVE NUMBERS HYDROMETER 34
3e6 4 3 2 l2 1 2 3 4 6 8 IO 14 16 20 3O 40 50 70 100 140 200 IOOshy 1F- M = -4
ff
mdash~~~v fcvs
10
N s 20
i 70 rushyugt UJ
60 gtshy
CD
s s
V
bull 30
A ndeg
1-
o UJ
gtbull 03
cc aujS U
(-zu0
a
Kn
An 40
V
V
H y
v
503J
An
UJ OT
Qshy
lt o lt_gt i_ z UJ o
pound 30
n
s s fCl DC
Ul a
i
IOshy (an
0 5lt DO 100 50 10 5 1 05 OI 005 001 0005 0001
GRAIN SIZE MILLIMETERS
COBBLES GRAVEL
COARSE j FINE COARSESAND
MEDIUM | FINE SILT OR CLAY
New England Governors Conf New Bedford Harbor GRAIN SIZE CURVE Boston Massachusetts Investigation STATION 27
New Bedford Massachusetts LOWER 10 CM
OGEOTECHNICAL ENGINEERS IN r WINCHESTER bull MASSACHUSETTS Project 82990 July 30 1982 Fig 11
US STANDARD SIEVE O P E N I N G IN INCHES USSTANDARD S I E V E N U M B E R S H Y D R O M E T E R
6 4 3 2 l2 l 34 3laquo 3 4 6 8 10 14 16 20 3O 40 50 70 100 140 200 100shy bull lt shy mdash1
bull l i i r -gt
k
N ltS 10
20
1- 7nI 7O 0 UJ
V 6600
bull 30
- ACl^U
H
o UJ
gt~ m
CD ^ o
ltrui u t-ziLu or if
laquon
4040
30
bulllaquo raquo
N
-50bullJJ
bull fin
7ltgt
UJ w poundg
lt
O o i_ z UJ o ft
lii
Q
o igt-- laquolaquo ft n
mdashi gtmdashraquo ^^
10 X gt 90
500 IOO 50 10 5 1 O5 OI O05 OOI 0005 0001
G R A I N S IZE M I L L I M E T E R S
G R A V E L S A N D[ COBBLES SILT OR CLAYCOARSE | F I N E COARSE M E D I U M F I N E
New England Governors Conf New Bedford Harbor GRAIN SIZE CURVE Boston Massachusetts Investigation STATION 27
New Bedford Massachusetts UPPER 10 CM
OGEOTECHNICAL ENGINEEFXS IN r WINCHESTER bull MASSACHUSETTS Prefect 82990 7uly 30 1982 Fig ] 0
US STANDARD SIEVE OPENING IN INCHES US STANDARD SIEVE NUMBERS HYDROMETER
s46 4 3 2 l2 1 fe 3 4 6 8 10 14 16 20 3O 40 50 70 100 140 200 IOOshy
-lt ^
^ QA v 10
V vgtn Ls - yrgt
tshy
H 70 - ^O Jn X TOshy19 UJ
UJ
A f gtshy 60 6deggtshym
V ltr w laquon z degdeg u 1- k
z An lt Zpound 40
u UJ ce ^ o
s - 7H OLS 30
UJ 0
2O PA
V IQ
~shy
0 5DO IOO 50 IO 5 1 O5 OI - 005 001 OX)05 OOOI
GRAIN SIZE MILLIMETERS
GRAVEL SAND [ COBBLES SILT OR CLAY COARSE 1 FINE COARSE MEDIUM FINE
n m
J
3
0
C
C
OA
RS
ER
B
O
New England Governors Conf New Bedford Harbor GRAIN SIZK CURVE Boston Massachusetts Investiqation STATION 29
New Bedford Massachusetts UPPER 10 CM CEOTECHNICAL ENGINEERS IN r
WINCHESTER bull MASSACHUSETTS Project 82990 July 30 1982 Fiq 12
US STANDARD SIEVE OPENING IN INCHES US STANDARD SIEVE NUMBERS HYDROMETER
6 4 3 2 l 1 2 3a 3 4 6 810 14 16 20 30 40 50 70 100 140 200
100 Tmdashbull bull bull 1 1 i 1mdash 1 i 1mdash rl 1mdash itr i il i il i 1 imdash h-raquo 1 1 iii i 1 bull t i 1 raquoii 1 Ji i ih i-bulllaquoX
imdashi 1 1 1 i i i i i 1 1 r n
s 9O shy 10
k
20
1-^ bullraquo X 7O (9 UJ
finou bull
CO
DC
pound 50shy
30
A r
1 C
g Lu
~gt~
BR
SE
R
UL k
O
l 0
CO
A
J 1 ^
o V UJ oc
0
JJJ 3O 7 n tt Ui Ngts a
Niin shy 90
O mdash mdash mdash i i j j 5ltDO 100 50 10 5 1 05 OI O05 001 OSO5 0001
GRAIN SIZE MILLIMETERS
GRAVEL SAND COBBLES SILT OR CLAY COARSE | FINE COARSE MEDIUM | FINE
New England Governors Conf New Bedford Harbor GRAIN SIZE CURVE
Boston Massachusetts Investigation STATION 29 New Bedford Massachusetts LOWER 10 CM
X-jK GEOTECHN1CAL ENGINEERS INC
1 3 bull
VL WINCHESTER bull MASSACHUSETTS Project 82990 July 30 1982 Fig 13
Table 1 Summary of sampling inforroaiton for sediment samples collected in the Acushnet River estuary on July 13 1982
Hater Core Station Time Depth Sampling Length Sample Processing and Location3 Date (local) (m) Equipment (cm) Preservation Methods Sample Identification
9 71382 1355 1 Push 36 Composite in Teflon jar NB-9 (Composite)-82-2192 corer store at 4 C
9 71382 1400 1 Push 48 Cap core tube store at NB-9 (0-10 cm)-82-2178 corer 4 C NB-9 (38-48 cm)-82-2179
11 71382 1405 12 Push 36 Composite in Teflon jar NB-11 (Composite 1-82-2193 corer store at 4 C
11 71382 1410 12 Push 36 Cap core tube store at NB-11 (0-10 cm)-82-2180 corer 4 C NB-11 (26-36 cm)-82-2181
16 71382 1520 17 Push 27 Composite in Teflon jar NB-16 (Composite) -82-2194 corer store at 4 C
16 71382 1525 17 Push 43 Cap core tube store at NB-16 (0-10cm)-82-2182 corer 4 C NB-16 (33-43 cm)-82-2183
21 71382 1420 1 Push 36 Composite in Teflon jar NB-21 (Composite)-82-2195 corer store at 4 C
21 71382 1425 1 Push 39 Cap core tube store at NB-21 (0-10cm)-82-2184 corer 4 C NB-21 (29-39 cm)-82-2185
27 71382 1445 15 Push 38 Composite in Teflon jar NB-27 (Composite)-82-2196 corer store at 4 C
27 71382 1450 15 Push 44 Cap core tube store at NB-27 (0-10 cm)-82-2186 corer 4 C NB-27 (34-44 cm)-82-2187
29 71382 1500 1 Push 79 Composite in Teflon jar NB-29 (Composite)-82-2197 corer store at 4 C
29 71382 1505 1 Push 94 Cap core tube store at NB-29 (0-10 cm)-82-2188 corer 4 C NB-29 (84-94 cm)-82-2189
31 71382 1435 06 Push 33 Composite in Teflon jar NB-31 (Composite ) -82-2198 corer store at 4 C
31 71382 1440 06 Push 31 Cap core tube store at NB-31 (0-10 cm)-82-2190 corer 4 C NB-31 (21-31 cm)-82-2191
aAll stations were located using navigational markers placed by the Coast Guard Providence Rhode Island
^ifeO-^UV 4^r Vy- bull Aciishnet Tiifn ~rSf~ bull -~ bullbullpoundbullbullbull
0 bull 100 200 300 400
1
SCALE IN FEET
500
OIP |^r-7
Kar i L^ ltlaquo T
-bull bullshy -bull shy - = bullbullbull vr L--V-To5^1
12 33 bull bull Two additional samples I | taken 300 down stream
Figure 1 Location of sampling stations in Acushnet River Stations denoted as bull were occupied by US Coast Guard in April 1982 Stations denoted as (bull) were reoccupied by ERGO on July 13 1982
Table 2 Results of bulk analysis of sediment samples
Concentration (ppm dry weight )a ERCO ID IC-82- Sample Description As Cd Cr Cu Pb Hg Ni V Zn PCBb
2178 Station 9 shy 0-10 cm 16 20 740 1700 930 13 113 150 3600 16700 38370 2179 Station 9 - 38-48 cm 13 69 87 820 1 000 19 23 33 3700 No sample
(13) (75) (120) (910) (1100) (18) (23) (32) (4000)
2180 Station 11 shy 0-10 cm 13 34 716 840 560 11 82 100 1800 1200 320 2181 Station 11 shy 26-36 cm 79 071 36 110 150 009 89 28 200 28
2182 Station 16 - 0-10 cm 53 077 32 60 70 lt03 12 16 170 190 20 2183 Station 16 - 33-43 cm 74 013 25 53 39 lt03 78 24 28 2
2184 Station 21 - 0-10 cm 23 33 680 580 310 lt03 97 133 1000 750 1290 2185 Station 21 - 29-39 cm 94 078 40 27 25 lt03 11 31 69 150
2186 Station 27 - 0-10 cm 93 17 440 730 420 057 76 64 1200 1980 66500 2187 Station 27 - 34-44 cm 99 068 38 20 420 lt03 12 38 51 27
2188 Station 29 - 0-10 cm 13 21 830 1200 130 10 123 13 1400 1130 430 2189 Station 29 - 84-94 cm 81 024 28 64 37 lt03 87 16 31 9
2190 Station 31 - 0-10 cm 22 15 520 1800 1400 24 68 98 4400 2900 1860 2191 Station 31 - 21-31 cm 76 60 83 540 1000 16 28 27 3800 2
(61) (49) (62) (420) (780) (10) (20) (19) (2700)
Concentration Ranges for Classification by Chemical Composition0
Category One lt10 lt5 lt100 lt200 lt100 lt05 lt50 lt75 lt200 lt05
Category Two 10-20 5-10 100-300 200-400 100-200 05-15 50-100 75-125 200-400 05-10
Category Three gt20 gt10 gt300 gt400 gt200 gt15 gt100 gt125 gt400 gt10
Duplicate analyses shown in parentheses
for PCB concentrations were obtained from the US Coast Guard Providence Rhode Island concentrations in the upper portion of the core were determined at the 0-1 and 5-12 to 6-12 depths in the core respectively
cMassachusetts Division of Water Pollution Control (1978) bull^Combined silt-clay percentage
Table 2 (CONT)
Grain size (wt )
ERCO ID IC-82shy Sample Description Gravel Sand Silt Clay
Water Content ()
Oil and Grease (wt) Classification
2178 2179
Station Station
9 - 0-10 cm 9 - 38-48 cm
0 624
1170 2602
6449 4816
2381 1958
692 593
6 1 5 11
3c
2180 2181
Station Station
11 shy11 shy
0-10 cm 26-36 cm
0 0
3152 3112
5099 3800
1749 3088
556 549
1 0 68 23
3c
2182 2183
Station Station
16 shy16 shy
0-10 cm 33-43 cm
189 0
5230 173
3136 7282
1445 2545
350 420
0 0 061 005
3c j)
2184 2185
Station Station
21 shy21 shy
0-10 cm 29-39 cm
0 423
1176 5475
6939 4629
18185 2773
520 558
1 0 41 03
3c
2186 2187
Station Stat ion
27 shy27 shy
0-10 cm 34-44 cm
0 0
5212 1066
3045 5963
1743 2971
547 569
2 0 97 02
3c
2188 2189
Station Station
29 shy29 shy
0-10 cm 84r94 cm
163 0
1576 204
5393 7043
2868 2753
667 463
1 0 83 01
3c
2190 2191
Station Station
31 shy31 shy
0-10 cm 21-31 cm
152 117
946 3606
4515 4423
4387 1851
669 582
3 1 47 24
3c
Concentration Ranges for Classification by Physical Characteristics0
Type A
Type B
mdash
mdash
mdash
mdash
lt60d
- shy 60-90d
- shy
- shy
lt40
40-600
lt05
0 5-10
Type C mdash
shy- - shy gt90d - shy gt60 gt 10
- Text3
- barcode 268640
- barcodetext SDMS DocID 268640
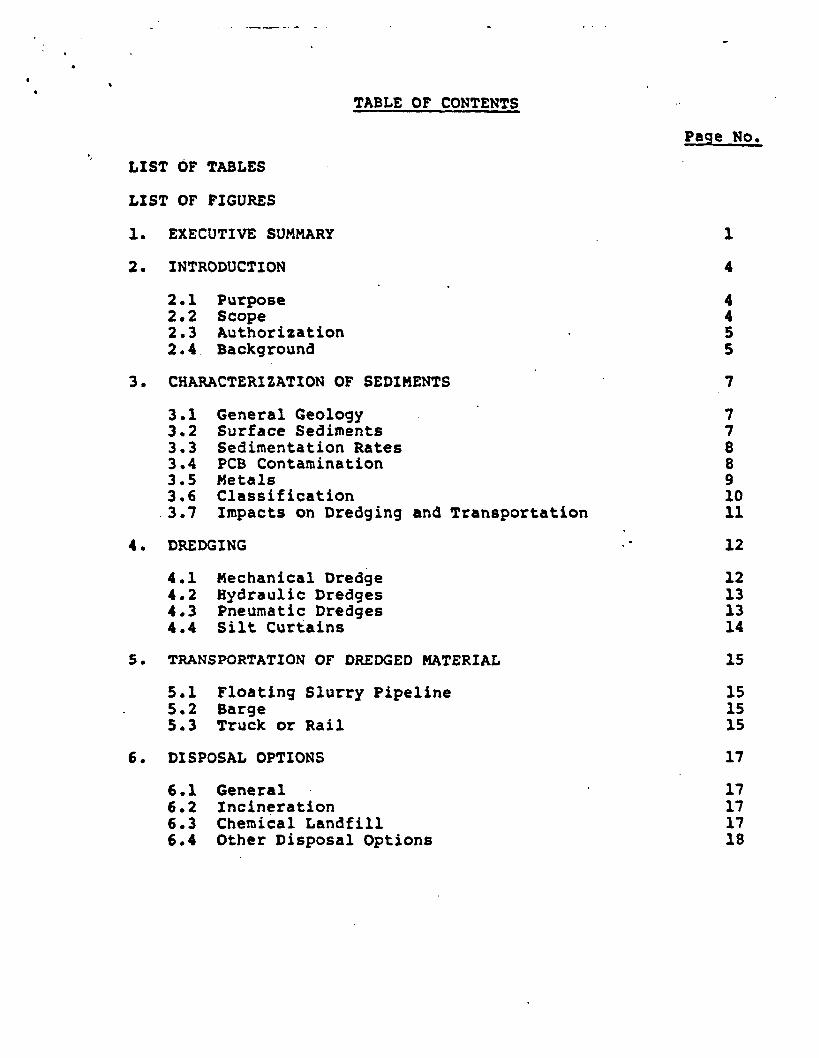
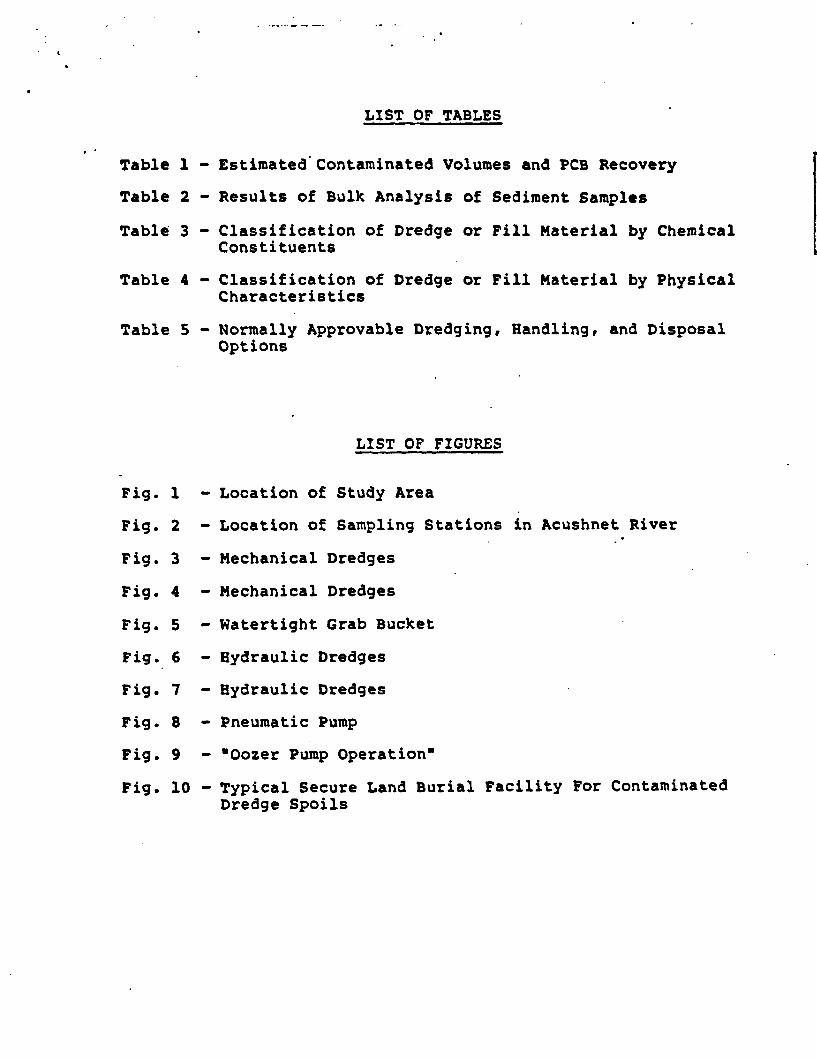
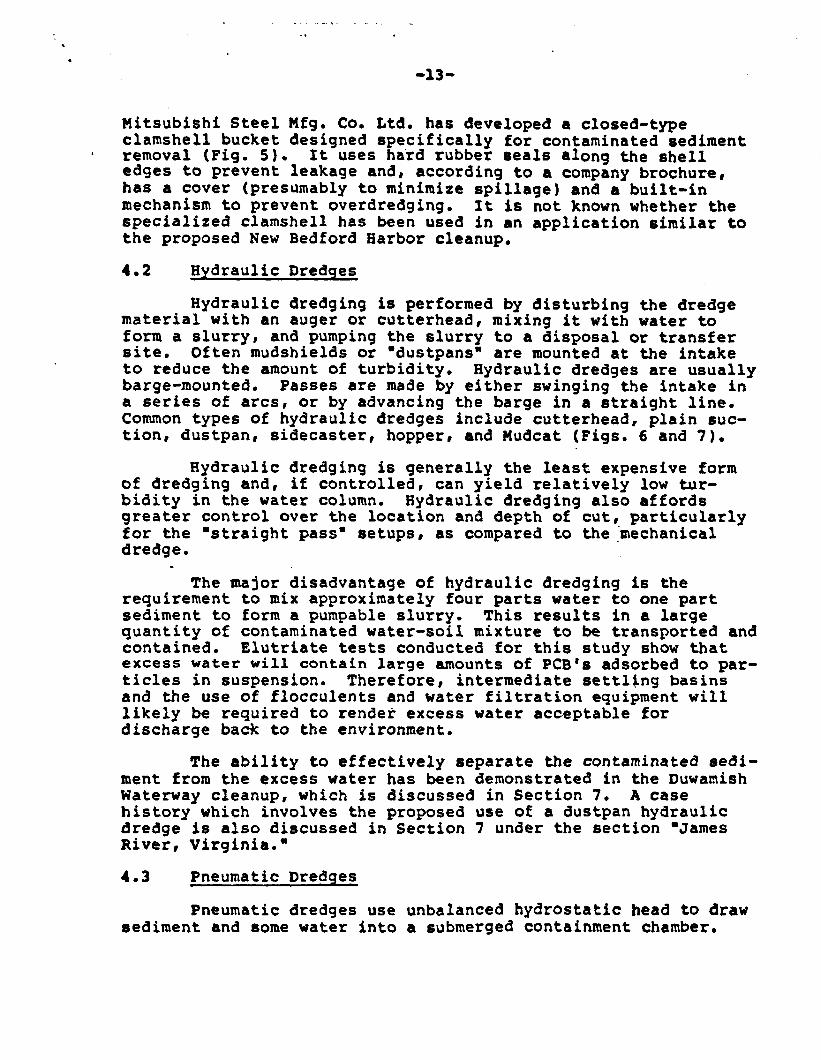
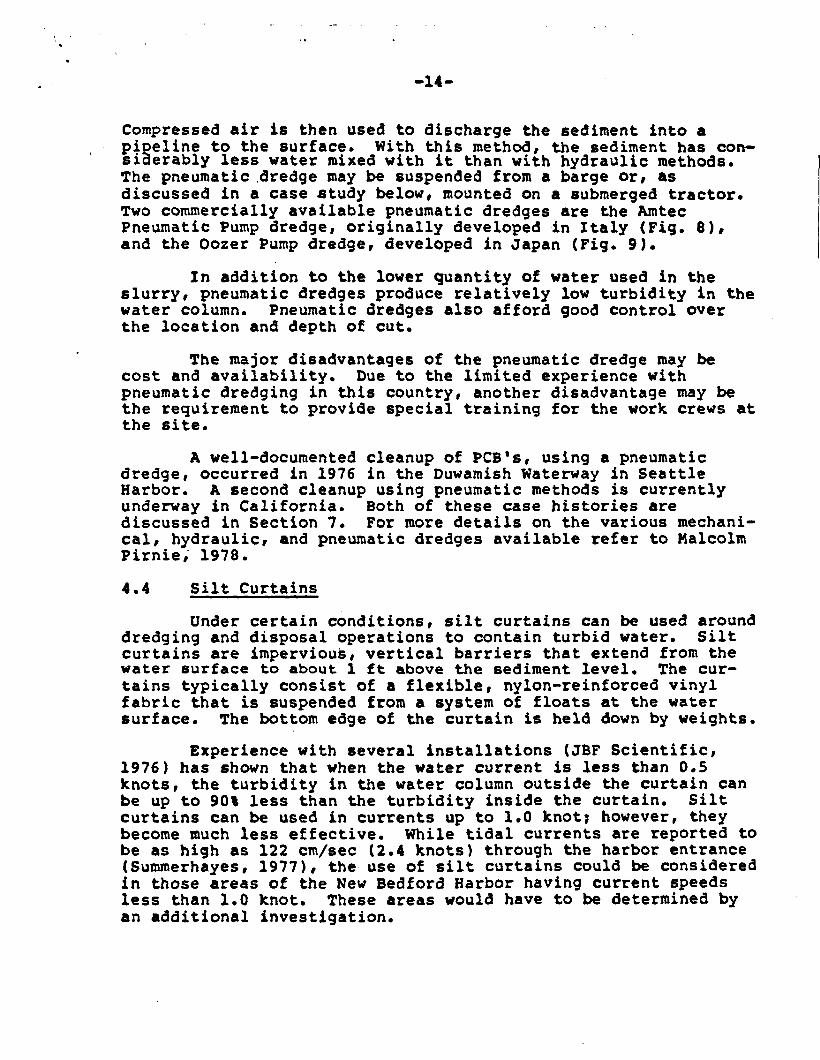