geospatial resolution of human and bacterial diversity ... · new york city (nyc) subway system,...
TRANSCRIPT

Article
Geospatial Resolution of H
uman and BacterialDiversity with City-Scale MetagenomicsGraphical Abstract
Highlights
d Almost half of all DNA present on the subway’s surfaces
matches no known organism.
d Hundreds of species of bacteria are in the subway, mostly
harmless. More riders bring more diversity.
d One station flooded during Hurricane Sandy still resembles a
marine environment.
d Human allele frequencies in DNA on surfaces can mirror US
Census data.
Afshinnekoo et al., 2015, CELS 1, 1–15July 29, 2015 ª2015 The Authorshttp://dx.doi.org/10.1016/j.cels.2015.01.001
Authors
Ebrahim Afshinnekoo,
Cem Meydan, ..., Shawn Levy,
Christopher E. Mason
In Brief
Afshinnekoo et al. describe a city-scale
molecular profile of DNA collected from a
city’s subway system, public surfaces,
and one waterway. These data enable a
baseline analysis of bacterial, eukaryotic,
and aracheal organisms in the built
environment of mass transit and urban
life.

Please cite this article in press as: Afshinnekoo et al., Geospatial Resolution of Human and Bacterial Diversity with City-Scale Metagenomics, CELS(2015), http://dx.doi.org/10.1016/j.cels.2015.01.001
Cell Systems
Article
Geospatial Resolution of Human and BacterialDiversity with City-Scale MetagenomicsEbrahim Afshinnekoo,1,2,3,21 Cem Meydan,1,2,21 Shanin Chowdhury,1,2,4 Dyala Jaroudi,1,2 Collin Boyer,1,2
Nick Bernstein,1,2 Julia M. Maritz,5 Darryl Reeves,1,2,6 Jorge Gandara,1,2 Sagar Chhangawala,1,2 Sofia Ahsanuddin,1,2,7
Amber Simmons,1,2 Timothy Nessel,8 Bharathi Sundaresh,8 Elizabeth Pereira,8 Ellen Jorgensen,9
Sergios-Orestis Kolokotronis,10 Nell Kirchberger,1,2 Isaac Garcia,1,2 David Gandara,1,2 Sean Dhanraj,7 Tanzina Nawrin,7
Yogesh Saletore,1,2,6 Noah Alexander,1,2 Priyanka Vijay,1,2,6 Elizabeth M. Henaff,1,2 Paul Zumbo,1,2 Michael Walsh,11
Gregory D. O’Mullan,3 Scott Tighe,12 Joel T. Dudley,13 Anya Dunaif,14 Sean Ennis,15,16 Eoghan O’Halloran,15
Tiago R. Magalhaes,15,16 Braden Boone,17 Angela L. Jones,17 Theodore R. Muth,7 Katie Schneider Paolantonio,5
Elizabeth Alter,18 Eric E. Schadt,13 Jeanne Garbarino,14 Robert J. Prill,19 Jane M. Carlton,5 Shawn Levy,17
and Christopher E. Mason1,2,20,*1Department of Physiology and Biophysics, Weill Cornell Medical College, New York, NY 10065, USA2The HRH Prince Alwaleed Bin Talal Bin Abdulaziz Alsaud Institute for Computational Biomedicine, Weill Cornell Medical College, New York,
NY 10065, USA3School of Earth and Environmental Sciences, City University of New York (CUNY) Queens College, Flushing, NY 11367, USA4CUNY Hunter College, New York, NY 10065, USA5Center for Genomics, New York University, New York, NY 10003, USA6Tri-Institutional Program on Computational Biology and Medicine (CBM), New York, NY 10065, USA7CUNY Brooklyn College, Department of Biology, Brooklyn, NY 11210, USA8Cornell University, Ithaca, NY 14850, USA9Genspace Community Laboratory, Brooklyn, NY 11238, USA10Department of Biological Sciences, Fordham University, Bronx, NY 10458, USA11State University of New York, Downstate, Brooklyn, NY 11203, USA12University of Vermont, Burlington, VT 05405, USA13Icahn School of Medicine at Mount Sinai, New York, NY 10029, USA14Rockefeller University, New York, NY 10065, USA15Academic Centre on Rare Diseases, School of Medicine and Medical Science, University College Dublin 4, Ireland16National Centre for Medical Genetics, Our Lady’s Children’s Hospital, Dublin 12, Ireland17HudsonAlpha Institute for Biotechnology, Huntsville, AL 35806, USA18CUNY York College, Jamaica, NY 11451, USA19Accelerated Discovery Lab, IBM Almaden Research Center, San Jose, CA 95120, USA20The Feil Family Brain and Mind Research Institute, New York, NY 10065, USA21Co-first author
*Correspondence: [email protected]
http://dx.doi.org/10.1016/j.cels.2015.01.001
This is an open access article under the CC BY license (http://creativecommons.org/licenses/by/3.0/).
SUMMARY
The panoply of microorganisms and other speciespresent in our environment influence human healthand disease, especially in cities, but have not beenprofiled with metagenomics at a city-wide scale. Wesequenced DNA from surfaces across the entireNew York City (NYC) subway system, the GowanusCanal, and public parks. Nearly half of the DNA(48%)does notmatchany knownorganism; identifiedorganisms spanned 1,688 bacterial, viral, archaeal,and eukaryotic taxa, which were enriched for harm-lessgeneraassociatedwithskin (e.g.,Acinetobacter).Predicted ancestry of humanDNA left on subway sur-faces can recapitulate U.S. Census demographicdata, and bacterial signatures can reveal a station’shistory, such asmarine-associated bacteria in a hurri-cane-flooded station. Some evidence of pathogenswas found (Bacillus anthracis), but a lack of reportedcases in NYC suggests that the pathogens represent
CEL
a normal, urban microbiome. This baseline metage-nomic map of NYC could help long-term disease sur-veillance, bioterrorism threat mitigation, and healthmanagement in the built environment of cities.
INTRODUCTION
The microbiome represents the diversity of the microorganisms
present in an environment, and the human microbiome has been
increasingly recognized as an integral component of human
health and disease (Peterson et al., 2009). In the average human,
bacterial cells outnumber human cells by a 10:1 ratio (Qin et al.,
2010), contribute as much as 36% of the active molecules pre-
sent in the human bloodstream (Hood, 2012), and serve as a
source of both pathogen protection (Vaarala, 2012) and risk
(Markle et al., 2013). Thus, it is paramount to understand bacte-
rial, viral, and metagenomic sources and distributions and how
humans may interact with (or acquire) new commensal species
or dangerous pathogens (Gire et al., 2014). This is especially
important in dense human environments such as cities, wherein
CELS 1, 1–15, July 29, 2015 ª2015 The Authors 1
S 1
A B
C D E
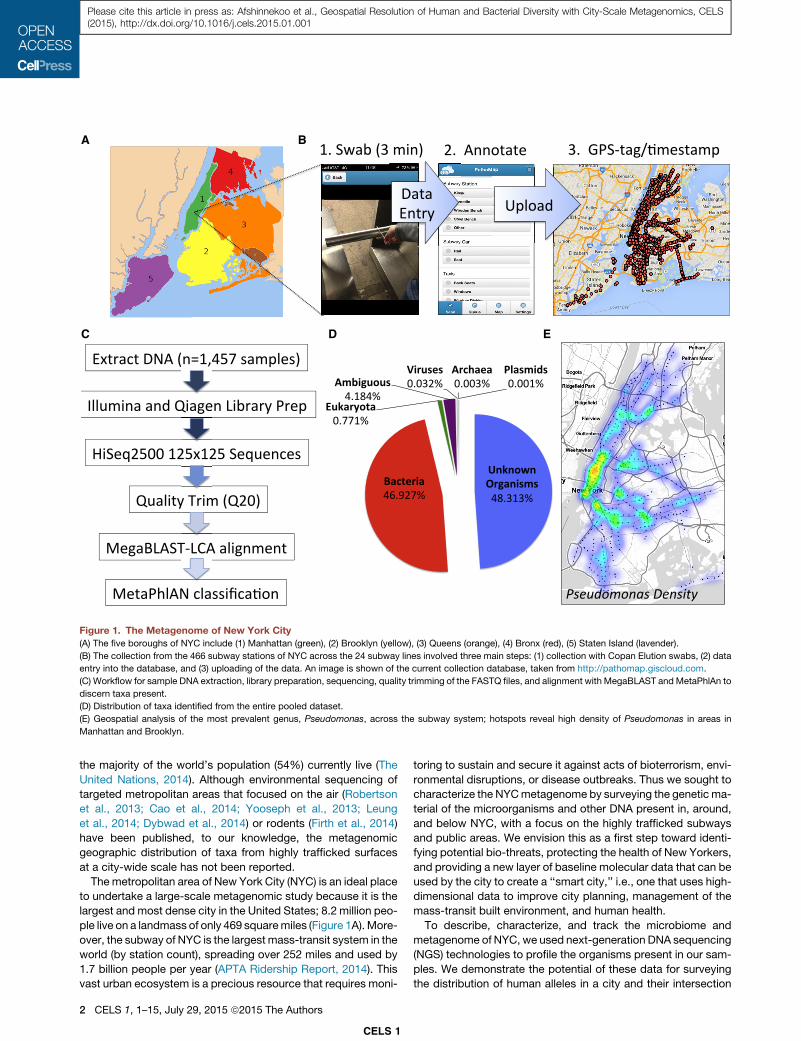
Figure 1. The Metagenome of New York City
(A) The five boroughs of NYC include (1) Manhattan (green), (2) Brooklyn (yellow), (3) Queens (orange), (4) Bronx (red), (5) Staten Island (lavender).
(B) The collection from the 466 subway stations of NYC across the 24 subway lines involved three main steps: (1) collection with Copan Elution swabs, (2) data
entry into the database, and (3) uploading of the data. An image is shown of the current collection database, taken from http://pathomap.giscloud.com.
(C) Workflow for sample DNA extraction, library preparation, sequencing, quality trimming of the FASTQ files, and alignment with MegaBLAST andMetaPhlAn to
discern taxa present.
(D) Distribution of taxa identified from the entire pooled dataset.
(E) Geospatial analysis of the most prevalent genus, Pseudomonas, across the subway system; hotspots reveal high density of Pseudomonas in areas in
Manhattan and Brooklyn.
Please cite this article in press as: Afshinnekoo et al., Geospatial Resolution of Human and Bacterial Diversity with City-Scale Metagenomics, CELS(2015), http://dx.doi.org/10.1016/j.cels.2015.01.001
the majority of the world’s population (54%) currently live (The
United Nations, 2014). Although environmental sequencing of
targeted metropolitan areas that focused on the air (Robertson
et al., 2013; Cao et al., 2014; Yooseph et al., 2013; Leung
et al., 2014; Dybwad et al., 2014) or rodents (Firth et al., 2014)
have been published, to our knowledge, the metagenomic
geographic distribution of taxa from highly trafficked surfaces
at a city-wide scale has not been reported.
The metropolitan area of New York City (NYC) is an ideal place
to undertake a large-scale metagenomic study because it is the
largest and most dense city in the United States; 8.2 million peo-
ple live on a landmass of only 469 squaremiles (Figure 1A).More-
over, the subway of NYC is the largest mass-transit system in the
world (by station count), spreading over 252 miles and used by
1.7 billion people per year (APTA Ridership Report, 2014). This
vast urban ecosystem is a precious resource that requires moni-
CELS 1
2 CELS 1, 1–15, July 29, 2015 ª2015 The Authors
toring to sustain and secure it against acts of bioterrorism, envi-
ronmental disruptions, or disease outbreaks. Thus we sought to
characterize the NYCmetagenome by surveying the genetic ma-
terial of the microorganisms and other DNA present in, around,
and below NYC, with a focus on the highly trafficked subways
and public areas. We envision this as a first step toward identi-
fying potential bio-threats, protecting the health of New Yorkers,
and providing a new layer of baseline molecular data that can be
used by the city to create a ‘‘smart city,’’ i.e., one that uses high-
dimensional data to improve city planning, management of the
mass-transit built environment, and human health.
To describe, characterize, and track the microbiome and
metagenome of NYC, we used next-generation DNA sequencing
(NGS) technologies to profile the organisms present in our sam-
ples. We demonstrate the potential of these data for surveying
the distribution of human alleles in a city and their intersection

Table 1. Summary of Top Taxa Per Kingdom
Bacteria Virus/Phages
No. Genus Species NCBI Taxa-ID No. Genus Species NCBI Taxa-ID
1,224 Pseudomonas stutzeri 316 74 Enterobacteria phage phiX174 374840
1,007 Stenotrophomonas maltophilia 40324 28 Epsilon15likevirus unknown unknown
939 Enterobacter cloacae 550 13 Erwinia phage ENT90 947843
728 Acinetobacter radioresistans 40216 12 Enterobacteria phage HK97 37554
675 Acinetobacter nosocomialis 106654 10 Stenotrophomonas phage phiSMA7 1343494
555 Lysinibacillus sphaericus 1421 9 Staphylcoccus phage PVL 71366
544 Enterococcus casseliflavus 37734 7 Enterobacteria phage mEp235 1147150
460 Brevundimonas diminuta 293 6 Lactococcus phage ul36 374525
428 Acinetobacter lwoffii 28090 6 Stenotrophomonas phage phiSMA9 334856
427 Bacillus cereus 1396 4 Enterococcus phage phiFL3A 673837
This table shows the most abundant species (with the corresponding NCBI Taxa-ID) by kingdom and the number of samples in which these species
were detected.
Please cite this article in press as: Afshinnekoo et al., Geospatial Resolution of Human and Bacterial Diversity with City-Scale Metagenomics, CELS(2015), http://dx.doi.org/10.1016/j.cels.2015.01.001
with orthogonal data like U.S. Census data. We also report here
the validation and functional characterization of the samples
collected, including ribosomal rRNA gene sequencing to com-
plement the shotgun sequencing, culturing of the bacteria to
test for the source of antibiotic resistance, and a characterization
of some bacterial plasmids found in the bacteria. These data
establish a city-scale, baseline metagenomic DNA profile, which
is essential for subsequent work in contextualizing the potentially
harmful, as well as neutral, bacteria and organisms that surround
and move with human populations.
RESULTS
City-Scale Metagenomic ProfilingTo create a city-wide metagenomic profile, we first built a mobile
application (‘‘app’’ for iOS and Android) in collaboration with GIS
Cloud to enable real-time entry and loading of sample metadata
directly into a database (Figure 1B). Each samplewas geo-tagged
with longitude and latitude coordinates via global positioning sys-
tem (GPS), time-stamped, andphoto-documented, andcollection
fields were completed for data entry and included the swabbing
time, the scientist performing the collection, and collection notes
(Figure 1B). This protocol enabled a built-in sample confirmation,
whereinwecould confirmthat thesample IDof theswab in the lab-
oratory matched the ID in the photo taken during the collection.
We collected 1,457 samples acrossNYC. These included sam-
ples from all open subway stations (n = 466) for all 24 subway
lines of the NYC Metropolitan Transit Authority (MTA), the Staten
Island Railway (SIR), 12 sites in the Gowanus Canal, four public
parks, and one closed subway station that was submerged dur-
ing the 2012 Hurricane Sandy (Superstorm Sandy). At subway
and railway stations, samples were collected in triplicate with
one sample taken inside a train at the station and two samples
from the station itself, with a serial rotation between the kiosks,
benches, turnstiles, garbage cans, and railings (see Experimental
Procedures). We obtained a median of 188 ng of DNA across all
surfaces (Figure S1) in the city. We used shotgun sequencing to
generate a total of 10.4 billion paired-end (125 3 125) DNA
sequence reads, sequencing all samples to an average depth
of 3.6M reads. Datawere deposited and verified by the Sequence
CEL
Read Archive (project PRJNA271013 and study SRP051511); all
samples’ metadata and locations can be browsed at http://www.
pathomap.org and in the supplemental files.
We analyzed the metagenomic and microbial communities
present in our samples using several tools (see detailed methods
below). Briefly, all reads were first trimmed for 99% accuracy
(Q value 20), followed by an alignment to all known organisms
in NCBI with MegaBLAST-LCA (Wolfsberg and Madden, 2001)
(lowest common ancestor [LCA] assignment by MEGAN) (Huson
et al., 2007) and the Metagenomic Phylogenetic Analysis tool
(MetaPhlAn v2.0) (Segata et al., 2012). Samples with predicted
pathogens were further characterized with Sequence-based
Ultra-Rapid Pathogen Identification (SURPI) (Naccache et al.,
2014) and the Burrows-Wheeler Aligner (BWA) (Li and Durbin,
2010). A total of 21,885 and 1,688 taxa were assigned with
MegaBLAST and MetaPhlAn, respectively, with 15,152 and
637 specific to the species level (Data Tables 1 and 2), respec-
tively. Based on our sequencing of a positive control sample
with titrated levels of known bacterial species (Figure S2; see
Experimental Procedures), we set our thresholds of MegaBLAST
andMetaPhlAn to enable an estimatedminimum 99% specificity
and 91% sensitivity for identifying taxa at the species level (Fig-
ure S3 and Tables S1 and S2).
We found that nearly half of the reads (48.3%) did not match to
any known organism, underscoring the vast wealth of unknown
species that are ubiquitous in urban areas (Figure 1D). These
numbers are similar to the range recently reported for the ‘‘air mi-
crobiome’’ of NYC, where 25%–62% of sequenced DNA did not
match any known organism (Yooseph et al., 2013). Of those reads
assigned to an organism, we next separated out each species by
abundance. The largest assigned categorywas for cellular organ-
isms (48%), withmost of these coming frombacteria (46.9%of all
reads), followed by relatively small subsets of readsmatching eu-
karyotes (0.8%), viruses (0.03%),archaea (0.003%),andplasmids
(0.001%). The most prevalent bacterial species on the subway
was Pseudomonas stutzeri, with enrichment in lower Manhattan
(Figure 1E), followed by strains from Enterobacter and Stenotro-
phomonas. Notably, all of the most consistently abundant viruses
were bacteriophages (Table 1), whichwere detected concomitant
with their bacterial hosts in our dataset (Data Tables 1 and 2).
S 1
CELS 1, 1–15, July 29, 2015 ª2015 The Authors 3

A B
D
F G
E
C
Figure 2. Human Ancestry Predictions from Subway Metagenomic Data Mirror Census DataUsing ancestry-informative alleles from the 1000 Genomes Project and the ancestry prediction tool AncestryMapper, we were able to recapitulate the likely
demographics of stations, based on the DNA left on the surfaces (A–G). We calculated the RMSD (gray bars) of the calculated ancestry versus the 2010 census
data for each station (left). The colors for each ancestry are shown on top, and the stacked barplots show the proportion of 100%of alleles.We have used K = 4 for
admixture. In our datasets, the four ancestral components correspond to African/European/Asian/Ameridian. The Ameridian component has been matched to
the Hispanic census designation; this is an approximation, as hispanics generally also have strong European components. For plots (B)–(G), horizontal black lines
represent the percentagematch (y axis) of alleles of each known ancestry (x axis); the top four ranking ancestries are highlighted using text labels colored tomatch
census legends in (C), (E), and (G). In Canarsie, Brooklyn (B and C), an increase in African alleles was predicted, which matched the census data (green), and the
same trend was observed for a primarily Hispanic area in the Bronx (Mount Eden). In one area of Manhattan near Penn Station, we found a higher incidence of
European alleles concomitant with an increase in Asian alleles. Areas of the city (e.g., Chinatown) are annotated directly in the maps.
Please cite this article in press as: Afshinnekoo et al., Geospatial Resolution of Human and Bacterial Diversity with City-Scale Metagenomics, CELS(2015), http://dx.doi.org/10.1016/j.cels.2015.01.001
These resultsdemonstrate the ability ofmetagenomicdata tohelp
to confirm the presence of a bacterial species, as the phages pro-
vide a cross-kindgom mirror of the abundance of their hosts.
HumanDNAwas the fourthmost abundant eukaryotic species,
behind two insects,Ceratitis capitata (Mediterranean fruit fly) and
Dendroctonus ponderosae (mountain pine beetle). Although
these are the top-ranking matches according to a BLAST search
for these reads (Table S3), the high incidence of Dendroctonus
ponderosae may represent the presence of another, yet-to-be
sequenced insectgenome that ismoreprevalent in anurban,built
environment (e.g., cockroaches are not yet in the NCBI data-
base), given that these species share conservedgenes like glyco-
side hydrolase (Eyun et al., 2014). Thus, although there is poten-
CELS 1
4 CELS 1, 1–15, July 29, 2015 ª2015 The Authors
tial evidence for hundreds of other plants, fungi, and eukaryotic
species in the subway (Data Table 1), the relatively fewcompleted
eukaryotic genomes focused our analysis on one of the best an-
notated genomes: the human genome.
Human Allele Frequencies on Surfaces Mirror U.S.Census DataDespite sampling surfaces from areas of high human traffic and
contact, we found that only an average of 0.2%of reads uniquely
mapped to human genome with BWA (hg19, see Experimental
Procedures). However, enough reads matched to the human
genome to enable discovery of 5.3 million non-reference alleles
from all samples across the city (Figure 2). We compared our

Please cite this article in press as: Afshinnekoo et al., Geospatial Resolution of Human and Bacterial Diversity with City-Scale Metagenomics, CELS(2015), http://dx.doi.org/10.1016/j.cels.2015.01.001
sample collection map at pathomap.giscloud.com and with
the predicted census demographics of the same GPS coordi-
nate, using the 2010 U.S. Census Data (obtained from http://
demographics.coopercenter.org). We hypothesized that the
aggregate human genetic variants of a single subway station
might echo the demographics of the reported population
from the census data. We examined areas of NYC that
showed a grouping in reported ethnicity (self-reported as
White, Black, Asian, Hispanic) from all areas of an image-
segmented U.S. Census Map (Figure S4) (Clinton et al.,
2010), then compared these to samples wherein we observed
enough human-mapping reads to call variants (see Supple-
mental Experimental Procedures). We then intersected these
variants with ancestry-informative markers from the 1000 ge-
nomes (1KG) dataset, then used AncestryMapper (Magalhaes
et al., 2012) and Admixture (Alexander et al., 2009) to calcu-
late the likely allelic admixture from the reference 1KG
populations.
We observed that the human DNA from the surfaces of the
subway could recapitulate the geospatial demographics of the
city in U.S. Census data (Figures 2A–2G), relative to the refer-
ence populations used by Admixture and AncestryMapper.
We found that the deviation from expected proportions of the
calculated census data exhibited a wide range (Figure 2A),
from nearly no deviation (root-mean-square deviation,
RMSD = 0.03) to more discordant predicted/observed allele fre-
quencies (RMSD = 0.53). For example, sample P00553 (Fig-
ure 2B) showed a majority African American and Yoruban
ancestry for a mostly black area in Brooklyn (Canarsie), and
this was nearly exactly calculated from the observed human al-
leles (Figure 2B). Also, in a primarily Hispanic/Amerindian area
of the Bronx, AncestryMapper showed the top three ancestries
to be Mexican, Colombian, and Puerto Rican (Figures 2D and
2E), which also correlated well with the human alleles. This
site also showed an increase in Asian ancestry (Han Chinese
and Japanese), which matches an adjacent area from the
census data (Figure 2D). Finally, we observed that an area of
Midtown Manhattan showed an increase in British, Tuscan,
and European alleles, with some alleles predicted to be Chinese
(Figure 2F), which also matches the census demographics of
the neighborhood.
Bacterial Genome Analysis Identifies Rare PotentialPathogensWe next investigated the bacterial content identified in our
samples (Figure 1C), which generated a total of 1,688 bacterial
taxa, with 637 of those specified down to the species level
(Data Table 2). An annotation of the genus and species for
our bacteria (Data Table 3) showed that the majority of the bac-
teria found on the surfaces of the subway (57%) are not asso-
ciated with any human disease, whereas about 31% represent
potentially opportunistic bacteria that might be relevant for im-
mune-compromised, injured, or disease-susceptible popula-
tions. A smaller proportion (12%) of the detected taxa with spe-
cies-level identification were known pathogens, including
Yersinia pestis (Bubonic plague) and Bacillus anthracis
(anthrax).
To further examine these putative pathogens, we focused only
on species found by BLAST and MetaPhlAn and then compared
CEL
our species to those annotated in the database of the National
Select Agent Registry from the Centers for Disease Control
(CDC) and the Pathosystems Resource Integration Center
(PATRIC) lists of known pathogenic bacteria. At least three
taxa on the CDC’s list of infectious agents and four organisms
on the PATRIC list, including Bacillus anthracis, Yersinia pestis,
and Staphylococcus aureus, showed evidence of being present
in several stations, or dozens of stations (Table S4). It is worth
noting that most strains of E. coli are benign, and these data
do not (by themselves) indicate that these reads were from live
pathogens. The presence of E. coli, however, indicates potential
fecal contamination on surfaces or persons with the presence of
E. coli skin infections, which is why it is listed on the PATRIC
database.
Although these data provide evidence of the ‘‘core’’ genome of
these organisms being identified, it could be that none of the fac-
tors and sequences that drive pathogenicity were present. Upon
examination of the putative pathogens’ virulence plasmids, we
found further evidence of a baseline level of pathogen presence.
Specifically, for the stationswithmatches toS. aureus, we exam-
inedthecoverageof themecAgene,ageneassociatedwithmeth-
icillin-resistant Staphylococcus aureus (MRSA) and nosocomial
infections (Chambers and Deleo, 2009). We observed up to 323
coverage of the mecA gene (Figure 3A) but a wide range
of coverage across all samples where it was present (0.23–323
coverage of the gene). We also examined the pMT1 plasmid of
Y. pestis, which is a known virulence factor that can promote
deep tissue invasion and acute infection symptoms (Lindler
et al., 1998). We observed a similarly wide range of coverage
from different samples (0.63–313) but consistent 203 coverage
across the murine toxin (yMT) gene (Figure 3B) of the pMT1
plasmid, which is considered a virulence element for Y. pestis
(Parkhill etal., 2001).WealsousedtheSURPIalgorithmtocharac-
terize thesesamples,whichalsopredictedthepresenceofeachof
these pathogen-related organisms (Figure S5). Yet based on
data from the CDC and HealthMap.org (http://www.healthmap.
org/en/), which uses machine-learning algorithms to track all re-
ported infections, there has not been a single reported case of
Y. pestis in New York City since our collections began, indicating
that these low-levelpathogens, if trulypresent,arenot likelyactive
and causing disease in people.
To determine whether viable microorganisms could be
cultured from the subway stations, we performed two experi-
ments. First, we swabbed subway stations using the same pro-
tocol and then transferred the collection to four types of LB
agar plates: one control and three with antibiotics (kanamycin,
chloramphenicol, and ampicillin). We found that all plates (18/
18) had viable bacteria that could be cultured on standard
agar plates (Figure 4A). When we tested microorganisms
cultured from swabs of the same stations, 28% (5/18) yielded
colonies resistant to standard antibiotics (Figure 4A); one sta-
tion produced a multi-drug-resistant culture. These results indi-
cate, not surprisingly, that there are live bacterial communities
present on the subway, but they also show that a substantive
proportion of these possess some resistance to commonly
used antibiotics.
We then performed a second culture experiment, combined
with sequencing, to gauge the impact of medium type and
to discern the genetic elements that may drive antibiotic
S 1
CELS 1, 1–15, July 29, 2015 ª2015 The Authors 5

A
B
Figure 3. Coverage Plots of Virulence Elements from Staphylococcus aureus and Yesinia pestis
We used the Integrative Genomics Viewer to plot the mapped number of reads from the shotgun sequence data that mapped to known virulence elements,
including (A) themecA gene fromMRSA and (B) the pMT1 plasmid from Y. pestis. Coverage depth is shown at the top of each inset, with SNPs shown as vertical
colors across the yMT gene.
Please cite this article in press as: Afshinnekoo et al., Geospatial Resolution of Human and Bacterial Diversity with City-Scale Metagenomics, CELS(2015), http://dx.doi.org/10.1016/j.cels.2015.01.001
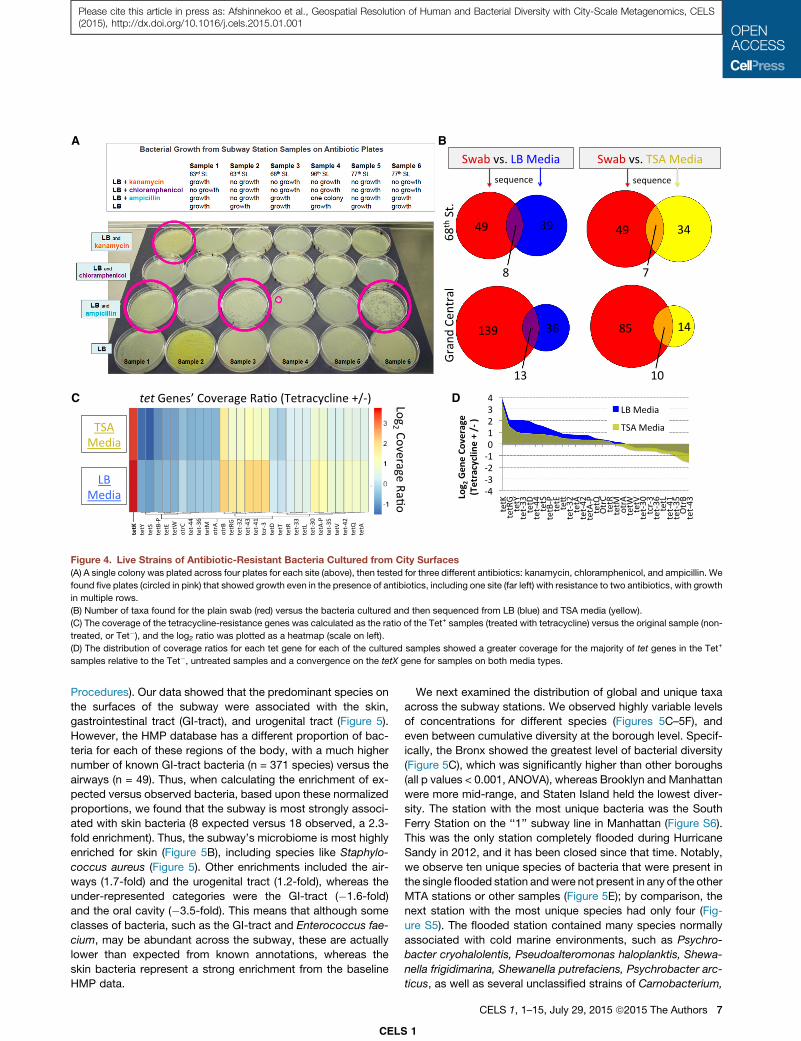
resistance. We took samples from a subset of the same sta-
tions and cultured them on LB agar medium and Trytic Soy
Agar (TSA) medium, while simultaneously testing the bacteria
for resistance to tetracycline at two different temperatures (Ta-
ble S5 and Experimental Procedures). We then sequenced the
bacteria using the same methods as above, with taxa identi-
fied by BLAST and MetaPhlAn. We observed that sequence-
based characterization of the samples consistently yielded
an identification of more species than the culture-based
methods (25%–380% increase), with an overall 20%–71% of
the overlap between both methods (Figure 4B). We observed
that the stations with the greater levels of human traffic (Grand
Central, Times Square) had the greatest diversity of taxa (Ta-
ble S5; Figure 4B), with a range of correlation of colony-form-
ing units (CFUs) and daily passengers ranging from 0.66–0.72
(Pearson R2). In all cases, as expected, the application of
tetracycline reduced the number of CFUs observed for each
collection. Finally, we used the known antibiotic resistance
CELS 1
6 CELS 1, 1–15, July 29, 2015 ª2015 The Authors
genes from the Short Read Sequence Typing for Bacterial
Pathogens (SRST2) database (Inouye et al., 2014) to examine
the presence and dynamics of the tetracycline-resistance
genes in our samples. We observed 29 of the known tetracy-
cline-resistance genes across our cultures, and we then
compared the overall coverage of each of these genes in the
samples before and after tetracycline treatment (Figure 4C).
The most significantly increased resistance gene, tetK, was
present and significantly enriched relative to all other genes
(t test, p = 0.003) across both types of media (Figure 4D);
this gene is a known genetic driver for the tetracycline-resis-
tance phenotype (Dutra et al., 2014).
Microbial Diversity Can Define Stations and SurfacesTo further catalog the types of bacteria that colonize the sub-
way’s surfaces, we used the annotations from the Human Mi-
crobiome Project (HMP), which has assigned each bacterium
to a primary area of the human body (see Experimental
A B
C D
Figure 4. Live Strains of Antibiotic-Resistant Bacteria Cultured from City Surfaces
(A) A single colony was plated across four plates for each site (above), then tested for three different antibiotics: kanamycin, chloramphenicol, and ampicillin. We
found five plates (circled in pink) that showed growth even in the presence of antibiotics, including one site (far left) with resistance to two antibiotics, with growth
in multiple rows.
(B) Number of taxa found for the plain swab (red) versus the bacteria cultured and then sequenced from LB (blue) and TSA media (yellow).
(C) The coverage of the tetracycline-resistance genes was calculated as the ratio of the Tet+ samples (treated with tetracycline) versus the original sample (non-
treated, or Tet�), and the log2 ratio was plotted as a heatmap (scale on left).
(D) The distribution of coverage ratios for each tet gene for each of the cultured samples showed a greater coverage for the majority of tet genes in the Tet+
samples relative to the Tet�, untreated samples and a convergence on the tetX gene for samples on both media types.
Please cite this article in press as: Afshinnekoo et al., Geospatial Resolution of Human and Bacterial Diversity with City-Scale Metagenomics, CELS(2015), http://dx.doi.org/10.1016/j.cels.2015.01.001
Procedures). Our data showed that the predominant species on
the surfaces of the subway were associated with the skin,
gastrointestinal tract (GI-tract), and urogenital tract (Figure 5).
However, the HMP database has a different proportion of bac-
teria for each of these regions of the body, with a much higher
number of known GI-tract bacteria (n = 371 species) versus the
airways (n = 49). Thus, when calculating the enrichment of ex-
pected versus observed bacteria, based upon these normalized
proportions, we found that the subway is most strongly associ-
ated with skin bacteria (8 expected versus 18 observed, a 2.3-
fold enrichment). Thus, the subway’s microbiome is most highly
enriched for skin (Figure 5B), including species like Staphylo-
coccus aureus (Figure 5). Other enrichments included the air-
ways (1.7-fold) and the urogenital tract (1.2-fold), whereas the
under-represented categories were the GI-tract (�1.6-fold)
and the oral cavity (�3.5-fold). This means that although some
classes of bacteria, such as the GI-tract and Enterococcus fae-
cium, may be abundant across the subway, these are actually
lower than expected from known annotations, whereas the
skin bacteria represent a strong enrichment from the baseline
HMP data.
CEL
We next examined the distribution of global and unique taxa
across the subway stations. We observed highly variable levels
of concentrations for different species (Figures 5C–5F), and
even between cumulative diversity at the borough level. Specif-
ically, the Bronx showed the greatest level of bacterial diversity
(Figure 5C), which was significantly higher than other boroughs
(all p values < 0.001, ANOVA), whereas Brooklyn and Manhattan
were more mid-range, and Staten Island held the lowest diver-
sity. The station with the most unique bacteria was the South
Ferry Station on the ‘‘1’’ subway line in Manhattan (Figure S6).
This was the only station completely flooded during Hurricane
Sandy in 2012, and it has been closed since that time. Notably,
we observe ten unique species of bacteria that were present in
the single flooded station andwere not present in any of the other
MTA stations or other samples (Figure 5E); by comparison, the
next station with the most unique species had only four (Fig-
ure S5). The flooded station contained many species normally
associated with cold marine environments, such as Psychro-
bacter cryohalolentis, Pseudoalteromonas haloplanktis, Shewa-
nella frigidimarina, Shewanella putrefaciens, Psychrobacter arc-
ticus, as well as several unclassified strains of Carnobacterium,
S 1
CELS 1, 1–15, July 29, 2015 ª2015 The Authors 7

Figure 5. Taxa Diversity and Association with Human Body Areas
Detected bacteria were annotated relative to the most commonly associated body part from the Human Microbiome Project (HMP) dataset.
(A) Of the 67 PathoMap species that matched the HMP dataset, the proportions were greatest for the GI-tract (blue), skin (green), and urogenital tract (white). The
entire circle represents 100% of the 67 species, and the sizes of each color represent the proportion of each type of bacteria.
(B) To account for the database proportions from the HMP, we calculated the log2 of the observed versus expected numbers of species found for each category,
which indicated that skin was the most predominant type of bacteria on the subway system.
(C) Boxplot of the number of species found per borough.Middle line of each section shows themedian, and the top and bottom of each box show the 75th and 25th
percentiles, respectively. Notches show the significant difference between groups (95% confidence interval).
(D and E) Heatmaps of NYC showing the density for Enterococcus faecium (D) and Staphylococcus aureus (E). Small red dots indicate the presence of a fully re-
sequenced mecA gene.
(F) Analysis of a subway station (picture on top shows the station) flooded during Hurricane Sandy. The Venn Diagram compares the unique set of 10 species in
the data from that station that did not appear in any other station or area of NYC, but 52 species overlapped with the set of 627 species present in the subway
system.
Please cite this article in press as: Afshinnekoo et al., Geospatial Resolution of Human and Bacterial Diversity with City-Scale Metagenomics, CELS(2015), http://dx.doi.org/10.1016/j.cels.2015.01.001
Cellulophaga, Flavobacterium, and Pseudoalteromonas. Some
of these species, like Shewanella frigidimarina, were previously
assumed to be Antarctic species that are usually found associ-
ated with fish (Frolova et al., 2011). The data show how the walls
and floors of the station still carry a ‘‘molecular echo’’ or micro-
biome aura (Lax et al., 2014) of the flooding of the station with
cold ocean water.
To determine whether the marine signature of the South Ferry
Station was a consequence of being coated in NYC’s waterways
during the hurricane, we compared these data to 12 sites along
the Gowanus Canal (GC) of Brooklyn, taking water samples and
then processing, extracting, and sequencing the samples in the
CELS 1
8 CELS 1, 1–15, July 29, 2015 ª2015 The Authors
same fashion as above. We observed that the taxa unique to the
hurricane-flooded, abandoned (AB) station were still distinct
from those found in the Canal in Brooklyn (Figure S7). Although
one sample (AB009) clustered with the GC samples, the majority
of the samples clustered by the taxa of each site and showed
distinct profiles. For example, the marine and Antarctic species
of the South Ferry Station were not found in the GC samples,
and the GC showed a unique enrichment for desulfobacter-
and methanogen-related bacteria and archaea (Data Table 2;
Figure S7), which may represent the industrial history of that
site and its current status as a U.S. Environmental Protection
Agency Superfund site.
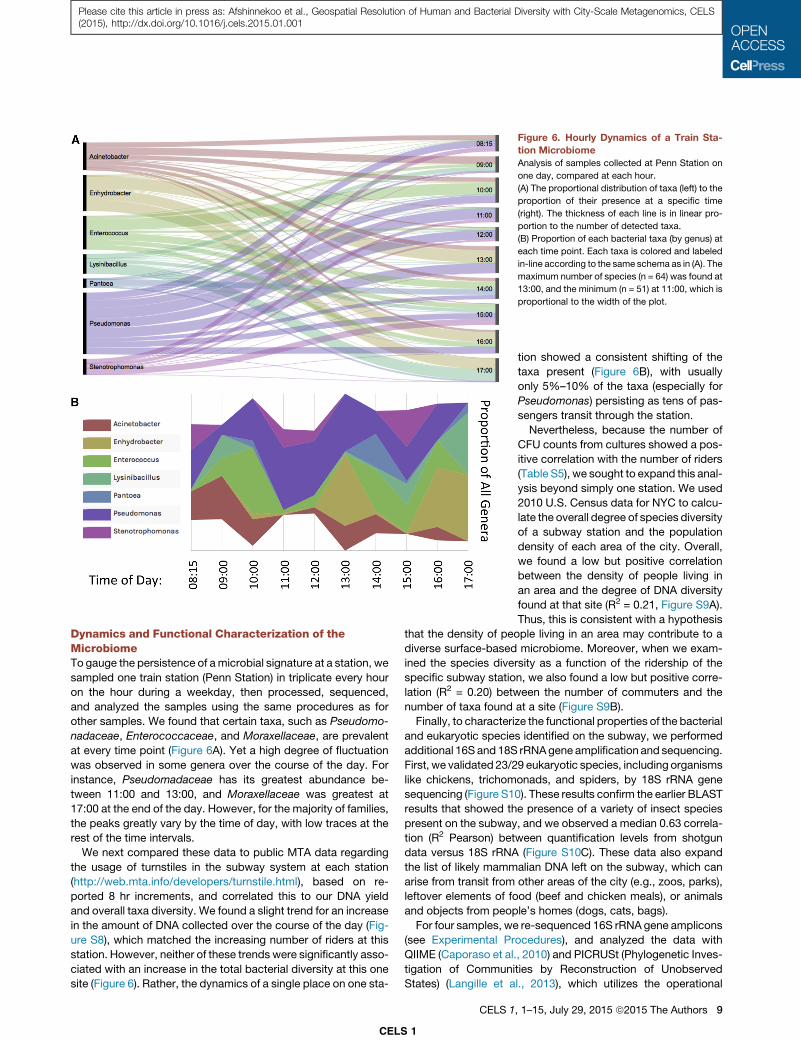
Figure 6. Hourly Dynamics of a Train Sta-
tion Microbiome
Analysis of samples collected at Penn Station on
one day, compared at each hour.
(A) The proportional distribution of taxa (left) to the
proportion of their presence at a specific time
(right). The thickness of each line is in linear pro-
portion to the number of detected taxa.
(B) Proportion of each bacterial taxa (by genus) at
each time point. Each taxa is colored and labeled
in-line according to the same schema as in (A). The
maximum number of species (n = 64) was found at
13:00, and the minimum (n = 51) at 11:00, which is
proportional to the width of the plot.
Please cite this article in press as: Afshinnekoo et al., Geospatial Resolution of Human and Bacterial Diversity with City-Scale Metagenomics, CELS(2015), http://dx.doi.org/10.1016/j.cels.2015.01.001
Dynamics and Functional Characterization of theMicrobiomeTo gauge the persistence of amicrobial signature at a station, we
sampled one train station (Penn Station) in triplicate every hour
on the hour during a weekday, then processed, sequenced,
and analyzed the samples using the same procedures as for
other samples. We found that certain taxa, such as Pseudomo-
nadaceae, Enterococcaceae, and Moraxellaceae, are prevalent
at every time point (Figure 6A). Yet a high degree of fluctuation
was observed in some genera over the course of the day. For
instance, Pseudomadaceae has its greatest abundance be-
tween 11:00 and 13:00, and Moraxellaceae was greatest at
17:00 at the end of the day. However, for the majority of families,
the peaks greatly vary by the time of day, with low traces at the
rest of the time intervals.
We next compared these data to public MTA data regarding
the usage of turnstiles in the subway system at each station
(http://web.mta.info/developers/turnstile.html), based on re-
ported 8 hr increments, and correlated this to our DNA yield
and overall taxa diversity. We found a slight trend for an increase
in the amount of DNA collected over the course of the day (Fig-
ure S8), which matched the increasing number of riders at this
station. However, neither of these trends were significantly asso-
ciated with an increase in the total bacterial diversity at this one
site (Figure 6). Rather, the dynamics of a single place on one sta-
CELS 1
CELS 1
tion showed a consistent shifting of the
taxa present (Figure 6B), with usually
only 5%–10% of the taxa (especially for
Pseudomonas) persisting as tens of pas-
sengers transit through the station.
Nevertheless, because the number of
CFU counts from cultures showed a pos-
itive correlation with the number of riders
(Table S5), we sought to expand this anal-
ysis beyond simply one station. We used
2010 U.S. Census data for NYC to calcu-
late the overall degree of species diversity
of a subway station and the population
density of each area of the city. Overall,
we found a low but positive correlation
between the density of people living in
an area and the degree of DNA diversity
found at that site (R2 = 0.21, Figure S9A).
Thus, this is consistent with a hypothesis
that the density of people living in an area may contribute to a
diverse surface-based microbiome. Moreover, when we exam-
ined the species diversity as a function of the ridership of the
specific subway station, we also found a low but positive corre-
lation (R2 = 0.20) between the number of commuters and the
number of taxa found at a site (Figure S9B).
Finally, to characterize the functional properties of the bacterial
and eukaryotic species identified on the subway, we performed
additional 16S and18S rRNAgene amplification and sequencing.
First, we validated 23/29 eukaryotic species, including organisms
like chickens, trichomonads, and spiders, by 18S rRNA gene
sequencing (Figure S10). These results confirm the earlier BLAST
results that showed the presence of a variety of insect species
present on the subway, and we observed a median 0.63 correla-
tion (R2 Pearson) between quantification levels from shotgun
data versus 18S rRNA (Figure S10C). These data also expand
the list of likely mammalian DNA left on the subway, which can
arise from transit from other areas of the city (e.g., zoos, parks),
leftover elements of food (beef and chicken meals), or animals
and objects from people’s homes (dogs, cats, bags).
For four samples, we re-sequenced 16S rRNA gene amplicons
(see Experimental Procedures), and analyzed the data with
QIIME (Caporaso et al., 2010) and PICRUSt (Phylogenetic Inves-
tigation of Communities by Reconstruction of Unobserved
States) (Langille et al., 2013), which utilizes the operational
, 1–15, July 29, 2015 ª2015 The Authors 9

Please cite this article in press as: Afshinnekoo et al., Geospatial Resolution of Human and Bacterial Diversity with City-Scale Metagenomics, CELS(2015), http://dx.doi.org/10.1016/j.cels.2015.01.001
taxonomic units (OTUs) defined by known genes to annotate the
putative metabolic and biological functions of a sample (Table
S6). The top three OTUs for all tested samples were transporters,
general function, and ABC transporters, with an enriched anno-
tation from the KEGG pathway database for ‘‘environmental in-
formation processing, membrane transport, and transporters.’’
The largest other pathway enriched in these data was annotated
as ‘‘unclassified, poorly characterized, and general function pre-
diction only.’’ These annotations also show a strong enrichment
of transporters and DNA replication and repair (including many
species with radiation resistance or desiccation resistance phe-
notypes), which may indicate the inherent need for these bacte-
ria to be continuously processing biological products from their
human hosts, as well as the molecular tools needed for survival
on primarily inert surfaces such as steel, glass, and plastic.
DISCUSSION
Whereas previous metagenomic studies have focused on tar-
geted areas in cities, this dataset represents a complete molec-
ular portrait of the distribution of human andmicrobial diversity at
a city-wide scale. Such data are critically important to ongoing
efforts that are using DNA-based sequencing methods for health
surveillance and potential disease detection (Tringe et al., 2008),
as they define the baseline levels of potential pathogens along
with normal flora (Blaser, 2014). Our data indicate that densely
populated, highly trafficked areas of human transit show strong
evidence of bacteria that are resistant to antibiotics and some
presence of potentially pathogenic organisms. But, most impor-
tantly, these potentially infectious agents are not creating wide-
spread sickness or disease. Instead, they likely represent normal
co-habitants of a shared urban infrastructure, and theymay even
be essential to maintaining such an environment (Gilbert and
Neufeld, 2014) and likely represent a normal, ‘‘healthy’’ metage-
nome profile of a city.
Indeed, these data indicate that the subway, in general, is pri-
marily a safe surface. Although evidence ofB. anthracis, Y. pestis,
MRSA, and other CDC infectious agents was found on the sub-
way system in multiple stations, the results do not suggest that
the plague or anthrax is prevalent, nor do they suggest that
NYC residents are at risk. According to the CDC, plague cases
from 1970–2012 were heavily concentrated on the West Coast
(http://www.cdc.gov/plague/maps/). Approximately seven hu-
man plague cases are reported a year, and none recently in
NYC or anywhere near NYC, and these results match those pre-
sent in HealthMap.org. This finding further supports the notion
that humans have interacted (and potentially evolved) with their
environment in such a way that even low levels of Yersinia pestis
(plague) or Bacillus anthracis (anthrax) will not necessarily confer
a risk of acquiring these pathogens.
The detection and classification of any putative pathogenic
organism depends on many factors. These factors include the
following: infective dosage, immune state of the hosts, route of
transmission, other competitive species, informatics approaches
to species identification, horizontal transfer (Smillie et al., 2011),
bacterial methylome state and unique basemodifications (Rasko
et al., 2011), and other factors of microbial genome regulation.
Notably, the evidence for these organisms came from multiple
subway locations, was collected by different people, and was
CELS 1
10 CELS 1, 1–15, July 29, 2015 ª2015 The Authors
sequenced in two different facilities, and none of these organ-
isms are studied in the laboratories where this research was con-
ducted. As such, although the evidence is strong that these
organisms were detected based on the current databases, it is
always possible that improved bacterial annotations and newly
completed genomes can move the ‘‘best-hit’’ evidence to a
different species in the Yersinia or Bacillus genera, or a different
genus altogether. Most importantly, none of these data indicate
that these organisms are alive, and the fragments of bacterial
DNA detected in these data may have arisen from sources other
than humans (insects, rats, mice, or other mammals).
Recent work has shown that homes can create a specific mi-
crobiome profile or ‘‘aura’’ for families and that this profile travels
with individuals (Lax et al., 2014). Yet, it was unknown how spe-
cific such a profile may be for mass-transit areas like subways.
These data show that some events, such as a flooding event dur-
ing a hurricane, can have a long-lasting impact on subway sta-
tions. Owing to the heavy rains of Hurricane (Superstorm) Sandy
in 2012, the South Ferry Station was completely submerged in
ocean water. Two years later, the majority of the bacteria from
the South Ferry Station are still distinct from the rest of the entire
subway system (Figure 5), and they mirror bacteria that are more
commonly associatedwith fish species, marine environments, or
very cold Antarctic environments; yet these species are still
distinct from another waterway (Gowanus Canal) in Brooklyn.
When the South Ferry station completely re-opens, it remains
to be seen how long it will take for such a high-traffic urban
area to be bio-remediated and normalized to mirror other sta-
tions, or if this unique profile of that station will persist long-term.
The rapid bacterial dynamics of Penn Station suggest that,
even on an hourly basis, there is a vast bacterial ecology that
is constantly shifting around commuters, which likely represents
the diverse ecology of human urban populations (Gonzalez et al.,
2012; Tyakht et al., 2013; Be et al., 2014). This diversity is
confounded with the thousands of passengers traveling through
the subway system, their personal microbial histories, station air
flow, subway-cleaning frequencies, surface composition, and
the particulars of this one site. Further high-resolution sampling
will be required to discern the consistency of a station over a
day, a month, or a year. To contextualize these results beyond
NYC, matching protocols and methods will need to be applied
in other cities’ public areas that represent other aspects of the
built environment, such as subways, sewers, parks, and high-
traffic subways; some of this work has started within the Meta-
Sub project (http://www.metasub.org), which is creating these
profiles across subways and cities around the world. Finally,
additional positive controls are sorely needed for future sampling
protocols, as is already done for clinical DNA and RNA se-
quencing (Munro et al., 2014; Li et al., 2014a, 2014b; SEQC/
MAQC-III Consortium, 2014). This could include barcoded, syn-
thetic, and titrated oligonucleotides being sprayed at regular
intervals to account for the degradation, disturbance, and
dissemination of DNA.
One notable result from these data was the conclusion that half
of our high-quality sequence reads do not match any known or-
ganism, which is similar to the range reported in other studies
(Yooseph et al., 2013) and demonstrates the large, unknown cat-
alog of life directly beneath our fingertips that remains to be
discovered and characterized. Because the majority of the DNA
Please cite this article in press as: Afshinnekoo et al., Geospatial Resolution of Human and Bacterial Diversity with City-Scale Metagenomics, CELS(2015), http://dx.doi.org/10.1016/j.cels.2015.01.001
left on surfaces is bacterial, many of these unknown DNA frag-
ments likely represent un-culturable species and strains of bacte-
ria. Although different methods are needed to enrich for the
metagenome of eukaryotes, we did observe a large catalog of
potential eukaryotes on the subway (Data Table 1), and we spec-
ulate that their accurate detection is confounded both by the het-
erogeneity of the samples’ DNA as well as the simple fact that not
all eukaryotic genomes have been sequenced. However, even at
stringent frequencies, our rarefaction plots show that hundreds,
to potentially thousands, of species may be present in the sub-
way (Figure S11). These taxa found in the subway also match
many of the same species found in the air (Table S7). The top-
ranking eukaryotic species (Table 1) include organisms that are
not often seen in the subway, such as mountain pine beetles
and Mediterranean fruit flies; these likely represent the closest
fully sequenced organisms present in NCBI and other genome
sequence databases. This work highlights the ongoing need for
robust eukaryotic genome assemblies to be completed, such
as the Genome 10K project (https://genome10k.soe.ucsc.edu/)
and the insect i5K project (http://www.arthropodgenomes.org/
wiki/i5K). Also, there have been documented cases of lateral
gene transfer of bacterial genes into Drosophila or other insect
hosts (Klasson et al., 2014), as well as contaminants of bacteria
present in genome assemblies (Salzberg et al., 2005), both of
which may impact the interpretation of these results across eu-
karyotic and other taxa.
Interestingly, such metagenomics profiling of a city, as shown
here, could facilitate new forensic applications that use station-
specific taxa (Figure 5) and the distribution of ancestry-informa-
tive markers from shotgun genomic DNA (Figure 2), just as ge-
netic markers informative of human ancestry can reveal the likely
origin of a person’s birth (Novembre et al., 2008). For example,
the bottom of a person’s shoe might represent the ‘‘genetic his-
tory’’ of that person’s daily or weekly travels, and the molecular
data can reveal the proportion of unique genetic markers and
potentially define the geospatial-genetic history of a person in a
city, as well as his or her pathogen risk or threat. These applica-
tions of public genetic data create potentially ambiguous ethical
situations, whereby one’s metagenome may hold clues about
historical, geospatial-genetic history, which then reduce one’s
expectation of privacy. But they also could provide new forensic
tools and methods for criminal justice and also newmechanisms
for disease and threat surveillance that are needed in increasingly
urbanized human societies.
Such ‘‘big data’’ could even be combined with a complete hu-
man genome to predict a person’s degree of baseline immuno-
logical protection/risk, combined with a characterization of the
dynamic antibodies and IgG variable regions in the person (im-
munomics) relative to the microbial alleles/strains present in a
city. Ideally, these data andmethods can be utilized for improved
monitoring of microbial biology vis-a-vis human biology, in the
built environment of mass transit. For this to occur, however,
other cities’ baseline pathogen and microbial profiles will be
needed, to help contextualize all of these data, concomitant
with improved sequencing lengths and expanded reference da-
tabases. Finally, further development of faster, even real-time,
characterization of the dynamics of the urban metagenome
and mass-transit systems can enable a more nimble response
time to any perturbations of these systems, which could poten-
CEL
tially impact the lives ofmillions of people each day and billions of
people each year.
EXPERIMENTAL PROCEDURES
Sample Collection
The entire NYC MTA subway system, a total of 468 stations, was swabbed in
triplicate over the course of the summer of 2013 and some additional samples
taken for culturing and testing and in response to reviewers in 2014. Two sur-
faces were swabbed in each station, and one surface was swabbed within the
train. Samples were collected from turnstiles and emergency exits, Metro Card
kiosks, wooden and metal benches, stairwell handrails, and trashcans. The
turnstiles and kiosks were prioritized at each station due to the level of hu-
man-surface interaction at these particular sites. In the train, the doors, poles,
handrails, and seats were swabbed.
Samples were collected using Copan Liquid Amies Elution Swab 481C, a
nylon-flocked swab with a 1 ml transport medium. The transport medium
maintains a pH of 7.0 ± 0.5 and consists of sodium chloride, potassium chlo-
ride, calcium chloride, magnesium chloride, monopotassium phosphate, diso-
dium phosphate, sodium thioglycollate, and distilled water (Amies, 1967). After
a surface was sampled, the swab was immediately placed into the collection
tube, coming into contact with the transport medium; samples were then
stored in a �80�C freezer once returned to the laboratory.
A mobile application (app) for iOS and Android systems was developed in
collaboration with GIS Cloud Mobile Data Collection (MDC) to map the data
points according to their geographical locations. When using the GIS Cloud
app, data fields to input included a sampleID, place, surface, traffic level,
notes, and an option to take a picture, and the app automatically adds a
time stamp for each submission (Figure S12). The app has been expanded
to include swabbing of other surfaces, including buses, taxis, parks, and air-
ports. All data points are accessible to view via pathomap.giscloud.com.
DNA Extraction
Samples were brought out of the �80�C freezer to thaw to room temperature.
DNAwas extracted using theMoBio Powersoil DNA isolation kit (as seen in Qin
et al., 2010 and also http://www.mobio.com/soil-dna-isolation/powersoil-
dna-isolation-kit.html). Using the reagents from the kit, the sample’s cells
were lysed, freeing the DNA and other contents. The other inorganic material
was precipitated out. Using a concentrated salt solution, the DNA readily
bound to the silica membrane of the kit’s spin filters. An ethanol wash helped
further clean and purify the DNA. Following theMoBio protocol, the 50 ml eluent
was further purified by introducing 100 ml (2:1 ratio) of Agencourt AMPure XP
magnetic beads. Samples were left to incubate at 25�C for 15 min and placed
on an Invitrogen magnetic separation rack (MagnaRack) for 5 min. The DNA
binds to the beads, and the supernatant is discarded. While the tubes were
on the MagnaRack, 700 ml of 80% ethanol was added to the beads to wash
off any remaining impurities. The ethanol was removed, and beads were left
to dry. Finally, 10 ml of an elution buffer was added to purify the DNA, and
9 ml of the eluent was removed with 1 ml going toward QuBit quantification. Us-
ing a Qubit 2.0 fluorometer and the high-sensitivity kit (DNA HS standards,
dsDNA HS buffer, and HS dye), we quantified each sample’s DNA. The param-
eters of the QuBit were set for ng/ml, and the value from the device was then
multiplied by 8 ml for the total yield of the sample in ng.
Illumina and QIAGEN Library Preparation
DNA fractions were prepared into sequencing libraries according to manufac-
turer’s standard protocols, using the TruSeq Nano DNA library preparation
protocols (FC-121-4001). A subset of our samples (Culture01-12 and other
test samples) was also prepared using the QIAGEN Gene Reader DNA Library
Prep I Kit (cat. no. 180984). Briefly, this involved Covaris fragmentation to
�500 nt, bead cleanup to remove small fragments (<200), A-tailing, adaptor
ligation, PCR amplification, bead-based library size selection, and cleanup
again. Fragments were then visualized on a BioAnalyzer 2100 to ensure li-
braries were within the range of 450–650 bp.
Sequencing
Raw data from four flowcells of the HiSeq2500 machines using HiSeq (v4) SBS
chemistry were processed using the Illumina RTA software and CASAVA 1.8.2,
S 1
CELS 1, 1–15, July 29, 2015 ª2015 The Authors 11
Please cite this article in press as: Afshinnekoo et al., Geospatial Resolution of Human and Bacterial Diversity with City-Scale Metagenomics, CELS(2015), http://dx.doi.org/10.1016/j.cels.2015.01.001
and then all samples checked for standard CASAVA QC parameters (all reads
pass filter). Specifically, all samples had high (>Q20) quality values at the me-
dian base, low% alignment to PhiX (<1%), and similar insert size (550 ± SD of
70 bp).
Sequence and Taxa Characterization
All reads were first quality trimmed with the FASTX toolkit (http://hannonlab.
cshl.edu/fastx_toolkit/) to ensure 99% base-level accuracy (Q20). Cleaned
reads were then aligned with MegaBLAST (Wolfsberg and Madden, 2001)
(see Experimental Procedures) to search for a match to any organism in the
full NCBI NT/NR database. The MegaBLAST output for one read often returns
multiple hits to sequences from different taxa, so we assigned each read to a
single ‘‘best’’ taxon using the LCA algorithm established by MEGAN (Huson
et al., 2007). For example, the species Salmonella enterica and the species
Salmonella bongori may have ambiguous reads that match both species, but
the LCA (genus Salmonella) can have sequences unique to that genus, which
is then the assigned taxa. To further classify bacterial and viral sequences
(see Experimental Procedures), we also analyzed all samples with MetaPhlAn
2.0 (Segata et al., 2012), and for specific pathogens, we also used SURPI
(Naccache et al., 2014) and the BWA (see below) (Li and Durbin, 2010).
MetaPhlAn version (v2.0) was used to study themicrobial populations on the
subway surfaces. FASTQ files from sequencing were run through MetaPhlAn
(see command in Supplemental Experimental Procedures), and the output
file (.bt2.out) outlined the abundance of various bacterial organisms to the spe-
cies level.
BWA Alignments
BWAwas used to align sample sequences against several reference genomes,
including the virulence plasmids. Standard genome processing of the ge-
nomes was performed with BWA (version 7.10, http://bio-bwa.sourceforge.
net/bwa.shtml), which includes building a burrows-wheeler transformation of
the reference genome, performing an alignment (aln ref.fa short_read.fq >
aln_sa.sai), and then converting the suffix array into genome coordinates
and a SAM file (sampe ref.fa aln_sa1.sai aln_sa2.sai read1.fq read2.fq > aln-
pe.sam). SAMtools version 1.19 (http://samtools.sourceforge.net/samtools.
shtml) was also used to call genetic variants (samtools mpileup -C50 -gf re-
f.fasta -r chr3:1,000-2,000 in1.bam in2.bam) compared to the reference
genome. All commands and scripts used are detailed in the Supplemental
Experimental Procedures and are the exact shell commands (.sh files) we
used to process the raw data.
To further investigate results of potential pathogenic bacteria found on the
subway, each sample’s sequences were compared to the virulent plasmid(s)’s
sequence. Using the National Select Agent Registry (NSAR) select agents and
toxins list (notably, CDC Tier 1 agents) and the PATRIC database, a list of path-
ogenic organismswas determined and cross-referenced to results fromMeta-
Phlan andBLAST. To verify these results, sequences of virulent plasmids of the
various agents were found on GenBank, and using BWA and the Integrative
Genomic Viewer (IGV), the sample was compared to the reference sequence.
Human Body-Part Association with Species
Species were matched to the top-associated human body part from the
Human Microbiome Project’s (HMP) public database, located here: http://
www.hmpdacc.org/HMRGD/healthy/. We used the top-ranked species for
each area of the body listed in the HMP dataset.
Bacterial Cultures, Collection, and Sequencing
Swab samples were collected from eight NYC subway locations to determine
whether bacteria could be cultured from turnstiles, and whether these cultura-
ble bacteria would grow in the presence of tetracycline. Collection locations
within the subway system were selected based on the intensity of human
use to determine whether the concentration of culturable bacteria would in-
crease with the level of human traffic. Four turnstiles from ‘‘low-traffic’’ stations
(68th St station, 5th Ave/53rd St Station, 77th St Station, and 8th Ave/50th St
Station) and four turnstiles from ‘‘high-traffic’’ stations (from two separate loca-
tions within both 42nd St GrandCentral Station and 42nd St Times Square Sta-
tion) were sampled in March 2014 (Table S4). Immediately prior to sample
collection, swabs (Elution Swabs; Copan Diagnostics) were dipped into the
1 ml of sterile Amies transport media supplied with the swab kit, as pre-moist-
CELS 1
12 CELS 1, 1–15, July 29, 2015 ª2015 The Authors
ening of swabs has been shown to improve bacterial recovery from environ-
mental surfaces. Two arms of each turnstile were swabbed at a constant speed
for a total of 1 min, and one individual performed all swab sampling in order to
standardize sampling effort. Swabswere then sealedwithin the sterile polypro-
pylene tubes supplied with the ESwab kit, packed into a cooler, transported to
the laboratory, and stored at 4�C for less than 24 hr before processing.
Cultivation of each sample began by briefly vortexing swabs to resuspend
cells in the transport media prior to creation of 0–3 10-fold dilutions in auto-
claved and 0.2 mm filter sterilized 25% Ringers Solution (Oxoid). One hundred
microliters of each dilution was spread on Luria Broth Agar (LB; Difco) and
Trytic Soy Agar (TSA; Difco) media, each with and without tetracycline
(10 mg/l) added. Control plates, spread with only sterile Ringers solution,
were used as amethod blank and processed in parallel with the swab samples.
Enumeration of CFUs occurred after replicate plates were incubated at 28�Cand 37�C for 5 days. The number of CFUs was then normalized to the concen-
tration within the original 1 ml of transport media and reported as CFUs per
1 min of standardized swabbing effort, to allow a relative comparison among
subway swab samples. Following incubation and enumeration, cells were har-
vested by pippetting 2ml of sterile water (Hyclone) onto each plate and using a
sterile spreader to scrape colonies from the media surface into a suspension.
The cell suspension was transferred to a sterile tube, and DNA from this cell
suspension was extracted (see above) to allow NGS characterization of the
cultivated bacterial assemblage.
MegaBLAST-LCA Pipeline
The MegaBLAST-LCA pipeline consisted of five steps explained in detail
below. (1) Paired-end reads were prepared for BLAST by trimming, filtering
on quality scores, and converting to unpaired FASTA sequences. (2) Prepared
reads were searched for in the NCBI NT database using MegaBLAST (default
parameters). (3) MegaBLAST hits were filtered such that short and low-scoring
hits were ignored in subsequent analysis. (4) Reads with MegaBLAST hits to
multiple taxa were assigned to the LCA taxa in the NCBI Taxonomy using
theMEGAN algorithm. For example, hits tomultiple species of the same genus
are assigned to the common genus by the LCA algorithm. (5) Finally, for each
sample, the total number of reads assigned to each taxon were counted. We
validated our MegaBLAST-LCA pipeline on a mock community of 11 bacterial
species (see Tables S2 and S3).
Preparing Reads for MegaBLAST
The leading and trailing 10 bp were trimmed from the 100 bp reads to remove
low-quality regions. Trimmed reads with more than 10 bases with quality
scores less than 20 were removed. Only one read from each pair was analyzed
further because MegaBLAST does not accommodate paired sequences.
Removal of Low-Scoring and Short-Length MegaBLAST Hits
MegaBLAST hits covering less than 65 bp of the 80 bp query sequence were
removed. We further filtered MegaBLAST hits following the recipe of the
MEGAN software. We required a min-score of 60 and a top percent of 10.
Thus, hits with a MegaBLAST bitscore lower than 60 were ignored, and hits
that were not within 10 percent of the best bitscore were ignored. Finally, we im-
plemented a win-score of 100, requiring that, for a given query, if at least one hit
had a bitscore greater than 100, hits with bitscores less than 100 were ignored.
See the MEGAN paper for further explanation (Huson et al., 2007).
LCA Algorithm
LCA was introduced as a bioinformatics method for estimating the taxonomic
composition of a metagenomic DNA sample (Huson et al., 2007). MEGAN is a
popular implementation of the LCA algorithm by the same authors. LCA is a
very simple algorithm. Given a taxonomic tree (e.g., the NCBI Taxonomy)
and a set of nodes in the tree (e.g., a few species), the LCA is identified by
back-tracing from each node in the set until convergence at a single node—
the LCA. We implemented the simple LCA algorithm following previously es-
tablished methods (Huson et al., 2007).
Positive Control
We used a positive control sample from the Metagenomics Research Group
(MRG) of the ABRF (Association of Biomolecular Resource Facilities), and
the control sample contained 11, and only 11, known bacteria that were

Please cite this article in press as: Afshinnekoo et al., Geospatial Resolution of Human and Bacterial Diversity with City-Scale Metagenomics, CELS(2015), http://dx.doi.org/10.1016/j.cels.2015.01.001
sequenced with 150 3 150 paired-end reads on an Illumina Hiseq2500 (v3).
We used this sample to establish a minimum threshold for calling a species
present (Figure S2 and Tables S1 and S2) from both BLAST and MetaPhlAn,
which enabled us to estimate 99% specificity and 91% sensitivity at the genus
level for MetaPhlAn. For BLAST, we observed 99.99% specificity and 100%
sensitivity. To ensure robust analysis, we focus only those species found by
both methods at these thresholds (normalized MetaPhlAn abundance of
0.01 and 0.1% of BLAST reads). This corresponds to an average minimum
of 3,000 paired-end reads for each species. These NARG samples are also
present in our SRA submission.
Negative Control
In conjunctionwith the positive control, we had a subset of samples designated
as negative controls. These swabs were taken out of their package and imme-
diately placed in the collection tube, being exposed in the environment for no
more than 1 s. The swabswere extracted following the same protocol as all the
other samples. Therewere a total of 51 control blank samples collected, and 13
were extracted. The DNA yield was consistently found to be undetectable by
Qubit (<0.05 ng/ml) for all samples. These data indicate that the DNA we are
studying is collected from the environment and surfaces we swab and not
from any other sources like the ESwab solution or MoBio Powersoil kit.
Geospatial Image Segmentation
Weused theBerkeley ImageSegmentation Algorithm at http://www.imageseg.
com/ to characterize the sub-sections and regions of the demographic map.
The raw image was uploaded onto the online site and processed using a
threshold of 40, shape rate of 0.6, and compactness rate of 0.2
Ancestry Analysis Methods
Dataset Preparation
Wehave used two different methods in our ancestry analysis: AncestryMapper
and Admixture (below). Both methods use a set of references that we have ob-
tained by merging the genotypes from each PathoMap sample with the phase
2 whole-genome of the 1000 Genomes Projects, build hg19 (ref to 1000 ge-
nomes). In this manner, each PathoMap sample is included in a table of geno-
types with each population (n), including the following: Yoruba (87), Luhya (96),
African American (61), Puerto Rican (53), Spanish (14), Tuscan (98), Northern
European Ancestry-Utah (82), British (88), Finnish (92), Han-Chinese (100),
Han-Beijing (96), Japanese (89), Colombian (60), andMexican (66).Wemerged
the PathoMap VCFs with the file 00-All.vcf.gz, which provides a comprehen-
sive report of short human variations formatted in VCF (http://www.ncbi.nlm.
nih.gov/variation/docs/human_variation_vcf/#all-00); in this manner, we
filtered for each PathoMap the SNPs that were useful in ancestry analysis.
We then proceeded to merge this file with the VCFs from the 1000 genomes.
We used VCF-tools and the commands VCF-merge and VCF-isec. We pro-
ceeded to merge the 1000 genomes by chromosome, and used a tped as
output. The 23 tpeds were then merged using plink (Purcell et al., 2007).
AncestryMapper
AncestryMapper (Magalhaes et al., 2012) calculates the genetic distance to a
set of population references and provides a reference system to which every
sample can be placed. Because it relates to a fixed set of references, it is
less dependent on the context of the other samples in thedataset. It is amethod
suited to this problem, as the PathoMap samples do not have the same set of
genotypes, hence each one has to be analyzed on its own. The references for
AncestryMapper were calculated as the consensus of the individuals of each
1000-genomes population, and the genetic distance to each population was
calculated by the euclidean distance. The AncestryMapper Ids (AMIds) were
derived such that themost similar population got an index of 100 and the lowest
an index of 0; AMIds are biologically meaningful as they relate to well-estab-
lished populations. As positive controls, we calculated AMIds for each of the
1000-genome samples included in each PathoMap set of SNPs; they all corre-
spond to what would be expected, i.e., Yoruba individuals got AMIds of 100 for
the Yoruba reference and 0 for the Mexican sample; conversely, for Mexican
individuals, the AMId for Yorubawas 0, with AMIds forMexicans 100. It is worth
pointing out that there is no 1000-genomes population that would correspond
to a genetically homogeneous Amerindean population; we have used the
Mexican population as a proxy for such population. AncestryMapper is avail-
able as an R package from CRAN (Magalhaes et al., 2012).
CEL
Admixture
Admixture is amodel-based ancestry estimation that directly seeks the ances-
tral clusters in the data (Alexander et al., 2009). Admixture models the proba-
bility of the observed genotypes to belong to ancestry proportions. We used
Admixture on each set of PathoMap and 1000-genomes individuals and
assumed the number of ancestral populations (K) to be 4; these ancestral pop-
ulations correspond to African, Indo-european, Asian, and Amerindian. We
verified that the 1000-genomes individuals were indeed assigned very high
values for their corresponding ancestral populations (e.g., all African individ-
uals were assigned very high values for an ancestral population that we in-
ferred to be African). We took the values that were assigned to the PathoMap
individual to correspond to their main ancestry components.
Software
We used Plink 1.9 (http://pngu.mgh.harvard.edu/�purcell/plink/plink2.shtml),
VCFtools (http://vcftools.sourceforge.net/downloads.html), Admixture (https://
www.genetics.ucla.edu/software/admixture/download.html), AncestryMapper
(R package available at CRAN), and a series of shell scripts (Supplemental
Experimental Procedures).
Reference Data
Please see 1000 Genomes whole genomes (http://www.1000genomes.org/
data).
18S Validation
Sequencing and Library Prep
The protocol used for amplification and sequencing of the V9 region of the 18S
rRNA gene is based off the 18S Illumina amplification protocol detailed on the
Earth Microbiome Website (http://www.earthmicrobiome.org) (Gilbert et al.,
2010). Briefly, PCRamplification of theV9 regionwas done in triplicate, cleaned,
visualized as above, pooled following the EMP protocol, and sequenced on an
Illumina Miseq with 23 100 chemistry (v3) with a 10% PhiX spike-in.
18S Data Analysis
All data analysis andquality filteringwere done following theQIIMEpipeline (Ca-
poraso et al., 2010). Paired-end reads were joined using fastq-join (Aronesty,
2011) with a minimum overlap of 10 bp, and only joined sequences were used
for further analysis. Joined reads were de-multiplexed and quality filtered using
the default parameters of split_libraries.py in QIIME. Additionally, Usearch
(Edgar,2010) version5.2wasused toscreensequences for chimerasandsingle-
tonsandcluster reads intoOTUswitha97%similarity threshold following thede-
novo protocol. Taxonomywas assigned using the SILVA database (Quast et al.,
2013) version 111 no ambiguious base file reference database and UCLUST
within QIIME. The resulting OTUswere filtered to exclude bacteria and archaea,
and downstream diversity analyses used data rarefied to the lowest amount of
sequences per sample (3,385). This left 551 OTUs from four samples.
16S Data Analysis
16S analysis followed the same steps as 18S; however, closed reference
OTUs were picked with Usearch against the GreenGenes database (DeSantis
et al., 2006).
ACCESSION NUMBERS
Raw data are available from the Sequence Read Archive submission
SUB664307 and Bioproject ID# PRJNA271013 and also at http://www.ncbi.
nlm.nih.gov/bioproject/271013.
SUPPLEMENTAL INFORMATION
Supplemental Information includes Supplemental Experimental Procedures,
12 figures, 7 tables, and 6 data files and can be found with this article online
at http://dx.doi.org/10.1016/j.cels.2015.01.001.
AUTHOR CONTRIBUTIONS
E.A. led the coordination of the PathoMap study, distributed samples, and
worked on the manuscript and the data analysis as well as sample collection,
DNA extraction, and library preparation. C.M. did data analysis, generated the
species heatmaps, and studied the human allele/census data correlation. S.C.
performed DNA extraction, library preparation, and sample collection and
S 1
CELS 1, 1–15, July 29, 2015 ª2015 The Authors 13

Please cite this article in press as: Afshinnekoo et al., Geospatial Resolution of Human and Bacterial Diversity with City-Scale Metagenomics, CELS(2015), http://dx.doi.org/10.1016/j.cels.2015.01.001
gatheredmetadata. D.J. extracted DNA and prepared libraries for themajority of
the samples. C.B. collected samples, extracted DNA, and gathered and orga-
nized data (annotations and metadata). N.B. did DNA extraction and sample
collectionandgatheredandorganizeddata (annotations andMetaPhlAnoutput).
J.M.M.did 16S/18S rRNAsequencingandQIIMEanalysis. D.R.did data analysis
and data management. J.G. extracted DNA and prepped libraries. S.C. did
SURPI analysis. S.A. extracted DNA and gathered data for HMP correlation
and metadata (zip codes). A.S. collected samples and extracted DNA. T.N. ex-
tracted DNA, collected samples, and created pathomap.org. B.S. did DNA
extraction and sample collection and launched Indiegogo campaign. E.P.
collected samples and extractedDNA. E.J. provided samples from theGowanus
Canal. S.-O.K. did data analysis and tool development. N.K. did DNA extraction
and sample collection. I.G. did DNA extraction and sample collection. D.G. did
DNA extraction and sample collection. S.D. did DNA extraction and sample
collection. T.N. did DNA extraction and sample collection. Y.S. did data analysis
and library preparation (nanopore). N.A. did data analysis and library preparation
(nanopore). P.V. distributed and collected samples and created the pMT1 circos
plot. E.M.H. did data analysis. P.Z. did data analysis and script/command devel-
opment. M.W. led seasonal sampling of the subway system and other sampling
sites.G.D.O. performedculture experiments. S.T. providedpositive control sam-
ples. J.T.D. helped develop the study and experimental design. A.D. performed
culture experiments. S.E. did the AncestryMapper and human variant analysis.
E.O. did the AncestryMapper and human variant analysis. T.R. Magalhaes did
the AncestryMapper and human variant analysis. B.B. sequenced samples.
A.L.J. sequenced samples. T.R. Muth extracted DNA. K.S.P. led sampling of
the abandoned station. E.A. provided samples from the Gowanus Canal.
E.E.S.helpeddevelop the studyandexperimental design. J.G. performedculture
experiments. R.J.P. did BLAST analysis. J.M.C. did 16S/18S rRNA sequencing
and QIIME analysis. S.L. sequenced samples and performed data analysis.
C.E.M. conceived of the project, led the project, collected samples, extracted
DNA, wrote and revised the manuscript and figures, performed data analysis,
and served as the principal investigator.
ACKNOWLEDGMENTS
Wewould like to thank Thomas Abdallah from the Metropolitan Transit Author-
ity (MTA) for access to the flooded subway station and general assistance with
sample collection in the subways. We also would like to thank the NIH
(F31GM111053), the Epigenomcs Core Facility at Weill Cornell Medical Col-
lege, the Clinical and Translational Sciences Center (CTSC), the Pinkerton
Foundation, the Vallee Foundation, Igor Tulchinsky from theWorldQuant Foun-
dation, Marc Van Oene from Illumina, Peer Schatz and Aaron Lizee from Qia-
gen, and Indiegogo for crowdfunding and crowdsourcing support. This study
was partially funded by a New York University Grand Challenge project, ‘‘Mi-
croorganisms, Sewage, Health and Disease:Mapping the NewYork CityMeta-
genome.’’We also thank Paul Scheid and Jeffrey A. Rosenfeld for contributions
to the sample collection protocols and analysis methods. Many students and
citizen scientist volunteers helped us in the sample collection across NYC,
and we would like to thank and acknowledge anyone who helped with even
a single swab. This includes students from Katie Schneider’s NYU class:
Anna Crouch, Isabel Wang, Jeep Roberto, Malinda Moore, Stephanie Viola,
and Davis Saltonstall; and Michael Walsh’s students (seasonal subway and
park sampling): Rachel Berger, Sarah-Ann Celestin, Sheaba Daniel, Wen
Deng, Janay Scott, Disleiry Benitez, Nadine Blackwood, Racquel Brereton,
Pui Ying Chan, Saurabh Dwivedi, Jennifer Fasheun, Bianca Hill, Tania Kashem,
Difaa Majrud, Nicole Mastrogiovanni, Vicky Milford, Olutosin Ojugbele, Alex-
andr Pinkhasov, Anila Thomas, Tejal Patel, Kalpita Abhyankar, Jovanna Linnen,
Chludzinski Stacey, Marc Smith, Herman Chen, Patricia Lolo, Akinwale Akin-
kunmi, Matthew Lee, Dean Perfetti, Marco Stillo, Britanny Thomas, Harrynauth
Persaud, and Sofia Oluwole. Also, for the Gowanus samples, we thank Ian
Quate and Matthew Seibert from Nelson Byrd Woltz Architecture firm. We
would also like to thank Joan Moriarty for assistance with the crowd-funding
campaign and Madeleine Mason-Moriarty for inspiring the project.
Received: October 29, 2014
Revised: December 30, 2014
Accepted: January 27, 2015
Published: February 3, 2015
CELS 1
14 CELS 1, 1–15, July 29, 2015 ª2015 The Authors
REFERENCES
Alexander, D.H., Novembre, J., and Lange, K. (2009). Fast model-based esti-
mation of ancestry in unrelated individuals. Genome Res. 19, 1655–1664.
Amies, C.R. (1967). A modified formula for the preparation of Stuart’s
Transport Medium. Can. J. Public Health 58, 296–300.
Erik Aronesty (2011). ea-utils: Command-line tools for processing biological
sequencing data; http://code.google.com/p/ea-utils.
Be, N.A., Thissen, J.B., Fofanov, V.Y., Allen, J.E., Rojas, M., Golovko, G.,
Fofanov, Y., Koshinsky, H., and Jaing, C.J. (2014). Metagenomic analysis of
the airborne environment in urban spaces. Microb. Ecol. 2014, 29.
Blaser, M.J. (2014). The microbiome revolution. J. Clin. Invest. 124, 4162–
4165.
Cao, C., Jiang, W., Wang, B., Fang, J., Lang, J., Tian, G., Jiang, J., and Zhu,
T.F. (2014). Inhalable microorganisms in Beijing’s PM2.5 and PM10 pollutants
during a severe smog event. Environ. Sci. Technol. 48, 1499–1507.
Caporaso, J.G., Kuczynski, J., Stombaugh, J., Bittinger, K., Bushman, F.D.,
Costello, E.K., Fierer, N., Pena, A.G., Goodrich, J.K., Gordon, J.I., et al.
(2010). QIIME allows analysis of high-throughput community sequencing
data. Nat. Methods 7, 335–336.
Chambers, H.F., and Deleo, F.R. (2009). Waves of resistance: Staphylococcus
aureus in the antibiotic era. Nat. Rev. Microbiol. 7, 629–641.
Clinton, N., Holt, A., Scarborough, J., Yan, L., and Gong, P. (2010). Accuracy
assessment measures for object-based image segmentation goodness.
Photogramm. Eng. Remote Sensing 76, 289–299.
DeSantis, T.Z., Hugenholtz, P., Larsen, N., Rojas, M., Brodie, E.L., Keller, K.,
Huber, T., Dalevi, D., Hu, P., and Andersen, G.L. (2006). Greengenes, a
chimera-checked 16S rRNA gene database and workbench compatible with
ARB. Appl. Environ. Microbiol. 72, 506972.
Dutra, V.G., Alves, V.M., Olendzki, A.N., Dias, C.A., de Bastos, A.F., Santos,
G.O., de Amorin, E.L., Sousa, M.A., Santos, R., Ribeiro, P.C., et al. (2014).
Streptococcus agalactiae in Brazil: serotype distribution, virulence determi-
nants and antimicrobial susceptibility. BMC Infect. Dis. 14, 323.
Dybwad, M., Skogan, G., and Blatny, J.M. (2014). Temporal variability of the
bioaerosol background at a subway station: concentration level, size distribu-
tion, and diversity of airborne bacteria. Appl. Environ. Microbiol. 80, 257–270.
Edgar, R.C. (2010). Search and clustering orders of magnitude faster than
BLAST. Bioinformatics 26, 2460–2461.
Eyun, S.I., Wang, H., Pauchet, Y., Ffrench-Constant, R.H., Benson, A.K.,
Valencia-Jimenez, A., Moriyama, E.N., and Siegfried, B.D. (2014). Molecular
evolution of glycoside hydrolase genes in the western corn rootworm
(Diabrotica virgifera virgifera). PLoS ONE 9, e94052.
Firth, C., Bhat, M., Firth, M.A., Williams, S.H., Frye, M.J., Simmonds, P., Conte,
J.M., Ng, J., Garcia, J., Bhuva, N.P., et al. (2014). Detection of zoonotic path-
ogens and characterization of novel viruses carried by commensal Rattus nor-
vegicus in New York City. MBio 5, e01933–e14.
Frolova, G.M., Gumerova, P.A., Romanenko, L.A., and Mikhailov, V.V. (2011).
Characterization of the lipids of psychrophilic bacteria Shewanella frigidimar-
ina isolated from sea ice of the Sea of Japan. Microbiology 80, 30–36.
Gilbert, J.A., and Neufeld, J.D. (2014). Life in a world without microbes. PLoS
Biol. 12, e1002020.
Gilbert, J.A., Meyer, F., Antonopoulos, D., Balaji, P., Brown, C.T., Brown, C.T.,
Desai, N., Eisen, J.A., Evers, D., Field, D., et al. (2010). Meeting report: the ter-
abasemetagenomics workshop and the vision of an Earthmicrobiome project.
Stand. Genomic Sci. 3, 243–248.
Gire, S.K., Goba, A., Andersen, K.G., Sealfon, R.S., Park, D.J., Kanneh, L.,
Jalloh, S., Momoh, M., Fullah, M., Dudas, G., et al. (2014). Genomic surveil-
lance elucidates Ebola virus origin and transmission during the 2014 outbreak.
Science 345, 1369–1372.
Gonzalez, A., King, A., Robeson, M.S., 2nd, Song, S., Shade, A., Metcalf, J.L.,
and Knight, R. (2012). Characterizing microbial communities through space
and time. Curr. Opin. Biotechnol. 23, 431–436.
Hood, L. (2012). Tackling the microbiome. Science 336, 1209.

Please cite this article in press as: Afshinnekoo et al., Geospatial Resolution of Human and Bacterial Diversity with City-Scale Metagenomics, CELS(2015), http://dx.doi.org/10.1016/j.cels.2015.01.001
Huson, D.H., Auch, A.F., Qi, J., and Schuster, S.C. (2007). MEGAN analysis of
metagenomic data. Genome Res. 17, 377–386.
Inouye, M., Dashnow, H., Raven, L.A., Schultz, M.B., Pope, B.J., Tomita, T.,
Zobel, J., and Holt, K.E. (2014). SRST2: Rapid genomic surveillance for public
health and hospital microbiology labs. Genome Med 6, 90, http://dx.doi.org/
10.1186/s13073-014-0090-6.
Klasson, L., Kumar, N., Bromley, R., Sieber, K., Flowers, M., Ott, S.H., Tallon,
L.J., Andersson, S.G., and Dunning Hotopp, J.C. (2014). Extensive duplication
of the Wolbachia DNA in chromosome four of Drosophila ananassae. BMC
Genomics 15, 1097.
Langille, M.G., Zaneveld, J., Caporaso, J.G., McDonald, D., Knights, D.,
Reyes, J.A., Clemente, J.C., Burkepile, D.E., Vega Thurber, R.L., Knight, R.,
et al. (2013). Predictive functional profiling of microbial communities using
16S rRNA marker gene sequences. Nat. Biotechnol. 31, 814–821.
Lax, S., Smith, D.P., Hampton-Marcell, J., Owens, S.M., Handley, K.M., Scott,
N.M., Gibbons, S.M., Larsen, P., Shogan, B.D., Weiss, S., et al. (2014).
Longitudinal analysis of microbial interaction between humans and the indoor
environment. Science 345, 1048–1052.
Leung, M.H., Wilkins, D., Li, E.K., Kong, F.K., and Lee, P.K. (2014). Indoor-air
microbiome in an urban subway network: diversity and dynamics. Appl.
Environ. Microbiol. 80, 6760–6770.
Li, H., and Durbin, R. (2010). Fast and accurate long-read alignment with
Burrows-Wheeler transform. Bioinformatics 26, 589–595.
Li, S., Tighe, S.W., Nicolet, C.M., Grove, D., Levy, S., Farmerie, W., Viale, A.,
Wright, C., Schweitzer, P.A., Gao, Y., et al. (2014a). Multi-platform assessment
of transcriptome profiling using RNA-seq in the ABRF next generation
sequencing study. Nat. Biotechnol. 32, 915–925.
Li, S., Labaj, P., Zumbo, R., Shi, W., Phan, J., Wu, L., Wang, M., Thierry-Mieg,
J., Thierry-Mieg, D., Shi, L., et al. (2014b). Detecting and correcting systematic
variation from large-scale RNA sequencing. Nat. Biotechnol. 32, 888–895.
Lindler, L.E., Plano, G.V., Burland, V., Mayhew, G.F., and Blattner, F.R. (1998).
Complete DNA sequence and detailed analysis of the Yersinia pestis KIM5
plasmid encoding murine toxin and capsular antigen. Infect. Immun. 66,
5731–5742.
Magalhaes, T.R., Casey, J.P., Conroy, J., Regan, R., Fitzpatrick, D.J., Shah,
N., Sobral, J., and Ennis, S. (2012). HGDP and HapMap analysis by Ancestry
Mapper reveals local and global population relationships. PLoS ONE 7,
e49438.
Markle, J.G., Frank, D.N., Mortin-Toth, S., Robertson, C.E., Feazel, L.M.,
Rolle-Kampczyk, U., von Bergen, M., McCoy, K.D., Macpherson, A.J., and
Danska, J.S. (2013). Sex differences in the gut microbiome drive hormone-
dependent regulation of autoimmunity. Science 339, 1084–1088.
Munro, S.A., Lund, S.P., Pine, P.S., Binder, H., Clevert, D.A., Conesa, A.,
Dopazo, J., Fasold, M., Hochreiter, S., Hong, H., et al. (2014). Assessing tech-
nical performance in differential gene expression experiments with external
spike-in RNA control ratio mixtures. Nat. Commun. 5, 5125.
Naccache, S.N., Federman, S., Veeraraghavan, N., Zaharia, M., Lee, D.,
Samayoa, E., Bouquet, J., Greninger, A.L., Luk, K.C., Enge, B., et al. (2014).
A cloud-compatible bioinformatics pipeline for ultrarapid pathogen identifica-
tion from next-generation sequencing of clinical samples. Genome Res. 24,
1180–1192.
Novembre, J., Johnson, T., Bryc, K., Kutalik, Z., Boyko, A.R., Auton, A., Indap,
A., King, K.S., Bergmann, S., Nelson, M.R., et al. (2008). Genes mirror geogra-
phy within Europe. Nature 456, 98–101.
Parkhill, J., Wren, B.W., Thomson, N.R., Titball, R.W., Holden, M.T., Prentice,
M.B., Sebaihia, M., James, K.D., Churcher, C., Mungall, K.L., et al. (2001).
Genome sequence of Yersinia pestis, the causative agent of plague. Nature
413, 523–527.
CEL
Peterson, J., Garges, S., Giovanni, M., McInnes, P., Wang, L., Schloss, J.A.,
Bonazzi, V., McEwen, J.E., Wetterstrand, K.A., Deal, C., et al.; NIH HMP
Working Group (2009). The NIH Human Microbiome Project. Genome Res.
19, 2317–2323.
Purcell, S., Neale, B., Todd-Brown, K., Thomas, L., Ferreira, M.A., Bender, D.,
Maller, J., Sklar, P., de Bakker, P.I., Daly, M.J., and Sham, P.C. (2007). PLINK:
a tool set for whole-genome association and population-based linkage ana-
lyses. Am. J. Hum. Genet. 81, 559–575.
Qin, J., Li, R., Raes, J., Arumugam,M., Burgdorf, K.S., Manichanh, C., Nielsen,
T., Pons, N., Levenez, F., Yamada, T., et al.; MetaHIT Consortium (2010). A hu-
man gut microbial gene catalogue established by metagenomic sequencing.
Nature 464, 59–65.
Quast, C., Pruesse, E., Yilmaz, P., Gerken, J., Schweer, T., Yarza, P., Peplies,
J., and Glockner, F.O. (2013). The SILVA ribosomal RNA gene database proj-
ect: improved data processing and web-based tools. Nucleic Acids Res. 41
(Database issue), D590–D596.
Rasko, D.A., Webster, D.R., Sahl, J.W., Bashir, A., Boisen, N., Scheutz, F.,
Paxinos, E.E., Sebra, R., Chin, C.S., Iliopoulos, D., et al. (2011). Origins of
the E. coli strain causing an outbreak of hemolytic-uremic syndrome in
Germany. N. Engl. J. Med. 365, 709–717.
APTA Ridership Report - Q4 2013 Report. American Public Transportation
Association (APTA). (2014). http://www.apta.com/resources/statistics/Pages/
RidershipArchives.aspx. February 26, 2014.
Robertson, C.E., Baumgartner, L.K., Harris, J.K., Peterson, K.L., Stevens,
M.J., Frank, D.N., and Pace, N.R. (2013). Culture-independent analysis of
aerosol microbiology in a metropolitan subway system. Appl. Environ.
Microbiol. 79, 3485–3493.
Salzberg, S.L., Dunning Hotopp, J.C., Delcher, A.L., Pop, M., Smith, D.R.,
Eisen, M.B., and Nelson, W.C. (2005). Serendipitous discovery of Wolbachia
genomes in multiple Drosophila species. Genome Biol. 6, R23.
Segata, N., Waldron, L., Ballarini, A., Narasimhan, V., Jousson, O., and
Huttenhower, C. (2012). Metagenomic microbial community profiling using
unique clade-specific marker genes. Nat. Methods 9, 811–814.
SEQC/MAQC-III Consortium. (2014). A comprehensive assessment of RNA-
seq accuracy, reproducibility and information content by the Sequencing
Quality Control Consortium. Nat. Biotechnol. 32, 903–914.
Smillie, C.S., Smith, M.B., Friedman, J., Cordero, O.X., David, L.A., and Alm,
E.J. (2011). Ecology drives a global network of gene exchange connecting
the human microbiome. Nature 480, 241–244.
The United Nations (UN). (2014). Study of ‘‘The 2014 World Urbanization
Prospects report.’’ http://esa.un.org/unpd/wup/. July 10, 2014.
Tringe, S.G., Zhang, T., Liu, X., Yu, Y., Lee, W.H., Yap, J., Yao, F., Suan, S.T.,
Ing, S.K., Haynes, M., et al. (2008). The airborne metagenome in an indoor ur-
ban environment. PLoS ONE 3, e1862.
Tyakht, A.V., Kostryukova, E.S., Popenko, A.S., Belenikin, M.S., Pavlenko,
A.V., Larin, A.K., Karpova, I.Y., Selezneva, O.V., Semashko, T.A., Ospanova,
E.A., et al. (2013). Human gut microbiota community structures in urban and
rural populations in Russia. Nat. Commun. 4, 2469.
Vaarala, O. (2012). Is the origin of type 1 diabetes in the gut? Immunol. Cell Biol.
90, 271–276, http://dx.doi.org/10.1038/icb.2011.115.
Wolfsberg, T.G., andMadden, T.L. (2001). Sequence similarity searching using
the BLAST family of programs. Curr. Protoc. Mol. Biol. Chapter 19, 3.
Yooseph, S., Andrews-Pfannkoch, C., Tenney, A., McQuaid, J., Williamson,
S., Thiagarajan, M., Brami, D., Zeigler-Allen, L., Hoffman, J., Goll, J.B., et al.
(2013). A metagenomic framework for the study of airborne microbial commu-
nities. PLoS ONE 8, e81862.
S 1
CELS 1, 1–15, July 29, 2015 ª2015 The Authors 15