geospatial information for disaster risk reduction and...
TRANSCRIPT
Geospatial Information for disaster risk reduction and
natural resources management
Rolando Ocampo Alcántar
Content• Background
• Geospatial Information for Disaster Management
• Risk Atlas
• Information Exchange Web Site
• Examples of the use of Geospatial Information for Disaster Management

Background
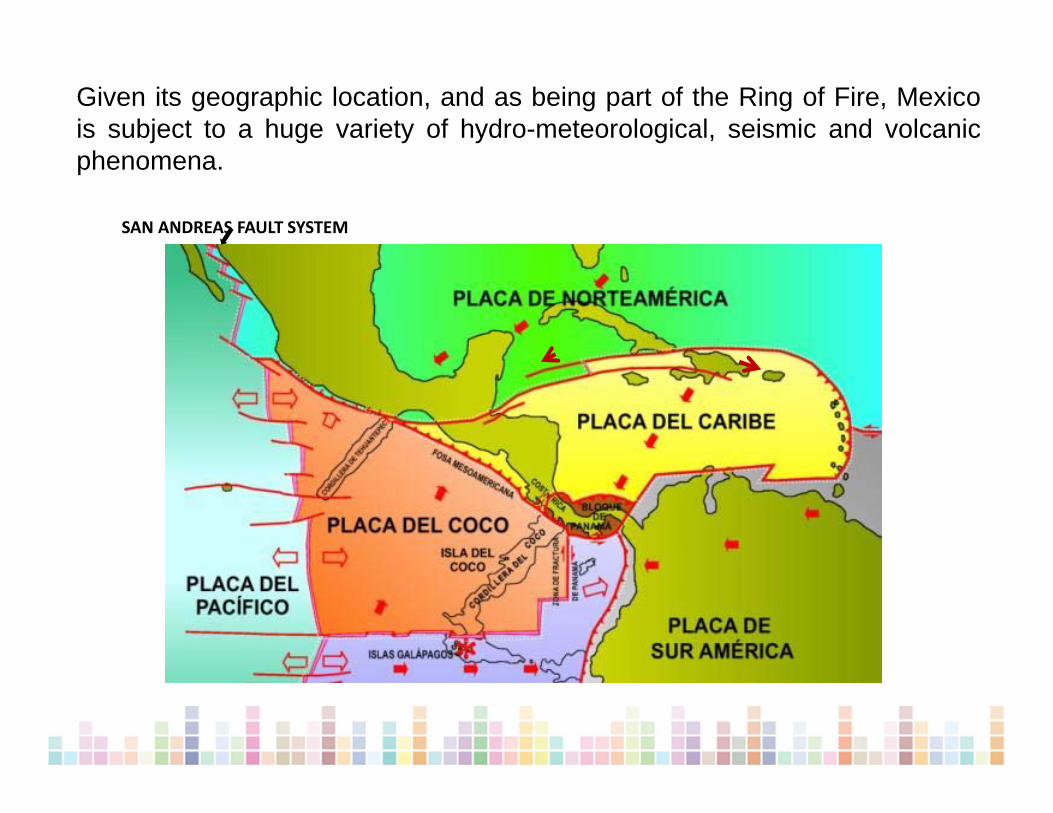
Given its geographic location, and as being part of the Ring of Fire, Mexicois subject to a huge variety of hydro-meteorological, seismic and volcanicphenomena.
SAN ANDREAS FAULT SYSTEM
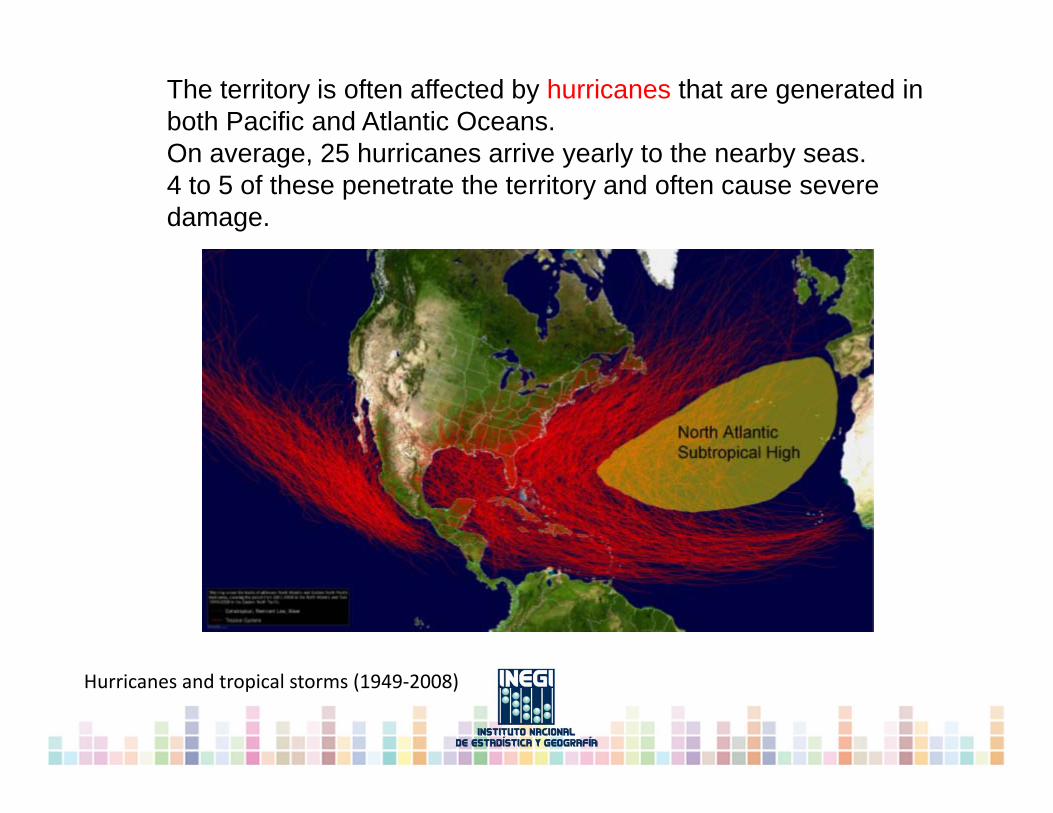
The territory is often affected by hurricanes that are generated in both Pacific and Atlantic Oceans.On average, 25 hurricanes arrive yearly to the nearby seas. 4 to 5 of these penetrate the territory and often cause severe damage.
Hurricanes and tropical storms (1949‐2008)
Geospatial Information for Disaster Management
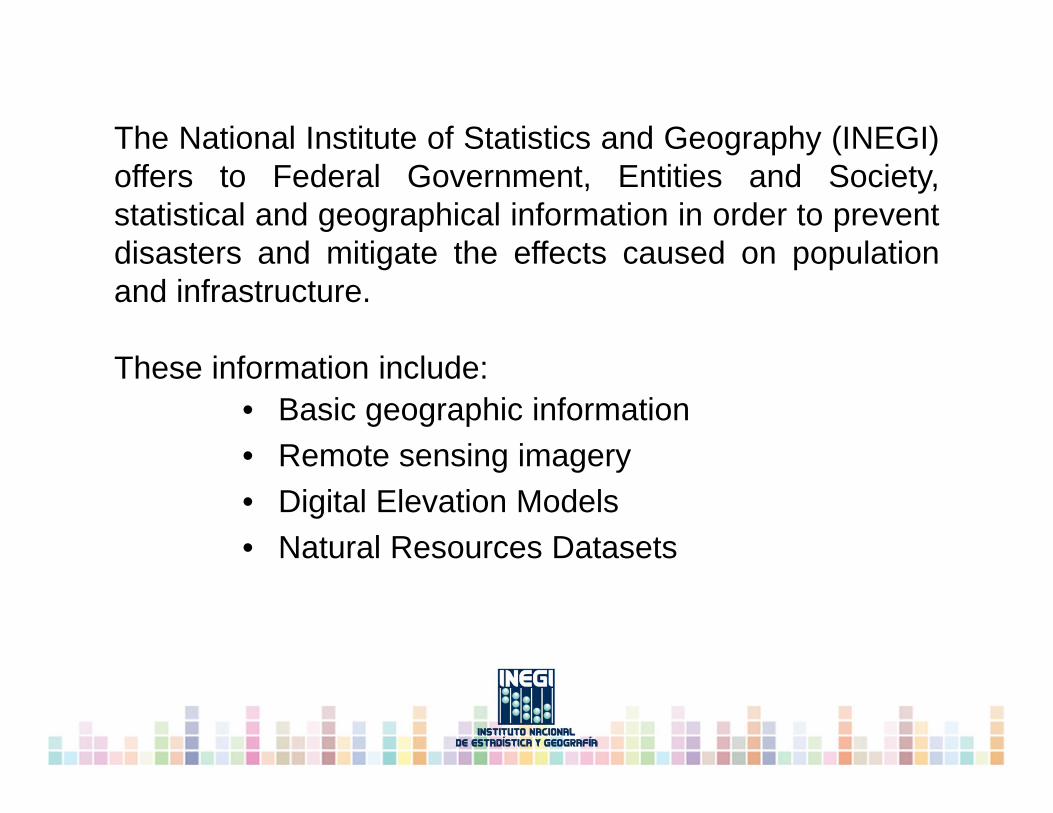
The National Institute of Statistics and Geography (INEGI)offers to Federal Government, Entities and Society,statistical and geographical information in order to preventdisasters and mitigate the effects caused on populationand infrastructure.
These information include:• Basic geographic information• Remote sensing imagery• Digital Elevation Models • Natural Resources Datasets
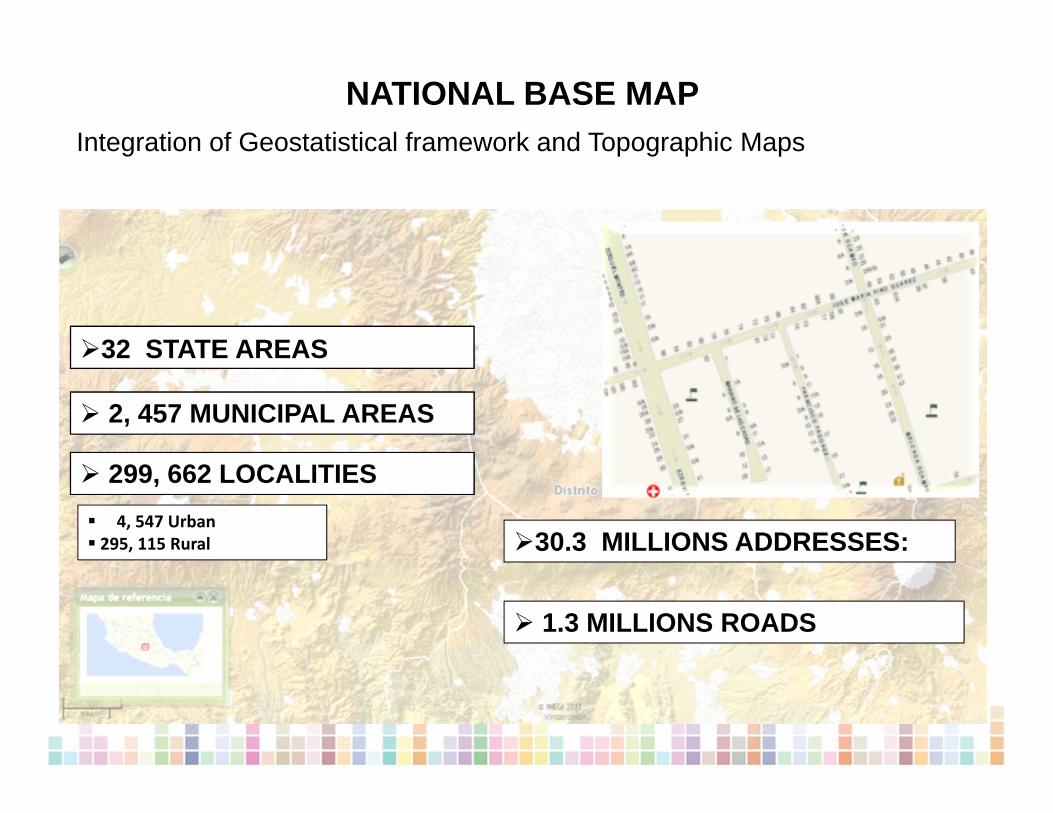
NATIONAL BASE MAP
32 STATE AREAS
2, 457 MUNICIPAL AREAS
299, 662 LOCALITIES 4, 547 Urban 295, 115 Rural 30.3 MILLIONS ADDRESSES:
1.3 MILLIONS ROADS
Integration of Geostatistical framework and Topographic Maps
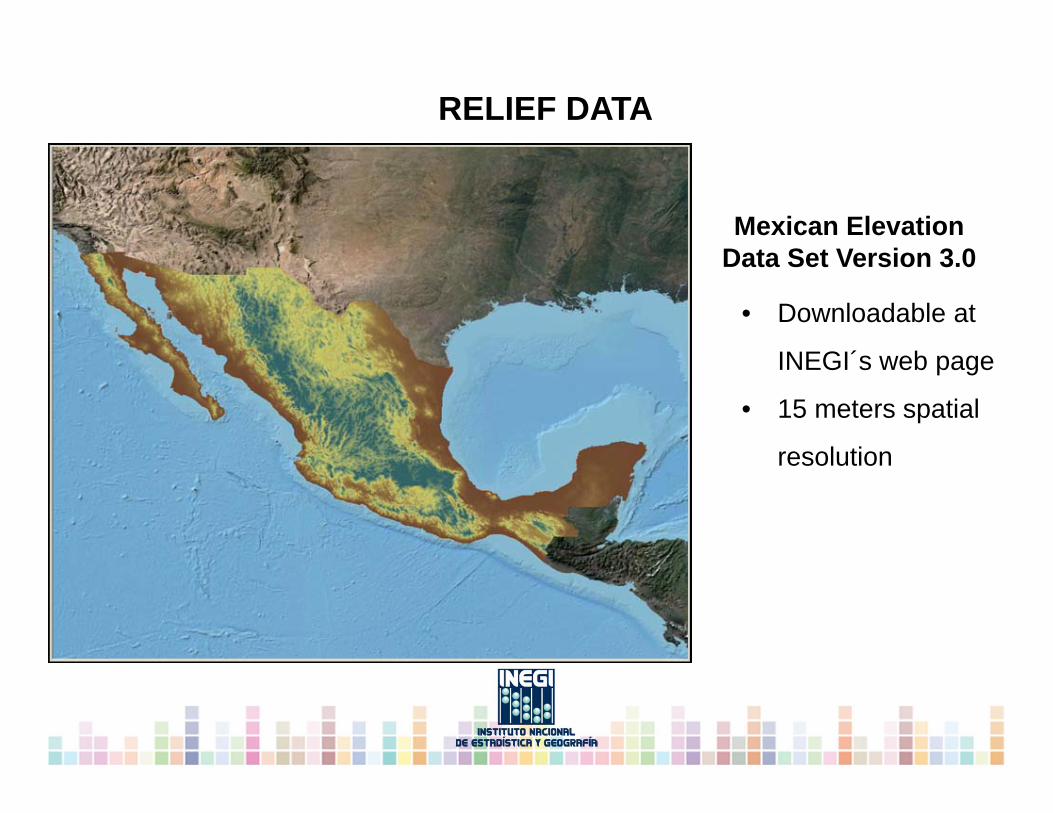
RELIEF DATA
• Downloadable at
INEGI´s web page
• 15 meters spatial
resolution
Mexican ElevationData Set Version 3.0
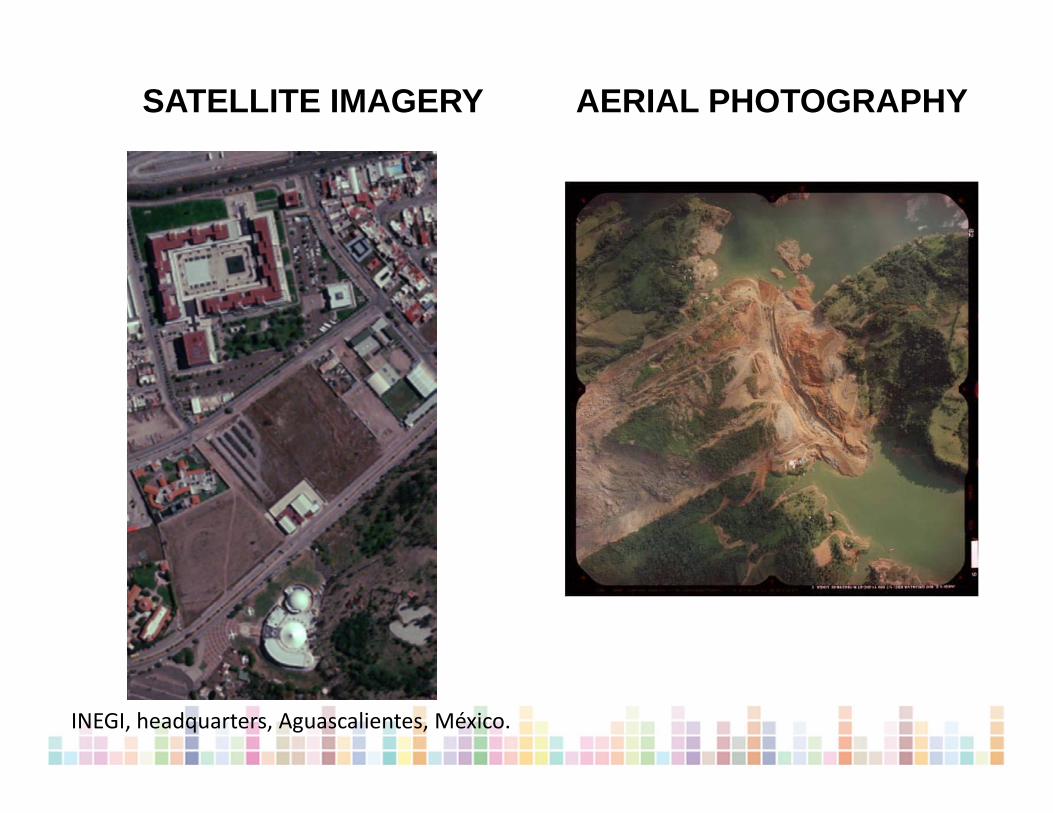
SATELLITE IMAGERY AERIAL PHOTOGRAPHY
INEGI, headquarters, Aguascalientes, México.
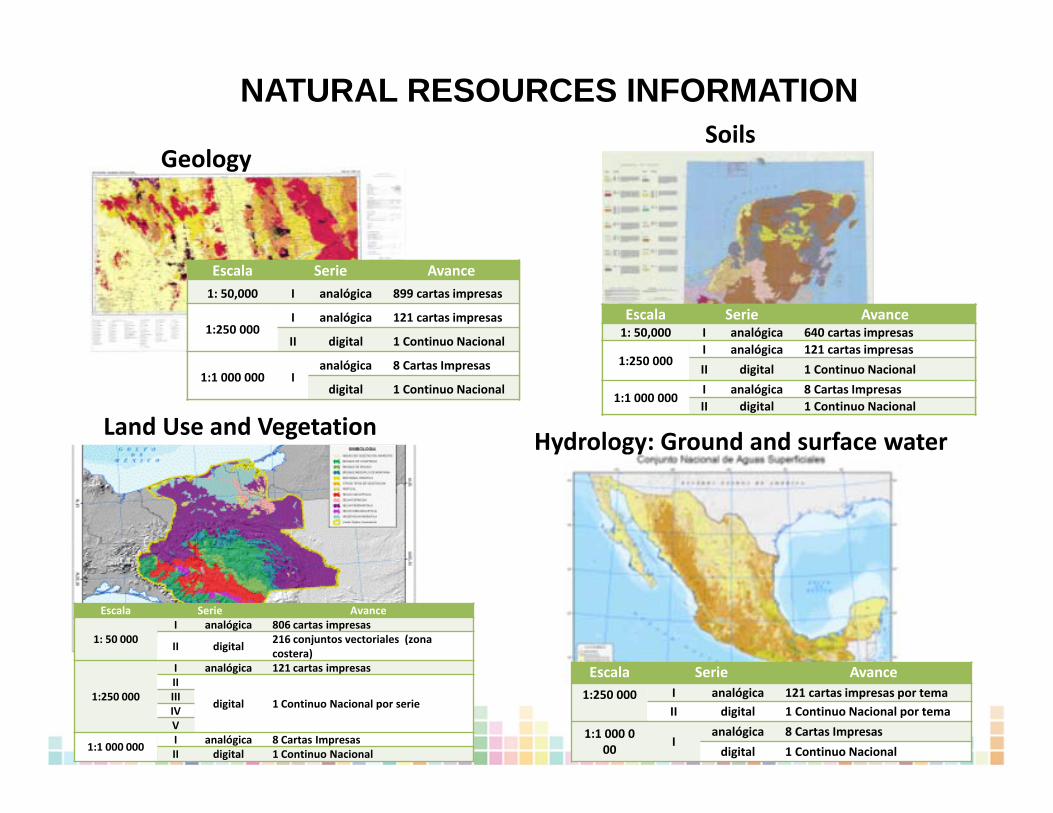
SoilsGeology
NATURAL RESOURCES INFORMATION
Escala Serie Avance1: 50,000 I analógica 640 cartas impresas
1:250 000I analógica 121 cartas impresas II digital 1 Continuo Nacional
1:1 000 000I analógica 8 Cartas Impresas II digital 1 Continuo Nacional
Escala Serie Avance1: 50,000 I analógica 899 cartas impresas
1:250 000I analógica 121 cartas impresas
II digital 1 Continuo Nacional
1:1 000 000 Ianalógica 8 Cartas Impresas
digital 1 Continuo Nacional
Land Use and Vegetation Hydrology: Ground and surface water
Escala Serie Avance
1: 50 000I analógica 806 cartas impresas
II digital 216 conjuntos vectoriales (zona costera)
1:250 000
I analógica 121 cartas impresasII
digital 1 Continuo Nacional por serie III IVV
1:1 000 000 I analógica 8 Cartas Impresas II digital 1 Continuo Nacional
Escala Serie Avance1:250 000 I analógica 121 cartas impresas por tema
II digital 1 Continuo Nacional por tema
1:1 000 000 I
analógica 8 Cartas Impresas digital 1 Continuo Nacional
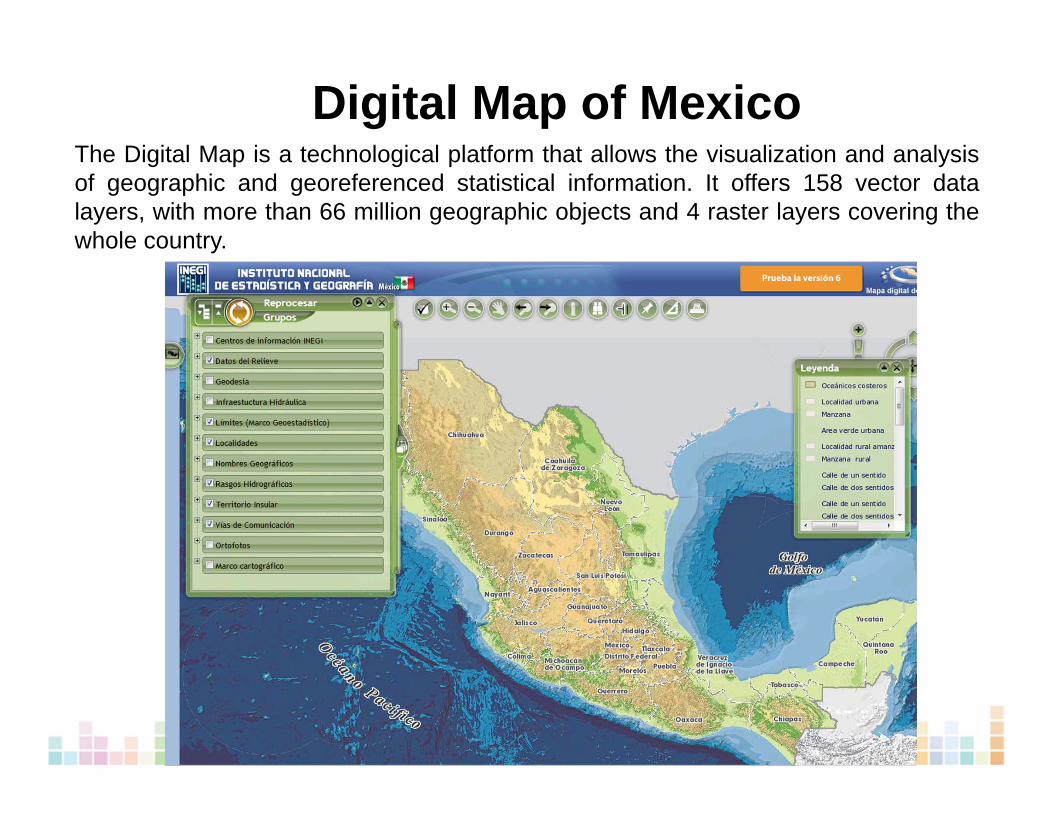
Digital Map of MexicoThe Digital Map is a technological platform that allows the visualization and analysisof geographic and georeferenced statistical information. It offers 158 vector datalayers, with more than 66 million geographic objects and 4 raster layers covering thewhole country.

Risk Atlas
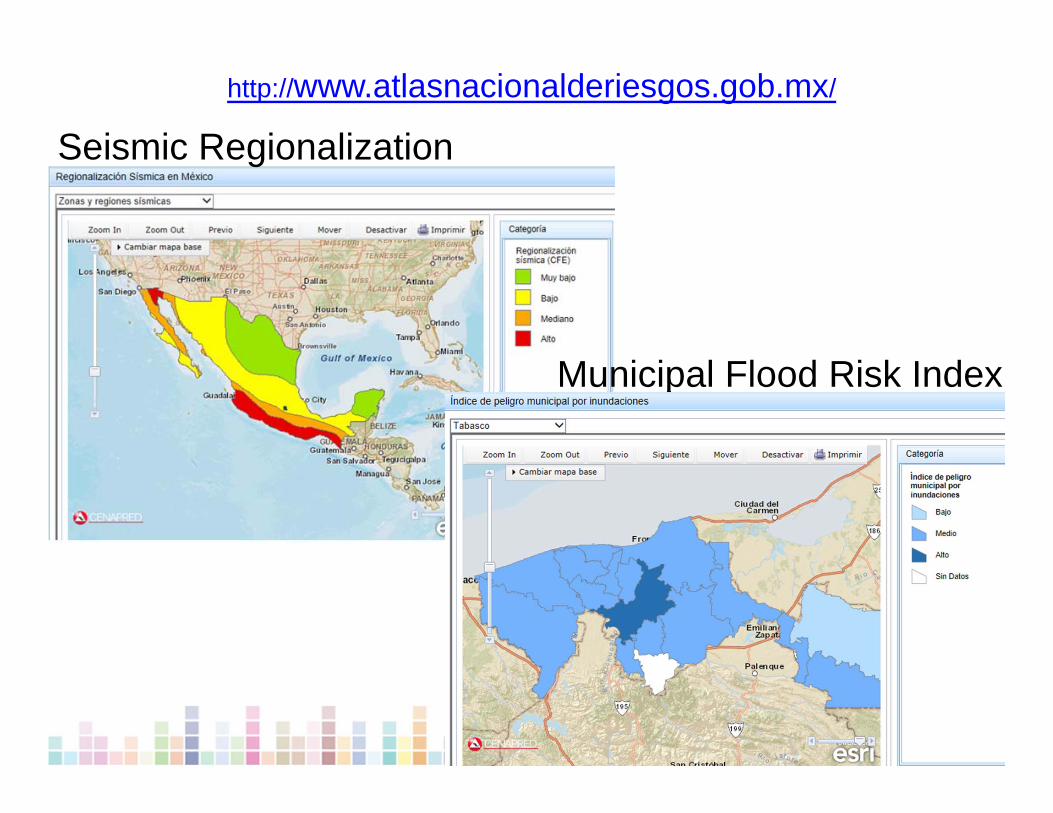
Seismic Regionalization
Municipal Flood Risk Index
http://www.atlasnacionalderiesgos.gob.mx/
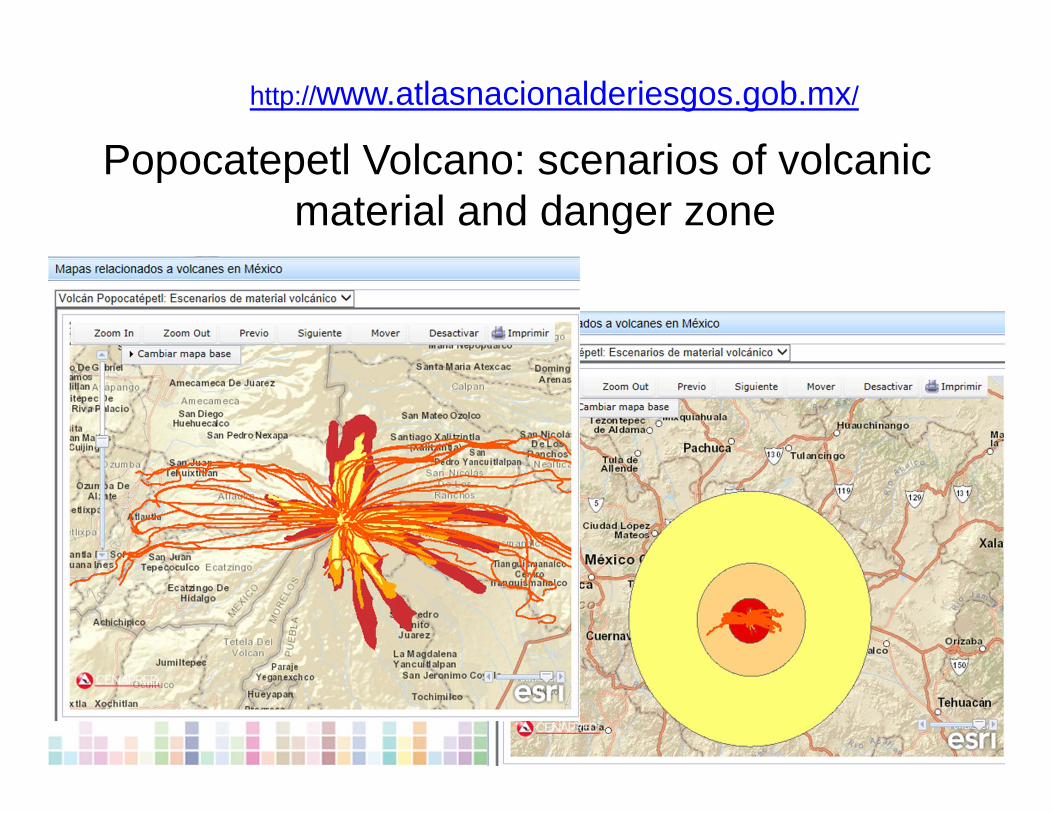
Popocatepetl Volcano: scenarios of volcanic material and danger zone
http://www.atlasnacionalderiesgos.gob.mx/
Information Exchange Web site
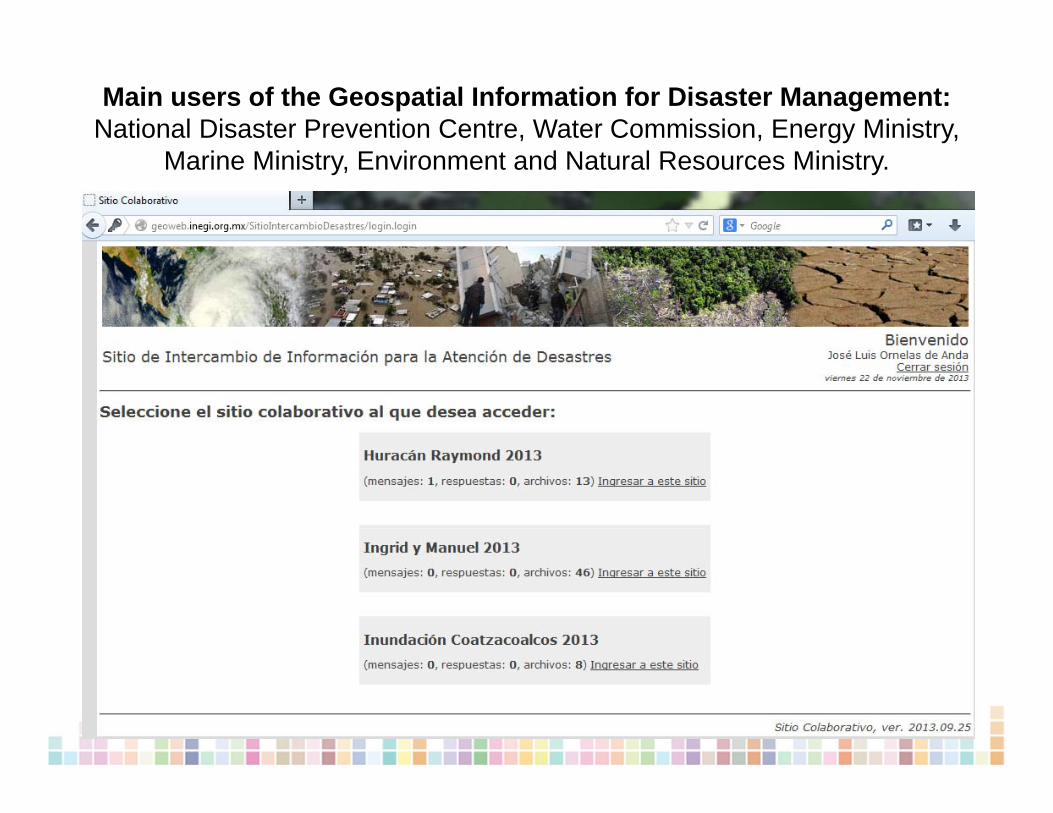
Main users of the Geospatial Information for Disaster Management:National Disaster Prevention Centre, Water Commission, Energy Ministry,
Marine Ministry, Environment and Natural Resources Ministry.
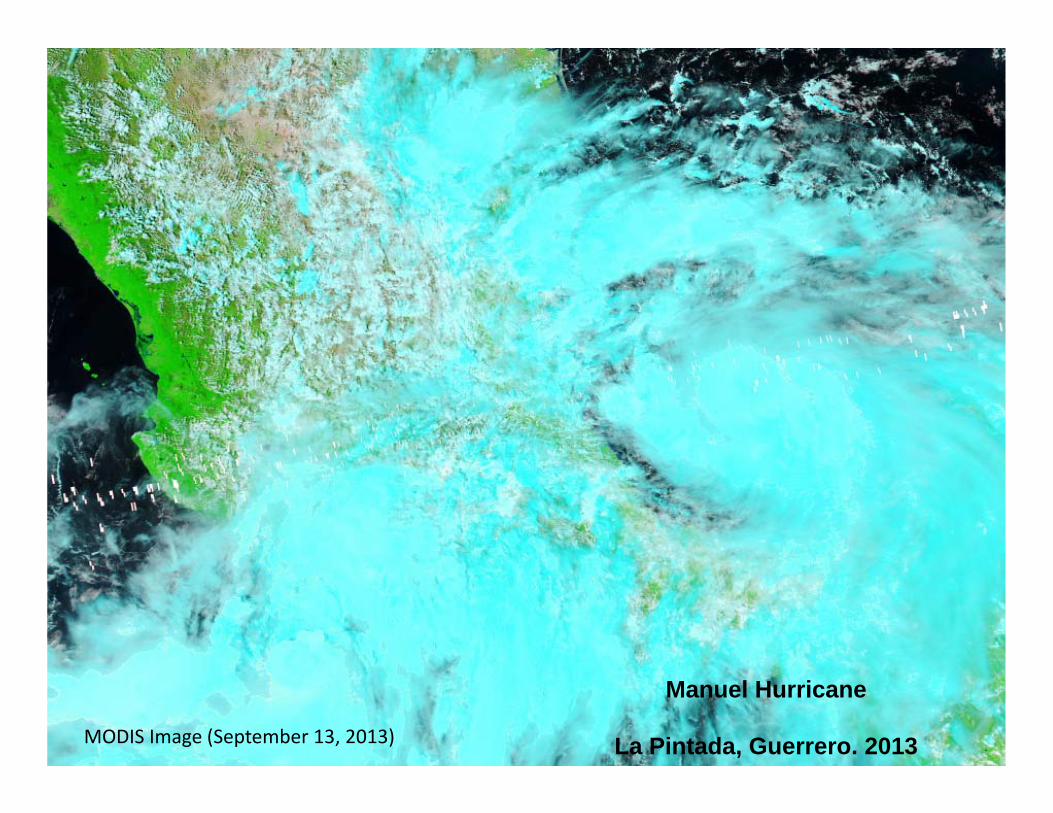
MODIS Image (September 13, 2013)
Manuel Hurricane
La Pintada, Guerrero. 2013
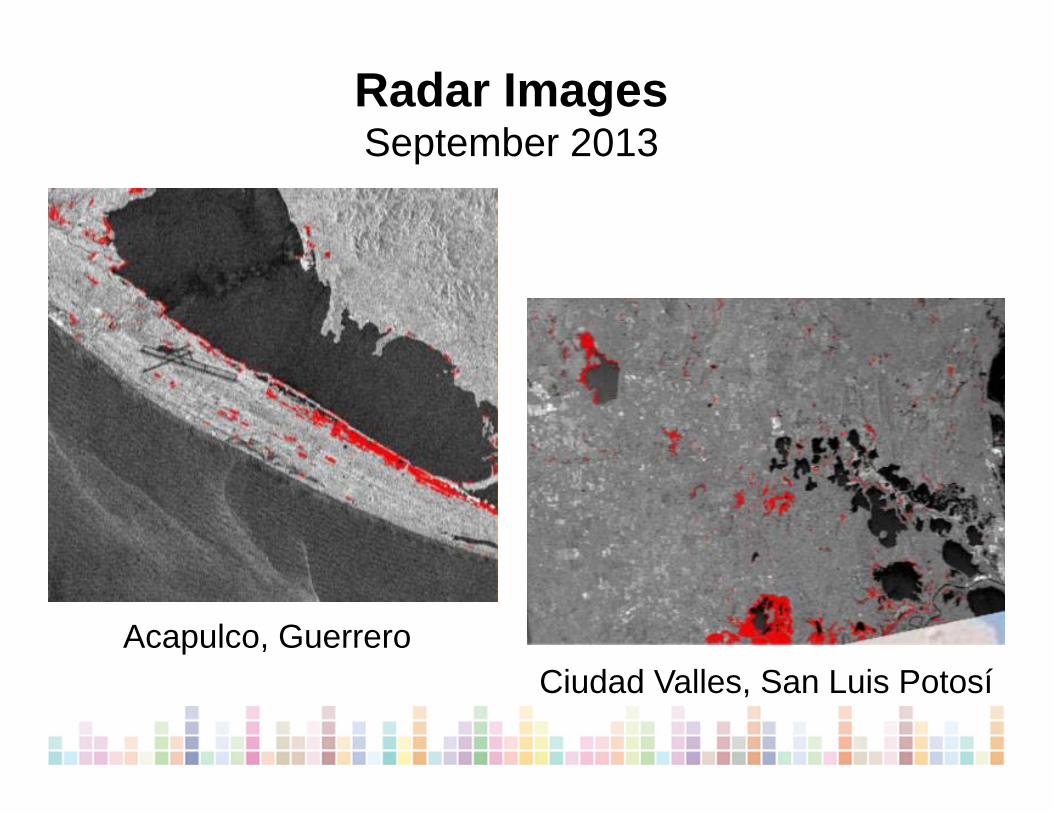
Radar ImagesSeptember 2013
Acapulco, GuerreroCiudad Valles, San Luis Potosí

Examples of the use of Geospatial
Information for Disaster Management
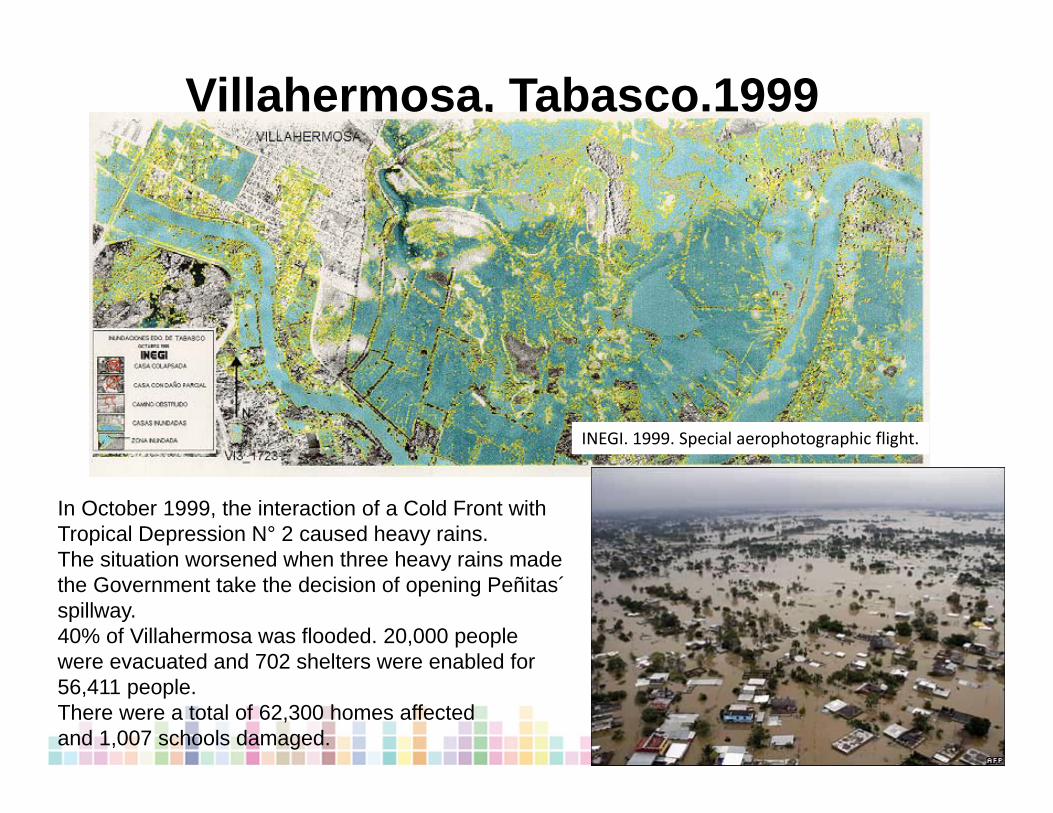
Villahermosa, Tabasco.1999
In October 1999, the interaction of a Cold Front with Tropical Depression N° 2 caused heavy rains.The situation worsened when three heavy rains made the Government take the decision of opening Peñitas´spillway.40% of Villahermosa was flooded. 20,000 people were evacuated and 702 shelters were enabled for 56,411 people.There were a total of 62,300 homes affected and 1,007 schools damaged.
INEGI. 1999. Special aerophotographic flight.
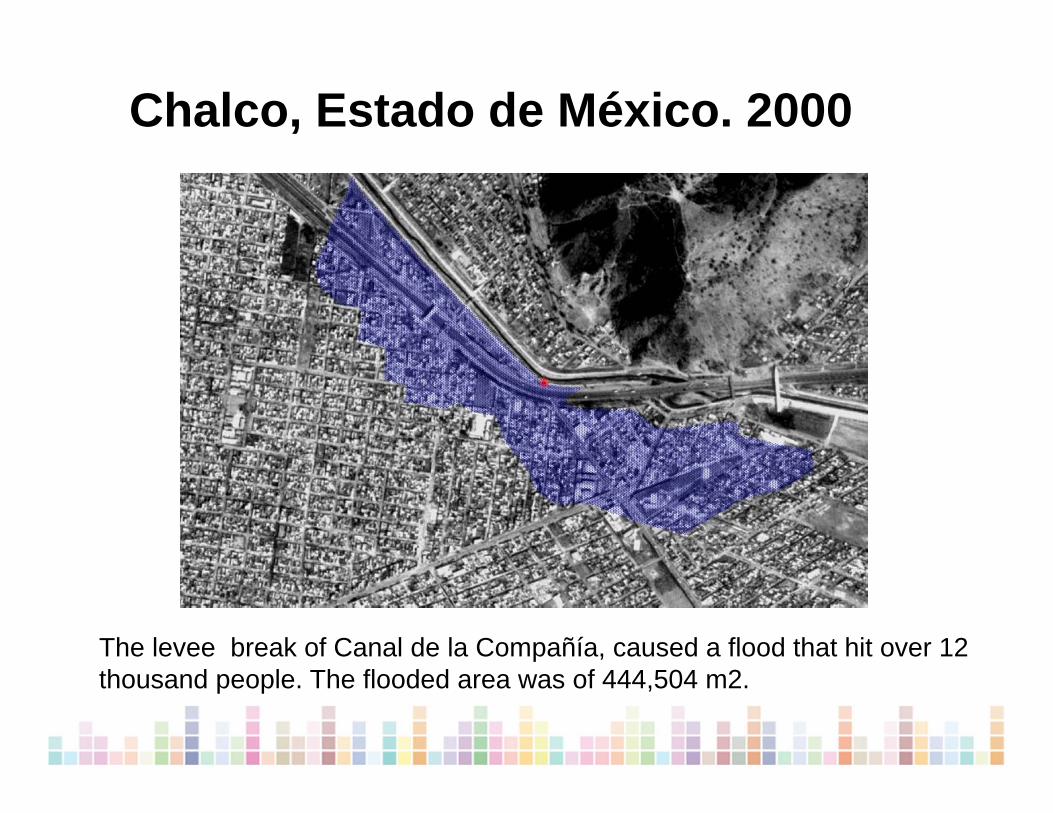
Chalco, Estado de México. 2000
The levee break of Canal de la Compañía, caused a flood that hit over 12 thousand people. The flooded area was of 444,504 m2.
INEGI. 2000. Special aerophotographic flight.
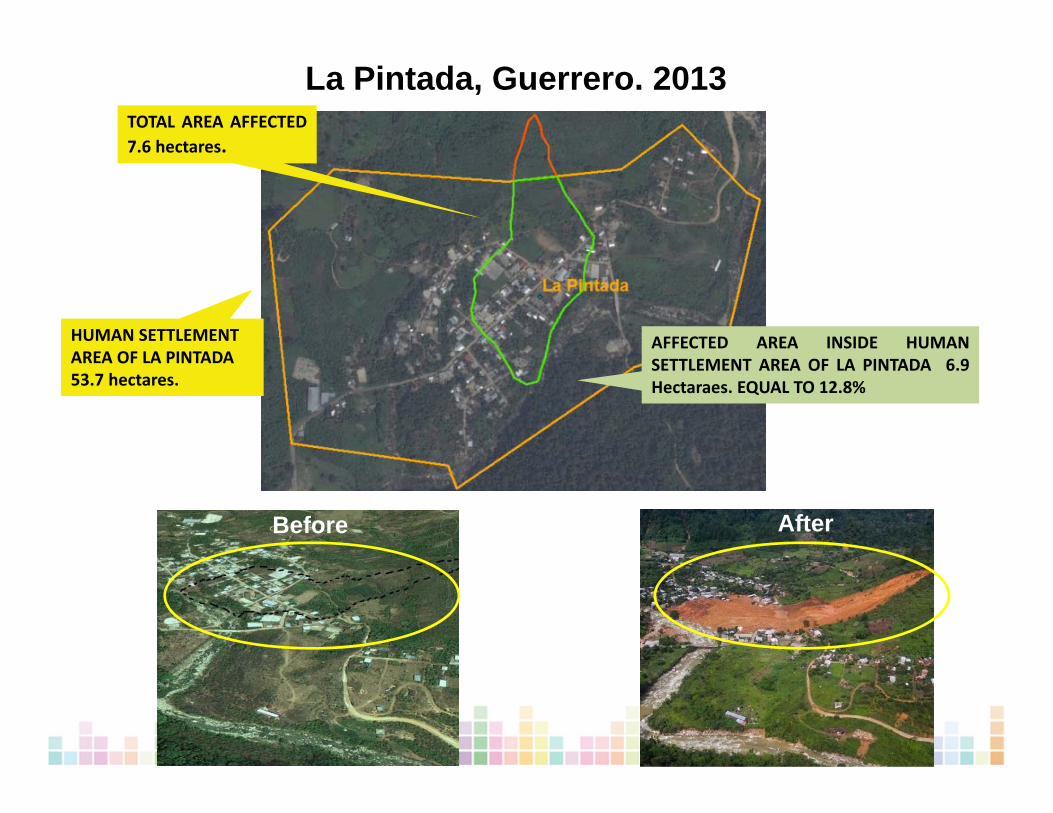
Before
After
La Pintada, Guerrero. 2013
AFFECTED AREA INSIDE HUMANSETTLEMENT AREA OF LA PINTADA 6.9Hectaraes. EQUAL TO 12.8%
HUMAN SETTLEMENT AREA OF LA PINTADA 53.7 hectares.
TOTAL AREA AFFECTED7.6 hectares.
After
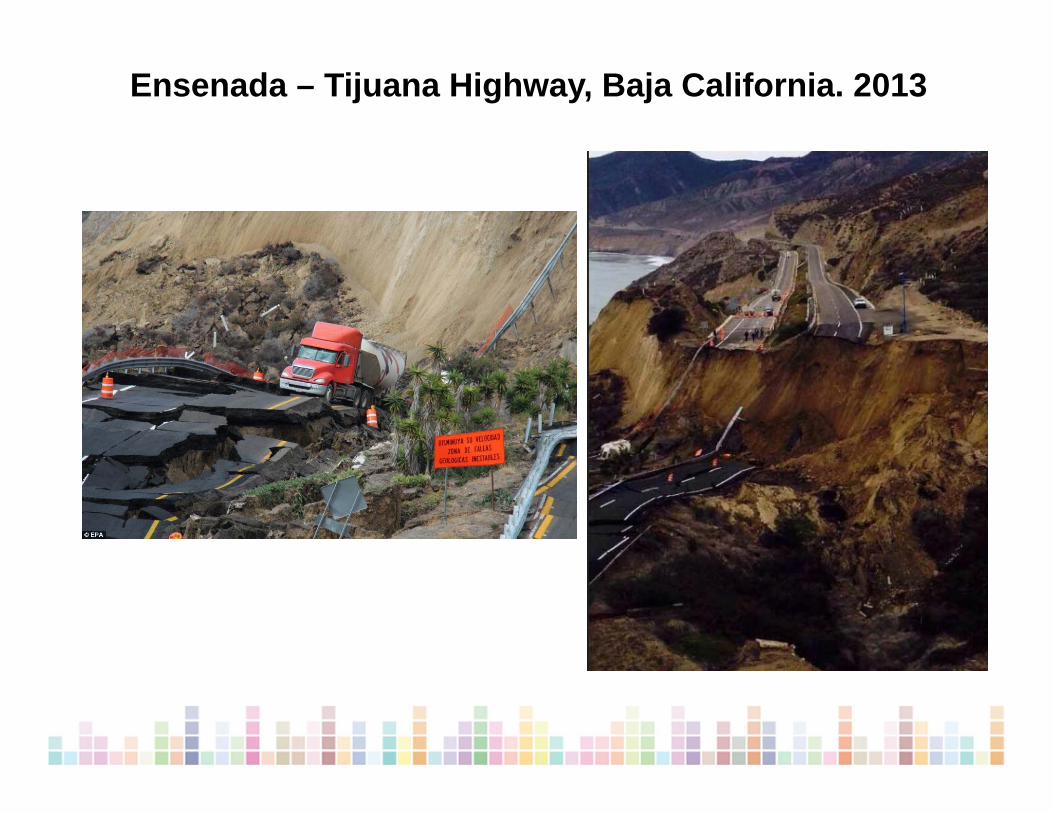
Ensenada – Tijuana Highway, Baja California. 2013

Geospatial Information for disaster risk reduction and
natural resources management
Rolando Ocampo Alcántar