geosocial gauge
DESCRIPTION
The remarkable success of online social media sites marks a shift in the way people connect and share information. Much of this information now contains some form of geographical content because of the proliferation of location-aware devices, thus fos- tering the emergence of geosocial media – a new type of user-generated geospatial information.TRANSCRIPT

International Journal of Geographical Information Science, 2013Vol. 27, No. 12, 2483–2508, http://dx.doi.org/10.1080/13658816.2013.825724
Geosocial gauge: a system prototype for knowledge discovery fromsocial media
Arie Croitorua*, Andrew Crooksb , Jacek Radzikowskia and Anthony Stefanidisa
aGeography and Geoinformation Science, George Mason University, Fairfax, VA, USA;bComputational Social Science, George Mason University, Fairfax, VA, USA
(Received 7 February 2013; accepted 13 June 2013)
The remarkable success of online social media sites marks a shift in the way peopleconnect and share information. Much of this information now contains some form ofgeographical content because of the proliferation of location-aware devices, thus fos-tering the emergence of geosocial media – a new type of user-generated geospatialinformation. Through geosocial media we are able, for the first time, to observe humanactivities in scales and resolutions that were so far unavailable. Furthermore, the widespectrum of social media data and service types provides a multitude of perspectiveson real-world activities and happenings, thus opening new frontiers in geosocial knowl-edge discovery. However, gleaning knowledge from geosocial media is a challengingtask, as they tend to be unstructured and thematically diverse. To address these chal-lenges, this article presents a system prototype for harvesting, processing, modeling,and integrating heterogeneous social media feeds towards the generation of geosocialknowledge. Our article addresses primarily two key components of this system pro-totype: a novel data model for heterogeneous social media feeds and a correspondinggeneral system architecture. We present these key components and demonstrate theirimplementation in our system prototype, GeoSocial Gauge.
Keywords: social media; geosocial analysis; social network analysis; event monitor-ing; system architecture
1. Introduction
The ubiquity of social media in almost every aspect of modern life is evident in the rapidgrowth of the sheer volume of data generated by its users. In 2011, Twitter users wereposting approximately 200 million tweets per day (Twitter 2011). A year later, this dou-bled to 400 million (Forbes 2012), reaching a worldwide rate of over 270,000 tweets perminute. At the same time, Flickr users upload in excess of 3000 images per minute (Sapiro2011), and YouTube users upload approximately 72 hours of video per minute (YouTube2013). These are remarkable volumes of user-generated data, signifying the shift that hasoccurred in recent years in digital data production. Although in the past established govern-ment or commercial organizations were responsible for generating most of the digital data,today it is estimated that approximately 75% of all digital data is contributed by individualusers (Mearian 2011). This trend in data growth is expected to become even more signif-icant over the next several years (Hollis 2011), as computing and technological advances
*Corresponding author. Email: [email protected]
© 2013 Taylor & Francis
Dow
nloa
ded
by [
Geo
rge
Mas
on U
nive
rsity
] at
09:
56 0
5 N
ovem
ber
2013

2484 A. Croitoru et al.
are solidifying the role of the general public as the main contributor and consumer ofbig data.
Coincident with these trends is the proliferation of location-aware devices. This makesa large portion of user-generated content contributed through web services to be geolo-cated, thus fostering the emergence of a new type of geospatial information: user-generated,geolocated (or georeferenced) multimedia feeds of diverse thematic content. These feedsare of diverse value, because they are expressions of geo-journalism, conveying cur-rent information about significant events, ranging from political movements and uprising(New York Times 2011, Pollock 2011) to natural disasters (Earle et al. 2010, Crooks et al.2013). These feeds also communicate users’ opinions and views (Bruns and Burgess 2011,Tumasjan et al. 2011) or even communicate their experiential perception of the spacearound them (as in the concept of urban imaginaries of Kelley 2011). As a result, weargue that social media feeds are becoming increasingly geosocial in the sense that theyoften have a substantial geographical content. This can take the form of coordinates fromwhich the contributions originate or of references to specific locations. At the same time,information on the underlying social structure of the user community can be derived bystudying the interactions between users (e.g., formed as the respond to, or follow, otherusers), and this information can provide additional context to the data analysis. Geosocialmedia therefore emerges as an alternative form of geo-information, which, through its vol-ume and richness, opens new avenues and research challenges for the understanding ofdynamic events and situations.
This rise of geosocial media represents a deviation from the well-established conceptsof crowdsourcing and volunteered geographic information (VGI Goodchild 2007, Fritzet al. 2009, Goodchild and Glennon 2010): unlike Wikimapia or OpenStreetMap, socialmedia feeds are not a vehicle for citizens to explicitly and purposefully contribute geo-graphic information to update or expand geographic databases. Instead, the geographiccontent is embedded in the contributors’ comments and has to be harvested and analyzedbefore it can be utilized. This type of geographic information has been referred to asAmbient Geographic Information (AGI, Stefanidis et al. 2013) and represents an exten-sion of the VGI concept. One could argue that while VGI is primarily crowdsourcing, withspecific tasks outsourced to the public at large, AGI is crowd harvesting, with the generalpublic broadcasting information that can be harvested in a meaningful manner.
The utilization of multiple geosocial media sources for information extraction andknowledge generation in various application domains is a challenging task, both in termsof data management and analysis and in terms of knowledge production. For example,many of the current efforts, such as the Ushahidi1 platform, provide a means to collect datafrom multiple social media sources and disseminate it over the web. While such efforts arevaluable for aggregating and visualizing data, they currently lack capabilities to add con-text to content or to support detailed analysis. The heterogeneity and diversity of geosocialmedia, which are both defining properties and essential to their value, often result in a lackof structural homogeneity and adherence to standards that are typically present in moretraditional authoritative sources (e.g., government generated data). As a result, the form ofraw geosocial media tends to be unstructured, and valuable knowledge is often implicit andcannot be easily processed through automation (Sahito et al. 2011). Such data structureheterogeneity has a direct impact on the ability to store it in a single integrated databaseand manage or process effectively. This heterogeneity is accompanied by thematic diver-sity: user activity in Twitter can range, for example, from daily chatter and conversationsto news reporting and sharing or seeking information (Java et al. 2009). Accordingly, the
Dow
nloa
ded
by [
Geo
rge
Mas
on U
nive
rsity
] at
09:
56 0
5 N
ovem
ber
2013

International Journal of Geographical Information Science 2485
ability to integrate content across different feeds presents a challenge that requires a holisticapproach to the analysis and synthesis of such data.
To address these challenges, this article presents a system prototype for harvesting,processing, modeling, and integrating heterogeneous social media feeds towards the gen-eration of geosocial knowledge. Rather than focusing on a specific geosocial media sourceor a specific user type, our framework aims to empower users to harvest, ingest, and analyzediverse data sources (starting with Twitter and Flickr). We focus on two key componentsof this system prototype: a general system architecture for harvesting geosocial data and anovel data model for heterogeneous social media feeds. We present these key componentsand demonstrate results from their implementation in GeoSocial Gauge, our system proto-type. Through these results we showcase the unique insights we can glean by integratingspatial and social analysis, especially as it relates to identifying the footprint of distributedconnected communities, and observing the effects of various events on these communi-ties and the corresponding social media activity. More specifically, we demonstrate howwe find the social structure of these communities, their spatial footprint, and how thesecommunities are affected by relevant events. Together, these elements provide us with anew lens for observing and understanding the human landscape as a geosocial ecosystem,comprising communities, their locations, and the links that connect them. The analysispresented here provides some examples of geosocial knowledge discovery, as defined inthe context of this article, and is representative of the capabilities of systems such asGeoSocial Gauge. These examples can be viewed as addressing some of the broader chal-lenges identified by Sui and Goodchild (2011) regarding the convergence of GIS and socialmedia.
The remainder of this article is organized as follows. In Section 2, we present ourapproach to modeling geosocial data, outline the key elements of this model, and dis-cuss the relationships between the different model components. In Section 3, we presentGeosocial Gauge, our Geosocial analysis workbench, including its workflow, the data har-vesting process, and the design principles of the workspace environment. To demonstratethe benefits of our framework, we describe in Section 4our analysis results from two recentreal-world sociopolitical events. Finally, we outline in Section 5our conclusion and outlookassessment.
2. A system architecture for geosocial knowledge discovery
In the context of this article, we refer to geosocial knowledge as the aggregate under-standing of human activities reflecting the interactions among individuals and groups ofpeople and how these relate to space and time. This represents an extension of traditionalgeospatial data gathering and processing, expanding its scope beyond physical infrastruc-ture, terrain, and buildings, to include the complex social-cultural fabric of the world, asrepresented both in the physical and the cyber realms.
A key characteristic of social media is that much of the information that can be derivedfrom it is implicit and has to be extracted through analysis. For example, while it isoften possible to derive a social network from social media feeds, this typically requiresadditional analysis to make user connections explicit. Harvesting geosocial knowledgetherefore requires developing a dedicated system that would be able to collect social mediafeeds, analyze them to reveal any implicit information, and store this information in adatabase to support knowledge discovery.
Based upon these observations, we have designed a dedicated system built around twoguiding principles:
Dow
nloa
ded
by [
Geo
rge
Mas
on U
nive
rsity
] at
09:
56 0
5 N
ovem
ber
2013

2486 A. Croitoru et al.
• As social media data delivery is highly dynamic, the system is designed to ingestfeeds at a high rate independently of any further analysis that is carried out.The decoupling of the initial data collection from further analysis steps eliminatesbottlenecks in the workflow and provides a higher degree of fault tolerance.
• The analysis of feeds is performed using a multi-step approach – ranging from pre-liminary analysis that involves only basic verification to in-depth analysis in whichdata are broken into atomic building blocks, and implicit links between data elementsare identified and created.
As the events communicated in social media are often dynamic and evolving, their harvest-ing requires a continuous refinement process. This process starts by collecting data fromone social media source, using, for example, specific regions of interest, time intervals, andkeywords. The harvested social media data are then analyzed, and the results are used torefine the data gathering process, for example, by refining the search area, time intervals,or keywords used for data collection. In doing so, social media is not regarded simply as anadditional data source, but rather as a key driver for the data collection process. As the rateof contributions in social media varies significantly among platforms, our data harvestingrefinement process starts with the collection of data from a highly dynamic source, that isTwitter, and as the harvesting process is refined, other less dynamic social media sources(e.g., Flickr or YouTube) are harvested. This allows enriching the data available for furtheranalysis, thus enhancing our ability to glean knowledge from it.
2.1. Harvesting and ingesting geosocial data
The transformation of social media feeds into geosocial data is a multi-step process thatgenerally requires three sequential steps: data collection from a set of social media dataproviders via Application Programming Interfaces (APIs), processing its geolocation con-tent, and storing the data in a dedicated database for further analysis. There exist a numberof tools that perform parts of these processes, such as 140 kit,2 or hootsuite,3 but theseare limited in their scalability with respect to large data sets. However, currently availabletools offer limited capabilities to add context to content or to support detailed analysis.In conjunction, there are some noteworthy efforts to create systems for gleaning situa-tional awareness from Twitter and other web text documents (e.g., Tomaszewski et al.2011, MacEachren et al. 2011a, 2011b), but they lack the broader scope we pursue here.Consequently, we have designed and developed a dedicated system for harvesting andingesting geosocial media feeds. As we discuss below, a key characteristic of this system isthe ability to continuously harvest, process, and store social media feeds while minimizingany dependencies between these processes. This design minimizes the effect of processingbottlenecks on the overall system performance. Figure 1 below depicts a schematic viewof our system. The harvesting process depicted in this figure is driven by Twitter contentand then expanded to incorporate Flickr and YouTube; however, any of these social mediasources may be used to drive the process. Nevertheless, even though from a database stand-point the order of these services can be interchanged, the nature of these services suggeststhat Twitter should indeed lead, as shown in Figure 1, owing to its highly dynamic natureand its immediacy in reporting events (e.g., Blasingame 2011, Crooks et al. 2013).
Generally, feeds can be retrieved from social media services using their APIs. Thisallows user-created client programs to interface with the service, submit queries in theform of an HTTP request, and receive in response data in XML or JSON formats. Thequery parameters may be, for example, based on location (area of interest to which the
Dow
nloa
ded
by [
Geo
rge
Mas
on U
nive
rsity
] at
09:
56 0
5 N
ovem
ber
2013

International Journal of Geographical Information Science 2487
Figure 1. Architecture of a system to harvest and ingest social media feeds that is driven by Twitter.
feed is related), time (period of interest), content elements (keywords), or even user handleor unique ID. It should be noted that depending on the service, some queries may requireclient authentication (e.g., a user-specific API key), while other queries can be submittedwithout authentication. Considering Twitter in particular, two types of APIs can be used.The first is streaming, where Twitter content is fed to the client continuously, subject tothe used filter parameters (e.g., keywords, location) and volume limits. The second APItype is representational state transfer (RESTful, Fielding 2000), where the client issuesqueries to the server at discrete time instances and Twitter returns the corresponding results.In response to issued queries and depending on the particularities of the social media sourcethat is being queried, either only metadata or data and metadata are returned.
When it comes to Flickr, the information extracted from the RESTfulAPI comprisesexclusively metadata (e.g., author, time, and geolocation when available) and informationon how to access the actual image itself. In contrast, the Twitter API provides both theactual tweets and the related metadata. Accordingly, from a system perspective, a key dif-ference between the two is that the Flickr API queries do not result in the data itself,but only in metadata including information necessary for retrieving the actual data (i.e.,images).
In our system, a query is submitted once a connection with the API is established, andthe stream processor receives the returned responses. The stream processor then checksthat the data are valid and calculates basic data volume statistics and saves the data to astorage backup in case streaming rates are higher than processing rates. Once this initialprocessing is completed, the data are transferred to the stream cache. Implemented as acollection in mongoDB, the stream cache is used to isolate the stream processor from thesource processor. This allows the two processors to work independently, protecting thecollection process from the impact of potential problems and delays in the processing ofTweets.
Dow
nloa
ded
by [
Geo
rge
Mas
on U
nive
rsity
] at
09:
56 0
5 N
ovem
ber
2013

2488 A. Croitoru et al.
Data from the stream cache are transferred to the source processor, which has threeprimary functions with respect to Twitter: parsing the information from the tweets that arestored as JSON streams, geocoding, and the insertion of processed data into the sourcedatabase. Of these three processes, geocoding is the most critical, as it is responsible formaking location data explicit, thus enhancing the value of social media data for geosocialanalysis. In our system, geocoding is performed by a dedicated geocoder component usingone or more external gazetteers and is activated when explicit geocoding (i.e., coordinates)is not available in a data item. In addition, the source processor is responsible for retrievingand processing data from RESTful APIs (e.g., Flickr and YouTube).
After the geocoding process, data from the source processor are transferred to thesearchable database. This database stores the processed social media data as individualdata elements, and like the stream cache, it is also implemented using mongoDB to sup-port fast access for near real-time basic analysis. For example, data from the social mediadatabase can be used for visualization in mash-ups that require quick access to individualtweets that were subject to the first level processing. The goal of such visualizations is toprovide timely dissemination and exploration of the data for fast discovery of trends orthe identification of anomalies, which does not require full knowledge of the underlyingstructure of the connections (i.e., the social network) between different social media users.
The final component of our system involves processing the data and storing it in a dedi-cated database to support further analysis to reveal connections between social media usersand requires finer querying capabilities. A key differentiator between the source informa-tion processor and the previous two processors is that it supports social network analysisby making the connections between users explicit. This processing step is separated fromthe previous two processing steps as it is slower, requiring multiple transactions with a ded-icated database. The outputs of the source information processor are stored in the socialmedia database, which is implemented as an SQL database using PostgreSQL. This is asearchable repository of data that supports integration of the various data structures undera unified scheme, thus allowing performing multi-source geosocial analysis. We discuss inSection 3this unified scheme.
3. Modeling heterogeneous geosocial data
The analysis and utilization of heterogeneous social media requires the development of aconceptual data model that will allow the integration of the various data structures undera unified scheme. Generally, this task can be viewed as a data-cleaning problem, that is,the removal of errors and inconsistencies in databases (Rahm and Do 2000), from either asingle source or multiple sources of data. For multiple (heterogeneous) data sources, data-cleaning problems can arise at the schema level (e.g., structural inconsistencies) or at theinstance level (e.g., uniqueness violations). In this work, we assume consistency withineach source (e.g., Twitter or Flickr) as each social media site maintains its own database.However, since we are interested in integrating multiple social media data sources, struc-tural inconsistencies should be considered. For example, different sources may have certainelements that are unique or specific to them. This problem has been recently indicated inthe context of processing social network data in business applications (Bonchi et al. 2011)or in the context of music recommender systems (Tan et al. 2011).
A step towards a more general solution for integrating social data was recently pre-sented by Lyons and Lessard (2012), who introduced a social feature integration techniquefor existing information systems that are not socially oriented. However, to the best ofour knowledge, there are still no widely accepted models that could be directly applied
Dow
nloa
ded
by [
Geo
rge
Mas
on U
nive
rsity
] at
09:
56 0
5 N
ovem
ber
2013

International Journal of Geographical Information Science 2489
to multiple social media sources for geographical analysis. For example, Sahito et al.(2011) presented a framework for enriching and deriving linkages in Twitter data by usingsemantic web resources, such as DBpedia,4 FreeBase,5 and GeoNames.6 However, thiswork considers only a single social media source – Twitter. A more generalized concep-tual model has been recently introduced by Reinhardt et al. (2010). In this model, socialmedia data are seen as a combination of two intertwined networks: a set of artifact net-works that describes the relationships between data elements (e.g., chats, blogs, or wikiarticles) and a social network. This artifact actor network (AAN) model is created by link-ing the two networks through semantic relationships. Content elements, for example, chatsor wiki articles, are modeled using two fundamental building blocks: actors (i.e., users)and artifacts (i.e., content). Although the overall framework concept of the AAN is nottied to a specific social media type, its implementation for different data sources is tai-lored to each source, for example, Twitter data are modeled differently than wiki sources.Our work is closely related to the data model presented by Shimojo et al. (2010), whichfocuses on lifelogs: digital records of the experiences and events a person encounters dur-ing a period of time, which are generated by individuals (Kalnikaite et al. 2010). Theirwork presents a model that is geared towards the integration of multiple heterogeneoussocial media sources through the introduction of a common model for lifelog data. Suchlifelog data, as captured by online services such as Twitter, Facebook, or Flickr, are mod-eled according to six fundamental perspectives: (1) what (the data content), (2) why (thepurpose of the data), (3) when (the time when the data entry occurred), (4) who (the ini-tiator of the data entry and other users involved), (5) where (the location at which the dataentry was made), and (6) how (the means by which the lifelog was recorded). Based onthis schema, the modeling process involves mapping data source elements to the relevantcommon data model perspectives and converting the data to a common format. However,the basic data model unit used in this work is the lifelog, and relations between lifelogs(and users) are not modeled.
The data model presented in this article complements and extends both modelspresented above and is designed around two fundamental principles:
(1) Social media has both source-independent and source-dependent components: dueto the nature of the social media production process, some components of the data,for example, a user, a data entry, and timestamp, will always be present, whileothers, such as a photo URL, may be present in some data sources (e.g., Flickr)and not in others (e.g., Twitter).
(2) Social media is inherently interconnected in a variety of ways reflecting relationsamong authors and content. These relations may be active, whereby an author,for example, may comment or reply to another contribution. They may also bepassive, whereby, for example, an author may simply be following other authors(by subscribing to their feeds).
We argue that this decoupling of source-dependent and source-independent componentsallows us to reach a high level of abstraction in our model, and diminishes the need totailor a specific solution for each data source type. By taking advantage of the source-independent component of social media entries we can turn unstructured data streams intostructured information, which can be analyzed to extract knowledge. This allows us, forexample, to identify social structures that span several social services, or references to thesame event or topic coming from different sources and/or services. In Figure 2 we providean entity–relation diagram of our data model, demonstrating the use of entry, geolocation,
Dow
nloa
ded
by [
Geo
rge
Mas
on U
nive
rsity
] at
09:
56 0
5 N
ovem
ber
2013

2490 A. Croitoru et al.
Figure 2. An Entity–Relation (ER) diagram of our geosocial media data model. Related entities areconnected with a line, where the cardinality of the relation is denoted by the diamond at the centerof the line and the labels at the ends of the line. Relations with a white diamond denote a one-to-onerelation, and relations with a white and black diamond denote a one-to-many relation. The cardinalityof each side of the relation is denoted by a label at each end of the line (e.g., ‘1 . . . ∗’ represents oneor more and ‘0 . . . 1’ represents zero or one).
time, keywords, and authors to integrate diverse social media feeds. We describe below keycomponents of this diagram.
3.1. Source-independent components
3.1.1. Entry component
An information entry is regarded in our model as an abstract record of social media data,a high level entity that binds the various components that constitute a data entry. Becauseof their inherent interconnected nature, our model accommodates many-to-many relation-ships between entries through a references table. In our model, the entry component mustbe linked to a single source-dependent component and that it must be linked to at leastone source feed (e.g., various queries to Twitter, Flickr, YouTube). An entry instance is
Dow
nloa
ded
by [
Geo
rge
Mas
on U
nive
rsity
] at
09:
56 0
5 N
ovem
ber
2013

International Journal of Geographical Information Science 2491
uniquely identified by an entry_id and is linked to one author instance of the author com-ponent. In addition, each entry is associated with a timestamp indicating when was theentry published (for further details on the time component, please refer to Section 3.1.4).Optionally, an entry can have links to other source-independent components. For example,each Twitter entry can be associated with one or more keywords that are represented byrecords in the tags table.
3.1.2. Author component
In our model, social media contributors (users) are associated with their contributions in aone-to-many relationship. As an author is identified by a tuple of a user name and a socialmedia service identifier, different users can use the same identifier on different services.While some work has addressed the development of strategies to identify the same usersacross different systems (Iofciu et al. 2011), this extends beyond the scope of this article.It should be noted that authors can also be referenced to in the content of social mediafeeds, for example, a reference to a person’s username in a tweet or a response to contentsubmitted by a user. Such references are important as they allow for the establishment ofa network of relations between users, which enables the reconstruction of the underlyingsocial network. In our model, this is accomplished by linking entries to users through thementions table. The type of the reference (e.g., mention of a username, response, etc) isdefined by assigning specific attribute from the mention_type table.
3.1.3. Geolocation component
Geolocation information for social media feeds can be inferred indirectly from contentanalysis or it can be extracted directly from the data itself. Representative examples ofthe indirect inference of geolocation for social media contributions include Topsy’s geo-inference capabilities7 and MetaCarta’s GeoTag module,8 which geolocate contributionsbased on an analysis of their content and its references to geographic toponyms. Whilegeotagging such contributions is an interesting multidisciplinary problem (see Fink et al.2009, Larson et al. 2011) in the sense that it links contributions to locations referenced inthem, this is beyond the scope of this work.
Direct geolocation is the method exploited by our system. It is included in the contri-butions themselves, either in the form of exact coordinates or as a toponym (e.g., listinga city name) to be geolocated using any gazetteer service (e.g., Lieberman et al. 2010).Within a tweet record, for example, geolocation information may be populated either bythe publisher (Twitter) of the client through which the tweet was submitted, and it may beavailable in the place, coordinates, or location fields. Similarly, in Flickr, the geolocationinformation is available in the location record at various levels of granularity, ranging fromcountry name to city, neighborhood, and precise coordinates. It can also be extracted fromthe image’s exchangeable image file format (EXIF) record. A more detailed discussion onthe various forms of geolocation has been offered by several authors, including Marcuset al. (2011), Croitoru et al. (2012), and Crooks et al. (2013).
Reports on the percentage of social media information that has geolocation informationassociated with it vary rather widely. For example, 6% of the approximately one billionFacebook users have elected to enter their actual home address (Backstrom et al. 2010).Regarding Twitter, we have reports of tweets carrying geolocation information as toponymsat a city level or better ranging from 20% (Cheng et al. 2010) to 65% (Hecht et al. 2011)of the total number of tweets. Geolocation information in the form of precise coordinates
Dow
nloa
ded
by [
Geo
rge
Mas
on U
nive
rsity
] at
09:
56 0
5 N
ovem
ber
2013

2492 A. Croitoru et al.
is available for a smaller percentage of tweets, with reports ranging from 5% (Cheng et al.2010, Valkanas and Gunopulos 2013) to 16% (Stefanidis et al. 2013). This variation in therate of geolocated tweets can be attributed to a range of factors, such as geographic area,time, and theme. For example, the seemingly high rate of 16%, which was observed fol-lowing the 2011 tsunami and Fukushima disaster in Japan, can be attributed to the responseof the Japanese population to a major event (e.g., evacuation), the increased use of mobiledevices after the event (Kaigo 2012), and the high penetration rate of Twitter in Japan(26.6%9). A recent study by Leetaru et al. (2013) using Twitter’s Dekahose data streamhas reported that even in the absence of a significant disruptive event (e.g., a nuclear dis-aster), the rate of geolocated tweets may vary depending on the time of day (from 2.3% at1:00 pm PST to 1.7% at 6:00 am PST) or the geographic location (from 2.86% in Jakartato 0.77% in Moscow).
3.1.4. Time component
While geolocated information is available for only a percentage of social media feeds,temporal information is available for all of them. For tweets, this is their submission time(the instance when it was submitted to Twitter by the user). A few seconds (2–5 s) aftertheir submission, the tweets become available to the public through Twitter. With Flickr, wecan have two time records: image capture (through its EXIF timestamp) or image postingon Flickr. Experiments have shown that social media response to events may be nearlyreal-time, with tweets reporting, for example, earthquakes as early as few tens of secondsafter them (Earle et al. 2010, Earle et al. 2011, Crooks et al. 2013, Kraut et al. 2013).
3.1.5. Narrative component: keywords
Social media are in essence modern reporting and storytelling mechanisms: they enableindividuals to communicate their impressions and interests to the general public. As part ofthis narrative, participants contribute keywords, both explicitly and implicitly. The explicitcontribution of keywords is through tags, like hashtags in Twitter (Huang et al. 2010) orgeneral tags in Flickr (Ames and Naaman 2007). These keyword tags are used to emphasizecontent, facilitate data access, and enable community networking (Romero et al. 2011).Hashtag usage, for example, has been shown to accelerate data retrieval from Twitter(Zhao et al. 2011) and Flickr (Sun et al. 2011). Hashtags also support the building ofsemantic networks by allowing individual tweets to be linked thematically based on theircontent. All tweets, for example, with the hashtag #obama are linked together at the Twittersite. Similarly, photos sharing the same tags in Flickr are aggregated into photosets (theequivalent of single-user photo albums) and groups (multi-user albums).
In addition to these explicit tagging mechanisms, keyword may also emerge by beingadopted massively, for example, in response to real-life events. In Figure 3, we show afrequency word cloud capturing the keywords communicated by the tweets about Syria on20 March 2013 between 8:00 pm and 10:00 pm EDT. This coincides to news breaking outof Syria reporting the suspected use of chemical weapons. In the word cloud, the biggersize words are the most popular ones, and we see how words associated with this massacrehave emerged rapidly as keywords for that time period.
In our model, unique keyword instances are stored in a separate tags table, which islinked to the entries table in a many-to-many relationship. Tags and locations have a many-to-many relationship: a tag can be associated with many locations, while the same locationcan be associated with many tags.
Dow
nloa
ded
by [
Geo
rge
Mas
on U
nive
rsity
] at
09:
56 0
5 N
ovem
ber
2013

International Journal of Geographical Information Science 2493
Figure 3. A frequency word cloud capturing the keywords communicated by the tweets out of Syriaon 20 March 2013 between 8:00 pm and 10:00 pm EDT. Keyword size reflects frequency.
3.1.6. Source component
The source component, and the corresponding sources table, serves as a directory of thedifferent source types that can provide data to our framework. Each source can be asso-ciated with one or more feeds, which are instances of a given source type. A source feedprovides content filtered according to predefined criteria. Each feed instance is character-ized by a feed_id and a name. Additionally, the feed’s record can also contain a query thatis used to retrieve the content; however, since some APIs allow building complex queriesthat cannot be described by a single URL, the query field is optional.
3.2. Source-dependent components
The data received from the feeds can be separated into two parts: a part comprised ofcontent that is common to all sources and a second part comprised of the remaining (noncommon) elements of the data received from the social media API source. This allowsstreamlining the integration of information from different sources, while maintaining theunique elements of each source. Source independent data, in the form of location, key-words, submission time, or authorship, is stored in the database in the tables describedabove. Source-dependent data are stored in source-specific tables. Since each of thesetables is tailored to accommodate the data specific to a given source, we are not constrainedby the requirement to keep uniformity between different sources in our model. For exam-ple, the Twitter API returns a tweet attribute that contains the content of a tweet, while theFlickr API returns a photo URL and has no equivalent to the tweet attribute. Such source-specific attributes, which are driven by the characteristics of each social media source, areregarded as source-dependent and are therefore stored separately. It should be noted that inthe case of Flickr, our focus is on retrieving the location of images rather than retrievingthem, and accordingly we do not consider the photo metadata in our architecture. Similarly,in the case of YouTube, we consider the location of videos rather than the video attributes.
Although Twitter, Flicker, and YouTube (and others) assign a unique entry identifica-tion tag any time media is fed to the service, we maintain in our model an internal unique
Dow
nloa
ded
by [
Geo
rge
Mas
on U
nive
rsity
] at
09:
56 0
5 N
ovem
ber
2013

2494 A. Croitoru et al.
identification tag for each entry to ensure consistency and enable links between entriesand between entries and other model components. The entry identification tags that wereassigned by each social media feed are kept in conjunction to the internal unique identifi-cation tag so that the relation between our identification tags and the social media servicetags are preserved.
4. Implementation and sample test cases
The prototype Geosocial Gauge system presented in this article has been implementedusing a combination of PostgreSQL and MongoDB databases for data storage and pro-grammed using Ruby, SQL, and R. The system can function using either Twitter’s freeAPI or a commercial service to access wider data streams. When using the free API,the data stream is capped to 50 tweets per second10 and is drawn from a 1% randomsample of its traffic. With Flickr there are no substantial restrictions on public contentaccess.
In Figure 4, we show a screenshot from our system’s front-end, showing live updatesof Twitter traffic. It comprises four views of the streaming data. The top left shows a heatmap indicating locations of high social media activity (tweets in this case). On the top rightwe display streaming social media feeds, harvested by our system from the correspondingAPI sites. On the bottom left we show a word cloud representation of the content of thesemessages. It shows the 70 most frequently used words in that data corpus (word size isproportional to usage frequency). Finally, the table in bottom right shows a rank of theorigin locations of these contributions. The data (top right) are streaming in continuouslyand so are the overlaid icons. All other three content is updated every 5 minutes using datafrom rolling 10-minute windows. As this frontend focuses on the dynamic nature of thedata feeds, it does not show Flickr and YouTube.
Figure 4. A screenshot from the front-end of our Geosocial Gauge system. The data displayed inthis figure correspond to a discussion about the unrest in Turkey and were collected on 12 June 2013.
Dow
nloa
ded
by [
Geo
rge
Mas
on U
nive
rsity
] at
09:
56 0
5 N
ovem
ber
2013
International Journal of Geographical Information Science 2495
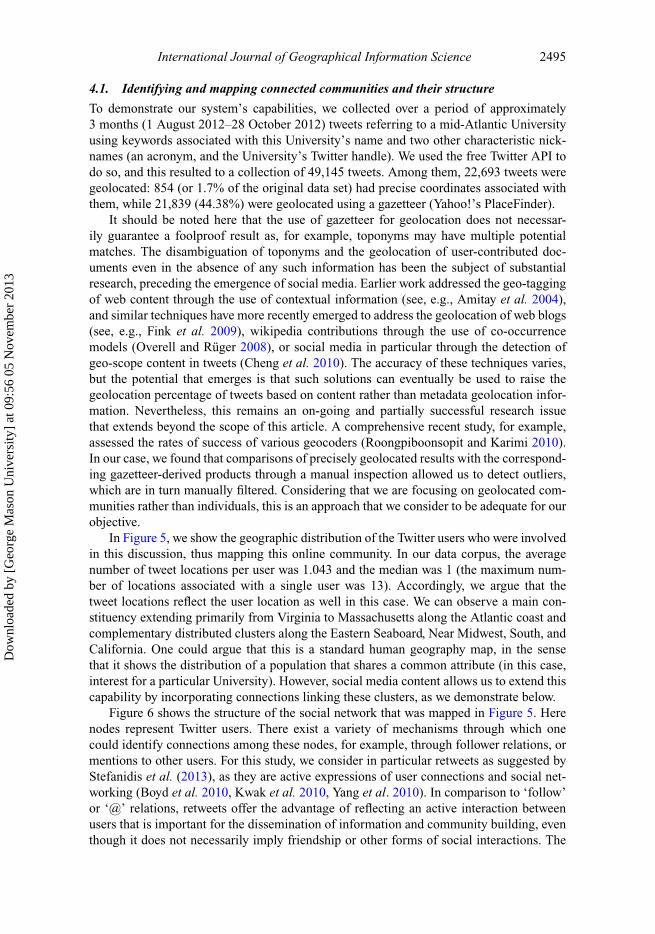
4.1. Identifying and mapping connected communities and their structure
To demonstrate our system’s capabilities, we collected over a period of approximately3 months (1 August 2012–28 October 2012) tweets referring to a mid-Atlantic Universityusing keywords associated with this University’s name and two other characteristic nick-names (an acronym, and the University’s Twitter handle). We used the free Twitter API todo so, and this resulted to a collection of 49,145 tweets. Among them, 22,693 tweets weregeolocated: 854 (or 1.7% of the original data set) had precise coordinates associated withthem, while 21,839 (44.38%) were geolocated using a gazetteer (Yahoo!’s PlaceFinder).
It should be noted here that the use of gazetteer for geolocation does not necessar-ily guarantee a foolproof result as, for example, toponyms may have multiple potentialmatches. The disambiguation of toponyms and the geolocation of user-contributed doc-uments even in the absence of any such information has been the subject of substantialresearch, preceding the emergence of social media. Earlier work addressed the geo-taggingof web content through the use of contextual information (see, e.g., Amitay et al. 2004),and similar techniques have more recently emerged to address the geolocation of web blogs(see, e.g., Fink et al. 2009), wikipedia contributions through the use of co-occurrencemodels (Overell and Rüger 2008), or social media in particular through the detection ofgeo-scope content in tweets (Cheng et al. 2010). The accuracy of these techniques varies,but the potential that emerges is that such solutions can eventually be used to raise thegeolocation percentage of tweets based on content rather than metadata geolocation infor-mation. Nevertheless, this remains an on-going and partially successful research issuethat extends beyond the scope of this article. A comprehensive recent study, for example,assessed the rates of success of various geocoders (Roongpiboonsopit and Karimi 2010).In our case, we found that comparisons of precisely geolocated results with the correspond-ing gazetteer-derived products through a manual inspection allowed us to detect outliers,which are in turn manually filtered. Considering that we are focusing on geolocated com-munities rather than individuals, this is an approach that we consider to be adequate for ourobjective.
In Figure 5, we show the geographic distribution of the Twitter users who were involvedin this discussion, thus mapping this online community. In our data corpus, the averagenumber of tweet locations per user was 1.043 and the median was 1 (the maximum num-ber of locations associated with a single user was 13). Accordingly, we argue that thetweet locations reflect the user location as well in this case. We can observe a main con-stituency extending primarily from Virginia to Massachusetts along the Atlantic coast andcomplementary distributed clusters along the Eastern Seaboard, Near Midwest, South, andCalifornia. One could argue that this is a standard human geography map, in the sensethat it shows the distribution of a population that shares a common attribute (in this case,interest for a particular University). However, social media content allows us to extend thiscapability by incorporating connections linking these clusters, as we demonstrate below.
Figure 6 shows the structure of the social network that was mapped in Figure 5. Herenodes represent Twitter users. There exist a variety of mechanisms through which onecould identify connections among these nodes, for example, through follower relations, ormentions to other users. For this study, we consider in particular retweets as suggested byStefanidis et al. (2013), as they are active expressions of user connections and social net-working (Boyd et al. 2010, Kwak et al. 2010, Yang et al. 2010). In comparison to ‘follow’or ‘@’ relations, retweets offer the advantage of reflecting an active interaction betweenusers that is important for the dissemination of information and community building, eventhough it does not necessarily imply friendship or other forms of social interactions. The
Dow
nloa
ded
by [
Geo
rge
Mas
on U
nive
rsity
] at
09:
56 0
5 N
ovem
ber
2013

2496 A. Croitoru et al.
Figure 5. The point distribution of tweets in our data corpus and correspondingly a map of theinvolved Twitter community.
958 nodes (and corresponding users) displayed in Figure 6 are nodes of degree 3 or higher,that is, they were involved in at least 3 retweets (either retweeting or being retweeted).They represent only 17% of the total number of 5631 nodes collected in our study. Theremainder 83% of nodes in our data corpus were involved in two or less retweeting activi-ties. The connections shown in the graph of Figure 6 are 2281 or 35% of the total numberof 6450 connections in our data corpus. Thus, we see that the top 17% of the nodes accountfor 35% of the total retweet connections. We considered 3 as the cut-off rate for this anal-ysis to be consistent with the commonly accepted view of the minimum size of smallgroups and cliques (3–5 members) in social networks (e.g., Dunbar and Spoors 1995, Hilland Dunbar 2003). The number of retweets visualized (Figure 6; as connections betweennodes) is 2281, out of a total of 6450 retweets. This indicates that 35% of all retweets inour data corpus were generated from the above-mentioned 17% of the nodes.
By design, the network is visualized in Figure 6 with minimally connected nodesarranged at its perimeter. In contrast, highly connected nodes, and their correspondingdenser, more connected clusters, are arranged towards the center of this graph. To bet-ter communicate visually the complexity of these connections, we provide in Figure 7 aclose-up of the central window identified in Figure 6. The size of node discs is propor-tional to their retweeting activity (either retweeting other messages or being retweeted byothers). Nodes represented by bigger discs are, therefore, responsible for more informationtraffic within this network, either as popular contributors or as relays of information. Thethickness of the connections is proportional to the volume of established links among thecorresponding nodes. A pair of nodes connected through a thick line displays more retweetactivity compared to other pairs connected through thin lines. In Figure 7, we observesome key nodes of our network and their connections. The two major nodes in the middleof Figure 7 correspond to the official University Twitter handle (largest node in the middleof figure) and a leading University administrator (slightly smaller node to the right of it).These two nodes share common connections, and they retweet each other’s messages quiteoften (as indicated by the thick lines connecting then). It is also worth pointing out the pair
Dow
nloa
ded
by [
Geo
rge
Mas
on U
nive
rsity
] at
09:
56 0
5 N
ovem
ber
2013

International Journal of Geographical Information Science 2497
Figure 6. The retweet social network structure of the community. The names of the nodes have beenremoved to preserve anonymity.
Figure 7. A close-up of the social network of Figure 6, demonstrating the complex connectionsamong its nodes.
of nodes at the lower right side of the graph in Figure 7, where two nodes share a verystrong connection as marked by the thick line.
To better understand cluster formation within such networks, we show in Figure 8 aconnected subset of the nodes of Figure 6. Three different clusters can be recognized as
Dow
nloa
ded
by [
Geo
rge
Mas
on U
nive
rsity
] at
09:
56 0
5 N
ovem
ber
2013

2498 A. Croitoru et al.
Figure 8. A small cluster of nodes showing the connections among them.
identified by different colors. They each have their own internal structure (they are typicallyformed around few dominant nodes, the ones with larger disc size). These communitiesare connected to form a larger social structure through select bridge nodes. In this figure,these bridge nodes are the two red nodes that connect the red cluster to the green andyellow ones. It is worth mentioning here that these clusters are identified based solely onmanifested connections among their nodes (in the form of retweets), regardless of a specificdiscussion sub-topic. The graph of Figure 8 was built using a depth search approach (Tarjan1972), but one could use a variety of approaches to do so. Duch and Arenas (2005) providea good overview of techniques for connected community detection in social networks.
Once such network structure has been extracted, we can proceed with augmenting thesimple map of Figure 5 by introducing connections among nodes to reveal links betweenspaces, as we show in Figure 9. The connecting lines in this Figure are visualizations inspace of the connections of the social network of Figure 6. Through these links, differentlocations are linked by virtue of the activities undertaken by their occupants.
We see quite vividly how the epicenter of this community is in the Capital area, andthe satellite communities are connected to it. We can also observe that social proximityoften overtakes geographical proximity when such connections are established. In an earlierarticle, Takhteyev et al. (2012) had shown that when it comes to Twitter communities, asubstantial share of ties lies within the same metropolitan region, and that between regionalclusters, distance, national borders and language differences all predict Twitter ties. Ourdata show that thematic affinity deserves at least an equal level of consideration as theseother parameters. For example, we observe that the Los Angeles metro area community
Dow
nloa
ded
by [
Geo
rge
Mas
on U
nive
rsity
] at
09:
56 0
5 N
ovem
ber
2013

International Journal of Geographical Information Science 2499
Figure 9. Mapping the connections among the nodes of Figure 6 to reveal the underlying linksamong the corresponding locations.
is more closely connected to the central community in the DC metro area, rather than tothe San Francisco metro area community (as indicated by the thickness of lines connectingthese communities). Even though both California communities share an interest on thesame topic, the relative significance of the DC community (being local to the Universityof interest) overtakes in this particular case the parameters presented by Takhteyev et al.(2012) to reshape the geography of this particular Twitter network. This results in two largecommunities in California that are minimally connected directly to each other. Instead, theyare connected rather indirectly, through the central community in the Capital area.
We should mention here that the green nodes of Figure 9 are a subset of the ones inFigure 6, as they only show pairs where both originator and retweeter were geolocated.This accounts for 2552 retweets (among the total of 6450 retweets). In contrast, the socialnetwork structure of Figure 6 included both geolocated and non-geolocated nodes. Thickerlines in Figure 9 indicate multiple connections among a pair of locations (and correspond-ing nodes associated with these locations). This visualization provides a novel view ofspace, as linked locations, and represents an advancement compared to our traditional,strict Cartesian perception of it. It reflects the transformation of a simple map of individualusers (as shown in Figure 5) to a map of a connected community and its links and ush-ers a new, geosocial view of space. One can argue that this is in essence the snapshot ofa geosocial ecosystem, comprising geolocated nodes (reflecting individual members) andconnections expressing how these nodes communicate with each other.
4.2. Events and cross-platform knowledge discovery
The geosocial system detected and mapped in Section 4.1 comprises a core component inthe form of a basic community that forms it, its interests as they are expressed throughthe associated discussion keywords, and the links that are established through communica-tions within that community. This core component of our geosocial system is occasionallydisturbed by events. Here we will attempt to highlight how such events impact our systemthrough a representative example.
Dow
nloa
ded
by [
Geo
rge
Mas
on U
nive
rsity
] at
09:
56 0
5 N
ovem
ber
2013

2500 A. Croitoru et al.
Figure 10. Twitter traffic associated with our study (green line) and the portion of these tweetsthat include a reference to President Obama (blue line). The x-axis represents time (from 5 August2012 to 10 October 2012), and the y-axis represents the tweet count. The two top traffic dates in ourdata corpus are marked by red circles.
In Figure 10, we show Twitter traffic associated with our system (green line). We caneasily recognize two peaks, marked by circles, at 5 October 2012 and 19 October 2012.The keyword analysis of the data reveals that a new keyword has emerged on these dates(namely ‘Obama’), and the blue line in the same graph shows the portion of traffic thatis associated with this new keyword. We can see that while the President’s name wasminimally involved with information traffic in our geosocial system before these dates, itaccounts for approximately a third of the corresponding traffic on 5 October and 19 October(growing to that level over a period of two days before each peak).
These results produced a new set of keywords, namely the university name and theword ‘Obama’ that were used for a subsequent social media query as part of the knowledgediscovery process within GeoSocial Gauge. In this case, the Flickr API was called usingthese new keywords and a temporal range corresponding to the period of interest based onthe analysis of Twitter results. In this particular case, limiting the search to the peak dateswe find in Flickr clusters of images contributed on these dates. For example, in the seconddate, the GeoSocial Gauge harvested 49 geolocated images from Flickr. After plotting theirlocations (in Google Earth), we see that they are spatially clustered at a football field of theUniversity under observation as shown in Figure 11. Querying the YouTube API with thesame parameters at the same time did not produce any geolocated videos. A recent studyhas indicated that approximately 4.5% of Flickr and 3% of YouTube content is geolocated(Friedland and Sommer 2010).
An online news search shows that on both days President Obama addressed electionrallies at this University Campus. On the second day, he gave a speech to an audience offew thousands at this particular practice field as shown in Figure 12. Thus, we observethat Twitter traffic variations are good indicators for event detection (e.g., by identifyingspikes and corresponding emerging keywords), while relevant Flickr clusters can supportthe discovery of the location of these events.
To examine the effect of this exogenous event onto the geosocial system that we inves-tigated, we plotted in Figure 13 our social network but marked in blue the nodes thatonly contributed tweets related to this particular event (i.e., all University-related tweets
Dow
nloa
ded
by [
Geo
rge
Mas
on U
nive
rsity
] at
09:
56 0
5 N
ovem
ber
2013

International Journal of Geographical Information Science 2501
Figure 11. Clusters of geolocated images contributed on 19 October 2012. We can identify imagescontributed from eight different locations, including a large cluster of 30 images contributed from asingle user at a single location.
Figure 12. The election rally event that was documented in Flickr and gave rise to the traffic peakof 19 October 2012. It is interesting to observe the numerous handheld devices used to document theevent.
Dow
nloa
ded
by [
Geo
rge
Mas
on U
nive
rsity
] at
09:
56 0
5 N
ovem
ber
2013

2502 A. Croitoru et al.
Figure 13. Another layout of the network of Figure 6. Here we identify by blue the nodes (andretweets) that have only contributed tweets related to the exogenous event of October 19, 2012.
contributed by them included the President’s name). We observe that these blue nodes rep-resent a very small portion of our network, and they are minimally connected within it,with the exception of a small cluster of 4 blue nodes within the marked box of Figure 13.Only 18 blue nodes are present in Figure 13, that is, they have at least 3 connections. Thetotal number of blue nodes in our data corpus was 315, leaving 297 blue nodes with 2or less connections. Overall, the blue nodes are sparsely connected, with only 148 con-nections among them, as shown in Figure 14. This simple example highlights a processthrough which it is possible to monitor, study, and assess the impact of exogenous eventson a geosocial ecosystem. In our particular test case, the event affected traffic patterns byintroducing spikes as shown in Figure 10, but had little effect on the actual overall structureof our social network.
5. Conclusion and outlook
More than 2300 years ago, Aristotle argued that ‘Man is by nature a social animal; anindividual who is unsocial naturally and not accidentally is either beneath our notice ormore than human’ (Vinciarelli et al. 2012), positioning social interactions as one of ourmost basic needs as individuals and as a society. Today we continue to engage in socialinteractions, and our beliefs, behavior, feelings, and actions are still deeply influenced bythe people we interact with, whether they are our family, our friends, our peers, or societyat large. However, the medium through which we can engage others has changed dramat-ically: in addition to physical interaction, social media in its many forms has opened anentirely new avenue to enable an alternative form of interaction. A recent survey on the useof social media among adult US users (Smith 2011) indicated that staying in touch with
Dow
nloa
ded
by [
Geo
rge
Mas
on U
nive
rsity
] at
09:
56 0
5 N
ovem
ber
2013

International Journal of Geographical Information Science 2503
Figure 14. The sparse connections among the 315 blue nodes. A comparison to Figure 6 shows thesparsity of this sub-network.
current friends (67%), family members (64%), and long lost old friends (50%) were thethree most significant reasons for using social media. The uniqueness of social media liesnot only in its ability to foster further social interaction, but also in its potential to trans-form the way we study it: for the first time, we are able to closely observe Aristotle’s socialanimal and measure and quantify interactions and behaviors. Furthermore, the widespreaduse of social media and its ubiquity in virtually every aspect of modern society are makingpossible, for the first time, to gain valuable insights into the links and interactions betweenpeople in a variety of settings and contexts and the physical space surrounding them. Thus,information harvesting from social media emerges as a new instrument for observing thehuman landscape, the geosocial ecosystems that are formed, and their evolution over time,at a larger scale and at a finer resolution than ever before.
In this article, we presented how such an instrument – Geosocial Gauge – can bebuilt and utilized to derive geospatial knowledge from social media feeds. In particular,we addressed the challenge of harvesting social media feeds and how such data can beprocessed and analyzed to reveal information about communities formed through them,their social networks, and the geographical space in which they operate. In addition, wepresented a conceptual model for storing and managing heterogeneous geosocial data in aunified database and provided a detailed description of its various source-dependent andsource-independent components. This approach allows bridging the gap between indepen-dent spatial (e.g., simple map mash-ups) and social network (e.g., Brabasi 2002) analysesand supports the discovery of additional knowledge. To showcase how Geosocial Gaugecan be used to glean geosocial knowledge, we presented two sample test cases – identify-ing and mapping connected communities around an academic institution and discoveringand locating events affecting such a community, using diverse social media sources. This
Dow
nloa
ded
by [
Geo
rge
Mas
on U
nive
rsity
] at
09:
56 0
5 N
ovem
ber
2013

2504 A. Croitoru et al.
allowed us to gain knowledge about the way in which these community members aredistributed in space. This is followed by a study of their social network structure, whichis then projected onto space to discover knowledge on the ties among distributed clustersof this community. By gleaning such knowledge, we are then able to see how this commu-nity is affected by relevant events. In doing so, we gain an understanding of how humansact as geosensors to report on a broad array of sociocultural events affecting them. Thisunderstanding of the connections between space, social networks, and events will help ourcommunity extract knowledge from the unstructured data of social media feeds.
The unprecedented ability to harvest, process, and derive knowledge from geosocialmedia is challenging the limits of our capacity to understand the geosocial realm. Whilein the past, human interaction occurred only in the physical space, today much of it alsooccurs in virtual space. The interplay between these two spaces is still not well under-stood, calling for new theories for grounding these phenomena and their relation to space,human behavior, and social interaction to link the virtual and the physical domains. In addi-tion, the sheer volume of geosocial media puts forward some significant challenges in thedevelopment of automated tools for processing and deriving knowledge from such feeds.
As we proceed exploring these opportunities, it is important that we remain cognizantof the associated privacy issues to ensure its proper use. The challenge exceeds beyondthe simple anonymization of such data. Studies have shown that by exploiting links insocial networks, public profiles can be exploited to discover hidden private attributes insocial media platforms (Zheleva and Getoor 2009). The privacy concerns are further com-plicated by the presence of geotagged information at-large (e.g., Friedland and Sommer2010). For example, recent studies have shown that the analysis of human mobility datain the form of cellphone usage allows for the unique identification of individuals by usingas few as four spatiotemporal points in these trajectories, even when coarse geolocationinformation is made available (de Montjoy et al. 2013). Accordingly, proposed solutionsfor privacy-aware collection of aggregate spatial data (e.g., Xie et al. 2011) are of question-able effectiveness when it comes to social media content. The broad range of informationthat is communicated through social media, an aggregate of location, social connections,and personal views, is accentuating the need to re-conceptualize the concept of privacy, assuggested by Elwood and Leszczynski (2011) with respect to the geoweb.
While data harvested from social media holds great potential for unveiling valuablegeosocial knowledge, it is important to recognize that the population of social mediausers may be demographically skewed. For example, a recent survey in the United Statesshowed that Twitter is especially appealing to adults between the ages of 18 to 29, African-Americans, and urban residents, while Instagram may be particularly appealing also toHispanic and women population in this age group (Duggan and Brenner 2012). A similarstudy indicated that over 65% of its user constituency being younger than 44 years and thatusage is notably higher in urban areas (Smith and Brenner 2012). Similarly, Mislove et al.(2011) found that in the United States, densely population regions are overrepresented inTwitter and that its users are predominantly male. The effect of such demographic biasescan be significant, as was recently shown in the context of electoral predictions using socialmedia (e.g., Gayo-Avello et al. 2011). However, in other cases it was found that the sheervolume of social media data could lead to results of similar predictive power as traditionalelection polls (e.g., Tumasjan et al. 2011). As our community is proceeding with the furtherstudy of the content of social media contributions to derive valuable geospatial knowledge,we anticipate a more in-depth analysis of the various normalization aspects of such data.
With millions of tweets and thousands of Flickr images posted hourly, social media con-tent is rapidly emerging as a new big data challenge for the computational and geospatial
Dow
nloa
ded
by [
Geo
rge
Mas
on U
nive
rsity
] at
09:
56 0
5 N
ovem
ber
2013
International Journal of Geographical Information Science 2505
communities. While this work marks a step in this direction, further work is required withrespect to managing and analyzing social media feeds. This is further emphasized by theever-evolving nature and complexity of social media feeds. For example, comments withinYouTube or Flickr may also be mined to further explore social interactions among users(e.g., Siersdorfer et al. 2010), while Instagram emerged in the past year a new comple-mentary source of imagery (Hochman and Schwartz 2012). It is also important to note thatas the human landscape can be highly dynamic, especially in the case of disruptive events(e.g., an earthquake or a geopolitical conflict), the dynamic nature of geosocial informationand the knowledge that is derived from it should also be addressed. This can include, forexample, studying and developing new tools for measuring and monitoring the resilienceof ties in the social and geographic domains and how links in these two domains relateto one another over time and space. Combined, these emerging opportunities promise tosubstantially advance the study of the human landscape at spatial and temporal scales andresolutions unfathomed so far.
Notes1. http://www.ushahidi.com2. http://140kit.com/3. http://hootsuite.com/4. http://dbpedia.org/5. http://www.freebase.com/6. http://www.geonames.org/7. http://about.topsy.com/technology/overview/8. http://www.metacarta.com/products-platform-geotag.htm9. http://bit.ly/S01Vlr
10. This information is current and is subject to change by Twitter itself.
ReferencesAmes, M. and Naaman, M., 2007. Why we tag: motivations for annotation in mobile and online
media. In: Proceedings of ACM SIGCHI conference on human factors in computing systems,San Jose, CA, 971–980.
Amitay, E., et al., 2004. Web-a-where: geotagging web content. In: Proceedings of the 27th annualinternational ACM SIGIR conference on research and development in information retrieval,Sheffield, UK, 273–280.
Backstrom, L., Sun, E., and Marlow, C., 2010. Find me if you can: improving geographical predictionwith social and spatial proximity. In: Proceedings of the 19th international conference on worldwide web, Raleigh, NC, 61–70.
Barabasi, A., 2002. Linked: the new science of networks. New York, NY: Perseus Publishing.Blasingame, D., 2011. Twitter first: changing TV news 140 characters at a time. In: Proceedings of
the 12th international symposium on online journalism, Austin, TX.Bonchi, F., et al., 2011. Social network analysis and mining for business applications. ACM
Transactions on Intelligent Systems and Technology, 2 (3), doi:10.1145/1961189.1961194Boyd, D., Golder, S., and Lotan, G., 2010. Tweet, tweet, retweet: conversational aspects of retweet-
ing on Twitter. In: Proceedings of the 43rd IEEE Hawaii international conference on systemsciences, Kauai, HI.
Bruns, A. and Burgess, J.E., 2011. #Ausvotes: how Twitter covered the 2010 Australian federalelection. Communication, Politics and Culture, 44 (2), 37–56.
Cheng, Z., Caverlee, J., and Lee, K. 2010. You are where you tweet: a content-based approach togeolocating Twitter users. In: Proceedings of the ACM conference on information and knowledgemanagement, Toronto, Canada, 759–768.
Croitoru, A., et al., 2012. Towards a collaborative geosocial analysis workbench. Washington, DC:COM-Geo.
Dow
nloa
ded
by [
Geo
rge
Mas
on U
nive
rsity
] at
09:
56 0
5 N
ovem
ber
2013

2506 A. Croitoru et al.
Crooks, A.T., et al., 2013. #Earthquake: Twitter as a distributed sensor system. Transactions in GIS,17 (1), 124–147.
deMontjoye, Y. A., et al., 2013. Unique in the crowd: the privacy bounds of human mobility. ScientificReports, 3 (Article No. 1376).
Duch, J. and Arenas, A., 2005. Community detection in complex networks using extremal optimiza-tion. Physical Review E, 72 (2), 027104.
Duggan, M. and Brenner, J., 2012. The demographics of social media users – 2012. Pew ResearchCenter, Washington, DC. Available from: http://bit.ly/XORHo0 [Accessed 19 January 2013].
Dunbar, R.I.M. and Spoors, M., 1995. Social networks, support cliques, and kinship. Human Nature,6 (3), 273–290.
Earle, P., et al., 2010. OMG earthquake! Can Twitter improve earthquake response? SeismologicalResearch Letters, 81 (2), 246–251.
Earle, P., Bowden, D.C., and Guy, M., 2011. Twitter earthquake detection: earthquake monitoring ina social world. Annals of Geophysics, 54 (6), doi:10.4401/ag-5364
Elwood, S. and Leszczynski, A., 2011. Privacy, reconsidered: new representations, data practices,and the geoweb. Geoforum, 42 (1), 6–15.
Fielding, R.T., 2000. Architectural styles and the design of network-based software architectures.Thesis (PhD). University of California, Irvine, CA.
Fink, C., et al., 2009. The geolocation of web logs from textual clues. In: Proceedings internationalconference on computational science and engineering, Vancouver, Canada, 1088–1092.
Forbes, 2012. Twitter’s Dick Costolo: Twitter mobile ad revenue beats desktop on some days.Available from: http://onforb.es/KgTWYP [Accessed 19 January 2013].
Friedland, G. and Sommer, R., 2010. Cybercasing the joint: on the privacy implications ofgeotagging. In: Proceedings of the fifth USENIX workshop on hot topics in security (HotSec10), Washington, DC.
Fritz, S., et al., 2009. Geo-Wiki.Org: the use of crowdsourcing to improve global land cover. RemoteSensing, 1 (3), 345–354.
Gayo-Avello, D., Metaxas, T., and Mustafaraj, E., 2011. Limits of electoral predictions using Twitter.In: Proceedings of the 5th international AAAI conference on weblogs and social media (ICWSM)Barcelona, Spain, AAA Press, 490–493.
Goodchild, M.F., 2007. Citizens as sensors: the world of volunteered geography. GeoJournal, 69 (4),211–221.
Goodchild, M.F. and Glennon, J.A., 2010. Crowdsourcing geographic information for disasterresponse: a research frontier. International Journal of Digital Earth, 3 (3), 231–241.
Hecht, B., et al., 2011. Tweets from Justin Bieber’s heart: the dynamics of the ‘location’ field in userprofiles. In: Proceedings of the ACM CHI conference on human factors in computing systems,Vancouver, Canada, 237–246.
Hill, R.A. and Dunbar, R.I.M., 2003. Social network size in humans. Human Nature, 14 (1), 53–72.Hochman, N. and Schwartz, R., 2012. Visualizing instagram: tracing cultural visual rhythms. In:
Proceedings of the sixth international AAAI conference on weblogs and social media, Dublin,Ireland, 6–9.
Hollis, C., 2011. 2011 IDC digital universe study: big data is here, now what? Available from: http://bit.ly/kouTgc [Accessed 19 January, 2013].
Huang, J., Thornton, K., and Efthimiadis, E., 2010. Conversational tagging in Twitter. In:Proceedings of the 21st ACM conference on hypertext and hypermedia, Toronto, Canada,173–178.
Iofciu, T., et al., 2011. Identifying users across social tagging systems. In: Proceedings of the 5thinternational AAAI conference on weblogs and social media, Barcelona, Spain, 522–525.
Java, A., et al., 2009. Why we Twitter: an analysis of a microblogging community. In: R. Goebel,J. Siekmann, and W. Wahlster, eds. Advances in web mining and web usage analysis, LectureNotes in Computer Science. Vol. 5439. Berlin, Germany: Springer, 118–138.
Kaigo, M., 2012. Social media usage during disasters and social capital: Twitter and the great EastJapan earthquake. Keio Communication Review, 34, 19–35.
Kalnikaite, V., et al., 2010. Now let me see where I was: understanding how lifelogs mediate memory.In: Proceedings of the 28th international conference on human factors in computing systems,Atlanta, GA, 2045–2054.
Kelley, M.J., 2011. The emergent urban imaginaries of geosocial media. GeoJournal, 78 (1), 181–203.
Dow
nloa
ded
by [
Geo
rge
Mas
on U
nive
rsity
] at
09:
56 0
5 N
ovem
ber
2013

International Journal of Geographical Information Science 2507
Kraut, R.E., et al., 2013. Public response to alerts and warnings using social media: report of aworkshop on current knowledge and research gaps. Washington, DC: National Academies Press.
Kwak, H., et al., 2010. What is Twitter, a social network or a news media? In: Proceedings of the19th international conference on world wide web, Raleigh, NC, 591–600.
Larson, M., Soleymani, M., and Serdykov, P., 2011. Automatic tagging and geotagging in videocollections and communities. In: Proceedings of the 1st ACM international conference onmultimedia retrieval, Trento, Italy.
Leetaru, K., et al., 2013. Mapping the global twitter heartbeat: the geography of Twitter. FirstMonday, 18 (5), doi:10.5210/fm.v18i5.4366
Lieberman, M.D., Samet, H., and Sankaranarayanan, J., 2010. Geotagging with local lexicons tobuild indexes for textually-specified spatial data. In: Proceedings of the IEEE 26th internationalconference on data engineering, Long Beach, CA, 201–212.
Lyons, K. and Lessard, L., 2012. S-FIT: a technique for integrating social features in existinginformation systems. In: Proceedings of the 2012 iConference, New York, NY, 263–270.
MacEachren, A.M., et al., 2011a. Senseplace2: Geotwitter analytics support for situational aware-ness. In: S. Miksch and M. Ward, eds. IEEE conference in visual analytics science andtechnology (VAST), Providence, RI, 181–190.
MacEachren, A.M., et al., 2011b. Geo-Twitter analytics: applications in crisis management. In:Proceedings of the 25th international cartographic conference, Paris, France, 3–8 July 2011.
Marcus, A., et al., 2011. Processing and visualizing the data in Tweets. SIGMOD Record, 40 (4),21–27.
Mearian, L., 2011. World’s data will grow by 50x in next decade, IDC study predicts, ComputerWorld Magazine. Available from: http://bit.ly/k1Jo0V .
Mislove, A., et al., 2011. Understanding the demographics of Twitter users. In: Proceedings of the5th international AAAI conference on weblogs and social media (ICWSM), Barcelona, Spain:AAA Press, 554–557.
New York Times, 2011. Spotlight again falls on web tools and change, New York Times, Availablefrom: http://nyti.ms/hWnxSp2 [Accessed 23 July 2012].
Overell, S. and Rüger, S., 2008. Using co-occurrence models for placename disambiguation.International Journal of Geographical Information Science, 22 (3), 265–287.
Pollock, J., 2011. Streetbook: how Egyptian and Tunisian youth hacked the Arab spring. TechnologyReview. Available from: http://bit.ly/nrO9PU .
Rahm, E. and Do, H.H., 2000. Data cleaning: problems and current approaches. IEEE DataEngineering Bulletin, 24 (4), 3–13.
Reinhardt, W., et al., 2010. Modeling, obtaining and storing data from social media tools withartefact-actor-networks. In: Proceedings of ABIS 2010: the 18th international workshop onpersonalization and recommendation on the web and beyond, Kassel, Germany.
Romero, D., Meeder, B., and Kleinberg, J., 2011. Differences in the mechanics of informationdiffusion across topics: idioms, political hashtags, and complex contagion on Twitter. In:Proceedings of the 20th international conference on world wide web, Hyderabad, India, 695–704.doi:10.1145/1963405.1963503
Roongpiboonsopit, D. and Karimi, H.A., 2010. Comparative evaluation and analysis of onlinegeocoding services. International Journal of Geographical Information Science, 24 (7),1081–1100.
Sahito, F., Latif, A., and Slany, W., 2011. Weaving Twitter stream into linked data: a proof of con-cept framework. In: Proceedings of the 7th international conference on emerging technologies,Islamabad, Pakistan, 1–6. doi:10.1109/ICET.2011.6048497.
Sapiro, G., 2011. Images everywhere: looking for models: technical perspective. Communications ofthe ACM , 54 (5), 108–108.
Shimojo, A., Kamada, S., Matsumoto, S., and Nakamura. M., 2010. On integrating heteroge-neous lifelog services. In: Proceedings of the 12th International Conference on InformationIntegration and Web-based Applications (iiWAS ’10). ACM, New York, NY, USA, 263–272.doi:10.1145/1967486.1967529
Siersdorfer, S., Chelaru, S., Nejdl, W., and San Pedro, J., 2010. How useful are your comments?:analyzing and predicting youtube comments and comment ratings. In: Proceedings of the 19thinternational Conference on World Wide Web, Raleigh, NC, 891–900.
Dow
nloa
ded
by [
Geo
rge
Mas
on U
nive
rsity
] at
09:
56 0
5 N
ovem
ber
2013

2508 A. Croitoru et al.
Smith, A., 2011. Why Americans use social media: social networking sites are appealing as away to maintain contact with close ties and reconnect with old friends. Pew Research Center,Washington DC. Available from: http://bit.ly/rLCsA6 [Accessed 20 January 2013].
Smith, A. and Brenner, J., 2012. Twitter use 2012. Pew Research Center, Washington DC. Availablefrom: http://bit.ly/JTpHsO [Accessed 20 January 2013].
Stefanidis, T., Crooks, A.T., and Radzikowski, J., 2013. Harvesting ambient geospatial informationfrom social media feeds. GeoJournal, 78 (2), 319–338.
Sui, D. and Goodchild, M.F., 2011. The convergence of GIS and social media: challenges forGIScience. International Journal of Geographical Information Science, 25 (11), 1737–1748.
Sun, A., et al., 2011. Tag-based social image retrieval: an empirical evaluation. Journal of theAmerican Society for Information Science and Technology, 62 (12), 2364–2381.
Takhteyev, Y., Gruzd, A., and Wellman, B., 2012. Geography of Twitter networks. Social Networks,34 (1), 73–81.
Tan, S., et al., 2011. Using rich social media information for music recommendation via hypergraphmodel. ACM Transactions on Multimedia Computing, Communications, and Applications, 7S(1), doi:10.1145/2037676.2037679
Tarjan, R., 1972. Depth-first search and linear graph algorithms. SIAM Journal on Computing, 1 (2),146–160.
Tomaszewski, B., et al., 2011. Supporting geographically-aware web document foraging andsensemaking. Computers, Environment and Urban Systems, 35 (3), 192–207.
Tumasjan, A., et al., 2011. Election forecasts with Twitter: how 140 characters reflect the politicallandscape. Social Science Computer Review, 29 (4), 402–418.
Twitter, 2011. 2000 million Tweets per day. Available from: http://bit.ly/laY1Jx .Valkanas, G. and Gunopulos, D., 2013. A UI prototype for emotion-based event detection in the
live web. In: Proceedings of the 2013 IEEE international conference on human factors in com-puting and informatics, special session on human-computer interaction & knowledge discovery,Maribor, Slovenia.
Vinciarelli, A., et al., 2012. Bridging the gap between social animal and unsocial machine: a surveyof social signal processing. IEEE Transactions on Affective Computing, 3 (1), 69–87.
Xie, H., Kulik, L., and Tanin, E., 2011. Privacy-aware collection of aggregate spatial data. Data &Knowledge Engineering, 70 (6), 576–595.
Yang, Z., et al., 2010. Understanding retweeting behaviors in social networks. In: Proceedings ofthe 19th ACM international conference on information and knowledge management, Toronto,Canada, 1633–1636.
YouTube, 2013. YouTube pressroom statistics. Available from: http://bit.ly/gzYBVx [Accessed20 January 2013].
Zhao, S., et al., 2011. Human as real-time sensors of social and physical events: a case study oftwitter and sports games. Technical Report TR0620-2011, Houston, TX: Rice University andMotorola Labs, arXiv:1106.4300v1.
Zheleva, E. and Getoor, L., 2009. To join or not to join: the illusion of privacy in social networkswith mixed public and private user profiles. In: Proceedings of the 18th international conferenceon world wide web, Madrid, Spain, 531–540.
Dow
nloa
ded
by [
Geo
rge
Mas
on U
nive
rsity
] at
09:
56 0
5 N
ovem
ber
2013