georgia workforce rendsgeorgia workforce trends – an analysis of long-term employment projections...
TRANSCRIPT

GEORGIA
Workforce TrendsAn Analysis of Long-term
Employment Projections to 2026
DEPARTMENT OF LABOR
Mark Butler, Commissioner

Equal Opportunity Employer/Program • Auxiliary Aids and Services Available upon Request to Individuals with Disabilities
Workforce Statistics & Economic ResearchMark Butler, Commissioner
Georgia Workforce Trends
An Analysis of Long-term Employment Projections to 2026
2 Georgia Workforce 2026
Georgia Workforce Trends – An Analysis of Long-term Employment Projec-tions to 2026 was produced by the Georgia Department of Labor’s Work-force Statistics and Economic Research (WS&ER) Division, under the
general direction of Mark Watson, Director. The publication’s charts, graphs, and analyses were prepared by Corey Smith, Statistical Business Operations Chief. Kenneth King, Program Chief, and Hans Friedrichsen worked to produce the underlying employment projections, the component upon which the analyses in this publication are based. Research and findings were also produced by numerous WS&ER staff with graphics and layout being provided by Helen Kim.
This workforce publication is one of several produced by WS&ER presenting labor market information. This product was funded by a grant from the U.S. Department of Labor’s Employment and Training Administration. Other pub-lications include: Georgia’s HOT Careers to 2026, Georgia’s STEM Careers to 2026, Georgia Jobs: 2017-2019 Short-term Employment Projections, Georgia Area Workforce Trends: Projections to 2024, Georgia Wage Survey, and Licensed and Certified Occupations in Georgia. This product was created by the Georgia Department of Labor and does not necessarily reflect the official position of the U.S. Department of Labor.
A d d i t i o n A l d A t A
For a complete set of industry or occupational employment projections for the state or any of its local workforce development areas, please contact the Workforce Statistics & Economic Research Division of the Georgia Depart-ment of Labor at (404) 232-3875 or at [email protected].
Source: Georgia Department of Labor, Workforce Statistics & Economic Research

Georgia Department of Labor 3
Table of Contents
Continued
Introduction ......................................................................................................................... 5
A Note about the Economy in 2016 ................................................................................. 6
Industry Employment Highlights ................................................................................... 7
Occupational Employment Highlights ......................................................................... 8
Industry Employment 11
Industry Sectors Defined ..................................................................................................12
Industry Employment By Supersector ..........................................................................13
Change in Employment by Industry Sector .................................................................14
Percent Change in Employment by Industry Sector .................................................15
Industry Subsectors with the Most Job Growth ........................................................16
High-Technology Industries with the Most Job Growth .........................................17
Fastest Growing Detailed Industries ............................................................................18
Most Job Growth by Detailed Industry ........................................................................19
Most Job Losses by Detailed Industry .........................................................................20
Occupational Employment 21
Job Function Categories ..................................................................................................22
Occupational Employment by Educational Catagory ..............................................23
Employment Growth by Educational Catagory ........................................................24
Employment Growth by Occupational Group...........................................................25
Annual Openings by Educational Catagory ...............................................................26
Annual Openings by Occupational Group ................................................................. 27
Fastest Growing Occupations .......................................................................................28
Occupations with the Most Job Growth .....................................................................29
Occupations with the Most Annual Openings..........................................................30
Occupations with the Most Job Losses ........................................................................31
Most Job Growth in Occupations that Require
a Bachelor’s Degree or More ..................................................................................... 32
Source: Georgia Department of Labor, Workforce Statistics & Economic Research

4 Georgia Workforce 2026
Most Job Growth in Occupations that Require an Associate’s
Degree or Postsecondary Award, or Some College ............................................. 33
Most Job Growth in Occupations that Require
a High School Diploma or Less ................................................................................34
Most Job Growth in Healthcare Technical & Support Occupations .................. 35
Most Job Growth in Selected Science, Technology, Engineering,
& Mathematics (STEM) Occupations ..................................................................36
Occupational Employment (Continued)
Source: Georgia Department of Labor, Workforce Statistics & Economic Research

Georgia Department of Labor 5
Deciding on a career is like anything else—a person is more likely to succeed if he or she has a solid plan. Prudent planning involves reviewing education and/or training, and it is imperative that good information about the job market is avail-able. Concerns about things like the number of jobs that will exist in the future, their rate of pay, and the kind of education and training that will be required can be difficult to sort out. Fortunately for Georgians, this publication addresses some of these issues.
Georgia Workforce Trends – An Analysis of Long-term Employment Projections to 2026 provides a graphic summary of the latest trends in employment growth (or decline) covering the decade from 2016 to 2026. These projections are a key to good decision-making for career counselors, education program planners, and policymakers. In a changing economy, the projections provide a glimpse into the future—to help decision-makers prepare for it.
The graphs depict trends in two key areas: industries and occupations. The projec-tions were developed using models that incorporated the latest available assump-tions about changes in technology, employers’ staffing patterns, and business practices. As such, they replace all statewide long-term employment projections previously released by the Georgia Department of Labor.
To help understand these projections, it is important to understand the differ-ence between an industry and an occupation. An occupation refers to a method of classifying jobs according to the type of work performed. People who supervise children are in the occupation of childcare worker, for example. An industry, on the other hand, refers to a way of classifying jobs and businesses according to the type of goods produced or services provided. For example, any job in a childcare center—from childcare worker to cook—is classified as part of the child daycare services industry.
All of the graphs in this report provide answers to some basic questions about employment in Georgia like: How many new jobs will there be? How fast are the number of jobs changing? and Which occupations are growing/declining the most? Graphs that show numeric employment change illustrate how many new jobs there will be (the actual number of jobs gained or lost over the projections decade). In general, occupations and industries with the greatest numeric increases are those that already have large numbers of workers. Graphs showing percent change in employment illustrate how fast the number of jobs are changing (the rate of job growth or decline during the decade). It is important to remember that fast growth does not always mean many new jobs. Graphs that show annual job openings include openings from job growth as well as openings from labor force exits and openings from occupational transfers all together.
Introduction
Source: Georgia Department of Labor, Workforce Statistics & Economic Research
6 Georgia Workforce 2026
For this set of employment projections, the base year, 2016, was in the midst of a Georgia and national economy that was continuing to show encouraging signs of confidence as businesses were growing, jobs were being created, and there was optimism in the air. In Georgia, we were in the sixth consecutive year of annual average job growth and had begun to feel a since of confidence in the encouraging economic climate. The unemployment rate was down to 5.6 percent in 2016, its sixth straight year of improvement, after topping out at 10.5 percent a few years earlier. Employment in Georgia’s manufacturing and construction sectors had now shown growth for several straight years each while education and health services, professional and business services, leisure and hospitality, and wholesale and retail trade, were displaying ongoing job growth in the state in 2016.
When developing long-term projections, however, our focus is on long-term employment trends in Georgia. Like other states in the nation, a long-term trend expected to continue is an aging population and labor force that must be ad-dressed. Projection notes in employment between 2016 and 2026 include persistent growth in health care and social assistance related jobs in part due to caring for older Georgians, as well as construction employment continuing to grow, an un-relenting boom in the film industry that looks to have long-term sustainability, and more occupations in the state generally requiring education beyond high school.
A Note about the Economy in 2016
Source: Georgia Department of Labor, Workforce Statistics & Economic Research

Georgia Department of Labor 7
Industry Employment Highlights
• Total employment in Georgia is projected to grow to over 5.0 million in 2026, an increase of 11.7 percent from the 2016 employment level. The growth amounts to nearly 525,000 new jobs for the state.
• Industry employment growth will be concentrated in the service-providing sectors of the economy. About 88 percent of the job growth in Georgia will be in the service providing sectors and about 12 percent will be in the goods-producing sectors. This amounts to over 462,000 new jobs in the service-providing sectors and about 62,000 more jobs in goods-producing sectors.
• Health care and social assistance will lead all industry sectors both in terms of job growth (+99,000 jobs) and growth rate (20.4 percent), as it accounts for nearly one-fifth of the 525,000 new jobs created in the state through 2026.
• Growing by 14.8 percent over the projection period, transportation and utili-ties will grow at the second fastest rate of all industry sectors through 2026.
• Professional and business services will add over 84,000 jobs, the second most in the state, by 2026. Employment in the industry sector will grow from about 598,000 in 2016 to over 682,000 by 2026.
• Georgia will see manufacturing employment grow by 8.0 percent from 2016 to 2026. Manufacturing jobs peaked in 1997 with about 554,000 jobs in the state. In 2016 there were about 385,000 manufacturing jobs and there will be around 416,000 by 2026.
• Construction jobs in Georgia will grow by 13.8 percent over the projection period as residential and commercial building continue, as well as, repairs and infrastructure improvements to roads and bridges persists.
• Educational services is projected to grow by 51,000, or 13.6 percent, from 2016 to 2026. There were about 375,000 jobs in 2016 which will jump to about 426,000 by 2026.
• The leisure and hospitality sector will add nearly 39,000 jobs through 2026. The accommodation and food services sub-sector will grow by about 30,000 workers as employment approaches 442,000. The arts, entertain-ment, and recreation sub-sector will grow by nearly 9,000 over the projec-tion period as employment tops 56,000.
• Over the ten-year projection period to 2026, government positions in Georgia (not including education) will grow by about 18,800, or 6.4 per-cent, to just over 313,000.
In 2
026
Source: Georgia Department of Labor, Workforce Statistics & Economic Research
8 Georgia Workforce 2026
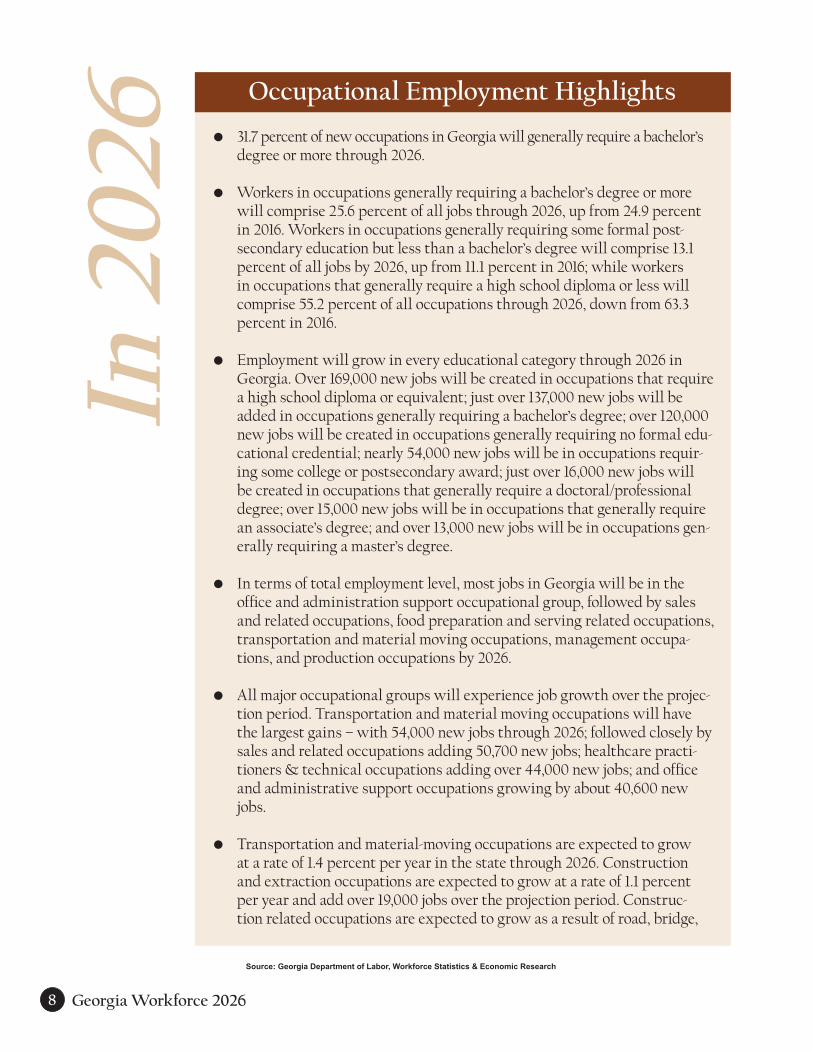
• 31.7 percent of new occupations in Georgia will generally require a bachelor’s degree or more through 2026.
• Workers in occupations generally requiring a bachelor’s degree or more will comprise 25.6 percent of all jobs through 2026, up from 24.9 percent in 2016. Workers in occupations generally requiring some formal post-secondary education but less than a bachelor’s degree will comprise 13.1 percent of all jobs by 2026, up from 11.1 percent in 2016; while workers in occupations that generally require a high school diploma or less will comprise 55.2 percent of all occupations through 2026, down from 63.3 percent in 2016.
• Employment will grow in every educational category through 2026 in Georgia. Over 169,000 new jobs will be created in occupations that require a high school diploma or equivalent; just over 137,000 new jobs will be added in occupations generally requiring a bachelor’s degree; over 120,000 new jobs will be created in occupations generally requiring no formal edu-cational credential; nearly 54,000 new jobs will be in occupations requir-ing some college or postsecondary award; just over 16,000 new jobs will be created in occupations that generally require a doctoral/professional degree; over 15,000 new jobs will be in occupations that generally require an associate’s degree; and over 13,000 new jobs will be in occupations gen-erally requiring a master’s degree.
• In terms of total employment level, most jobs in Georgia will be in the office and administration support occupational group, followed by sales and related occupations, food preparation and serving related occupations, transportation and material moving occupations, management occupa-tions, and production occupations by 2026.
• All major occupational groups will experience job growth over the projec-tion period. Transportation and material moving occupations will have the largest gains – with 54,000 new jobs through 2026; followed closely by sales and related occupations adding 50,700 new jobs; healthcare practi-tioners & technical occupations adding over 44,000 new jobs; and office and administrative support occupations growing by about 40,600 new jobs.
• Transportation and material-moving occupations are expected to grow at a rate of 1.4 percent per year in the state through 2026. Construction and extraction occupations are expected to grow at a rate of 1.1 percent per year and add over 19,000 jobs over the projection period. Construc-tion related occupations are expected to grow as a result of road, bridge,
In 2
026 Occupational Employment Highlights
Source: Georgia Department of Labor, Workforce Statistics & Economic Research

Georgia Department of Labor 9
In 2
026 highway, and waterway upgrades and improvements expected in Georgia
through 2026.
• Occupational groups growing at the fastest annual average growth rate through 2026 include healthcare support occupations growing by 2.0 percent per year to about 123,400 jobs by 2026; personal care and service occu-pations growing by 1.8 percent per year to nearly 151,400 total jobs; and healthcare practitioners & technical occupations growing by 1.7 percent per year reaching nearly 285,500 jobs in Georgia.
• Office and administrative support occupations will grow by 0.6 percent in Georgia and add 40,600 jobs while protective service occupations and production occupations will each grow by 0.7 percent and add 7,700 and 22,900 jobs, respectively, in Georgia; these growth rates are the slowest among the major occupational groups in the state.
• Occupations generally requiring a high school diploma or equivalent will account for 38.2 percent of all occupational openings in Georgia through 2026. The openings will come from labor force exits due to retirement or other reasons, plus occupational transfers from movement to other jobs, plus employment growth.
• More than half of the twenty fastest growing occupations in Georgia will be film or healthcare related through 2026 and include occupations such as costume attendants, film and video editors, physician assistants, occu-pational therapy assistants, and nurse practitioners; however, the list also includes rotary drill operators, bus drivers, and CNC programmers.
• Laborers and freight, stock, and material movers, hand (20,700), retail salespersons (18,000), combined food prep workers (17,300), registered nurses (13,500), and general and operations managers (13,000) will gain the most jobs through 2026.
• Combined food prep workers, retail salespersons, cashiers, laborers and freight, stock, and material movers, hand, and waiters and waitresses will top the list of most annual occupational openings in Georgia through 2026. Included in the top twenty list of most job openings also are customer service representatives, office clerks, general and operations managers, stock clerks and order filers, and janitors and cleaners.
• Executive secretaries and executive administrative assistants in Georgia will experience the most job losses through 2026; followed by secretaries
and administrative assistants, except legal, medical, and executive; fast
Occupational Employment Highlights Continued
Source: Georgia Department of Labor, Workforce Statistics & Economic Research

10 Georgia Workforce 2026
In 2
026 Occupational Employment Highlights Continued
food cooks; tellers; postal service mail carriers; and telecommunications equipment installers and repairers, except line installers. Although declining, there will still be some job openings in these occupations due labor force exits and occupational transfers.
• Job growth in Georgia in occupations that generally require a master’s degree or a doctoral/professional degree include lawyers; educational, guidance, school, and vocational counselors; nurse practitioners; physical therapists, physician assistants; and physicians and surgeons.
• The majority of job growth by 2026 in occupations that generally require a bachelor’s degree will be in nursing, management, k-12 education, soft-ware development, and accounting,. All of them will be for the pro-jection period because of their rapid job growth, high wages, and plentiful occupational openings.
• Job growth through 2026 in Georgia occupations generally requiring some college, postsecondary non-degree award, or an associate’s degree are con-centrated in healthcare. The group includes medical assistants, nursing assistants, and licensed practical/vocational nurses but also includes occu-pations such as heavy and tractor-trailer truck drivers, teacher assistants, and automotive service technicians and mechanics.
• Job growth in occupations that require a high school diploma or less will be heavily influenced by several large-employment service occupations.
Laborers and freight, stock, and material movers, hand; retail salespersons; combined food preparation and serving workers; personal care aides, and customer service reps will all add substantial new jobs over the decade.
• Healthcare and healthcare support occupations are expected to drive job growth over the projection period in Georgia. Registered nurses, medi-cal assistants, and nurse assistants top the list in terms number of new healthcare jobs. When it comes to rate of growth of health related occupa-tions, physician assistants, nurse practitioners, and occupational therapy assistants are on top.
• Careers in science, technology, engineering, and mathematics, commonly referred to as STEM occupations, will grow by nearly 77,000 new jobs in Georgia over the projection period ending in 2026.
• STEM occupations with the most growth through 2026 in Georgia will include registered nurses, software developers, licensed practical/voca-tional nurses, computer user support specialists, and emergency medical technicians and paramedics.
Source: Georgia Department of Labor, Workforce Statistics & Economic Research
Hot
Georgia Department of Labor 11
Industry Employment
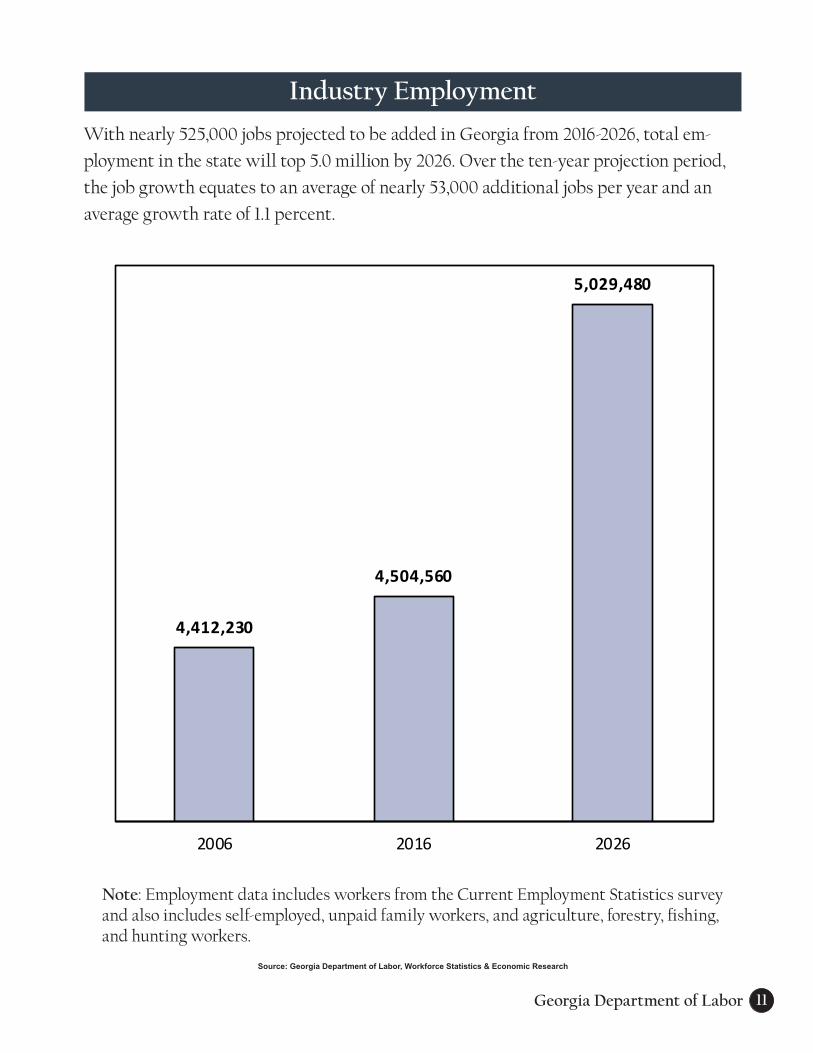
With nearly 525,000 jobs projected to be added in Georgia from 2016-2026, total em-
ployment in the state will top 5.0 million by 2026. Over the ten-year projection period,
the job growth equates to an average of nearly 53,000 additional jobs per year and an
average growth rate of 1.1 percent.
Note: Employment data includes workers from the Current Employment Statistics survey and also includes self-employed, unpaid family workers, and agriculture, forestry, fishing, and hunting workers.
Source: Georgia Department of Labor, Workforce Statistics & Economic Research
4,412,230
4,504,560
5,029,480
2006 2016 2026

12 Georgia Workforce 2026
Industries shown in the following graphs are defined primarily according to the North
American Industry Classification System (NAICS), a system used by the U.S. Bureau of
Labor Statistics to classify establishments into industry categories. Industries fall into
either goods-producing or services-providing sectors.
Goods-producing Sectors • Natural Resources and Mining. Exam-
ples include animal and crop production, logging, support activities for agriculture, and oil and gas extraction companies.
• Construction. Examples include bridge-building and home construction companies.
• Manufacturing. Examples include es-tablishments that make computer chips, breakfast cereals, and other goods.
Services-providing sectors
• Wholesale & Retail Trade. Examples include wholesale merchants of durable goods like automobiles and furniture, non-durable goods like drugs and grocer-ies, department stores, and gas stations.
• Transportation and Utilities. Examples include airports, warehousing and storage facilities, and power plants.
• Information. This includes print, soft-ware, and database publishing firms; broadcasting and telecommunications providers; and internet service providers.
• Financial Activities. Industries include finance, insurance, real estate, and rental services.
• Professional and Business Services. Examples include temporary help firms, consulting services, scientific and tech-nical services, and waste management establishments.
• Educational Services. This sector in-cludes local, state, and private schools, and other providers of education.
• Health Care and Social Assistance. In-cludes physicians’ offices, dentists’ offices, public and private hospitals, and privately run social services.
• Leisure and Hospitality. Examples include hotels, restaurants, sports teams, theme parks, performing arts companies and arcades.
• Other Services. Examples include auto-motive repair shops, funeral homes, and drycleaners.
• Government. This sector consists of the federal, state, and local governments, except for the postal service and govern-ment-run hospitals and schools.
Industry Sectors Defined
Source: Georgia Department of Labor, Workforce Statistics & Economic Research
Georgia Department of Labor 13
Projected 2026
Industry Supersector Employment Shares, 2016-2026
2016
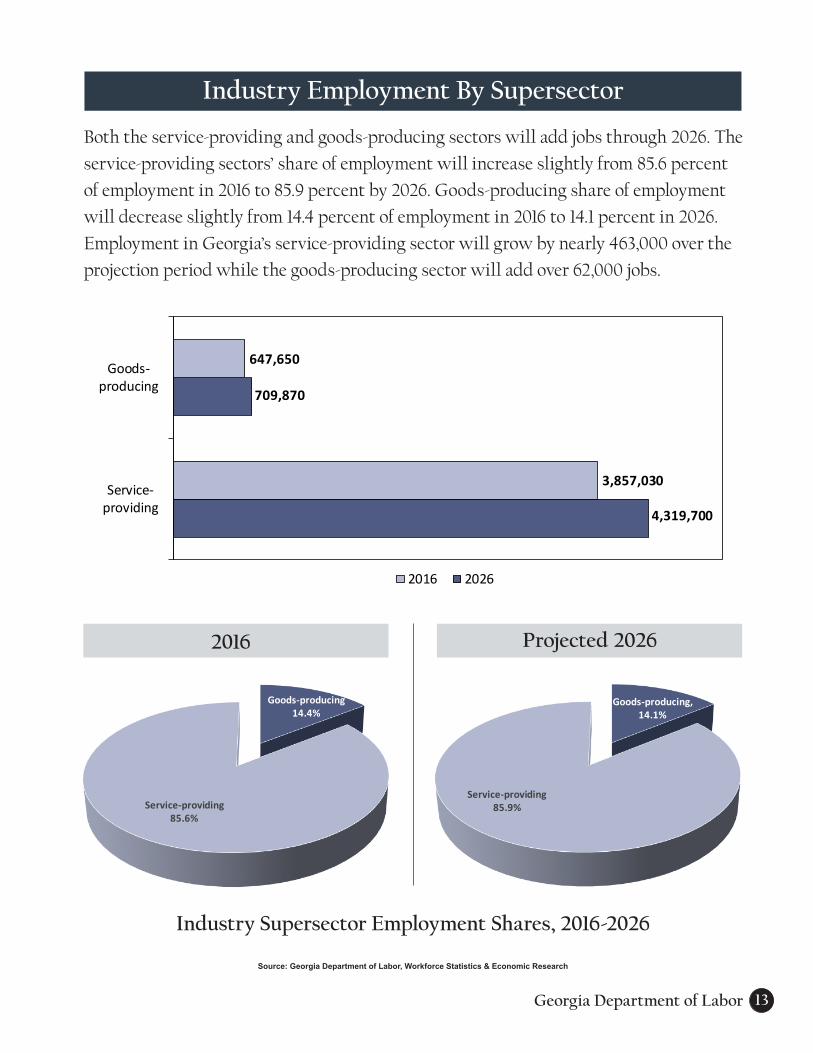
Both the service-providing and goods-producing sectors will add jobs through 2026. The
service-providing sectors’ share of employment will increase slightly from 85.6 percent
of employment in 2016 to 85.9 percent by 2026. Goods-producing share of employment
will decrease slightly from 14.4 percent of employment in 2016 to 14.1 percent in 2026.
Employment in Georgia’s service-providing sector will grow by nearly 463,000 over the
projection period while the goods-producing sector will add over 62,000 jobs.
Industry Employment By Supersector
Source: Georgia Department of Labor, Workforce Statistics & Economic Research
Goods-producing14.4%
Service-providing85.6%
Goods-producing Service-providing
Goods-producing, 14.1%
Service-providing85.9%
Goods-producing Service-providing
4,319,700
709,870
3,857,030
647,650
Service-providing
Goods-producing
Chart Title
2016 2026
14 Georgia Workforce 2026
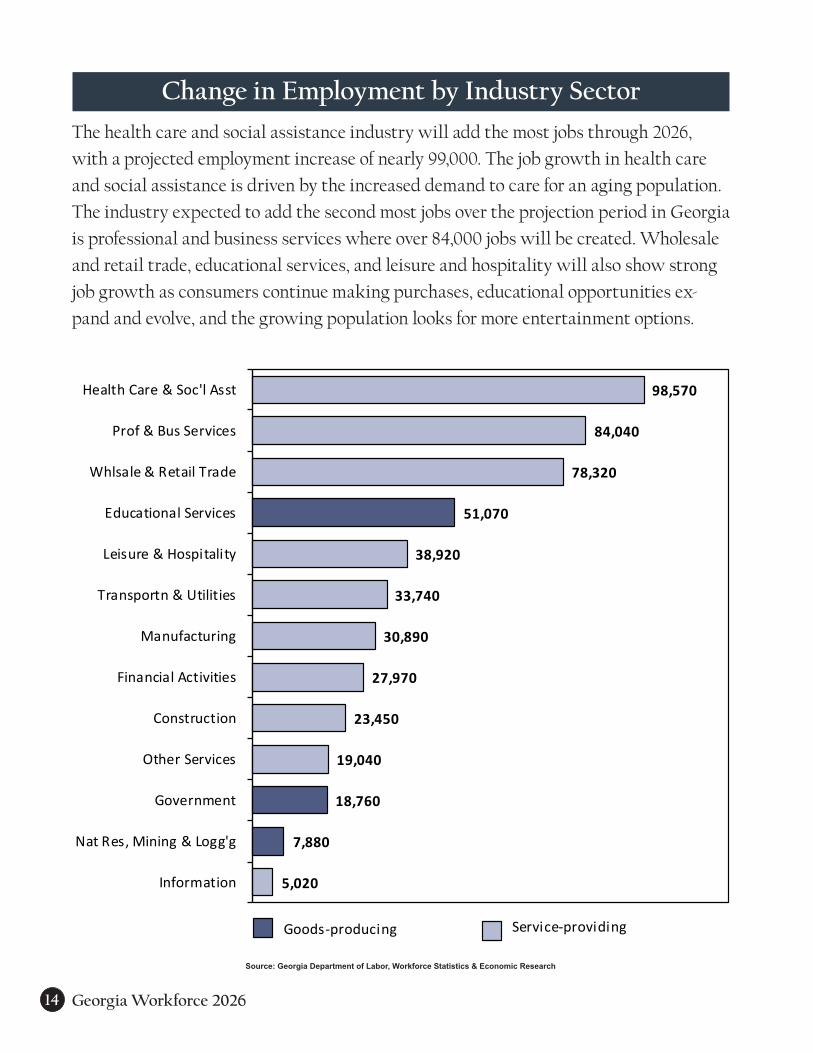
The health care and social assistance industry will add the most jobs through 2026,
with a projected employment increase of nearly 99,000. The job growth in health care
and social assistance is driven by the increased demand to care for an aging population.
The industry expected to add the second most jobs over the projection period in Georgia
is professional and business services where over 84,000 jobs will be created. Wholesale
and retail trade, educational services, and leisure and hospitality will also show strong
job growth as consumers continue making purchases, educational opportunities ex-
pand and evolve, and the growing population looks for more entertainment options.
Change in Employment by Industry Sector
Source: Georgia Department of Labor, Workforce Statistics & Economic Research
98,570
84,040
78,320
51,070
38,920
33,740
30,890
27,970
23,450
19,040
18,760
7,880
5,020
Health Care & Soc'l Asst
Prof & Bus Services
Whlsale & Retail Trade
Educational Services
Leisure & Hospitality
Transportn & Utilities
Manufacturing
Financial Activities
Construction
Other Services
Government
Nat Res, Mining & Logg'g
Information
Goods-producing Service-providing
Change in Employment by Industry Sector
Georgia Department of Labor 15
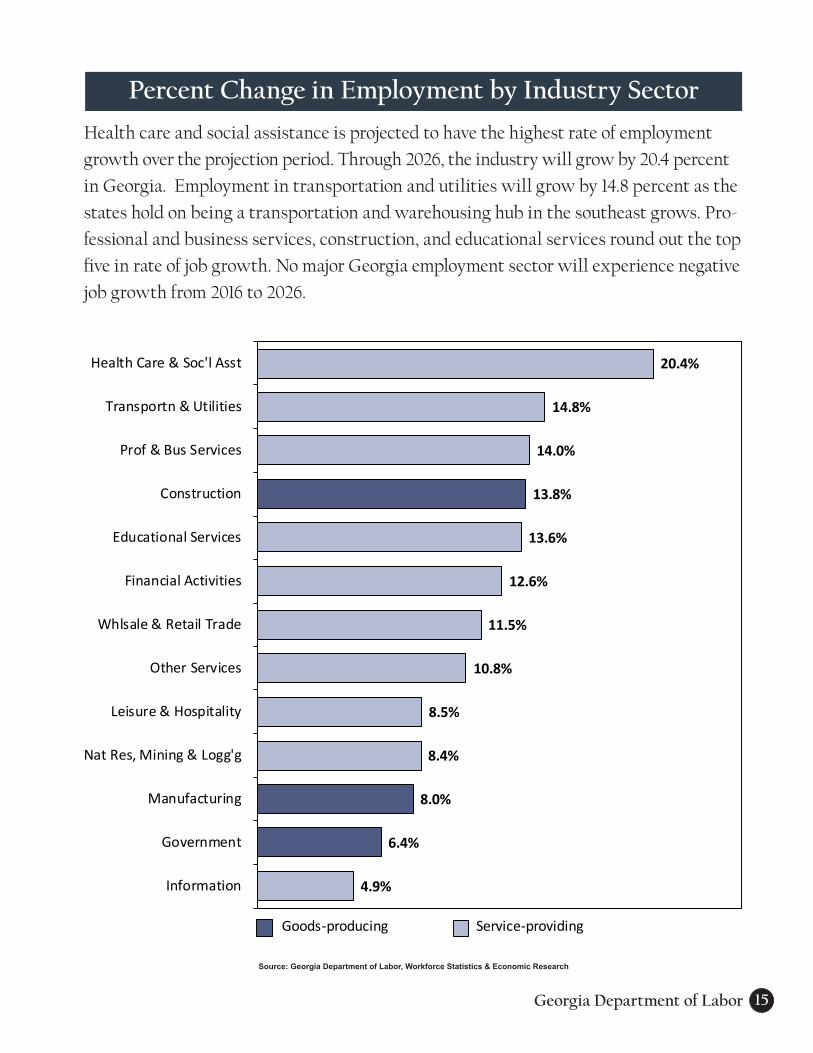
Health care and social assistance is projected to have the highest rate of employment
growth over the projection period. Through 2026, the industry will grow by 20.4 percent
in Georgia. Employment in transportation and utilities will grow by 14.8 percent as the
states hold on being a transportation and warehousing hub in the southeast grows. Pro-
fessional and business services, construction, and educational services round out the top
five in rate of job growth. No major Georgia employment sector will experience negative
job growth from 2016 to 2026.
Percent Change in Employment by Industry Sector
Source: Georgia Department of Labor, Workforce Statistics & Economic Research
20.4%
14.8%
14.0%
13.8%
13.6%
12.6%
11.5%
10.8%
8.5%
8.4%
8.0%
6.4%
4.9%
Health Care & Soc'l Asst
Transportn & Utilities
Prof & Bus Services
Construction
Educational Services
Financial Activities
Whlsale & Retail Trade
Other Services
Leisure & Hospitality
Nat Res, Mining & Logg'g
Manufacturing
Government
Information
Goods-producing Service-providing
16 Georgia Workforce 2026
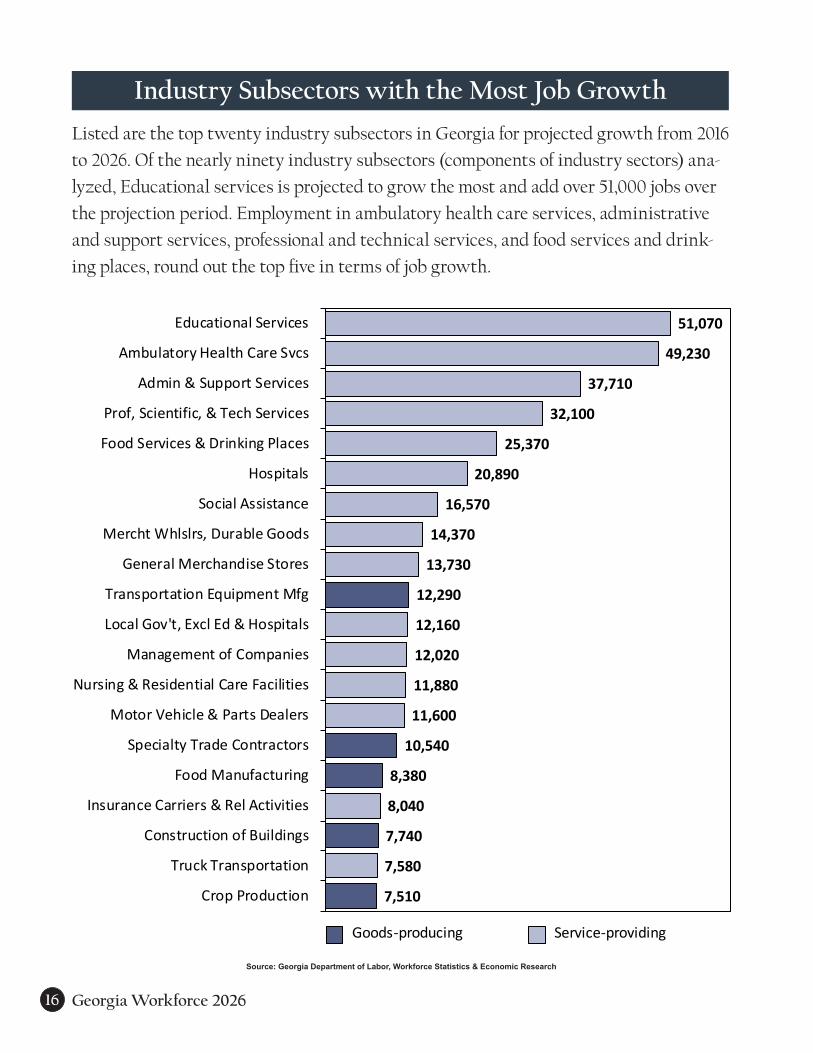
Listed are the top twenty industry subsectors in Georgia for projected growth from 2016
to 2026. Of the nearly ninety industry subsectors (components of industry sectors) ana-
lyzed, Educational services is projected to grow the most and add over 51,000 jobs over
the projection period. Employment in ambulatory health care services, administrative
and support services, professional and technical services, and food services and drink-
ing places, round out the top five in terms of job growth.
Industry Subsectors with the Most Job Growth
Source: Georgia Department of Labor, Workforce Statistics & Economic Research
51,070
49,230
37,710
32,100
25,370
20,890
16,570
14,370
13,730
12,290
12,160
12,020
11,880
11,600
10,540
8,380
8,040
7,740
7,580
7,510
Educational Services
Ambulatory Health Care Svcs
Admin & Support Services
Prof, Scientific, & Tech Services
Food Services & Drinking Places
Hospitals
Social Assistance
Mercht Whlslrs, Durable Goods
General Merchandise Stores
Transportation Equipment Mfg
Local Gov't, Excl Ed & Hospitals
Management of Companies
Nursing & Residential Care Facilities
Motor Vehicle & Parts Dealers
Specialty Trade Contractors
Food Manufacturing
Insurance Carriers & Rel Activities
Construction of Buildings
Truck Transportation
Crop Production
Goods-producing Service-providing

Georgia Department of Labor 17
The high technology industry includes firms that design, develop, and introduce new
products, processes and innovations by applying scientific and technical knowledge. High
technology usually receives attention due to its potential to create well-paying jobs. High-
tech includes such industries as management, scientific, and technical consulting services
which will add nearly 7,400 jobs by 2026; architectural and engineering services which
will grow by nearly 7,100 jobs; and aerospace product and parts manufacturing which will
add over 4,800 new jobs to Georgia’s economy over the projections period.
High-Technology Industries with the Most Job Growth
Source: Georgia Department of Labor, Workforce Statistics & Economic Research
7,370
7,080
4,830
2,930
2,650
2,330
1,860
1,740
1,520
1,510
1,210
910
900
610
590
520
410
Mgt, Scientific, & Tech Consult Svcs
Architectural, Engineerg, & Rel Svcs
Aerospace Product & Parts Mfg
Computer Sys Design & Rel Svcs
Wireless Telecom Carriers
Facilities Support Services
Office Administrative Services
Other Chemical Product & Prep Mfg
Data Processing, Hosting, & Rel Svcs
Software Publishers
Electr Pwr Generation, Transm & Distrib
Scientific Research & Development Svcs
Electrical Equipment Manufacturing
Other Transportation Equip Mfg
Electr & Prec Equip Repair & Maint
Paint, Coating, & Adhesive Mfg
Pharmaceutical & Medicine Mfg
Goods-producing Service-providing

18 Georgia Workforce 2026
Detailed industry employment in the state growing at the fastest rate is educational
support services, growing at 7.7 percent over the projections period. With many of the
municipalities in the state grappling with infrastructure issues like aging water/sewer
systems and stressed underground pipes, employment in water, sewage and other sys-
tems is slated to grow at the second fastest rate from 2016 to 2026. One-fourth of the
detailed industries growing fastest are in health care and social assistance as Georgia’s
population continues to live longer and advances in medical care persists.
Fastest Growing Detailed Industries
Source: Georgia Department of Labor, Workforce Statistics & Economic Research
7.7%
6.8%
6.0%
5.5%
5.1%
4.6%
4.3%
4.0%
3.9%
3.9%
3.8%
3.7%
3.5%
3.5%
3.4%
3.4%
3.4%
3.1%
3.1%
3.1%
Educational Support Services
Water, Sewage & Other Systems
Alumina & Aluminum Production
Support Activities for Mining
RV Parks & Recreational Camps
Motion Picture & Video Industries
Outpatient Care Centers
Other Information Services
Other Chemical Product & Prep Mfg
School & Employee Bus Transportation
Care Retire't & Living Facilities for Elderly
Social Advocacy Organizations
Animal Production
Individual & Family Services
Hardware Manufacturing
Wireless Telecommunications Carriers
Other Ambulatory Health Care Services
Activities Related to Credit Intermediation
Facilities Support Services
Specialty Hospitals (excl Psych/Subst Abuse)
Goods-producing Service-providing

Georgia Department of Labor 19
At the detailed industry level, elementary and secondary schools employment will
grow the most in Georgia from 2016 to 2026 with projected job growth of over 34,500.
Employment services along with restaurants and other eating places round out the top
three with, respectively, nearly 26,000 and over 22,000 projected jobs to be added by
2026. Six of the top twenty industries, and four of the top ten industries, adding the
most jobs in the state over the projection cycle are health care related. Three of the top
twenty are professional and business service jobs.
Most Job Growth by Detailed Industry
Source: Georgia Department of Labor, Workforce Statistics & Economic Research
34,510
25,870
22,100
21,690
19,600
19,230
12,160
12,020
10,070
7,950
7,740
7,590
7,510
7,470
7,370
7,240
7,080
7,020
6,630
6,600
Elem & Secondary Schools
Employment Services
Restaurants & Other Eating Places
Other General Merchandise Stores
General Medical & Surgical Hospitals
Offices of Physicians
Local Gov't, Excl Ed & Hospitals
Management of Companies
Individual & Family Services
Care Retire't & Living Facilities for Elderly
Colleges, Universities, & Prof Schools
Automobile Dealers
Crop Production
Agencies, Brokers, & Other Ins Rel Activities
Mgt, Scientific, & Tech Consult Svcs
Outpatient Care Centers
Architectural, Engineering, & Related Svcs
Offices of Other Health Practitioners
Accounting, Tax Prep, & Payroll Svcs
Animal Slaughtering & Processing
Goods-producing Service-providing

20 Georgia Workforce 2026
Several industries will endure employment declines over the ten-year projection period.
As shoppers move to purchase more goods over the internet, department stores are
poised to shed the most jobs by 2026 in Georgia. Wired telecommunications carriers;
newspapers, periodicals, and book publishers; textile furnishings mills; and office sup-
plies, stationery, & gift stores round out the top five industries with the most job cuts.
Seven of the twenty industries losing the most jobs by 2026 are in manufacturing.
Most Job Losses by Detailed Industry
Source: Georgia Department of Labor, Workforce Statistics & Economic Research
-7,960
-5,290
-3,310
-2,490
-1,750
-1,600
-1,550
-1,520
-1,500
-1,310
-1,300
-1,290
-1,270
-1,120
-1,010
-880
-870
-870
-830
-800
Department Stores
Wired Telecommunications Carriers
Newspaper, Periodical, & Book Publishers
Textile Furnishings Mills
Office Supplies, Stationery, & Gift Stores
Religious Organizations
Fabric Mills
Drycleaning & Laundry Services
Nonmetallic Mineral Mining & Quarrying
Depository Credit Intermediation
Book, Periodical, & Music Stores
Textile & Fabric Finishing & Coating Mills
Forestry & Logging
Semiconductor & Other Electr Comp Mfg
Naviga'l, Measurg, Electro, & Ctrl Instr Mfg
Petro & Petro Product Merch Whlsalers
Cut & Sew Apparel Mfg
Pulp, Paper, & Paperboard Mills
Psychiatric & Substance Abuse Hospitals
Vending Machine Operators
Goods-producing Service-providing
Georgia Department of Labor 21
The previous section analyzed projected growth and decline in industry employment.
This section examines projected changes in a closely related area—that of occupational
employment. The Georgia Department of Labor has analyzed several factors affecting
employment growth for nearly 800 detailed occupations. Occupations in this publica-
tion are defined according to the Standard Occupational Classification (SOC) system,
which is prescribed by the U.S. Bureau of Labor Statistics. Graphs of occupational
trends are displayed by the educational level usually required for employment and by
the kinds of tasks that workers typically perform. Educational levels include eight
categories that range from a doctoral or professional degree to no formal educational
credential.
Subsequent pages present graphical displays of occupational trends by percentage
change, numerical change, and annual openings. Each of these is a useful measure of job
growth and/or decline. Occupations with fast growth, many new positions, or many job
openings generally offer more favorable conditions for mobility and advancement.
jobs combine all of these attributes with high wages to produce the most attractive
job opportunities in Georgia. Each occupation designated as in this report meets
all three of the following criteria:
• Annual job growth greater than the statewide average of 1.1 percent
• Annual wage greater than the statewide average of $47,000 per year as listed in the
2017 edition of the Georgia Wage Survey
• At least 400 projected job openings per year to the year 2026
Occupational Employment
Hot
Hot
Source: Georgia Department of Labor, Workforce Statistics & Economic Research

22 Georgia Workforce 2026
Job function categories are grouped by occupation. A description of each occupational group in presented below.
• Management, business, and financial operations occupations – workers in these jobs direct the activities of business, government, and other organizations and perform tasks related to finance and business.
• Professional and related occupations – workers in these occupations are in education, healthcare, science, information technology, the arts, and a variety of other jobs.
• Sales and related occupations – workers in this group are involved in the sale of goods and services, both to businesses and to consumers.
• Office and administrative support occupations – workers in this group prepare and file documents, interact with the public, and gather and distribute goods and information.
• Healthcare Support Occupations – workers in these occupations are involved with support-ing technical healthcare workers.
• Protective Service Occupations – this group of workers is entrusted with protecting the public.
• Food Preparation & Serving Related Occupations – these workers prepare and serve food.
• Building & Grounds Cleaning & Maintenance Occupations – workers in this group of occupations are involved with cleaning and maintaining buildings and grounds.
• Personal Care & Service Occupations – involved with providing care and service to the public.
• Farming, fishing, and forestry occupations – workers in this group tend and harvest re-newable resources.
• Construction and extraction occupations – This group includes workers in construction and building trades and in oil and gas extraction and mining.
• Installation, maintenance, and repair occupations – workers in this group install and maintain all types of equipment. • Production occupations – most people in these occupations work as assemblers or machine
operators, primarily in manufacturing industries.
• Transportation and material-moving occupations – workers in these occupations move people or materials.
Job Function Categories
Source: Georgia Department of Labor, Workforce Statistics & Economic Research
Georgia Department of Labor 23
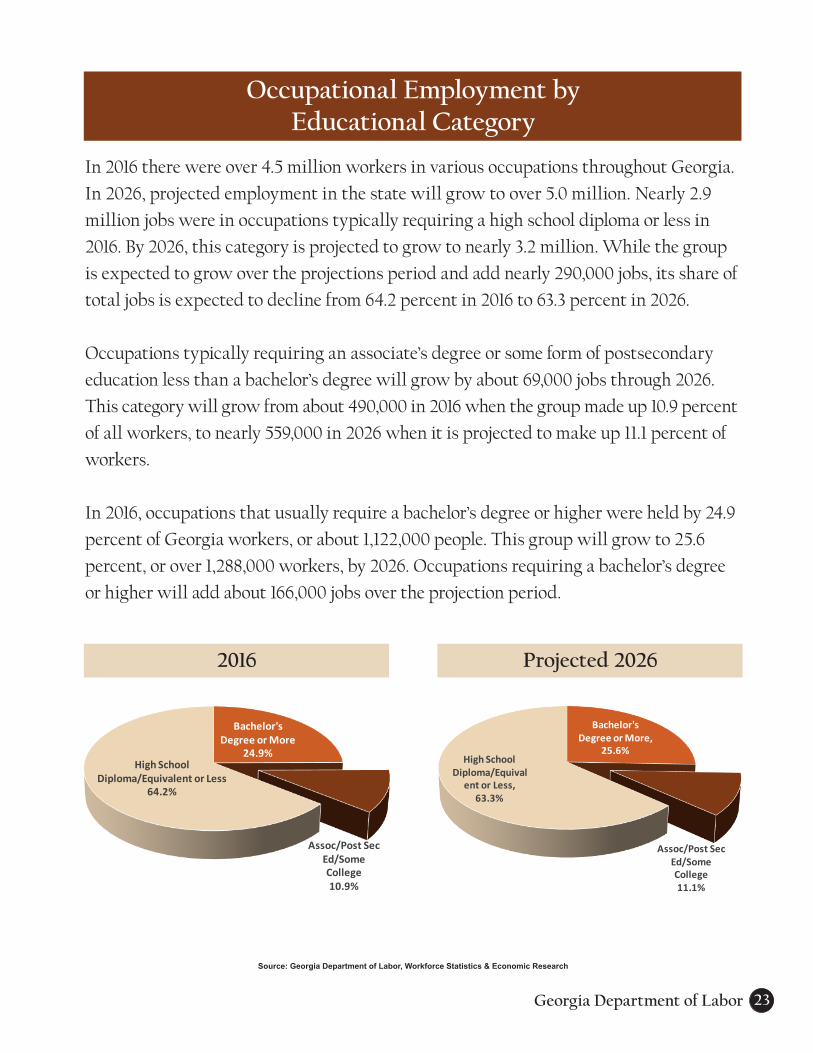
In 2016 there were over 4.5 million workers in various occupations throughout Georgia.
In 2026, projected employment in the state will grow to over 5.0 million. Nearly 2.9
million jobs were in occupations typically requiring a high school diploma or less in
2016. By 2026, this category is projected to grow to nearly 3.2 million. While the group
is expected to grow over the projections period and add nearly 290,000 jobs, its share of
total jobs is expected to decline from 64.2 percent in 2016 to 63.3 percent in 2026.
Occupations typically requiring an associate’s degree or some form of postsecondary
education less than a bachelor’s degree will grow by about 69,000 jobs through 2026.
This category will grow from about 490,000 in 2016 when the group made up 10.9 percent
of all workers, to nearly 559,000 in 2026 when it is projected to make up 11.1 percent of
workers.
In 2016, occupations that usually require a bachelor’s degree or higher were held by 24.9
percent of Georgia workers, or about 1,122,000 people. This group will grow to 25.6
percent, or over 1,288,000 workers, by 2026. Occupations requiring a bachelor’s degree
or higher will add about 166,000 jobs over the projection period.
Occupational Employment by Educational Category
Projected 20262016
Source: Georgia Department of Labor, Workforce Statistics & Economic Research
Bachelor's Degree or More
24.9%
Assoc/Post Sec Ed/Some College10.9%
High School Diploma/Equivalent or Less
64.2%
Bachelor's Degree or More Assoc/Post Sec Ed/Some CollegeHigh School Diploma/Equivalent or Less
Bachelor's Degree or More,
25.6%
Assoc/Post Sec Ed/Some College11.1%
High School Diploma/Equival
ent or Less, 63.3%
Bachelor's Degree or More Assoc/Post Sec Ed/Some CollegeHigh School Diploma/Equivalent or Less

24 Georgia Workforce 2026
Employment Growth by Educational Category
Employment in all education categories will see job growth through 2026. Occupations
requiring a high school diploma or equivalent will see the most growth with the group
adding over 169,000 new positions, comprising 32.3 percent of the nearly 525,000 jobs
to be added in Georgia over the projection period. Occupations typically requiring no
formal educational credential are projected to grow by over 120,000 by 2026.
As the need for a more educated workforce continues to grow, the occupational groups
that generally require education beyond high school are projected to increase. From
2016-2026, occupations in Georgia that generally require a bachelor’s degree will grow
by over 137,000 (26.1 percent) to nearly 1,095,000. Occupations typically requiring post-
secondary non-degree awards will see employment levels rise by over 43,000 to nearly
329,000 by 2026. Positions requiring a doctoral or professional degree, which have the
highest average wage in the state at $115,700 per year, are projected to add over 16,000
jobs in the state through 2026.
Source: Georgia Department of Labor, Workforce Statistics & Economic Research
169,350
137,160
120,390
43,190
16,020
15,060
13,060
10,720
High School Diploma orEquivalent
Bachelor's Degree
No formal educational credential
Postsecondary Non-DegreeAward
Doctoral or Professional Degree
Associate's Degree
Master's Degree
Some College, No Degree
Georgia Department of Labor 25
Employment Growth by Occupational Group
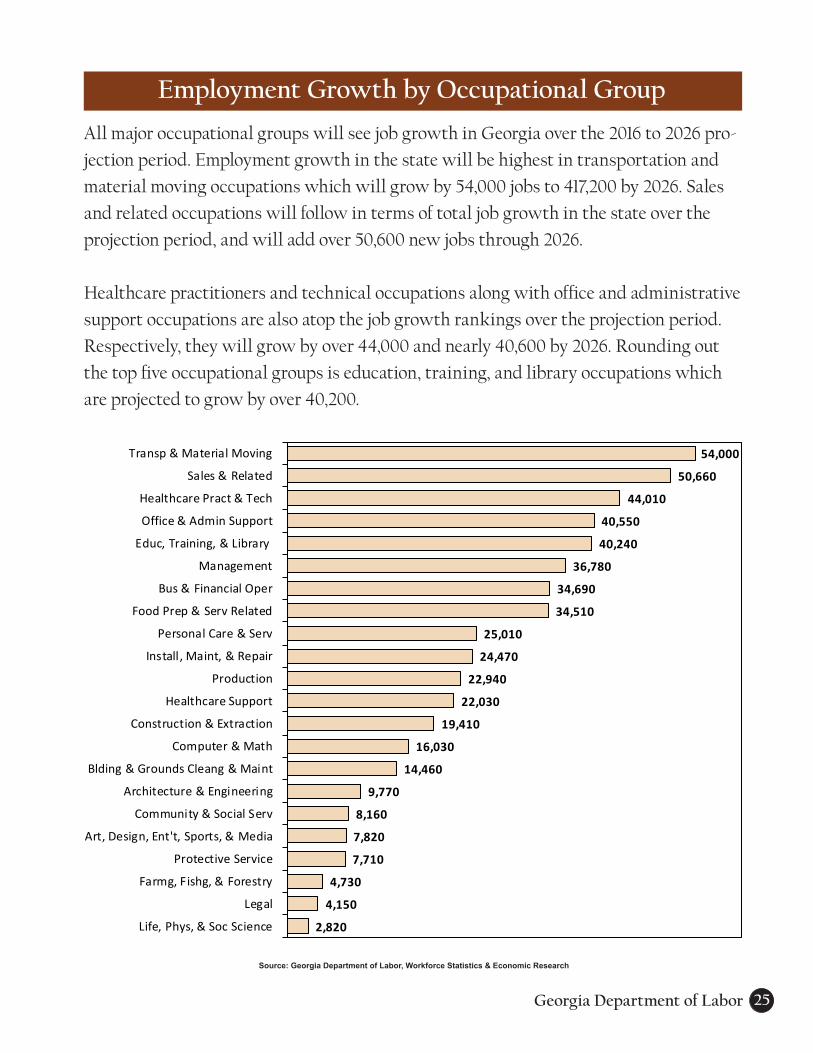
All major occupational groups will see job growth in Georgia over the 2016 to 2026 pro-
jection period. Employment growth in the state will be highest in transportation and
material moving occupations which will grow by 54,000 jobs to 417,200 by 2026. Sales
and related occupations will follow in terms of total job growth in the state over the
projection period, and will add over 50,600 new jobs through 2026.
Healthcare practitioners and technical occupations along with office and administrative
support occupations are also atop the job growth rankings over the projection period.
Respectively, they will grow by over 44,000 and nearly 40,600 by 2026. Rounding out
the top five occupational groups is education, training, and library occupations which
are projected to grow by over 40,200.
Source: Georgia Department of Labor, Workforce Statistics & Economic Research
54,000
50,660
44,010
40,550
40,240
36,780
34,690
34,510
25,010
24,470
22,940
22,030
19,410
16,030
14,460
9,770
8,160
7,820
7,710
4,730
4,150
2,820
Transp & Material Moving
Sales & Related
Healthcare Pract & Tech
Office & Admin Support
Educ, Training, & Library
Management
Bus & Financial Oper
Food Prep & Serv Related
Personal Care & Serv
Install, Maint, & Repair
Production
Healthcare Support
Construction & Extraction
Computer & Math
Blding & Grounds Cleang & Maint
Architecture & Engineering
Community & Social Serv
Art, Design, Ent't, Sports, & Media
Protective Service
Farmg, Fishg, & Forestry
Legal
Life, Phys, & Soc Science
Employment Growth by Occupational Group

26 Georgia Workforce 2026
Annual Openings by Educational Category
Occupational openings are an estimate of separations caused by workers exiting the
labor force, due to retirement or other reasons, and separations caused by workers trans-
ferring to different occupations. Projections of separations are combined with projections
of employment change to determine occupational openings. Of the nearly 572,000 annual
openings projected in Georgia through 2026, 220,000 are due to the need to replace
workers that have exited the labor force, about 300,000 are from people transferring to a
different job, and over 52,000 is due to employment growth.
Occupations with the most job openings through 2026 in the state will generally re-
quire a high school diploma or equivalent.
Source: Georgia Department of Labor, Workforce Statistics & Economic Research
218,730
190,410
94,000
33,550
12,120
10,020
6,940
6,670
High School Diploma orEquivalent
No formal educational credential
Bachelor's Degree
Postsecondary Non-DegreeAward
Some College, No Degree
Associate's Degree
Master's Degree
Doctoral or Professional Degree
Georgia Department of Labor 27
Annual Openings by Occupational Group
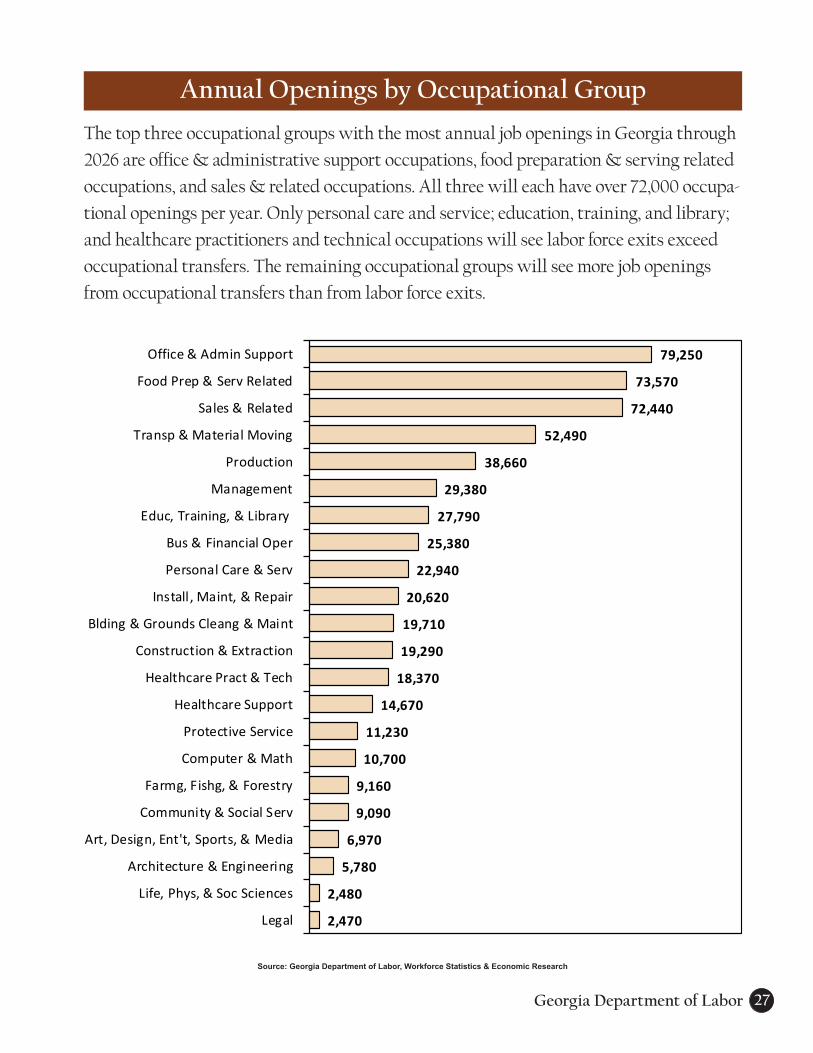
The top three occupational groups with the most annual job openings in Georgia through
2026 are office & administrative support occupations, food preparation & serving related
occupations, and sales & related occupations. All three will each have over 72,000 occupa-
tional openings per year. Only personal care and service; education, training, and library;
and healthcare practitioners and technical occupations will see labor force exits exceed
occupational transfers. The remaining occupational groups will see more job openings
from occupational transfers than from labor force exits.
Source: Georgia Department of Labor, Workforce Statistics & Economic Research
79,250
73,570
72,440
52,490
38,660
29,380
27,790
25,380
22,940
20,620
19,710
19,290
18,370
14,670
11,230
10,700
9,160
9,090
6,970
5,780
2,480
2,470
Office & Admin Support
Food Prep & Serv Related
Sales & Related
Transp & Material Moving
Production
Management
Educ, Training, & Library
Bus & Financial Oper
Personal Care & Serv
Install, Maint, & Repair
Blding & Grounds Cleang & Maint
Construction & Extraction
Healthcare Pract & Tech
Healthcare Support
Protective Service
Computer & Math
Farmg, Fishg, & Forestry
Community & Social Serv
Art, Design, Ent't, Sports, & Media
Architecture & Engineering
Life, Phys, & Soc Sciences
Legal

28 Georgia Workforce 2026
Fastest Growing Occupations
The 20 fastest growing occupations, in terms of average annual growth, through 2026 in
Georgia are dominated by movie, television, and healthcare professions. Twelve of the 20
are in the field of healthcare or movies and eight of the occupations generally require a
bachelor’s degree or higher.
Though all the jobs listed are fast-growing in Georgia, it does not always mean they will
create a large number of jobs. Rotary drill operators, costume attendants, and CNC ma-
chine tool programmers, are all fast growing occupations but will struggle to each pro-
duce 100 new jobs through 2026. Whereas personal care aides and nurse practitioners
will produce over 10,000 and nearly 1,700 jobs, respectively, over the projection period.
Source: Georgia Department of Labor, Workforce Statistics & Economic Research
Hot
Hot
Hot
5.3%
3.9%
3.7%
3.6%
3.5%
3.5%
3.3%
3.3%
3.3%
3.3%
3.1%
3.1%
3.0%
2.9%
2.8%
2.8%
2.8%
2.8%
2.7%
2.7%
Rotary Drill Operators, Oil & Gas
Costume Attendants
Film & Video Editors
Physician Assistants
Bus Drivers, Transit & Intercity
Personal Care Aides
Occupational Therapy Assistants
Set & Exhibit Designers
Statisticians
Nurse Practitioners
Physical Therapist Assistants
Comptr Numerically Controlled Mach Progr
Physical Therapist Aides
Camera Operators, TV, Video, & Motion Picture
Nursing Instructors & Teachers, Postsec
Transit & Railroad Police
Farmworkers, Ranch, & Aquacultural Animals
Actors
Respiratory Therapists
Producers & Directors
Georgia Department of Labor 29
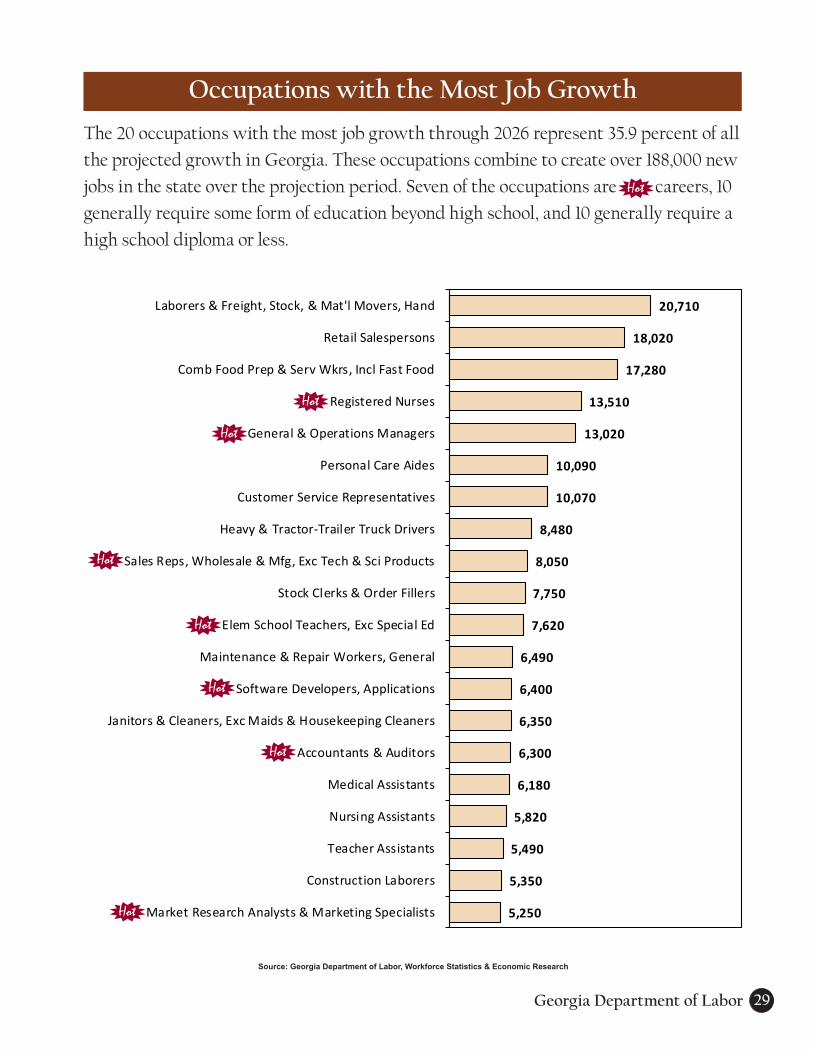
Occupations with the Most Job Growth
Hot
The 20 occupations with the most job growth through 2026 represent 35.9 percent of all
the projected growth in Georgia. These occupations combine to create over 188,000 new
jobs in the state over the projection period. Seven of the occupations are careers, 10
generally require some form of education beyond high school, and 10 generally require a
high school diploma or less.
Hot
Hot
Hot
Hot
Hot
Hot
Hot
Source: Georgia Department of Labor, Workforce Statistics & Economic Research
20,710
18,020
17,280
13,510
13,020
10,090
10,070
8,480
8,050
7,750
7,620
6,490
6,400
6,350
6,300
6,180
5,820
5,490
5,350
5,250
Laborers & Freight, Stock, & Mat'l Movers, Hand
Retail Salespersons
Comb Food Prep & Serv Wkrs, Incl Fast Food
Registered Nurses
General & Operations Managers
Personal Care Aides
Customer Service Representatives
Heavy & Tractor-Trailer Truck Drivers
Sales Reps, Wholesale & Mfg, Exc Tech & Sci Products
Stock Clerks & Order Fillers
Elem School Teachers, Exc Special Ed
Maintenance & Repair Workers, General
Software Developers, Applications
Janitors & Cleaners, Exc Maids & Housekeeping Cleaners
Accountants & Auditors
Medical Assistants
Nursing Assistants
Teacher Assistants
Construction Laborers
Market Research Analysts & Marketing Specialists
30 Georgia Workforce 2026
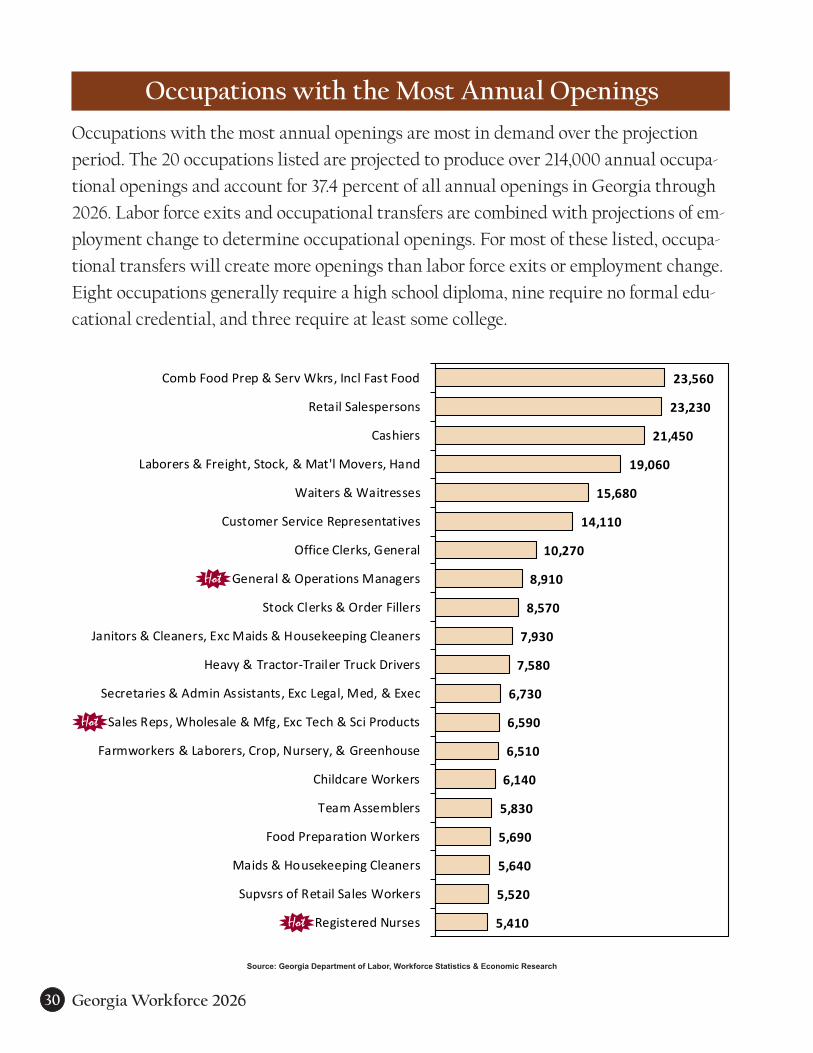
Occupations with the Most Annual Openings
Occupations with the most annual openings are most in demand over the projection
period. The 20 occupations listed are projected to produce over 214,000 annual occupa-
tional openings and account for 37.4 percent of all annual openings in Georgia through
2026. Labor force exits and occupational transfers are combined with projections of em-
ployment change to determine occupational openings. For most of these listed, occupa-
tional transfers will create more openings than labor force exits or employment change.
Eight occupations generally require a high school diploma, nine require no formal edu-
cational credential, and three require at least some college.
Source: Georgia Department of Labor, Workforce Statistics & Economic Research
Hot
Hot
Hot
23,560
23,230
21,450
19,060
15,680
14,110
10,270
8,910
8,570
7,930
7,580
6,730
6,590
6,510
6,140
5,830
5,690
5,640
5,520
5,410
Comb Food Prep & Serv Wkrs, Incl Fast Food
Retail Salespersons
Cashiers
Laborers & Freight, Stock, & Mat'l Movers, Hand
Waiters & Waitresses
Customer Service Representatives
Office Clerks, General
General & Operations Managers
Stock Clerks & Order Fillers
Janitors & Cleaners, Exc Maids & Housekeeping Cleaners
Heavy & Tractor-Trailer Truck Drivers
Secretaries & Admin Assistants, Exc Legal, Med, & Exec
Sales Reps, Wholesale & Mfg, Exc Tech & Sci Products
Farmworkers & Laborers, Crop, Nursery, & Greenhouse
Childcare Workers
Team Assemblers
Food Preparation Workers
Maids & Housekeeping Cleaners
Supvsrs of Retail Sales Workers
Registered Nurses
Georgia Department of Labor 31
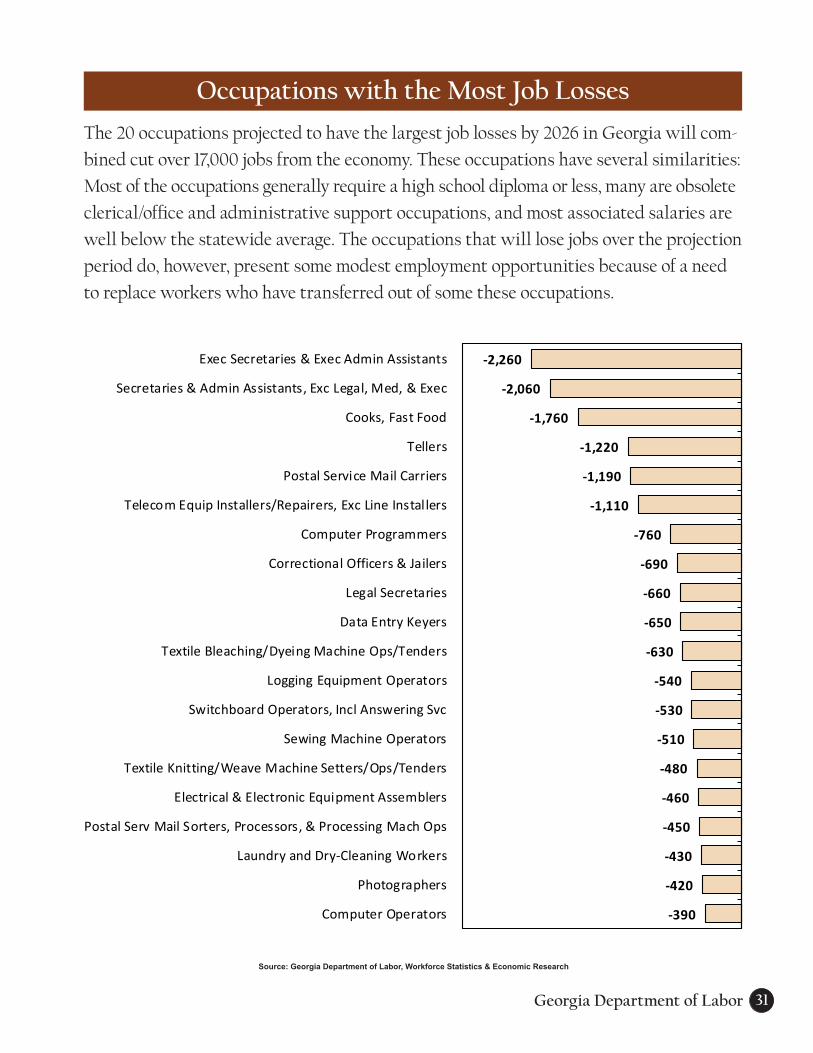
Occupations with the Most Job Losses
The 20 occupations projected to have the largest job losses by 2026 in Georgia will com-
bined cut over 17,000 jobs from the economy. These occupations have several similarities:
Most of the occupations generally require a high school diploma or less, many are obsolete
clerical/office and administrative support occupations, and most associated salaries are
well below the statewide average. The occupations that will lose jobs over the projection
period do, however, present some modest employment opportunities because of a need
to replace workers who have transferred out of some these occupations.
Source: Georgia Department of Labor, Workforce Statistics & Economic Research
-2,260
-2,060
-1,760
-1,220
-1,190
-1,110
-760
-690
-660
-650
-630
-540
-530
-510
-480
-460
-450
-430
-420
-390
Exec Secretaries & Exec Admin Assistants
Secretaries & Admin Assistants, Exc Legal, Med, & Exec
Cooks, Fast Food
Tellers
Postal Service Mail Carriers
Telecom Equip Installers/Repairers, Exc Line Installers
Computer Programmers
Correctional Officers & Jailers
Legal Secretaries
Data Entry Keyers
Textile Bleaching/Dyeing Machine Ops/Tenders
Logging Equipment Operators
Switchboard Operators, Incl Answering Svc
Sewing Machine Operators
Textile Knitting/Weave Machine Setters/Ops/Tenders
Electrical & Electronic Equipment Assemblers
Postal Serv Mail Sorters, Processors, & Processing Mach Ops
Laundry and Dry-Cleaning Workers
Photographers
Computer Operators

32 Georgia Workforce 2026
Occupations with the most job growth in Georgia that generally require a bachelor’s
degree or more are concentrated in management, business and finance, and education.
Georgia will likely continue to be a magnet for corporations looking for a friendly busi-
ness environment thus spurring job growth in business and financial related occupa-
tions along with the management positions to lead them. Keeping a priority on educa-
tion with a rising population, education jobs are projected to be plentiful through 2026.
Almost all of these occupations have earned the distinction of being for the projec-
tion period. Their rapid job growth, relatively high wages, and plentiful job openings
through 2026 make them extremely attractive job prospects.
Most Job Growth in Occupations that Require a Bachelor’s Degree or More
Hot
Hot
Hot
Hot
Hot
Hot
Hot
Hot
Hot
Hot
Hot
Hot
Hot
Hot
Hot
Hot
Hot
Hot
Source: Georgia Department of Labor, Workforce Statistics & Economic Research
13,510
13,020
7,620
6,400
6,300
5,250
4,480
4,170
4,120
4,040
3,790
2,290
2,230
2,210
2,150
2,090
1,910
1,870
1,650
1,640
Registered Nurses
General & Operations Managers
Elem School Teachers, Exc Special Ed
Software Developers, Applications
Accountants & Auditors
Market Research Analysts & Marketing Specialists
Business Operations Specialists, All Other
Financial Managers
Management Analysts
Middle School Teachers, Exc Spec & Career/Tech Ed
Secondary School Teachers, Exc Spec & Career/Tech Ed
Substitute Teachers
Lawyers
Sales Managers
Human Resources Specialists
Managers, All Other
Medical & Health Services Managers
Ed, Guidance, School, & Voc Counselors
Nurse Practitioners
Civil Engineers
Georgia Department of Labor 33
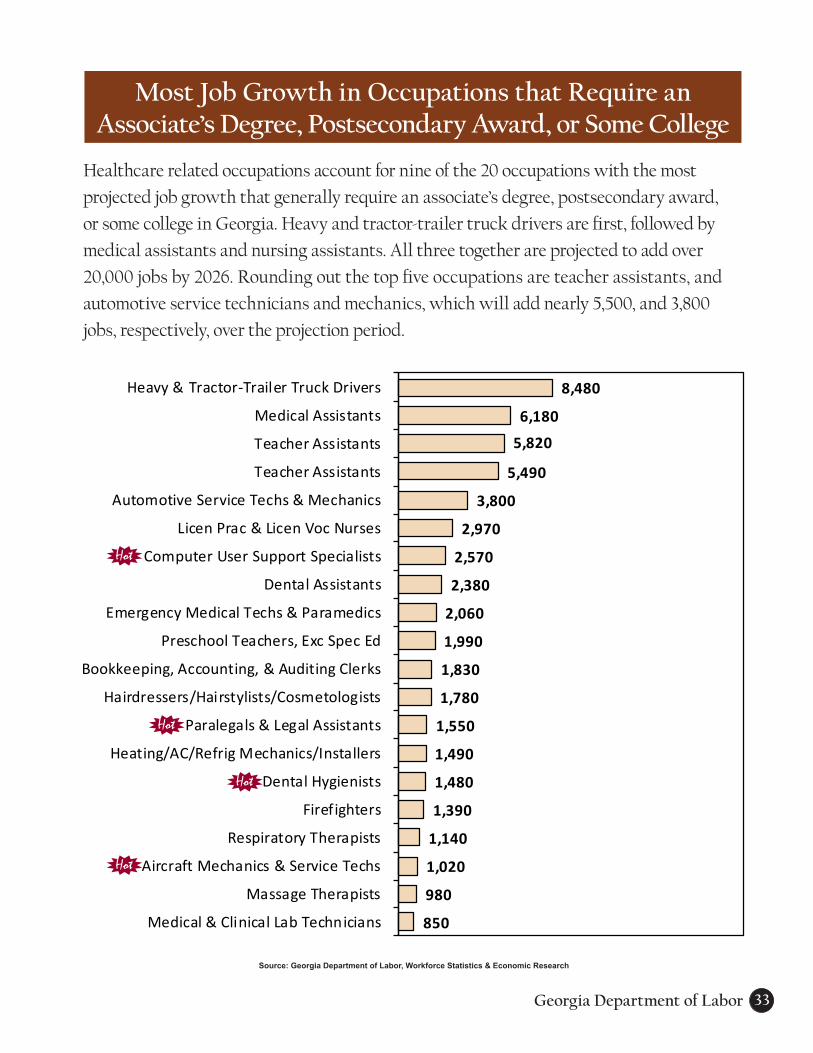
Most Job Growth in Occupations that Require an Associate’s Degree, Postsecondary Award, or Some College
Healthcare related occupations account for nine of the 20 occupations with the most
projected job growth that generally require an associate’s degree, postsecondary award,
or some college in Georgia. Heavy and tractor-trailer truck drivers are first, followed by
medical assistants and nursing assistants. All three together are projected to add over
20,000 jobs by 2026. Rounding out the top five occupations are teacher assistants, and
automotive service technicians and mechanics, which will add nearly 5,500, and 3,800
jobs, respectively, over the projection period.
Hot
Hot
Hot
Hot
Source: Georgia Department of Labor, Workforce Statistics & Economic Research
8,480
6,180
5,820
5,490
3,800
2,970
2,570
2,380
2,060
1,990
1,830
1,780
1,550
1,490
1,480
1,390
1,140
1,020
980
850
Heavy & Tractor-Trailer Truck Drivers
Medical Assistants
Teacher Assistants
Teacher Assistants
Automotive Service Techs & Mechanics
Licen Prac & Licen Voc Nurses
Computer User Support Specialists
Dental Assistants
Emergency Medical Techs & Paramedics
Preschool Teachers, Exc Spec Ed
Bookkeeping, Accounting, & Auditing Clerks
Hairdressers/Hairstylists/Cosmetologists
Paralegals & Legal Assistants
Heating/AC/Refrig Mechanics/Installers
Dental Hygienists
Firefighters
Respiratory Therapists
Aircraft Mechanics & Service Techs
Massage Therapists
Medical & Clinical Lab Technicians
34 Georgia Workforce 2026
Hot
Hot
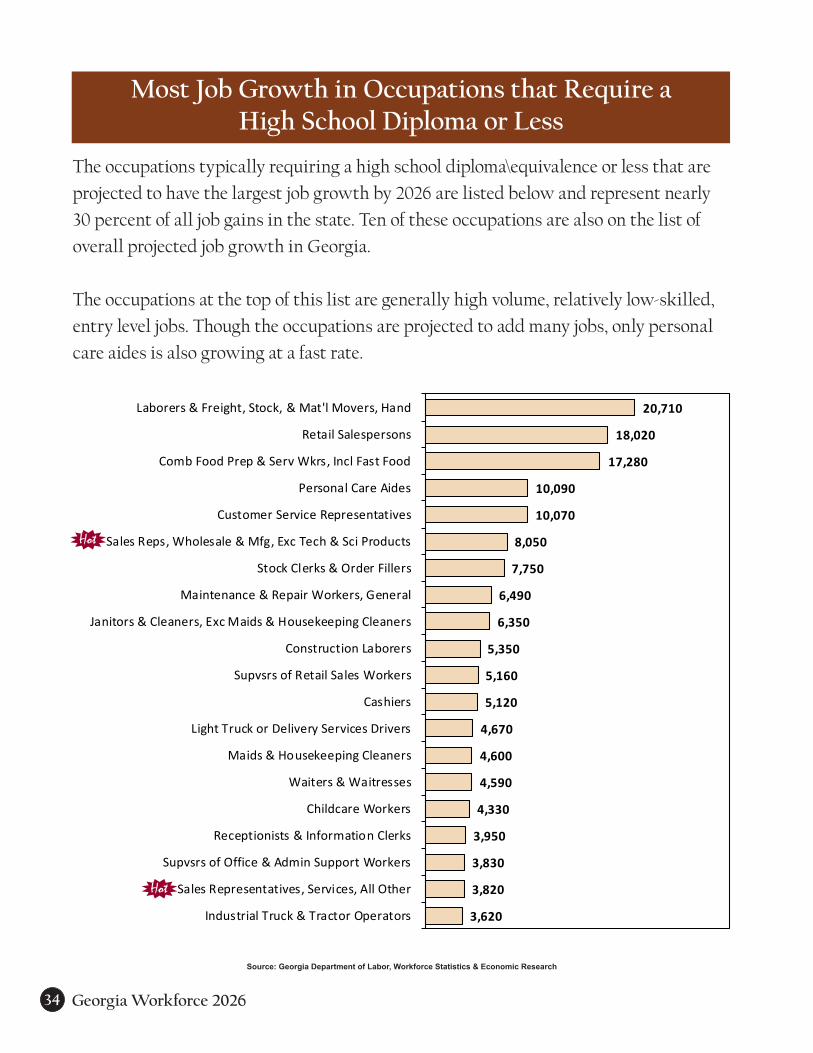
The occupations typically requiring a high school diploma\equivalence or less that are
projected to have the largest job growth by 2026 are listed below and represent nearly
30 percent of all job gains in the state. Ten of these occupations are also on the list of
overall projected job growth in Georgia.
The occupations at the top of this list are generally high volume, relatively low-skilled,
entry level jobs. Though the occupations are projected to add many jobs, only personal
care aides is also growing at a fast rate.
Most Job Growth in Occupations that Require a High School Diploma or Less
Source: Georgia Department of Labor, Workforce Statistics & Economic Research
20,710
18,020
17,280
10,090
10,070
8,050
7,750
6,490
6,350
5,350
5,160
5,120
4,670
4,600
4,590
4,330
3,950
3,830
3,820
3,620
Laborers & Freight, Stock, & Mat'l Movers, Hand
Retail Salespersons
Comb Food Prep & Serv Wkrs, Incl Fast Food
Personal Care Aides
Customer Service Representatives
Sales Reps, Wholesale & Mfg, Exc Tech & Sci Products
Stock Clerks & Order Fillers
Maintenance & Repair Workers, General
Janitors & Cleaners, Exc Maids & Housekeeping Cleaners
Construction Laborers
Supvsrs of Retail Sales Workers
Cashiers
Light Truck or Delivery Services Drivers
Maids & Housekeeping Cleaners
Waiters & Waitresses
Childcare Workers
Receptionists & Information Clerks
Supvsrs of Office & Admin Support Workers
Sales Representatives, Services, All Other
Industrial Truck & Tractor Operators

Georgia Department of Labor 35
More than three of every four new healthcare jobs in Georgia through 2026 are projected
to be in one of the 20 occupations listed below. Registered nurses, the largest health-
care occupation, leads the list in job growth and will add over 13,500 new jobs over the
projection period as the total number of registered nurses will top 87,000 by 2026. All
healthcare occupations listed are expected to grow faster than the state average, reflect-
ing a push toward making healthcare more affordable and more accessible to Georgians.
Most Job Growth in Healthcare Technical & Support Occupations
Source: Georgia Department of Labor, Workforce Statistics & Economic Research
Hot
Hot
Hot
Hot
Hot
Hot
13,510
6,180
5,820
3,080
2,970
2,380
2,060
1,810
1,650
1,630
1,630
1,560
1,480
1,140
980
860
850
850
840
830
Registered Nurses
Medical Assistants
Nursing Assistants
Home Health Aides
Licen Prac & Licen Voc Nurses
Dental Assistants
Emergency Medical Techs & Paramedics
Pharmacy Technicians
Nurse Practitioners
Physician Assistants
Physical Therapists
Physicians & Surgeons, All Other
Dental Hygienists
Respiratory Therapists
Massage Therapists
Pharmacists
Medical & Clinical Lab Technicians
Health Technologists & Technicians, All Other
Med Records & Health Information Techs
Radiologic Technologists
36 Georgia Workforce 2026
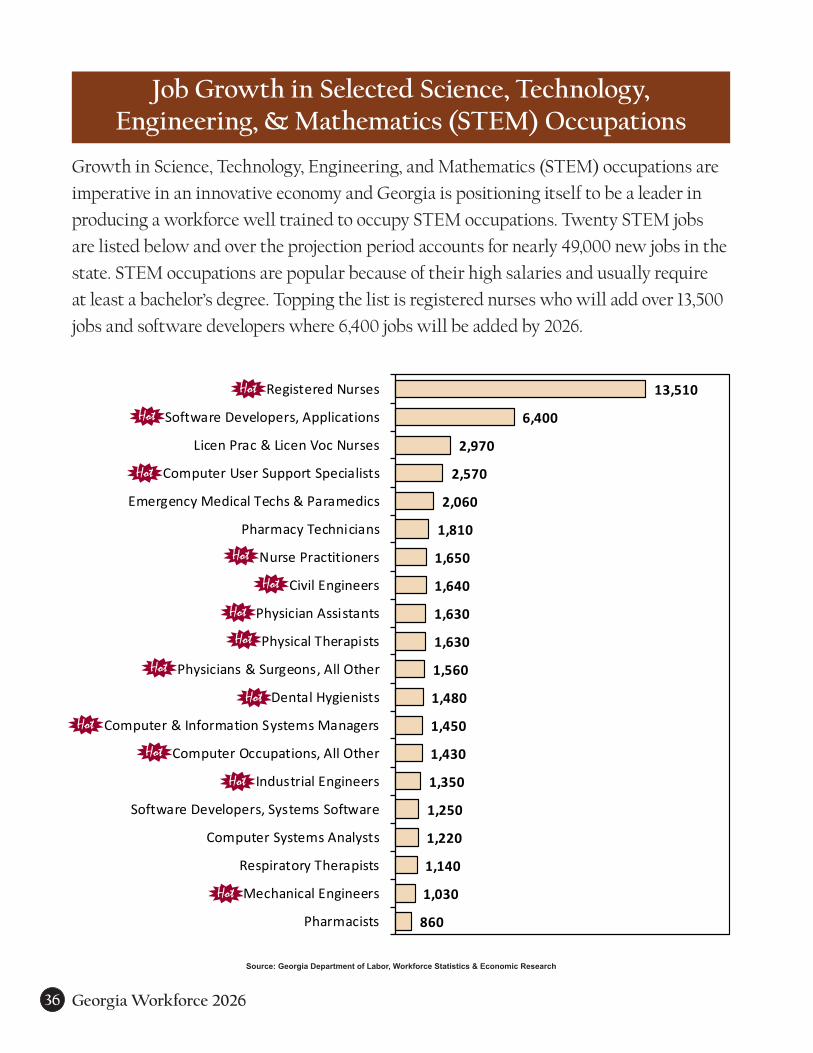
Growth in Science, Technology, Engineering, and Mathematics (STEM) occupations are
imperative in an innovative economy and Georgia is positioning itself to be a leader in
producing a workforce well trained to occupy STEM occupations. Twenty STEM jobs
are listed below and over the projection period accounts for nearly 49,000 new jobs in the
state. STEM occupations are popular because of their high salaries and usually require
at least a bachelor’s degree. Topping the list is registered nurses who will add over 13,500
jobs and software developers where 6,400 jobs will be added by 2026.
Job Growth in Selected Science, Technology, Engineering, & Mathematics (STEM) Occupations
Source: Georgia Department of Labor, Workforce Statistics & Economic Research
Hot
Hot
Hot
Hot
Hot
Hot
Hot
Hot
Hot
Hot
Hot
Hot
Hot
13,510
6,400
2,970
2,570
2,060
1,810
1,650
1,640
1,630
1,630
1,560
1,480
1,450
1,430
1,350
1,250
1,220
1,140
1,030
860
Registered Nurses
Software Developers, Applications
Licen Prac & Licen Voc Nurses
Computer User Support Specialists
Emergency Medical Techs & Paramedics
Pharmacy Technicians
Nurse Practitioners
Civil Engineers
Physician Assistants
Physical Therapists
Physicians & Surgeons, All Other
Dental Hygienists
Computer & Information Systems Managers
Computer Occupations, All Other
Industrial Engineers
Software Developers, Systems Software
Computer Systems Analysts
Respiratory Therapists
Mechanical Engineers
Pharmacists

Georgia Department of Labor 37
__________________________________________________________________________
__________________________________________________________________________
__________________________________________________________________________
__________________________________________________________________________
__________________________________________________________________________
__________________________________________________________________________
__________________________________________________________________________
__________________________________________________________________________
__________________________________________________________________________
__________________________________________________________________________
__________________________________________________________________________
__________________________________________________________________________
__________________________________________________________________________
__________________________________________________________________________
__________________________________________________________________________
__________________________________________________________________________
__________________________________________________________________________
__________________________________________________________________________
__________________________________________________________________________
__________________________________________________________________________
__________________________________________________________________________
__________________________________________________________________________
__________________________________________________________________________

38 Georgia Workforce 2026
__________________________________________________________________________
__________________________________________________________________________
__________________________________________________________________________
__________________________________________________________________________
__________________________________________________________________________
__________________________________________________________________________
__________________________________________________________________________
__________________________________________________________________________
__________________________________________________________________________
__________________________________________________________________________
__________________________________________________________________________
__________________________________________________________________________
__________________________________________________________________________
__________________________________________________________________________
__________________________________________________________________________
__________________________________________________________________________
__________________________________________________________________________
__________________________________________________________________________
__________________________________________________________________________
__________________________________________________________________________
__________________________________________________________________________
__________________________________________________________________________
__________________________________________________________________________
Georgia Department of Labor 39
__________________________________________________________________________
__________________________________________________________________________
__________________________________________________________________________
__________________________________________________________________________
__________________________________________________________________________
__________________________________________________________________________
__________________________________________________________________________
__________________________________________________________________________
__________________________________________________________________________
__________________________________________________________________________
__________________________________________________________________________
__________________________________________________________________________
__________________________________________________________________________
__________________________________________________________________________
__________________________________________________________________________
__________________________________________________________________________
__________________________________________________________________________
__________________________________________________________________________
__________________________________________________________________________
__________________________________________________________________________
__________________________________________________________________________
__________________________________________________________________________
__________________________________________________________________________