georgia department of behavioral health & developmental ... · georgia department of behavioral...
TRANSCRIPT

Georgia Department of Behavioral Health & Developmental Disabilities
2015 INTERIM QUALITY MANAGEMENT REPORT
Prepared by the DBHDD Office of Quality Management August 2015

1
Contents Introduction ..................................................................................................................................... 3
Activities of the Quality Councils................................................................................................... 3
Executive Quality Council .......................................................................................................... 3
Hospital System Program Quality Council ................................................................................. 4
Community Behavioral Health Program Quality Council .......................................................... 5
Developmental Disabilities Program Quality Council ............................................................... 5
Status of Quality Management Work Plan Goals ........................................................................... 6
DBHDD QM Work Plan ............................................................................................................. 7
Hospital System QM Work Plan................................................................................................. 7
CBH QM Work Plan ................................................................................................................... 7
DD QM Work Plan ..................................................................................................................... 7
Key Performance Indicators and Outcomes ................................................................................... 8
Data Collection Plan/Data Definition Document ....................................................................... 8
Dashboards .................................................................................................................................. 9
Hospital System Key Performance Indicators ............................................................................ 9
Community Behavioral Health Program Key Performance Indicators .................................... 10
Developmental Disability Programs Key Performance Indicators ........................................... 12
Administrative Services Organization (ASO) ...................................................................... 15
Quality Monitoring Activities ....................................................................................................... 16
Complaints and Grievances .................................................................................................. 16
Hospital and Community Incident Data January 2015 – June 2015 ..................................... 17
Hospital Peer Review and Credentialing .............................................................................. 24
Hospital Utilization Review .................................................................................................. 24
Adult Mental Health Fidelity Reviews ................................................................................. 24
Quality Service Reviews of Adult Behavioral Health Community Providers ...................... 25
Division of Addictive Diseases (AD) Quality Management Activities ................................ 26
Children, Young Adults and Families Community Mental Health Programs (CYFMH) .... 29
Behavioral Health Mobile Crisis Response System Performance and Quality Monitoring . 30
Mental Health Coalition Meetings ........................................................................................ 31
Residential Support Services Coalition Meeting .................................................................. 31
Behavioral Health Contracted External Review Organization (ERO) ................................. 31
Implementation and Results of Best Practice Guidelines: .................................................... 32
Office of Deaf Services ......................................................................................................... 37

2
Division of Developmental Disabilities ................................................................................ 38
Transitions to the Community and Pioneer Project .............................................................. 38
Data Reliability Process ................................................................................................................ 55
Hospital System KPI Data Integrity ......................................................................................... 55
Community BH Key Performance Indicator Data Integrity ..................................................... 56
DD KPI Data Integrity .............................................................................................................. 56
Summary ....................................................................................................................................... 56
Appendix A DBHDD Quality Management Work Plan............................................................... 58
Appendix B Hospital System Quality Management Work Plan ................................................... 61
Appendix C Community Behavioral Health Quality Management Work Plan ............................ 65
Appendix D Developmental Disabilties Quality Management Work Plan .................................. 67
Appendix E Hospital System KPI Dashboards ............................................................................. 73
Appendix F CBH System KPI Dashboards .................................................................................. 77
Appendix G Developmental Disabilities KPI Dashboards ......................................................... 100

3
Introduction
The Georgia Department of Behavioral Health and Developmental Disabilities (DBHDD) serves
as the single state authority for the provision of direct services, administration, and monitoring of
all facets of the state’s publicly funded behavioral health & developmental disabilities service
system. DBHDD’s role as a direct service provider is limited to the operation of five state
hospital campuses. Outpatient services are delivered by a network of private and public
providers with whom DBHDD contracts. DBHDD Contractors are community-based
organizations which administer behavioral health & developmental disabilities services
throughout the state and are responsible for the provision of comprehensive services for children
and adults with substance abuse disorders, serious and persistent mental illness (SPMI) and
developmental disabilities.
This report is DBHDD’s August 2015 Interim Quality Management (QM) System Report. The
report and the summary of activities contained herein comprise a review of quality management
activities that have taken place in the hospital, community behavioral health and developmental
disabilities systems of care, as well as a review of QM activities at the State Office. It is the
intent of DBHDD to share this report with Department staff and stakeholders.
The primary purpose of this Interim Report is to synthesize and communicate the DBHDD QM
activities taking place across the Department. As a result of data availability, the analysis and
discussion contained within this report will vary, but generally focuses on activities and data
between January 2015 – June 2015.
Activities of the Quality Councils
Executive Quality Council The Executive Quality Council (EQC) is the governing body for the QM program providing
strategic direction and is the ultimate authority for the entire scope of DBHDD QM activities
including the QM plan, the DBHDD work plan and the annual evaluation. The EQC is the
highest-level quality committee in DBHDD. The EQC met in March 2015 and a summary of
some of the key EQC activities that took place during that meeting includes:
Performed its annual review of the QM system.
Discussed the Hospital System revision of their Annual Key Performance Indicators.
The new chairperson of the Community Behavioral Health (CBH) Program Quality
Council (PQC) discussed her vision for the PQC.
Discussed the re-engineering of the DBHDD DD service system.
Reviewed the Office of Incident Management and Investigation’s (OIMI) trends and
patterns.
Received updates from the Hospital, CBH and DD PQCs regarding the quality
management-related work that each functional area prioritized.
Between January and June 2015, the DBHDD conducted significant work related to functional
realignment of many activities of the Department. As a part of this work, two new Divisions, the
Division of Performance Management and Quality Improvement (PMQI) and the Division of

4
Accountability and Compliance (DAC), were created. The Department’s executive team and the
Division Directors for PMQI, DAC, Behavioral Health, Developmental Disabilities and the
Hospital System met regularly and defined the scope of responsibilities for each Division. The
two new Divisions presented and received approval for plans for establishing their offices and
realignment of staff from within the state office and all DBHDD Regional Offices (now Field
Offices) began to occur. The organizational structure for the Division of PMQI includes an
integrated Office of Quality Improvement and the Department created a new Director-level
position to provide oversight and began a national recruiting effort to fill this position. The
individual selected for this position will assume responsibility for the future design and
development activities related to the organization-wide, integrated Quality Management system.
During January and June 2015, the Department’s executive team also made the decision to adopt
the National Quality Strategy and engaged a national expert to assist the Division Director for
Performance Management and Quality Improvement by providing consultation and
recommendations regarding the Department’s quality framework and providing input on the job
description, minimum qualifications, recruiting strategies, and feedback on candidates for the
Director of Quality Improvement.
The Division of PMQI also includes and Office of Performance Analysis and a Director was
hired and a plan for staffing the office with statistical experts and data managers was created.
Three staff have been realigned from other areas within the Department and recruitment began
for a performance analyst position to better meet the needs for statistical and analytical technical
expertise. Additional realignment of staff from other areas is expected. This Office provides
research and data analytical support to the Offices of Quality Improvement and Provider
Network Management as well as to other Divisions and Offices where quality improvement or
program evaluation activities are essential to inform decision-making and planning.
Hospital System Program Quality Council The Hospital System PQC meets bimonthly, and has held 3 meetings between January 2015 and
June 2015. During this period, the HSPQC developed additional Key Performance Indicators
(KPIs) for the Hospital System. In addition, two new discipline committees were created,
Activity Therapy and Environment of Care & Safety to support quality improvement goals of the
Hospital System. As determined by the committees, discipline-specific performance measures
may be created. In the bimonthly meetings, the Hospital System PQC continues to address
patient safety and other performance measures. A brief summary of some of the key Hospital
System PQC activities that took place during those meetings includes:
Reviewed PI initiatives focused on management of aggression, restraint and seclusion,
polypharmacy, consumer satisfaction and other performance measures.
Focused on PI initiatives aimed at reducing incidents of aggression and use of restraint
and seclusion.
Reviewed and modified strategies being utilized by hospital-based PI teams to improve
patient safety.
Addressed data collection methodologies and data integrity issues that affected reporting
timeliness and quality.

5
Reviewed and discussed the Triggers and Thresholds report data, the Hospital System
dashboard measures and specific Hospital System KPI trends and patterns and made
suggestions/recommendations for program/service changes.
Community Behavioral Health Program Quality Council The Community Behavioral Health PQC held one meeting between January 2015 and June 2015.
A brief summary of some of the key CBH PQC activities that took place during that meeting
includes:
Discussed preparations for transitioning some of the quality related work to the new
Administrative Services Organization (ASO).
Discussed strategies to maximize the PQC’s time with relationship to the ASO.
Discussed the national quality framework.
Received an update from the Office of Incident Management and Investigations
comparing community incident data from 2014.
In lieu of the usual monthly BH PQC meeting schedule, BH leadership committed their time to
staff the joint DBHDD/Georgia Collaborative ASO QM Committee whose goal it is to ensure
that the quality management activities of the Georgia Collaborative ASO are implemented in a
manner that is consistent with the Department QM plan, the ASO Request for Proposal (RFP)
and the vendor’s proposal. This workgroup’s meeting schedule is very intensive and includes
joint meetings twice per week with additional ad hoc meetings and workgroups as needed.
The work of this committee during this process involved planning and specification of detailed
IT requirements for the collection of individual outcome indicators (e.g. housing, employment,
functional status, use of hospital services, criminal justice involvement, etc.), creation of new
quality review tools for BH and DD services and designing the methods and processes that will
be used to collect, summarize, and report on information gathered during these quality reviews.
The DD leadership and staff worked alongside the BH leadership and staff to integrate the
quality review processes for BH and DD services as much as was practical and appropriate and
to provide their unique expertise and experience in the development of the Georgia
Collaborative’ s QM activates, tools and processes. The activities during this period concluded
with the performance of the QM Readiness Review in preparation for the go-live of quality
reviews in July 2015.
Developmental Disabilities Program Quality Council The DD Program Quality Council did not meet in the first half of 2015 however quality data was
shared with DD Leadership. Like the Division of BH, leadership and staff from the Division of
DD, devoted significant resources to the joint DBHDD /Georgia Collaborative ASO QM
workgroup during this review period. See above for description of these activities during this
period.
Each of the Regional and Statewide QI Councils met at least once during the period of January
2015 through June 2015. All the Councils convened in October for their annual group
conference. Data from the FY14 Quality Assurance Report was shared and discussed with the
Councils. Each Council had a chance to begin developing their 2015 work plans based on their

6
respective regional data. Additionally, each Council presented on the quality improvement
projects that they completed in FY14. Examples of those presentations can be found at:
http://www.dfmc-
georgia.org/quality_improvement_council/project_plan_presentations/index.html.
The Statewide Quality Council met once between January and March 2015. In partnership with
the Division of DD, the Statewide Council began work on the development of a QI Council
Communication Plan. This plan will improve the dissemination of information regarding the
activities of the Statewide and Regional Councils. The plan will also improve communication
among the Councils themselves. All Regional QI Council Co-Chairs continue to participate in
the Statewide Council meetings. An invitation was extended to all Regional QI Council Co-
Chairs to become members of the Statewide QI Council. The Regional Co-Chairs attended the
December 2014 Statewide Council meeting.
The Statewide QI Council continued to provide support to the Division concerning the Transition
Plan for the Home and Community Based Waivers. Support included education of community
stakeholders and providers concerning the plan and data collection.
Regional QI Council Initiative Updates:
Region 1 Researching the implementation of peer-to-peer support groups for IDD providers and
possibly partnering with an advocacy agency on this initiative.
Region 2: Working with the Abuse, Neglect, and Exploitation (ANE) Advocators to work on
Choice.
Region 3: Doing a mini pilot of a training program to educate individuals and families on
Choice.
Region 4: Developing resources in each county to share with people who have limited access to
services.
Region 5: Conducting Provider fairs to educate individuals and families on the type of supports
and services that are available in the region.
Region 6: Working with local physicians and health professionals to provide technical
assistance on education concerning the needs of individuals transitioning to the community.
Status of Quality Management Work Plan Goals Each Program Quality Council developed a work plan to guide the quality management activities
within its area of responsibility. The EQC defines the work plan for the Department through the
DBHDD QM Work Plan and then the Program Quality Councils develop program-specific work
plans for the hospital system, the community behavioral health and developmental disabilities
service delivery systems.

7
Below are descriptions of the status of each functional area’s work plan and the progress toward
achieving the work plan goals for each Quality Council:
DBHDD QM Work Plan
As of July 2015 the DBHDD QM Plan and Work Plans were in the process of being updated.
For the purposes of this Interim Report the existing QM Plan and Work Plans have been utilized.
Overall, the tasks in the first goal related to accurate, effective and meaningful performance
indicators have been met.
The second goal is related to the education of stakeholders regarding QM. As of July 2015 the
DBHDD QM Learning Plan will be delayed pending the hiring of a new Director of QI, but once
finalized will be included in a revised QM Plan.
The third goal related to implementing the outcomes framework has been completed but it is
anticipated that it will be revised during the latter part of 2015 using the National Outcomes
Framework as a model.
Component parts of the fourth goal related to IT data systems have been completed but as the
result of IT leadership changes there have been changes in tasks and projects, which will be
reflected in an updated QM Plan.
The following are summaries of the activities related to each PQC’s QM work plan which
support the goals of the DBHDD’s QM Work Plan. See Appendix A.
Hospital System QM Work Plan
The Hospital System is working to maintain and improve quality as it assists in DBHDD’s
strategic direction toward building community-based services while reducing its dependence on
state hospitals. As the System's hospitals are reduced in size, closed and/or repurposed, it is
essential that an effective quality management system is maintained so that those transitions are
managed in a way that assures that individuals receive the quality of service they deserve. At the
time of this report, the progress with regard to the identified goals was consistent with the current
plan. See Appendix B.
CBH QM Work Plan Progress towards meeting the goals is consistent with the plan except for the items in Goal 2
related to QM training plans for providers and individuals served and for Goal 4, which is related
to integration of QM data systems. Progress on Goal 4 is behind schedule due to the ASO
implementation, which will provide enhanced data integration and reporting to support the
Department and providers’ QM systems. See Appendix C for the CBH QM Work Plan.
DD QM Work Plan The Developmental Disabilities quality management work plan continues to support the
DBHDD QM work plan and addresses the need to ensure that individuals with I/DD who
transition out of state hospitals receive the highest quality of services and achieve their goals
once in the community. The I/DD Work Plan strives to assure that individuals living in the

8
community receive the highest quality services and supports in the least restrictive environment.
Progress toward meeting the goals of the DD work plan is consistent with the plan’s targeted
timelines. Some Target Completion dates were extended based on the Georgia Collaborative
Timeline, See Appendix D.
The Division of DD continues with its Re-Engineering Project that is evaluating how IDD
functions at both a systemic and support provision level. The Division formed the following five
workgroups:
Health and Wellness: The Health and Wellness committee has focused on developing
policies for both new Behavioral Support and Consultation Services and Nursing
services. The committee has formed two sub-committees for these two clinical
areas. The committee has also drafted policies for use of the HRST and assisted in the
development and implementation of the new Integrated Clinical Support Team.
Support Coordination: Reviewed present support coordination responsibilities, and
developed a “Pioneer Project” to improve the quality of transitions from State Hospitals
to the Community. More information on the Pioneer Project can be found under “DD
Transition Quality Review Analysis”. Additionally, a program was developed for the
improvement of Support Coordination which was entitled “Enhanced Support
Coordination.” This was to include pre-transition and post transition activities. A key
component of this was early engagement by Support Coordination and also included
broader service delivery post transition. A new model of monitoring identified as
“Recognize and Refer” was used to encourage collaboration and improvement of service
delivery rather than punitive ratings. Referrals could be of the clinical or nonclinical
nature.
Continuous Quality Improvement: Reviewed current QM practices, developed draft IDD
Performance Indicators with the input from external and internal stakeholders; developed
a Mortality Review Report that will be disseminated in the latter half of Calendar Year
2015; and assessed current data collection protocols.
Competency-Based Training: Reviewed current training practices; assessed training
needs; provided training supports to the five workgroups, plus regional and state staff.
Individual and Community Supports: Conducted quarterly sample reviews of transitions
that have occurred utilizing standardized performance assessment tools; developed an
efficient process to ensure funding transfers for community placements; analyzed trends
in provider data to determine key courses of action to be taken by Performance
Management Unit or other relevant units. See Appendix D for the DD work plan.
Key Performance Indicators and Outcomes
Data Collection Plan/Data Definition Document The data definition document is used by each of the three functional QM areas within the
Department and provides guidance on how each element and attribute of KPIs should be used. It
gives details about the structure of the elements and format of the data. Additionally the
Performance Measure Evaluation Tool (PMET) is used when evaluating existing or developing
new KPIs.
9
Dashboards The KPI dashboard format incorporates KPI data in table and graph form, provides measure
definition & explanation, a numerator and denominator explanation and an analysis of the KPI
for the time period. The KPI dashboards can be found in Appendices E, F and G.
Hospital System Key Performance Indicators
The key performance indicators utilized by the Hospital System are a combination of quality
measures that support the System’s value of three priority areas:
1. The use of consumer feedback to reflect the quality of our services
a. Client Perception of Outcome of Care
i. Summary comments and analysis: The DBHDD Hospital System
facilities have consistently scored higher than the baseline established
on the basis of the national averages for the same survey tool. The
hospital Quality Management departments are looking at ways to
improve the consistency and timeliness of reporting and the
consistency and quality of the methods of administration of the survey
instruments.
b. Client Perception of Empowerment
i. Summary comments and analysis: The DBHDD Hospital System
facilities have consistently scored higher than the baseline established
on the basis of the national averages for the same survey tool. The
hospital Quality Management departments are looking at ways to
improve the consistency and timeliness of reporting and the
consistency and quality of the methods of administration of the survey
instruments.
2. The importance of continuity of care with regard to the transition of consumers
between hospital and community services
a. Continuing Care Plan Created (Overall)
i. The Hospital System has managed to reduce the variation it
experienced in the previous six month period, and achieved a more
consistent overall improvement trend to a level that is well within the
target range for this measure.
3. The importance of supporting the recovery of individuals receiving BH hospital
services
a. Individual Recovery Plan Audit - Quality Measure
i. Summary comments and analysis: As was reported in the previous
QM system review, the Hospital System has continued to achieve a
gradual overall positive trend. While the gradual improvements
reflected in these data indicate that the current strategy has been
effective, the Hospital System PQC is currently looking to develop
new qualitative measures that will provide additional information on
the extent to which the System is meeting its goal of being a recovery-
oriented system of care.

10
The Hospital System plans to continue to monitor and improve the quality of care measured by
these KPIs and to utilize additional measures to provide feedback on other aspects of quality.
The hospital system dashboard can be found in Appendix E.
Community Behavioral Health Program Key Performance Indicators Summary and Recommendations for the current CBH KPIs:
1. Georgia Housing Voucher Program adult individuals with serous and persistent mental
illness (SPMI) in stable housing
Summary comments and analysis: The number of individuals receiving Georgia
Housing Vouchers who are in stable housing has significantly exceeded the HUD
standard of six months and DBHDD’s target of 77% for the January 2015 to June
2015 time period, and appears to be stable at approximately 92%.
2. Georgia Housing Voucher Program adult individuals with SPMI who left stable housing
under unfavorable circumstances and have been reengaged and reassigned vouchers
Summary Comments and analysis: DBDD tracks Georgia Housing Voucher
individuals who left stable housing under unfavorable circumstance and were
reengaged in services. Between January – June 2015 this KPI appears stable
averaging between approximately 18 – 19% which exceeds the target of 10%.
This KPI will continue to be monitored.
3. Adult Mental Health supported employment providers that met a caseload average on the
last day of the calendar month of employment specialist staff to consumer (1:20 and
under):
Summary Comments and analysis: The target of 85% or more has not been met
during this reporting period. Between January – March 2015, two providers
indicated that they will be performing additional training with their clinical staff
about SE options for consumers who indicate the desire to work as they have not
been receiving internal referrals from new clinicians.
4. Individuals who had a first contact with a competitive employer within 30 days of
enrollment
Summary Comments and analysis: The overall percentage of consumers who had
first contact slightly decreased in comparison to the previous two quarters, but
still exceeded the target of 75%. This measure is analyzed on a 30 day lag and
April 2015– June 2015 data was not available for analysis as of the date of this
report.
5. Assertive Community Treatment consumers who are received into services within 3 days
of referral
Summary Comments and analysis: The target of 70% was met during the months
of February, March, April and May 2015 (June data was not available at the time
this report was released).
6. Assertive Community Treatment consumers with a Psychiatric Inpatient admission
within the past month
Summary Comments and analysis: The target of 7% or less was not met for this
reporting period but shows a slight downward trend in hospital utilization for the
month of May. Some providers indicate that new or acute consumers may be
admitted more frequently and may benefit from respite in place of psychiatric
admission.

11
7. Average number of jail/prison days utilized per enrolled Assertive Community Treatment
consumer
Summary Comments and analysis: The target of 1 day or less was met for
January, February and May 2015. There was a slight spike in jail utilization
during the month of April.
8. Intensive Case Management consumers with a Psychiatric Inpatient admission within the
past month
Summary Comments and analysis: For this reporting period overall the target of
5% or less was not met for the months of February, April and May, however the
percentages appear slightly better than previous quarters.
9. Intensive Case Management consumers housed (non-homeless) within the past month
Summary Comments and analysis: Overall the target of 90% or more was met
during this reporting period.
10. Average number of jail/prison days utilized per enrolled Intensive Case Management
consumer
Summary Comments and analysis: The target of .25 days or less was not met for
this reporting period. This KPI will continue to be monitored.
11. Community Support Teams with a Psychiatric Inpatient admission within the past month
Summary Comments and analysis: Overall the target of 10% or less was met
during this reporting period.
12. Community Support Team consumers housed (non-homeless) within the past month
Summary Comments and analysis: Overall the target of 90% or more was met
during this reporting period.
13. Average number of jail/prison days utilized per enrolled Community Support Team
consumer
Summary Comments and analysis: Overall the target of 0.75 days or less was met
for all months during this reporting period except for May which shows a slight
upward trend. This trend pattern is consistent with the same time period from
2014.
14. Case Management consumers with a Psychiatric Inpatient admission within the past
month
Summary Comments and analysis: Overall the target of 5% or less was met
during this reporting period.
15. Case Management consumers housed (non-homeless) within the past month
Summary Comments and analysis: Overall the target of 90% or more was met
during this reporting period.
16. Average number of jail/prison days utilized per enrolled Case Management consumer
Summary Comments and analysis: Overall there continues to be some variability
in the average number of jail/prison days utilized during this time; which was met
for all months except April which at .26 just missed the target of .25 days or less.
17. Percent of Adult Addictive Disease consumers active in AD treatment 90 days after
beginning non-crisis stabilization services
Summary Comments and analysis: This KPI became effective in July 2013 and is
collected on an annual basis. It is anticipated that 2015 data will become
available in October 2015.

12
18. Percent of Adult Addictive Disease consumers discharged from crisis or detoxification
programs who receive follow-up behavioral health services within 14 days.
Summary Comments and analysis: This KPI became effective in July 2013, is
collected on an annual basis. It is anticipated that 2015 data will become
available in October 2015.
19. Percent of Individuals who are enrolled in services and were included in a review or
audit who state they are satisfied with the services they are receiving
Summary Comments and analysis: This measure was met during the time frame.
20. Percent of Individuals who are enrolled in services and were included in a review or
audit who feel their quality of life has improved as a result of receiving services
Summary Comments and analysis: This measure was not met during the time
frame. A review of individual’s answers did not indicate a particular pattern and
responses to why they felt their quality of life had not improved were varied.
21. Percent of youth with an increase in functioning as determined by a standardized tool
Summary Comments and analysis: The Department is transitioning from the
Child and Adolescent Functional Assessment Scale (CAFAS) to the Child and
Adolescent Needs and Strengths (CANS). The implementation of the CANS is
scheduled for October 2015. Data collection for this KPI will begin in FY16.
22. Percent of families of youth satisfied with services as determined by their parent or legal
guardian using a standardized tool
Summary Comments and analysis: This data is collected and analyzed on an
annual basis. In 2014, 84% of families of youth were satisfied with the
community mental health services they received.
The Community Behavioral Health dashboard can be found in Appendix F.
Developmental Disability Programs Key Performance Indicators
In July of 2014, the Division of DD convened a stakeholder work group which included
representation from providers, self-advocates, family members, support coordination, advocacy
agencies, and DBHDD staff, to recommend quality Outcome and Performance Indicators. The
indicators focus on the quality of services provided by DD Providers and the Division itself. DD
will use some of these indicators as KPIs for Providers and the DD system itself. At the time of
this report, the indicators were being finalized. Examples of draft outcomes and indicators
include:
Outcome: People have timely access to needed services
o Performance Indicator: Average number of days between approval of a Prior
Authorization and services beginning
Outcome: People are connected to their community
o Performance Indicator: Proportion of individuals who have established at least
one non-paid/non-family community relationship.
The Performance Indicators are currently undergoing review by DBHDD Leadership. Once
approved, the goal is to begin gathering data from various sources. An example of a data source
would be Quality Enhancement Provider Reviews that are conducted by the Georgia
Collaborative ASO.

13
Person Centered Supports Each individual’s team of supports meets annually to develop an ISP that is person centered and
supports the individual’s needs and desired goals. An ISP QA Checklist tool was initially
developed by the Department to ensure the ISP includes all necessary requirements as dictated
by DBHDD, and that it helps ensure the individual has a healthy, safe, and meaningful life.
Please see Section entitled DD Individual Support Plan Quality Assurance (ISP QA) Checklist
on page 40 for a detailed description on ISP Quality Assurance.
Health and Safety
The Division of DD utilizes the National Core Indicator Survey to gather directly from
individuals and their families, the satisfaction they feel with their services and supports and to
gather additional data on the health and safety of those individuals. The Division of DD received
the latest Georgia NCI data, which is for 2012 – 2013, in mid-July 2014.
In 2014, 40 states participated in the NCI Project. The latest Georgia NCI data (2013-2014) was
released in January 2015. Georgia’s NCI reports can be found at:
http://www.nationalcoreindicators.org/states/GA/
Georgia is performing at or above the National Average in the majority of the sub-domains for
the NCI Consumer Survey.
Georgia is above NCI Average in Choice, Community Inclusion, Work, and Health and
Safety.
Georgia is below the National Average for individuals who are self-directing their
services; individuals who have had Vision-Hearing Screenings; and annual dental
examinations. DBHDD continues to educate individual/families and support coordination
agencies on the option of self-directing services. DBHDD has implemented processes to
conduct hearing assessments on all individuals currently in service who report having
some form of hearing impairment, as well as all individuals entering into services.
Georgia is below average on several indicators for NCI Adult Family Survey. These areas
include service coordinators informing families of services available, individuals having service
plans, services and supports changing when family needs change, and transition from school to
adult services.
Efficiency of Services
In 2011, as part of the Settlement Agreement and as a direct result of the prohibition on DD
individuals being admitted to state hospitals, the Division of DD created the Georgia Crisis
Response System for Developmental Disabilities.
The goal of this system is to provide time-limited home and community based crisis services that
support individuals with developmental disabilities in receiving crisis supports in the least
restrictive environment possible, and provide alternatives to institutional placement, emergency
room care, and/or law enforcement involvement (including incarceration). These community
based crisis services and homes are provided on a time-limited basis to ameliorate the presenting

14
crisis. The system is to be utilized as a measure of last resort for an individual undergoing an
acute crisis that presents a substantial risk of imminent harm to self or others.
The Georgia Crisis Response System (GCRS) includes intake, dispatch, referral, and crisis
services components. An essential part of this system is the assessment of the individual
situation to determine the appropriate response to the crisis. Entry into the system takes place
through the Single Point of Entry (SPOE) system. Intake personnel determine if an individual
meets the requirements for entry into the system and initiate the appropriate dispatch or referral
option. If a Developmental Disability (DD) Mobile Crisis Team is dispatched to the crisis
location, this team assesses the need for a referral or crisis services. Crisis services include
intensive on-site or off-site supports.
Two main components of the system are Intensive In-Home Supports and Intensive Out of Home
Supports.
The intent of Intensive In-Home Support is to stabilize the individual through behavioral
intervention strategies provided under the recommendations of the DD Mobile Crisis Team. The
services are provided in the individual’s home and may be provided 24/7 for a limited period of
time. During the first half of 2015, 5% of crisis incidents resulted in the need for intensive in-
home supports. Utilization of the intensive in-home supports has been consistent (5%-6%) over
the last 12 months.
The intent of Intensive Out-of-Home Supports is to stabilize the individual through nursing and
behavioral supports, on a time-limited basis. Intensive Out-of-Home Supports are provided in
one of 11 Crisis Support Homes strategically located across the state. An additional 12th
Crisis
Support Home is currently in development, and will become operational in the latter half of
calendar year 2015. During the first half of 2015, 8% of crisis incidents resulted in the need for
intensive out-of-home supports. This was a drop of 4% Utilization of Crisis Support Homes
compared to last quarter of 2014, but the drop was not significant compared with the last three
quarters of data. The use of the homes continues to be higher than the use of Intensive In-home
Supports, which is not a goal of the crisis system. A new Crisis Services Coordinator has
recently been hired. One of the responsibilities of this position is to review the entire DBHDD
crisis system and address areas where improvement is needed. The work of this position will be
reported in the 2015 Annual Report.
Crisis data shows that the system is operating as it should, with the individual receiving crisis
supports in the least restrictive environment as possible; however, there is a statewide lack of
Respite (Emergency and Planned) Services. This lack of services directly results in individuals
being placed in Crisis Support Homes, when there are no other supports available. The Division
is currently evaluating and attempting to increase its Respite Services capacity.
DBHDD continues with the challenging work of supporting dually diagnosed individuals. The
Department has implemented a statewide Mobile Crisis Response System for individuals with
behavioral health issues, and the Division of DD is partnering with the Division of Behavioral
Health to address this shared population. The implementation of the Georgia Collaborative will
help with addressing the person as a whole, with the capacity to review all supports and needs of

15
an individual. A Director of Crisis Services Coordination was hired in June of 2015. This new
position will be responsible for the coordination of both the BH and DD Crisis System. It is a
goal of DBHDD that eventually there will be an integrated Crisis System to address both
populations of individuals.
Administrative Services Organization (ASO) A key goal of the Georgia Department of Behavioral Health and Developmental Disabilities
is to improve access to high-quality and effective services for individuals with developmental
disabilities (DD) and/or behavioral health (BH) conditions. To help achieve this goal, in
September of 2014 the Department completed the procurement of an Administrative Services
Organization (ASO). The Department contracted with ValueOptions, which has undergone a
merger and is now Beacon Health Options.
This contract combined several important functions that were previously provided in several
distinct contracts. Those functions include:
BH External Review Organization
Georgia Crisis and Access Line
DD Quality Management System
DD Consumer Information System
Some highlights of the ASO functions include:
Maintaining a 24/7 crisis and access line for behavioral health and developmental
disability services.
Creating a single information technology system for behavioral health and developmental
disability services.
Using state-of-the-art technologies to create efficiencies and improve the quality of care.
Performing on-site quality reviews of both behavioral health and developmental
disabilities services.
Providing an integrated and effective platform for monitoring the department’s quality
management plan.
Providing focused utilization management and review services for intensive services and
a streamlined process for less intensive services.
One of the Georgia Collaborative ASO’s initiatives is to design and develop a new case
management system for the Division of DD. One aspect of the new system will be the
development of a new electronic Individual Support Plan or “eISP”. In the first half of 2015, the
Division of DD implemented 9 teams of internal stakeholders to review the existing case
management system and ISP, and make recommendations for the new case management system
development. For example, one team was tasked with reviewing all current assessment
templates and making changes where needed. Another team was tasked with reviewing and
updating the current Support Coordination monitoring tools. There is also a team specifically
focused on the development of the new eISP. All teams have a goal of completing their work
prior to the end of 2015. All recommendations will then be submitted to the Georgia
Collaborative ASO to begin programming the new system.

16
For additional information about the ASO please click on the following link:
https://dbhdd.georgia.gov/administrative-services-organization. The ASO began a phased go-live
with operations beginning on July 1, 2015.
Quality Monitoring Activities
Complaints and Grievances Constituent Services is a function of the Office of Public Relations (OPR) and serves as the
liaison to consumers, families, advocates, and the general public for assistance with complaints,
grievances, and inquiries relative to the department and community services. In addition, the
office collects and reports data to executive staff via the Executive Quality Council regarding
issues and resolutions of consumer concerns.
Constituent Services staff received 79 complaints, grievances and inquiries between January 1,
2015 and June 1, 2015. Of the 79 complaints received there were 21 issue categories, as
illustrated in the following table:
Issue Categories
Addictive Diseases Human Resources
Adult services and community care placement
DUI Intervention
Termination – Hospital employee
Developmental Disabilities Mental Health
Complaint about provider services
Exceptional Rate
NOW & COMP Waiver need for funding
Access to services
Complaint – Community psychologist
Complaint - provider services
General Information about services
Housing
Inpatient evaluation /discharge
Long-term intensive patient treatment
Residential placement
NOW & COMP Waiver eligibility
Planning List
Residential placement
Request to change services or provider
Self-Directed Services - budget
Provider Network Management
Provider application process
Provider certification
Mental health services was the most frequent issue category cited during this time, totaling forty
(40) cases or fifty-one percent (51%) of all inquiries received. Of the forty cases, twenty-eight
(28) were triaged and sent to the six regional offices, as well as state office staff, to address and
respond to OPR within 5 to 7 business days. The other twelve mental health inquiries were
triaged to Georgia Regional Hospital in Atlanta, East Central Regional Hospital in Augusta and
West Central Georgia Regional Hospital in Columbus. The primary concerns of individuals
advocating for mental health services on behalf of another person were access to community
services, access to inpatient treatment and the need for long-term intensive inpatient treatment.

17
The second most frequent issue of concern was related to developmental disabilities services.
Thirty-four percent (34%) of the developmental disability complaints/inquiries were pertaining
to the need the New Options Waiver (NOW) and the Comprehensive Supports Waiver (COMP)
program. Thirty-one (31) inquiries received were related to developmental disabilities and were
received from family members, friends or an advocate of the individual who was the subject of
the inquiry.
Thirty-nine percent (39%) of all inquiries were referred from the Governor’s Office or by
members of the Georgia General Assembly. In some instances, individuals contacted the
Governor’s Office as well as their legislator resulting in duplicate inquiries. Many of these
inquiries cited the need for additional waiver funding.
In efforts to improve the overall constituent services process, the Department’s Office of
Information Technology is currently developing a secure case-management system to manage all
incoming constituent service inquiries. The system will incorporate a user-friendly, web-based
intake form on the department’s website. Additionally, the system will protect against data-loss,
provide status updates to those making inquiries, and provide staff with the ability to produce
customized reports of cases managed.
OPR and Constituent Services will continue to analyze complaint/grievance trends and patterns,
which can be used for service and program improvement.
Hospital and Community Incident Data January 2015 – June 2015 DBHDD requires its contractors to report incidents per Policy 04-106, Reporting and
Investigating Deaths and Critical Incidents in Community Services, and DBHDD hospitals per
Policy 03-515, Incident Management in Adult Mental Health and Forensic Units and Policy 03-
615, Incident Management in DBHDD Skilled Nursing Facilities and Intermediate Care
Facilities for Individuals with Intellectual Disabilities. Contractors and Hospitals are required to
report significant and/or adverse incidents for all individuals served. These reports are submitted
to DBHDD, Office of Incident Management and Investigations (OIMI). OIMI staff review all
submitted reports for identification of potential quality of care concerns. The quality of care
concerns are triaged for investigation either at the State or Contractor level.
The following incident review covers critical incident reports received in the Office of Incident
Management and Investigations from January 1, 2015, through June 30, 2015. The total
incidents received by month for hospitals and community providers are included in Tables 1 and
3 below. The tables also provide a comparison for the current report period (January 2015 –
June 2015) with the prior six-month period (July 2014 – December 2014).
Hospital Incident Data
As Table 1 indicates, the total number of hospital incidents for the report period was 4,144, or a
rate of 20.32 per 1000 patient days, compared to the prior 6 months of 3,427, or rate of 16.45 –
an increase in the rate of incidents of 20.9%. A contributing factor to the rate increase between
the two report periods is a spike in reporting A42-Minor Occurrence Injuries which increased
from 121 to 387 or 219.8% - the preponderance reported by ECRH. It is hypothesized that this
increase is due to training related to identification and reporting of minor occurrence injuries.

18
Another category that saw an 89.3% increase from the prior report period was A2-Aggressive
Act to Self - increasing from 206 to 309 across all hospitals.
NOTE: The rate is used to adjust for differences in the size of the patient population by taking
total incidents divided by Occupied Bed Days (OBD) multiplied times 1000. OBD was not
available for June 2015 at the time of this report so an average of the previous bed days was
used. All rates in this report have been rounded to the nearest tenth or hundredth; therefore, any
calculations performed using the rounded numbers presented here will result in minor
differences when compared with the numbers within this report.
Table 1: Total Incidents by Month
HOSPITAL Incidents
Jul-14 Aug-14 Sep-14 Oct-14 Nov-14 Dec-14
Total Jul-Dec
2014
532 544 548 615 605 582 3427
Jan-15 Feb-15 Mar-15 Apr-15 May-15 Jun-15
Total Jan-Jun
2015
704 641 691 678 652 778 4144
HOSPITAL RATE (Incidents per 1000 patient days)
Jul-14 Aug-14 Sep-14 Oct-14 Nov-14 Dec-14
Avg. Jul-Dec
2014
14.98 15.48 16.07 17.57 17.96 16.72 16.45
Jan-15 Feb-15 Mar-15 Apr-15 May-15 Jun-15
Avg. Jan-Jun
2015
20.18 20.31 19.84 19.94 18.81 22.89 20.32
The five hospital incidents most frequently reported during this review period are listed below in
Table 2. Incident types A04 and A03, “Aggressive act to staff-Physical” and “Aggressive act to
another individual-Physical”, occurred more often than all others and account for 47% of the
total number of incidents reported. The incident rate for “Aggressive act to staff-Physical”
increased from a rate of 4.25 per 1000 patient days to a rate of 4.84 compared to the prior six
months – a 14.1% increase. “Aggressive acts to another individual-Physical” increased from
4.08 per 1000 patient days to 4.63 – an increase of 13.5%. Incident Types A02 “Aggressive act
to self”, A01 “Accidental Injury”, and A42 “Minor Occurrence Injury”, round out the most
frequently reported hospital incidents. These five incident types account for 74% of the total
number of incidents reported.
Table 2: Most Frequently Reported Hospital Incidents (updated 7/6/2015)
Hospital Incident Type Total
Rate (incidents
per 1000 patient
days
A04-Aggressive act to staff-Physical 988 4.85
A03-Aggressive act to another individual-Physical 945 4.63
A02-Aggressive act to self 390 1.91
A42-Minor Occurrence Injury 387 1.90

19
A01-Accidental Injury 381 1.87
Community Incident Data
Unlike the Hospital System data, which uses patient days as a (common) denominator, there is
no such equivalent on the Community provider side. It is much more challenging and less
reliable to estimate the “patient population” for the diverse and changing numbers of community
programs. Therefore, any interpretation of the comparison data reported in this section should be
done with that caveat in mind.
The total community incidents for the report period were 1,930 compared to the previous 6
months of 1,949, reflecting a decrease of less than 1% (reporting as of 7/6/2015).
Table 3: Total Community Incidents by Month
Jul-14 Aug-14 Sep-14 Oct-14 Nov-14 Dec-14 Total
320 314 317 344 318 336 1,949
Jan-15 Feb-15 Mar-15 Apr-15 May-15 Jun-15
324 308 336 350 341 271 1,930
See Table 4 below for the five most frequently reported community incident types.
Table 4: Most Frequently Reported Community Incidents (updated 7/6/2015)
Community Incident Type Total
C-Hospitalization of an Individual in a community residential program 655 C-Incident occurring in the presence of staff which requires intervention of law
enforcement services* 325
C-Individual injury requiring treatment beyond first aid 310
C-Alleged Individual Abuse-Physical 278 C-Individual who is unexpectedly absent from a community residential program or
day program 267
*The second most frequently reported incident type is actually C-Deaths (Category III); however these
deaths are not investigated, therefore they are not included here. NOTE: Category I and Category II
deaths are investigated per policy. See definitions below from policy, 04-106, Reporting and
Investigating Deaths and Critical Incidents in Community Services for definitions of each.
Death-Unexpected (Category I): An unexpected death is when the cause of death is not
attributed to a terminal diagnosis or diagnosed disease process where the reasonable
expectation of the outcome is death.
Includes the death of any individual:
Receiving residential services or receiving 24/7 community living support
Occurring on site of a community provider
In the company of staff of a community provider
Absent without leave from residential services.

20
Death-Expected (Category II): An expected death is when the cause of death is attributed to a
terminal diagnosis or diagnosed disease process where the reasonable expectation of the
outcome is death.
Includes the death of any individual:
Receiving residential services or receiving 24/7 community living support
Occurring on site of a community provider
In the company of staff of a community provider
Absent without leave from residential services.
Death (Category III) Death: The death of any individual enrolled with DBHDD and actively
receiving services. Excludes deaths defined as Category I-Unexpected, Suicide and Category II-
Expected. Includes the death of an individual receiving DD self-directed services.
Community Incident Data – Behavioral Health Services
Community behavioral health providers reported 579 critical incidents during this report period
or 30% of the total number of community incidents. The incident types requiring an
investigation and reported most frequently for Behavioral Health were: “Hospitalization of an
Individual in a community residential program”, “Incident occurring in the presence of staff
which requires intervention of law enforcement services”, “Individual who is unexpectedly
absent from a community residential or day program”, “Alleged Individual Abuse-Physical”, and
“Individual injury requiring treatment beyond first aid”.
“Hospitalization of an individual in a community residential program” was reported more
frequently than all other community incident types and decreased 22% from the prior six-month
period. Review of these reports indicates that most are reports of appropriate transfers of
individuals from crisis stabilization units to state hospitals when additional treatment is needed.
With the closure of an additional state hospital in December 2013 and the increase in availability
of crisis stabilization units, this increase is not considered to be significant or unexpected.
Consideration is being made to whether this type of transfer from crisis residential care to state
hospital care should continue to be classified as an incident because it is not consistent with the
original intent of the indicator. The indicator was intended to capture instances in which
individuals in non-crisis residential settings required treatment in an inpatient facility.
Reports of “Incidents occurring in the presence of staff which required intervention of law
enforcement services” increased 17.6%. Reports of an “individual who is unexpectedly absent
from a community residential program or day program” increased 7.4%; Reports of “Alleged
Individual Abuse-Physical” increased 140% (substantiated individual abuse-physical actually
decreased by 50%). Reports of “individual injury requiring treatment beyond first aid” increased
29.4%. Further analysis of these numbers will take place at the program level and/or at the
appropriate program quality council.
Community Incident Data – Developmental Disability Services
Community developmental disability providers reported 1,351 deaths and critical incidents or
70% of all incidents during this report period. The incident types requiring an investigation and

21
reported most frequently for developmental disabilities were “Hospitalization of an Individual in
a community residential program”, “Individual injury requiring treatment beyond first aid”,
“Alleged Individual Abuse-Physical”, “Incident occurring in the presence of staff which requires
intervention of law enforcement services”, and “Alleged Neglect”. Each of the above five most
frequently reported incident types realized a decrease over the prior report period.
Hospitalizations of individuals served increased in the IDD service line from 506 in the prior 6
month period to 529 in the most recent 6 month period. “Incidents occurring in the presence of
staff requiring intervention of law enforcement services” were the same-107 for both report
periods.
Reports of “Hospitalization of an Individual in a community residential program” increased
4.5%. Reports of “Individual injury requiring treatment beyond first aid” decreased 19.3%;
Reports of “Alleged Individual Abuse-Physical” decreased 6.3% (substantiated individual abuse-
physical decreased 32%); Reports of an “Incident occurring in the presence of staff which
requires intervention of law enforcement services” did not change, and reports of “Alleged
Neglect” decreased 10.4% (substantiated Neglect decreased 57%).
Community Mortality Reviews
The Department developed a community mortality review process in FY 13 to achieve the
following goals:
To conduct mortality reviews utilizing a systematic interdisciplinary review of the
investigative report of all suicides and all deaths where the cause of death is not attributed to
a terminal diagnosis or diagnosed disease process where the reasonable expectation of the
outcome is death. This includes the death of any individual receiving residential services or
receiving 24/7 community living support, death that occurred on site of a community
provider, or occurred in the company of a staff member of a community provider, or death
when the individual was absent without leave from residential services,
To review the quality of services and supports provided to the individual,
To identify factors that may have contributed to the death and/or indicate possible gaps in
services,
To recommend corrective actions to improve the performance of staff, providers and
systems,
To assess support systems and programmatic operations to ensure reasonable medical,
educational, legal, social, or psychological interventions were being provided prior to
deaths, and
To review the investigative reports to assure that a comprehensive systemic approach was
taken in the investigation.
The DBHDD Community Mortality Review Committee (CMRC) was established to ascertain
whether all necessary and reasonable interventions were taken to provide for the health, safety,
and welfare of the individual receiving services by a DBHDD provider and to identify and
mitigate any findings that could affect the health, safety and welfare of other individuals
receiving supports and services from DBHDD community providers.
The CMRC is chaired by the DBHDD Director of the Division of Hospital Operations/Chief
Medical Officer (CMO). Other members of the committee include the DBHDD Director of
Quality Management, the DBHDD Suicide Risk Prevention Coordinator, a community

22
physician, a Registered Nurse who is experienced and understanding of the needs of individuals
who are receiving services through DBHDD, the Director of DD QM, the OIMI Director,
representatives of the Office of AD, the Division of BH and others as appointed by the CMO.
There must be a minimum of five committee members present with three (or at least 51%)
clinicians and at least one physician. The Department is currently reevaluating the purpose and
membership of the committee and considering additional DBHDD leadership involvement and
expertise outside of DBHDD. The Department is also developing training for all CMRC
members and increasing the meeting times to reflect the importance of this activity.
The CMRC meets approximately 10 times during the year or as often as is necessary to meet the
timeframes for conducting reviews. The CMRC reviews the causes and circumstances of all
unexpected deaths through available documentation and uses the findings to further enhance
quality improvement efforts of the Department. Through a review of each unexpected death by
clinical and professional staff, deficiencies in the care or service provided or the omission of care
or a service by DBHDD employees and/or contractors may be identified and corrective action
taken to improve services and programs. Trends, patterns and quality of care concerns are
shared with the appropriate quality council and addressed with the applicable program leadership
for resolution.
During this review period (January – June 2015) the Community Mortality Review Committee
met six times to review all reported unexpected deaths (as defined by the community incident
management policy) of all individuals receiving DBHDD services (BH, DD, and AD). A total of
52 deaths were reviewed during this period. Of the 52 reviews, 36 reviews had
recommendations. When there were outstanding issues identified by the Community Mortality
Review Committee related to the investigative report, those issues were addressed with the
appropriate party. Based on these reviews, recommendations were made related to the
following:
OIMI using the investigative report and CMRC questions/recommendations to improve
the thoroughness of investigations,
Creating or modifying existing policies, procedures, provider manual or other guidance
regarding service provision,
Requesting additional Corrective Action Plans (CAPs) related to the provision of clinical
oversight of staff, revision of a provider’s risk assessment, follow up for missed clinical
appointments, seizure protocol/plan, communication issues
Requesting a special review from the Provider Performance Unit,
Consulting with the Suicide Prevention Coordinator,
Conducting additional investigative work regarding agency neglect,
Conducting additional reviews of a provider’s policies
Reviewing how LPNs function in a provider’s organization.
For FY 15, DBHDD contracted with external providers with expertise in Developmental
Disabilities and Suicide Prevention: Columbus Medical Services, LLC, to provide mortality
reviews of all deaths from the ADA population that has transitioned from a hospital setting to the
community. DBHDD has also contracted with Barbara Stanley, PhD, and Gregory Brown, PhD,
both nationally recognized suicide experts and trainers, to conduct mortality reviews of suicide

23
deaths. These objective reviews by external authorities will help provide additional expertise in
these two critical areas of clinical practice.
The CMRC reviews the external mortality reports to identify trends and patterns and to identify
whether systems issues are raised by the cause or circumstances surrounding an individual’s
death. Systems issues may be at the individual, program and/or system or state level. The
CMRC determines whether, based on the findings, actions should be taken to improve the health
and safety of individuals served by the Department. Future enhancements to the process include
a CMRC policy, training for CMRC members, additional membership for the Committee and a
database for tracking to completion any recommendations made.
The following two tables provide mortality data for both hospital and community providers for
current report period January-June 2015 and prior report period July-December 2014:
Years 2014 & 2015
Source Hospital
Values
Incident Type
July - Dec
2014
Jan – June
2015 Change % Change Total
A16-Death-expected 7 4 -3 -43% 11
A17-Death-unexpected 6 3 -3 -50% 9
A34-Suicide 0 1 1
1
Grand Total 13 8 -5 -38% 21
Years 2014 & 2015
Source Community
Values
Disability Incident Type
July – Dec
2014
Jan – June
2015 Change
%
Change Total
BH C-Death 138 139 1 0.7% 277
C-Suicide 15 18 3 20.0% 33
C-Death-Unexpected 2 4 2 100.0% 6
BH Total
155 161 6 3.9% 316
DD C-Death 33 43 10 30.3% 76
C-Death-Unexpected 33 41 8 24.2% 74
C-Death-Expected 8 7 -1 -12.5% 15
DD Total
74 91 17 23.0% 165
Grand Total
230 252 23 9.6% 481

24
Hospital Peer Review and Credentialing The hospitals’ Clinical Directors along with the Program Directors and discipline chiefs provide
oversight and direction to the professional staff. Audit tools are also used to monitor the quality
of clinical services. Auditors are assigned to audit the work of their peers so the audits also
function as peer reviews for the clinical staff. The auditors receive training on audit criteria and
methodology in their respective areas of responsibility in order to achieve inter-rater reliability.
The criteria for those audits include system-wide criteria developed and administered at all
hospitals, as well as any that may be hospital-specific. Responsibilities for audits are assigned
by each hospital’s discipline chief (physicians, nurses, social workers and psychologists). The
results of the peer review/audits are reviewed by the appropriate supervisor who will provide
feedback and, as needed, address any quality issues. Data from those audits are also entered into
a system-wide audit database that permits aggregation and analysis. Discipline-specific monthly
reports are generated and distributed to the respective discipline chiefs. Facility and Hospital
System data are also aggregated and shared through the hospitals’ respective quality councils.
Hospital Utilization Review The Hospital System and Regions continue to monitor and address issues related to rapid
readmissions (less than 30 days), as well as those with 3 or more admissions in a year. The
overall trend for the 30 day readmissions have shown a slight downward trend during the last 12
months. The monthly rate reported for 3 or more admissions in a year has shown a decline for six
straight months, as well as a slight downward trend over the last 12 months.
Adult Mental Health Fidelity Reviews Assertive Community Treatment Fidelity Reviews are conducted annually for all twenty-two
state-contracted ACT teams and all 6 Medicaid-funded ACT teams. Between January 2015 and
June 2015, a DACTS (Dartmouth Assertive Community Treatment Scale) fidelity review was
conducted on sixteen state-contracted ACT Teams. The review typically takes 3 days with one
day of on-site technical assistance built in on the last day after the review. Once the DBHDD
ACT & CST Services Unit completes the fidelity review, results of the Fidelity Review are given
to the ACT team, leadership within the agency, the regional office in which the team operates,
and the DBHDD Adult Mental Health Director and other departmental leadership. Results are
also provided to the ACT Subject Matter expert hired as part of the Independent Reviewer’s
review of the Settlement. This is followed by a detailed discussion of the report inclusive of
each scale and the rating for each scale along with any explanation or recommendation for the
rating. This occurs during the exit interview, which is attended by the ACT provider, regional
and state office staff. Review items that are found to be below the acceptable scoring range: a
score of 1 or 2, result in a Corrective Action Plan which each team develops and submits for
acceptance to the regional and state office. ACT teams are contractually required to obtain a
DACTS mean score of 4.0 and total score of 112. Of the sixteen teams that have received a
fidelity review, fourteen achieved a score within the acceptable range of fidelity, indicating that
they are serving the appropriate population, maintaining an acceptable caseload, delivering the
service with intended frequency and intensity, providing crisis response, conducting effective
daily team meeting discussion of consumers, engaging formal and informal supports, being
involved in hospital admissions and/or discharges and delivering 80% of the teams services in
the community. At the time of the review, two teams scored below the acceptable range of
fidelity. Some of those areas of needed attention are: strengthening delivery and documentation
of contacts with consumer's informal support system, increasing the stability of staffing and

25
reducing turnover, and developing more effective daily schedules to increase face-to-face
contacts between the ACT team and the individuals that each team serves. Both teams have
submitted CAPs, and have received technical assistance and have both demonstrated
improvements in the following areas; substance abuse group provision, staffing, involvement
with informal supports.
Supported Employment Fidelity Reviews are conducted annually for all twenty-one state
contracted SE providers. During FY15, fidelity reviews were conducted during October 2014 –
June 2015, 21 fidelity reviews were completed using the 25-item IPS model for supported
employment. Once the 2-day SE fidelity review is completed and findings are scored, the results
are given to the SE provider, the regional office in which the team operates, the DBHDD Adult
Mental Health Director and other departmental leadership. Results are also provided to the SE
Subject Matter Expert hired as part of the Independent Reviewer’s review of the Department’s
performance related to the ADA Settlement Agreement. This is followed by an exit interview
inclusive of provider, regional and state staff with a detailed discussion of the review outcome
and report. Outcomes are also discussed with the CBH PQC. Review items that are found to be
below the acceptable scoring range; a score of 1 or 2 will result in a Quality Improvement Plan
(QIP) which each team develops and submits for acceptance to the regional and state office. SE
providers are contractually expected to minimally obtain an IPS total score of 74. Of the twenty-
one providers who have received a fidelity review, twenty-one achieved a score within the
acceptable range of fidelity, indicating that they are effectively integrating SE and mental health,
maintaining collaboration with Georgia Vocational Rehabilitation Agency (GVRA),
demonstrating clearly defined employment duties for SE staff, implementing zero exclusion,
rapidly engaging consumers in competitive job search, assessing consumer’s interests and
making job placements based on identified interests and skills.
Quality Service Reviews of Adult Behavioral Health Community Providers The DBHDD Quality Management Team completed a review of individuals who frequently
utilize crisis and inpatient services in both the community and through the State Hospital System.
The reviews combined a focus of the State Hospital services along with community-based crisis
and therapeutic services allowing for a comprehensive look at the services individuals receive or
are referred to for treatment.
The project focused on an individual’s treatment, level of satisfaction, and unmet needs or
barriers to successful treatment, and followed the individual through their continuum of care,
including their transition process into community behavioral health services. In keeping with
past quality audit/service reviews conducted by the QM Department, records were reviewed and
individuals and staff were interviewed. The project focused on all six DBHDD Regions and a
sample of 127 individuals who were the highest utilizers of crisis and inpatient services in each
region. The review was completed June 2015 and findings were shared in a presentation to
DBHDD program leadership in July 2015 and will be discussed in a future CBH PQC meeting.
The following is a summary of some of the issues identified:
Homelessness is a recurrent factor associated with high utilization of crisis and inpatient
services. Some homeless individuals reported using the crisis service as a temporary

26
shelter. Multiple factors appear to impact placement of individuals in appropriate
housing, including consumer choice to be discharged to shelters.
Substance abuse is also a recurrent factor associated with high utilization of crisis and
inpatient services. Some of the highest utilizers of crisis services diagnosed with a
substance abuse disorder were not participating in community-based treatment for their
addiction. Aside from the individual refusing the treatment, other factors influencing a
lack of follow through to outpatient services included relapse soon after discharge;
inadequate housing options; and lack of available residential treatment options, available
beds, or admission criteria that the individual did not meet.
The review identified special populations that appeared underserved and/or who needed
more thorough assessments in order to gain additional information about their service
needs. Examples included: emerging young adult (males) diagnosed with SPMI,
individuals with borderline intellectual functioning or IDD, the homeless population, and
transient users of crisis services. The financial status of individuals also was associated with high utilization of crisis and
inpatient services as multiple people were unable to afford medications, housing,
transportation, and treatment such as residential substance abuse.
Limitations in resources within the community were identified for all regions. Examples
included: safe housing, transportation, SA residential programs, gender specific SA
treatment for women, and an array of intensive treatment options in rural areas.
This review identified a variety of issues specific to this population as well as issues that may
inform how the Department’s behavioral health programs could be more responsive to this
population. Providers throughout the state were eager to participate in this review and interested
in successful ways to address recidivism to better serve individuals in their communities. Many
of the concerns identified impact the entire population of individuals served, not just those who
were the highest utilizers of crisis and inpatient services. Providers also shared innovative
strategies they are using to address the needs of the individuals in their services.
Division of Addictive Diseases (AD) Quality Management Activities The Office of Addictive Diseases provides leadership for adult and adolescent substance abuse
treatment services. The Office’s responsibilities include: program oversight; grants management;
ensuring compliance with federal and state funding requirements; maintaining collaborative
relationships with advocacy groups and other stakeholders; providing data and information at the
regional and local levels to impact policy decisions; statewide technical assistance to providers
and the six DBHDD Regional Offices; developing and maintaining collaboration among private
and public sector providers and stakeholders; providing training and information on best
practices for substance abuse treatment; coordinating collaborative efforts in increasing best
practices models; assisting community and faith-based groups in developing capacity and
training; overseeing HIV Early Intervention Services among substance abusers and their families
and significant others; overseeing men’s residential treatment services throughout Georgia and
the Ready for Work women’s programs.
Program staff assigned to the Office’s State office are responsible for conducting provider site
reviews to ensure fidelity/compliance to service guidelines and federal block grant requirements.

27
Listed in the chart below is an overview of each program area and the QM activities conducted
by staff along with the frequency:
AD Service/
Description
QM Activities/On-site reviews Frequency Outcomes
Women’s
residential
treatment and
recovery support
services
Site visits are currently conducted by Women’s
Treatment Coordinator. Staff reviews provider
compliance with standards and overall performance
in providing gender specific substance abuse
treatment services. In addition, TCC vendor conducts
reviews of all Therapeutic Childcare programs
offering services to children. Clinical reviews of
these programs against requirements are conducted
by addiction credentialed staff with gender specific
training and historical context of programs and
interaction with child welfare agencies.
1x every 2
years
During this report period 14
Residential providers were
reviewed for compliance with
policy/procedure standards,
evidenced based practices, staff
training, clinical documentation,
and authorization of appropriate
services. Of the 14, all were in
compliance and only 3 were in
need of technical assistance (TA)
in terms of clinical
documentation and treatment
planning which included training
of staff and support of
leadership.
For the TCC component, 5
reviews/audits were completed in
this reporting period and all were
in compliance, with only 1
provider needing TA. The TCC
consultant will be implementing
additional TA for a new provider
opening July 1, 2015
Women’s
outpatient
treatment and
recovery support
programs
Site visits are currently conducted by Women’s
Treatment Coordinator. Staff reviews provider
compliance with standards and overall performance
in providing gender specific substance abuse
treatment services.
1x every 2
years
During this report period 11
outpatient providers were
reviewed for compliance
policy/procedure standards,
evidenced based practices, staff
training, clinical documentation,
and authorization of appropriate
services. Of the 11, 1 was not in
compliance but not in need of a
corrective action plan. TA was
provided immediately and the
provider was able to correct
authorization patterns for
enrolled individuals. Follow up
was completed 30 days later and
the provider was in compliance
with all required authorizations
for this service.
Women’s
transitional
housing supports
Site visits are currently conducted by Women’s
Treatment Coordinator.
1x every 2
years
During this reporting period 8
Transitional Housing programs
were reviewed for compliance
policy/procedure standards,
documentation, case
management and authorization of
appropriate services. All 8 were
in compliance.
Recovery Support
Services for youth
(Clubhouses)
Site visits conducted by C&A program staff to ensure
program design and requirements are being followed.
Staff person is 7 Challenges trained.
1x every 2
years
During this reporting period 3
recovery support programs were
reviewed for compliance. All 3
were in compliance and met the

28
standard for performance
delivery. 1 recovery support
program has been visited and
technical support provided as
they are in the process of
relocating. 3 recovery support
programs are scheduled for
review during the month of June.
Recovery Centers
Site visits conducted by Adult program staff to ensure
program design and requirements are being followed.
Clinical review of these programs against
requirements are conducted by addiction credentialed
staff
1x every 2
years
There were no reviews
completed during this time,
however, a Programmatic Report
is submitted and reviewed every
month addressing contract
deliverables and the amount of
unduplicated individuals served.
IRT (Intense
Residential
Treatment)
Programs
Site visits conducted by C&A program staff to ensure
program design and requirements are being followed.
Staff person is 7 Challenges trained.
1x every 2
years
Both IRT Programs have been
reviewed during this reporting
period and both were in
compliance.
Transitional/IOP Site visits conducted by Adult program staff to ensure
program design and requirements are being followed.
Clinical review of these programs against
requirements are conducted by addiction credentialed
staff
As needed
basis if
monthly
reports
indicate an
issue
There were no reviews
completed during this time,
however, a monthly reporting
form is submitted and reviewed
identifying the number of
admissions, the number of
discharges, length of stay and
identified referring agencies.
HIV testing and
education
(HIV/EIS)
Site visits conducted by vendor to ensure program
design and requirements are being followed.
No site visits during this period.
They will be completed in the
months of August and
September. Quarterly reports are
submitted providing information
on the number of individuals
tested, number of post-test
counseling sessions, number of
HIV positive, and number of
individuals referred and
connected to treatment.
AD Treatment
Courts
None. N/A N/A
Opioid
Maintenance
Site visits conducted by State Opioid Maintenance
Treatment Authority to providers within the DBHDD
network.
1x every 2
years
No site visits during this period.
They will be completed in the
next quarter. This report
identifies the current EBP,
number of indigent individuals
receiving care, number of
individuals with take home,
number of individuals
completing the program, number
of individuals in aftercare, and
the current number of individuals
titrating off methadone.
Adult Residential
Treatment
Services
Site visits conducted by Adult program staff to ensure
program design and requirements are being followed.
Clinical reviews of these programs against
requirements are conducted by addiction credentialed
staff.
1x every 2
years
There were no reviews
completed during this time,
however, a monthly reporting
form is submitted and reviewed
identifying type of service,
number of individuals served,
number of admissions, number of
discharges, referring agencies,

29
and length of stay.
In addition to site reviews, program staff process contract payments and monthly programmatic
reports which are received monthly from providers, to ensure service guidelines are being met
from a contractual standpoint. Once reviews are completed, the results are shared with the
Regions and providers to review performance/progress and identify any areas in need of
improvement.
Office of Addictive Diseases Training
The Office of Addictive Diseases also ensures that training is offered to providers to improve
quality of services. Trainings initiated by the Office during this reporting period include the
following;
Advanced Clinician Training - DUI Intervention Program
Understanding and Utilization of ASAM Criteria; Legal and Ethical Issues in
Addictions and Avoiding Malpractice
STAR BH Military Culture Training (Tier One)
Children, Young Adults and Families Community Mental Health Programs (CYFMH) DBHDD’s Office of Children, Young Adults, and Families (CYF) works directly with the
Georgia State University Center of Excellence (COE) for Children’s Behavioral Health to ensure
quality improvement and ongoing evaluation among CYF services, as well as to provide
specialized workforce development for the department’s network of child and adolescent
behavioral health providers. The COE also provides ongoing support and facilitation to
Georgia’s Interagency Directors Team (IDT) (a sub-committee of the Behavioral Health
Coordinating Council), evaluates interagency pilot initiatives, and provides evaluation services
for Georgia’s System of Care Expansion grant.
In an effort to ensure quality management among CYF’s provider network, the office in
partnership with the COE hold quarterly quality consortium meetings for each specialized
service provider. The meetings are held with the state’s seven psychiatric residential treatment
facilities, four crisis stabilization units, two care management entities, and 11 resiliency support
clubhouses, more commonly referred to as mental health clubhouses. During each quality
consortium meeting, quarterly fidelity monitoring reports are reviewed. Dialogue about trended
data, issues that may have arisen with the data collection process, suggestions for how to improve
or change fidelity monitoring, and any other matters regarding quality improvement data is
facilitated. Quality management activities provided across CYF’s continuum of services include:
fidelity monitoring reports, trended fidelity monitoring reports, and quality assurance
workgroups.
Since January 1st, 2015, CYF in partnership with the COE has also provided a host of
workforce development opportunities in an effort to ensure high-quality services. One of
these trainings is for professionals delivering high-fidelity Wraparound. Georgia adopted the
Innovations Institute implementation model, which includes a core curriculum comprised of
Introduction to Wraparound, (2) Engagement, (3) Intermediate Wraparound and (4)

30
Advancing Wraparound Practice. In an effort to continue quality practice the COE developed
an assessment to identify additional training needs. The Georgia local coaches created five
additional curricula: (1) Strengths Training, (2) Needs and Outcomes, (3) Family Support
Partners in Wraparound, (4) Transitions in Wraparound, and (5) Creative Styles of Crisis and
Safety Planning.
In addition to high-fidelity Wraparound training, CYF has also provided Trauma-informed
Systems training throughout the state. This workforce development opportunity is designed to
teach basic knowledge, skills, and values about working with children who have experienced
traumatic stress and may have been involved in the child welfare and juvenile justice systems.
Finally, during this reporting period CYF has worked directly with the COE and the IDT in
planning for the 8th
Annual System of Care Academy: Embracing Transition. The theme for
this year’s academy is based on CYF’s new focus on the transition-age youth and young adult
population. This year’s academy will be held July 14th
-16th
, and will feature speakers such as
SAMHSA’s Dr. Gary Blau, CDC’s Dr. Ileana Arias, and global speaker, advocate, and mental
health advocate Kevin Hines. An anticipated 400 individuals, including professionals,
families, and youth will be in attendance for this event.
Behavioral Health Mobile Crisis Response System Performance and Quality Monitoring Mobile Crisis Response Services (MCRS) for behavioral health has been statewide since July 1,
2014. Each region is covered by one of two vendors, Benchmark Human Services and
Behavioral Health Link, both of whom have been participating in the MCRS Quality
Management System since the beginning of the contracts. There are 20 data points that the
vendors report on monthly to the regions. This data is reviewed quarterly at a MCRS Quality
Consortium. Through these meetings, a quarterly data template has been created, barriers to
implementation have been resolved, and processes have been put into place to improve the
quality of the service.
Between January and June 2015, 8,415 calls were received. The table below shows the average
(mean) response time for mobile crisis teams. Response time is defined as the amount of time in
between being dispatched to a location where the individual is located until the time of arrival at
that location.
Month
Average Response
Time
(in minutes)
Jan 2015 52
Feb 2015 51
Mar 2015 50
Apr 2015 50
May 2015 52
Jun 2015 52
Average 51

31
Mental Health Coalition Meetings A gathering of all Supported Employment providers and a gathering of all Assertive Community
Treatment providers are facilitated on an every other month basis by DBHDD staff. Community
Support Team providers gather every other month as well. Case management and Intensive Case
Management providers gather once a month for a Coalition call. These meetings are vehicles
for disseminating and gathering information, maintaining open communication, promoting
provider collaboration and fostering the partnership between the Department and provider
agencies. This forum allows for discussion of programmatic operations and performance
(including key performance indicators), informal presentations/in-service, discussion of
Departmental policies and any other matters of relevance for these evidence-based practices.
Coalition meetings have functioned as forums of discussion that have provided an impetus for
policy adjustments, including: increasing units of group therapy per authorization, and increasing
allowable number of monthly enrollment prior to requiring a waiver. The majority of service
specific coalition meeting are held in Macon for ease of access; a call in number is provided for
all coalition meetings for those unable to be present. Adult Mental Health staff, regional staff,
providers and members of APS, and the external review organization, participate in Coalition
meetings. There were three ACT Coalition meetings held between January 2015 and June 2015.
There were three SE Coalition meetings held between January 2015 and June 2015. There were
two Coalition calls and one ICM/CM Coalition meeting between January 2015 and June 2015.
Residential Support Services Coalition Meeting The Office of Adult Mental Health (AMH) held its first Residential Support Services (RSS) and
Crisis Respite Apartments (CRA) joint coalition meeting in October 2014. The meeting had 70+
attendees representing state and regional staff, contracted community providers and local
stakeholders. The coalition meeting created a platform for residential providers to promote open
dialogue in the discussion of challenges and solutions to providing housing supports and options
for individuals living with SPMI across the state. The agenda was comprised of information on
the forthcoming residential redesign including Medicaid billing and a focus on recovery
transformation and individual movement and transition throughout the levels of residential care.
In January 2015, all contracted RSS and CRA providers participated in the AMH combined
coalition meeting that provided information on the array of community based services offered by
the Department. The second RSS and CRA joint coalition meeting was held in April 2015. The
agenda was comprised of information related to Forensics and Community Integration Home
placement, the Peer Forensic Specialist Initiative, Data Review and Compliance, Residential
Medicaid Billing and Fee for Service, and a presentation by New Horizons focused on Housing
First. The June 2015 RSS and CRA joint coalition meeting focused on the FY 2016 contract
deliverables including the Residential Cost Analysis that will be conducted during the first
quarter of the fiscal year. The coalition reviewed the newly implemented DBHDD Supported
Housing and Needs and Choice Evaluation Policy, 01-120.
Behavioral Health Contracted External Review Organization (ERO) APS Healthcare is the External Review Organization (ERO) for DBHDD behavioral health
services through June 2015. Many of the established functions and products provided by this
32
vendor continued to contribute to the Department’s management of the provider network. These
elements include training, technical assistance, prior authorization for services, provider audits,
and provider billing and service provision data. In July 2015, the Georgia Collaborative ASO
assumed these functions.
Audits:
The ERO conducted 102 audits of community BH providers from January 2015 through June
2015. Audit information has been crucial for the Department’s continued implementation of
Policy 01-113, Noncompliance with Audit Performance, Staffing, and Accreditation
Requirements for Community Behavioral Health Providers and for the management of providers
which fail to achieve compliance with DBHDD audit score, staffing, and accreditation
requirements. Audit results can be found at: www.apsero.com
Training:
The ERO has provided training opportunities to the network during the report period—a total of
538 hours (including audit exit interviews). In addition to the onsite technical assistance
provided at each Audit Exit Interview, APS has also offered both broad and targeted information
to the provider network:
In support of the implementation of the additional crisis services in Regions 4 and 6, APS
has continued to provide technical assistance to support collaboration among providers,
State-operated hospitals, community-based hospitals, and GCAL;
Participation and training as an element of the Georgia Certified Peer Specialist training;
Multiple trainings for documentation and treatment planning for recovery-based services,
such as the following:
o Georgia Mental Health Consumer Network Certified Peer Specialist trainings
o Georgia Council on Substance Abuse (C.A.R.E.S.) Certified Peer Specialist—
Addictive Disease training
o Supported Employment and Task Oriented Rehabilitation Services;
Care Management and Audits staff have attended all ICM/CM/CST and ACT coalition
meetings in order to provide training specific to audits, authorization, treatment planning,
and care management or authorization based on provider need;
Continued offering of the Ambassador Program for new providers and providers’ new
staff members.
Service Utilization & Authorization:
During the report period, licensed clinicians at the ERO have manually reviewed 17,061
authorization requests for community services. Of those, 1,828 authorization reviews were
specific to ACT services.
Implementation and Results of Best Practice Guidelines:
Beck Initiative The Beck Initiative is a collaborative clinical, educational and administrative partnership
between the Aaron T. Beck Psychopathology Research Center of the University of Pennsylvania
(UPENN) and DBHDD to implement recovery-oriented Cognitive Therapy (CT-R) training and
consultation throughout the DBHDD network. Fusing the recovery movement’s spirit and

33
cognitive therapy’s evidence base, CT-R is a collaborative treatment approach that prioritizes
attainment of patient-directed goals, removal of obstacles to the goals, and engagement of
withdrawn patients in their own psychiatric rehabilitation. Through intensive workshops and
ongoing consultation, tangible tools to help remove roadblocks to recovery of people with severe
mental illness are placed in the hands of care providers across the network. CT-R provides the
fabric for promoting continuity of care with the goal of helping affected individuals achieve
sustained integration in the community.
Broad Project Goals
To promote hope, autonomy, and engagement in constructive activity, for individuals
served by agencies in the DBHDD network;
To establish CT-R as a standard practice of care for people served within DBHDD
agencies;
To promote the sustained implementation of CT-R into the DBHDD network;
To improve the professional skills of therapists in the DBHDD system;
To conduct program evaluation to examine outcomes such as client attrition, service use,
recidivism, therapist turnover, and the sustainability of high-quality CT in DBHDD
settings;
To utilize the evidence-based practice of CT-R in the Department as roadmap for
delivering recovery-oriented care; and
To serve as a model for other large mental health systems.
FY: 15 - Project Plan
Providers in Regions 2 & 5 will receive this training September 2014 – August 2015. The CT-R
Training Program consists of workshops (Phase 1) and 6-month consultation (Phase 2).
Participants in the trainings included individuals from the DBHDD state hospitals and the
community based providers (e.g. assertive community treatment teams, community support
teams and outpatient providers).
FY: 16 - Project Plan
Activities scheduled for July 1, 2015 – December 2016:
CT-R trainings will continue within regions 2 and 5 during this fiscal year as described above.
In addition to completing the trainings sustainability activities will begin in this fiscal year.
Local expertise for CT-R training will be transitioned to the Center of Excellence (COE) at
Georgia State University. This is a key part of the sustainability plan to ensure sustainability of
future trainings, support for current trainees and ongoing evaluation efforts. DBHDD has a
contract in place with the COE that has been underway for the past several months to begin
transition work. The COE will work collaboratively with the University of Pennsylvania (the
Beck Team) to jointly plan the sustainability effort to ensure continuity. Activities will include
training to the COE team by the Beck Team, shadowing by the COE team, and joint evaluation
planning by both the Beck Team and the COE team. The COE will hire elite trainers that will
facilitate the future CT-R trainings and a coordinator to oversee the overall project.

34
Data Workshops/Trainings Participation Outlined Below
Region 2:
Total number of general workshop participants:
Total: 89
Total number of trainees that also participated in the consultation phase:
Total: 66
Region 5:
Total number of general workshop participants:
Total: 91
Total number of trainees that also participated in the consultation phase:
Total: 65
Suicide Prevention Program DBHDD recognizes suicide as a significant public health issue in the State of Georgia and has
developed a suicide prevention program. The program’s goals include:
• preventing suicide deaths,
• reducing other suicidal behaviors including attempts,
• reducing the harmful after-effects associated with suicidal behaviors, and
• improving the mental health of Georgians through primary prevention activities,
access to care, early intervention, crisis treatment and continuing care.
A foundation of suicide prevention is providing awareness to communities and groups about the
crisis of suicide and engaging citizens to work in their communities. In 2014 the Suicide
Prevention Program adopted the focus of Suicide Safer Communities to encourage multiple
activities and multiple community partners in suicide prevention. The Suicide Prevention
Program now works with over 12 suicide prevention coalitions throughout Georgia to support
local collaboration to prevent suicide and is working with Bartow and Oconee county
stakeholders to develop new coalitions. Between January and June 2015 three awareness events
were held with a total of 185 people attending.
The Georgia Suicide Prevention Information Network (GSPIN) website www.gspin.org supports
awareness, coalitions, survivors groups and the interested public. Between January and June
2015 the website had over 600,000 hits and the broadcast network had 2,850 members who
received 9 email blasts with information and activities. During this period 290 people registered
as new members of GSPIN.
With a more aware general public, there is a need to identify people at high risk of suicide in the
general public and assist them in accessing care. In order to address the access to care issue, the
Suicide Prevention Program supported two evidence based gatekeeper trainings. Gatekeepers act
as outreach liaisons that provide their community with information about how to identify
someone at high risk of suicide, how to encourage the person to get help, and how to access
behavioral health and crisis services. The programs are called: Question, Persuade, and Refer

35
(QPR) and Mental Health First Aid (MHFA) and are for both adults and youth. These programs
teach community members to recognize the signs of suicidal behavior and direct individuals to
assistance. Between January 1, 2015 and June 30, 2015, DBHDD trained at least 150 Georgia
citizens in QPR and 250 citizens in mental health first aid. The training was provided throughout
the State and included 8 QPR trainings, 7 adult Mental Health First Aid trainings and 5 Youth
Mental Health First Aid trainings in counties to community members in churches, schools,
libraries and other community settings. Additionally, there was a SAMSHA grant opportunity to
support Youth Mental Health through the school systems that was awarded to the Department of
Education to support three counties and another two counties.
To help to expand the use of QPR in Georgia communities and support its sustainability,
between January and June 2015, the Suicide Prevention Program staff provided 3 QPR Instructor
Training events in Decatur, Dublin, and Moultrie. Fifty-five new certified trainers were added to
the existing group of over 200 certified QPR trainers throughout the state. These new trainers
were recruited from our coalitions, colleges and universities, the schools and agencies that serve
the refugee population.
The Suicide Prevention Program, through its contractor, The Suicide Prevention Action Network
of Georgia (SPAN-G), has revised the suicide prevention training segments in the Crisis
Intervention Team (CIT) trainings coordinated by the National Alliance on Mental Illness
(NAMI) that is given to law enforcement and first responders throughout Georgia. In addition to
identification of suicide, the program now contains information about supporting and managing
suicide survivors at the scene of a death and on self-care. This module has been expanded into
two modules, the first on suicide and the second on self-help and peer to peer support. Between
January and June 2015 SPAN-GA gave 11 trainings in the revised Suicide module during CIT
trainings to approximately 330 personnel from The Georgia Bureau of Investigation (GBI),
Sheriff’s Offices, Police Departments, High School Security, Pardons and Parole, Emergency
Medical Service (EMS) and Fire Departments. The self-help and peer support module is now
being given by first responder peers.
DBHDD’s Suicide Prevention Evidence Based Practice (SPEBP) Initiative called A.I.M.
(Assessment, Intervention, and Monitoring) with the outcome of identification, brief intervention
and monitoring of consumers who are at high risk of suicide move toward the goal of helping
them become securely situated in services and more empowered to act in their own self-interest
continues to train providers in the use of the Columbia Suicide Severity Rating Scale, the Stanley
and Brown Suicide Safety Plan and the monitoring questions developed by Stanley and Brown
for use until consumers are securely into care. During the first six months of 2015, the Suicide
Prevention Program provided four A.I.M. trainings for 74 behavioral health providers in Albany,
Columbus, Dublin and Augusta. During this time period, training focused on the need for
information about assessment skills, two Assessing and Managing Suicide Risk for Mental
Health Professionals trainings provided by the SAMHSA funded Suicide Prevention Resource
Center were taught to clinical leadership in DBHDD provider organizations (72 attendees)
bringing the total of clinical leadership trained to over 225. From this group of attendees 15 New
Leaders were trained and certified. Each New Leader has agreed to provide three trainings and
the Suicide Prevention Program anticipates that by the end of 2015 at least 300 more clinicians
will be trained in this foundation program.

36
Work with other state agencies was focused on the Department of Education (DOE) during this
reporting period. During the 2015 legislative session, House Bill 198 (HB 198), the Jason Flatt
Act, was passed and signed into law by Governor Deal. The new law mandates that all
certificated school personnel receive annual training in suicide prevention, including resources in
the community, and that each school system develop a suicide prevention policy including
prevention, intervention, and postvention. The bill mandates that a committee including
representatives of the Board of Education and the DBHDD Suicide Prevention Program develop
a list of approved curriculum and a model suicide prevention policy. During May and June 2015
the Suicide Prevention staff met with designated representatives of the DOE to work on the
development of the list of approved curriculum and the model protocol.
To support the work of student support personnel, the Suicide Prevention Program again
provided training in the LIFELINES: Intervention Programs. During March and April 2015 two
LIFELINES: Intervention Programs were given to over 30 school and allied personnel. The
Suicide Prevention Program also provided ongoing postvention suicide training to the schools
through its LIFELINES: Postvention programs. Two LIFELINES: Postvention trainings were
provided to teams of school personnel and community professionals who work with school staff
after a suicide death of a young person. This program trained 32 school and behavioral health
personnel to respond effectively to suicide deaths in the schools. As part of its consultation to
other agencies in Georgia, there were two on-site visits with a school system experiencing a
cluster of deaths, including suicide deaths.
Additionally, DBHDD and the Garrett Lee Smith Youth Suicide Prevention Program provided
the Extended Gatekeeper Initiative in 28 schools in 12 school districts in the Atlanta Independent
School System (formerly Atlanta Public Schools), Calhoun City Schools, Gwinnett County
Schools, Montgomery County Schools, Laurens County Schools, Dublin City Schools, Dodge
County Schools, Floyd County Schools, Gordon County Schools, Lowndes County Schools,
Fannin County Schools, and Camden County Schools (through the Camden Community
Alliance). In the third year of the 3 year grant funding these schools have received Question,
Persuade and Refer (QPR) gatekeeper training, Sources of Strength peer leadership groups, and
training in intervention and postvention through LIFELINES.
Additionally, DBHDD provides training to teams of survivors of suicide and other committed
individuals and technical assistance to these teams in developing and running groups. Between
January and June 2015 there were 25 active Survivors of Suicide Groups (SOS) operating in
Georgia covering all 6 DBHDD regions. Training was held to prepare new SOS group leaders in
June 2015 and 10 new group leaders were trained. During this period a group was established in
Midtown Atlanta and a group in Decatur is being developed. Additionally, 3 people were trained
or retrained to deliver the family survivor program for communities called Starfish. Again in
2015, Camp SOS, a weekend camp for families, was held for eleven families with 42 members
aged 4 to 70. Fourteen volunteers were trained as well.
Educational and outreach materials (purple packets) were designed that included materials from
the Link Counseling Center, the American Association of Suicidology, identification of crisis
service providers and crisis telephone numbers. Purple packets are disseminated to survivors of
suicide by first responders, mental health professionals, funeral directors, clergy and others who

37
encounter survivors of suicide death. Purple packets were provided to DBHDD providers who
attended gatekeeper and A.I.M. trainings and supplies of purple packets were given out at the
Coalition. During the first six months of 2015 4,385 purple packets were disseminated
throughout the state. Also, during this period the Rockdale/Newton Suicide Prevention Coalition
developed an education and outreach packet for youth who have attempted suicide and their
families to be disseminated by first responders. The packets are currently being piloted by first
responders in Rockdale County with an initial group of 100 packets.
The DBHDD Suicide Prevention staff continues to provide on-site and telephone consultation
with providers who have experienced the death of a consumer by suicide, participate in meetings
of the EQC, the CBH PQC, and the Community Mortality Review Committee. Consultation to
providers included focus on their setting and death reviews as well as introduction to the Zero
Suicide in Healthcare Initiative and A.I.M. program.
During the first six months of 2015, the Suicide Prevention Program staff actively worked on a
draft suicide prevention policy for screening, assessment, and monitoring for DBHDD providers.
Office of Deaf Services In April 2014, the Office of Deaf Services (DS) began the process of obtaining the information
needed to ensure quality provision of behavioral health & developmental disabilities services to
individuals with hearing loss. These efforts continue with the development of new policies and
operational procedures, hiring of two additional staff, and ongoing development of project
management plans.
Goals of Deaf Services include:
gathering information and developing a baseline array of statewide community based
behavioral health and developmental disability services for deaf individuals
promoting best practices in behavioral health American Sign Language (ASL)
interpreting
increasing percentage of behavioral health therapy and case management services
provided by professionals with fluency in American Sign Language and training in deaf
culture
increasing communication access for individuals with developmental disabilities in both
community and residential settings
developing behavioral health-related educational materials to increase public information
and community outreach
developing opportunities for stakeholder input on DS goals and activities
An initial standard/performance indicator was developed in July 2014 and was included in the
Comprehensive Community Provider (CCP) requirements. The intent of this standard was to
require that community based providers offer accessible services to deaf and hard of hearing
individuals. The first task of this standard requires providers to notify the DS at intake of all
newly enrolled individuals with any level of hearing loss. In response, the DS provides a brief
communication screening and if necessary, a full communication assessment and incorporates
the results within the individual’s treatment plan. The second task requires that providers and the
DS work together to gather data to develop further performance indicators and to establish,

38
provide, and oversee the quality of accessible services. In June 2015, it was determined that this
standard/key performance indicator six month data reporting timeline did not gather data often
enough to meet the goals of DS. Instead, we will incorporate the standard into a policy with more
frequent data reporting requirements.
From January to June of 2015, trainings were provided on the following topics: understanding
the diagnostic process using DSM IV & V (February); how interpreters can lessen the incidence
of secondary trauma (March and April); how to put all the previous trainings together in real life
situations (May). With the last session in May, those who were using the training as an entryway
into the practicum were able to do so. Currently there are fifteen interpreters in various steps of
the practicum. One individual is awaiting the results of their evaluation. Georgia currently has
five interpreters who hold the Georgia Behavioral Health Interpreter (GaBHI) certification. The
shift from using generalist ASL interpreters toward using those who have specialized training in
providing Behavioral Health services has been successful. In January 2015, ASL interpreting for
approximately 20% of providers’ 62 Behavioral Health appointments with deaf individuals was
provided by outside agencies; the Office of Deaf Services has been able to decrease that to 4% of
71 appointments during May. (Data for June 2015 are not available as of the date of this report.)
Division of Developmental Disabilities
Transitions to the Community and Pioneer Project The Division of DD initiated the Pioneer Project in August 2014 to accomplish goals of
stabilizing the community and ensuring that transitions from hospitals to the community are safe
and result in high quality care in the community. It was determined to begin implementation in
one Region in order for the following assumptions to be tested, before going statewide: a)
community stability means that individuals are receiving quality health and wellness services and
are living integrated lives in the community based upon their own wishes and desires; b)
assessments must drive the ISPs; c) person-centeredness and increasing individuals’ connections
to communities will improve outcomes for individuals; d) engaging providers in change
processes and meeting their individual needs for TA and support will improve performance; e)
providing support to providers will improve the net outcome to individuals they serve; f) the
reported lack of availability of professional clinical services in the community contributes to less
than desirable outcomes for individuals; g) early engagement of Support Coordination in the
transition process and enhancement of Support Coordination services following transition will
lead to better transitions from state hospitals and increased stability following transition.
Region 2, which is comprised of 33 counties in the middle part of Georgia, was chosen as the
first implementation location due to the fact that the majority of hospital transitions remaining
are likely to be moving to one of the counties in the Region. CRA Consulting has assisted the
Division in guiding the Pioneer activities, which have included:
Developing a core team of Regional, State Office, Hospital, Support Coordination
leadership, Clinical Staff, and Consulting Staff to guide the changes made in the
transition process and stabilization activities.
Engaging providers who are currently serving individuals that have transitioned from
hospitals since October 2010 in activities, including individual and group meetings,
activities involving individuals, and training. Technical assistance was provided by
Regional and CRA staff to providers who presented with a wide variety of unique
challenges, such as financial/organizational issues, individuals with complex needs, and

39
programmatic issues. In addition, providers from all 6 Regions who are interested in
serving individuals transitioning from hospitals into Region 2 in the future, were asked to
complete a Request for Information/Request for Application. This information is being
used to develop a database of provider characteristics, capabilities, capacities, and their
interests in providing identified services in specified geographic areas. As a part of the
RFI/RFA process, providers agree to participate in special meetings and training.
Establishing the Integrated Clinical Support Team (ICST): CRA Consulting contracts
with Benchmark, Inc. to provide clinical professionals, including nurses, speech and
language pathologists, occupational therapists, registered dietitians, behavioral
specialists, a pharmacist, and an M.D. These clinicians receive referrals from Support
Coordination and the Region and can provide assessments, make recommendations, and
train provider and Support Coordination staff. The ICST is working to help providers
develop community relationships and resources so that individuals they serve are able to
access the services they need.
Meeting with individuals and family members to update their person-centered
descriptions, utilizing the MyLife tool, completing 105 MyLife reviews in Region 2. The
primary purpose of the meeting was to have a discussion about whether the individual
was living an integrated life, was engaging with members of the community, and had
opportunities to accomplish his or her goals.
Reviewing the current status of the individuals in Region 2 by updating the Joint
Monitoring Tool reviews. The Regional Quality Review team completed 92 reviews
with 8 additional scheduled to be completed by the end of July 2015.
Reviewing each individual’s HRST, SIS and MyLife/Person-Centered Plan in
comparison to the current ISP to determine if the ISP accurately reflected the
recommendations from each and if recommendations from assessments had been
implemented. This was called the ISP Fidelity Review, and 103 of these reviews were
completed for individuals in Region 2.
Providing assessments and ISP updates. Support Coordination has worked with
providers and the Integrated Clinical Support Team to ensure that individuals receive
needed assessments and that ISPs are being updated to include the recommendations
made in any new assessments. To date, 176 assessments have been provided for 50
individuals.
Coordinating with Support Coordination to implement Early Engagement for individuals
within at least 60 days of transition. In addition, enhanced SC is provided to all
individuals in the ADA population who have transitioned from State Hospitals since
October 2010.
Developing transition tools and processes to ensure that all transitions are thoroughly
planned and reviewed prior to the actual move to the community. New processes
include:
o Review of homes being considered for individuals utilizing a Housing Checklist
focused on the environment, including the community the home is in, and
determining whether the home is ADA compliant or can be made ADA compliant (as
required).
o Completion of a Housemate Matching Process that includes documented meetings
with each individual and discussions with the individual’s support system to
thoroughly describe preferred characteristics of potential housemates and to identify
40
if the individual knows someone with whom they wish to live. A Housemate
Matching questionnaire was developed to guide and document the information. In
addition, individuals who are planned housemates have the opportunity to meet in
person on more than one occasion and to have multiple visits to new homes prior to
the transition.
o Ongoing documentation and review of transition planning for each individual by the
core team and Director of the Office of Transitions through weekly meetings and
documentation on the Transition Process Overview tool.
o Developing a new Guide to Community Transitions from State Hospitals that
captures the new processes and allows documentation in detail.
o Developing a Manual that describes Pioneer Processes.
o Developing and utilizing an Individual Support Plan Narrative (ISPN) comprised
from a review of all updated assessments and detailing the needs identified in the
assessments. The ISPN is used in transition planning and informs the ISP and the
allocation of funding for supports. The ISPN is also used in transition planning to
help inform Support Coordination regarding issues that need to be monitored, to
assist the provider in identifying personnel requirements for their staffing, and to
assist in assuring that adequate training is completed for provider personnel.
o Providing community focused risk assessments for individuals transitioning from
Forensic units with special needs and requirements.
o Developing criteria for individuals to enter active transition planning. While it is
recognized that all individuals in state hospitals are eligible for transition, the
transition team must focus its work. An Active Transition List is maintained by the
Office of Transitions and the status for each individual is tracked.
o Coordinating with Support Coordination to implement Early Engagement for
individuals within at least 60 days of transition and providing Enhanced Support
Coordination to all individuals in the ADA population who have transitioned from
State Hospitals since October 2010. Support Coordinators become an active part of
transition planning for the individual and develop the ISP.
o Engaging the Integrated Clinical Support Team in the transition planning process so
that they are aware of individuals’ health needs and able to offer training and support
to the provider needed immediately upon transition.
o Providing ongoing support for the provider before, during and after the transition,
including training by the Office of Learning and Development (OLOD) and hospital
staff, follow-up visits by the RQR Team within 24 hours and continuing at a schedule
of 48 hours, 9 days, 30 days, and monthly thereafter for six months. Enhanced
Support Coordination begins the day of transition and continues on a weekly basis for
the first 90 days and follow the frequency described based on HRST Score:
o < 2 – Once a month,
o 3-4 – Twice a month,
o 5-6 – Three times a month but always monthly at a minimum per service definitions.
There have been 16 transitions this FY, (4) of which utilized Pioneer processes. The first was
July 7, 2014. Certain transitions occurred that were underway prior to the development of the
Pioneer Project, were required by the court, or were requested by individuals, families or
guardians. Of the (4) transitions that occurred under the Pioneer processes, 2 transitions

41
occurred in December of 2014, which were successful, followed by 2 additional transitions on
June 22, 2015, which are still being monitored. Although the 2 transitions in December were
successful, there were refinements of processes that needed to occur before transitioning the next
individuals, including development of the Housing Checklist and the Housemate Matching
process, and inclusion of the ICST in the transition planning. Presently, there are 23 individuals
on the Active Transition List and more are being recommended.
DD Reviews of Individuals Served The purpose of the Person Centered Review (PCR) is to assess the effectiveness of and the
satisfaction individuals have with the service delivery system. The Division of DD’s external
quality review organization (Delmarva Foundation) uses interviews, observations and record
reviews to compile a well-rounded picture of the individual’s circle of supports and how
involved the person is in the decisions and plans laid out for that person. Data is reported on a
quarterly basis.
The time period for DD data reported here is July 1, 2014 through March 21, 2015. Data for the
second quarter of 2015 (April through June) was not available at the time of the writing of this
report, but will be included in the 2015 Annual QM Report. Below, are results for:
Individuals who recently transitioned from an institution to the community (IRTC) and
participated in a Person Centered Review (PCR);
A group of randomly selected individuals who were receiving waiver services, already
established in the community (Established) and participated in a PCR;
The previous year’s IRTC interviews;
Quality Enhancement Provider Reviews (QEPR), including the Qualification and
Training, as well as provider Strengths and Barriers;
Follow up with Technical Assistance (Follow Up w/TA) and the Follow Up with
Technical Assistance Consultation (FUTAC).
Between July1, 2014 and March 21, 2015 a total of 87 new IRTC interviews and 449 Established
individual interviews have been completed. The following tables display results for IRTC
individuals compared to the Established individuals, as well as the previous year’s IRTC results
when appropriate.
Information in Table 1 provides a general description of the 612 individuals interviewed through
a Person Centered Review (PCR, N = 423) or Quality Enhancement Provider Review (QEPR,
N= 189) process between July 2014 and March 2015. The largest proportion of individuals
interviewed to date resides in Region 3 (27.9%). Males continue to represent a larger proportion
of the sample and most individuals have a primary diagnosis of Intellectual Disability.
Table 1: Demographic Characteristics
July 2014 - March 2015
Region PCR and QEPR
1 87 14.2%
2 91 14.9%
3 171 27.9%

42
4 85 13.9%
5 88 14.4%
6 90 14.7%
Gender
Female 270 44.1%
Male 342 55.9%
Age Group
18-25 58 9.5%
26-44 266 43.5%
45-54 150 24.5%
55-64 103 16.8%
65+ 35 5.7%
Disability
Autism 10 1.6%
Cerebral Palsy 1 0.2%
Intellectual Disability 533 87.1%
Profound Intellectual Disability 68 11.1%
Total 612
Individual Interview Instrument (III) Two different interview tools are used in the DD QM process to collect information from
individuals: the NCI Consumer Survey and the Individual Interview Instrument (III). The focus
of the NCI survey is on the system—the unit of analysis is the service delivery system. The
focus of the III is the individual, if desired goals and outcomes are being addressed through the
service delivery system, including both paid and unpaid supports and services. Together they
help provide a clear picture of service delivery systems and provider performance. The person’s
participation in this process is voluntary and the Quality Improvement Consultant confirms
whether he/she would like to participate before beginning the interview.
The Individual Interview Instrument is comprised of 15 elements designed to evaluate
individuals’ services and well-being through nine different Expectations—each scored as Present
or Not Present. Quality Improvement Consultants use the III tool as a guide to determine if the
expectations are being met for the person interviewed. These are summarized below, with the
number of elements included in each Expectation given in parentheses.
1. Involvement in Planning (2): Is the person involved in the development of his/her
annual plan and identification of supports and services? Does the person direct the
design of the service plan, identifying needed skills and strategies to accomplish desired
goals?
2. Involvement in Development and Evaluation (1): Is the person involved in the
development and ongoing evaluation of supports and services? Does the person
participate in the routine review of the service plan and direct changes as desired to
assure outcomes are achieved?
3. Meeting Goals and Needs (2): Is a personal outcome approach used to design person-
centered supports and services and assist the person to achieve personal goals? Is the

43
person achieving desired outcomes and goals, or receiving supports that demonstrate
progress toward these outcomes and goals?
4. Choice (2): Is the person afforded choices related to supports and services (paid and
unpaid) and is the person involved in life decisions relating to the level of satisfaction?
Does the person actively participate in decisions concerning his or her life? Is the person
satisfied with the supports and services received?
5. Health (1): Does the person feel healthy and does the person get to see a doctor when
needed? Are there things about the person’s health that could be better?
6. Safety (2): Consultant identifies the person’s knowledge of self preservation, what is
done in case of an emergency. Included in this expectation is if the person is free from
abuse, neglect and exploitation.
7. Rights (1): Is the person educated and assisted by supports and services to learn about
rights and fully exercise them, particularly rights that are important to that person?
8. Privacy/Dignity/Respect (2): Is the person treated with dignity and respect and are the
person’s privacy preferences upheld?
9. Community Involvement and Access (Community) (2): Is the person provided with
opportunities to receive services in the most integrated settings that are appropriate to the
needs and according to the choices of that person? Is the person also developing desired
social roles?
Results for the III are presented by Expectation in Figure 3. The average results have been
approximately the same since Year 4 of the Quality Management System. Also, consistent
across the years, the individual’s involvement in the review of supports and services and
community involvement were least likely to be present. However, results to date this year
indicate at least a five percentage point increase in the following: person’s involvement in the
design of the service plan, goals and dreams reflected in supports and services, exercising rights,
and developing social roles.

44
Figure 3: Individual Interview Instrument (III) Percent Present by Expectation (N=612)
July 2014 – March 2015
DD Individual Support Plan Quality Assurance (ISP QA) Checklist Each individual’s team of supports should meet annually to develop an ISP that supports the
individual’s needs and desired goals. The ISP QA Checklist was initially developed by the state,
and revised in Year 4, to ensure the ISP includes all necessary requirements as dictated by the
state, and that it helps ensure the individual has a healthy, safe, and meaningful life. Delmarva
Quality Improvement Consultants use the ISP QA Checklist form to evaluate the various
sections of the ISP, rating them on the degree to which they address all requirements.
Delmarva QICs determine an overall rating for each individual reviewed, based upon the degree
to which the ISP is written to provide a meaningful life for the individual receiving services.
There are three different categories for each ISP.
85.1%
90.1%
91.0%
89.3%
91.0%
77.9%
99.2%
90.5%
96.7%
93.8%
95.9%
94.6%
82.0%
94.0%
0% 25% 50% 75% 100%
Years 1 - 3
Year 4 (961)
Year 5 (792)
Year 6 (636)
Y7YTD (612)
9. Community involvement and access
8. Privacy, Dignity, Respect
7. Rights
6. Safety; free from abuse and neglect
5. Health
4. Choice of supports and services, and life
decisions
3. Meeting goals, needs, and interests of the
person
2. Involved in routine review of supports and
services
1. Involved in developing annual plan

45
Service Life: The ISP supports a life with basic paid services and paid supports. The person’s
needs that are “important for” the person are addressed, such as health and safety. However,
there is not an organized effort to support a person in obtaining other expressed desires that are
“important to” the person, such as getting a driver’s license, having a home, or acting in a play.
The individual is not connected to the community and has not developed social roles, but
expresses a desire to do so.
Good But Paid Life: The ISP supports a life with connections to various supports and services
(paid and non-paid). Expressed goals that are “important to” the person are present, indicating
the person is obtaining goals and desires beyond basic health and safety needs. The person may
go out into the community but with only limited integration into community activities. For
example, the person may go to church or participate in Special Olympics. However, real
community connections are lacking, such as singing in the church choir or being part of an
organized team, and the person indicates he or she wants to achieve more.
Community Life: The ISP supports a life with the desired level of integration in the community
and in various settings preferred by the person. The person has friends and support beyond
providers and family members. The person has developed social roles that are meaningful to that
person, such as belonging to a Red Hat club or a book club or having employment in a
competitive rather than segregated environment. Rather than just going to church the person
may be an usher at the church or sing in the choir. Relationships developed in the community
are reciprocal. The ISP is written with goals that help support people in moving toward a
Community Life: The ISP supports a life with the desired level of integration in the community
and in various settings preferred by the person. The person has friends and support beyond
providers and family members. The person has developed social roles that are meaningful to that
person, such as belonging to a Red Hat club or a book club or having employment in a
competitive rather than segregated environment. Rather than just going to church, the person
may be an usher at the church or sing in the choir. Relationships developed in the community
are reciprocal. The ISP is written with goals that help support people in moving toward a
Community Life, as the person chooses.
The distribution of the ISP rating for results to date this year is presented in Figure 4, with
findings from Year 1 through Year 6 provided. Findings to date indicate:
An upward trend in the percent of ISPs written to support a Community Life, up to Year
4 and 5 levels
Individuals in Regions 5 and 6 were much more likely to have ISPs written to support a
Service Life
Individuals in Region 1 were more likely to have ISPs written to support a Community
Life
Individuals living in their own place or with a parent were most likely to have an ISP
written to support a Community Life
However, close to 20 percent of individuals living with a parent had an ISP written to
support a Service Life, higher than any other setting
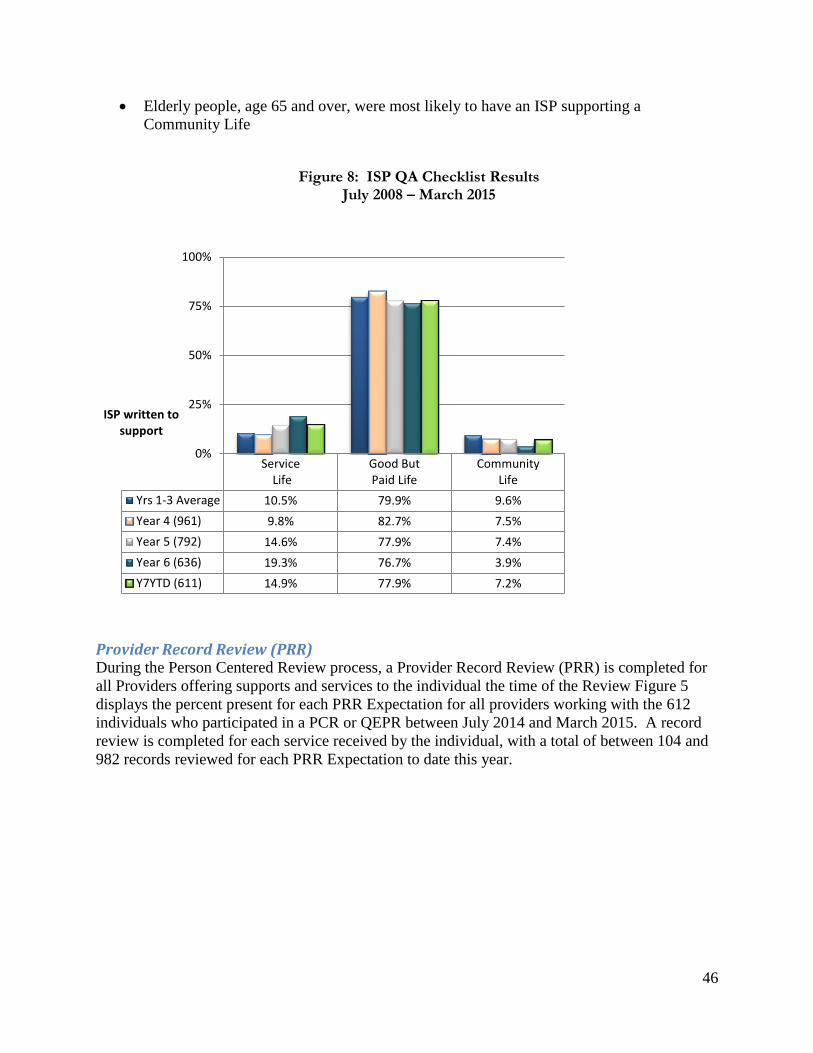
46
Elderly people, age 65 and over, were most likely to have an ISP supporting a
Community Life
Figure 8: ISP QA Checklist Results
July 2008 – March 2015
Provider Record Review (PRR) During the Person Centered Review process, a Provider Record Review (PRR) is completed for
all Providers offering supports and services to the individual the time of the Review Figure 5
displays the percent present for each PRR Expectation for all providers working with the 612
individuals who participated in a PCR or QEPR between July 2014 and March 2015. A record
review is completed for each service received by the individual, with a total of between 104 and
982 records reviewed for each PRR Expectation to date this year.
Service Life
Good ButPaid Life
CommunityLife
Yrs 1-3 Average 10.5% 79.9% 9.6%
Year 4 (961) 9.8% 82.7% 7.5%
Year 5 (792) 14.6% 77.9% 7.4%
Year 6 (636) 19.3% 76.7% 3.9%
Y7YTD (611) 14.9% 77.9% 7.2%
0%
25%
50%
75%
100%
ISP written to support

47
Figure 5: Provider Record Review (PRR) Percent Present by Expectation
July 2014 – March 2015
DD Person Centered Review Results
Support Coordinator Record Review (SCRR)
Each individual who is eligible for services through one of the waivers selects a support
coordinator to act as an advocate and help identify, coordinate, and review the delivery of
65.1%
66.6%
61.0%
63.5%
60.7%
51.9%
26.4%
24.6%
69.8%
91.9%
97.6%
24.6%
55.9%
80.7%
81.7%
73.9%
97.4%
61.4%
46.6%
54.5%
26.6%
0% 25% 50% 75% 100%
Year 3 (1,943)
Year 4 (1,414)
Year 5 (1,217)
Year 6 (1,030)
Y7YTD (982)
16. Positive behavior support plans are in
place.
15. Individual chooses community
services/supports.
14. Individual directs supports and services.
13. Individual is achieving desired goals.
12. Meets NOW/COMP documentation
requirements.
11. Means to evaluate quality and
satisfaction of services.
10. Means to identify health status and
safety needs
9. Individual is afforded choices of services
and supports.
8. Medication oversight/administration.
7. Information is protected, organized and
confidential.
6. Potential risk to individuals and staff is
managed.
5. The provider maintains a central record
for individual.
4. Clear description of services and
supports.
3. Personal funds managed by individual
and protected.
2. Human and civil rights are maintained.
1. Person centered focus supported in
documentation.

48
appropriate services, based on specific goals, needs and requirements of the individual. During
each PCR, the QICs review the individual’s record maintained by the individual’s support
coordinator. Information from the record is used to score the support coordinator on nine
different Expectations (scored as Present or Not Present):1
1. A person centered focus is supported in the documentation.
2. Human and civil rights are maintained.
3. Documentation describes available services, supports, care, and treatment of the
individual.
4. Support coordinator monitors services and supports according to the ISP.
5. Support coordinator continuously evaluates supports and services.
6. The support coordinator has an effective approach for assessing and making
recommendations to the provider for improving supports and services related to risk
management.
7. The support coordinator maintains a system of information management that protects the
confidentiality of the individual’s information.
8. Individuals are afforded choices of services and supports.
9. Individuals are included in the larger community.
1 Go to Delmarva’s GQMS website for a detailed description of each expectation and the type of probes used to determine the appropriate outcome. (http://www.dfmc-georgia.org/person_centered_reviews/index.html)

49
Figure 6: Support Coordinator Record Review Results (SCRR) Percent Present by Expectation
July 2014 – March 2015
Quality Enhancement Provider Review The purpose of the Quality Enhancement Provider Reviews is to monitor providers to ensure
they meet requirements set forth by the Medicaid waiver and Division of DD and to evaluate the
effectiveness of their service delivery system.
QEPR Administrative Review Each provider receives one Administrative Review to determine if providers have adequately
documented Qualifications and Training (Q&T) for themselves and all relevant employees. The
Q&T component includes a review of a sample of personnel records to determine if staff has the
necessary qualifications, specific to services rendered, and if the training was received within
required timeframes. Due to the degree of revisions implemented in the Administrative tools,
procedures, and the Standards for All Providers, comparisons to Years 1 through 3 are not
appropriate. In addition, five Expectations were recently revised.
The Administrative Qualification and Training Checklist is used to score providers on 11
Expectations pertaining to service specific qualifications and receiving training within
69.7%
64.8%
37.8%
69.5%
96.9%
79.9%
72.8%
65.6%
51.3%
62.2%
47.0%
0% 25% 50% 75% 100%
Yrs 1-6 Average
Y7YTD (423)
9. Individuals are included in larger community.
8. Individuals are afforded choices of services
and supports
7. Confidentiality of the individual’s information is
protected
6. Recommendations for risk management are
made and accessed.
5. SC continuously evaluates supports and
services
4. SC monitors services/supports according to
the ISP
3. Records describe available services and
supports
2. Human and civil rights are maintained
1. Person-centered focus shown in the
documentation

50
appropriate timeframes. The average compliance score for the 27 providers reviewed to date in
Year 7 was 50.1 percent. Most of the employee records reviewed for these providers did not
have job descriptions in place and most employees did not have training requirements completed.
Background screening compliance indicates only 64.8 percent of providers reviewed had all
components of the critical requirement in place.
Figure 7: Administrative Qualifications and Training Elements
Average Percent Present
July 2014 - March 2015 (N=27)
Number
Questions Expectations Y7YTD
4 The type and number of professional staff attached to the organization are properly trained, licensed, credentialed, experienced and competent. 59.2%
2 The type and number of all other staff attached to the organization are properly trained, licensed, credentialed, experienced and competent. 85.2%
6 Job descriptions are in place for all personnel. 36.4%
2 There is evidence a National Criminal Records Check (NCIC) is completed for all employees. 64.8%
4 Orientation requirements are specified for all staff. Prior to direct contact with consumers, all staff and volunteer staff shall be trained and show evidence of competence. 56.5%
15 Within the first sixty days, and annually thereafter, all staff having direct contact with consumers shall have all required annual training. 48.5%
7 Provider ensures staff receives a minimum of 16 hours of annual training. 35.8%
1 Organizations with oversight for medication or that administer medication follow federal and state laws, rules, regulations and best practices. 57.7%
1 Provider has a current certification from MHDDAD Division (receives less than $250,000 waiver dollars per year). 75.0%
1 Provider has the required current accreditation, if required (receives $250,000 or more waiver dollars per year). 87.5%
2 Providers using Proxy Caregivers must receive training that includes knowledge and skills to perform any identified specialized health maintenance activity. 50.0%
45 Average 50.1%
DD Follow-Up Reviews
Follow Up with Technical Assistance Consultation (FUTAC) Providers are tagged to receive a FUTAC through a referral system. The review process utilizes a
consultative approach to help providers increase the effectiveness of their service delivery
systems. The focus is to help improve systems to better meet the health and safety needs,
communicated choices, and preferences of individuals receiving services. The FUTAC also
supplements the PCR and QEPR processes by affording the State of Georgia and contracted
providers the opportunity to solicit technical assistance for specific needs within the service

51
delivery milieu. During the first three quarters of the contract year, 294 FUTACs were
completed. Results are displayed in Figure 8 and include the following:
Approximately 90 percent were onsite and most were referred at the individual level
(85.4%) and by one of the Regional Office Health Quality Managers (89.1%)
Most FUTAC were completed in Region 3 (60.5%)
The Support Coordinator monthly score of a 3 or 4 was the primary reason for the referral
(87.8%). A score of 3 or 4 requires that a provider submit a corrective action plan to the
Region. Regional staff may implement a “look behind” review to determine is CAP has
been met, or FUTAC may be submitted to Delmarva for additional review.
Health, Safety, and the Provider Record Review documentation were most often the
Focused Outcome Area addressed
Technical assistance most often included discussion with the provider and brainstorming
Figure 8: Follow Up with Technical Assistance Consultation
Number and Percent by Type and Referral Information
July 2014 - March 2015
Type Number Percent
Desk 31 10.5%
Onsite 263 89.5%
Referral Level
Individual 251 85.4%
Provider 43 14.6%
Referral Source
Division 2 0.7%
Health Quality Manager (HQM) 262 89.1%
Internal 10 3.4%
Other Regional Office Staff 7 2.4%
Provider 13 4.4%
Referral Reason
SC Monthly Monitoring Scores of 3 & 4s 258 87.8%
Corrective Action Plan (CAP)/Critical Incident 3 1.0%
Provider Self Request 23 7.8%
Complaints/Grievance 9 3.1%
QEPR Alert 0 0.0%
PCR Alert 1 0.3%
Compliance Review 0 0.0%
Support Plan Needing Improvement 0 0.0%
Level of Care Registered Nurse (LOC RN) Review 0 0.0%
Total 294

52
Focused Outcome Recommendations Recommendations are intended to help offer insight for providers to improve their organizational
systems and practices. Recommendations following a FUTAC often include keeping health and
medication records current and providing ongoing safety education. A total of 548
recommendations have been provided as a result of the QEPR. The following were provided to
12 or more of the 27 providers reviewed, indicating the provider should:
Summary of Developmental Disability Findings
In the first half of 2015 The Division of DD accomplished the following. Each Regional Quality
Improvement (QI) Council has provided representation on the state QI Council to enhance the
connectivity of all initiatives, with Choice selected as the overarching theme for improvement
activities. Due to changes in DBHDD priorities, the training plan is being revised to address
current needs of the state. The training Calendar is dependent on the implementation of the
Georgia Collaborative ASO timeline. Additional information will be provided in the 2015
Annual Report
The quality review processes show multiple areas where providers appear to be improving their
service delivery systems and individuals’ lives are being positively impacted. Findings indicate
most providers are not only receptive to improving the quality of their services but are flexible,
dependable, respectful, embrace a teamwork approach, have an attitude of putting the person
first, and individuals express satisfaction with supports and services.
Compared to 2014, individuals were more likely to be involved in the design of the service plan,
a key method for ensuring a person centered approach to services. Individuals were also more
likely to be developing desired social roles, an essential component of the new CMS community
Develop ongoing methods to evaluate supports and services providing an opportunity for continuous quality improvement
Assist individuals in developing more person centered goals that matter most to the person.
Identify ways to expose individuals to new experiences in their communities.
Consider the use of communication books, picture books or other means of communication to ensure individuals who communicate in different ways are afforded choice (s).
Develop practices of ongoing learning on the individuals’ preferences for exercising rights.
Explore alternate rights educational materials to accommodate individuals with different communication and learning styles.

53
life requirements. The person’s goals and dreams were more likely to be reflected in supports
and services and individuals were more likely to indicate they are educated on and assisted to
exercise their rights. These were also reflected in the ISPs reviewed to date this year, for which
the proportion written to reflect a Community Life has increased for the first time since FY 2012.
The percent of ISPs with all goals written with a person centered approach has increased by 12
percentage points since Year 6.
The average Support Coordination documentation score has improved for the first time since
FY2008. It is hypothesized that the increase could be a result of additional technical assistance
provided by DBHDD and Delmarva, or increased documentation QA provided internally by each
Support Coordination agency. Compared to 2014, Support Coordination documentation is much
more likely to show how individuals are afforded choice of services and supports, and more
likely to reflect a person centered approach to services. While PRR results on average have not
improved since 2014, providers were somewhat more likely to protect the person’s personal
information. Twenty-three of the 27 providers reviewed through the QEPR were properly trained
or credentialed in the professional field as required and 23 were experienced and competent in
the services, supports, care and treatment they provide.
Health and Safety Findings ISP QA checklist results indicate continued issues with signed medication consent forms, signed
Behavior/Crisis/Safety plan(s), and updates to the HRST as required. In addition, only about one
quarter of providers documented a means to identify the person’s health status and safety needs
and about 25 percent of providers had not adequately documented potential risk to individuals
and staff (PRR results). While staff interviews show high compliance for health on average,
close to 20 percent of the staff interviewed were not providing individuals with ongoing
education on self-reliance in healthcare and self-preservation. Health and safety were often the
Focused Outcome Area for a FUTAC and of the 27, Administrative Q&T results indicated:
10 providers had staff that did not have the required training for recognizing and
reporting suspected abuse, neglect or exploitation of any individual
17 had staff not properly trained on the holistic care of the individual
16 to 18 providers did not document annual training for Emergency and disaster plans
and procedures, specific individual medications and their side effects, fire safety, and/or
the organization's infection control policies and procedures
11 providers did not have proper training for medication oversight and administration
The new eISP process will be implemented with the Georgia Collaborative ASO. As this process
is implemented, requirements will be developed to ensure proper assessments are completed and
all required documentation including consents and behavior support plans are signed before
completing the ISP process.
Person Centered Practices Positive results noted previously indicate some improvement has been seen in the area of Person
Centered Practices. However, because this is instrumental to meeting new CMS standards and
assurances, it is important to continue to address areas where the data suggest Providers fall
short. III results indicated individuals (18%) were not always involved in the routine review of
service plans. In a population of approximately 20,000 individuals, this represents 3,600

54
individuals. Close to 21% of ISPs had only up to one of four expectations present supporting the
person’s Dreams and Visions.
Provider Record Review results indicate providers continue to struggle with using a person-
centered focus in their documentation, suggesting services are not generally implemented with
person centered practices. Compliance decreased from a July 2014 rate of 34% to a rate of 27%
by the end of the first quarter of 2015. Individuals do not seem to be as likely to manage their
own funds as in previous years, which is a key to person-centered practices and also another new
CMS expectation. This standard showed a decrease of 24 percentage point to 46.6%, and has
shown a downward trend since FFY2010 (92.4%). Provider documentation indicating choice of
services and ensuring the person directs supports and services has remained consistently low,
55.9% and 24.6% respectively. DBHDD is embarking on a new Person-Centered Practice
training series which will provide quality improvement opportunities to address these
inefficiencies
Staff may interact with individuals on a daily basis. Close to 70% of staff interviewed could
describe the procedures and responsibilities needed to establish a person-centered approach to
service delivery. Fewer than half of Support Coordinators used a person-centered focus in the
documentation. Approximately 40% of coordinators documented providing choice of services
and supports for individuals. Review results indicate 16 of the 27 providers who participated in
a QEPR did not have training in person centered values, principles and approaches within 60
days of direct service provision.
With the implementation of the new eISP, it is expected that with the implementation of the new
ISP process, people served will have more opportunity to direct the ISP and goals. However, the
new system itself will not generate this type of practice. The Division of DD will take steps to
ensure the philosophy, intentions and purpose of person centered planning are integral
components of the training on the new ISP process. Additionally, the new eISP will be
accessible and easily modified by the person and/or the supports in place to ensure the person is
“driving” supports and services, which is also a requirement of the new CMS definition of
person centered practices
Community Many of the standards reviewed indicate continued issues surrounding the person’s ability to
access and/or have informed choice of community activity. Approximately 32% of individuals
interviewed indicated they were not developing desired social roles. In a population of 20,000,
that informs us over 6,000 individuals with IDD are not participating in the community as
preferred. While there has been a small increase in the proportion of ISPs written to support a
community life, only seven percent of plans support real community integration. Therefore, for
20,000 ISPs fewer than 1,500 conform to CMS standards of ensuring individuals can access
communities the same as other citizens.
Almost 75% of providers had not documented how individuals are choosing community supports
and services and approximately 62% of support coordinators had not documented how
individuals are included in the larger community. Staff interview results have traditionally been
quite high. However, close to 37% of staff interviewed to date this year did not ensure services
rendered in the community promoted integration and the support of desired social roles.
55
Current data show a small increase in the ISPs written to support a community life, however the
overall percent remains quite low. In the second half of 2015, the DBHDD will take steps to
develop education curriculum addressing the topic of valuing the person and community
involvement and methods to reframe thinking about community inclusion. Newly released CMS
rulings require that States document and exhibit community integration for individuals they
support. DBHDD has partnered with the Georgia Department of Community Services (Georgia’s
Medicaid agency) to provide IDD providers with focused training and technical assistance on
increasing and maintaining community integration and the new CMS rules governing community
integration.
Quality Enhancement Provider Reviews Administrative review of employee records for the 27 providers who participated in a QEPR
reflected relatively low compliance on required qualifications and training, including back
ground screening. It is important to note that most of the providers had not ever participated in
the QEPR or benefited from the technical assistance provided during the review process. Seven
providers had fewer than 30% of the training standards met and seven providers had fewer than
40% of the PRR standards met.
The Division of DD must continue to hold providers accountable regarding responsibilities to
train staff and conduct background screening, to ensure that there is a greater chance individuals
will be treated with respect and maintain health and safety. If staff has the knowledge regarding
health issues, medications, rights, safety, and person centered practices the more likely they are
to share this information with individuals served, to help them become more independent and
knowledgeable. Technical assistance and accountability will be increased with the
implementation of the Georgia Collaborative ASO.
Data Reliability Process Accurate and reliable data are essential for the success of the DBHDD QM Program. Some of
the DBHDDs data integrity activities include:
Hospital System KPI Data Integrity The Hospital System Quality Management office has utilized the newly developed performance
measure evaluation tool (PMET) to identify and assess those KPIs that need additional work in
order to assure data integrity. The Hospital System PQC has prioritized data integrity as an
important issue and the Assistant Director of Hospital System Quality Management is working
with the Hospital Quality Managers committee to make the needed improvements.
Beginning with the reporting period of January 2014, reporting tools were developed to give
hospitals the ability to drill down directly to reported data failures and make needed corrections
to data that is reported to The Joint Commission (commonly known as the HBIPs measures). Use
of that tool resulted in several data-collection methodology changes, which improved the
reliability of the data and timeliness of reporting. As reporting requirements by The Joint
Commission and Centers for Medicare and Medicaid Services change, these reports are altered
and improved in order to give the hospitals the maximum amount of data integrity and reporting
capability.

56
In addition, beginning in December 2013, DBHDD’s EMR system was improved to capture
needed data directly from the physician electronic record. This improved data collection by
eliminating interpretation and data re-entry of the reported data.
Community BH Key Performance Indicator Data Integrity The majority of the data that comprises the CBH KPIs is received from providers via a monthly
programmatic report. These reports are submitted through an online web-portal. Once the data
is received by DBHDD the data must pass a logic safeguard validation and is reviewed by staff
with programmatic oversight of each specific program before it is accepted. DBHDD Regional
Offices also have access to the web-portal and have the ability to give additional comments
regarding the validity of the reports. Feedback is given to providers when errors or omissions
occur and they are required to re-complete and re-send their data once corrected. Technical
Assistance is provided as needed.
DD KPI Data Integrity Every two weeks, the analyst working with Delmarva runs a report to identify any incorrect or
missing data from the database. This process generates a report from data collected as part of the
PCR and QEPR processes which is reviewed by managers, who correct any identified errors.
In order to ensure proper handling of possible missing data or data errors, a Data Correction
Protocol has been developed to track data errors and necessary correction. For approved reviews
or reports, all changes in the data are documented in the “Reopen Review Log”. This information
is reviewed periodically by the quality improvement regional manager for possible trends. After
the data in the report have been corrected, a new report is generated and distributed as necessary.
Summary The sections above reference the multitude of quality related activities taking place across
DBHDD. Key activities that have taken place between January 2015 and June 2015 include the
annual DBHDD QM system review; a review and updating of the hospital QM system, a review
of DBHDD’s KPIs, continued training of providers on cognitive therapy (Beck Initiative) and the
expansion of suicide prevention activities and the creation of the Department’s first Mortality
Review Report. The Division of Developmental Disabilities has drafted specific performance
and outcome indicators for its providers and the services received by individuals and their
families; is undergoing a re-organization to functionally align the supports and services provided;
has implemented several QI initiatives to address areas of need; is developing a more person-
centered and user friendly ISP; is addressing the weaknesses of its transition process to better
support individuals moving from a state hospital to the community; and continues to stress the
importance of community integration for all individuals supported by the Division of
Developmental Disabilities.
During the upcoming six months, quality management activities will focus on the continued
assurance of quality transitioning of individuals from state hospitals to the community, the
implementation of the Georgia Collaborative ASO, the DD re-engineering project, finalizing the
corrective action plan/enforcement process, submission of the NOW/COM waiver applications,
finalizing the IDD rate structure, implementation of a new support coordination process and
intensive support coordination for IDD, incorporating independent subject matter expert review

57
of settlement service consumer deaths, and analyzing & utilizing data trends/patterns to make
program decisions and improvements.

58
Appendix A DBHDD Quality Management Work Plan
Goal 1: Develop accurate, effective and meaningful performance indicators.
Tasks Responsible Person Target Completion Date
Status
Determine the criteria for
developing the key performance
indicators
Carol Zafiratos June 2013 Completed
Identify and assess current
performance indicators for value
and applicability
Carol Zafiratos, Steve
Holton, Eddie Towson
June 2013 Completed and now ongoing
Collaborate with stakeholders
using the identified criteria to
develop key performance
indicators
Program Quality Councils July 2013 Completed and now ongoing
Develop and implement data
collection plans for KPIs (identify
responsible persons for data
entry, collection, reporting, etc.)
Carol Zafiratos, Steve
Holton, Eddie Towson
August 2013 Completed
Goal: 2 Educate stakeholders regarding QM (includes staff, providers and ultimately individuals
and families).
Tasks Responsible Person Target Completion Date
Status
Update the current QM Training
Plan and ensure inclusion of
training for hospitals, CBH and
DD
Carol Zafiratos and Training
Department
June 2013 Delayed until September 2015
Continue development of web
based training materials – three
additional modules
Carol Zafiratos and Training
Department
December 2013 Completed
Develop and implement
methodology to evaluate the
effectiveness of the training
Carol Zafiratos and Training
Department
December 2013 Completed

59
Goal: 3 Assess and improve the effectiveness of the QM system and its various components.
This is a multi-year goal.
Tasks Responsible Person Target Completion Date
Status
Implement the EQC approved
outcomes framework
(identify/revise KPIs as
applicable, develop a data
definition/collection plan for each
measure and implement data
collection).
Program Quality Council
Chairpersons
June 2013 Completed. It
is anticipated
that the
framework
will be
revised in
2015.
Assess achievement levels of
quality goals
Program Quality Council
Chairpersons
March 2014 Competed
Assess performance indicator
achievement against target
thresholds
Program Quality Council
Chairpersons
March 2014 Completed
Modify QM system and/or
components as needed
Program Quality Council
Chairpersons
March 2014 Completed
and now
ongoing
Goal 4: Integrate QM Data Systems (have access to the data needed that is compatible with the
hospital, community BH and community DD systems and which follows an individual and the
services they receive across their lifetime, as applicable). This is a multi-year goal.
Tasks Responsible Person Target Completion Date
Status
Perform a comprehensive QM
data management needs
assessment
Director of IT and Carol
Zafiratos, Steve Holton and
Eddie Towson
January 2014 Significantly
revised. Refer
to the updated
QM Plan
when
modified.
Define and develop data sharing
partnerships/agreements with
other agencies (DCH, DJJ, DOE,
DPH, DAS, etc.)
DBHDD Leadership
representative(s) [COO &
Director of IT]
July 2014 Significantly
revised. Refer
to the updated
QM Plan
when
modified.
Create a QM information
management plan (i.e.: policy and
procedure development)
Director of IT July 2014 Significantly
revised. Refer
to the updated
QM Plan
when
modified.
Develop a RFP to build a Director of IT July 2014 Significantly

60
DBHDD Enterprise Data Systems
(EDS)
revised. Refer
to the updated
QM Plan
when
modified.
Develop the DBHDD EDS Director of IT 2015 Significantly
revised. Refer
to the updated
QM Plan
when
modified.
Evaluate the effectiveness and
efficiency of the newly created
system
Director of IT, Carol
Zafiratos, Steve Holton and
Eddie Towson
2016 Significantly
revised. Refer
to the updated
QM Plan
when
modified.

61
Appendix B Hospital System Quality Management Work Plan
Goal 1: Develop accurate, effective and meaningful performance indicators.
Tasks Responsible Person Target Completion Date
Status
Determine the criteria for
developing the key performance
indicators
Carol Zafiratos June 2013 Completed
Identify and assess current
performance indicators for value
and applicability
Steve Holton, Dr. Risby,
Carol Zafiratos
June 2013 Completed
Modify KPIs, as appropriate Hospital System Quality
Council
July 2013 Completed
Develop and implement data
collection plans for KPIs (identify
responsible persons for data
entry, collection, reporting, etc.)
Steve Holton and Carol
Zafiratos
August 2013 Completed

62
Goal 2: Educate stakeholders regarding QM (includes staff, providers and ultimately individuals and families).
Tasks Responsible Person Target Completion Date
Status
Update the current QM Training
Plan and ensure inclusion of
training for hospitals
Carol Zafiratos, Steve Holton
and Training Department
June 2013
DBHDD
reorganization has
affected the target
dates for this goal
and will be adjusted
as new leadership
has an opportunity to
review and revise.
The scope and
specificity of
the training
plan has been
modified –
refer to the
Learning Plan
contained
within the
QM Plan for
specifics
Identify desired knowledge,
skills, abilities and behaviors for
current and prospective quality
management facilitators and
leaders.
DBHDD Quality
Management Director
August 2013
DBHDD
reorganization has
affected the target
dates for this goal
and will be adjusted
as new leadership
has an opportunity to
review and revise.
The revised
DBHDD
Learning Plan
will include
Hospital
Quality
Managers
Assess training needs of QMs
This task is no longer a necessary
step in this training plan. All
QMs, as well as other DBHDD
QM team facilitators and leaders
will receive the standard QM
facilitation curriculum.
Director of Hospital System
Quality Management
Sept 15, 2013
DBHDD
reorganization has
affected the target
dates for this goal
and will be adjusted
as new leadership
has an opportunity to
review and revise.
The revised
DBHDD
Learning Plan
will include
Hospital
Quality
Managers
Develop training plans and
methodology for QMs
This task is no longer a necessary
step in this training plan. All
QMs, as well as other DBHDD
QM team facilitators and leaders
will receive the standard QM
facilitation curriculum.
Director of Hospital System
Quality Management, Carol
Zafiratos and Training
Department
Nov 1, 2013
DBHDD
reorganization has
affected the target
dates for this goal
and will be adjusted
as new leadership
has an opportunity to
review and revise.
Completed at
the DBHDD
level

63
Goal 3: Assess and improve the effectiveness of the QM system and its various components.
Tasks Responsible Person Target Completion Date
Status
Set target values for Hospital
System KPIs.
Dr. Emile Risby – Chair
Hospital System Program
Quality Council
June 2013 Completed
Each hospital creates their data
definition/collection plans
Program Quality Council
Chairpersons
Dec. 2015
New KPIs have
been established,
but there are also
a few more that
we are
developing
related to
Provision of
care, budget, and
discharge.
Each hospital identifies and
submits their KPIs (hospital level)
and PI goals to the HS PQC
Program Quality Council
Chairpersons
March 2014 Completed
Hospitals update analyses and
begin to prepare reports for
Hospital System PQC (Quality
Management effectiveness review
meeting scheduled for Sept
2016).
Program Quality Council
Chairpersons
Sept 2016 This has been
changed to the
Hospital System
level.

64
Goal 4: Integrate QM Data Systems (have access to the data needed that is compatible with the hospital, community BH and community DD systems and which follows an individual and the services they receive across their lifetime, as applicable).
Tasks Responsible Person Target Completion Date
Status
Organize a Hospital System
information management
committee
Director of Hospital System
Quality Management
July 15, 2013 Completed
Develop methodology for
performing IM needs assessment
Chair of Information
Management Committee &
Director of Hospital System
Quality Management
September 1, 2013 Completed
Perform needs assessment in
hospitals and analyze results
Chair of Information
Management Committee &
Director of Hospital System
Quality Management
November 1, 2015 Currently
being
performed by
the OIT
consultants.
Set priorities for IM needs and
communicate priorities to OIT, as
appropriate.
Chair of Information
Management Committee &
Director of Hospital System
Quality Management
December 1, 2015 Revised target
date to
December
2015
Develop Hospital System IM plan
Chair of Information
Management Committee &
Director of Hospital System
Quality Management
December 31, 2015 Revised target
date to
December
2015

65
Appendix C Community Behavioral Health Quality Management Work Plan
Goal 1: Develop accurate, effective and meaningful performance indicators.
Tasks Responsible Person Target Completion Date
Status
Distribute Performance Measure
Evaluation Tool (PMET) to CBH
committee members
Carol Zafiratos July 2013 Completed
Utilize criteria (from PMET) to
assess current KPI’s
Chris Gault and CBH
Program Staff
September 2013 Completed
Use PEMT and develop new
KPI’s as indicated
Chris Gault and CBH
Program Staff
October 2013 Completed and ongoing
Make recommendations regarding
the infrastructure that is needed to
ensure data integrity and follow
up for new KPIs
Chris Gault and CBH
Program Staff
October 2013 Completed
Collaborate with stakeholders to
review and provide feedback on
new KPI’s
Chris Gault and CBH
Program Staff
October 2013 Completed and ongoing
Develop data collection plans for
new KPIs (identify responsible
persons for data entry, collection,
reporting, etc.)
Chris Gault and CBH
Program Staff
November 2013 Completed
Implement data collection plans
for new KPIs
Chris Gault and CBH
Program Staff
January 2014 Completed and ongoing
Initiate provider based data
integrity reviews
Resources need to be
identified
August 2015 Delayed, incorporated into ASO procurement
Goal: 2 Educate stakeholders regarding QM (includes staff, providers and ultimately individuals
and families).
Tasks Responsible Person Target Completion Date
Status
Develop and implement
recommendations for the first
three quality management related
training modules for State and
Regional Office BH staff
CBH PQC and Carol
Zafiratos
Start Date =
September 2013
Completion Date =
January 2014
1st and 2
nd
modules
completed
Once approved implement the
training recommendations and
monitor compliance for state staff
CBH Program Managers Start Date = October
2013 Completed
Develop a QM training plan for CBH PQC, Chris Gault and January 2014 Delayed, new

66
providers Monica Parker target date October 2015
Develop a QM training plan for
individuals served and families
CBH PQC, Chris Gault and
Monica Parker
March 2014 Delayed, new target date October 2015
Goal: 3 Assess and improve the effectiveness of the QM system and its various components.
This is a multi-year goal.
Tasks Responsible Person Target Completion Date
Status
Using the PMT, annually review
all KPI’s for efficiency and
effectiveness
CBH PQC March 2015 Delayed, new target date September 2015
Goal 4: Integrate QM Data Systems (have access to the data needed that is compatible with the
hospital, community BH and community DD systems and which follows an individual and the
services they receive across their lifetime, as applicable). This is a multi-year goal.
Tasks Responsible Person Target Completion Date
Status
Make recommendations based
upon KPI selection for future data
needs
CBH PQC through Chris
Gault
December 2013 and
ongoing
Completed
and ongoing

67
Appendix D Developmental Disabilties Quality Management Work Plan Goal 1: Assess and improve the effectiveness of the QM System and its various components
that assures quality person-centered supports and services for individuals with developmental
disabilities. Goal 2: Develop accurate and meaningful performance indicators.
Tasks Responsible
Person
Target
Completion
Date
Status
Documentation review (i.e.
relevant policies and
procedures, recent CMS
Waiver changes, DOJ
Settlement Agreement, etc.)
Director of DD
Quality
Management and
Contractor
06/30/13 Completed
Assessment of current data
collection methods
Director of DD
Quality
Management and
ASO
07/31/13
Revised to
07/01/15
Assessment of current data
utilization
Director of DD
Quality
Management and
Contractor
07/31/13 Completed.
Interview Central and
Regional Office staff to
identify capabilities of
quality practitioners
Director of DD
Quality
Management and
Contractor
07/31/13 Completed.
Conduct Stakeholder
interviews to determine
capabilities of quality
practitioners
Director of DD
Quality
Management and
Contractor
07/31/13 Completed.
Conduct Focus Groups with
targeted stakeholders to
collect information on
strengths, benefits and
opportunities for
improvement
Director of DD
Quality
Management and
Contractor
07/31/13 Completed.
Conduct Interviews with
service provider and service
coordination staff
Director of DD
Quality
Management and
Contractor
07/31/13 Completed.
Conduct comparison of
requirements generated by
DBHDD to CMS and DOJ
requirements
Director of DD
Quality
Management and
Contractor
07/31/13 Completed.
Establish QI Council
workgroup to design new
QM system with
participation from DD
Director of DD
Quality
Management and
Contractor
07/31/13 –
Revised to
02/01/14
Planning timeline for
design of new system
has been extended to
allow for more thorough

68
Advisory Council planning and
development
Develop report describing
the status of the "as is"
system
Director of DD
Quality
Management and
Contractor
08/01/13 Completed.
See Attachment 1-
Quality Management
System Review -
Summary of Current
Status Report
Develop recommendations
for improvements to
Georgia’s quality system
Director of DD
Quality
Management and
Contractor
08/01/13 –
Revised to
02/01/14
In process
See Attachment 1-
Quality Management
System Review -
Summary of Current
Status Report
As part of Goal 1 DD will
establish accurate, effective,
and meaningful
performance indicators for
DD Services and DD
Providers
Director of DD
Quality
Management and
Contractor
08/15/13 –
Revised to
03/01/14
Completed
Finalize measurements Director of DD
Quality
Management and
Contractor
09/15/30/13 –
Revised to
03/01/14 then to
12/31/14 and
revised again to
03/01/15
Develop comprehensive
description of redesign for
statewide DD QM system
Director of DD
Quality
Management and
Contractor
10/01/13 –
Revised to
03/01/14
Planning timeline for
design of new system
has been extended to
allow for more thorough
planning and
development
Goal 3: Educate Stakeholders regarding QM (including staff, providers, and individuals
and families)
Tasks Responsible
Person
Target
Completion
Date
Status
Identify core knowledge and
skill requirements for each
quality role identified.
Director of DD
Quality
Management and
Dept Director of
QM
08/31/13.
Revised to
05.01.15
Completed.

69
Review and analyze the
instructional
system/knowledge and basic
skill topics with DBHDD
Staff and quality councils.
Director of DD
Quality
Management and
Dept Director of
QM
08/31/13 –
Revised to
07/01/16
Planning timeline for
design of new system
has been extended to
allow for more thorough
planning and
development
Develop materials and
methods for learning
management and curriculum
development
Director of DD
Quality
Management and
Dept Director of
QM
09/30/13 –
Revised to
07/01/16
Development timeline
has been extended to
allow for more thorough
planning and
development
Create DD training program
draft and review with
DBHDD Staff and Quality
Councils
Director DD
Quality
Management
10/31/13 –
Revised to
07/01/16
Timeline has been
adjusted as a result of
extended planning and
development period
Finalize training program
with input from Quality
Councils and Advisory
Council
Director DD
Quality
Management
11/15/13 –
Revised to
07/01/16
Timeline has been
adjusted as a result of
extended planning and
development period
Train staff and stakeholders
on new DD QM System
Director DD
Quality
Management and
Contractor
12/15/13 –
Revised to
07/01/16
Timeline has been
adjusted as a result of
extended planning and
development period
Draft a manual which
includes the following
sections:
Director of DD
Quality
Management and
Contractor
12/15/13 –
Revised to
07/01/16
Timeline has been
adjusted as a result of
extended planning and
development period
QM and improvement
requirements section
Roles and
responsibilities
section
Guidance on joint
agency collaboration
Reporting
requirements
Tools for data
collection and
analysis
Review drafts of each section
with DBHDD staff and QI
Councils and Advisory
Council
Director of DD
Quality
Management
12/31/13 –
Revised to
07/01/16
Timeline has been
adjusted as a result of
extended planning and
development period
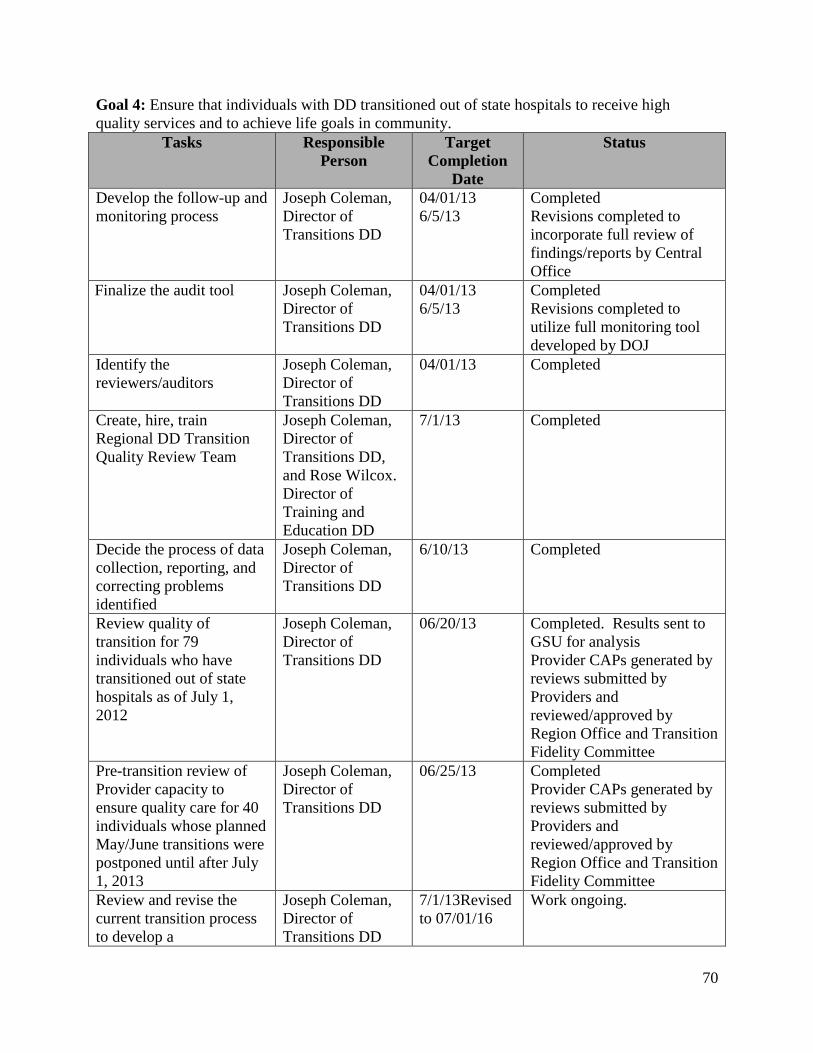
70
Goal 4: Ensure that individuals with DD transitioned out of state hospitals to receive high
quality services and to achieve life goals in community.
Tasks Responsible
Person
Target
Completion
Date
Status
Develop the follow-up and
monitoring process
Joseph Coleman,
Director of
Transitions DD
04/01/13
6/5/13
Completed
Revisions completed to
incorporate full review of
findings/reports by Central
Office
Finalize the audit tool Joseph Coleman,
Director of
Transitions DD
04/01/13
6/5/13
Completed
Revisions completed to
utilize full monitoring tool
developed by DOJ
Identify the
reviewers/auditors
Joseph Coleman,
Director of
Transitions DD
04/01/13 Completed
Create, hire, train
Regional DD Transition
Quality Review Team
Joseph Coleman,
Director of
Transitions DD,
and Rose Wilcox.
Director of
Training and
Education DD
7/1/13 Completed
Decide the process of data
collection, reporting, and
correcting problems
identified
Joseph Coleman,
Director of
Transitions DD
6/10/13 Completed
Review quality of
transition for 79
individuals who have
transitioned out of state
hospitals as of July 1,
2012
Joseph Coleman,
Director of
Transitions DD
06/20/13 Completed. Results sent to
GSU for analysis
Provider CAPs generated by
reviews submitted by
Providers and
reviewed/approved by
Region Office and Transition
Fidelity Committee
Pre-transition review of
Provider capacity to
ensure quality care for 40
individuals whose planned
May/June transitions were
postponed until after July
1, 2013
Joseph Coleman,
Director of
Transitions DD
06/25/13 Completed
Provider CAPs generated by
reviews submitted by
Providers and
reviewed/approved by
Region Office and Transition
Fidelity Committee
Review and revise the
current transition process
to develop a
Joseph Coleman,
Director of
Transitions DD
7/1/13Revised
to 07/01/16
Work ongoing.

71
comprehensive process /
plan
Goal 5: Integrate QM Data Systems in a matter which is compatible with Department data
systems (Hospital, Community BH and Community DD) which will allow Division to follow an
individual and their services across their lifetime. This is a multi-year goal.
Tasks Responsible
Person
Target
Completion
Date
Status
Develop Division DD
information management
committee
Director of DD
Quality
Management
08/01/13.
Revised to In
place and
ongoing.
ASO (Georgia
Collaborative) has been
procured and
implementation is
underway. There are two
teams of DBHDD and
Collaborative staff that
are responsible for this
work. The Collaborative
QM Team and the
Collaborative IT Team
Assessment current
information management
systems methods for
collection and utilization
Director of DD
Quality
Management and
Division Data
Manager
08/01/13
Revised to
Ongoing
Ongoing
ASO (Georgia
Collaborative) has been
procured and
implementation is
underway. DD staff are
working with Business
Analyst to develop work
flows for collection and
utilization
Set priorities for IM needs
and work with OIT to
address those needs as
appropriate.
Director of DD
Quality
Management and
Division Data
Manager
10/01/13
Completed and ongoing.
ASO (Georgia
Collaborative) has been
procured and
implementation is
underway. There are two
teams of DBHDD and
Collaborative staff that
are responsible for this
work. The Collaborative
QM Team and the
Collaborative IT Team
Include development of
new DD case management
Director of DD
Quality
10/01/13
Revised to
Completed

72
system in the Department’s
RFP for an Administrative
Service Organization
(ASO). Revised to:
Develop new ISP for
inclusion in the Georgia
Collaborative Case
Management System
Management 07/01/15
Work with ASO to develop
and test new system
Director of DD
Quality
Management and
Vendor
08/01/14 –
Revised to
01/01/2016
Timeline adjusted to
match ASO
implementation timeline.
Train end users on new
system Director of DD
Quality
Management and
Vendor
10/01/14 –
Revised to
01/01/2016
Timeline adjusted to
match ASO
implementation timeline.
Transition data from old
case management system to
new system
Director of DD
Quality
Management and
Vendor
12/31/14 -
Revised to
01/01/16
Timeline adjusted to
match ASO
implementation timeline.

73
Appendix E Hospital System KPI Dashboards
Jul-14 Aug-14 Sep-14 Oct-14 Nov-14 Dec-14 Jan-15 Feb-15 Mar-15 Apr-15 May-15 Jun-15
Numerator 104 114 140 127 111 108 134 80 97 107 133 N/A
Denominator 123 138 185 162 136 136 161 103 119 143 153 N/A
Rate 85% 83% 76% 78% 82% 79% 83% 78% 82% 75% 87% #N/A
Quarterly Average
July-September 2014 Analysis
Respondents still rated DBHDD's service higher than the national average. However, a slight downward trend over the previous
four quarters is noted. Recommend continued monitoring and improvement in services.
Data collection is incomplete for this quarter.
January-March 2015 Analysis
The average positive response remains within the target range. Recommend continued monitoring.
October-December 2014 Analysis
Scores have continued to fall well within the target range during this period.
April-June 2015 Analysis
Client Perception of Outcome of Care
MEASURE DEFINITION AND EXPLANATION
Measure definition: The percent of clients at discharge or at annual review who respond positively to the outcome domain on
the Inpatient Consumer Survey.
Measure explanation: This measure shows client responses to the following questions:
*I am better able to deal with crisis.
*My symptoms are not bothering me as much.
*I do better in social situations.
*I deal more effectively with daily problems.
(Source: NRI) The determination of the line where the red/yellow areas of the graph meet is based on the national average
published by NRI for December 2013 through November 2014, less one standard deviation. (Data collection for surveys were
started state-wide in February 2012.)
COMPONENTS OF NUMERATOR AND DENOMINATOR
Numerator: Number of clients who respond positively to the
outcome domain
Denominator: Number of clients completing at least 2 items in the
outcome domain Included populations: Clients who were
discharged during the period and completed at least 2 questions
in the domain. Only clients served in programs associated with
Adult Mental Health are surveyed.
COMMENTS AND/OR ANALYSIS PER QUARTER
80% 80% 81% Incomplete data
30%
35%
40%
45%
50%
55%
60%
65%
70%
75%
80%
85%
90%
95%
100%
Jul-14 Aug-14 Sep-14 Oct-14 Nov-14 Dec-14 Jan-15 Feb-15 Mar-15 Apr-15 May-15 Jun-15

74
Jul-14 Aug-14 Sep-14 Oct-14 Nov-14 Dec-14 Jan-15 Feb-15 Mar-15 Apr-15 May-15 Jun-15
Numerator 74 109 136 129 106 99 111 69 90 100 120 N/A
Denominator 120 140 182 164 138 129 161 102 116 143 149 N/A
Rate 62% 78% 75% 79% 77% 77% 69% 68% 78% 70% 81% #N/A
Quarterly Average
July-September 2014 Analysis
Despite the expected seasonal drop in rate, respondents still rated DBHDD's service higher than the national average.
Data collection is incomplete for this quarter.
January-March 2015 Analysis
Clients continue to score the Hospital System's performance in client empowerment above the national average and within the
acceptable range.
October-December 2014 Analysis
Scores have continued to fall well within the target range during this period, with an overall slight improment trend over the
course of the year.
April-June 2015 Analysis
Client Perception of Empowerment
MEASURE DEFINITION AND EXPLANATION
Measure definition: The percent of clients at discharge or at annual review who respond positively to the empowerment
domain on the Inpatient Consumer Survey.
Measure explanation: This measure shows client responses to the following questions:
*I had a choice of treatment options.
*My contact with my doctor was helpful.
*My contact with nurses and therapist was helpful.
(Source: NRI) The determination of the line where the red/yellow areas of the graph meet is based on the national average
published by NRI for December 2013 through November 2014, less one standard deviation. (Data collection for surveys were
started state-wide in February 2012.)
COMPONENTS OF NUMERATOR AND DENOMINATOR
Numerator: Number of clients who respond positively to the
empowerment domain
Denominator: Number of clients completing at least 2 items in the
empowerment domain Included populations: Clients who were
discharged during the period and completed at least 2 questions
in the domain. Only clients served in programs associated with
Adult Mental Health are surveyed.
COMMENTS AND/OR ANALYSIS PER QUARTER
72% 77% 71% Incomplete data
30%
35%
40%
45%
50%
55%
60%
65%
70%
75%
80%
85%
90%
95%
100%
Jul-14 Aug-14 Sep-14 Oct-14 Nov-14 Dec-14 Jan-15 Feb-15 Mar-15 Apr-15 May-15 Jun-15

75
Jul-14 Aug-14 Sep-14 Oct-14 Nov-14 Dec-14 Jan-15 Feb-15 Mar-15 Apr-15 May-15 Jun-15
Numerator 293 278 310 295 225 277 276 234 270 267 280 N/A
Denominator 296 282 312 300 225 280 279 234 272 271 282 N/A
Rate 99% 99% 99% 98% 100% 99% 99% 100% 99% 99% 99% #N/A
Quarterly Average
July-September 2014 Analysis
Rate remains above The Joint Commission guidelines. Continued monitoring is recommended.
Data collection is incomplete for this quarter.
January-March 2015 Analysis
Rate continues to be reported above The Joint Commission guideline rate, including a reported (and rare) 100% score for the
month of February. Continued monitoring is recommended.
October-December 2014 Analysis
Scores have continued to fall well within the target range during this period.
April-June 2015 Analysis
Continuing Care Plan Created (Overall)
MEASURE DEFINITION AND EXPLANATION
Measure definition: Patients discharged from a hospital-based inpatient psychiatric setting with a continuing care plan that
contains all of the following: reason for hospitalization, principal discharge diagnosis, discharge medications and next level of
care recommendations.
Measure explanation: This measure is a nationally standardized performance measure for behavioral health organizations,
reported to The Joint Commission through our partner, NRI, on a quarterly basis. The data are for people who were treated in
adult mental health inpatient programs only.
The colored bands represent ranges that indicate level of acceptibility of scores and are based The Joint Comission "Target
Rates" published quarterly, 4 to 5 months after the quarter ends. The most recent rates published are used as guides for
current data. The red area of the graph indicates the area that is below The Joint Commission's Target Range. The Joint
Commission changed the target range in October 2012 from 93.4% to 94.4%.
COMPONENTS OF NUMERATOR AND DENOMINATOR
Numerator: Psychiatric inpatients for whom the post
discharge continuing care plan is created and contains all of
the following: reason for hospitalization, principal discharge
diagnosis, discharge medications and next level of care
recommendations.
Included Populations: NA
Excluded Populations: None
Denominator: Psychiatric inpatient discharges. Included
Populations: Patients referred for next level of care with ICD-9-CM
Principal or Other Diagnosis Codes for Mental Disorders.
Excluded Populations: The following cases are excluded: •
Patients who expired • Patients with an unplanned departure
resulting in discharge due to elopement or failing to return from
leave • Patients or guardians who refused aftercare • Patients or
guardians who refused to sign authorization to release information
• Patients discharged to another unit within the same hospital
COMMENTS AND/OR ANALYSIS PER QUARTER
99% 99% 99% Incomplete data
85%
90%
95%
100%
Jul-14 Aug-14 Sep-14 Oct-14 Nov-14 Dec-14 Jan-15 Feb-15 Mar-15 Apr-15 May-15 Jun-15

76
Jul-14 Aug-14 Sep-14 Oct-14 Nov-14 Dec-14 Jan-15 Feb-15 Mar-15 Apr-15 May-15 Jun-15
Numerator 1570 1717 1627 1466 1563 1576 1621 1602 1584 1532 1499 N/A
Denominator 1706 1851 1782 1631 1762 1762 1763 1763 1723 1704 1648 N/A
Rate 92% 93% 91% 90% 89% 89% 92% 91% 92% 90% 91% #N/A
Quarterly Average
July-September 2014 Analysis
Rate is holding relatively steady during this quarter. Continued emphasis on the IRP process has kept this rate above the
threshold.
Data collection is incomplete for this quarter.
January-March 2015 Analysis
Continued, relatively constent scores reflected in the IRP Quality audit display the emphasis placed on quality IRP creation by
DHBDD hospitals.
October-December 2014 Analysis
Scores have continued to fall well within the target range during this period. Possible causes for a slight down turn in the
current quarter are being addressed and should be reflected in the next quarter's scores.
April-June 2015 Analysis
Individual Recovery Plan Audit - Quality Measure
MEASURE DEFINITION AND EXPLANATION
Measure definition: Percent of positive responses to the Individualized Recovery Plan audit's questions on "Quality."
Measure explanation: Chart audit focusing on the quality and internal-consistency of the Individualized Recovery Plan. Audit
began January 2012.
COMPONENTS OF NUMERATOR AND DENOMINATOR
Numerator: Total number of "Yes" responses to questions 2-
20 on the IRP audit
Denominator: Total number IRP audits conducted.
COMMENTS AND/OR ANALYSIS PER QUARTER
92% 89% 92% Incomplete data
50%
55%
60%
65%
70%
75%
80%
85%
90%
95%
100%
Jul-14 Aug-14 Sep-14 Oct-14 Nov-14 Dec-14 Jan-15 Feb-15 Mar-15 Apr-15 May-15 Jun-15

77
Appendix F CBH System KPI Dashboards
Jul-14 Aug-14 Sep-14 Oct-14 Nov-14 Dec-14 Jan-15 Feb-15 Mar-15 Apr-15 May-15 Jun-15
Numerator 1089 1134 1159 1251 1302 1383 1454 1425 1601 1627 1684 1756
Denominator 1194 1247 1274 1369 1426 1502 1572 1548 1729 1765 1835 1902
Percent 91.2% 90.9% 91.0% 91.4% 91.3% 92.1% 92.5% 92.1% 92.6% 92.2% 91.8% 92.3%
Quarterly Average
MEASURE DEFINITION AND EXPLANATION
Percent of Georgia Housing Voucher Program adult MH individuals in stable housing
(greater than 6 months)
Target 77%
91.0% 91.6% 92.4% 92.1%
October-December 2014 Analysis
Measure definition: A measure of stable housing based on nationally accepted HUD standard.
Measure explanation: An initial indication of the program's ability to prevent homelessness and re-institutionalization.
COMPONENTS OF NUMERATOR AND DENOMINATOR
Numerator: Number of individuals leaving the program less than 6
months.
Denominator: Number of individuals in the program greater
than 6 months.
COMMENTS AND/OR ANALYSIS PER QUARTERApril-June 2015 Analysis
Data analysis not complete as of the writing of this report.
January-March 2015 Analysis
The quarterly average rose for the third consecutive quarter, indicating continued improvement.
Although monthly averages vary slightly, the quarterly average is an improvement over last quarter, and well within the target rate.
July-September 2014 Analysis
As a rolling average, this measure continues to remain stable as new individuals are added on to the program.
70%
75%
80%
85%
90%
95%
100%
Jul-14 Aug-14 Sep-14 Oct-14 Nov-14 Dec-14 Jan-15 Feb-15 Mar-15 Apr-15 May-15 Jun-15

78
Jul-14 Aug-14 Sep-14 Oct-14 Nov-14 Dec-14 Jan-15 Feb-15 Mar-15 Apr-15 May-15 Jun-15
Numerator 49 54 53 63 67 66 65 69 78 81 81 89
Denominator 290 307 314 333 344 352 373 394 415 424 434 453
Percent 16.9% 17.6% 16.9% 18.9% 19.5% 18.8% 17.4% 17.5% 18.8% 19.1% 18.7% 19.6%
Quarterly Average
MEASURE DEFINITION AND EXPLANATION
Percent of Georgia Housing Voucher Program adult MH individuals who left stable housing under
unfavorable circumstances and have been reengaged and reassigned vouchers
Target 10%
17.1% 19.0% 17.9% 19.1%
October-December 2014 Analysis
Measure definition: A measure to determine negative program leavers in order to divert them from homelessness or
other more expensive systems of care.
Measure explanation: Reinforces the notion that recovery is not a straight line and that reengagement after initial failure
is an important program component.
COMPONENTS OF NUMERATOR AND DENOMINATOR
Numerator: Number of individuals that left the program under
negative circumstances that reentered the program.
Denominator: Number of individuals that left the program
under negative circumstances.
COMMENTS AND/OR ANALYSIS PER QUARTERApril-June 2015 Analysis
Data analysis not complete as of the writing of this report.
January-March 2015 Analysis
Although not as high as last quarter, this quarter's rate is still above the target rate set for this measure.
Rates this quarter fall above the target rate and within the rates previously reported.
July-September 2014 Analysis
Over the course of the program this measure appears to be stable hovering between highs of 19% and lows at 16%.
0%
5%
10%
15%
20%
25%
30%
35%
40%
45%
50%
Jul-14 Aug-14 Sep-14 Oct-14 Nov-14 Dec-14 Jan-15 Feb-15 Mar-15 Apr-15 May-15 Jun-15

79
Jul-14 Aug-14 Sep-14 Oct-14 Nov-14 Dec-14 Jan-15 Feb-15 Mar-15 Apr-15 May-15 Jun-15
Numerator 23 22 21 20 22 23 22 21 19 20 20 0
Denominator 27 27 27 27 27 27 27 27 27 27 27 0
Percent 85.2% 81.5% 77.8% 74.1% 81.5% 85.2% 81.5% 77.8% 70.4% 74.1% 74.1% #N/A
Quarterly Average
April-June 2015 Analysis
Data collection and analysis not complete as of the writing of this report..
January-March 2015 Analysis
Two providers stated that they have not been getting internal referrals from new clinicans. Both providers indicated that they will be
providing more training to their clinical staff about zero Supportive Employment exclusions when it comes to consumers who indicate the
desire to work.
October-December 2014 Analysis
The target was met during one month this quarter. Several providers indicated that staffing chages and turn over impacted their ratios this
quarter.
July-September 2014 Analysis
Target was only met during one month this quarter.
Percent of providers that meet a caseload average consumer to staff ratio 20:1 and under
(Target 85% or more)
*KPI activated July 2014*
81.5% 80.2% 76.5% Quarterly data not complete
MEASURE DEFINITION AND EXPLANATION
Measure definition: The percent of SE consumers who were employed on the last day of the calendar month or who were
discharged during the month while employed.
Measure explanation: To examine the percentage of consumers were are able to obtain employment while utilizing
Supported Employment services.
COMPONENTS OF NUMERATOR AND DENOMINATOR
Numerator: Number of consumers competitively employed at
end of month plus the number of consumers competitively
employed at discharge that month.
Denominator: Number of consumers served that month.
COMMENTS AND/OR ANALYSIS PER QUARTER
50%
55%
60%
65%
70%
75%
80%
85%
90%
95%
100%
Jul-14 Aug-14 Sep-14 Oct-14 Nov-14 Dec-14 Jan-15 Feb-15 Mar-15 Apr-15 May-15 Jun-15

80
Jul-14 Aug-14 Sep-14 Oct-14 Nov-14 Dec-14 Jan-15 Feb-15 Mar-15 Apr-15 May-15 Jun-15
Numerator 581 609 604 603 604 603 574 579 604 646 655 0
Denominator 1228 1232 1207 1220 1194 1205 1223 1258 1296 1323 1326 0
Percent 47.3% 49.4% 50.0% 49.4% 50.6% 50.0% 46.9% 46.0% 46.6% 48.8% 49.4% #N/A
Quarterly Average
MEASURE DEFINITION AND EXPLANATION
Percent of Supported Employment consumers who were employed on the last day of the calendar
month or who were discharged during the month while employed
Target (43%) or more
*KPI activated July 2014*
48.9% 50.0% 46.5% Quarterly data not complete
October-December 2014 Analysis
Measure definition: The percent of SE consumers who were employed on the last day of the calendar month or who were
discharged during the month while employed.
Measure explanation: To examine the percentage of consumers were are able to obtain employment while utilizing
Supported Employment services.
COMPONENTS OF NUMERATOR AND DENOMINATOR
Numerator: Number of consumers competitively employed at
end of month plus the number of consumers competitively
employed at discharge that month.
Denominator: Number of consumers served that month.
COMMENTS AND/OR ANALYSIS PER QUARTERApril-June 2015 Analysis
Data collection and analysis not complete as of the writing of this report..
January-March 2015 Analysis
One provider indated they have done a better job of networking with businesses with non‐traditional business hours which has increased
potential job sites to employ consumers. Providers have continues to utilize step‐down plans for persons employed/stable on their jobs
which has created some employment rate fluxuation throughout the year.
The rate of employment during this quarter appeared to remain steady. Two providers indicated that their services are delivered in a rural
areas and many of their consumers do not want employment far away from home due to transportation barriers. Another provider indicated
that their percentage was lower this quarter because they were still training their new Supportive Employment Specialist.
July-September 2014 Analysis
There appeared to be a slight upward trend this quarter. At the end of the quarter there was a focus on discharging consumers who have
been steady in employment, need minimal supports, and could maintain their employment with a step ‐down service.
20%
25%
30%
35%
40%
45%
50%
55%
60%
65%
70%
75%
80%
85%
90%
95%
100%
Jul-14 Aug-14 Sep-14 Oct-14 Nov-14 Dec-14 Jan-15 Feb-15 Mar-15 Apr-15 May-15 Jun-15

81
Jul-Sep 2014 Oct-Dec 2014 Jan-Mar 2015 Apr-Jun 2015
Numerator 109 83 120 0
Denominator 137 100 154 0
Rate 80% 83% 78% #N/A
Target met this quarter.
July-September 2014 Analysis
Target met this quarter. There appears to be a slight upward trend in 2014.
Percent of unduplicated individuals who had 1st contact with a competitive
employer within 30 days of enrollment
Target (75%) or more
MEASURE DEFINITION AND EXPLANATION
Measure definition: The percent of individuals meeting settlement criteria that were enrolled during the quarter that had
contact with a potential employer in the open job market within 30 days of enrolling in supported employment services.
Measure explanation: To examine the percentage of settlement criteria consumers who are able to have rapid job placement
opportunities. Note: Measure is taken on a 30-day lag.
COMPONENTS OF NUMERATOR AND DENOMINATOR
Numerator: Number of settlement criteria consumers who
started Supported Employment services during the quarter
and who had first contact with a competitive employer within
30 days.
Denominator: Number of settlement criteria consumers who
started Supported Employment services during the quarter.
COMMENTS AND/OR ANALYSIS PER QUARTERApril-June 2015 Analysis
Data collection and analysis not complete as of the writing of this report.
January-March 2015 Analysis
Target met this quarter.
October-December 2014 Analysis
40%
45%
50%
55%
60%
65%
70%
75%
80%
85%
90%
95%
100%
Jul-Sep 2014 Oct-Dec 2014 Jan-Mar 2015 Apr-Jun 2015
82
Jul-14 Aug-14 Sep-14 Oct-14 Nov-14 Dec-14 Jan-15 Feb-15 Mar-15 Apr-15 May-15 Jun-15
Numerator 72 78 78 94 102 75 82 71 75 76 78 0
Denominator 86 116 112 119 129 107 120 101 98 95 92 0
Rate 83.7% 67.2% 69.6% 79.0% 79.1% 70.1% 68.3% 70.3% 76.5% 80.0% 84.8% #N/A
Quarterly Rate
The target was met two months during the quarter. One provider indicated that some barriers were being given incorrect
consumer contact information on the ACT referral form and consumers moving upon release/discharge from jails. Other
providers have indicated sucess with using Community Transition Planning service to build rapport with the consumers prior to
their release/discharge to address this barrier.
October-December 2014 Analysis
The target was met every month during the quarter. One provider indicated that the addition of listing the admission criteria on
their referral form has assisted in reducing the number of inappropriate referrals so that they can focus their efforts on those
consumer who are referred and meet criteria. The same provider also indicated that they have a dedicated intake specialist on
the team who has assisted in reducing the turnaround time from referral to receiving services.
July-September 2014 Analysis
The target was met one month during the quarter. Some providers indentified that some referral sources do not include all the
referral information. It requires additional time to follow up with the referral sources before the individual can be received into
services. Providers identified the need to continue to educate referral sources on all the information that is needed.
January-March 2015 Analysis
Percent of Assertive Community Treatment consumers who are received into
services within 3 days of referral
Target (70%) or more
*Key Performance Indicator activated July 2013*
MEASURE DEFINITION AND EXPLANATION
Measure definition: The percent of ACT consumers who began services during the month that waited three
days or less since their date of referral to ACT services.
Measure explanation: To examine the percentage of consumers who are able to access ACT services in a rapid
manner.
COMPONENTS OF NUMERATOR AND DENOMINATOR
Numerator: Number of consumers received into
services within 24 hours of referral date plus number
of consumers received into services within 3 days of
referral date.
Denominator: Total number of consumers received into
services.
COMMENTS AND/OR ANALYSIS PER QUARTERApril-June 2015 Analysis
Data collection and analysis not complete as of the writing of this report..
72.6% 76.3% 71.5% Quarterly data not complete
50%
55%
60%
65%
70%
75%
80%
85%
90%
95%
100%
Jul-14 Aug-14 Sep-14 Oct-14 Nov-14 Dec-14 Jan-15 Feb-15 Mar-15 Apr-15 May-15 Jun-15

83
Jul-14 Aug-14 Sep-14 Oct-14 Nov-14 Dec-14 Jan-15 Feb-15 Mar-15 Apr-15 May-15 Jun-15
Numerator 168 168 168 147 152 160 163 149 162 175 152 0
Denominator 1664 1642 1656 1650 1675 1628 1618 1508 1625 1667 1712 0
Percent 10.1% 10.2% 10.1% 8.9% 9.1% 9.8% 10.1% 9.9% 10.0% 10.5% 8.9% #N/A
Quarterly Average
Percent of Assertive Community Treatment consumers admitted to a
Psychiatric Hospital within the past month
Target (7%) or less
N/A due to monthly unduplicated counts
October-December 2014 Analysis
Measure definition: The percent of consumers in ACT services for over thirty days that were admitted to a psychiatric
hospital during the month.
Measure explanation: To examine the percentage of consumers who are utilizing psychiatric hospitals for stabilization.
COMPONENTS OF NUMERATOR AND DENOMINATOR
Numerator: Number of consumers admitted to Psychiatric
Inpatient.
Denominator: Census on the last day of the month minus
number of enrollments during the month.
COMMENTS AND/OR ANALYSIS PER QUARTERApril-June 2015 Analysis
Data collection and analysis not complete as of the writing of this report..
January-March 2015 Analysis
The target was not met during any month this quarter. Teams identify newer/acute consumers as having psychiatric admissions more
frequently. Teams suggest that sometimes caregivers and individuals would benefit from respite in place of psychiatric admissions.
MEASURE DEFINITION AND EXPLANATION
The target was not met during any month this quarter. Several teams indicated that consumers who have both behavioral health and
substance abuse conditions are the individuals who cycle the most freqently in inpatient facilities.
July-September 2014 Analysis
The target was not met during any month this quarter. Some teams report that unstable housing has been contributing to the psychiatric
admissions.
0%
5%
10%
15%
Jul-14 Aug-14 Sep-14 Oct-14 Nov-14 Dec-14 Jan-15 Feb-15 Mar-15 Apr-15 May-15 Jun-15

84
Jul-14 Aug-14 Sep-14 Oct-14 Nov-14 Dec-14 Jan-15 Feb-15 Mar-15 Apr-15 May-15 Jun-15
Numerator 1418 1708 1731 1482 1820 1494 1185 1167 1950 1858 1839 0
Denominator 1807 1840 1812 1811 1809 1811 1800 1714 1785 1446 1872 0
Rate 0.785 0.928 0.955 0.818 1.006 0.825 0.658 0.681 1.092 1.285 0.982 #N/A
Quarterly Rate
The target was met two of the three months this quarter. One team indicated that the holiday season impacted jail utilization for
consumers on their team.
July-September 2014 Analysis
Target was met each month this quarter. One provider cited strong relationship with jails and the ability to advocate for consumers.
October-December 2014 Analysis
Measure definition: The average number of days consumers in ACT services for over thirty days spent in jail/prison
during the month.
Measure explanation: To examine the amount of time consumers spend in jail.
COMPONENTS OF NUMERATOR AND DENOMINATOR
Numerator: Number of jail days utilized for consumers in
services 30 plus days.
Denominator: Number of discharges plus census on the
last day of month.
COMMENTS AND/OR ANALYSIS PER QUARTERApril-June 2015 Analysis
Data collection and analysis not complete as of the writing of this report..
January-March 2015 Analysis
The target was met two of the three months this quarter.
MEASURE DEFINITION AND EXPLANATION
Average # of jail/prison days utilized
(per enrolled Assertive Community Treatment consumer)
Target (1.0 day) or less
0.633 0.566 0.808 Quarterly data not complete
0.00
0.25
0.50
0.75
1.00
1.25
1.50
Jul-14 Aug-14 Sep-14 Oct-14 Nov-14 Dec-14 Jan-15 Feb-15 Mar-15 Apr-15 May-15 Jun-15

85
Jul-14 Aug-14 Sep-14 Oct-14 Nov-14 Dec-14 Jan-15 Feb-15 Mar-15 Apr-15 May-15 Jun-15
Numerator 57 58 56 63 62 67 59 68 64 71 83 0
Denominator 854 1004 1085 1106 1223 1145 1268 1288 1334 1332 1363 0
Percent 6.7% 5.8% 5.2% 5.7% 5.1% 5.9% 4.7% 5.3% 4.8% 5.3% 6.1% #N/A
Quarterly Average
Performance measure not met during any month this quarter.
July-September 2014 Analysis
Performance measure not met during any month this quarter.
MEASURE DEFINITION AND EXPLANATION
Percent of Intensive Case Management consumers with a
Psychiatric Inpatient Admission within the past month
Target (5%) or less
N/A due to monthly unduplicated counts
October-December 2014 Analysis
Measure definition: The percent of consumers in ICM services for over thirty days that were admitted to a psychiatric
hospital during the month.
Measure explanation: To examine the percentage of consumers who are utilizing psychiatric hospitals for stabilization.
COMPONENTS OF NUMERATOR AND DENOMINATOR
Numerator: Number of consumers admitted to Psychiatric
Inpatient.
Denominator: The census on the last day of the month
minus number of enrollments during the month.
COMMENTS AND/OR ANALYSIS PER QUARTERApril-June 2015 Analysis
Data collection and analysis not complete as of the writing of this report.
January-March 2015 Analysis
Performance measure met two of the three months this quarter.
0%
5%
10%
15%
Jul-14 Aug-14 Sep-14 Oct-14 Nov-14 Dec-14 Jan-15 Feb-15 Mar-15 Apr-15 May-15 Jun-15

86
Jul-14 Aug-14 Sep-14 Oct-14 Nov-14 Dec-14 Jan-15 Feb-15 Mar-15 Apr-15 May-15 Jun-15
Numerator 948 985 1084 1119 1195 1121 1225 1286 1326 1331 1343 0
Denominator 974 1018 1120 1157 1254 1175 1290 1338 1389 1393 1410 0
Percent 97.3% 96.8% 96.8% 96.7% 95.3% 95.4% 95.0% 96.1% 95.5% 95.5% 95.2% #N/A
Quarterly Average
Measure met every month this quarter. ICM providers indicated that Crisis Respite Apartments, the GA Housing Voucher, and natural
community supports have assisted in keeping their percentage of consumers housed high.
July-September 2014 Analysis
Measure met every month this quarter.
MEASURE DEFINITION AND EXPLANATION
Percent of Intensive Case Management consumers housed
(non homeless) within the past month
Target (90%) or more
N/A due to monthly unduplicated counts
October-December 2014 Analysis
Measure definition: The percent of consumers in ICM services on the last day of the month that were not homeless.
Measure explanation: To examine the percentage of consumers who are not living in homeless shelters or on streets at
a single point in time.
COMPONENTS OF NUMERATOR AND DENOMINATOR
Numerator: Number of consumers by living arrangement on
the last day of the month minus number of homeless: street,
homeless shelter.
Denominator: Number of consumers by living
arrangement on the last day of the month.
COMMENTS AND/OR ANALYSIS PER QUARTERApril-June 2015 Analysis
Data collection and analysis not complete as of the writing of this report..
January-March 2015 Analysis
Measure met every month this quarter.
85%
90%
95%
100%
Jul-14 Aug-14 Sep-14 Oct-14 Nov-14 Dec-14 Jan-15 Feb-15 Mar-15 Apr-15 May-15 Jun-15
87
Jul-14 Aug-14 Sep-14 Oct-14 Nov-14 Dec-14 Jan-15 Feb-15 Mar-15 Apr-15 May-15 Jun-15
Numerator 458 524 530 584 678 543 758 761 847 826 921 0
Denominator 1133 1227 1286 1405 1410 1318 1475 1524 1586 1626 1584 0
Rate 0.404 0.427 0.412 0.416 0.481 0.412 0.514 0.499 0.534 0.508 0.581 #N/A
Quarterly Rate
Performance measure not met during any month this quarter.
July-September 2014 Analysis
Performance measure not met during any month this quarter.
October-December 2014 Analysis
Measure definition: The average number of days consumers (who have been in ICM services for over thirty days)
spent in jail/prison during the month.
Measure explanation: To examine the amount of time consumers spend in jail.
COMPONENTS OF NUMERATOR AND DENOMINATOR
Numerator: Number of jail days utilized for consumers
in ICM services 30 plus days.
Denominator: Number of discharges plus census on last
day of month.
COMMENTS AND/OR ANALYSIS PER QUARTERApril-June 2015 Analysis
Data collection and analysis not complete as of the writing of this report.
January-March 2015 Analysis
Performance measure not met during any month this quarter.
MEASURE DEFINITION AND EXPLANATION
Average # of jail/prison days utilized
(per enrolled Intensive Case Management consumer)
Target (0.25 days) or less
0.357 0.400 0.447 Quarterly data not complete
0.00
0.25
0.50
0.75
1.00
1.25
Jul-14 Aug-14 Sep-14 Oct-14 Nov-14 Dec-14 Jan-15 Feb-15 Mar-15 Apr-15 May-15 Jun-15

88
Jul-14 Aug-14 Sep-14 Oct-14 Nov-14 Dec-14 Jan-15 Feb-15 Mar-15 Apr-15 May-15 Jun-15
Numerator 20 25 13 23 15 12 25 13 21 15 12 0
Denominator 247 258 256 265 266 274 282 288 286 274 272 0
Percent 8.1% 9.7% 5.1% 8.7% 5.6% 4.4% 8.9% 4.5% 7.3% 5.5% 4.4% #N/A
Quarterly Average
Percent of Community Support Team consumers with a Psychiatric Inpatient Admission
within the past month
Target (10%) or less
N/A due to monthly unduplicated counts
October-December 2014 Analysis
Measure definition: The percent of consumers in CST services for over thirty days that were admitted to a psychiatric
hospital during the month.
Measure explanation: To examine the percentage of consumers who are utilizing psychiatric hospitals for stabilization.
COMPONENTS OF NUMERATOR AND DENOMINATOR
Numerator: Number of consumers admitted to Psychiatric
Inpatient.
Denominator: Census on last day of month minus the
number of enrollments during month.
COMMENTS AND/OR ANALYSIS PER QUARTERApril-June 2015 Analysis
Data collection and analysis not complete as of the writing of this report..
January-March 2015 Analysis
The target was met each month this quarter. Some providers indicated that the variability of percentages month-to-month could be related to
the lack of housing choices in the rural areas. Providers also indicated it could be related to consumers having a high level of comfort going
to the hospital versus utilizing available community supports. Providers continually educate consumers and their support systems regarding
utilizing available community supports.
MEASURE DEFINITION AND EXPLANATION
The target was met each month this quarter.
July-September 2014 Analysis
There appears to be a decrease in the month of September. One provider indicated that they are using more proactive coping mechanisms
with consumers to reduce admissions. Another provider indicated that the DBHDD funded Beck Initiative training has been very helpful to
assist staff in engaging with clients early in treatment.
0%
5%
10%
15%
20%
25%
30%
Jul-14 Aug-14 Sep-14 Oct-14 Nov-14 Dec-14 Jan-15 Feb-15 Mar-15 Apr-15 May-15 Jun-15

89
Jul-14 Aug-14 Sep-14 Oct-14 Nov-14 Dec-14 Jan-15 Feb-15 Mar-15 Apr-15 May-15 Jun-15
Numerator 244 257 262 269 278 279 280 286 285 278 277 0
Denominator 247 259 267 272 279 279 283 290 287 279 280 0
Percent 98.8% 99.2% 98.1% 98.9% 99.6% 100.0% 98.9% 98.6% 99.3% 99.6% 98.9% #N/A
Quarterly Average
Percent of Community Support Team consumers housed
(non homeless) within the past month
Target (90%) or more
N/A due to monthly unduplicated counts
October-December 2014 Analysis
Measure definition: The percent of consumers in CST services on the last day of the month that were not homeless.
Measure explanation: To examine the percentage of consumers who are not living in homeless shelters or on streets at
a single point in time.
COMPONENTS OF NUMERATOR AND DENOMINATOR
Numerator: Number of consumers by living arrangement on
last day of month minus number of homeless: street,
homeless shelter.
Denominator: Number of consumers by living
arrangement on last day of month.
COMMENTS AND/OR ANALYSIS PER QUARTERApril-June 2015 Analysis
Data collection and analysis not complete as of the writing of this report..
January-March 2015 Analysis
The target was met each month this quarter.
MEASURE DEFINITION AND EXPLANATION
The target was met each month this quarter.
July-September 2014 Analysis
Consistent with previous quarters, the percentage appeared to remain consistent during the quarter. Teams did not report any barriers.
Several teams reported that they find family members are willing to take in consumers.
80%
85%
90%
95%
100%
Jul-14 Aug-14 Sep-14 Oct-14 Nov-14 Dec-14 Jan-15 Feb-15 Mar-15 Apr-15 May-15 Jun-15

90
Jul-14 Aug-14 Sep-14 Oct-14 Nov-14 Dec-14 Jan-15 Feb-15 Mar-15 Apr-15 May-15 Jun-15
Numerator 154 135 166 154 158 54 72 67 106 164 341 0
Denominator 294 300 298 301 307 310 315 319 322 319 307 0
Rate 0.524 0.450 0.557 0.512 0.515 0.174 0.229 0.210 0.329 0.514 1.111 #N/A
Quarterly Rate
BOTTOM 0.600 0.600 0.600 0.600 0.600 0.600 0.600 0.600 0.600 0.600 0.600 0.600
The target was met each month this quarter.
July-September 2014 Analysis
The percentages were below target through the quarter.
October-December 2014 Analysis
Measure definition: The average number of days consumers (who have been in CST services for over thirty days)
spent in jail/prison during the month.
Measure explanation: To examine the amount of time consumers spend in jail.
COMPONENTS OF NUMERATOR AND DENOMINATOR
Numerator: Number of jail days utilized for consumers in
CST services 30 plus days.
Denominator: Number of discharges plus census on the
last day of the month.
COMMENTS AND/OR ANALYSIS PER QUARTERApril-June 2015 Analysis
Data collection and analysis not complete as of the writing of this report..
January-March 2015 Analysis
The target was met each month this quarter.
MEASURE DEFINITION AND EXPLANATION
Average # of jail/prison days utilized
(per enrolled Community Support Team consumer)
Target (0.75 days) or less
0.510 0.399 0.256 Quarterly data not complete
0.00
0.25
0.50
0.75
1.00
1.25
1.50
1.75
2.00
Jul-14 Aug-14 Sep-14 Oct-14 Nov-14 Dec-14 Jan-15 Feb-15 Mar-15 Apr-15 May-15 Jun-15

91
Jul-14 Aug-14 Sep-14 Oct-14 Nov-14 Dec-14 Jan-15 Feb-15 Mar-15 Apr-15 May-15 Jun-15
Numerator 21 30 20 23 27 16 33 19 30 26 36 0
Denominator 689 753 833 914 998 1039 1060 1122 1168 1190 1249 0
Percent 3.0% 4.0% 2.4% 2.5% 2.7% 1.5% 3.1% 1.7% 2.6% 2.2% 2.9% #N/A
Quarterly Average
Data collection and analysis not complete as of the writing of this report..
January-March 2015 Analysis
Measure met each month this quarter. Some CM providers may have had an increase in the number of psychiatric admissions due to
retaining case managers, especially in rural areas.
Measure met each month this quarter.
July-September 2014 Analysis
October-December 2014 Analysis
Measure met each month this quarter.
MEASURE DEFINITION AND EXPLANATION
Percent of Case Management consumers with
a Psychiatric Inpatient Admission within the past month
Target (5%) or less
3.1% 2.2% 2.4% Quarterly data not complete
April-June 2015 Analysis
Measure definition: The percent of consumers in CM services for over thirty days that were admitted to a psychiatric
hospital during the month.
Measure explanation: To examine the percentage of consumers who are utilizing psychiatric hospitals for stabilization.
COMPONENTS OF NUMERATOR AND DENOMINATOR
Numerator: Number of consumers admitted to Psychiatric
Inpatient.
Denominator: Census on last day of month minus the
number of enrollments during month.
COMMENTS AND/OR ANALYSIS PER QUARTER
0%
5%
10%
Jul-14 Aug-14 Sep-14 Oct-14 Nov-14 Dec-14 Jan-15 Feb-15 Mar-15 Apr-15 May-15 Jun-15

92
Jul-14 Aug-14 Sep-14 Oct-14 Nov-14 Dec-14 Jan-15 Feb-15 Mar-15 Apr-15 May-15 Jun-15
Numerator 718 800 875 913 999 1068 1077 1127 1184 1178 1258 0
Denominator 733 814 897 933 1018 1088 1111 1165 1217 1215 1288 0
Percent 98.0% 98.3% 97.5% 97.9% 98.1% 98.2% 96.9% 96.7% 97.3% 97.0% 97.7% #N/A
Quarterly Average
Measure met each month this quarter. CM providers indicated that Crisis Respite Apartments, the GA Housing Voucher, and natural
community supports have assisted in keeping their percentage of consumers housed high. One CM provider indicated that they have built
relationships with landlords. The provider indicated that landlords are more likely to call them when the consumer has a crisis versus
moving towards eviction.
MEASURE DEFINITION AND EXPLANATION
July-September 2014 Analysis
Measure met each month this quarter.
Measure met each month this quarter. At the DBHDD January Combined Coalition Meeting providers were introduced to the Projects for
Assistance in Transition from Homelessness (PATH) Teams in their area and encouraged to partner with them in accessing housing for
individuals experiencing chronic homelessness and SMI. PATH is an added resource for CM providers who are able to benefit from PATH’s
established relationships with HUD funded and private housing providers.
Percent of Case Management consumers housed
(non homeless) within the past month
Target (90%) or more
October-December 2014 Analysis
Measure definition: The percent of consumers in CM services on the last day of the month that were not homeless.
Measure explanation: To examine the percentage of consumers who are not living in homeless shelters or on streets at a
single point in time.
COMPONENTS OF NUMERATOR AND DENOMINATOR
Numerator: Number of consumers by living arrangement on
last day of month minus the number of homeless: street,
homeless shelter.
Denominator: Number of consumers by living arrangement
on last day of month.
COMMENTS AND/OR ANALYSIS PER QUARTERApril-June 2015 Analysis
N/A due to monthly unduplicated counts
Data collection and analysis not complete as of the writing of this report..
January-March 2015 Analysis
85%
90%
95%
100%
Jul-14 Aug-14 Sep-14 Oct-14 Nov-14 Dec-14 Jan-15 Feb-15 Mar-15 Apr-15 May-15 Jun-15

93
Jul-14 Aug-14 Sep-14 Oct-14 Nov-14 Dec-14 Jan-15 Feb-15 Mar-15 Apr-15 May-15 Jun-15
Numerator 193 145 173 273 319 175 200 233 162 373 160 0
Denominator 876 982 1068 1120 1187 1265 1297 1325 1484 1425 1476 0
Rate 0.220 0.148 0.162 0.244 0.269 0.138 0.154 0.176 0.109 0.262 0.108 #N/A
Quarterly Rate
Measure was met two out of the three months this quarter. CM providers indicated that jail utilization is lower in counties where they
have built relationships with the local jails. Providers indicated that county jails are more likely to release consumers when they know
they are being released with appropriate community mental health supports.
July-September 2014 Analysis
Measure met each month this quarter.
October-December 2014 Analysis
Measure definition: The average number of days consumers (who have been in CM services for over thirty days)
spent in jail/prison during the month.
Measure explanation: To examine the amount of time consumers spend in jail.
COMPONENTS OF NUMERATOR AND DENOMINATOR
Numerator: Number of jail days utilized for consumers in
CM services 30 plus days.
Denominator: Number of discharges plus census on the
last day of month.
COMMENTS AND/OR ANALYSIS PER QUARTERApril-June 2015 Analysis
Data collection and analysis not complete as of the writing of this report..
January-March 2015 Analysis
Measure was met each month this quarter. Providers commented that they see a decrease in the number of jail days utilized when the
Case Manager is known by law enforcement to be responsive to requests for assistance. Several providers have begun providing
education about available services to their local law enforcement. One provider has a newsletter that they distribute to law enforcement
which describes services and provides contact information.
MEASURE DEFINITION AND EXPLANATION
Average # of jail/prison days utilized
(per enrolled Case Management consumer)
Target (0.25 days) or less
0.175 0.215 0.145 Quarterly data not complete
0.00
0.05
0.10
0.15
0.20
0.25
0.30
0.35
0.40
0.45
0.50
Jul-14 Aug-14 Sep-14 Oct-14 Nov-14 Dec-14 Jan-15 Feb-15 Mar-15 Apr-15 May-15 Jun-15

94
2011 2012 2013 2014
Numerator 0 0 22 3714
Denominator 0 0 100 11784
Percent #N/A #N/A 22.0% 31.5%TOP 0.700 0.700 0.700 0.700
Annually 2015
Annually 2014
Annually 2013
Percent of adult clients active in AD treatment 90 days after beginning non-crisis
stabilization services.
Target 25%
MEASURE DEFINITION AND EXPLANATION
Measure definition: This measure captures how many individuals in AD services remained engaged in
treatment 90 days after beginning community based treatment services.
Measure explanation: The purpose of this measure is to determine level of engagement and retention of
individuals involved in AD community based treatment.
COMPONENTS OF NUMERATOR AND DENOMINATOR
Numerator: The unduplicated count of individuals
entering non-crisis stabilization services identified by
having a Registration or New Episode MICP who
had Medicaid claims or State Encounters for
community Based Treatment services, excluding
Crisis Stabilization and Detoxification (Residential
and Ambulatory) between 90 - 120 days after entry
into services.
Denominator: The unduplicated count of individuals
who received Community Based Treatment services
where the authorization (MICP) for service had Adult
Addictive Diseases selected as the Primary Diagnostic
Category.
COMMENTS AND/OR ANALYSIS PER YEAR
Data collection and analysis not complete as of the writing of this report.
There was an increase from 2013 to 2014 indicates an increase in the number of individuals still active in treatment 90 days
after starting services which seems to offer some statistical support that engagement of individuals has improved. However,
other factors/data is not available for a full analysis to reach a conclusive cause and effect determination.
The previous KPI, Percent of adult AD consumers who abstain from use or experience reduction in use (while
in treatment) Target (40%), was replaced with this KPI.
15%
20%
25%
30%
35%
40%
45%
50%
2011 2012 2013 2014

95
2011 2012 2013 2014
Numerator 0 0 34 2427
Denominator 0 0 100 7014
Percent #N/A #N/A 34.0% 34.6%
Annually 2015
Annually 2014
Annually 2013
Percent of clients discharged from crisis or detoxification programs who
receive follow-up behavioral health services within 14 days.
Target 35%
MEASURE DEFINITION AND EXPLANATION
Measure definition: This measure captures how many individuals who were discharged from detox
and/or crisis received follow-up services in the community within 14 days.
Measure explanation: The purpose of this measure is to determine if those served in these higher
levels of care were provided follow-up services in community based treatment.
COMPONENTS OF NUMERATOR AND DENOMINATOR
Numerator: The unduplicated count of
individuals who had Medicaid Claims or State
Encounters for any Community Based
Treatment service excluding Crisis
Stabilization and Detoxification (Residential
and Ambulatory) within 14 days of the last
Crisis encounter.
Denominator: The unduplicated count of individuals
who received Crisis Stabilization services where the
authorization (MICP) for service had Adult Addictive
Diseases selected as the Primary Diagnostic Category.
COMMENTS AND/OR ANALYSIS PER YEAR
The previous KPI was inactivated after FY2012 and replaced with the current KPI. The
threshold of 35% was not met in 2013.
Data collection and analysis not complete as of the writing of this report.
There was a slight increase from 2013 to 2014 but not statistically significant to warrant any analysis at
this time.
25%
30%
35%
40%
45%
50%
55%
60%
65%
2011 2012 2013 2014

96
April 2013 -
September
2013
October
2013 -
March 2014
April 2014 -
September
2014
October
2014 -
March 2015
Numerator 40 7 9 24
Denominator 52 8 9 26
Rate 77% 88% 100% 92%
October 2014 - March 2015
April 2014 - September 2014
October 2013 - March 2014
April 2013 - September 2013
Percent of individuals receiving community or hospital based services who stated they are
satisfied with the services they are receiving
Target 90% or more
MEASURE DEFINITION AND EXPLANATION
Measure definition: Those individuals who were chosen by the QM review team to be interviewed as part of a review or audit
who stated they are satisfied with the services they are receiving.
Measure explanation: The purpose of this measure is to determine one of the impacts services may have on the target
population.
COMPONENTS OF NUMERATOR AND DENOMINATOR
Numerator: The number of individuals who answered yes. Denominator: The total number of individuals responding to the question.
COMMENTS AND/OR ANALYSIS PER PERIOD
The measure was met during this time frame.
Conclusions could not be drawn from the few surveys that were completed during this reporting period.
Conclusions could not be drawn from the few surveys that were completed during this reporting period.
The most common comment related to an individual not being satisfied with their services was a desire to interact with their team more
frequently.
70%
80%
90%
100%
April 2013 - September 2013 October 2013 - March 2014 April 2014 - September 2014 October 2014 - March 2015
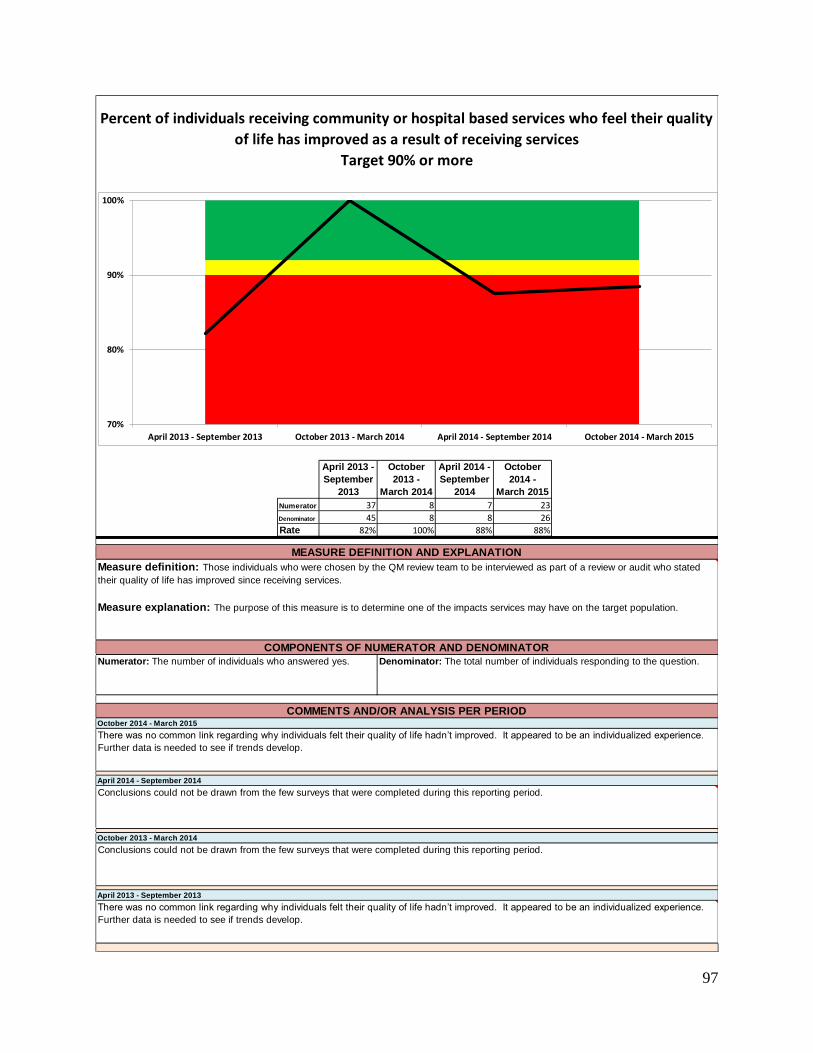
97
April 2013 -
September
2013
October
2013 -
March 2014
April 2014 -
September
2014
October
2014 -
March 2015
Numerator 37 8 7 23
Denominator 45 8 8 26
Rate 82% 100% 88% 88%
October 2014 - March 2015
April 2014 - September 2014
October 2013 - March 2014
April 2013 - September 2013
Percent of individuals receiving community or hospital based services who feel their quality
of life has improved as a result of receiving services
Target 90% or more
MEASURE DEFINITION AND EXPLANATION
Measure definition: Those individuals who were chosen by the QM review team to be interviewed as part of a review or audit who stated
their quality of life has improved since receiving services.
Measure explanation: The purpose of this measure is to determine one of the impacts services may have on the target population.
COMPONENTS OF NUMERATOR AND DENOMINATOR
Numerator: The number of individuals who answered yes. Denominator: The total number of individuals responding to the question.
COMMENTS AND/OR ANALYSIS PER PERIOD
There was no common link regarding why individuals felt their quality of life hadn’t improved. It appeared to be an individualized experience.
Further data is needed to see if trends develop.
Conclusions could not be drawn from the few surveys that were completed during this reporting period.
Conclusions could not be drawn from the few surveys that were completed during this reporting period.
There was no common link regarding why individuals felt their quality of life hadn’t improved. It appeared to be an individualized experience.
Further data is needed to see if trends develop.
70%
80%
90%
100%
April 2013 - September 2013 October 2013 - March 2014 April 2014 - September 2014 October 2014 - March 2015

98
Jul-Sep 2014 Oct-Dec 2014 Jan-Mar 2015 Apr-Jun 2015
Numerator 0 0 0 0
Denominator 0 0 0 0
Rate N/A N/A N/A #N/A
Percent of youth with an increase in functioning as determined by a standardized tool
Target 80%
MEASURE DEFINITION AND EXPLANATION
Measure definition: This measure provides retrospective data on the effectiveness of the services provided by community
providers, as measured by the standardized tool.
Measure explanation: To determine the effectiveness of the services provided, the results of subsequent assessments should
reflect improved functioning.
COMPONENTS OF NUMERATOR AND DENOMINATOR
Numerator: Number of youth who have reported increased
scores on the standardized tool.
Denominator: Number of youth that completed the standardized
tool assessment.
COMMENTS AND/OR ANALYSIS PER QUARTERApril-June 2015 Analysis
The Department is in the middle of a standardized tool transition from the Child and Adolescent Functional Assessment Scale
(CAFAS) to the Child and Adolescent Needs and Strengths (CANS). The implementation of the CANS is scheduled for October
2015. Data collection for this KPI will begin in FY16.
January-March 2015 Analysis
N/A
October-December 2014 Analysis
N/A
July-September 2014 Analysis
N/A
40%
45%
50%
55%
60%
65%
70%
75%
80%
85%
90%
95%
100%
Jul-Sep 2014 Oct-Dec 2014 Jan-Mar 2015 Apr-Jun 2015

99
2011 2012 2013 2014
Numerator 0 0 491 468
Denominator 0 0 585 557
Rate #N/A #N/A 84% 84%
Annually 2014
Annually 2013
Responses to the satisfaction survey surpassed the target rate.
Responses to the satisfaction survey surpassed the target rate.
COMMENTS AND/OR ANALYSIS PER QUARTER
Percent of families of youth served by CMEs who are satisfied with services as
determined by their parent or legal guardian using a standardized survey tool (YSS-F)
Target 80%
MEASURE DEFINITION AND EXPLANATION
Measure definition: This measure identifies families of youth who are being served by the Care Management Entities who respond to
satisfaction questions on the YSS-F standardized survey instrument.
Measure explanation: To examine the general satisfaction with services received while being served by a CME.
COMPONENTS OF NUMERATOR AND DENOMINATOR
Numerator: Percentage of respondents with an agverage score
>3.5 from the statisfaction questions.
Denominator: Number of respondents to YSS-F questions
related to general satisfaction.
40%
50%
60%
70%
80%
90%
100%
2011 2012 2013 2014

100
Appendix G Developmental Disabilities KPI Dashboards
2011 2012 2013 2014
Numerator 270 260 358 266
Denominator 416 412 497 375
Rate 64.9% 63.1% 72.0% 70.9%TOP 0.200 0.200 0.200 0.200BOTTOM 0.750 0.750 0.750 0.750
Annually 2014
Annually 2013
Annually 2012
Percentage of Individuals Who Have Had a Flu Vaccine in Past Year
Target 75%
MEASURE DEFINITION AND EXPLANATION
Measure definition: Percentage on individuals surveyed through the National Core Indicator Survey who
report having a flu shot in past year.
Measure explanation: Allows for additional monitoring of the health of individuals.
COMPONENTS OF NUMERATOR AND DENOMINATOR
Numerator: The numerator is the number of
individuals who reported that they have had a flu shot
in the last year. NCI data management and analysis
is coordinated by Human Services Research Institute
(HSRI). Georgia enters data in the ODESA database
which HSRI uses for analysis. In 2014, 40 states
participated in the NCI Survey.
Denominator: The Denominator is the number of
individuals who were able to answer this question.
Not all individuals were capable or we aware is they
had a flu shot or not. NCI data management and
analysis is coordinated by Human Services Research
Institute (HSRI). Georgia enters data in the ODESA
database which HSRI uses for analysis.
COMMENTS AND/OR ANALYSIS PER YEAR
71% of respondents from Georgia reported that they received a flu shot in the past year. Georgia remains within the
average range of the NCI average of 78%.
72% of respondents from Georgia and 76% of respondents across NCI States were reported to have had a
flu vaccine in the past year. This is up significantly from 63% last year; however Georgia remains within the
average range of NCI States.
63% of respondents from Georgia were reported to have had a flu vaccine in the past year. This is slightly
down from 65% for the previous year. 63% is significantly below the national average (77%) of all NCI
States.
30%
35%
40%
45%
50%
55%
60%
65%
70%
75%
80%
85%
90%
95%
100%
2011 2012 2013 2014

101
2011 2012 2013 2014
Numerator 326 312 391 283
Denominator 418 445 514 398
Rate 78.0% 70.1% 76.1% 71.1%
Annually 2014
Annually 2013
Annually 2012
Percentage of Individuals Who Have Had a Dental Examine in Past Year
Target 80%
MEASURE DEFINITION AND EXPLANATION
Measure definition: Percentage on individuals surveyed through the National Core Indicator Survey who report
having a dental exam.
Measure explanation: Allows for additional monitoring of the health of individuals.
COMPONENTS OF NUMERATOR AND DENOMINATOR
Numerator: The numerator is the number of individuals
who reported that they have had a dental examination in
the last year. NCI data management and analysis is
coordinated by Human Services Research Institute
(HSRI). Georgia enters data in the ODESA database
which HSRI uses for analysis. in 2014, 40 states
participated in the NCI Survey.
Denominator: The Denominator is the number of
individuals who were able to answer this question.
Not all individuals were capable or were aware if they
had a dental exam or not. NCI data management
and analysis is coordinated by Human Services
Research Institute (HSRI). Georgia enters data in
the ODESA database which HSRI uses for analysis.
COMMENTS AND/OR ANALYSIS PER YEAR
71% of respondents from Georgia reported that they had a dental examination within the last year. Georgia scored significantly
below the NCI average of 79%, ranking 9th among the 40 NCI states.
76% of respondents from Georgia and 80% of respondents across NCI States were reported to have had a
dental exam in the past year. This is up significantly from 70% last year; however Georgia still remains within the
average range of NCI States
70% of respondents reported having a dental exam in the past year. This is down significant from 78% the
previous year. 70% is also significantly lower that the national average (80%) for all other NCI States. This KPI
has been given Departmental priority and solutions to improve this KPI are being reviewed.
50%
55%
60%
65%
70%
75%
80%
85%
90%
95%
100%
2011 2012 2013 2014

102
2011 2012 2013 2014
Numerator 373 466 448 389
Denominator 451 518 520 452
Rate 83% 90% 86% 86%
Annually 2014
Annually 2013
Annually 2012
86% of respondents from Georgia reported that they had completed a physical exam in the last 12 months. Georgia remains with the
average range of the NCI average of 88%.
86% of respondents from Georgia and 89% of respondents across NCI States were reported to have had a physical
exam in the past year. This is down slightly from 90% last year; however Georgia still remains within the average range
of NCI States
90% of respondents reported having had a physical exam in this past year. This is slightly down from the previous year
which as reported at 91%. 90% is in line with the national average (90%) for all other NCI States.
COMMENTS AND/OR ANALYSIS PER YEAR
Percentage of Individuals Who Have Had an Annual Physical in Past Year
Target 92%
MEASURE DEFINITION AND EXPLANATION
Measure definition: Percentage on individuals surveyed through the National Core Indicator Survey who report having
a physical exam.
Measure explanation: Allows for additional monitoring of the health of individuals.
COMPONENTS OF NUMERATOR AND DENOMINATOR
Numerator: The numerator is the number of individuals who
reported that they have had an annual physical examination
in the last year. NCI data management and analysis is
coordinated by Human Services Research Institute (HSRI).
Georgia enters data in the ODESA database which HSRI
uses for analysis. In 2014, 40 states participated in the NCI
Survey.
Denominator: The Denominator is the number of
individuals who were able to answer this question. Not all
individuals were capable or we aware is they had a
physical exam or not. NCI data management and analysis
is coordinated by Human Services Research Institute
(HSRI). Georgia enters data in the ODESA database
which HSRI uses for analysis.
70%
75%
80%
85%
90%
95%
100%
2011 2012 2013 2014

103
2011 2012 2013 2014
Numerator 291 342 336 268
Denominator 338 384 386 291
Rate 86% 89% 87% 92%
Annually 2014
Annually 2013
Annually 2012
87% of respondents from Georgia and 81% of respondents across NCI States reported they never feel scared at home.
This is down slightly from 89% last year; however Georgia’s average is significantly about the average range of NCI
States.
89% of respondents reported they never feel scared at home. This is an improvement from the previous year which was
reported at 86%. 89% is in line with the national average (82%) for all other NCI States.
92% of respondents from Georgia reported that they feel safe in their home environment. Georgia scored well above the NCI average of
82%, ranking 8th among the 40 NCI states.
COMMENTS AND/OR ANALYSIS PER YEAR
Percentage of Individuals Who Feel Safe in Their Home
Target 90%
MEASURE DEFINITION AND EXPLANATION
Measure definition: Percentage on individuals surveyed through the National Core Indicator Survey who report feeling
safe in their residential environment.
Measure explanation: Allows for additional monitoring of the safety of individuals
COMPONENTS OF NUMERATOR AND DENOMINATOR
Numerator: The numerator is the number of individuals
who reported that they either feel safe in their home or never
feel afraid in their home. NCI data management and
analysis is coordinated by Human Services Research
Institute (HSRI). Georgia enters data in the ODESA
database which HSRI uses for analysis. In 2014, 40 states
participated in the NCI survey.
Denominator: The Denominator is the number of
individuals who were able to answer this question. Not all
individuals were capable or were willing to answer this
question. NCI data management and analysis is
coordinated by Human Services Research Institute
(HSRI). Georgia enters data in the ODESA database
which HSRI uses for analysis.
70%
75%
80%
85%
90%
95%
100%
2011 2012 2013 2014

104
2011 2012 2013 2014
Numerator 194 170 302 274
Denominator 200 177 311 288
Rate 97% 96% 97% 95%
Annually 2014
Annually 2013
Annually 2012
95% of respondents from Georgia reported that they are treated with dignity and respect. Georgia is slightly higher than the the NCI
average of 93%, ranking 8th among the 40 NCI states.
97% of respondents from Georgia and 93% of respondents across NCI States reported they are treated with dignity and
respect. This is up slightly from 96% last year, and Georgia ranks top among the NCI States.
96% of respondents reported that they are treated with dignity and respect. This is slightly down from the previous year
when 97% reported they felt that they were treated with dignity and respect. 96% is in line with the national average
(94%) of all other NCI States.
COMMENTS AND/OR ANALYSIS PER YEAR
Percentage of Individuals Who Report They are Treated with Dignity and Respect
Target 90%
MEASURE DEFINITION AND EXPLANATION
Measure definition: Percentage on individuals surveyed through the National Core Indicator Survey who report staff and family treat
them with respect.
Measure explanation: Allows for additional monitoring of the safety of individuals.
COMPONENTS OF NUMERATOR AND DENOMINATOR
Numerator: The numerator is the number of individuals who
reported that their staff treat them with dignity and respect.
NCI data management and analysis is coordinated by
Human Services Research Institute (HSRI). Georgia enters
data in the ODESA database which HSRI uses for analysis.
In 2014, 40 states participated in the NCI survey.
Denominator: The Denominator is the number of
individuals who were able to answer this question. Not all
individuals were capable or were willing to answer this
question. NCI data management and analysis is
coordinated by Human Services Research Institute
(HSRI). Georgia enters data in the ODESA database
which HSRI uses for analysis.
70%
75%
80%
85%
90%
95%
100%
2011 2012 2013 2014

105
2011 2012 2013 2014
Numerator 297 349 432 309
Denominator 457 521 600 442
Rate 65% 67% 72% 70%
Annually 2014
Annually 2013
Annually 2012
70% of respondents from Georgia reported that they have a choice of supports and services. Georgia is well above the
NCI average of 57%, ranking 2nd among the 40 NCI states.
72% of respondents from Georgia and 52% of respondents across NIC States reported that they have a choice of
support and services. This is up significantly from 67% last year, and Georgia ranks top among the NCI States
67% of respondents reported that they have a choice of supports and services which is 2% improvement from the
previous year. 67% is significantly above the national average (54%) of all other NCI States.
COMMENTS AND/OR ANALYSIS PER YEAR
Percentage of Individuals Who Report They have a Choice of Supports and Services
Target 95%
MEASURE DEFINITION AND EXPLANATION
Measure definition: Individuals report that they have choice in the supports they receive.
Measure explanation: Division of DD strives to support individuals to have a choice in all supports and services.
COMPONENTS OF NUMERATOR AND DENOMINATOR
Numerator: The numerator is the number of individuals who
reported that they had a choice in the supports and services they
receive.NCI data management and analysis is coordinated by
Human Services Research Institute (HSRI). Georgia enters data in
the ODESA database which HSRI uses for analysis. In 2014, 40
states participated in the NCI survey.
Denominator: The Denominator is the number of individuals who
were able to answer this question. Not all individuals were
capable or were willing to answer this question. NCI data
management and analysis is coordinated by Human Services
Research Institute (HSRI). Georgia enters data in the ODESA
database which HSRI uses for analysis.
50%
55%
60%
65%
70%
75%
80%
85%
90%
95%
100%
2011 2012 2013 2014

106
Apr-Jun 2014 Jul-Sep 2014 Oct-Dec 2014 Jan-Mar 2015
Numerator 34 41 41 35
Denominator 703 665 650 681
Percentage 5% 6% 6% 5%
BOTTOM 0.000 0.000 0.000 0.000
Provision of intensive in-home supports remained the same for the last two quarters of 2014, and relatively the same all year
long.
July-September 2014 Analysis
Utilization of intensive in-home supports increased 1.2% during this quarter. The Temporary Intensive Supports (TIS) home
that supported children and adolescents, was closed in July. Analysis showed that the closing did not contribute to the slight
increase in utilization
Utilization of intensive in-home supports decreased slightly during this quarter; however, the decrease was not significant.
Percentage of Crisis Incidents that Resulted in Intensive In-Home Supports
MEASURE DEFINITION AND EXPLANATION
Measure definition: Percentage of crisis incidents that could warrant additional in-home supports for the individual or family in
crisis.
Measure explanation: Most crisis episodes can be sufficiently addressed by a Mobile Crisis Team at the time of the crisis.
Some crisis episodes, however, may need additional supports or training for the individual or family that will hopefully lessen or
eliminate the chance of such a crisis happening again. These supports or trainings may be provided in the person’s home for
up to 24 hours a day and 7 days a week.
COMPONENTS OF NUMERATOR AND DENOMINATOR
Numerator: Number of crisis episodes statewide that
resulted in the need for additional intensive in-home
supports.
Denominator: Total number of crisis episodes statewide.
April-June 2014 Analysis
COMMENTS AND/OR ANALYSIS PER QUARTERJanuary-March 2015 Analysis
Utilization of intensive in-home supports dropped 1% from last quarter but remained stable compared last three quarters.
October-December 2014 Analysis
0%5%
10%15%20%25%30%35%40%45%50%55%60%65%70%75%80%85%90%95%
100%
Apr-Jun 2014 Jul-Sep 2014 Oct-Dec 2014 Jan-Mar 2015

107
Apr-Jun 2014 Jul-Sep 2014 Oct-Dec 2014 Jan-Mar 2015
Numerator 71 63 75 56
Denominator 703 665 650 681
Percentage 10% 9% 12% 8%
January-March 2015 Analysis
Percentage of Crisis Incidents that Resulted in Placement of the Individual
in a Crisis Support Home
MEASURE DEFINITION AND EXPLANATION
Measure definition: Percentage of crisis incidents that could warrant placement in a crisis support home while the crisis was
addressed.
Measure explanation: Most crisis episodes can be sufficiently addressed by a Mobile Crisis Team at the time of the crisis. Some
crisis episodes, however, may need additional supports or training for the individual or family that will hopefully lessen or
eliminate the chance of such a crisis happening again. From time to time it may be in the best interest of the individual and
family that these supports and trainings be provided out of the individuals home and in a crisis support home. Placement in a
crisis home should be the option of last resort for dealing with a crisis episode.
COMPONENTS OF NUMERATOR AND DENOMINATOR
Numerator: Number of crisis episodes statewide that
resulted in the need for an individual to be removed from
their home and place in a crisis support home.
Denominator: Total number of crisis episodes statewide.
COMMENTS AND/OR ANALYSIS PER QUARTER
Utilization of Crisis Support Homes dropped 4% compared to last quarter but the drop was not signficant compared with the last
three quarters of data. The use of the homes continues to be higher than the use of Intensive In-home Supports, which is not a
goal of the crisis system.
October-December 2014 Analysis
Provision of in-home supports remained the same during this quarter, but utilization of the crisis homes increased by 3
percentage points. The increase was not significant however when compared to the first three quarters of 2014. DBHDD has
continued in its efforts to recruit additional respite and emergency respite providers to reduce the to use the crisis homes.
July-September 2014 Analysis
Utilization of the crisis homes remained basically the same as last quarter. There again only a 1 percentage point drop in
utilization from last quarter. DBHDD has been seeking possible providers of emergency respite as an alternative to out of home
crisis placement.
April-June 2014 Analysis
Utilization of the crisis homes remained basically the same as last quarter. There was only a 1 percentage point drop in
utilization from last quarter. DBHDD has been seeking possible providers of emergency respite as an alternative to out of home
crisis placement.
0%5%
10%15%20%25%30%35%40%45%50%55%60%65%70%75%80%85%90%95%
100%
Apr-Jun 2014 Jul-Sep 2014 Oct-Dec 2014 Jan-Mar 2015