georgetown university conference center...
TRANSCRIPT

2002 Safety in Numbers Conference
Georgetown University Conference CenterWashingt
January 9
on, DC
, 2002

AGENDA
8:00 am - 9:00 am Registration and Continental Breakfast West Lobby
9:00 am - 9:10 am Welcome and Opening Remarks Grand BallroomAshish Sen, Director Salons ABGBureau of Transportation Statistics
9:10 am - 9:30 am Keynote Speaker:
The Honorable Robert A. Borski, Member of Congress
9:30 am - 9:45 am Safety Data Initiative OverviewDemetra Collia, Bureau of Transportation Statistics
9:45 am - 10:30 am Progress Reports:
Project 1Terry Klein, Bureau of Transportation Statistics
Projects 2, 3 and 5Sue Baker, Johns Hopkins School of Public HealthDennis Shanahan, Injury Analysis, LLCBob Dodd, Dodd & Associates
10:30 am - 10:45 am Coffee Break West Lobby
10:45 am - 11:30 am Progress Report s Continued: Grand BallroomSalons ABG
Projects 6, 7 and 9Mei-Li Lin, National Safety CouncilDick Paddock, Traffic Safety Analysis Systems & ServicesSergey Sinelnikov, National Safety CouncilBarbara DeLucia, Robert Scopatz, Data Nexus, Inc.
Project 10Dave Balderston, Federal Aviation Administration
11:30 am - 11:40 am Description of Afternoon Project Level DiscussionsJeff Hanan, FacilitatorEquals Three Communications

11:45 am - 1:15 pm Lunch with Keynote Speaker Grand BallroomChristopher Hart, Assistant Administrator, Office of System Safety, Salons CHFFederal Aviation Administration
1:25 pm - 1:55 pm Project Level Discussions – Session 1:
Project 1: Reengineer Data Programs Conference Room 6 Terry Klein, Kimberley Hill, Bureau of Transportation Statistics
Project 2: Develop Common Criteria for Reporting Deaths & Injuries Salon E Dennis Shanahan, Injury Analysis, LLC
Project 3: Develop Common Denominators for Safety Measures Salon B Bob Dodd, Dodd & Associates
Project 5: Develop Common Data on Accident Circumstances Conference Room 4 Sue Baker, Johns Hopkins School of Public Health
Project 6: Develop Better Data on Accident Precursors Salon D Dick Paddock, Traffic Safety Analysis Systems & Services
Project 7: Expand Collection of “Near-Miss” Data to all Modes Exec. Boardroom Sergey Sinelnikov, National Safety Council
Project 9: Explore Options for Using Technology in Data Collection Conference Room 5 Barbara DeLucia, Robert Scopatz, Data Nexus, Inc.
Project 10: Expand, Improve & Coordinate Safety Data Analysis Conference Room 3 Dave Balderston, Federal Aviation Administration
2:00 pm – 2:30 pm Project Level Discussions – Session 2 (Repeated)
2:35 pm – 3:05 pm Project Level Discussions – Session 3 (Repeated)
3:15 pm - 3:30 pm TranStats/Intermodal Transportation Database Status Report Grand BallroomJeff Butler, Bureau of Transportation Statistics Salons ABG
3:30 pm - 3:45 pm Data Gaps Project StatusBill Bannister, Bureau of Transportation Statistics
3:45 pm – 4:00 pm Stakeholder Feedback OverviewTerry Klein, Bureau of Transportation Statistics
4:00 pm - 4:15 pm ClosingRick Kowalewski, Deputy DirectorBureau of Transportation Statistics

Dr. Ashish SenDirector, Bureau of Transportation Statistics
Welcoming RemarksSafety in Numbers Intermodal Safety Data Conference
Washington, DCJanuary 9, 2002

2
Thank you, Demetra. Good morning. Thank you for joining us today in this continuing
effort to make our transportation system even safer than it is today.
My acknowledgments to the National Safety Council for its support on this project,
especially Vice President Chuck Hurley and Dr. Mei-Li Lin. Thanks to Professor Sue Baker of
The Johns Hopkins Center for Injury Research and Policy for her leadership and work on this
project and also for convincing an impressive group of transportation and data experts to work
on our project.
Also, my acknowledgements to the scientists at The National Institute for Occupational
Safety and Health. I hope for continuing collaborative scientific research with them in the area
of transportation safety.
Thanks, too, to Demetra, Beth Bradley and Kim Hill for their continuing efforts on the
Safety Data Plan and for their extra efforts to arrange this conference.
Thanks particularly to all these people at a time when the transportation system has been
responding to the events of September 11.
We are all here today because there are too many people being killed as a result of
transportation incidents. In 2000, there were more than 44,000 transportation-related deaths.
That number is unacceptable and it makes the Safety Data Initiative a top priority.
Working together, we must improve the quality of safety data so planners and decision-
makers can make more informed safety decisions. Informed decisions are more likely to lead to
fewer deaths and injuries.

3
We all recognize that safety data are not everything that they could be or need to be.
BTS has audited several DOT databases and the results were not reassuring. At least two
databases needed to be re-engineered to make the data reliable.
We all know, from our personal experience, cases of other databases where the data are
subject to systematic errors that prevent us from doing useful safety analysis.
One database on grade-crossing accidents, for example, appeared to show that the
sounding of a locomotive horn at a grade crossing reduced safety rather than enhancing it. It was
only when the agency's staff checked the accuracy of the data that the errors were discovered.
Timeliness is also a particularly critical problem —some of our safety data are not
available for two years after the event. One senior DOT official characterized some of our safety
data as being like "light from a distant star -- it may have been extinguished long ago by the time
we see it." Timely data are essential to taking action on unsafe conditions.
We must gather safety data in a more consistent, systematic way from all modes of
transportation. In some modes, "operator error" is commonly assigned as the "cause" of an
accident, without ever investigating why the operator made the error, and what can be done to
prevent similar errors in the future.
In some modes, operator fatigue is commonly reviewed as a possible contributing factor
in an accident; in others, fatigue is only considered when its presence is unmistakable. We need
to make sure that we are gathering systematic safety data.
We have been working together on the Safety Data Initiative for more than two years.
When we met last year, I pledged that we would return to the stakeholders to share the draft
reports of the implementation plan.

4
We believe we have a series of proposals that will make major advances in safety data.
And we believe BTS can play a unique leadership role in coordinating improvements in
transportation safety data.
We have the drafts for you today but the most important thing of all is for us to hear your
comments. It is essential to us to have broad-based support for the projects and for all of us to
reach agreement on the direction we are heading.
As we move forward after today, we will be submitting our report to Secretary Mineta in
the near future and then we will be developing programs for the reauthorization process.
But, as in all our efforts, it must be a partnership. By working together, we will produce
higher quality data that can lead to a safer transportation system.
Thank you for coming here today and for your work on these projects. Through projects
such as the Safety Data Initiative, we will ensure that data remains the light in enlightened
policy.
When we met last year, I called the Safety Data Initiative an ambitious undertaking and
said we should aim high. Today, we are still keeping our vision high. With our vision, and with
our joint efforts, we can, as Secretary Mineta has said, “create a dynasty of safety for the future.”
And now, I am proud to introduce our keynote speaker. Congressman Bob Borski from
Philadelphia, PA has served on the House Transportation Committee since 1983 and has played
a key role on every transportation bill the committee has considered.
In 1991, he led the effort on ISTEA to prevent expansion of the network that can be used
by triple trailers. In this Congress, he became Ranking Member of the Highways and Transit
Subcommittee.

5
Congressman Borski has a long-term interest in safety. As chairman of the House
Investigations and Oversight Subcommitee in 1993 and 1994, he chaired hearings on safety
comparisons across modes. We are honored to have Congressmen Borski as our keynote speaker
today.
###

1
THE HONORABLE ROBERT A. BORSKIRANKING DEMOCRATIC MEMBER
SUBCOMMITTEE ON HIGHWAYS AND TRANSITCOMMITTEE ON TRANSPORTATION AND INFRASTRUCTURE
JANUARY 9, 2002
Safety In Numbers ConferenceGeorgetown University Conference Center
Good morning, Ladies and Gentlemen. I want to commend BTS for holding this
conference on Safety In Numbers and for its efforts to improve transportation safety.
Transportation safety requires good research, and good research requires accurate
and timely data collection and analysis.
Speaking as the Ranking Democrat on the Subcommittee on Highways and Transit,
let me assure you that I support your efforts to advance this much needed initiative.
The Subcommittee on Highways and Transit has already initiated hearings on the
reauthorization of TEA 21. Late last year we began with a series of TEA 21 success stories.
Early this year, we expect to have the modal administrators up to testify, followed by
hearings throughout the year as we prepare for, and look ahead to, the reauthorization of
TEA 21 in 2003.
I am fully aware of BTS’ interest in funding the safety data projects you will be
discussing today, which are expected to cost some $9 million.
TEA 21 authorized BTS at $31 million annually, and it is my understanding that the
appropriations committees fully funded that authorization each year. However, they did not
fund the $4 million authorization in AIR 21. TEA 21 reauthorization will be the next major
piece of legislation for the Subcommittee and probably the next major opportunity for BTS
to revise or expand its programs.
Let me give you a few thoughts about where I think improved data could pay the
greatest dividends.

2
In comparison to other modes, improving highway safety is, by far, our greatest
opportunity to save lives in transportation. Last year, 41,821 people were killed and an
estimated 3.2 million people were injured in motor vehicle crashes, more than 1% of the
nation’s total population. Insurance, lost wages, health care and other costs related to
highway crashes exceed $150 billion annually, and losses in terms of human suffering are
incalculable.
Crashes involving motor vehicles account for about 90 percent of all transportation
fatalities. So it should be obvious that better highway safety data will lead to better planning,
rulemaking and decision making, and a safer transportation system overall.
Trucking is a special concern. In 1999, more than 400,000 trucks were involved in
traffic accidents – 5,362 people were killed and an estimated 142,000 were injured in those
crashes.
Large trucks are over represented in fatal crashes. Although 13 percent of all traffic
deaths resulted from crashes involving large trucks, these vehicles represent only 3 percent
of all registered vehicles and about 7 percent of vehicle miles traveled. Fatality rates for large
trucks are about 65 percent higher than passenger vehicles.
That is why the Subcommittee, in the Motor Carrier Safety Improvement Act of
1999, authorized $15 million from the Highway Trust Fund to carry out a comprehensive
study to determine the causes of, and contributing factors to, crashes involving large trucks.
The legislation requires the study to be reviewed and updated every five years.
The study calls on DOT to develop measures to improve the evaluation of future
truck crashes; monitor crash trends and identify causes and contributing factors; and develop
effective safety countermeasures. The study is a prime example of our interest in using data
and data analysis to make good transportation policy and programs – and not as a drunk
would use a lamp post, for support rather than illumination.

3
Let me offer a few comments on some of the research projects you are developing:
Research Project #1: Reengineer DOT data programs
I think it’s an excellent idea to reengineer the 40 or so data programs maintained by
DOT related to safety and measures of exposure. An assessment of the quality of existing
data is the first step in retooling DOT data programs.
Research Project #2: Develop common criteria for injuries and deaths
There are many inconsistencies between programs reporting injuries and deaths.
Most modes count any death that occurs within 30 days of an incident. FRA counts deaths
that occur within 365 days of an incident. The Coast Guard does not specify a time period.
For injuries, FMCSA counts an injured person being taken to a medical facility for
immediate medical attention. The Coast Guard requires a report if there is an injury that
requires medical treatment beyond first aid. RSPA requires a report for bodily harm
resulting in loss of consciousness, the necessity to carry the person from the scene, necessity
for medical treatment, or disability extending beyond the day of the accident.
The modes often treat similar circumstances differently. For example, incidents
involving ground crews in aviation are counted while longshoremen in the maritime industry
are not; rail maintenance workers are counted while shipyard and bus maintenance workers
are not.
Clearly, there is a need to develop common criteria for reporting injuries and deaths.
Research Project #3: Develop common denominators for safety measures
The project to develop common denominators for safety measures will make
comparative risk analysis across modes more precise. For example, highway safety data is
currently based on accidents or deaths per vehicle mile traveled, whereas transit safety data is
based on accidents or deaths per passenger mile of travel. These differences, and differences
in other modes, make cross modal comparisons difficult.

4
Research Project #4: Advance the timeliness of safety data
The lack of timely data drives me crazy!
Most of the data reports submitted to Congress are at least two years old by the time
they are released. We need timelier data to identify trends earlier, take corrective actions
earlier, and thus reduce transportation related deaths and injuries. More timely data will lend
greater credibility to DOT’s performance reporting under the Government Performance and
Results Act and other requirements of law.
Conclusion
Let me conclude with a general observation about the use of technology to improve
transportation safety and security. Event recorders have long been used in the aviation
industry to investigate accidents and to help determine the underlying causes of accidents.
We should consider using event recorders in other modes so investigators can be more
discriminating in accident investigations. A couple of your projects envision the use of these
devices.
A large scale demonstration of the most promising crash avoidance technologies in
automobiles should also be conducted – otherwise they will never be accepted. We cannot
mandate these technologies in automobiles unless we can show conclusively that their safety
benefits far outweigh their costs. A large scale demonstration of these technologies could be
the next major step taken in the intelligent vehicle initiative authorized by TEA 21.
Finally, the events of September 11th have made us all aware of the need for
enhanced security in transportation. The use of smart cards and vehicle usage monitoring
systems could improve the security of drivers licenses and restrict access to sensitive
transportation freight. These devices incorporate biometric and other information of the
owner that can be checked against the same measures taken from the person attempting to
use the card or operate the vehicle.

5
I urge you to be sensitive to security needs as you develop your research program.
Thank you for asking me to speak this morning, and I wish you good luck in your
discussions throughout the day.

1
PROJECT OVERVIEW
Reengineer DOT Data Programs
BACKGROUND
In September 2000, the Bureau ofTransportation Statistics (BTS) publishedthe Safety Data Action Plan with the goal ofproviding the U.S. Department ofTransportation (DOT) with quality data,capable of identifying, quantifying, andminimizing risk factors in U.S. travel. TheSafety Data Action Plan identified 10research projects to address specificshortcomings in current data collection anddata quality within the various DOTdatabases. The first research projectaddresses reengineering DOT data programs.
DOT maintains in excess of 40 programsthat capture either safety data or crucialrelated information, such as measures ofexposure. A data quality review requestedby Congress indicated that qualityimprovements can be made that will betterserve the DOT mission. It was decided thatthe first step in reengineering data programsis a data quality audit of all major safety datasystems to evaluate existing capabilities anddetermine needed improvements. Thisincludes review and assessment of DOT datacollection systems, as well as othertransportation safety data systems notdirectly collected by DOT, but accessiblewithin DOT data systems. The next stepwould be to implement recommendationsfor improvements, based on the assessmentperformed. This overview will focus on thedata quality assessments phase.With improved data, DOT’s safety programswill become not only more effective, butmore cost-effective as well. The
Department can better address its strategicgoal of improving safety by developing moretargeted inspection, education, regulatory,and research programs.
Objective
As previously mentioned, the initial goal ofthis project is to conduct quality audits oftransportation safety data systems. Due toresource constraints, BTS decided toconduct data quality assessments of fivemajor data systems by the end of 2001. Dataquality is a broad concept that refers,ultimately, to the usefulness of data foranalysis and decisionmaking. The overallobjective of this project is to ensure thatdecisionmakers can have a reasonable levelof confidence in the source and reliability oftransportation safety data.
Process
A data quality assessment template wasdeveloped to guide the person responsiblefor the assessment and to afford consistencybetween assessments. The template includesthe following sections: Background, Framesand Sampling, Data Collection, DataPreparation, Data Dissemination, SponsorEvaluation, Data Analysis, Assessment, andRecommendations and Suggestions for DataQuality Improvements. See the Attachmentfor details.
The selection of data systems was based onrecommendations from the Safety Data TaskForce members and include: the UNISHIPdata system, the Hazardous Materials

2
Management Information System (HMIS),the Airline Passenger Origin and DestinationSurvey, the National Transit DatabaseSystem – Safety & Security module, and theNational Aviation Safety Data AnalysisCenter (NASDAC)) data system. Draft DataQuality Assessment Reports for each of thefive data systems are under managementreview. Both the assessment and therecommendations for each system aim atimproving the relevance, completeness,quality, timeliness, comparability and utilityof transportation safety data.
DATA SYSTEM SPECIFICS ANDRECOMMENDATIONS FORDATA QUALITYIMPROVEMENTS
UNISHIP
UNISHIP is an enforcement database forhazardous materials shippers. Unlike manyof the other safety databases, UNISHIP isnot available to the general public. Itsprimary purpose under Federal HazardousMaterials Transportation Law is to provideDOT administrations with information onpast violation histories of hazardousmaterials offenders for consideration whenassessing civil penalties. In addition,information about pending enforcementactions against shippers is also collected andshared, thus allowing each administration toknow if another administration is alreadyinvolved in a pending case. Finally,administrations with active shipperinspection programs can use the informationto plan inspections or consolidateenforcement cases across modes.Because the Intermodal Hazardous MaterialsPrograms (IHMP) office of S-3 is in theprocess of preparing a final InformationResources Management (IRM) proceduresdocument for UNISHIP, no
recommendations have been issued at thistime. The IHMP IRM procedures documentaddresses UNISHIP data file transferstructures and file content issues forimproving UNISHIP. It also lists relatedresponsibilities for each OperatingAdministration (OA), and the Office of theInspector General (IG). Additional updatesto prior years data will be made as requiredunder the final IRM procedures. Currently,the IHMP is working with the Research andSpecial Programs Administration (RSPA) todevelop a schedule for beta-testingbimonthly transfers of UNISHIP data fromeach of the OAs using the new file contentand transfer structures.
Hazardous Materials Information System(HMIS)
The Hazardous Materials InformationSystem (HMIS) consists of six databasesthat support the mission of the Office ofHazardous Materials Safety (OHMS) in theResearch and Special ProgramsAdministration (RSPA). The initialhazardous materials incident reportingsystem was established in 1971 to meet therequirements of the Hazardous MaterialsControl Act of 1970. Of the six databasesthat constitute the HMIS, the only databasewith a large set of numeric elements withstatistical properties is the HazardousMaterials Incident Reporting System(HMIRS).
When an unintentional release of ahazardous material occurs, during transit,loading/unloading, or temporary storage,Title 49 CFR 171.15 and 171.16 requires thetransporting carrier to report the incident.Carriers must also notify the NationalResponse Center immediately by telephone,and file an incident report within 30 days,

3
when any one of the following eventsoccurs:• one or more major transportation
arteries or facilities are closed or shutdown for one hour or more,
• the operational flight plan or routineof an aircraft is altered,
• an evacuation occurs lasting one ormore hours,
• estimated carrier and/or propertydamage exceeds $50,000, or
• a person is killed or hospitalized.
The HMIRS identifies the mode oftransportation involved, the name of thereporting carrier, shipment information, thehazardous materials involved, theconsequences of the incident, reporterinformation, and the nature of packaging, aswell as the factors contributing to packagingfailure. On average, carriers reported about14,500 incidents per year during 1995 to1997. The average number of incidentsincreased to about 17,200 records per yearafter intrastate reporting started in October1998.
The assessment conducted by BTS pointsout positive qualities as well as potentialproblems within the HMIS system. Thisdata quality assessment is currently undermanagement review.
Airline Passenger Origin-DestinationSurvey
The Airline Passenger Origin-DestinationSurvey tracks passengers’ use of thecommercial air traffic system. It collectsinformation on passenger origins,destinations, and routings. The CivilAeronautics Board launched the first airlinepassenger survey in 1947, based onpassenger reservations. The reporting basischanged from reservations to tickets in 1968.
After the Civil Aeronautics Board wasterminated on December 31, 1984, theOrigin-Destination Survey continued as aticket-based survey under DOT’s Researchand Special Projects Administration. Since1995, the Bureau of TransportationStatistics, Office of Airline Information(OAI), has conducted the survey byauthorization of Title 14 CFR 241, 19-7.
The Airline Passenger Origin-DestinationSurvey relies on a 10-percent sample oftickets from large certificated air carriersconducting scheduled passenger services.About 12 million passenger tickets weresampled during 2000. Except forinternational data (itineraries including non-U.S. points), OAI releases all data from theAirline Passenger Origin-Destination Surveyto the public.
Selected findings of the data qualityassessment:• Documentation for the Origin-
Destination Survey is weak, therebyhindering the use of the data. Thesurvey also lacks a source andaccuracy statement to inform users ofthe limitations of the data.
• Although tickets are sampledcontinuously, air carriers report datafor the Airline Passenger Origin-Destination Survey 45 days after theend of the quarter, and OAI thentakes 75 days to prepare the data.
• Long-term data timeliness andquality gains can be realized ifcomputerized reservation systemscan be adapted as the basis for theOrigin-Destination Survey. OAIwould need to thoroughly test thefeasibility and accuracy of such anapproach.
• OAI should consider not releasingsummary estimates for markets

4
where the sample size is below acertain minimum, e.g., 200 to 500cases per quarter. Estimates ofvariance should be developed for anysummary estimates published.
National Transit Database System –Safety & Security Module
The Federal Transit Administration (FTA)has responsibility for the National TransitDatabase (NTD) system, which is authorizedby Title 49 U.S.C. Section 5335(a) and(a)(2). The NTD provides informationdescribing the U.S. transit system withrespect to investment, expenditures,operations, and performance. Theassessment document provides backgroundinformation on the NTD, but the actualassessment pertains only to the Safety andSecurity module.
BTS was given the unique opportunity toassess the pilot for the recent revision of theSafety and Security module. The Safety andSecurity module is being revised at thedirection of the U.S. House and SenateCommittees on Appropriations as specifiedin the Reports to the U.S. Department ofTransportation (DOT) FY 2000Appropriations Act. Recommendationshave been made by BTS in the assessmentdocument regarding the collection tool usedto gather safety and security information.Current computer technology allowsbreaking the extensive information requiredon the Safety and Security Forms into aseries of simple questions with appropriateresponse categories. BTS is recommendingthat a series of screening questions be usedto lead the respondent through the newprocess, omitting items irrelevant to themode for which incident data are beingreported. It is recommended that responsecategories be linked to follow-up items for
additional detailed data. In this way, therespondent would only see questions andresponse categories relevant to theirsituation. An individual reporting a transitincident should be able to click on a buttonto view descriptive information pertaining tothe questions asked on a particular screen.This can eliminate the need for repetitivereferences to hardcopy manuals whilepreparing the report. Built-in controls canprevent the respondent from entering datanot of a specific type or outside aprespecified range. The use of suchtechniques will address certain legislativeconcerns by:• Reducing the margin of error – with
skip patterns in the instrument, theindividuals reporting incident dataneed not be presented with a list ofitems and categories, some of whichmay not apply to them. Individualsreporting incident data for a transitagency that does not operate railmodes, for example, may not befamiliar with the terminology andconditions relevant to rail modes.
• Reducing burden of data reporting –by presenting questions andcategories specific to the modeinvolved, the time required forincident reporting is reduced.
The collection of more detailed informationon safety and security incidents effectivelyaddresses the congressional mandate toidentify common causal factors involved intransit incidents, as specified in the Reportsto the U.S. Department of Transportation FY2000 Appropriation Act. Changing thereporting requirements from annually tomonthly or quarterly (depending on the sizeof the transit authority) will greatly improvethe timeliness of the safety and securityinformation on transit incidents.

5
Because much of the historical data files arenot available in text (ascii, or csv) formatfrom NTD website, importing the data intostatistical packages, e.g., SAS, proved to bequite difficult and time consuming. BTSrecommends that FTA make the NTD datamore accessible to users by ensuring thatdata can be easily and quickly read intostatistical packages, like SAS, as well as intouser-friendly packages like Excel.
National Aviation Safety Data AnalysisCenter (NASDAC) Data System
The Federal Aviation Administration’sNASDAC data system is a growing,integrated metadata repository. Its UserCommittee is continuously providing inputfor enhancements. At present, theNASDAC contains 27 data systemsimported from various source databases.There are a number of highly desirablefeatures built into the operational facets ofthe repository and the number of users isgrowing. The NASDAC data systemcurrently provides various resources to theaviation community, including:• a centralized repository of aviation
safety databases;• a library of aviation safety studies
and reference materials;• local and wide area network access;
• Internet, Intranet, and Extranetaccess;
• data access, analysis, and retrievalsoftware; and
• on-site technical and analyticalsupport personnel.
The NASDAC Data Quality Assessment isbeing done in stages. This first stageassessment includes a total system overviewof NASDAC. This is necessary in order tolearn about the data repository, prior to thedata quality assessment of individualNASDAC source databases.
Given that the NASDAC warehouses asignificant number of various aviation safetydatabases, the NASDAC User Committeerecommended that an automated data qualityassessment capability (which could beapplied to each source database) should beincorporated into the system. Thisautomated data quality assessment capabilityis an integral component of NASDAC’sAdvanced Data Architecture (ADA). TheADA is in the development stage and will beimplemented in early 2002. SinceNASDAC’s data quality assessment anddata quality reporting capabilities are still indevelopment stage and are not yet installedin the repository, the recommendations willbe deferred until a review of this systemcomponent is conducted.

A-1
AttachmentData Quality Assessment Template
This is a worksheet for the information gathered and the assessments prepared during a detailed data qualityassessment. The information gathered in Sections A through G serves as background material for the AssessmentReport, which would consist of an Introduction followed by Sections H and I.
A. Background1. Name of data system:
2. Sponsoring agency:
3. Legal authority:Legislation, regulations
4. When initiated:
5. Original purpose of data system:
6. Target population:Events/objects/businesses/persons/etc. of interest and rationale for choosing
7. History of data system:Significant changes in purpose, data uses, collection strategies, etc.
8. Future plans:Have any? How are plans formulated?
B. Frames and Sampling (if applicable)1. Frame:Minimum values for eligibility, sources, update procedures (source? how often updated? how current?), coverage oftarget population
2. Sample design procedures:Description of sampling technique, stratification/clustering, sample allocation, sample weighting (include post-stratification/benchmarking/calibration), variance estimation, redrawing/rotating (how often?)
3. Sample size:Size of frame, total number selected, number per stage if multistage
4. Documentation:Topics covered, intended audience
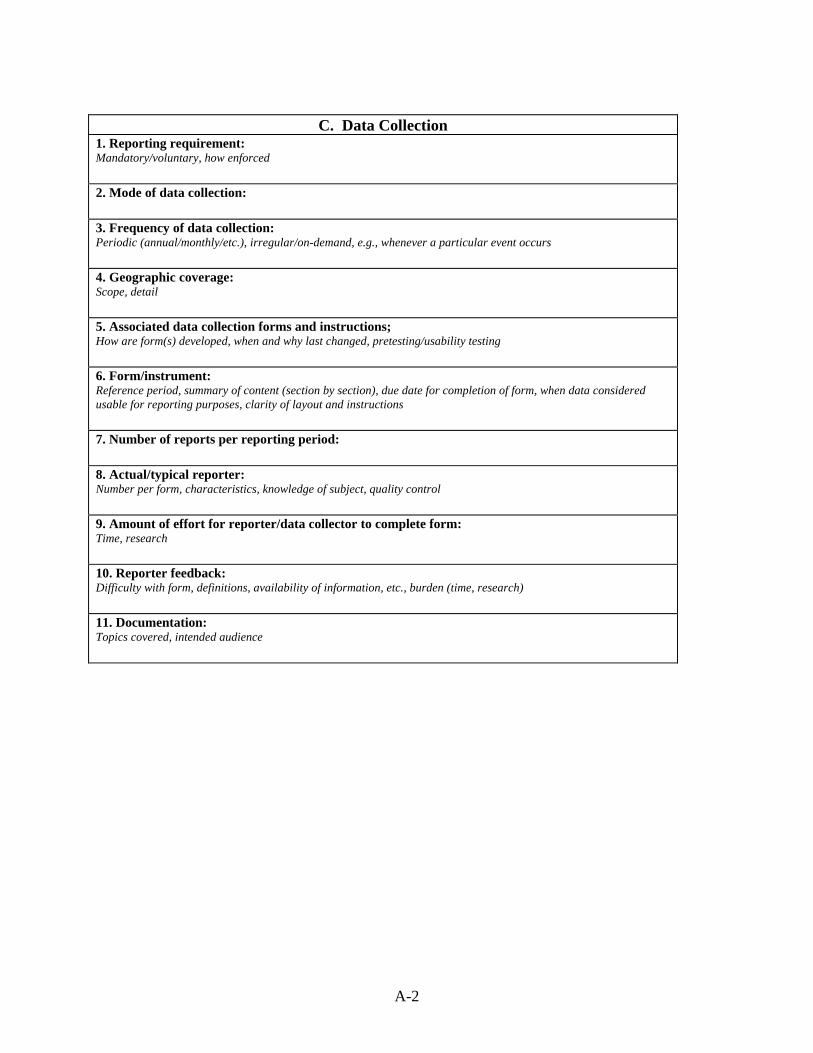
A-2
C. Data Collection1. Reporting requirement:Mandatory/voluntary, how enforced
2. Mode of data collection:
3. Frequency of data collection:Periodic (annual/monthly/etc.), irregular/on-demand, e.g., whenever a particular event occurs
4. Geographic coverage:Scope, detail
5. Associated data collection forms and instructions;How are form(s) developed, when and why last changed, pretesting/usability testing
6. Form/instrument:Reference period, summary of content (section by section), due date for completion of form, when data consideredusable for reporting purposes, clarity of layout and instructions
7. Number of reports per reporting period:
8. Actual/typical reporter:Number per form, characteristics, knowledge of subject, quality control
9. Amount of effort for reporter/data collector to complete form:Time, research
10. Reporter feedback:Difficulty with form, definitions, availability of information, etc., burden (time, research)
11. Documentation:Topics covered, intended audience

A-3
D. Data Preparation1. Who prepares:
2. Editing:Types of edits, how are error messages dealt with, verification procedures
3. Late/missing reports:Follow-up procedures, rate (and how calculate)
4. Adjustment/imputation for late/missing reports:Procedures, impact on estimates
5. Missing items in reports:Follow-up procedures, rate for key items
6. Any imputation for missing items in reports:Which items, procedures, impact on estimates
7. Changes and updates:Procedures, report files archived?
8. ITDB preparation:Changes made, reasons for changes, impact on estimates
9. Documentation:Topics covered, intended audience
E. Data Dissemination1. Intended audience:DOT (which part?), Congress, State/local governments, industry/trade associations, researchers, etc.
2. Other major uses (enforcement, etc.):
3. Confidentiality/privacy concerns and protections:
4. Reports and publications:Name, date of release (relative to end of reporting period), particular target audience, format(s) released (hardcopy,online, CD, etc.), how label/identify revisions, description of data limitations included?
5. Analysis:Estimation procedures, statistical comparisons, seasonal/cyclical adjustment
6. Tabular and graphical presentation:
7. Release of data:What information released, what format, available to whom

A-4
F. Sponsor Evaluation1. Coverage of target population:
2. Validation of data:
3. Data quality/limitations of data:Sources and accuracy stated, sampling error, nonsampling error
4. User feedback:Who are actual users, how well are needs met, how is feedback solicited, performance measures collected
5. Prior reviews:
G. Data Quality Staff Data Analysis1. Ease of access and use
2. Documentation sufficiency, accuracy:Variable names, values, etc.
3. Blank data elements:
4. Overuse of text fields:
5. Coding/classification problems:Mutually exclusive and exhaustive, systematic, overuse of “other”, “NEC”, etc.
6. Duplicate records:
7. Outliers:
8. Inconsistencies among items:
9. Ability to reproduce published/official estimates:
10. Relationship to other data:Within data system over time, ability to relate to external data systems (e.g., standard definitions, codes), estimates,duplication between systems
11. Anything else that looks strange:
12. Source of data used in DQ staff analysis:Name of file, location, date acquired/accessed, version, etc.

A-5
H. Assessment1. Relevance and Completeness:User needs and data gaps, coverage of major issues, user involvement mechanisms, program review and monitoringpolicies [cf. Sections A, E, F]
2. Quality:Design of data collection meet objectives, how carefully implemented, assessments of accuracy provided,quantification of accuracy and deficiencies [cf. Sections B, C, D, E, G]
3. Timeliness:Delay between reference date and time information available, delay between time information available and timeneeded to be useful [cf. Sections A, C, E, F]
4. Comparability:Ability to combine with other information, cross-modal consistency in concepts and definitions, consistency with non-DOT concepts and definitions [cf. B, C, G]
5. Utility:Ease of obtaining information, suitability of format for users, availability of supplementary information/metadataneeded to use data correctly, documentation, and its interpretability, statements describing limitations of the data [cf.Sections A, C, D, E, F, G]
I. Recommendations and Suggestions for Data Quality Improvements1. “Tactical” (correcting any errors found during review):
2. “Strategic” (improving procedures):Easy (low-lying fruit), hard (e.g., need additional resources)
3. Continuing:Follow-up on implementation of recommendations, development of standards
J. References

1
PROJECT OVERVIEW
Develop Common Criteria for ReportingInjuries and Fatalities
BACKGROUND
In September 2000, the Bureau ofTransportation Statistics (BTS) publishedthe Safety Data Action Plan with the goal ofproviding the U.S. Department ofTransportation (DOT) with data of a qualitysufficient to identify, quantify, and minimizerisk factors in U.S. travel. The Safety DataAction Plan identified several researchprojects to address specific shortcomings incurrent data collection and data qualitywithin the various DOT databases.
The synthesis of the recommendations fromthis extensive research program can providethe foundation for a plan to improve dataquality and comparability within DOT. It isanticipated that these improved data willlead to interventions that will advance theDOT Strategic Safety Goal of eliminatingtransportation-related deaths, injuries, andproperty damage.
Objective
The objective of this project was to deviseinjury coding standards for all DOTdatabases. This would ensure uniformity ininjury event definitions and reportingcriteria across modes and include sufficientmechanistic cause information fordevelopment of intervention strategies.
GENERAL APPROACH
The general approach was to inventory DOTand selected non-DOT databases, andidentify, describe, and explore opportunitiesto reach the objective.
Scope
The scope was limited to a review of U.S.transportation safety databases including air,water, road, rail, transit, and pipeline, aswell as a review of standards and bestpractices from non-transportation injury datasystems or coding protocols. This reviewfocused on data related to acute non-intentional injuries sustained bytransportation workers and travelers, butalso considered the potential for reportingchronic injuries and disabilities andintentional injuries such as homicide andsuicide.
Data Sources
The data sources included the followingfederal agencies:
Department of Transportation agencies:• Federal Aviation Administration (FAA)• Federal Motor Carrier Safety
Administration (FMCSA)• Federal Transit Authority (FTA)

2
• Maritime Administration (MARAD)• National Highway Traffic Safety
Administration (NHTSA)• Research and Special Programs
Administration (RSPA) (under theOffice of the Secretary ofTransportation; includes hazardousmaterials, pipeline safety, and otherspecial projects not mode-specific)
• U. S. Coast Guard (USCG)
Other federal agencies:• National Center for Health Statistics
of the Centers for Disease Controland Prevention (NCHS/CDC)
• National Institute for OccupationalSafety and Health (NIOSH)
• Consumer Product SafetyCommission (CPSC)
• National Transportation SafetyBoard (NTSB)
• Department of Defense (DOD)
Purpose of Injury Investigation/DataCollection
Investigations of transportation incidents areintended to determine the cause(s) of theincidents. DOT’s Strategic Safety Goal is to“promote the public health and safety byworking toward the elimination oftransportation-related deaths, injuries, andproperty damage.” The overridingphilosophy is that the determination of causefactors will lead to prevention strategies.Although the elimination of injury-producing incidents is a justifiable andlaudable goal, few believe it is achievable aslong as humans are involved in the design,manufacture, operation, and maintenance oftransportation systems. This is particularlytrue considering the constantly increasing
exposure in most, if not all, transportationmodes.
A secondary goal of incident investigationand data collection should be to determinethe cause(s) of injury. An appropriatebalance needs to be reached between effortsdirected toward incident prevention andthose directed toward injury prevention.This secondary goal is frequentlyoverlooked or underemphasized in theinvestigation of transportation incidentseither because it is not recognized asimportant by the investigating agency orbecause of resource limitations. Some haveargued that injury and survival factorsinvestigations are unnecessary and detractfrom the main focus of investigations — theprevention of incidents. Such reasoning isbased on the now discredited “zero defect”mentality that persisted in the 1970s and1980s. In order to meet the DOT StrategicSafety Goal, both aspects of incidentinvestigation must be aggressively pursued.
Injury investigation and the recording ofinjury data in transportation databases isgenerally undertaken to meet one or more offour main objectives:
1. to determine the “severity” of anincident,
2. to aid in the calculation of the “cost” oftransportation incidents,
3. to provide a basis for managementdecisions related to prioritization andresource allocation, and
4. to provide a basis for developingprevention/mitigation strategies.
The first two objectives can be achievedwith relatively rudimentary injury data, suchas recording whether each person involvedin the incident received fatal injuries, wasotherwise injured, or was uninjured.

3
Depending on the goals of the organization,the third objective may be met with eitherrudimentary or more detailed data. To meetthe fourth objective of providing a basis fordeveloping injury mitigation strategies,however, requires not only descriptive dataon the nature of the injuries sustained bypersons involved in an incident, but alsoinformation relating to the mechanism orcause of those injuries.
Clearly, one cannot develop an effectiveprevention strategy for a particular type ofinjury if that injury is not adequatelydescribed and if the cause of the injury is notknown. Consequently, the development of adatabase that can be used to formulate injurymitigation strategies requires considerablygreater amounts and specificity of data thana database designed to meet the otherobjectives listed above.
The mechanism of an injury can bedescribed on various levels. Frequently, theterm is used in its general sense to describethe activity that caused a person to beinjured. Examples include “automobilecrash,” “fell from a height,” or “involved inan explosion.” Although this level ofdescription provides some useful data, itstates the obvious in most transportationincidents, and is thus not very useful fordeveloping mitigation strategies. A moreuseful level of description requires theidentification of the particular injury such as“left distal tibia fracture” and a clearmechanism of that injury such as“floorboard deformed inward.” Thisdetailed joint description of injury and causegives a clear picture not only of the injurybut also of the specific cause of that injury.A database with this level of descriptionallows the user to identify and quantify theoccurrence of that injury and its associatedmechanism over time and also suggests a
mitigation strategy — prevent the floorboardfrom deforming. Without such data,analysts could identify the injury, but thecause and potentially effective mitigationstrategies would be left to speculation.
Detailed injury and mechanism data areindispensable in identifying and quantifyinginjury causes and performing a cost-benefitanalysis of proposed prevention strategies.However, collection of reliable mechanisticdata requires well-trained investigators,detailed analysis of the incident scene, and ahigher level of resource commitment than iscurrently available in many incidentinvestigations. Specifically, the processrequires an analysis and description of allsignificant injuries, careful analysis of theenvironment to which the injured wasexposed, an analysis of protective equipment(e.g., seats and restraints) to determinefunction or lack of function and use, and aknowledge of the crash dynamics, incidentcircumstances, and related structural failuremodes.
Longitudinal analysis can identify consistentinjury mechanisms suggesting the need andmethod of implementing injury preventionstrategies and providing the justification forthe expenditures involved. Such analysiswas responsible, for example, for theimprovements in automobile restrainttechnology introduced in the U.S. marketover the past 40 years. In the 1960s, the lapbelt was introduced into automobilesprimarily to prevent ejection of occupantsfrom vehicles during crashes. Subsequently,it was shown that although the lap beltprevented occupant ejection, it did notprevent upper torso and head contact withinternal structures, and it even caused aconstellation of injuries later referred to asthe “seat belt syndrome." Consequently, thelap/shoulder harness restraint system was

4
introduced. This innovation greatly reducedthe injuries identified in many previouscrashes, but was it shown to be insufficientto protect front seat occupants in other typesof crashes. This led to the development ofthe air bag, which was first offered toenhance protection in frontal collisions fordrivers, then all front seat occupants, andwas subsequently refined to avoid certainserious injuries caused by the air bagsthemselves in some cases. Now thetechnology has been extended to protectboth front and rear occupants in sideimpacts. These innovations have all beenbased on knowledge of injuries and causalmechanisms derived through crashinvestigations and a database with sufficientdata to perform an accurate analysis andquantification of injury mechanisms.
Therefore, in a program to provide commoninjury data and common injury and eventdefinitions across all modes oftransportation, it is vital to establish clearobjectives for the use of the data and toensure that new data systems provide asufficient level of detail, quality, andcommonality to meet those objectives. Toprovide a data system that will provide asufficient level of detail to develop andjustify injury mitigation strategies willrequire that mechanistic data be collectedand stored. For some modes, this willrequire a considerably higher level ofcommitment to incident investigations interms of trained investigators and financialresources than currently available. Othermodes currently have such systems in place.
INJURY INFORMATIONCOLLECTED BY EACH MODE
General
Each transportation mode is regulated by atleast one federal agency with at least onedatabase on injuries and property damagebut with little coordination of data collected,definitions of events or injuries, or data-collection methods. The Volpe NationalTransportation Systems Center Reportprovided a comparison of reporting criteriaand how fatality and injury data are capturedand reported within agency databases. Theworking group for this project (2) obtainedbasic data for comparison from the Volpereport and provided more data on non-DOTdatabases.
Comparison of Databases
Injury Criteria Utilized in ExistingDatabasesThe working group developed a matrixcomparing each data source on 10 factors:agency responsibility with respect to injuryinvestigation, identity and training of datacollectors, nature of data sources, definitionsof events that trigger investigation or report,event and circumstance inclusion criteria,inclusion of data on uninjured, fatalitydefinition, injury definition, injury coding,and statutory requirements governing thescope of investigation and reporting.
Event DefinitionsMost agencies use one or more of fourfactors as the threshold for reporting anincident: degree of injury, dollar amount ofproperty damage, amount of substancereleased into environment, and type ofoccurrence. There is mode specificity andwide variation on each factor, although all

5
agencies report fatalities at the sceneinvolving operation of a vehicle orpipeline.
Fatality DefinitionsIn some cases, whether a fatality is deemedtransportation-related and reportable maydepend on the function of the fatally injuredperson at time of death. Agencies also varyin the maximum elapsed time betweeninjury and death permitted for reporting,with FRA allowing up to 365 days, whiletransit, highway, and aviation agenciesallow up to 30 days, and pipeline and marineagencies do not specify any such limit.
Injury DefinitionsCriteria for reporting injury vary widely.Examples include injuries requiringhospitalization, needing to be carried fromthe scene, needing medical treatment,disability beyond the day of injury,incapacitation or hospitalization beyond 24hours, and so forth.
Person Inclusion CriteriaThe function or location of victims at thetime of an incident frequently determines iftheir injuries are reportable, and the specificcriteria for inclusion vary widely acrossdatabases.
Uninjured PersonsDatabases vary widely in whether or howuninjured occupants or bystanders arereported.
Data CollectorsThe training and background of personsinvestigating and reporting data varieswidely, with trained professionalinvestigators in some modes, self-reportingowners or operators in others, andcombinations of police accident reports and
trained investigators in the NHTSAdatabase.
Injury CodingThere is no universally accepted system ofinjury classification and coding among anydatabases known to the working group.Most schemes focus on injury description,severity, and mechanism. The AbbreviatedInjury Scale (AIS) is the most widely usedand accepted system, classifying injury bybody part, specific lesion, and severity on a6-point ordinal scale with a 7th-digit to code“Unknown,” where severity is looked at interms of the threat to life of a single injurywithout respect to combined effect ofmultiple injuries on one person. The InjurySeverity Score (ISS) and the Maximum AIS(MAIS) are functions of the AIS on a singleinjured person that measure overall injuryseverity. Most hospitals encode dischargediagnoses using the InternationalClassification of Diseases, ClinicalModification, 9th Edition (ICD-9CM), whichclassifies injury and other diagnoses by anumerical code and will be revised within ayear (ICD-10CM). A published conversiontable exists to translate ICD-9CM codes intoAIS. AIS does not specify injurymechanism or body part aspect (e.g., left orright, superior or inferior, anterior orposterior). The KABCO scheme allowsnonmedically trained persons to make on-scene injury severity assessments, whereK = Killed, A = Incapacitating Injury,B = Non-incapacitating injury, C = Possibleinjury, and O = No injury.
Discussion
Due to the wide variation among DOTmodal agencies in event definitions, typeand detail of injury data, and methods andresources applied to incident investigationand injury reporting, achieving common
6
criteria will require major changes inpractices and resource allocation, andassociated Code of Federal Regulations(CFR) specifications, in some or allagencies. The working group consideredtwo approaches to establishing commoncriteria for reporting injuries and death: aminimal “least common denominator”approach and a proven current systemsapproach. The minimal approach wouldadapt the existing method with the leastcomplexity and resource allocation to allmodes to allow general cross-modalcomparison of injury cost and severity, butwould not provide sufficient data to identifyinjury causes or develop practical mitigationstrategies.
In contrast, two proven current systemsprovide data sufficient to identify injurycauses and support development andjustification of mitigation strategies: theNational Automotive Sampling SystemCrashworthiness Data System (NASS CDS)and the U.S. Army Aircraft AccidentReporting System (USA AARS). While theNASS CDS is a probability sample usingtrained investigators or analysts, the USAAARS is a total reporting system (census),using physicians to record the data. Bothsystems are based on AIS 90 with additionalfields for pertinent injury and mechanisminformation. NHTSA and automobilemanufacturers routinely use NASS CDSdata to identify and mitigate injury hazardsand to justify or oppose proposedrulemaking. The U.S. Army routinely usesUSA AARS data to identify and mitigatecausal factors associated with injuries.
RECOMMENDATIONS
General
In spite of the marked differences amongtransportation modes in event and injurydefinitions, inclusion criteria, and thereporting and coding of injury data,establishing common criteria for suchreporting among the modes is a technicallyachievable goal. The main impediment toachieving the goal will be resourceallocation. Nevertheless, in the spirit of theSafety Data Action Plan and DOT StrategicSafety Goal, the working group hasdeveloped the following set ofrecommendations that it believes willpromote commonality among the modes andalso improve the quality and utility ofmechanistic incident and injury data fordevelopment of strategies to prevent injuriesin vehicular crashes and othertransportation-related incidents.
Event DefinitionThe working group recommends that allmodes adopt the following definition of areportable event.
Any incident involving the movement oroperation or intended movement oroperation of a motor vehicle, vessel, aircraft,pipeline, or other conveyance in the courseof transporting persons or goods from oneplace to another:• that occurs within U.S. jurisdiction
or involves a U.S. commercialcarrier;
• where the cause is intentional orunintentional;
• that results in substantial propertydamage; or
• that results in injury (requiringmedical attention beyond first aid) or

7
death of anyone (passengers, crew,pedestrians, other workers, orbystanders) within 30 days of theevent.
Fatality DefinitionA transportation-related fatality one thatresults from injuries incurred in atransportation incident when the deathoccurs within 30 days of the incident.
Injury DefinitionA transportation-related injury is onerequiring medical attention beyond first aidgiven in a transportation incident.
UninjuredTo evaluate injury preventioncountermeasures and the hazard associatedwith design features or environmentalstructures, record data for both injured anduninjured individuals exposed to the samepotentially injurious event. At a minimum,age, sex, seating position, and occupantrestraint use and availability should berecorded for uninjured individuals exposedto a reportable event.
Injury Classification and CodingThe working group recommends an injuryreporting system patterned after the NASSCDS, with at least the following elements:• source of injury data,• complete AIS 90 code, including
severity code,• aspect of injury 1,• aspect of injury 2, and• injury source (one or more data
fields).
Because injury mechanisms differ markedlyacross modes, an encompassing set ofcommon codes cannot be developed for useacross all modes. The working group
recommends that experts in each modeand/or database develop a set of codespatterned after the NASS CDS or USAAARS, after which commonalities can beidentified and implemented whilemaintaining necessary mode-specific codes.The working group recommends a cost-benefit analysis of the feasibility of applyingthe adopted standards to historical data inDOT databases. If modes elect not to adoptthe recommended common coding method,then the working group recommends thatthey adopt AIS for some commonality withother modes, and if the latter is not electedby a mode, then the mode is urged to adoptKABCO or a modification thereof as part oftheir injury-coding scheme.
Other Recommendations
Finally, the working group suggests twoother recommendations that were outside thescope of the current project. First, eachmode or database manager should consideropportunities for limiting detailedinvestigations of incidents to a validstatistical sample as has been done byNHTSA in the NASS CDS database.Sampling requires a high volume ofincidents for precise statistical estimation.For this reason, it will not be practical for allmodes, but it should be considered forgeneral aviation and, most likely,recreational boating. Second, each modeshould pursue opportunities for linkingtransportation databases to hospitaldatabases, state or territory vital statistics,and other medical databases. Such linkageshave the potential of reducing workload andresource requirements as well as increasingthe accuracy of injury recording.
1
PROJECT OVERVIEW
Common Denominators for TransportationSafety EvaluationsINTRODUCTION
Background
Transportation safety statistics are oftenreported as rates of events, such as crashesor deaths per some unit of activity (oftencalled exposure). The type of exposureinformation used to calculate these ratesvaries greatly and is often specific to thetype or mode of transportation system beingevaluated. This mode-specific characteristicmakes comparisons of the relative safety ofdifferent transportation modes very difficult.Consequently, transportation safetypractitioners, policymakers, and the publicoften have difficulty accurately comparingthe safety performance of differenttransportation modes.
In September of 2000, the Bureau ofTransportation Statistics (BTS) of the U.S.Department of Transportation (DOT)initiated a project called the Safety DataAction Plan. The goal of the plan was todevelop an approach to improve the qualityof safety data throughout DOT. BTSidentified 10 subject areas that would benefitfrom a focused effort to improve the qualityof transportation safety data andinformation.
One of these topics was the development ofcommon denominators for safety measures.The problem was defined as “Each modeuses a different set of denominators(exposure measures) for evaluating changesin safety risk” (Safety Data Action Plan).
The plan authors further observed “We needsome set of common denominators that canbe used to characterize transportation safetyin a comparable way for comparablecircumstances. It should be possible tocompare the risk of recreational boating, forexample, to the risk of recreational flying orrecreational driving. ”
While there are limitations to identifyingcross-modal exposure measures, thepotential benefits from such an effort aremany. For example, having a commonframe of reference for transportation safetymetrics will allow researchers andpolicymakers to conduct evaluations thatprovide insight on some of the followingissues:• the overall safety of the
transportation system;• relative safety of different modes;• comparison of the effectiveness of
safety interventions for differentmodes;
• focus areas for research and/orfunding; and
• strategic planning for transportationagencies including federal, state, andmunicipalities.
Objective
The objective of this project is to identifycommon denominators suitable for safetyevaluations and comparisons within and

2
across various transportation modes(aviation, recreational boating, commercialfishing, etc.). Numerous factors will beconsidered, including the suitability ofcurrent exposure measures for cross modecomparisons, the possible need to developnew measures, and the methods required todevelop these new measures.
GENERAL APPROACH
The project involved two main steps:baseline determination of current exposuremeasure characteristics and evaluation ofcross-mode suitability of the exposuremeasures.
Baseline Determination
• Current exposure measures used intransportation safety evaluationswere indexed and cataloged.
• Limitations and gaps associated withthe current exposure measures wereidentified.
• Potential improvements in currentexposure measure data systems wereidentified.
Cross Mode Exposure Measures
• Suitable, and unsuitable, cross modecomparisons were identified.
• Exposure measures needed tosupport these comparisons wereidentified.
• Recommendations for the use ofexposure measures suitable for intra-and intermode comparisons weremade including the development ofnew measures where appropriate.
• Approaches for implementingfindings and recommendations wereidentified.
Scope
The scope of this project is limited toevaluation of exposure measures suitable foruse in transportation safety relatedevaluations (both inter- and intramode).Primary attention was paid to U.S. DOTbased data systems, although those datasystems commonly used for exposure datamaintained by non-DOT organizations arealso included. Exposure measures for thefollowing modes were considered:• aviation,• highway,• railroad,• transit,• water, and• pipeline.
Note: The working group for this projectwas concerned about defining whatconstitutes a transportation relatedoccupational injury or death. This wouldhave a direct impact on the exposuremeasures used for evaluating such injuries.Consequently, the Project 3 working groupapplied the scope definition used by theProject 5 and Project 2 working groups.Specifically, exposure measures wereconsidered that were useful for ratecalculations of transportation crashes ormishaps. The definition of crash and mishapwas defined as:• any incident involving the movement
or operation of a vehicle, vessel,aircraft, pipeline, or otherconveyance in the course ofconveying persons or goods fromone place to another;
• occurs within U.S. jurisdiction orinvolves a U.S. commercial carrier;
• is intention or unintentional; and• results in substantial property
damage or injury (requiring medicalattention beyond first aid) or deathwithin 30 days (e.g., passengers,

3
crew, pedestrians, other workers, orbystanders).
Information Sources
Data SourcesExposure information is sometimes derivedfrom data sources not originally designed fortransportation safety analyses. An examplemight be the use of information derivedfrom the registrations for recreational boats.Submittal of these data are required fromeach of the 50 states. The data is thencollected by the U.S. Coast Guard and usedfor safety evaluations. The difficulty withthis exposure data source is that individualstates have different registrationrequirements and data may varyconsiderably. Further, this exposure sourcedoes not provide information on the activityassociated with the boats. That is, how arethe boats used, by whom, and so on?Finally, there is no federal control of boatregistration, and thus changing the system toproduce better exposure information will bedifficult, as will be the case with othersources of exposure data (e.g., automobileregistrations and licensed driver registries).
In contrast to the boat registration database,other sources of exposure data arespecifically designed for use in safetyevaluations. An example of this is theGeneral Aviation and Air Taxi Surveyconducted by the Federal AviationAdministration on a yearly basis. Thissurvey collects information from a sample ofaircraft owners who provide information onhow the aircraft is used, how often it isflown, and how it is equipped, plus manyother types of information that prove usefulto analysts and policymakers.
For this project, the primary source of theexposure data is collected and maintained bythe following government organizations.
U.S. Department of TransportationFederal Aviation Administration (FAA)Bureau of Transportation Statistics (BTS)Surface Transportation Board (STB)Federal Railroad Administration (FRA)U.S. Maritime Administration (MARAD)United States Coast Guard (USCG)Federal Highway Administration (FHWA)Federal Transit Authority (FTA)Research and Special ProjectsAdministration (RSPA)
Other Federal AgenciesNational Institute for Occupational Safetyand Health (NIOSH)U.S. Army Corps of EngineersU.S. Census Bureau
Most of the exposure databases maintainedby these organizations were evaluated byDOT’s Volpe National TransportationSystems Center (Berk) and summarized in areport to support this project.
Expert PanelIn addition to the information provided byVolpe and the various government agencies,an expert panel of experiencedtransportation safety practitioners,researchers, and government representativesprovided considerable input on the focus ofthe project and the associatedrecommendations.Consideration of ApproachInitially, the working group assigned to thisproject spent a significant amount of timeconceptualizing how cross modalcomparisons would work. This became oneof the first steps undertaken because theworking group had little experience in usingcommon exposure measures forcomparisons across modes. Review of therelevant literature and comparison of theexperience among the working groupmembers demonstrated that such

4
comparisons appear to be somewhatuncommon.
Traditionally, transportation safety statisticsare reported and compared within modes.Typical statistics arising out of thesecomparisons might include reporting rates ofevents, perhaps over time so comparisonscould be made of the increase or decrease ofunwanted events. In order to understandhow cross modal comparisons might beused, a sample of potential questions orcomparisons was derived from input fromBTS staff. Some of these ideas are listedbelow.
How Common Exposure Measures MightBe Used• Allocating research resources across
modes (and across federal programsin general).
• Making modal choices for travelamong the public (where there arelogical choices to made (e.g., longautomobile trips or bus trips versusairline travel).
• Identifying especially riskytransportation occupations oractivities.
• Monitoring overall transportationsystem safety performance andtargeting interventions where themost benefit might be expected.
• Strategic planning for DOT andother governmental transportationauthorities.
• Support for rulemaking.
Review of the various exposure databasesshows a large variation in how data arecollected and used. Because of these manydifferences, it is inappropriate to expect asingle set of exposure measures might to besuitable for all transportation modes. It maybe that simple exposure measures (e.g.,number of people transported by a mode)
are useable for cross-mode evaluations, butthis measure may not be very informative.If efforts are made to find exposuremeasures that are more specific, such as thenumber of hours flown by a pilot during afixed time frame, the applicability across thevarious modes seem to rapidly diminish.
In addition, it is clear that cross-modalexposure measures are only needed wherethere are meaningful cross-modalcomparisons of risk. For example, theworking group could not think ofmeaningful comparisons of say, the risk offlying on a commercial airliner versus therisk of riding in a recreational sailboat. Inlike fashion, it is clear that cross-modalexposure measures between two or moremodes might change based on the riskquestion being asked. For example, the riskto freight between air and highway modesmight require a different exposure measurethan the risk to the operators of the freightcarriers in the two modes.
Based on these considerations, the workinggroup decided to apply a simple conceptualmodel applicable to all modes to helpdetermine what types of cross modalexposure data might be valid and useable.There were four main categories (each withmultiple subgroupings) included in thismodel.
Cross Modal Categories for Exposure DataThe four groupings used by the workinggroup were associated with the underlyingpurpose of the transportation activity:
1. Recreational use: Includes activitiessuch as pleasure boating, recreationalflying, and recreational driving.
2. Cargo and material transportation:Includes transportation of cargo andmaterials by airplane, truck, pipeline,and water.

5
3. Passenger transportation: Includesall activities involving passengertransportation, both commercial andprivate.
4. Occupational and Harvesting:Includes occupational activities suchas commercial fishing, truck driving,flying, etc.
These categories are not mutually exclusive,but they provide a starting point fordiscussing suitability of cross modalcomparisons.
DISCUSSION OF CROSS MODALEXPOSURE MEASURES
Working group 3 identified potentialexposure measures that could be appliedacross modes. In some cases, theseexposure measures are derived from currentexposure data systems while in others, newdata collection efforts might have to beundertaken.
As mentioned earlier, the results from theworking groups’ discussion on exposuremeasures suitable for cross modal evaluationare organized by the function of thetransportation activity. These groups arepassenger transportation, freighttransportation, recreational use, andoccupational activities.
Passenger Transportation
Modes involved in passenger transportationinclude aviation, highway, transit, maritime,and rail. The working group was also askedto consider walking and bicycling, butdecided that only bicycling was suitable forinclusion in this evaluation of exposuremeasures. Exposure measures identified bythe working group that might be of use areincluded below. Some of these exposurevalues are derived from actual measures(from surveys or required reports) whileothers are calculated from measures that arereported:• person miles traveled (calculated),• person hours of travel (calculated),• average trip length in miles
(measured),• average trip length in time
(measured),• number of occupants in vehicle
(measured),• number of people using that mode of
transportation per year (measured),and
• number of licensed drivers/operators(measured).
Freight Transportation
Modes involved in freight transportationinclude aviation, highway, maritime, rail,and pipeline. It should be noted thattransportation of materials by pipeline isvery different than transportation of mostother freight. This characteristic caused afair amount of discussion among workinggroup members who had difficultyidentifying common exposure measures forfreight that would also include pipeline.Exposure measures identified by theworking group that might be of use include:• ton miles,• cube miles,• trip length in miles,

6
• trip length in time (these two valueswould allow speed values to becalculated),
• number of licensed drivers/operators,• volume of materials transported,• person miles traveled (calculated ),
and• person hours of travel (calculated).
Occupational Transportation ExposureMeasures
The working group felt strongly that thequality of occupational exposure data in thetransportation industry must be improved.The group, however, had a difficult timedetermining which groups should beconsidered transportation workers. Asdiscussed earlier in this paper, the workinggroup decided that occupational-relatedexposure data should be limited to the actualoperation of the vehicle. Support functionssuch as maintenance, loading, and otheractivities where the vehicle is stationarywould not be included. It should be noted,however, that many occupational groupssuch as truck drivers, pilots, and others haveresponsibilities other than just operatingtheir vehicles. These individuals may berequired to load and unload trucks, wait forloading, and so on. These activities areconsidered part of the driver’s work time(often called duty time) but are not typicallyrecognized when measuring vehicleoperation. This is critical if safetyevaluations examine operator fatigue orcircadian rhythm disruption.With this limitation in mind, occupationalgroups would include vehicle operators andcrewmembers. It is also appropriate thatindividuals who rely on their personalvehicles to perform their jobs be included inthis group.
There is some discrepancy in the group’sdefinition with respect to occupational
exposure to workers maintaining the“facility.” Here, highway transportation isconsidered somewhat unusual in that facilitymaintenance and development is done in thepresence of moving vehicles (i.e., inhighway work zones). This is not true (atleast to the same extent) for other modes.Because of this difference, this group is notincluded here. The working group alsodecided to include commercial fishermansince they are dependent on the fishingvessel, a form of conveyance, for theirlivelihood.
Exposure measures identified by theworking group for transportation workerexposure databases that might be suitable forcross mode evaluation include thefollowing:• hours on duty,• person hours operating the vehicle,• number of licensed drivers/operators,• total number of individuals involved
in that occupation, and• active work zones in highway areas
(including a measure of size i.e.,length by number of lanes as well asa measure of amount of time inplace).
Recreational Exposure Measures Suitablefor Cross Modal Comparisons
The working group recognized thattransportation related recreational activitiesare fairly common. The working groupdecided that recreational use of vehiclesinvolved those activities associated with thepleasure of operating the vehicle—not usingvehicles for transportation. Activities thatmight fit this profile included recreational

7
boating, recreational flying, recreationaldriving (for example, off- road exploration),and recreational bicycling. Common to allof these recreational uses of vehicles is thefact that traveling from one place to anotheris not the primary purpose.
Exposure measures identified by theworking group for transportation relatedexposure measures that might be suitable forcross mode evaluation include thefollowing:• person hours operating the vehicle,• total number of other participants
involved in the recreational use ofvehicles, and
• total number of vehicle occupants.
RECOMMENDATIONS
The following recommendations are basedon the exposure data needed to support crossmodal evaluations.
The general aviation activity survey shouldbe expanded to collect information on thefollowing topics:• number of aircraft occupants;• person miles traveled;• trip length, miles;• freight (ton miles); and• hours on duty for professional pilots.
A program should be developed to capturethe following types of information fromcommercial marine operators includingcommercial shippers and commercialfisherman. At this point, it is not clear ifcurrent data collection efforts for this groupcould be modified or if a new data collectionprogram would need to be developed.• trip length, miles;• trip length, time;• number of occupants or crew;• hours on duty;
• person miles, stratified by position(crew, passenger, etc.); and
• person hours, stratified by position(crew, passenger, etc.).
The highway data collection efforts, HPMS,VIUS, NHTS, Transportation AnnualSurvey and Commodity Flow Survey shouldbe reviewed to determine the accuracy ofcurrent estimates provided and theirsuitability for combination or modificationto provide or enhance the followinginformation for motor carriers.• person miles traveled,• person hours traveled,• trip length,• number of occupants,• total number of trucks operated by
commercial motor carriers,• hours on duty for vehicle operators,
and• purpose of trip.
An ongoing and systematic survey should beundertaken to capture information fromrecreational boat operators on the following:• person hours operating the boat;• person hours on-board, including at
anchor;• total number of boat occupants;• trip length, miles; and• trip length, time.
The NHTS should be conducted morefrequently to improve timeliness ofinformation and modified to collectinformation on the following:• recreational driving;• recreational boating;• person hours engaged in recreational
driving;• total number of occupants during
recreation driving;• recreational trip length, miles;• recreational trip length, time; and
8
• increase frequency of survey toimprove timeliness.
The Department of Transportation shouldwork with State and other appropriateauthorities to develop a central repository ofdemographic information derived fromoperating licenses and approvals. Thiswould include:• drivers’ licenses,• operator information for train and
transit operators, and• information on commercial marine
operators.

1
PROJECT OVERVIEW
Developing Common Data on AccidentCircumstancesBACKGROUND
Over time, each transportation mode hasdeveloped its own way of describing thecircumstances surrounding crashes andmishaps. Consequently, there is littleconsistency across modes in how data arecollected and in the characteristics of datadescribing a mishap. Efforts to defineimportant factors that may contribute tocrashes/mishaps are often limited to a singlefactor or to a poorly delineated group offactors such as “operator error." A moredetailed characterization of human factorsand crash survival factors is needed in mosttransportation modes.
Objective
The objective of Project 5 was to describethe type of data currently available, compareit with that needed by investigators andresearchers in order to identify the factorsand circumstances that are present intransportation crashes and incidents, andmake recommendations for improved data.A major aim was identification of those dataelements needed for application of acommon conceptual framework of eventfactors across a wide variety of events andmodes.
GENERAL APPROACH
• Identify a conceptual framework ofcrash/incident factors for use acrosstransportation modes.
• Identify types of information collectedon crash/incident factors for the variousmodes.
• Identify methods forcategorization/coding of crash/incidentfactors by mode.
• Determine how crash/incident factorinformation is collected by mode.
• Identify limitations of currentcrash/incident factor categorizations bymode.
• Make recommendations forimprovement.
Scope
This project identifies typical crash andincident factors for various modes usedduring investigations. Included are alltransportation crashes or mishaps, definedas:• any incident involving the movement or
operation of a vehicle, vessel, aircraft,pipeline, or other conveyance in thecourse of conveying persons or goodsfrom one place to another;
• occurring within U.S. jurisdiction orinvolves a U.S. commercial carrier;
• intentional or unintentional; and• resulting in substantial property damage
or injury (requiring medical attentionbeyond first aid) or death within 30 daysof passengers, crew, pedestrians, otherworkers, or bystanders.

2
Data Sources
The data reviewed for this project werecollected by U.S. Department ofTransportation (DOT) agencies, otherfederal agencies, and nonfederal agenciessuch as state medical examiner offices.
CONCEPTUAL FRAMEWORK
We identified the Haddon Matrix as theideal framework, because of its combinationof simplicity and comprehensiveness. The12-cell Haddon Matrix is the conceptualframework or model most widely used in theinjury prevention field and is commonlyused to analyze risk factors or preventionmeasures for mishaps and injuries. Thematrix divides the injury event into threephases: “pre-event” (contributing to thelikelihood that a crash or other potentiallyinjurious or damaging event will occur);“event” (influencing the likelihood andseverity of injury when a crash, fall, etc.,occurs); and “post-event” (influencing thelikelihood of survival or complete recovery).
Each of the three phases is further dividedinto four groups of risk factors: those relatedto 1) the operator or the person who may beinjured, 2) the vector or vehicle thattransmits the energy, 3) the physicalenvironment, and 4) thesocial/cultural/organizational environment.
Advantages of the Haddon Matrix are that itis relevant to all transportation modes, iswell known and widely applied in the injuryfield, and can be expanded to accommodatevarious taxonomies. It can be used toorganize risk factors, exposure,circumstances of injury, and preventivemeasures.
Other analytical or conceptual frameworkssuch as SHEL and Event Tree Analysis wereconsidered but are generally lesscomprehensive than the Haddon Matrix,although they may provide more details onone or more cells in the Haddon Matrix.
CRASH/INCIDENT DATAELEMENTS
The primary databases for each mode shouldcontain information on factors thatcontribute to the likelihood of a mishap orthe occurrence and severity of injury and arestructured in a multistage matrix coveringpre-event, event, and post-event factors forthe following: human factors, vehiclefactors, physical environment factors, andsocial/organizational factors.
MAJOR GAPS ANDLIMITATIONS IN DATA
• The quality of data is often less thanoptimal.
• Some important data elements are rarelycollected, such as data on the injurymechanism, whether the person was atwork, operator fatigue, and distractions;alcohol data are not routinely collectedfor all appropriate people.
• Lack of information on injury type andseverity (except in NHTSA'sNASS/CDS), for example, on survivingairplane passengers.
• Lack of information on uninjuredpassengers in some state police reports.
• Lack of narrative description, or lack ofuse of the information in narratives.
• Lack of detail on human factors.• Lack of feedback to investigators.• Absence of guidelines for law
enforcement officers and others onwhom we rely to provide data ontransportation incidents.

3
• Some transportation events such as thoseinvolving off-road vehicles, suicide,terrorism and injuries that occur in theabsence of a collision are typically notrecorded by police or by a DOT agency.
• Linkage of crash investigation reportswith death certificate and autopsy data istypically absent.
RECOMMENDATIONS
Data Quality, Adequacy, andCompleteness
Changes should be implemented in alltransportation systems to ensure that crucialdata elements, as outlined in the full report,are included. In addition, the Bureau ofTransportation Statistics should workclosely with those states having goodmedical examiner systems to establishprocedures for testing and for electronicreporting of all transportation deaths,including pedestrians and passengers.
Improved Methodology
The following recommendations mayprovide more and perhaps better data.Greater use can be made of sampling toobtain more detailed information on eventsof interest. Supplemental studies can beused in connection with sampling. Forexample, at various times data could becollected on all events involving certaintypes of vehicles or specific circumstances.Confidential reporting systems, similar toASRS (NASA's Aviation Safety ReportingSystem) for aviation incidents, could bedeveloped and used by other modes. Specialstudies using other national databases suchas CPSC's National Electronic InjurySurveillance System (NEISS) could be usedto address those transportation-relatedinjuries for which data are not routinely
collected by DOT agencies. Finally, high-quality data from states or counties shouldbe combined to provide more completenational estimates.
Improvements in Data to be Collected orReported
Details about crash severity and mechanismsof injury are needed, especially for generalaviation crashes. Systematic samples ofcrashes, as is currently done for automotiveinjuries through NASS/CDS, would be agood place to start.
Photographic evidence should be added tofiles in a format available to and usable byresearchers.
All forms for reporting injuries and eventsshould include narrative text on incidentcircumstances, which would need to beentered and analyzed.
The National Household Travel Survey(NHTS) should include information (e.g.,age, gender) on nonfamily passengers.
Greater use should be made of GIS(geographic information systems) to identifyexactly where crashes occur and to relatelocation to highway, seaway, rail, or otherfeatures.
To the extent feasible and productive, dataelements should be made comparable acrossmodes and among agencies.
Available data from non-DOT sourcesshould be incorporated into DOT datarecords (e.g., race and occupation areavailable on the death certificate and shouldbe added to DOT data on fatally injuredoperators or other persons).
4
For a sample of fatal crashes, it would bevaluable to have linked crash investigationreports and autopsy data.
Greater Use of Technology to ImproveData
A variety of technologies could advancedata-collection efforts:
• Incorporation of Event Data Recorder(EDR) data into police reports andFARS and NASS data, in a manner easyfor researchers to use, should be anobjective.
• Installation of Automatic CrashNotification (ACN) in all road vehiclesshould be encouraged and the dataincluded in reports of investigators.
• Drop-down menus for data entry bycrash investigators have promise; forexample, crash investigators could usehand-held devices for enteringinformation as they investigate a crash.
• As other technologies to obtain data(e.g., cameras, GPS/GIS, alertingdevices) become available andreasonable in cost, they should be usedand the data from them incorporated intoincident/crash reports.
• Evaluations are needed to determinewhether currently available automaticwarning systems are working asintended. An example of this technologyis radar, employed in trucks, that emitswarning sounds if the vehicle is tooclose to an object.
Other Recommendations
In order to identify new problems in a timelyfashion, data should be made available atleast on a quarterly basis.
Easier access to data from the NationalDriver Registry, currently not available toresearchers, would be desirable.
Greater use should be made of somedatabases such as ASRS.
Increased frequency of surveys that collectdata that may change substantially each yearwould be helpful, e.g., Nationwide PersonalTransportation Survey and VehicleInventory and Use Survey.
BTS should routinely obtain DOT-relevantdata that are not contained in DOT databases(e.g., bicyclist injury data should beobtained from CPSC, since most do notinvolve motor vehicles and/or public roadsand therefore are not included in policereports).
Creation of an office within BTS/DOT toassist external researchers with projects thatrequire use of various DOT-sponsored datasystems is especially important for projectsrequiring linked information from differentdata systems about individual cases.
Provision of data on the Internet would behelpful, such as data from FARS, GES,NTSB, NPTS; results of periodic DOTsurveys such as the National Survey ofDrinking and Driving Attitudes andBehavior; and where to find relevant data,both DOT and non-DOT.
DETAILED RESEARCHPROTOCOLS
Full proposals were developed for thefollowing research suggestions, consideredby Project 5 members to be the mostimportant:

5
• Sampling System for Collecting DetailedData on Aviation Crashes;
• Use of Narrative Text Mining toSupplant/Validate Fixed FieldResponses of Naïve Coders;
• Human Factors Taxonomy, Event DataRecorders, and Transportation Safety;and
• Using Indexing Systems to IdentifyPrecursors of Vehicle Crashes, Injuries,and Deaths (this proposal is especiallyrelevant to Project 6).
CONCLUSIONS
The Department of Transportation's mandateincludes the safety of the traveling public.Underlying the identification oftransportation risks and potential remedies isthe need for adequate data.
DOT's Bureau of Transportation Statisticshas an opportunity to improve safetythrough enhancements to the data collected
by the various federal agencies. This reporthighlights many of the gaps and limitationsin transportation data and recommendsspecific improvements.
Some data gaps and differences amongvarious federal agencies reflect restrictionson legislative authority stipulated in theCode of Federal Regulations.Consequently, legislation must be passed toeliminate these gaps, a process that must bechampioned by each agency. Members ofthe Safety Data Action Plan were instructedto disregard the existence of legislativebarriers when considering data problems andneeded improvements.
Regardless of possible barriers toimplementation of some aspects of therecommendations, we believe that majorsteps can and should be made to improvetransportation data. Existing databases ofthe various modal agencies reflect interest inand commitment to useful data collection.We are therefore optimistic that this reportwill bear fruit.

1
PROJECT OVERVIEW
Developing Better Data on AccidentPrecursors or Leading Indicators
INTRODUCTION
The Bureau of Transportation Statistics(BTS) has developed a Safety Data ActionPlan that sets forth a number of projectsintended to improve the quality, reliability,timeliness, completeness, and utility of safetydata across all transportation modes. Project6 focuses on the identifying relationshipsbetween precursors and safety outcomes. Inparticular, the goal of the project is todevelop research studies that mightsignificantly improve our ability to predictsafety problems, and to identify dataelements essential to predicting transportationinjuries and fatalities.
A series of meetings between representativesof the various transportation modes were heldin the summer and fall of 2001 and resultedin the development of 17 research topics.After discussions of the relative benefits andcosts of each proposal, lists of both short-term and long-term projects were selected forfurther consideration.
During the fall of 2001, suggestionsidentified as high priority were developedinto formal research proposals. Several well-qualified statisticians were brought in todevelop the research protocols, andknowledge-base representatives from theappropriate modes helped establish specificdata collection mechanisms and researchimplementation plans.
Background
During the development of the Safety DataAction Plan, it was recognized that in orderto justify significant efforts to gather better ornew data on accident precursors, there was aneed to prove the value of collecting the data.Even if there were significant efforts togather more complete, accurate data in anarea covered by existing data collectionprocesses, the additional cost of thisexpanded effort would require justification.One possible justification for these additionaldata collection costs would be compellingevidence of the ability to predict accidentsbased on information provided by theseadditional data.
The main objective in Project 6 is to identifyaccident precursors or leading indicators forfurther research on hypothesis testing andestablishing relationships between risk andpredictors. The results of this research canalso be used to target or redirect programs forgreater effectiveness (i.e., fewer fatalities andinjuries).
The working team for this project wascomposed of staff from the National SafetyCouncil (NSC), Traffic Safety AnalysisSystems & Services, Inc. (TSASS), andrepresentatives from each of the modes, whocould provide technical input and content-based expertise.
METHOD

2
Efforts within Project 6 were organized alonga series of subprojects and phases. The firstof these was a literature review performed bythe Volpe National Transportation SystemsCenter and NSC staff. Other major phasesincluded candidate research projectidentification, project prioritization, researchprotocol development, and reportpreparation.
Volpe Literature Search/Review
The Volpe staff reviewed a number ofinformation sources to compile an Accessdatabase of precursor-accident relationshipsthat have been identified or studied. NSCstaff then reviewed the documents andidentified several potential research projectsfor further study.
Solicitation of Precursor Ideas
Subsequently, BTS and NSC hosted a seriesof meetings with team members to solicitsuggestions for research into accidentprecursors. These meetings were attended bystaff from each DOT mode and resulted inroughly 20 suggestions for research. Areview of the projects revealed severalcommon themes among members of theworking team from which combined projectdescriptions were drawn.
Once a set of candidate projects wasformulated, the team was then called on toestablish criteria for prioritizing the researchsuggestions. Eight criteria were adopted. Theproposed projects were ranked by all teammembers based on the criteria listed below.The numbers in parentheses represent thepooled weight out of 100 percent, based onteam member balloting:• Increased understanding (20%)
Does this add to our knowledge? Hasit been done before?
• Cost-effectiveness (15%)
Is this worth more than the cost ofresearch or implementation?Consideration of length of researcheffort.
• Feasibility of implementation (14%)If it proves a strong relationship, willwe implement the results in terms ofchanges to our data collection?
• Likely impact (16%)Will this make a difference withrespect to safety and /or policy?
• Anticipated cost of research (8%)Is this likely to be expensive orinexpensive to research?
• Adaptability to other/multiple modes(11%)Do you think multiple modes coulduse the results of this research?
• Cross-function (7%)Would the results be used by multiplefunctions (operations, planning,enforcement)?
• External consumer (9%)What will be the reaction by outsidestakeholders (industry, states, etc.)?
Review and Refinement
During the period when the proposed projectswere ranked by the working team, additionalinformation on data availability wascollected. In particular, the project sponsorswere asked to provide information on thelikely source of data to be used in theproposed research. If that source existed,they were asked to provide information aboutthe accessibility, completeness, and reliabilityof the data. If there was no current source forthe data, they were asked to suggest how thedata might be collected, and to provide someinsight about the potential difficulties inobtaining data. The description of eachproject was then updated and expanded to theextent possible.

3
RESULTS
Proposed Research Projects that evaluate therelationship between a specific precursor anda safety outcome fall within the followingfour categories.
Evaluation of a Type of Data or Method ofCollection
Several of the proposed projects weredirected toward evaluating the general type ofdata or a method of gathering data to predictaccidents.
“Text Mining to Establish Sequence ofEvents” addressed the general sense that thesequence of events might be an excellentpredictor of accidents, but recognized thatthis information is seldom coded withinsafety datasets. However, many safety datafiles contain narrative information that mightindicate the sequence of events, if properlyprocessed. Text mining is an analytical toolthat draws on the ability of computerprograms to look for patterns within largevolumes of text information. This project, ifpursued, would look at narrative informationin the accident files of several modes toestablish if, indeed, text mining technologycan generate a set of discrete events, andsequence those events as well as a humanmight. Examples of the types of data filesthat would be utilized included: narratives oftraffic crashes from police agencies that uselaptops (text files) to record traffic accidentdata as well as similar data from the aviationand maritime modes.
Another project, entitled “A Human FactorsAnalysis of Precursors Associated withIncidents/Accidents,” attempts to apply theJANUS approach to classifying precursors tomaritime accident information. Byincorporating aspects of Reason's "SwissCheese" model of human error, the Human
Factors Analysis and Classification System(HFACS) developed by Shappell andWiegmann, and the HERA model used byEUROCONTROL, a common taxonomy canbe developed for the examination of incidentswithin multiple domains.
The third project, entitled “Value ofVolunteered Safety Information asPrecursors,” draws on experience in theaviation industry. It calls for a detailedreview and analysis of information obtainedfrom existing voluntary reporting systemswhere hazardous situations are reported to anauthority by vehicle operators or the public.The goal of this project is to establish thereliability and utility of data obtained throughthese systems in identifying potentialaccident precursors.
Other projects within this topic area include:• retrospective interview and survey
information about operatordistractions, misunderstandings, etc.,that might have increased thelikelihood of operator error, resultingin an accident, or near-accident;
• an assessment of the data needs forGIS systems that support safetyanalysis;
• documentation of safety successes aswell as failures (i.e., where a safetydesign succeeded in mitigating theseverity of an incident); and
• various forms of data modeling toestablish potential for accidents.
Safety Culture Analysis
Establishing a methodology for documentingand assessing the “Safety Culture” ofoperators and companies was recommendedby several modes. These projects focused onattributes of the operator (both the driver andthe company), which might allow thecharacterization of accident risk. An

4
example was given of a small charter flightoperation, trucking company, or fishingoperation that was owner-operated and thepossibility that the combined workload ofbeing both the driver and manager of a smallcompany might increase the likelihood ofaccidents.
The project with the highest rating in thisgroup was proposed by the Federal AviationAdministration, entitled: “OrganizationalSafety Culture and Other Indicators ofAccident Risk.” Other projects with similarfocus, but slightly different approaches,include the NIOSH proposal “Using anIndexing System to Identify Precursors forVehicle Crashes, Injuries and Deaths” andthe Maritime Administration proposal “StudyFeasibility of Possible Profiling Systems.”These projects attempt to establish measuresor classification criteria that allow evaluationof a commercial operator for potentialaccident involvement. All of these projectsreceived strong support across modes, andthey appeared to have good potential fortechnology transfer from one mode toanother.
Specific Precursor-Outcome Relationships
The project with the highest rating in thiscategory focused on workload as a specificprecursor to accidents. Other projects withinthis group addressed the followingprecursors:1. experience and training as predictor of
hazardous materials incidents,2. noise levels and distraction,3. social needs and nocturnal work activity,4. tracking undeclared hazardous materials
shipments,5. traffic intensity at the sector level, and6. driving records as a predictor of crash
involvement.
The first three are specific risk factors thatmight be considered under “Safety Culture”efforts. Projects 4 and 5 were specific to aparticular USDOT mode. The last projectinvestigates the potential link betweensudden changes in driving patterns andincreased likelihood for causing accidents.
Technology Transfer
The project entitled “Use of Flight DataRecorder Information to Predict Accidents”was developed on the concept that data fromvehicle data recorders can be used toestablish patterns of operation, such asevasive or abrupt maneuvers that would bepotential predictors of accidents. Thegrowing use of computer technology forvehicle control and monitoring in all modescan make such analysis possible. Modes thatcan most benefit from this study includeAviation, Maritime, and Highway.
GENERAL CONCLUSIONS ANDNEXT STEPS
The proposed research efforts covered a widerange of specific accident types andtransportation environments. Results of suchresearch efforts have the potential to makesignificant contributions to the field oftransportation safety. Several of theproposed projects can be done utilizingexisting data sources in a relatively short timeframe, while others can be started withminimal new data collection efforts.However, most of the proposed projects willlikely entail a two-year time commitment.

1
PROJECT OVERVIEW
Expand the Collection of “Near-Miss” Datato All Modes
INTRODUCTION
Background
Virtually all transportation incidents arepreceded by a chain of events orcircumstances – any one of which mighthave prevented the incident if it had goneanother way. In a large number of cases,operators are aware of these “close calls” or“near-misses” and may have informationthat could prevent future mishaps.However, most of our modal programs arefocused on collecting data only on eventsthat meet the threshold of a reportableaccident. Thus, the large majority of caseswhere we could capture useful data onaccident precursors or on effectiveprevention strategies remain unexposed.
Collecting and analyzing reports of near-misses provide a route of access to thecauses of hazards that have the potential ofleading to crashes. Lessons learned fromnear-misses can be used in designingcountermeasures that not only reduce thenumber of transportation-related safetyincidents, but, in some cases, even preventcatastrophic events of certain types fromever occurring. Thus, high-quality data onnear-misses is needed to strengthenpreventive efforts and reduce the burden oftransportation-related incidents onindividuals and society.
The Department of Transportation (DOT)has been working toward the elimination oftransportation-related fatalities and injuries
in the United States. Toward this end, DOThas made a commitment to improve safetydata collection and reporting across alltransportation modes. As a result, a series ofworkshops held in 1999 and a Safety DataConference in April 2000 brought togetherexperts from different transportation modeswho developed the Safety Data Action Plan(SDAP). The SDAP is comprised of 10research projects intended to improve thequality and timeliness of existingtransportation safety data, collect better dataon accident circumstances, precursors, andleading indicators, and expand the use oftechnology in data collection.
This project attempts to: a) describe systemsnow employed in the collection of data onnear-misses in various modes, b) specifyrequirements for collection and analysis ofvoluntary data that will be useful inprevention efforts, and c) propose studiesaimed at expanding the collection of near-miss data across all transportation modes.
Purpose
The immediate purpose of the presentproject is to study near-miss events capableof leading to accidents within all modes oftransportation. It involves the study ofexisting systems for identifying andreporting near-misses, identifying potentialbenefits and problems, exploring thetransferability of reporting from aviation andmaritime modes to other modes, andproposing a coordinated effort across DOTfor implementing such systems.

2
A near-miss situation is one that could haveresulted in accidental harm or damage butfailed to in the absence of any specificmeasure designed to prevent it. The originaltitle of the project refers to the term near-miss. However, the term “near” implies aspatial or temporal proximity that does notapply to the many situations that arise andare corrected well before and at a greatdistance from an actual accident. Somereported situations center on specific events,while others involve generally prevailingconditions. In this context, the term “unsafesituations” appears to be more descriptiveand, therefore, is used in this researchproject.
The ultimate purpose of this activity is toprovide statistical data that will lead to theprevention of accidents. To accomplish this,the data gathered must identify causes ofunsafe situations in terms that can be appliedto their reduction, and ultimately result inreducing the incidence and severity oftransportation accidents.
A resolution adapted by the DOT SafetyCouncil in January 2000 supported thedevelopment of precursor data for industrialand transportation-related safety incidencesand, specifically, pointed in the direction ofcapturing information on factors associatedwith unsafe situations.
Objectives
The goals of this project are to studyexisting systems for recording and reportingunsafe situations, produce operationaldefinitions and criteria for such situations ineach transportation mode, identify potentialbenefits and problems with data collection,improve cross-modal utility of the data, andexplore the transferability of unsafe situationreporting from aviation to other modes.
The Heinrich Pyramid depicts therelationship of accidents to two forms ofunsafe situations. One consists of recordedincidents that produced consequences thatcould have resulted in injury, or damagemeeting accident report thresholds, butfailed to do so. The second level representsunrecorded occurrences of events orconditions that raised the danger of anaccident or incident, but due to fortunatecircumstances, failed to do so. Both of theserepresent sources of information that couldbe applied to the prevention of accidents ifthey were reported, analyzed, anddisseminated.
When it comes to causative factors, unsafesituations represent less a separate subset ofprecursors to accidents than simply the sameprecursors with different outcomes. Theconditions that lead to an unsafe situation onone occasion can result in a real accident onanother. If that were not the case, therewould be little point in studying nearaccidents. What the additional study ofunsafe situations brings is:1. a greater number of episodes from which
accident contributors can be gained, and2. the opportunity in some instances to
identify preventive measures from thosesteps that actually succeeded in avoidingan accident.
Methodology
The project objectives were met in thefollowing four phases.
Development of Unsafe Situation DataSystems Matrix

3
The first step in meeting objectives of theproject was to examine the systems engagedin data collection on unsafe situations and toidentify the properties of each. Theseincluded the manner in which reports arecollected, the information furnished,protections to reporters, access to data,including web access, analyses performed,and reports furnished. This work has beenaccomplished by soliciting input frompersonnel involved with these systems andtechnical experts from transportation modes,as well as through extensive literaturereview.
Human Factors TaxonomyThe second part of the project involvesdevelopment of a human factors taxonomy –a classification structure developed as a keypiece to the utility of the unsafe situationdata systems across transportation modes.While the project is concerned exclusivelywith analysis of unsafe situations, anyhuman factors taxonomy would applyequally well to the accidents, whoseprevention is the ultimate goal of suchanalysis.
Individual reports of unsafe situations havebeen useful in identifying causes that aresufficiently serious as to serve as a basis ofcorrective action. The bulk of reporting,however, involves situations that may not beserious enough to prompt action bythemselves but occur often enough to meritattention. A formal mechanism foridentifying frequent situations would requiresome means of aggregating those withsimilar causes to permit the compilation ofstatistics. The need for such taxonomies isgreatest for the most frequent and mostdiverse of causes, those involving humanfactors.
Guidelines for Voluntary Reporting ofUnsafe Situations
The third step in the project was to developguidelines for systems focused on bothcollecting and analyzing unsafe situationdata. Two such systems were:1. developing taxonomies for classifying
and coding causes of unsafe situations,and
2. devising systems of voluntary reportingacross modes.
Research efforts concentrated on voluntaryreporting mechanisms, incentives, andbarriers for voluntary reporting, datarecording methods and databases, the typesof data available from unsafe situations, thescope and quality of the data, means used toinfer causes from information furnished, andthe statistical methods used to estimate theprevalence of various causative factors.
Automated Methods of Data CollectionOne additional source of information onunsafe situations involves automatedmethods of data collection. A segment ofthe project was devoted to this topic andincluded a discussion of technologicalmethods currently in use and new ideas forautomatic reporting.
Information Sources
Materials presented in this project wereobtained from the following agencies andsources of information.
Department of Transportation• Bureau of Transportation Statistics
(BTS)• Federal Aviation Administration
(FAA)• Federal Highway Administration
(FHWA)• Federal Motor Carrier Safety
Administration (FMCSA)• Federal Railroad Administration
(FRA)• Federal Transit Authority (FTA)

4
• Maritime Administration (MARAD)• National Highway Traffic Safety
Administration (NHTSA)• Research and Special Programs
Administration (RSPA)• United States Coast Guard (USCG)
Other Organizations• Aviation Safety Reporting System
(ASRS)• Confidential Human Factors Incident
Reporting Programme (CHIRP)• National Institute for Occupational
Safety and Health (NIOSH)
Safety Data Task ForceA Safety Data Task Force withrepresentatives from each transportationmode, safety policy and analysis offices, andBTS staff provided feedback on the project’sscope, objectives, and progress.
Volpe Group Background ReportThe Volpe National Transportation SystemsCenter prepared a background reportdescribing existing and planned voluntarysafety reporting systems. The Volpe Reportoutlined the DOT confidentiality regulationsand explored opportunities for extendingBTS’s legislative data protections to otherdata systems.
PROCESS
Modal Matrix
A search for systems that collect informationon unsafe conditions revealed several eitherin operation or on the drawing board. Thesearch encompassed unsafe situations thatcaused incidents resulting in damage belowthe threshold for reporting, as well asaccidents themselves, in order to take
advantage of characteristics that applyacross all levels of hazard. For each system,these included its history, the informationbeing collected, its sources, the analysesbeing performed, information beingfurnished, and the means of access.Information presented in a matrix format isthe most effective way to considerindividual components in a systematicmanner. Furthermore, it helped theinvestigators to benchmark the aviationindustry practices, discover previouslyunidentified problems with unsafe situationdata reporting, acquisition, management,and analysis, and recommend solutions fortransferring the aviation experiences to othertransportation modes.
Several systems have been developed andimplemented in aviation in the United Statesand abroad. The Aviation Safety ReportingSystem (ASRS) is a nationwide system thatcollects, analyzes, and responds tovoluntarily submitted reports of unsafeaviation situations in order to lessen thelikelihood of aviation accidents. The ASRSand its structure served as a prototype forother reporting systems in aviation as wellas systems within other modes listed here.
Aviation• Near Midair Collisions System
(NMACS) – United States• FAA Accident/Incident Data System
(AIDS) – United States• National Transportation Safety
Board (NTSB) AviationAccident/Incident Database – UnitedStates
• Confidential Human Factors IncidentReporting Programme (CHIRP) –United Kingdom
• International Civil AviationOrganization (ICAO)
• The Global Analysis and InformationNetwork (GAIN) (proposed)

5
Maritime• The Nautical Institute International
Marine Accident Reporting Scheme(MARS)
• Safety Incident ManagementInformation System (SIMIS) –United States
• The International MaritimeInformation Safety System (IMISS)(proposed)
Motor Carrier• Hazardous Materials Incident Report
System – United States
Rail• Signals Passed at Danger (SPAD)
system – United Kingdom
Intermodal• Securitas – Canada
A great volume of data has been and will becollected on unsafe situations intransportation. Most of the systems forcollecting information on unsafe situationscome from aviation, primarily commercialair carriers. While similar concerns havestimulated efforts to extend the approach tothe maritime industry, progress has been lessevident. Thus far, little effort appears tohave been devoted to the effort by the railindustry. Within modes where accidents aresufficiently plentiful to provide insight intocauses, there is still room for examiningcategories of operation characterized byrelatively few but very serious accidents.
Human Factors Taxonomy
In order to aggregate data and compilestatistics on the causes of unsafe situations,some means of classifying them intocategories is needed. This is particularlychallenging for causes arising from the
human component. The more tangibleaspects of causes, relating to equipment,weather, and surfaces such as highways,runways, and rails, tend to fall intonumerous but readily identifiable categories.However, the characteristics of people thatlead to unsafe situations cover a widerrange, particularly their errors, which areunique to each situation.
Taxonomies of human causes have beenstructured at two levels. One involves thespecific errors that lead to individualsituations, where “error” refers not only tomistakes that make the person responsiblefor the situation but also the absence ofactions that could have prevented them. Thesecond level involves predisposing factorsthat lead to errors, including thepsychological and physical characteristics ofpeople, the hardware and software withwhich they interact, and the surroundingphysical, social, and organizationalenvironments in which activity takes place.Where equipment fails, the first step is tofind out specifically what broke and thencorrect the design, manufacturing, ormaintenance flaws that allow the failure tooccur. Similarly, efforts to overcome thecauses that lie in human factors must start byidentifying the specific errors and thencorrect the predisposing conditions that leadto them.
Voluntary Reporting of Unsafe Situations
The process of developing cross-modalguiding principles for voluntary reporting ofunsafe situations was based primarily on theexperiences of the ASRS demonstrating thatanalysis of such events is key toimprovement in transportation safety. Inorder to capitalize on the success of theASRS and other programs, any systemgeared toward voluntary reporting should bebased on the following premises:

6
• voluntary participation• reporter confidentiality• guaranteed immunity• system operated by a nonregulatory
third-party agency• buy-in and support from the
community• ease of data submission• follow-up opportunity for further
investigation, and• feedback—evidence of data output,
implementation, andcountermeasures.
Because each transportation mode has itsunique characteristics and environment, theapplicability of these factors may vary.However, there are common themes. Theseguiding principles lay down the rules forfuture investigations that will put them intopractice. A proposal for a pilot studyaddresses the transferability and futureimplementation.
Automated Collection of Unsafe SituationData
The reporting of accidents, incidents, andoccurrences by participants and witnesseshas provided information capable of guidingpreventive efforts in all transportationmodes, at least to some degree. However, ittakes time, and is dependent on both theability and willingness of informants toreport events accurately. Advances intechnology offer the opportunity to recordevents automatically in a way that will allowthe nature and origins to be ascertained andverified objectively.
RECOMMENDATIONS
On the basis of project findings, thefollowing proposals for collection andanalysis of unsafe situation data weredeveloped.
Outcome Classification and Coding
Development of taxonomies for collectingand coding of unsafe situations at the levelsof human error and the predisposing factorsthat produce them is of high and urgentpriority. The factors that predispose errorstend to fall into the same general categoriesacross modes and have been the subject ofsuitable taxonomies, most notably the SHELmatrix. However, the behaviors required byvarious forms of transportation and,therefore, the errors that arise, vary acrossmodes as well as across operations withinmode. While some taxonomies of humanerror have been developed and applied toprevention, they do not involve the modesgiven primary attention for analysis ofunsafe situations.
Voluntary Self-Reporting
A high-priority study, specifically called forin this project, is extension of voluntary self-reporting from aviation to othertransportation modes. Where accidentsoccur, they are typically the subject ofmandatory reports by investigating officersand those involved. However, where eventsonly raise the possibility of accidents, theonly sources of information are the partiesinvolved in them, and requiring reportsbecomes problematic. The alternative isvoluntary reporting, which has beensuccessfully employed in aviation for thepast 25 years. A proposed study wouldexamine the requirements for extendingvoluntary self-reporting to other modes, toinclude sources of, and ways of overcoming,possible resistance.
Marine Traffic Study
The technology employed in studying flightpatterns could be extended to marine traffic

7
through an additional project. To permittracking ship movements in areas not readilyregistered by ground-based radar, otherforms of measurement (e.g., use of satellitesand Global Positioning System (GPS))would be studied.
Large Truck Headway Analysis
One specific extension of technology toanother mode will be collection of truckheadway data to compile statistics capableof revealing the conditions associated withunsafe following distances. The study couldemploy rearward distance measurementdevices (e.g., laser) to detect short headwaysof trucks encountered in the traffic stream aswell as location-determining devices such asGPS to allow headways to be associatedwith various roadway characteristics.
CONCLUSION
The collection, analysis, and reporting ofdata describing unsafe situations that do notresult in reportable accidents can bebeneficial in preventing damage, injury, anddeath within all modes of transportation.Such data are of particular value in modescharacterized by relatively few but highlyserious accidents.
While the nature of unsafe acts tends to bemode-specific, the basic methods of datacollection and analysis, developed largely inaviation, can be extended across modes.Within the United States, voluntary reportshave been the prevalent source ofinformation concerning unsafe acts.
Both voluntary reports and automatedsystems of data collection can be successfulin securing information on the nature andcauses of unsafe situations in transportation.In both cases, the confidentiality and privacy
of information sources have to be effectivelyprotected.
Thus far, attempts to correct conditionsleading to unsafe situations have been basedprimarily on individual reports. Gaininggreater benefit from reporting systemsrequires developing means of classifyingcauses in a manner that allows dataaggregation and identification of the mostprevalent causes.
The greatest challenge to classification andaggregation of causes involves human error,which may be defined as lack of any actionthat could have prevented a situation fromarising, and could be reasonably expected (itdoes not involve culpability or blame). Thedistinctive elements of individual errorscomplicate grouping into categories.
Although error taxonomies in sometransportation modes have been successfulin identifying and initiating steps to preventthe most frequent needs, they are basedprimarily on accidents, and are as yetlacking in those currently subject to self-reporting systems. The need for taxonomiesis recognized, and efforts to develop themare currently under way.
Based on identified errors, a wide range ofremedial processes can be employed toaddress predisposing conditions involvingunderlying physical and psychological,hardware, environmental, social, andorganizational factors. These factors arelargely the same across modes, and availabletaxonomies of predisposing conditions canbe applied to their classification.
An assumption underlying the search forcauses of unsafe situations is that they arealso the causes of accidents, and processesdesigned to prevent them would also preventaccidents. Therefore, taxonomies of human

8
error and their predisposing conditionswould apply equally to the analysis ofaccident data.
1
PROJECT OVERVIEW
Exploring Options for Using Technology inData Collection
INTRODUCTION
The U.S. Department of Transportation(DOT) maintains over 40 programs thatcapture either safety data or crucial relatedinformation (e.g., measures of exposure). Arecent data quality review requested byCongress suggests that improvements can bemade that will better serve the DOT mission.
The objective of this project is to exploreoptions for using technology to facilitatemore timely data collection, improve dataquality, and assure the relevance oftransportation safety data. This overviewbriefly describes the project’s background,methods, results, and recommendations.The project’s final product is a prioritizedset of work plans identifying promisingtechnologies for field-testing.
Background
DOT’s safety mission extends to all modesof transportation: air, highway, commercialtrucks and buses, rail, pipeline, andwaterway. In each of these modes, data-collection technologies have enhanced the
ability of each agency to collect key safetydata in a timely and accurate fashion. Thisproject identifies new applications ofexisting or emerging technologies for furthertesting across the modes.
Each of the modes within DOT is engagedin technology projects, many of which relatedirectly to data collection and the safetymission of their administration. There aresome commonalities in the types oftechnology being used, most notably in thearea of event data recorders in vehicles andthe use of global positioning systems (GPS)and geographic information systems (GIS)for obtaining and analyzing locationinformation.
As a starting point, the Volpe NationalTransportation Systems Center compiled alisting of some existing data-collectionprojects within DOT that utilize technologyat some level. There are a large number ofongoing technology projects within DOT.Some of these technologies are already inuse in more than one mode. The Project 9research team identified additional data-collection technologies.

2
Objectives
The objectives of this project were toidentify potential uses of technology to:• improve the timeliness of basic data
collection,• improve the accuracy of data
collected,• improve the usefulness of the data
collected,• improve the cost-effectiveness of the
data-collection system overall, and• establish or increase utilization of
technology across transportationmodes.
Scope
Project 9 was primarily centered on twoactivities: 1) identifying existingtechnologies already used in one mode thatcould have potential application to datacollection for other modes; and 2)identifying “new” technologies for safetydata collection. The sources of newtechnologies were defined as any non-DOTentity including other government agenciesand the private sector. DOT modal expertsalso identified candidate technologies thatmight have an innovative application fortheir mode. The experts wrote descriptionsof technologies and expanded the list toinclude additional projects that, in theirjudgment, could provide important safetydata either in their mode or in another DOTmode.
GENERAL APPROACH
This project solicited input from the variousmodes of transportation about uses oftechnology for Data-Collection Elements.Of particular interest were thosetechnologies that could be pilot tested orimplemented in one mode and then the
results transferred for use by one or moreother modes. This section of the reportoutlines how each of these tasks wasconducted.
Data Collection Issues and PotentialTechnologies
As part of the Bureau of TransportationStatistics (BTS) SDI work group sessions,modal representatives described data-collection issues faced by specific programareas within their administration. A subsetof these data-collection issues had clearsafety implications for the mode. As such,they were useful in the effort to identify apreliminary set of data-collection issues foreach of the modes.
The DOT modes, as well as state and localgovernment agencies, are engaged in a largenumber of data-collection technologyprojects. As detailed in the BackgroundSection of this overview, the Volpe Centerprovided descriptions of data-collectiontechnologies currently in use that cover abroad range of applications. Modal expertsin each of these applications were identifiedand contacted by BTS staff. The expertswere asked to describe the technology insufficient detail to enable project teammembers to decide whether it had potentialapplication to identified Data CollectionElements needs. Experts were also asked tocomment on the potential applicability ofselected technologies to other data-collection needs, both within and outsidetheir mode. This effort resulted in a list ofexisting technologies and additionalinformation on other areas where thosetechnologies might be applied for data-collection.

3
Technology Transfer Opportunities
Experts in each of the modes were asked toprovide contacts outside of DOT who areusing or developing technologies that mightbe applicable to Data-Collection Elementsinside DOT. These contacts were drawnfrom industry and other governmentagencies (federal, state, and localgovernment, as well as foreigngovernments’ transportation agencies).Further contacts were identified throughthese initial industry and other governmentagency contacts, web-based searches, andbusiness-to-business listings. Each of thecontacts was asked to provide descriptionsof technologies in sufficient detail that theproject team could decide whether thetechnology had potential application inaddressing Data Collection Elements needsin DOT.
Technology Prioritization
The tasks described above produced asubstantial list of new and existingtechnologies with cross-modal transferpotential. These technologies wereevaluated in order to develop a set ofproposed technology projects for WorkGroup B prioritization. In order to developthe technology projects for prioritization theproject team grouped the technologies intoeight general categories. Within each of thecategories, several example projects weredescribed. The following criteria were usedto evaluate each project:• Cost-effectiveness: A statement of
whether the project promises areasonable “return on investment” inthat the savings (cost reductions,lives or resources saved) aredemonstrably larger than the costs ofimplementing the project.
• Feasibility: A statement of thelikelihood that the technology can be
implemented as described and thelikelihood that, as implemented, thetechnology will meet the functionalspecifications.
• Likely impact: A statement of theconcrete changes that will occuronce the technology is implemented(improved data quality, timeliness,accessibility of the data).
• Anticipated cost: An estimate of thecost of implementation of thetechnology at the level or extentrequired to achieve the desiredoutcome.
• Maintainability: A statement of theprojected, annualized maintenancecosts for a “standard”implementation of the technology,and, where needed, a qualitativeassessment of the ability to maintainthe technology once installed.
• Potential for expansion and/or newapplications: A statement of theprobable further uses for thetechnology, should it provesuccessful in the evaluation project.Does the technology have thepotential to add new features and/ornew operating characteristics?
• Accessibility: A statement of thelevel of technical expertise requiredto operate and/or maintain thetechnology in a manner that willmaximize the benefits of theimplementation. High accessibilitymeans that a low level of skill ortraining would be required to keepthe technology functioning asdesired.
• Strategic importance: Reviewer’sjudgment of how well this projectfits with the agency’s strategic planand mission.
• Adaptability: Reviewer’s judgmentof how well this technology fits with
4
existing technology projects in theagency.
• Cross-functional application:Reviewer’s judgment of furtherapplications of this technologywithin their mode.
• Industry buy-in: Reviewer’sjudgment of how this technologyproject would be perceived by theaffected industries.
In order to prioritize the technologies, GroupB members were asked to read the generaldescription of each technology type, revieweach of the several example implementationdescriptions, and then simply rank order theeight technologies based on the needs oftheir own mode for safety data collection.The participants were encouraged to use theexample descriptions to help determine thevalue of the technology to their mode.
EVALUATION OF THE EIGHTMOST PROMISING DATACOLLECTION TECHNOLOGIES
The Work Group B members selected thefollowing eight technologies, in order ofpriority:• Electronic Identification/Security
(Smart Cards),• Operator Performance Monitoring,• Hands-Free Operation (wearable
computers for data collection),• Vehicle Usage Monitoring Systems,• Imaging (x-ray, mm-wave, and
satellite),• Voice-Activated Data Input,• Automated Control Device Data
Collection,• Pattern Recognition Software.
Each of these technologies is describedbriefly in the following eight sections.Some potential data collection elements that
may depend on a specific application and/orinterface with other technologies are alsolisted for each technology.
Electronic Identification/Security (SmartCards)
Smart cards are credit-card size devices withembedded memory circuits. The devicescan be written to or read using a simple,inexpensive computer interface. Smartcards are currently being tested for use ascredit/bank cards and potentially in somedriver licensing applications. The maritimeindustry uses these devices now for trackingtraining and qualifications.
Smart cards offer the potential for increasedsecurity by incorporating biometricinformation on the owner of the card thatcan be checked against the same measurestaken from the person attempting to use thecard. The most promising of these biometricdata sources include thumbprints and retinalprints. Implementation involvingthumbprints is the simpler and lessexpensive of the two options.
Some potential data-collection elements:• user identification;• date, time, start, end, and route of
travel;• speed, lane keeping, following
distance, and other performancemeasures;
• waiting times;• vehicle configuration;• way points;• time at controls; and• user qualifications and experience.
Operator Performance Monitoring
Checking employees’ readiness for servicecan be accomplished using technologiesthat: a) require a pre-test before operation

5
and/or b) provide ongoing monitoring orfeedback on performance during operation.Such systems are in place aboard some shipsand have been tested in commercial motorvehicles (e.g., lane departure warningdevices for detecting drowsy drivers). Theprimary goal of such systems is to providefeedback to the operator in order to improvesafety by alerting them to lapses inconcentration. The systems could also beused to collect data on the prevalence ofselected types of operator behaviors.
Some potential data-collection elements:• user readiness to perform;• user reaction time to hazard
warnings;• control movements in response to
specific events;• lane departures, speed, following
distances; and• accuracy of identification on
simulated objects throughout theworkday.
Hands-Free Operation
Many transportation activities occur awayfrom a desk or vehicle, for example,inspections, assessment, or enforcementduties. The usefulness of hand-heldcomputers is limited by their size and theneed for the operator to hold the device inone hand in order to use it with the otherhand. There are computing devicesintegrated into uniforms or outer safetygarments (e.g., safety vests) that maysupport these field data-collection activitiesin a much more natural way. The devicemay include a small ocular “screen” fordisplay of information visually, a voiceinput/output device, a small keyboardstrapped to one arm, and various accessoriessuch as GPS, bar code readers, smart cardreaders, magnetic stripe readers, andcommunications devices for sending and
receiving data via radio, cell phone, or othermethod.
Some potential data-collection elements:• standard law enforcement reports,
and• data entry for numerous safety data
elements.
Vehicle Usage Monitoring Systems
As an advancement over Event DataRecorders now found in commercial aircraft,trains, ships, and motor vehicles, usagemonitoring systems would serve to collectadditional data elements not currentlyavailable. For example, collecting data onthe user of the vehicle could ensure that onlyauthorized personnel can operate a vehicleor perform a particular task onboard thevehicle. Collecting information on the routetaken, speeds reached, and start/end pointsof trips would be useful in surfacetransportation modes. Links to otheronboard systems (e.g., hazard indicators andtelemetry systems) will allow the storage ofdata on operators’ response to incidents ornear-incidents.
Some potential data-collection elements:• user identification;• route taken, starting point, and
ending point; and• time and date of travel via computer-
based clock/calendar.
Imaging
Imaging capabilities have expanded and thecosts of the data have begun to drop inrecent years. Satellite imaging systemsalready in existence can identify movingobjects with a high degree of reliability andmillimeter wave imaging systems that candetect plastics underneath clothing. Thesesystems have obvious applications in

6
security in all modes and for use in systemperformance monitoring for traffic control.
Some potential data-collection elements:• traffic volume, vehicle classification;• speed, delay;• origin/destination and duration of
travel;• incident response;• platooning of traffic;• ramp metering and intersection
signal control optimization;• location, duration, and extent of
event;• time to first response;• progress of response;• concealed object identification; and• image database for developing
pattern recognition software.
Voice-Activated Data Input
Data collection, especially in adverseenvironments, has benefited recently fromadvances in real-time voice interfacetechnology. Essentially, this technologyallows a user to enter data or performfunctions on a computer by speaking into amicrophone. Computer software analyzesthe speech and interprets the resulting wordsas data, text, or commands. In the simplestapplications, a limited vocabulary is used inorder to increase the accuracy of translation.Broader applications (e.g., word processingor spreadsheet-type software) must allow foran unlimited vocabulary, and thus thecapacity for the translation software to“learn” both the speaker’s vocal mannerismsand new items in its dictionary of terms orcommands. In conjunction with event datarecorders and intelligent transportationsystem technology, voice data input hasnumerous applications from simplereplacement of keyboards for data entry inadverse environments to enhanced securityfor command and control situations.
Some potential data-collection elements:• user identification;• route taken, starting point, and
ending point;• time and date of travel;• control inputs;• comparison of control inputs to
actual operation;• presence of hazards; and• response to events.
Automated Control Device DataCollection
A variety of automated control devices arenow planned or in operation across the DOTmodes: a remote control system forcommercial aircraft is being tested,automated ships are already in use in themaritime industry, and motor vehicleautomated control systems are being testingby various manufacturers. The commondenominator for all of these systems are datarequirements for making the software-baseddecision of when to take control and foroperating safely in automated modes.
Some potential data-collection elements:• user identification;• speed changes;• travel position;• logged travel course;• type of aircraft, vehicle, ship;• behaviors leading up to event;• successful and unsuccessful
avoidance maneuvers; and• identification of specific hazards.
Pattern Recognition Software
Pattern recognition software is a class ofsoftware designed to identify target “items”from a stream of data in real time. Variantsof this type of software are programmed todeal with images (e.g., sorting applications,

7
facial recognition), auditory patterns (e.g.,speech recognition, looking for keyphrases), or even odors (e.g., moleculedetection systems). All of these systemsinvolve the programming of a particularpattern to be searched for from among anincoming stream of data. When the systemdetects that pattern (or one labeled “similarenough” through a set of “fuzzy”algorithms), the software can alert users tothe presence (or probable presence) of thetarget item, whether that item is a person, aweapon, or a spike in fluid flow readings.
Some potential data-collection elements:• object identification and profiling;• enhanced assistance to screening
personnel;• concentrations of specific
substances; and• flow rates, variations in
environmental factors.
RECOMMENDATIONS
The first three technologies listed in theprevious section (Electronic Identification/Security Smart Cards, Operator PerformanceMonitoring, and Hands-Free Operation)clearly had the most support from all themodes surveyed. This indicates broadpossibilities for application of thesetechnologies. It is recommended that atleast one, if not several, pilot projects bedeveloped in these three technology areas.The examples provided in the final reportshould provide a good starting point. Theremaining five technologies each havesupport from at least one mode, indicatingthat these might be worth a single project asa proof of concept and/or to develop the ideafurther for the other modes to review. It isrecommended that BTS and the mode(s) thatsupported these technology ideas worktogether to develop a single pilot project ofeach technology. Statements from the
Group B participants in support of or criticalof the application of each of thetechnologies are included in theRecommendations Section of the finalreport.

1
PROJECT OVERVIEW
Expand, Improve, and Coordinate Safety DataAnalysis
BACKGROUND
Research professionals, worldwide, analyzesafety data to assess the extent, investigatethe circumstances, and determine the causesof transportation-related deaths and injuries.The results of their analyses inform theselection, development, and implementationof safety policies and specificcountermeasures for hazards in all modes oftransportation.Although data analysis is essential for theformulation, implementation, and evaluationof transportation safety countermeasures andpolicies, improvements are needed:• Resources for safety analysis and
evaluation are presently insufficient,apparently because of a decline inrecognition of data analysis as a toolfor improving transportation safety.
• Data analysis methods andproficiency levels are diverse,without generally accepted standardsfor either the application of thesemethods or the evaluation of theiradequacy.
• Fora for intermodal interchange ofsafety research methods, analysistools, and information on bestpractices for improving safety dataanalysis do not presently exist.
These deficiencies currently constrain theprocesses of discovery and evaluationrequired to optimize the productivity oftransportation safety research. Theconstraint has an adverse impact on the
potential effectiveness of transportationsafety programs.
Goal
The goal of this project is to increase theextent to which analyses of transportationsafety data help to save lives and preventinjuries from hazards in all transportationmodes . Achieving this goal requiresimprovements in the development,application, and assessment of methods foranalyzing transportation safety data and forapplying the results of this analysis toenhance transportation safety policies andprograms.
Objectives
This project has two specific objectives inorder to accomplish the goal.
Report on Transportation Safety DataAnalysisThe team will produce a report that will:• Inventory data analysis tools and
analytic expertise currentlyemployed by organizations andindividuals conducting safetyresearch for each transportationmode.
• Assess the current status of:o Data analysis by public
organizations, privateorganizations, andindividuals that conduct

2
highway, aviation, rail,marine, and pipeline safetyresearch or formulate andenforce transportation safetypolicy.
o Tools used to identify andmeasure the consequences ofcauses and circumstances oftransportation-related deathsand injuries for each mode oftransportation.
o Best practices and lessonslearned within organizationsand by individualsconducting and applying theresults of safety research foreach of the transportationmodes.
o Resources needed to supportthe analysis of safety data toimprove the effectiveness oftransportation safetyprograms.
• Recommend standards, technologies,training, evaluation, and otherrequirements to improve safety dataanalysis capabilities for each mode.
• Recommend venues and protocolsfor interchanges of safety dataanalysis best practices and lessons-learned.
Intermodal interchanges of information ondata analysisThe team will formulate a strategy forprogram development and coordination offora, training, and other options forinformation exchanges on data analysisefforts, statistical and other analysis tools,best practices and lessons-learned, impacts,and resource requirements.
The Working Team
The initiative to improve and expand safetydata analysis will be accomplished by ateam BTS established through its SafetyData Initiative. Participants represent allDOT modes as well as principal public andprivate organizations involved insponsorship, conduct, or application oftransportation safety research.
Technical support is provided to the team byBTS and the U.S Department ofTransportation Volpe NationalTransportation Systems Center (VolpeCenter).
TASKS
To achieve its objectives, the team willaccomplish the following tasks:• identify leaders in transportation
safety research,• conduct a transportation safety data
analysis survey,• construct an inventory of analysis
methods,• develop a DOT safety data analysis
improvement plan,• formulate an outreach strategy, and• produce the Transportation Safety
Data Analysis Report.
Leaders in Transportation SafetyResearch
The team will identify leaders intransportation safety research worldwide andestablish mechanisms for their involvementin this project.
Transportation Safety Data AnalysisSurvey
The team will conduct a survey to acquireinformation on needs and requirements for

3
safety data analysis, analysis methods, andbest practices by organizations andindividuals involved in safety research in alltransportation modes.
With support from BTS, the Volpe Center,and NIOSH, the working team will:• develop the survey methodology and
questions,• identify respondents (e.g., program
managers, principal investigators andtechnical experts in safety researchfor each transportation mode),
• coordinate execution of the survey intheir respective organizations,
• code the data and analyze thefindings, and
• develop summary of findings.The team will summarize the surveymethodology and findings in theTransportation Safety Data Analysis report.
Analysis Methods Inventory
The survey findings will include informationon the application of data analysis methodsfor transportation safety research. Theworking team will:• compile a list of the methods used
for safety research in each mode;• develop a bibliography of
transportation safety research studiesthat use these methods;
• identify analysis resources, includingpersonnel, facilities, instrumentationand equipment for the employmentof these methods; and
• identify critical research issues, andstrategies for their resolution.
This inventory will be included as anappendix in the Transportation Safety DataAnalysis report.
DOT Safety Data Analysis ImprovementPlan
For each mode of transportation, the teamwill identify and evaluate:• strengths and weakness of safety
data analysis applications andpractices,
• best safety data analysis practices,• resource needs for safety data
analysis, and• lessons learned from the application
of safety analysis methodologies andpractices.
Based on this information, the working teamwill develop a plan for improving safetydata analysis in the Department ofTransportation. The plan will includeperformance standards, recommendationsfor developing new analytic methodologies,recommendations for technologyapplications, best practices andbenchmarking, and training guidelines. Thisplan will be includeed in the TransportationSafety Data Analysis report.
Outreach Strategy
The team will develop a strategy foroutreach to foster improvements intransportation safety data analysis. Thestrategy will involve objectives andguidelines for:• sponsorship of a safety data analysis
“strike force,”• development of presentations for
national and internationalconferences and other meetings,
• curriculum for a safety risks andcosts analysis and management shortcourse, and
• a website and publication program.The team will present the outreach strategyin the Transportation Safety Data Analysisreport.
4
Transportation Safety Data AnalysisReport
The team will assemble and edit theinformation developed in Tasks 1 through 5to produce the Transportation Safety DataAnalysis report.

5
APPENDIXSafety Data Analysis SurveyOVERVIEW
This Appendix presents the instrument for the survey conducted by the working team fromDecember 2001 through January 2002. The goal for conducting the survey is to acquireinformation on methods used to analyze transportation safety data. The purpose is to developrecommendations for facilitating improvements in transportation safety data analysis. Towardthese ends, the specific survey objectives are to identify the following.• Methods that U.S. Department of Transportation (DOT) agencies use to analyze the
safety of road, air, rail, water and pipeline transportation systems• Research problems that the agencies address with safety data analysis• Impact of safety data analyses on Federal transportation policies• DOT analysis resources and capabilities• Needs for improvement.The survey principally focuses on quantitative analysis of safety data, though it also coversqualitative analysis methods. The survey acquires information on analysis used to address safetyproblems, to identify areas for transportation safety improvement, and to developrecommendations for facilitation of data analysis for all transportation modes. This includes, forexample, the development of resources for information on and providing training in the use ofanalysis methods, developing guidelines for use of these methods, and developing standards or“best practices” for research.
Safety Data Analysis Purpose and Analysis Objectives
In conducting the survey, the team assumed that the purpose of safety data analysis is to produceknowledge in order to save lives, prevent injuries, and protect property from hazards intransportation. To achieve this purpose, public and private highway, aviation, rail, marine, andpipeline safety organizations sponsor, conduct, and use the results of transportation safetyresearch worldwide. Safety professionals analyze data to assess the extent, investigate thecircumstances, and determine the causes of transportation-related deaths, injuries, and propertydamage. The results of their analyses inform the development and implementation of policiesfor hazard mitigation and measures to minimize the consequences of accidents or other mishapsfor all modes of transportation.
Areas Considered for Possible Improvement
Successful analysis requires capabilities to produce accurate and useful information on hazardsand risks in an increasingly complicated transportation environment. However:• Resources for safety analysis may presently be insufficient, perhaps because of a decline
in recognition of the value of data analysis as a tool for improving transportation safety.

6
• Since data analysis methods and proficiency levels are diverse, generally acceptedstandards for their application or the evaluation of their adequacy may not exist.
• Fora for intermodal interchange of safety research methods, analysis tools, andinformation on best practices for improving safety data analysis do not presently exist.
The team hypothesized that these or other deficiencies might constrain the productivity oftransportation safety research, with adverse impacts on the effectiveness of safety programs.One purpose of the survey was to evaluate the extent of possible deficiencies, and recommendsteps to improve safety data analysis for all transportation modes.
METHOD
To acquire information on transportation safety data analysis, the team surveyed organizationsthat conduct and sponsor safety research. Questions were developed to facilitate thesediscussions about data analysis purposes, programs, and the analysis used. These interviews willidentify quantitative and qualitative safety analysis methods, areas of research, resources used toconduct analysis, and recommendations for actions that might be taken to improve safety dataanalysis for each of the transportation modes.
The following survey instrument was sent to prospective modal contacts in preparation for theirinterviews.
Survey Instrument
The Bureau of Transportation Statistics (BTS) requests your participation in the survey oftransportation safety professionals conducted by its Safety Data Initiative, Safety Data AnalysisWorking Team. Participants represent public and private organizations involved in thesponsorship or conduct of safety data analysis or the use of analysis products. It is essential thatrecommendations in the forthcoming report on Transportation Safety Data Analysis reflect yourknowledge and experience, and BTS very much appreciates your consideration and participationin the survey to ensure this occurs. To arrange for your participation, BTS will contact you toarrange a time for you to meet with Dr. Lynn Weidman, Ms. Paulette Grady, and Dr. AlexBlumenstiel. The meeting will be an opportunity to discuss critical issues in safety data analysis.The questions in the attachment to this document are intended to facilitate discussion at thismeeting.
The purpose of the survey is to ensure that professionals who sponsor or conduct analysis, or useanalysis products join in exploring critical issues affecting transportation safety data analysis andparticipate in the development of recommendations for improvement. The information that youprovide by participating in this survey will be crucial in forming recommendations for solvingthese problems.Safety Data Analysis Issues
The goal of safety data analysis is to produce knowledge in order to save lives, prevent injuries,and protect property from hazards in transportation. To reach this goal, public and privatehighway, aviation, rail, marine, and pipeline safety organizations sponsor, conduct, and use the

7
results of transportation safety research worldwide. Safety professionals analyze data to assessthe extent, investigate the circumstances and determine the causes of transportation-relateddeaths, injuries and property damage. The results of their analyses inform the development andimplementation of policies for mitigation of accidents and measures to minimize theirconsequences for all modes of transportation.
Achievement of the goal requires the capability to produce accurate and useful information onhazards and risks in an increasingly complicated environment. However, insufficient resourcesand capabilities even now constrain safety data analysis and limit its benefits for thedevelopment of effective transportation policies and hazard controls. The future viability andcontribution of data analysis to further improvements in transportation safety remain uncertain.Reasons for this uncertainty include:• Resources for safety analysis are presently insufficient, apparently because of a decline in
recognition of the value of data analysis as a tool for improving transportation safety.• Data analysis methods and proficiency levels are diverse, with generally accepted
standards for neither the application of these methods nor the evaluation of theiradequacy.
• Fora for intermodal interchange of safety research methods, analysis tools, andinformation on best practices for improving safety data analysis do not presently exist.
Specific Safety Data Analysis Questions
The Safety Data Analysis Working Team offers the attached list of questions to facilitatediscussion and the formulation of recommendations for improvement of data analysis tools andanalytic expertise for transportation safety research. The questions request information on:• Data sources, problems addressed by and uses of transportation safety data analysis
products• Methods and tools used to identify and measure the consequences of causes and
circumstances of transportation-related deaths, injuries and property damage for eachmode of transportation
• Expertise and resources applied and needed to support the analysis of safety data• Best practices and lessons learned within organizations and by individuals conducting
and applying the results of safety research for each of the transportation modes• Needs for and the effectiveness of training.
The working team will use the information you provide to formulate:• Recommendations for standards, technologies, training, evaluation and other
requirements to improve safety data analysis capabilities for each mode• Recommendations for venues and protocols for interchanges of safety data analysis best
practice and lessons-learned.
8
• A strategy for program development and coordination of fora, training, and other optionsfor information exchanges on data analysis efforts, statistical and other analysis tools,best practices and lessons-learned, impacts, and resource requirements.
Your assistance in this effort is crucial for success of the initiative to improve safety dataanalysis in all modes of transportation.
We very much appreciate your time and effort in contributing to the initiative and will call you toarrange a meeting.Thank you.
Sincerely,
Dave BalderstonFederal Aviation Administration Office of Systems SafetyChair, Safety Data Analysis Working Team
Name: __________________________________________________Title: ___________________________________________________Agency/Organization: _____________________________________Address: ________________________________________________Phone: __________________________________________________Fax: ____________________________________________________E-mail: _________________________________________________
Please summarize your own interests and efforts in conducting, sponsoring or using products ofsafety data analysis.

9
INTERVIEW QUESTIONS
1.1 What organizations use your agency’sinformation systems for safetyresearch?
1.1.1 In house
1.1.2 Other agencies
1.1.3 Private research, academic or othernon-profit organizations
1.1.4 Commercial enterprises
1.2 What are the principal problems thatyour agency has addressed byanalyzing safety data over the last fiveyears?
1.3 What are the principal sources of thedata used for this analysis?
1.3.1 Your agency’s information systems(list)
1.3.2 Other DOT, government or otherorganizations’ information systems(identify)
1.4 What kinds of analysis were (are)used?
1.5 What standards are applied to evaluatethe analysis results?
1.6 Has your agency establishedrequirements or guidelines to ensurethat analysis results are used to informpolicy development?
1.6.1 What are the requirements orguidelines?
1.7 What recent operational, development,enforcement or other policies orrequirements have been informed bythe results of safety data analysis?
2 Methods and Tools
2.1 What kinds of analytical methods andtools does your agency use?Examples are:
2.1.1 Hazard analysis2.1.2 Risk analysis and modeling
2.1.3 Probability statistics
2.1.4 Correlations and analysis of variance
2.1.5 Other statistical tests
2.1.6 Geographical information system
2.1.7 Video or graphical analysis
2.1.8 Simulation
2.2 Does your agency recommend, requireor promote the use of particular toolsspecifically for safety assessment, riskanalysis or other safety-relatedanalysis applications?
2.2.1 If it does, what are these tools andhow are they used?
2.3 Are analysis methods or toolsdeveloped specifically or applied for

10
purposes that are unique to youragency?
2.3.1 If so, what are these methods ortools, what are their sources, andhow are they used?
2.4 What analysis methods and tools doesyour agency use that can be used byother DOT modes?
2.4.1 For what purposes does your agencyuse these tools?
2.4.2 What other agencies use the tools?For what purposes?
2.4.3 For what other purposes could youragency and other agencies use thetools?
2.4.4 Are there studies that you havewanted but haven’t been able to findthe methods to do properly?
2.4.5 Does your agency develop orsponsor the development of newtools for safety analysis? What toolshas it developed?
2.4.6 Who uses them?
2.4.7 For what are they used?
2.4.8 What methods or tools is youragency currently developing ortesting?
2.5 Does your agency have a policy foruse of particular types of analytic toolsto answer specific types of safetyquestions? For example, the FAAdevelops and applies blunder modelsto assess impacts of aircraft separation
standards. It uses hazard assessmentto assess the potential impacts onsafety of new aeronauticaltechnologies. Does your agency usesimilar tools for similar purposes?Other examples?
2.6 What are limitations of the analysistools that you agency uses?
2.7 Are there actions that BTS can take tohelp improve the agency’s analysiscapabilities?
3 Expertise and Resources
3.1 What proportion of your agency’ssafety analysis expertise is in-house?
3.2 What is the composition of thisexpertise, in skills and qualifications?
3.3 How many FTEs on average has youragency devoted overall to safety-related analysis work during the past 5years?
3.3.1 In house
3.3.2 Other
3.4 Does your agency have a specificorganization unit with the mission todevelop and apply safety analysismethods and tools?
3.4.1 Size of the unit (FTEs)?
3.4.2 Funding?
3.4.3 Other responsibilities?

11
3.5 What has your agency’s annual levelof funding for safety data analysisbeen over the past five years?
3.6 What is its FY 2002 level of fundingfor this activity?
3.7 Does your agency need to change thenumber of FTEs, funding, skill mix orstaff qualifications devoted to safetyanalysis? If so, in what ways and whyhave priorities changed?
3.8 What is your agency’s plan for safetyanalysis support for the next fiveyears?
4 Lessons Learned and Best Practices
4.1 How does your agency measure andevaluate productivity in its in-houseand sponsored or contracted researchand analysis programs?
4.2 Does your agency have a policy inplace to formalize best practices forsafety research and analysis?
4.3 How does your agency:
4.3.1 Identify lessons learned?
4.3.2 Formalize best practices forproductive safety research andanalysis efforts?
4.4 If lessons learned and best practiceshave been identified and formalized,have they improved safety analysis?If so, how?
4.5 Is documentation of lessons-learnedand productivity improvementsavailable?
4.6 In what form?
4.7 Has the documentation been useful?
4.8 What improvements in theapplication of best practices andlessons-learned may be needed?
4.9 What resources (FTEs and budget)are applied to evaluate your agency’ssafety analysis methods, tools andresults?
4.10 What are your agency’s plans forimproving safety data analysis overthe next five years?
4.11 Training methods
• Does your agency have specificgoals for improving its safetyanalysis capabilities that can beachieved through training? If so,what are these goals?
• What improvements are needed orplanned to help your agency achieveits goals?
• What level of funding is needed forthese improvements?
• Does your agency currently providetraining in safety data analysis?
• Formal Courses (Internal, External)
• Training materials

12
• Mentoring
• Does your agency have a policyregarding the use of specific trainingmethods for improving its safetyanalysis capability?
• In the past 5 years, what resourceshas your agency devoted on averagefor training its staff in safety dataanalysis?
5.6.1 Courses
5.6.2 Training materials
5.6.3 Other.
5.7 How is staff selected for thistraining? How is the effectiveness ofthe training measured? What havebeen the results?

1
Research Project #1Research Project #1
Reengineering DOT Data Programs
Reengineering DOT Data ProgramsReengineering DOT Data Programs
�Ensure decision makers have confidence in source and reliability of transportation safety data
ObjectiveObjective

2
Reengineering DOT Data ProgramsReengineering DOT Data Programs
�Conduct data quality assessments of transportation safety data systems
Phase IPhase I
Reengineering DOT Data ProgramsReengineering DOT Data Programs
� Background Information
� Frames and Sampling� Data Collection� Data Preparation
� Data Dissemination� Sponsor Evaluation� Data Analysis� Assessment� Recommendations
Data Quality Assessment TemplateData Quality Assessment Template

3
Reengineering DOT Data ProgramsReengineering DOT Data Programs
� UNISHIP� Hazardous Materials Management
Information System (HMIS)� Airline Passenger Origin and Destination
Survey� National Transit Database System – Safety
& Security module� National Aviation Safety Data Analysis
Center (NASDAC)) data system
Selected Data SystemsSelected Data Systems
Reengineering DOT Data ProgramsReengineering DOT Data Programs
� Primary purpose is to provide DOT administrations with information on past violation histories of hazardous materials offenders to be used when assessing civil penalties
UNISHIPUNISHIP

4
Reengineering DOT Data ProgramsReengineering DOT Data Programs
� Includes information on incidents involving unintentional release of a hazardous material during transit, loading/unloading, or temporary storage
Hazardous Materials Management Hazardous Materials Management Information System (HMIS)Information System (HMIS)
Reengineering DOT Data ProgramsReengineering DOT Data Programs
� Tracks how passengers use the commercial air traffic system
� Collects information on passenger origins, destinations, and routings.
� Conducted by BTS Office of Airline Information (OAI) since 1995
Airline Passenger Origin & Airline Passenger Origin & Destination SurveyDestination Survey
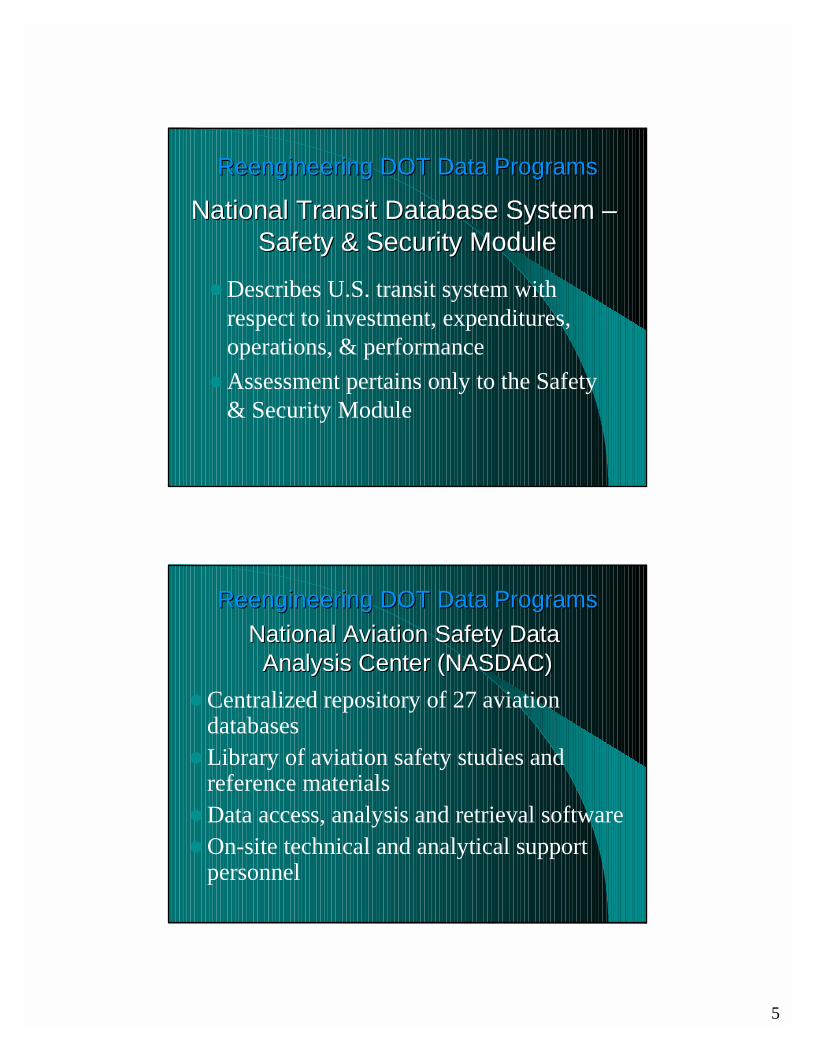
5
Reengineering DOT Data ProgramsReengineering DOT Data Programs
�Describes U.S. transit system with respect to investment, expenditures, operations, & performance
�Assessment pertains only to the Safety & Security Module
National Transit Database System National Transit Database System ––Safety & Security ModuleSafety & Security Module
Reengineering DOT Data ProgramsReengineering DOT Data Programs
�Centralized repository of 27 aviation databases
�Library of aviation safety studies and reference materials
�Data access, analysis and retrieval software�On-site technical and analytical support
personnel
National Aviation Safety Data National Aviation Safety Data Analysis Center (NASDAC)Analysis Center (NASDAC)

6
Reengineering DOT Data ProgramsReengineering DOT Data Programs
� BTS will continue to assess DOT databases that capture safety data in an effort to address the department’s strategic goal of improving transportation safety.
ConclusionConclusion

1
Research Project #2Research Project #2
Develop Common Criteria for Injury and Fatality Reporting
Develop Common Criteria for Injury and Develop Common Criteria for Injury and Fatality ReportingFatality Reporting
� Recommend common injury coding standards across transportation modes
� Develop uniform event definitions� Develop common injury reporting criteria� Provide sufficiently robust data to:
– Develop mitigation strategies– Prioritize research and resource allocation
Objectives

2
Develop Common Criteria for Injury and Develop Common Criteria for Injury and Fatality ReportingFatality Reporting
� Form working group� Inventory DOT and selected non-DOT
databases� Describe current definitions/processes/
injury coding schemes� Develop recommendations for a common
scheme
General Approach
Develop Common Criteria for Injury and Develop Common Criteria for Injury and Fatality ReportingFatality Reporting
� Help determine incident severity and cost� Provide objective basis for development of
injury mitigation/prevention strategies� Provide basis for management decisions
– Resource prioritization – Resource allocation– Research
Purpose of Injury Reporting

3
Develop Common Criteria for Injury and Develop Common Criteria for Injury and Fatality ReportingFatality Reporting
� Injury location– Body region/organ system– Aspect
� Injury type/description � Injury severity� Injury cause/mechanism
Elements of Injury Reporting
Develop Common Criteria for Injury and Develop Common Criteria for Injury and Fatality ReportingFatality Reporting
� High degree of variability among databases:– Event definition– Injury definitions– Inclusion criteria– Investigation methodology– Injury reporting
Findings
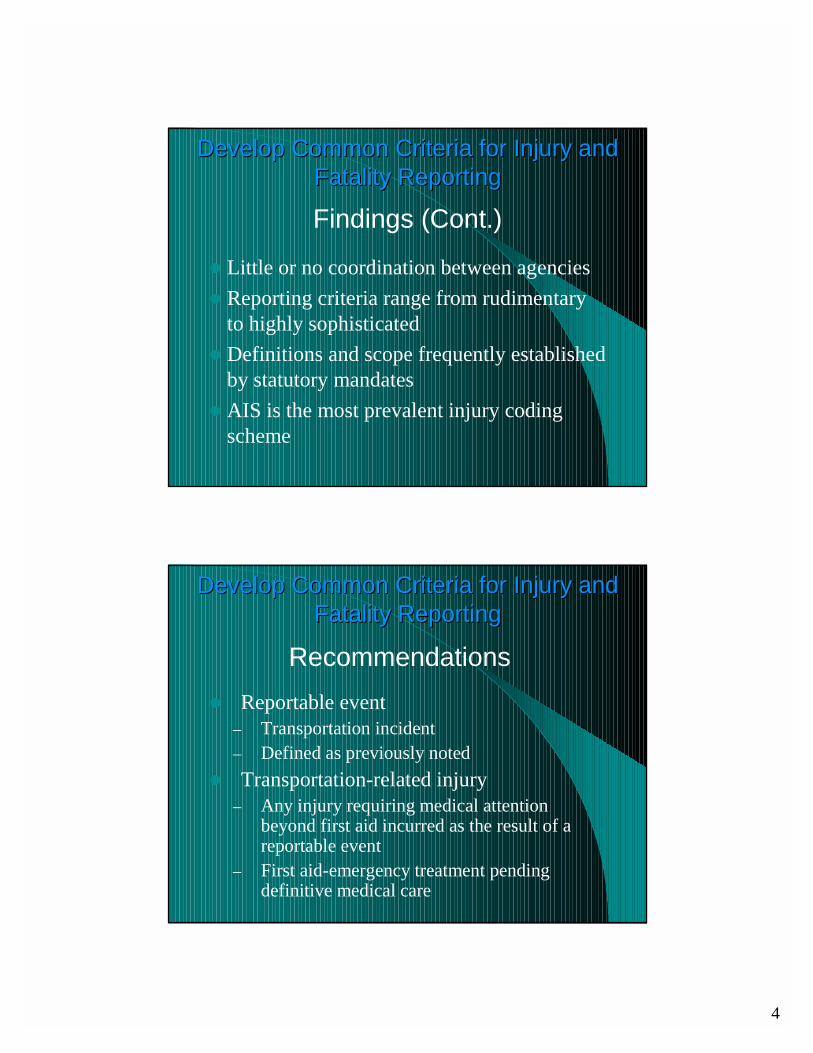
4
Develop Common Criteria for Injury and Develop Common Criteria for Injury and Fatality ReportingFatality Reporting
� Little or no coordination between agencies� Reporting criteria range from rudimentary
to highly sophisticated� Definitions and scope frequently established
by statutory mandates � AIS is the most prevalent injury coding
scheme
Findings (Cont.)
Develop Common Criteria for Injury and Develop Common Criteria for Injury and Fatality ReportingFatality Reporting
� Reportable event – Transportation incident– Defined as previously noted
� Transportation-related injury– Any injury requiring medical attention
beyond first aid incurred as the result of a reportable event
– First aid-emergency treatment pending definitive medical care
Recommendations

5
Develop Common Criteria for Injury and Develop Common Criteria for Injury and Fatality ReportingFatality Reporting
� Fatality definition– Fatality resulting from injuries sustained in a
transportation incident when the death occurs within 30 days of the incident
� Uninjured– Uninjured persons involved in a
transportation incident should be reported
Recommendations
Develop Common Criteria for Injury and Develop Common Criteria for Injury and Fatality ReportingFatality Reporting
� Injury Coding� Adopt a system similar to the NASS CDS
– Minimum elements for each injury:– Source of recorded injury data– Complete AIS 90 code– Injury Aspect 1– Injury Aspect 2– Multiple mechanism fields
Recommendations

6
Develop Common Criteria for Injury and Develop Common Criteria for Injury and Fatality ReportingFatality Reporting
� Injury aspect– AIS does not include aspect information– Locating the injury to right-left, inferior-
superior, anterior-posterior is important to determining injury mechanisms
– Use of several fields more accurately describes location
Recommendations
Develop Common Criteria for Injury and Develop Common Criteria for Injury and Fatality ReportingFatality Reporting
� Injury mechanism– Attributes trauma to the physical source of
injury– Essential for the determination of prevention
strategies� If you do not know what caused the injury,
how can you prevent it?– Basic coding structure can be applied to all
modes– Specific codes will be unique to each mode
Recommendations

7
Develop Common Criteria for Injury and Develop Common Criteria for Injury and Fatality ReportingFatality Reporting
� Statistical Sampling– Should consider opportunities for statistical
sampling of incidents within modes– Requires a relatively high volume of incidents– Currently utilized by NASS CDS– Probably practical for general aviation and
recreational boating
Recommendations
Develop Common Criteria for Injury and Develop Common Criteria for Injury and Fatality ReportingFatality Reporting
� Database linkage– Consider opportunities for linkage to other
databases� Hospital� Vital statistics� Other medical databases
Recommendations

8
Develop Common Criteria for Injury and Develop Common Criteria for Injury and Fatality ReportingFatality Reporting
� Adoption of the Working Group recommendations will require considerable change for most modes
� Changes are essential for establishing a robust injury surveillance system able to support the vision of the DOT
Conclusions

1
Research Project #3Research Project #3
Develop Common Denominators for Safety Measures
Develop Common Denominators for Develop Common Denominators for Safety MeasuresSafety Measures
� Develop or identify common denominators suitable for transportation safety measurement
� Should be usable within and across various transportation modes
Goals

2
Develop Common Denominators for Develop Common Denominators for Safety MeasuresSafety Measures
� Limited to evaluation of exposure measures suitable for transportation safety evaluations
� Includes crashes, incidents and injuries to occupants and/or workers
Scope
Develop Common Denominators for Develop Common Denominators for Safety MeasuresSafety Measures
� Aviation– General aviation– Air carrier
� Highway– Passenger car– Trucks– Transit services– Bicycles
� Rail– Passenger and freight– Transit systems
employing rail� Maritime
– Commercial– Recreational
� Pipeline
Modes Considered

3
Develop Common Denominators for Develop Common Denominators for Safety MeasuresSafety Measures
�Exposure measures currently used identified
�Limitations and gaps of current environment identified, by mode and by type of activity
General Approach
Develop Common Denominators for Develop Common Denominators for Safety MeasuresSafety Measures
�Recommendations developed to correct for limitations and gaps
�Recommendations for exposure measures suitable for intra- and inter-mode comparisons developed
�Approaches for implementing findings and recommendations developed
General Approach

4
Develop Common Denominators for Develop Common Denominators for Safety MeasuresSafety Measures
� General aviation activity survey should be expanded to collect information on:– Number of aircraft occupants– Trip length, miles– Amount of freight carried– Hours on duty for professional pilots
General Recommendation 1
Develop Common Denominators for Develop Common Denominators for Safety MeasuresSafety Measures
� A process needs to be developed to capture information from commercial marine operators that would include:– Trip length, miles– Trip length, time– Number of occupants including crew– Hours on duty for crewmembers
General Recommendation 2

5
Develop Common Denominators for Develop Common Denominators for Safety MeasuresSafety Measures
� Highway data collection systems (HPMS, VIUS, NHTS, etc.) should be reviewed to determine accuracy of estimates currently provided. Accurate estimates are needed for:– Trip length in distance and time– Number of vehicle occupants– Total number of trucks operated by commercial
operators– Hours on duty for professional drivers
General Recommendation 3
Develop Common Denominators for Develop Common Denominators for Safety MeasuresSafety Measures
� An ongoing and systematic survey should be undertaken to collect information from recreation and boat operators on:– Total number of occupants per trip– Trip length in time and distance– Type and size of boat (sailboat, power, etc.)– Number of hours underway compared to time at
anchor
General Recommendation 4

6
Develop Common Denominators for Develop Common Denominators for Safety MeasuresSafety Measures
� The National Household Transportation Survey (NHTS) should be conducted more frequently (every two years) to improve timeliness of information. It should also be modified to collect information on:– Recreational use of transportation
� Trip length and distance where applicable� Number of occupants� Transportation mode used for recreation
General Recommendation 5
Develop Common Denominators for Develop Common Denominators for Safety MeasuresSafety Measures
� The U.S. Department of Transportation should work with State and local authorities to develop a central repository of vehicle operator demographic information derived from operator licenses and other sources. This information should be collected for operators of highway vehicles and transit system vehicles.
General Recommendation 6

1
Research Project #5Research Project #5
Develop Common Data on Accident Circumstances
Common Data on Accident CircumstancesCommon Data on Accident Circumstances
�Determine most important data items– Identify useful conceptual
framework�Describe what is now collected� Identify gaps �Make recommendations
ObjectivesObjectives

2
Common Data on Accident CircumstancesCommon Data on Accident Circumstances
� Three phases:– pre-event - contributing to likelihood that
a potentially damaging event will occur– event - influencing the chance of injury
when an event (crash, fall, etc.) occurs– post-event - influencing the chance of
survival or complete recovery
Conceptual Framework: Conceptual Framework: The Haddon MatrixThe Haddon Matrix
Common Data on Accident CircumstancesCommon Data on Accident Circumstances
The Haddon MatrixThe Haddon Matrix
Post-Event
Event
Pre-Event
Social Environment
Physical Environment
VehicleHuman
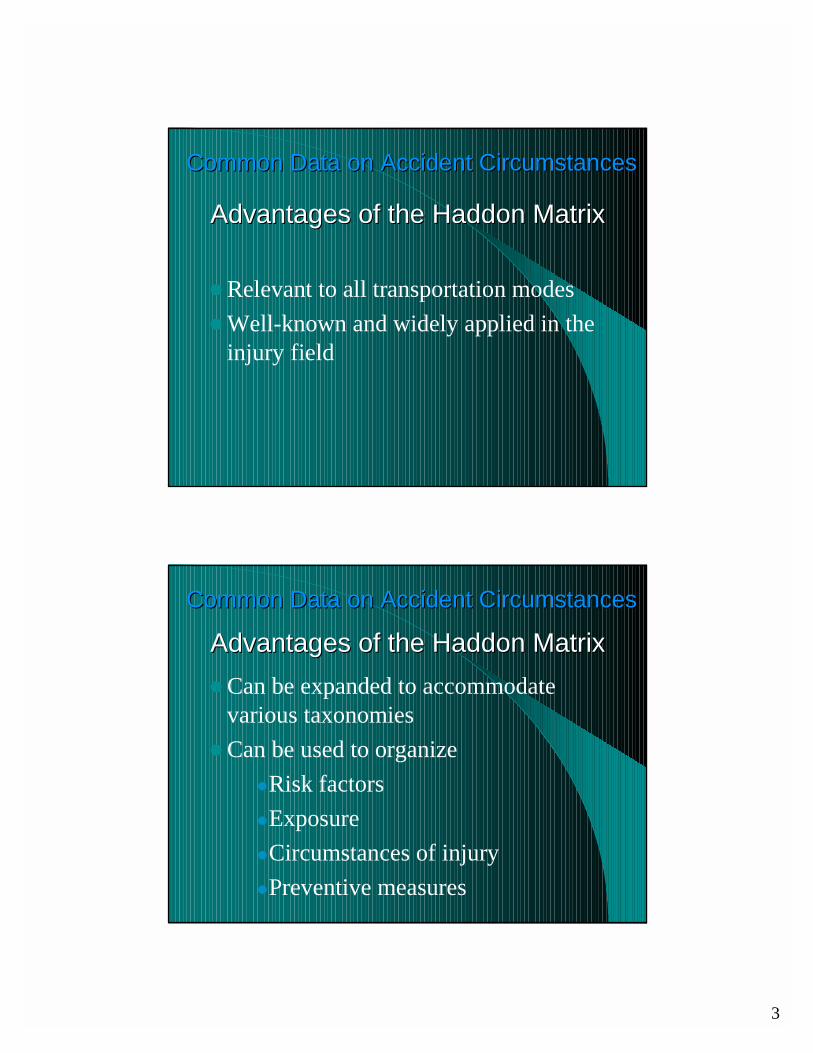
3
Common Data on Accident CircumstancesCommon Data on Accident Circumstances
�Relevant to all transportation modes�Well-known and widely applied in the
injury field
Advantages of the Haddon MatrixAdvantages of the Haddon Matrix
Common Data on Accident CircumstancesCommon Data on Accident Circumstances
�Can be expanded to accommodate various taxonomies
�Can be used to organize �Risk factors �Exposure �Circumstances of injury�Preventive measures
Advantages of the Haddon MatrixAdvantages of the Haddon Matrix
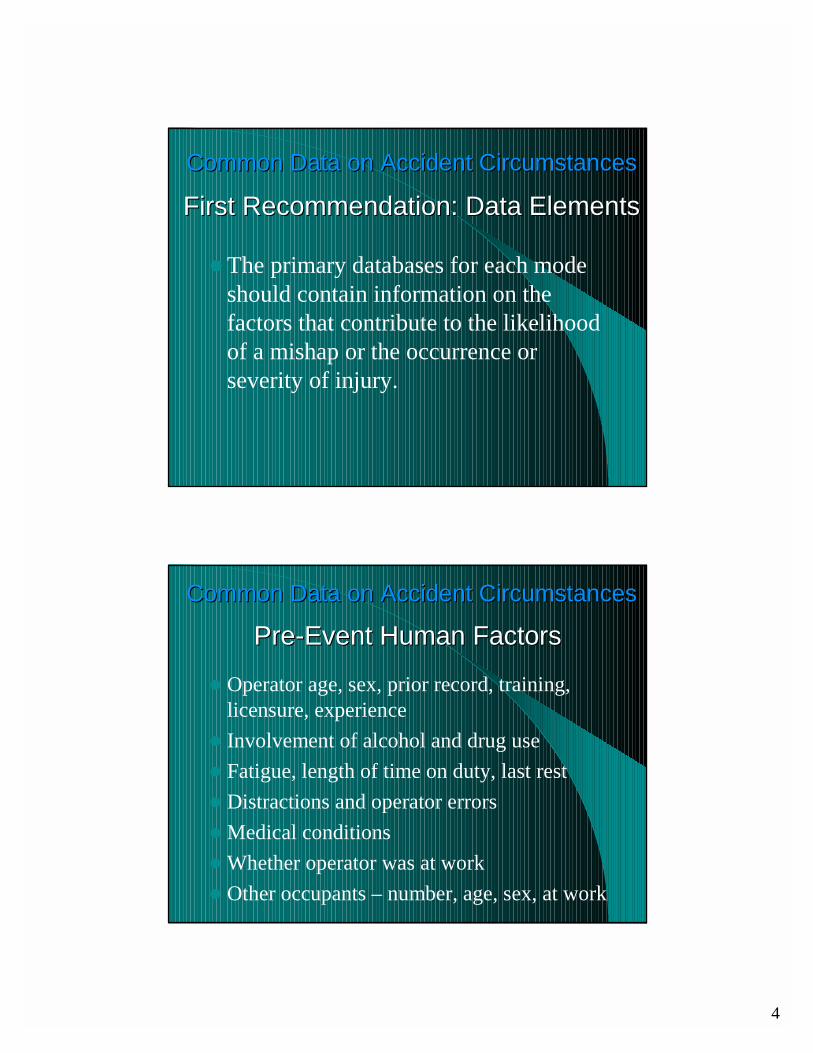
4
Common Data on Accident CircumstancesCommon Data on Accident Circumstances
�The primary databases for each mode should contain information on the factors that contribute to the likelihood of a mishap or the occurrence or severity of injury.
First Recommendation: Data ElementsFirst Recommendation: Data Elements
Common Data on Accident CircumstancesCommon Data on Accident Circumstances
� Operator age, sex, prior record, training, licensure, experience
� Involvement of alcohol and drug use� Fatigue, length of time on duty, last rest� Distractions and operator errors � Medical conditions � Whether operator was at work � Other occupants – number, age, sex, at work
PrePre--EventEvent Human FactorsHuman Factors

5
Common Data on Accident CircumstancesCommon Data on Accident Circumstances
� Information on injury type and severity� Information on uninjured passengers� Narrative description� Detail on human factors� Guidelines for recording data� Feedback to investigators� Linkage with death certificate information
Data Gaps Include Lack of:Data Gaps Include Lack of:
Common Data on Accident CircumstancesCommon Data on Accident Circumstances
�Quality of data often less than optimal�Some events not recorded by police or
DOT– Mishaps of off-road vehicles– Suicide– Terrorism– Injuries without collision
Other Data LimitationsOther Data Limitations

6
Common Data on Accident CircumstancesCommon Data on Accident Circumstances
�Little data on–Injury mechanism–Whether at work–Operator fatigue and distractions
Other Data LimitationsOther Data Limitations
Common Data on Accident CircumstancesCommon Data on Accident Circumstances
� Details on crash severity and injury mechanism, at least for samples of crashes
� Inclusion of narrative text� Greater use of GIS to identify exact location� Incorporation of data from non-DOT
sources� Greater comparability of data across modes
Recommended Data ImprovementsRecommended Data Improvements

7
Common Data on Accident CircumstancesCommon Data on Accident Circumstances
� Greater use of sampling� Supplemental studies, e.g., certain vehicles� Confidential reporting systems� Special studies using other national
databases such as CPSC’s NEISS
Recommended Improvements in MethodsRecommended Improvements in Methods
Common Data on Accident CircumstancesCommon Data on Accident Circumstances
� Incorporation of Event Data Recorder (EDR) data in police reports
� Installation of Automatic Crash Notification (ACN) in all road vehicles
�Evaluation of effectiveness of current automatic warning systems
Use of Technology to Improve DataUse of Technology to Improve Data

8
Common Data on Accident CircumstancesCommon Data on Accident Circumstances
�More timely data, on quarterly basis� Increased frequency of national
surveys such as personal transportation survey
�Data on bicyclist injuries should be obtained from CPSC
Other RecommendationsOther Recommendations
Common Data on Accident CircumstancesCommon Data on Accident Circumstances
�Major steps can and should be taken to improve transportation safety data.
ConclusionConclusion

1
Research Project #6Research Project #6
Develop Better Data on Accident Precursors or Leading Indicators
Improve Data on Accident Improve Data on Accident Precursors or Leading IndicatorsPrecursors or Leading Indicators
� Identify precursors that might be strong predictors of accidents
� Establish research projects that would evaluate the strength of the precursor to predict accidents
ProjectProject PurposePurpose

2
Improve Data on Accident Improve Data on Accident Precursors or Leading IndicatorsPrecursors or Leading Indicators
� Form Working Group from modal safety experts
� Volpe review of current work
Project TasksProject Tasks
Improve Data on Accident Improve Data on Accident Precursors or Leading IndicatorsPrecursors or Leading Indicators
� Identify Potential-Accident relationships
� Prioritize Proposed projects
� Develop Research protocols
Project TasksProject Tasks

3
Improve Data on Accident Improve Data on Accident Precursors or Leading IndicatorsPrecursors or Leading Indicators
�Evaluation of Data or Method of Collection
�Safety Culture Analysis�Specific Precursor-Outcome
Relationships�Technology Transfer
Proposed Research AreasProposed Research Areas
Improve Data on Accident Improve Data on Accident Precursors or Leading IndicatorsPrecursors or Leading Indicators
� Mining to Establish Sequence of Events
– Use Text Mining to search narrative reports for the sequence of events that resulted in an accident.
Evaluation of Data or Method Evaluation of Data or Method of Collectionof Collection

4
Improve Data on Accident Improve Data on Accident Precursors or Leading IndicatorsPrecursors or Leading Indicators
� A Human Factors Analysis of Precursors Associated with Incidents/Accidents
– Looks at Reason’s ‘Swiss cheese’ model of accidents
– Incorporates human factors aspects to help understand the combination of factors that result in an accident
Evaluation of Data or Method Evaluation of Data or Method of Collectionof Collection
Improve Data on Accident Improve Data on Accident Precursors or Leading IndicatorsPrecursors or Leading Indicators
� Other proposals:
– Retrospective interview and survey information
– Assessment of data needs for GIS
– Documentation of safety “successes” as well as failures
– Various forms of data modeling to establish potential for accidents
Evaluation of Data or Method Evaluation of Data or Method of Collectionof Collection

5
Improve Data on Accident Improve Data on Accident Precursors or Leading IndicatorsPrecursors or Leading Indicators
� Organizational safety culture and other indicators of accident risk – Investigate both the “driver” and the company – Workload - an indicator of accident risk– Identify “culture” attributes that are
characteristic of “problem” operators
Safety Culture AnalysisSafety Culture Analysis
Improve Data on Accident Improve Data on Accident Precursors or Leading IndicatorsPrecursors or Leading Indicators
� Study the Feasibility of Possible Profiling Systems – Investigate the operability and utility of “profiling”
of carriers & operators
� Using an Indexing System to Identify Precursors for Vehicle Crashes, Injuries and Deaths – Utilize a point system to rate risk of accidents
Safety Culture AnalysisSafety Culture Analysis

6
Improve Data on Accident Improve Data on Accident Precursors or Leading IndicatorsPrecursors or Leading Indicators
� Experience & Training As Predictor of Hazardous Materials Incidents
� Several other proposals:– Noise Levels and Distraction– Social Needs and Nocturnal Work Activity– Tracking Undeclared Hazardous Materials
Shipments– Traffic Intensity at the Sector Level– Driving Records as a Predictor of Crash
Involvement
Specific PrecursorSpecific Precursor--OutcomeOutcomeRelationshipsRelationships
Improve Data on Accident Improve Data on Accident Precursors or Leading IndicatorsPrecursors or Leading Indicators
� Use of Flight Data Recorder Technology to Predict Accidents in other modes
Technology TransferTechnology Transfer
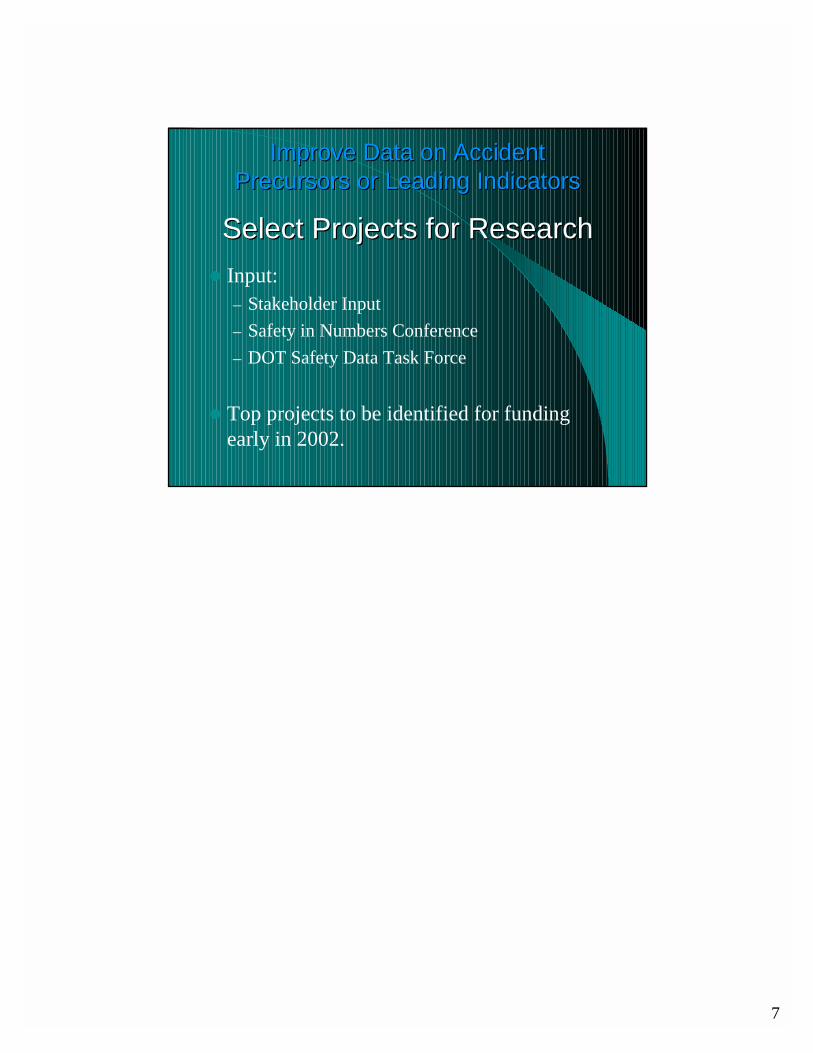
7
Improve Data on Accident Improve Data on Accident Precursors or Leading IndicatorsPrecursors or Leading Indicators
� Input:– Stakeholder Input– Safety in Numbers Conference– DOT Safety Data Task Force
� Top projects to be identified for funding early in 2002.
Select Projects for ResearchSelect Projects for Research

1
Research Project #7Research Project #7
Expand the Collection of “Near-Miss” Data to All Modes
Collection of “NearCollection of “Near--Miss” DataMiss” Data
�Definition– A situation that could have resulted in
accidental harm or damage but failed to in the absence of any specific measure designed to prevent it.
� - “Near-Miss” vs. “Unsafe Situation”
Background

2
Collection of “NearCollection of “Near--Miss” DataMiss” Data
� Injury Prevention� In-depth quantitative analysis� Stronger safety efforts� Cost-efficiency
Benefits of Unsafe Situation Reporting
Collection of “NearCollection of “Near--Miss” DataMiss” Data
�Automated data recording systems�Voluntary self-reporting systems
Methods of Data Collection

3
Collection of “NearCollection of “Near--Miss” DataMiss” Data
�Aviation– Aviation Safety Reporting System
(ASRS)– Near Midair Collision System (NMACS)– The Confidential Human Factors Incident
Reporting Programme (CHIRP)– The Global Analysis and Information
Network (GAIN)
Existing Data Systems
Collection of “NearCollection of “Near--Miss” DataMiss” Data
� Maritime– The Nautical Institute International Marine
Accident Reporting Scheme (MARS)– Safety Incident Management Information System
(SIMIS)– The International Maritime Information Safety
System (IMISS)
� Rail– Signal Passed at Danger (SPAD) system
� Intermodal– Secutitas
Existing Data Systems

4
Collection of “NearCollection of “Near--Miss” DataMiss” Data
� Study Existing Data Systems� Identify Potential Benefits and Problems� Explore Transferability of Reporting� Improve Cross-Modal Utility of Data� Improve Data Analysis Process
Project Goals & Objectives
Collection of “NearCollection of “Near--Miss” DataMiss” Data
� Data Systems Matrix� Human Factors Taxonomy� Voluntary Reporting Guidelines� Automated Methods of Data Collection
Methodology
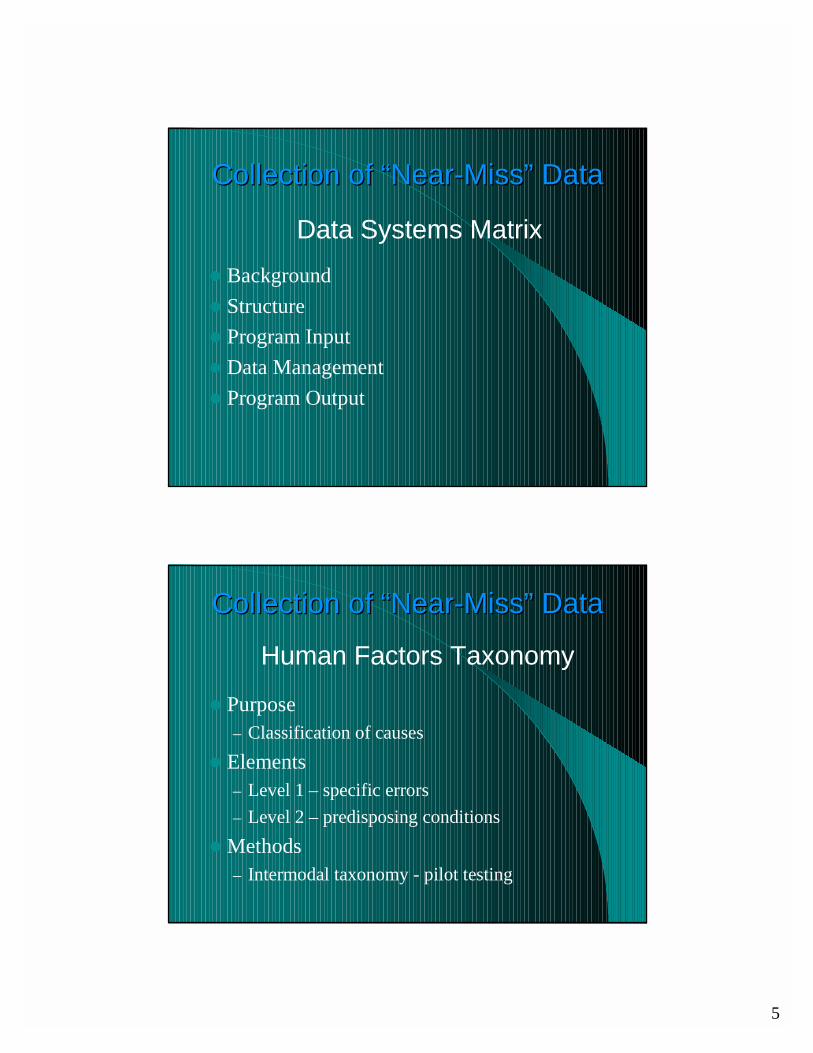
5
Collection of “NearCollection of “Near--Miss” DataMiss” Data
� Background� Structure� Program Input� Data Management� Program Output
Data Systems Matrix
Collection of “NearCollection of “Near--Miss” DataMiss” Data
� Purpose– Classification of causes
� Elements– Level 1 – specific errors– Level 2 – predisposing conditions
� Methods– Intermodal taxonomy - pilot testing
Human Factors Taxonomy

6
Collection of “NearCollection of “Near--Miss” DataMiss” Data
� Voluntary participation� Confidentiality� Legislative protection & immunity� Non-regulatory host agency� Buy-in and support from the community� Feedback� Data System Design
Key Elements in Voluntary Reporting
Collection of “NearCollection of “Near--Miss” DataMiss” Data
� Voluntary Reporting– Target areas– Modal participation– Methods
� Draft guidelines� Pilot testing� Final guidelines� Modal implementation
Project Approach

7
Collection of “NearCollection of “Near--Miss” DataMiss” Data
� Automated Reporting– Technology & Unsafe Situations– Advantages of Automated Data Collection– Marine Traffic Patterns Study– Truck Headway Study
Project Approach
Collection of “NearCollection of “Near--Miss” DataMiss” Data
� Value of Unsafe Situation Data in Transportation Safety
� (Self-reports + Recorded Data) = Success� Identification of Contributing Factors� Trend Analysis� New Remediation Strategies
Conclusion
1
Research Project #9Research Project #9
Exploring Options for Using Technology in Data Collection
Using Technology in Data CollectionUsing Technology in Data Collection
� Improve timeliness� Improve accuracy� Improve usefulness� Improve cost-effectiveness� Establish or increase utilization of
technology across transportation modes
ObjectivesObjectives

2
Using Technology in Data CollectionUsing Technology in Data Collection
� Review Existing Technologies� Identify New Technologies� Apply Technologies to Needs� Develop Pilot/Demo Project Descriptions
Project PlanProject Plan
Using Technology in Data CollectionUsing Technology in Data Collection
� FAA - 7 current technology projects� FRA - 6 current technology projects� MARAD/USCG - 13 current technology projects� NHTSA - 5 current technology projects� FMCSA - 8 current technology projects� FHWA - 7 current technology projects� RSPA - 7 current technology projects� FTA - 8 current technology projects
BackgroundBackground

3
Using Technology in Data CollectionUsing Technology in Data Collection
� Technology Transfer Opportunities� Identify “New” Technologies� Map Technologies to Needs
Overall MethodOverall Method
Using Technology in Data CollectionUsing Technology in Data Collection
� Cost-effectiveness� Feasibility� Likely Impact� Anticipated Cost
� Maintainability� Potential for
Expansion
� Accessibility
� Strategic Importance
� Adaptability� Cross-Functional
Application
� Industry Buy-in
Prioritization AttributesPrioritization Attributes

4
Using Technology in Data CollectionUsing Technology in Data Collection
� Smart Cards� Performance
Monitoring� Hands-Free Operation
� Vehicle Usage Monitoring
� Imaging� Voice Activation� Automated Control� Pattern Recognition
Eight TechnologiesEight Technologies
Using Technology in Data CollectionUsing Technology in Data Collection
� Licensing Applications
� Highway Data
� CDL
� Security
� Qualifications
� Certifications
Smart CardsSmart Cards

5
Using Technology in Data CollectionUsing Technology in Data Collection
� Driver Control
� Commercial Vehicles
� Shipping
� Traffic Control
� Security Personnel
Performance MonitoringPerformance Monitoring
Using Technology in Data CollectionUsing Technology in Data Collection
� Law Enforcement
� CMV Inspection
� Pipeline Inspection
� Bridge & Tunnel Inspection
� Highway Data
� Ship Inspection
HandsHands--Free OperationFree Operation

6
Using Technology in Data CollectionUsing Technology in Data Collection
� Driver Control
� Commercial Vehicle
Vehicle Usage MonitoringVehicle Usage Monitoring
Using Technology in Data CollectionUsing Technology in Data Collection
� Traffic Monitoring
� Pipeline Incidents
� 3-D X-ray
� Millimeter Wave
ImagingImaging

7
Using Technology in Data CollectionUsing Technology in Data Collection
� Vehicle Interlock
� Secure Operation
� Shipping
Voice Activated Data InputVoice Activated Data Input
Using Technology in Data CollectionUsing Technology in Data Collection
� Aircraft Monitoring
� Telemetry
� Hazard Identification
Automated Control DeviceAutomated Control Device
8
Using Technology in Data CollectionUsing Technology in Data Collection
� Security
� Scent Detection
� Pipeline Incidents
Pattern RecognitionPattern Recognition
Using Technology in Data CollectionUsing Technology in Data Collection
� Top 3 Technologies for Field Testing:– Electronic Identification/Security (Smart
Cards)– Operator Performance Monitoring– Hands-Free Operation
� Develop Several Pilots/Demonstrations
ConclusionConclusion

1
Research Project #10Research Project #10
Expand, Improve, and Coordinate Safety Data Analysis
Expand, Improve, and Coordinate Expand, Improve, and Coordinate Safety Data Analysis Safety Data Analysis
� Increase the extent to which analyses of transportation safety data help to save lives and prevent injuries from hazards in all modes of transportation.
GoalGoal
2
Expand, Improve, and Coordinate Expand, Improve, and Coordinate Safety Data Analysis Safety Data Analysis
� Report on Transportation Safety Data Analysis
� Promote intermodal interchanges of information on data analysis
ObjectiveObjective
Expand, Improve, and Coordinate Expand, Improve, and Coordinate Safety Data AnalysisSafety Data Analysis
� Identify and index leaders in transportation safety data analysis and research
� Conduct a transportation safety data analysis survey
� Construct an analysis methods inventory
ProcessProcess

3
Expand, Improve, and Coordinate Expand, Improve, and Coordinate Safety Data Analysis Safety Data Analysis
� Develop a DOT safety data analysis improvement plan
� Formulate an outreach strategy
� Produce the Transportation Safety Data Analysis Report
ProcessProcess
Expand, Improve, and Coordinate Expand, Improve, and Coordinate Safety Data Analysis Safety Data Analysis
� Survey methodology and questions developed
� 15 respondents identified and interviews scheduled
� Will code results, analyze and summarize findings
Data Analysis SurveyData Analysis Survey
4
Expand, Improve, and Coordinate Expand, Improve, and Coordinate Safety Data AnalysisSafety Data Analysis
� Performance standards
� Recommendations for developing new analytic methodologies
Safety Data Analysis Improvement PlanSafety Data Analysis Improvement Plan
Expand, Improve, and Coordinate Expand, Improve, and Coordinate Safety Data AnalysisSafety Data Analysis
� Recommendations for technology applications
� Best practices and benchmarking
� Training guidelines
Safety Data Analysis Improvement PlanSafety Data Analysis Improvement Plan
5
Expand, Improve, and Coordinate Expand, Improve, and Coordinate Safety Data Analysis Safety Data Analysis
� Sponsorship of a safety data analysis “strike force”
� Presentations for national and international conferences and other fora
Outreach RecommendationsOutreach Recommendations
Expand, Improve, and Coordinate Expand, Improve, and Coordinate Safety Data Analysis Safety Data Analysis
� Curriculum for estimating
� Estimating transportation safety risks
� Cost analysis and Management
� Web site and publication program
Outreach RecommendationsOutreach Recommendations

1
TTRANRANSSTATSTATSThe Intermodal Transportation Database
April 3, 2002 Bureau of Transportation Statistics
TTRANRANSSTATSTATS –– What is it?What is it?
• Web-based
• Intermodal
• Easy access
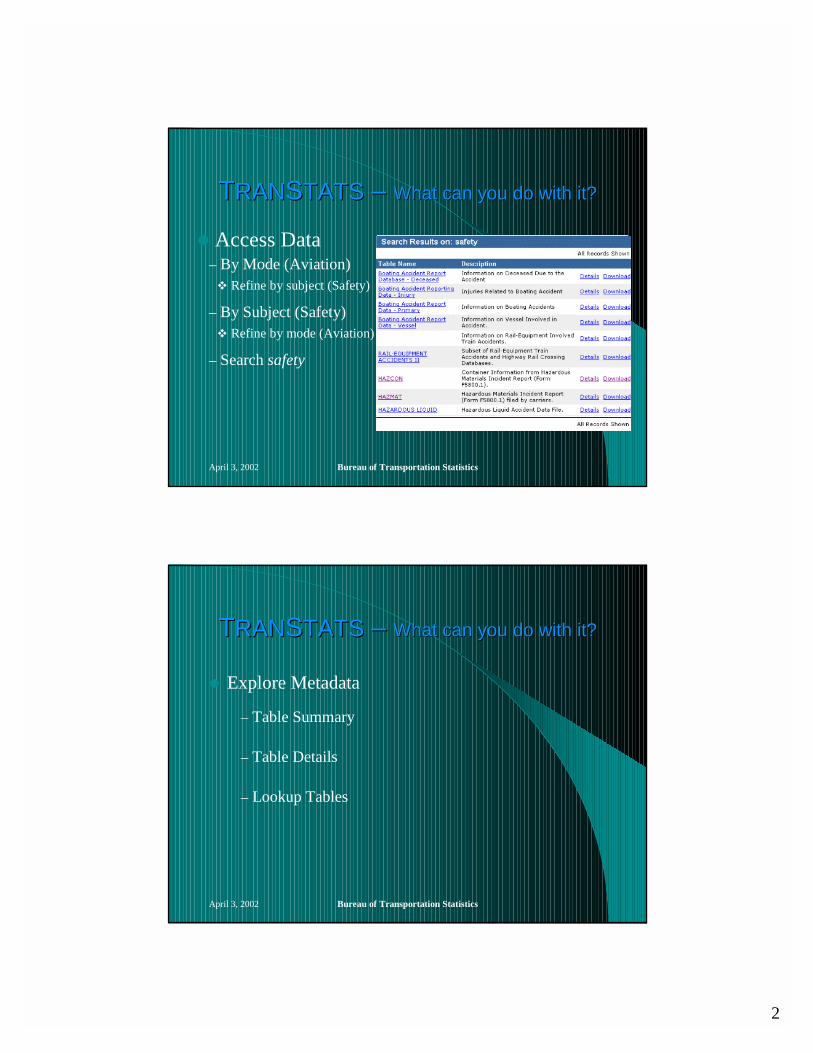
2
April 3, 2002 Bureau of Transportation Statistics
TTRANRANSSTATSTATS –– What can you do with it?What can you do with it?
� Access Data
– By Subject (Safety)
– Search safety
– By Mode (Aviation)� Refine by subject (Safety)
� Refine by mode (Aviation)
April 3, 2002 Bureau of Transportation Statistics
TTRANRANSSTATSTATS –– What can you do with it?What can you do with it?
� Explore Metadata
– Table Summary
– Table Details
– Lookup Tables
3
April 3, 2002 Bureau of Transportation Statistics
� Perform Interactive Analysis : Analysis Tables
– Start Analysis
– Filter Selection
– Analysis Summary
� Filter Statistics
� Ranks� Percent of Total
� Filter Variables � Filter Years
TRANSTATSTRANSTATS –– What can you do with it?What can you do with it?
April 3, 2002 Bureau of Transportation Statistics
� Perform Interactive Analysis : Time Series
– Analysis Types
– Filter Selection
– Analysis Summary
� Filter Statistics
� Ranks� Percent of Total
� Filter Variable
TRANSTATSTRANSTATS –– What can you do with it?What can you do with it?
4
April 3, 2002 Bureau of Transportation Statistics
� Perform Interactive Analysis : Charts
– Charts for One Year
– Time-Series Charts
� Filter Selection� Ranks� Percent of Total
� Chart� Change table� Drill Down
TRANSTATSTRANSTATS –– What can you do with it?What can you do with it?
April 3, 2002 Bureau of Transportation Statistics
� Perform Interactive Analysis : Maps
– Mapping Center
– Map Analysis
� Predefined areas� Filter selection� Mapping tools
� Perform Analysis� Create ad-hoc maps
TRANSTATSTRANSTATS –– What can you do with it?What can you do with it?

5
April 3, 2002 Bureau of Transportation Statistics
� Download Data– Locate table
– Start download
� Filter time/period� Filter geographical
location
– Use Filters
– Select fields
TRANSTATSTRANSTATS –– What can you do with it?What can you do with it?
April 3, 2002 Bureau of Transportation Statistics
� Access data
� Explore metadata
� Interactive analysis
� Download Data
– Analysis Table– Time Series– Charts– Maps
TRANSTATSTRANSTATS –– What can you do with it?What can you do with it?

6
April 3, 2002 Bureau of Transportation Statistics
� Online Support– Page-sensitive help– Getting Started– Keyword Search
� Contact Information– Data source contact– Contact BTS
TRANSTATSTRANSTATS –– Where do you get help?Where do you get help?
April 3, 2002 Bureau of Transportation Statistics
The Intermodal Transportation Database
End of Presentation
Thank You!
TTRANRANSSTATSTATS

1
Data Gaps ProjectData Gaps Project
Status Update
Data Gaps ProjectData Gaps Project
� Background: Project Encompasses– All categories of transportation data (including
safety)– All types of gaps– All transportation data users

2
Data Gaps ProjectData Gaps Project� Efforts to date
– Literature searches– Meetings & workshops– Web-conferencing– On-line questionnaire– On-line database– “Expert” review– Preliminary findings
� What’s next?– Web-conferencing– Risk/benefit
assessment– Solution development– Cost estimation– Implementation
responsibility– Final report
Data Gaps ProjectData Gaps Project
� How you can help?
– Visit Web site: www.bts.gov/datagaps/� Fill out questionnaire� Send e-mail comments
– Participate in web-conference focus group
– Encourage associates to participate
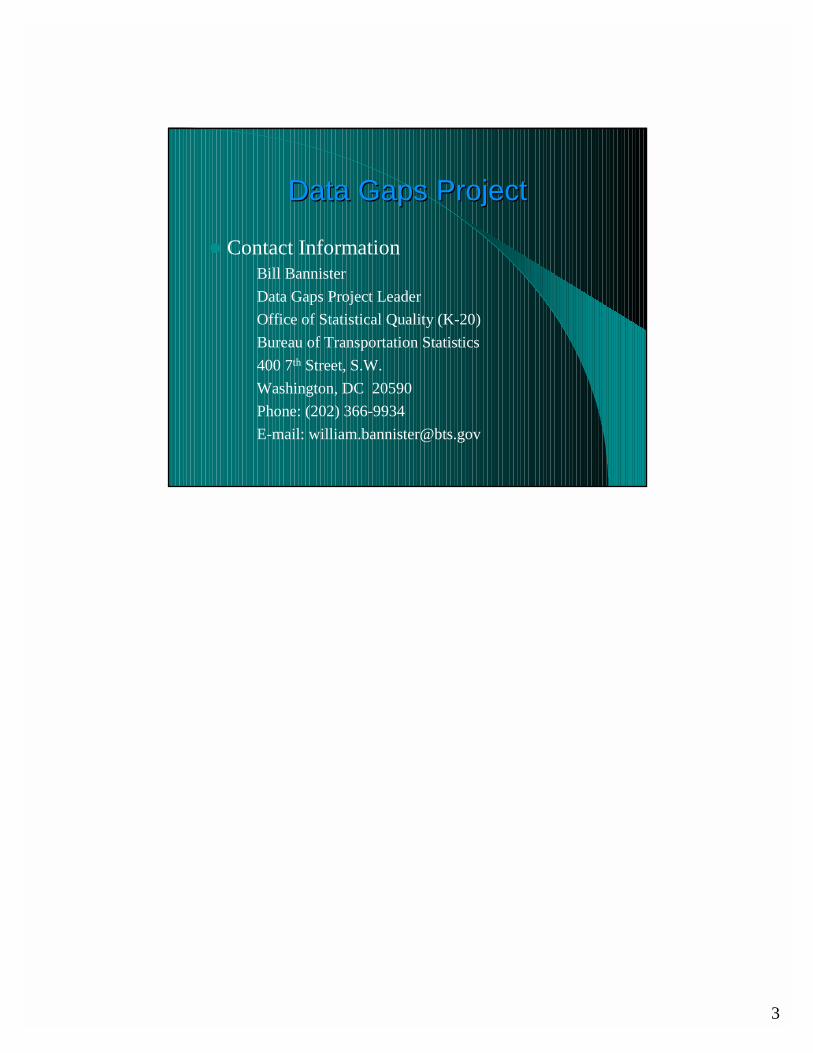
3
Data Gaps ProjectData Gaps Project
� Contact InformationBill BannisterData Gaps Project LeaderOffice of Statistical Quality (K-20)Bureau of Transportation Statistics400 7th Street, S.W.Washington, DC 20590Phone: (202) 366-9934E-mail: [email protected]