geopolymerization of the estonian oil shale solid heat carrier...
TRANSCRIPT

UNIVERSITY OF TARTU
INSTITUTE OF ECOLOGY AND EARTH SCIENCES
DEPARTMENT OF GEOLOGY
Marian Külaviir
Geopolymerization of the Estonian oil shale solid heat carrier
retorting waste ash: characterization of structural changes
through infrared (ATR-FTIR) and nuclear magnetic resonance
spectroscopic (29
Si MAS-NMR) analysis
BSc thesis
Supervisors: Päärn Paiste
Martin Liira
TARTU 2014

1
TABLE OF CONTENTS
1. INTRODUCTION ...................................................................................................................... 2
2. GEOPOLYMERS ...................................................................................................................... 3
2.1. Synthesis of geopolymers ................................................................................................... 5
2.1. Properties of geopolymers .................................................................................................. 7
3. ENERGY SECTOR WASTES IN ESTONIA .......................................................................... 8
4. MATERIALS AND METHODS ............................................................................................. 10
4.1. Synthesis of geopolymer samples .................................................................................... 11
4.2. Attenuated Total Reflectance – Fourier Transform Infrared Spectroscopy (ATR-FTIR) 12
4.3. Magic Angle Spinning - Nuclear Magnetic Resonance spectroscopy (MAS-NMR) ....... 13
4.3.1. 29
Si MAS-NMR spectroscopy .................................................................................. 15
5. RESULTS AND DISCUSSION .............................................................................................. 17
5.1. ATR-FTIR spectra of geopolymers .................................................................................. 17
5.1.1. ATR-FTIR spectra of black ash geopolymers .......................................................... 18
5.2. 29
Si MAS-NMR spectra of black ash geopolymers .......................................................... 22
5.3. Strength Development ...................................................................................................... 29
6. CONCLUSIONS ...................................................................................................................... 30
ACKNOWLEDGEMENTS ............................................................................................................. 31
REFERENCES ................................................................................................................................. 32
APPENDIXES ................................................................................................................................. 36
KOKKUVÕTE ................................................................................................................................. 40

2
1. INTRODUCTION
New inorganic materials called geopolymers which could potentially replace conventional
cements, plastics and many mineral based products are becoming important in the
reduction of world pollution. Pollutants, resulting from the manufacturing and use of the
older materials, including large CO2 emissions from producing the Portlanc cement, toxic
metal contamination of freshwater resources resulting from mining operations and fires
involving ordinary organic plastics. Producing cement from geopolymers instead of
Portland cement would be 60% energy-efficient and emit up to 80% less carbon dioxide
(Li et al. 2012).
For synthesising geopolymers aluminosilicate raw material is needed. In Estonia just such
sources are available: oil shale ash from energy and shale-oil industry. It is possible to
produce geopolymeric construction materials of these residues enabling to make use of
industrial by-products and also reduce CO2 footprint and energy consumption. In addition
the geopolymeric building materials would diversify the local market and possibly being
potential export article.
Use of oil shale for fuel in thermal power plants is gradually decreasing and production of
shale oil has become more competitive as the world market prices of crude oil rise. As
demand for shale oil products has increased significantly the wastes from the industry is
increasing also. Thus it is important to find sustainable use for residuals from shale oil
production. One option is synthesising geopolymeric materials which may be used as
cements. This thesis focuses on less studied residual fly ash (hereinafter black ash) from
the oil shale retorting using Petroter solid heat carrier technology. The aim of the current
thesis is to investigate the synthesis of geopolymeric products from retorting ash
(hereinafter black ash), formed in the production of shale oil using Petroter solid heat
carrier technology.

3
2. GEOPOLYMERS
Geopolymers were first mentioned in 1950s when Victor Glukhovsky assumed that since
the geological process of transformations of some volcanic rocks into zeolites takes place
during formation of sedimentary rocks at low temperatures and pressure, it might be
modelled and carried out in cementitious systems. These systems may ensure durability
and other new useful properties. The founder of geopolymer science –Joseph Davidovits
coined the term geopolymers as three-dimensional alumino-silicates that are formed at low
temperature and short time by naturally occurring alumino-silicates (Davidovits 1988).
Geopolymers may be broadly referred as „inorganic polymers“ (Duxson et al. 2007).
Although they came upon the synthesis of geopolymers by observing the formation of
zeolites, the two processes should not be confused since the resulting products are different
in composition and structure. Unlike zeolites the geopolymeric products do not have
stoichiometric composition and comprise mixtures of amorphous to semi-crystalline
structure and crystalline Al–Si particles (Davidovits 1991).
Geopolymers consists of sialate (silicon-oxo-aluminate) network where SiO4 and AlO4
tetrahedra are alternately covalently linked by sharing all oxygen atoms (Figure 1).
Positive ions such as Na+, K
+ and Ca
2+, are present in the framework cavities to balance the
negative charge of Al3+
in IV-fold coordination.
Figure 1. Types of polysialate monomers (Davidovits 2011).
Polysialates in geopolymers are chain and ring polymers, their empirical formula is
displayed as Mn(–(SiO2)z–AlO2)n∙wH2O, where z is 1, 2 or 3, M is a monovalent cation
such as K+ or Na
+ and n is the degree of polycondensation. Geopolymerisation is an
exothermic process which evolves through the condensation, step by step, from monomers
to dimers, trimers and higher molecules (Figure 2). The starting monomers may be

4
siloxonate (Si–O–Si–O), sialate (Si–O–Al–O) and disiloxo-sialate (Si–O–Al–O–Si–O–Si–
O) (Davidovits 2011). Other possible functional groups existing in the system are Al–O–Al
groups (in high Al systems) and non bridging oxygen (NBO) of the form Si–OH, Si–O–
Na+ or Al–OH. In addition, there may be small amounts of other less stable compounds,
such as 5-coordinated Si species (Rees 2007).
Figure 2. Different structures of polysialate (Davidovits 2011).

5
2.1. Synthesis of geopolymers
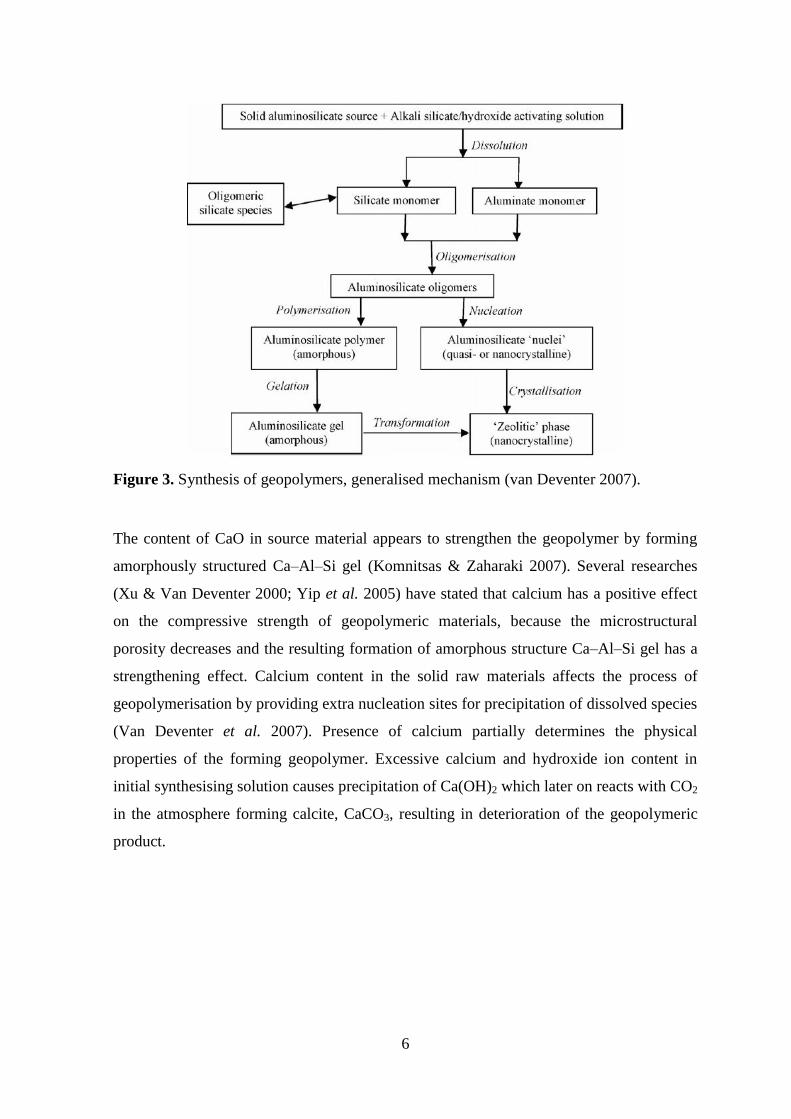
The simplyfied general mechanism of the synthesis of geopolymers is presented linearly
below (Figure 3), but it should be noted that the actual processes are often coupled and
occur simultaneously. Aluminosilicate raw material is dissolved in alkaline solution,
through hydrolysis, aluminate and silicate species are released into aqueous phase forming
a complex colloidal solution of silicate, aluminate and aluminosilicate species. Dissolution
of amorphous aluminosilicates is rapid at high pH therefore a supersaturated
aluminosilicate solution is formed. In supersaturated solution a gel is formed and
aluminosilicate oligomers form networks in the aqueous phase by condensation. This
process liberates water which was previously used for dissolution. Released water remains
within pores in the gel, because of that the gel structure is referred to as bi-phasic:
aluminosilicate network and water. For the formation of gel the solution must be
concentrated since in diluted solutions there is no equilibrium between silicon and
aluminium. The system continues to reorganize after gelation, more new strengthening
bonds are created resulting in three-dimentional aluminosilicate network inherent to
geopolymers (Duxson et al. 2007). It is important to note that generated geopolymers are
not so structurally long-range ordered to be crystalline, their structure is amorphous or
containing some level of short-range ordering.
6
Figure 3. Synthesis of geopolymers, generalised mechanism (van Deventer 2007).
The content of CaO in source material appears to strengthen the geopolymer by forming
amorphously structured Ca–Al–Si gel (Komnitsas & Zaharaki 2007). Several researches
(Xu & Van Deventer 2000; Yip et al. 2005) have stated that calcium has a positive effect
on the compressive strength of geopolymeric materials, because the microstructural
porosity decreases and the resulting formation of amorphous structure Ca–Al–Si gel has a
strengthening effect. Calcium content in the solid raw materials affects the process of
geopolymerisation by providing extra nucleation sites for precipitation of dissolved species
(Van Deventer et al. 2007). Presence of calcium partially determines the physical
properties of the forming geopolymer. Excessive calcium and hydroxide ion content in
initial synthesising solution causes precipitation of Ca(OH)2 which later on reacts with CO2
in the atmosphere forming calcite, CaCO3, resulting in deterioration of the geopolymeric
product.

7
2.1. Properties of geopolymers
The raw materials and processing conditions determinine the structure, chemical and
physical properties of geopolymeric products. In macroscopic scale, geopolymers
synthesised from different aluminosilicate sources may appear similar but their
microstructure homogeneity and thus the physical, mechanical and chemical properties
vary to a large extent (Subaer & van Riessen 2007).
Geopolymers are thermally stable up to 1000-1200 °C, also the early compressive strength
is remarkable – up to 20 MPa. Surface hardness in Mohs scale is 4-7, they have high
surface smoothness and precise mouldability. Other useful properites are freeze-thaw,
sulphate and corrosion resistance. With these properties geopolymers can be useful tooling,
moulding art objects, ceramics as well as building materials. Cements made of
geopolymers show very low
shrinkage in air after drying, preventing thus formation of cracks. (Komnitsas & Zaharaki
2007)

8
3. ENERGY SECTOR WASTES IN ESTONIA
Direct combustion of kukersite oil shale, found in Estonia, releases enough energy to be
used as a fuel. During burning the bituminous organic matter in kukersite releases energy
but the other, inorganic matter is useless in the means of enegy production and turns into
residual ash. Nearly half of the oil shale dry mass is left after combustion or shale-oil
extraction as a solid residue. As Estonian oil shale is being the largest exploitable oil shale
resource in the world (Teedumäe & Raukas 2006) the great amount of residual ash has a
strong negative impact to the local environment. In Estonia the largest part of the mined oil
shale is currently burned in thermal power plants for electricity and heat generation using
pulverized fuel or circulating fluidized bed combustion. The remaining mined oil shale is
retorted to produce shale oil and gas (Ots 2006).
Petroter technology uses the pyrolysis process to treat fine-grained oil shale (0-25 mm
fraction) with a solid heat carrier. Through a mixture of oil shale and heated ash in the
absence of air, the heating and destruction of organic matter contained in oil shale occurs
followed by the emission of liquids and gases. The share of the fine-grained fraction in
mined oil shale is approximately 70%.
The oil shale pyrolysis process is effected in a drum rotating reactor in the absence of air,
at a temperature of 450–500°C, by mixing oil shale with hot ash (as a solid heat carrier).
Vapour-gas mixture that appears in the reactor during the pyrolysis process is fed through
several process vessels to be refined from ash and mechanical impurities, and is then
subject to a distillation process to produce liquid products and gas with high calorific
value. Liquid products are fed to other units for loading as final products or for further
processing. Gas is fed to the heat power plant for heat and power production. Steam is fed
to the heat power plant for power production. The by-products of this process include
phenol water, flue gases and ash from thermal processing (black ash). (Viru Keemia Grupp
2014)
The American Society for Testing and Materials classifies fly ashes to class F and C. The
first is produced by burning bituminous coals, the second is produced by burning lignite
and subbituminous coals. The main difference between class F and C fly ash is the calcium

9
content, which is significantly higher in class C fly ash (ASTM 2008). By its composition
the black ash is similar to class C fly ash. While low calcium (class F) fly ash is most
commonly used for geopolymeric synthesis, extensive research has been aimed at high
calcium (class C) fly ash. Previous works (Guo et al. 2010) have shown the potential of
geopolymer production from C class fly ash creating good precontitions for the use of
black ash as a raw material for geopolymer synthesis.

10
4. MATERIALS AND METHODS
The raw material – black ash was collected from the Petroter solid heat carrier retort at
Viru Keemia Grupp AS (Kohtla-Järve, Estonia) The mineralogical and chemical
composition of the ash is presented in Table 1 and 2 (Paaver 2014).
To understand the composition and the structure of the geopolymeric products, the following
characterization techniques were used in this study: Attenuated Total Reflectance – Fourier
Transform Infrared Spectroscopy (ATR-FTIR) and 29
Si solid state magic angle spinning
nuclear magnetic resonance (MAS-NMR)
Table 1. Mineralogy of black ash. Table 2. Chemical composition of black ash.
Phase Name Wt% Oxide Wt%
Quartz 11,71 SiO2 21,23
Orthoclase 14,25 Al2O3 5,27
Muscovite 2,64 TiO2 0,16
Calcite 26,81 Fe2O3 3,65
Dolomite 8,52 MnO 0,07
Lime 2,08 CaO 31,89
Periclase 7,50 MgO 8,15
C2S β (Belite) 3,15 Na2O 0,11
Merwinite 5,22 K2O 2,58
Melilite 4,19 Cl 0,34
Wollastonite 1,53 P2O5 0,11
Oldhamite 3,59 S 1,97
Anhydrite 1,10
Hematite 1,09
Magnetite 0,94
Amorpus phase 5,7
11
4.1. Synthesis of geopolymer samples
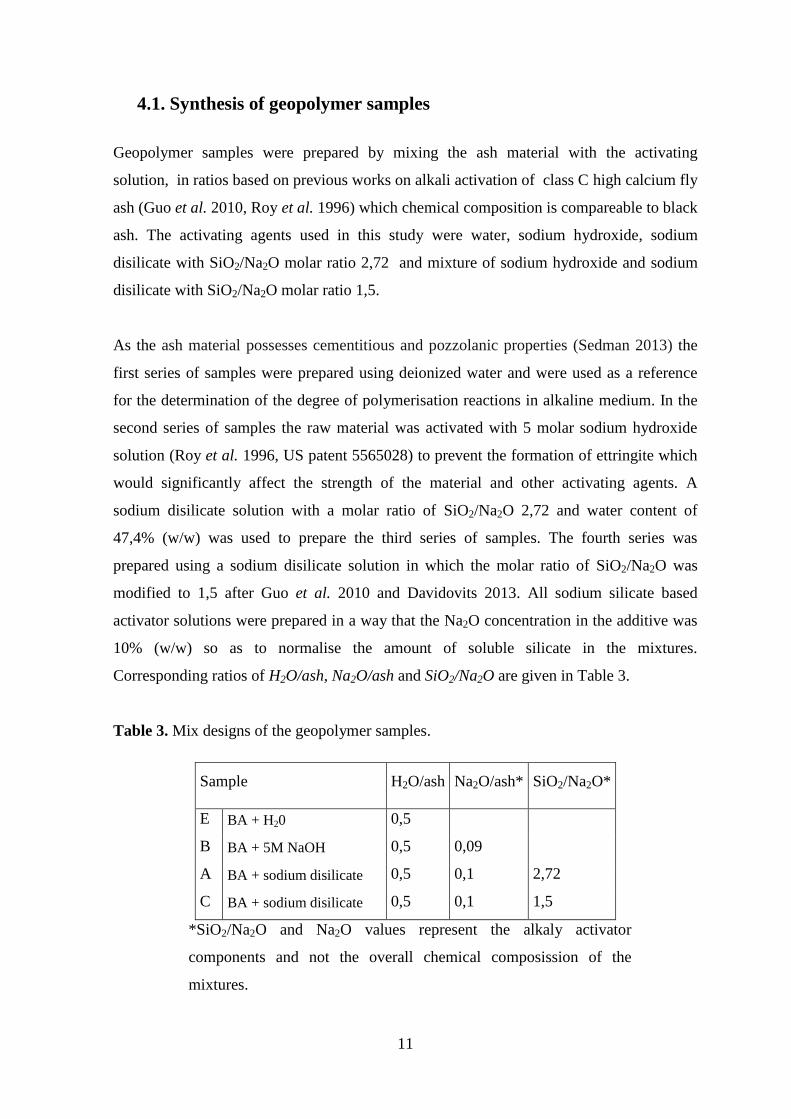
Geopolymer samples were prepared by mixing the ash material with the activating
solution, in ratios based on previous works on alkali activation of class C high calcium fly
ash (Guo et al. 2010, Roy et al. 1996) which chemical composition is compareable to black
ash. The activating agents used in this study were water, sodium hydroxide, sodium
disilicate with SiO2/Na2O molar ratio 2,72 and mixture of sodium hydroxide and sodium
disilicate with SiO2/Na2O molar ratio 1,5.
As the ash material possesses cementitious and pozzolanic properties (Sedman 2013) the
first series of samples were prepared using deionized water and were used as a reference
for the determination of the degree of polymerisation reactions in alkaline medium. In the
second series of samples the raw material was activated with 5 molar sodium hydroxide
solution (Roy et al. 1996, US patent 5565028) to prevent the formation of ettringite which
would significantly affect the strength of the material and other activating agents. A
sodium disilicate solution with a molar ratio of SiO2/Na2O 2,72 and water content of
47,4% (w/w) was used to prepare the third series of samples. The fourth series was
prepared using a sodium disilicate solution in which the molar ratio of SiO2/Na2O was
modified to 1,5 after Guo et al. 2010 and Davidovits 2013. All sodium silicate based
activator solutions were prepared in a way that the Na2O concentration in the additive was
10% (w/w) so as to normalise the amount of soluble silicate in the mixtures.
Corresponding ratios of H2O/ash, Na2O/ash and SiO2/Na2O are given in Table 3.
Table 3. Mix designs of the geopolymer samples.
Sample H2O/ash Na2O/ash* SiO2/Na2O*
E BA + H20 0,5
B BA + 5M NaOH 0,5 0,09
A BA + sodium disilicate 0,5 0,1 2,72
C BA + sodium disilicate 0,5 0,1 1,5
*SiO2/Na2O and Na2O values represent the alkaly activator
components and not the overall chemical composission of the
mixtures.

12
After the addition of activating solution to the black ash, the mixtures were poured in
cylindrical mold with a diameter of 23 mm and height of 35 mm. To ensure that the
container was filled homogeneously the samples were placed on a vibrating stand for 1
minute. The samples were then placed to dry at ambient temperatures. Alltogether 45
samples were prepared, nine with each activating solution.
After 7, 28 and 90 days 3 samples of each type were crushed. The strongest was picked
through compression strength test and grounded fine in a mortar for further analysis.
4.2. Attenuated Total Reflectance – Fourier Transform Infrared
spectroscopy (ATR-FTIR)
In the current thesis the source material and grounded geopolymer samples after 7, 25 and
90 days of curing were analysed with Attenuated Total Reflectance – Fourier Transform
Infrared Spectroscopy (ATR-FTIR). The ATR-FTIR spectra of the samples were collected
using a „Smart Orbit“ diamond ATR-microanalysator with CsI optics attached to Thermo
Scientific Nicolet 6700 FT-IR spectrometer which allows measuring between
10000-55 cm-1
. Absorbance spectra were collected from 225-4000 cm-1
at a resolution of
4 cm-1
with 128 scans. The spectrometer was controlled and the spectra processed in
Thermo Electron’s OMNIC program.
ATR-device is based on a total internal reflection principle. The crystal of ATR is covered
with sample and the infrared light is directed from the inside of the crystal on the surface
which is in contact with the crystal. The infrared light is directed at an angle that the
phenomenon of total reflectance occurs. Part of the infrared beam reaches to the sample
what is on the ATR-crystal and is partly absorbed by molecules and converted into energy
of molecular vibration; when the radiant energy matches the energy of a specific molecular
vibration, absorption occurs. The intensity of the infrared light which reflects back from
the sample is registered and compared with the intensity of the infrared which reflects back
if there is no sample on the crystal, hence the optical absorbance is found. The total
internal reflection phenomenon occurs only if the ATR-cristal has higher refractive index
than the sample. ATR-FTIR spectroscopy is a fast and relatively simple method. The

13
samples do not need specific pretreatment and samples with different consistency and state
can be analysed. The advantage of ATR attachment to FTIR spectroscope is that the
amount of the sample may be very small. One important aspect is that the contact between
sample and crystal must be good. (Teearu 2009)
ATR-FTIR allows to identify different chemical bonds in the sample – different bonds
absorb distinct infrared wavelengths. Materials are characterised by the vibrations of the
bonds, which involves streching, bending and other deformations. Bonds can stretch in-
phase (symmetrical stretching) or out-of-phase (asymmetric stretching). One drawback is
the complexity of interpreting the ATR-FTIR spectrum, as the bands from fundamental
vibrations and bands from overtone vibations are hardly distinguished. (Rees 2007)
4.3. Magic Angle Spinning - Nuclear Magnetic Resonance
spectroscopy (MAS-NMR)
Solid state 29
Si MAS-NMR measurements from source material and grounded samples
after 28 and 90 days of curing were made in The National Institute of Chemical Physics
and Biophysics (Tallinn, Estonia) by Senior Research Fellow, PhD Ivo Heinmaa. 29
Si
MAS-NMR spectrometer used in this thesis was a Bruker AVANCE-II NMR spectrometer
attached to 8,5 T magnet (29
Si resonance frequency 71,4 MHz). About 1,8 g of each
sample was rotated at 5 kHz in 10 mm o.d. zirconia rotors using home-built MAS probe
with single-pulse and a relaxation delay of 100 s. Number of scans was 800 to 1600.
Magic Angle Spinning - Nuclear Magnetic Resonance spectroscopy (MAS-NMR) is a
method which allows the measurement of the electron density around each nucleus in a
chemical environment in solid state, giving information on how atoms are linked to each
other in the sample. MAS-NMR is the most effective method for determing the structure of
amorphous solids such as geopolymers synthesised from fly ash.
NMR can be used only if the sum of protons and neutrons of an atom in the molecule is an
odd number. When the proton is placed in an external magnetic field, the spin vector of the
particle aligns itself with the external field, just like a magnet would. Each spin aligns in
14
one of the two possible orientations: there is a low energy configuration and a high energy
configuration. At room temperature, the number of spins in the lower energy level, N+,
slightly outnumbers the number in the upper level, N–.
The signal in NMR spectroscopy results from the difference between the energy absorbed
by the spins which make a transition from the lower energy state to the higher energy state,
and the energy emitted by the spins which simultaneously make a transition from the
higher energy state to the lower energy state. The signal is thus proportional to the
population difference between the states. NMR is a rather sensitive spectroscopy method
since it is capable of detecting these very small population differences. It is the resonance,
or exchange of energy at a specific frequency between the spins and the spectrometer,
which gives NMR its sensitivity. (Hornak 1996) The distribution of particles between the
lower and upper enery level depends on gyromagnetic ratio (γ) and force of exteral
magnetic field (B0) (Equation 1).
(1)
For example in case of hydrogen nuclei if B0=4,69 T, for 1 000 000 particles in the upper
energy level there is 1 000 033 particles in the lower energy level. The difference is only
33 ppm, therefore the measured signal is very weak. (Leito 2013)
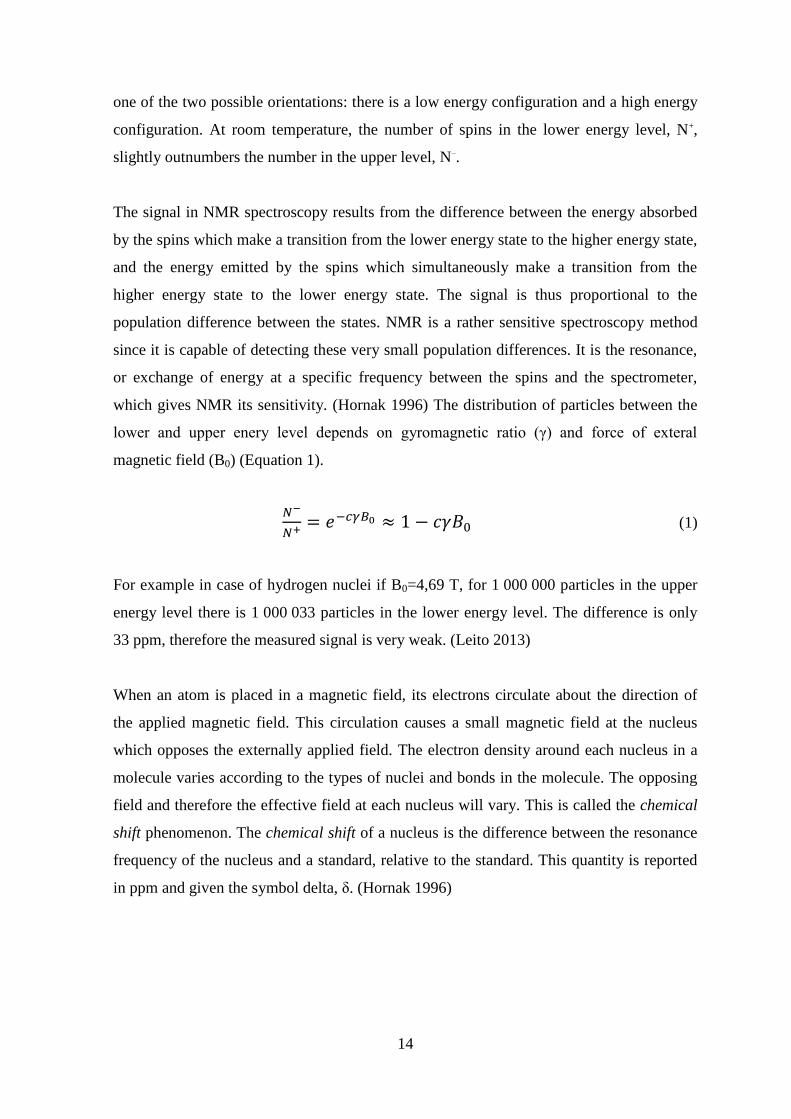
When an atom is placed in a magnetic field, its electrons circulate about the direction of
the applied magnetic field. This circulation causes a small magnetic field at the nucleus
which opposes the externally applied field. The electron density around each nucleus in a
molecule varies according to the types of nuclei and bonds in the molecule. The opposing
field and therefore the effective field at each nucleus will vary. This is called the chemical
shift phenomenon. The chemical shift of a nucleus is the difference between the resonance
frequency of the nucleus and a standard, relative to the standard. This quantity is reported
in ppm and given the symbol delta, δ. (Hornak 1996)

15
4.3.1. 29Si MAS-NMR spectroscopy
29Si MAS NMR spectroscopy is a useful tool for describing the nanostructure of
geopolymers. In 29
Si MAS-NMR the chemical shift δ depends on the chemical
environment of the 29
Si nucleus. 29
Si chemical shift is dependent on the degree of
condensation of the SiO4 unit, with increasing condensation corresponding to more
negative δ. Furthermore, the NMR analysis allows quantitative determination of Si
components because the intensity of signal is proportional to the number of 29
Si nuclei
present. (Davidovits 2011)
To describe the structural units in aluminosilicates the conventional notation is Qn(mAl),
with „n“ representing the covalence number of the silicon center with values of 0,1,2,3 or
4. In case of Q0 the silicon is in isolated mono group. Q1 represents disilicates and chain
end groups. Middle groups in chains are marked with Q2. Q3 notes branching silicon sites
and Q4 three-dimensional cross-linked sites. The letter „m“ represents the number of Al
surrounding silicon tetrahedra, that is the number of Si–O–Al links in sialate unit. Possible
Qn(mAl) chemical structures and corresponding 29
Si MAS-NMR chemical shift δ values
are given in Figure 4.
After the determination and quantification of the silicon species the mean chain length
(MCL) of silicate structures comprising of SiO4/AlO4 tetrahedra can be estimated from the
relative fractions of the different Q–species according to Equation 2 (Richardson et al.
1997).
(2)

16
Figure 4. Qn(mAl) chemical structures and corresponding chemical shift δ values
(Davidovits 2011).

17
5. RESULTS AND DISCUSSION
To apprehend the ATR-FTIR and 29
Si MAS-NMR spectum of material, some knowledge
about the composition and structure is necessary. Since black ash contains a significant
amount of calcium which is not essential in any part of a basic geopolymeric structure, it is
proposed that if sufficient calcium is added to a geopolymeric system, a calcium silicate
hydrate (C–S–H) based cementitious material may form instead.
Figure 5 shows the likely reaction products formed when calcium is added to a
geopolymeric system (Yip et al. 2005).
Figure 5. Reaction products of geopolymeric system when calcium is added (Yip et al.
2005).
5.1. ATR-FTIR spectra of geopolymers
To understand the FTIR spectrum of geopolymeric material, we should know that
geopolymer is a hydrous alkali aluminosilicate, with a tetrahedral silicate network with a
number of the tetrahedral positions occupied by Al3+
in four fold coordination, charge
stabilised by an alkali cation. Also there may be some Al–O–Al groups and non-bridging
oxygens of the form Si–OH, Si–O- Na
+ or Al–OH existing in the system. It should be noted
that any factor which strains, lengthens or alters the Si–O–Si bond will affect the FTIR
spectra (Rees 2007). The FTIR spectra of silicates are very sensitive to the substitution of
ions of different charge, but much less sensitive to substitution of ions of the same charge.
The substitution of trivalent ions into the tetrahedral positions in a silicate network causes

18
the main Si–O stretching band (1100-900cm-1
) to shift to lower wavenumbers due to the
average increase in the (Si, Al)–O bond length and the increased ionic character of the
bond (Rees 2007). However, the remaining Si–O bonds in what were previously the
pairing silicate tetrahedra may experience an increase in strength due to the resulting
change in polarisation at the O site on the Si–O–Al linkage, leading to higher wavenumber
contributions to the main Si–O band and consequent broadening of the band around
970 cm−1
. In FTIR spectrum crystalline materials present sharp well-defined bands as
amorphus phases give broad, poorly defined bands (Fernández-Carrasco 2012).
5.1.1. ATR-FTIR spectra of black ash geopolymers
Figures 6-9 display ATR-FTIR spectra of initial black ash (red), and differently activated
samples after 7 (blue), 28 (green) and 90 (purple) days. Multiple changes in the FTIR
spectra between the original black ash and activated samples can be observed in all sample
series. New bands around 3300-3400 cm-1
and 1640 cm-1
, reprecenting O–H streching and
bending vibrations in H2O become visible in every sample. The sharp bands at 1795cm-1
;
1400 cm-1
; 870, cm-1
and 712 cm-1
represent C–O vibrations in CO32-
ion (García-Lodeiro
et al. 2007), confirming the presence of calcite which was also observed in X-ray
diffraction analysis (appendix A). Tough these bands are prominent in every spectrum they
have little significance in this research. The shoulder at 1120 cm-1
and low band at
594 cm-1
in the original black ash spectrum correspond to the streching and bending of
S–O bond of SO42-
in anhydrite (Fernández-Carrasco 2012) which is also in correlation
with mineralogical composition (Appendix A). The relevant peaks indicating to Si
functional groups remain between 400-1200 cm-1
.
The FTIR spectra of water activated black ash (Figure 6) show a band around 970 cm-1
associated with the Si–O–Si (Si–O–Al) (Yu et al. 1999) asymmetric streching vibrations in
SiO4 tetrahedra. According to Yu et al. 1999 this band represents Q2 silicon site. The band
shifts to higher wavenumbers after 7 days and then shifts back to lower wavenumbers,
indicating that initially formed structures deform in time. The band at 1110 cm-1
is a
combination of Si–O stretching vibrations from amorphous silicate phases assosiated with
Q3 silicon sites (Rees 2007) and S–O vibrations in SO42-
, arising from different sulfate

19
minerals like gypsum and ettringite in the sample (Appendix A). The band at 1110 cm-1
is
likely the result of dissolution and depolymerisation of the amorphous glass phase present
in the source material and subsequent polymerisation as braching Q3 silicon species.
Figure 6. ATR-FTIR spectra of black ash (red) and H2O activated black ash after 7 (blue),
28 (green) and 90 (purple) days.
The FTIR spectra of initial black ash and samples prepared using sodium disilicate solution
with SiO2/Na2O ratio 2,72 (Figure 7) show a Si–O–Si streching band around 960 cm-1
corresponding to Q2 silicon site. The main band in original black ash is centered at
975 cm-1
, after 7 days the band has shifted to lower wavenumbers (959 cm-1
) which referrs
that during alkali-activation, every bridging oxygen atom of initial aluminosilicate is
replaced by two non-bridging oxygen atoms with negative charge – the process is called
depolymerisation. Through that process the TO4 (T = Si or Al) tetrahedras within the
network have become more isolated with increasing alkali concentration. Consequently,
the T–O bonds in the tetrahedra should possess lower molecular vibration force constants,
resulting in shift of the infrared band to smaller wavenumbers. (Lee & van Deventer 2003)

20
After 28 and 90 days it appears that the band shifts progressively to higher wavenumbers
from 959 cm-1
to 962 cm-1
and to 979 cm-1
which points out that the material continuously
polymerises and the bonds are strengthening and polymer is lengthening (see Chapter 5.1).
Spectra of black ash activated with sodium disilicate solution with SiO2/Na2O ratio 1,5
(Figure 9) represents the same shift of Si–O–Si (Si–O–Al) band to lower wavenumbers at
the beginning and later shift to greater wavenumbers, indicating to the same tendency of
polymerisation.
Also it is observed that in the 7 day spectrum of samples which have additional Na+
(Figures 7-9) the Si–O–Si peaks have shifted to lower wavenumbers than in the spectra of
H2O activated ash. This phenomenon is in agreement with the previous studies (Rees 2007)
stating that the higher Na+
content leads to the shift of the Si–O–Si band to lower
wavenumbers.
Figure 7. ATR-FTIR spectra of black ash (red) and sodium disilicate with SiO2/Na2O 2,72
activated black ash after 7 (blue), 28 (green) and 90 (purple) days.

21
Figure 8 displays infrared spectra of NaOH activated black ash sample, there one sharp
band at at 3640 cm-1
is present, characteristic to O–H stretching in portlandite (Ca(OH)2)
(García-Lodeiro et al. 2009) The main band is split into two components, around 945 cm-1
and around 990 cm-1
that are associated with Si–O–Si and Si–O–Al streching vibrations in
Q2(1Al) and Q2 silicon site respectively (Lecomte et al. 2006). The increase in intensity of
the 990 cm-1
band after 28 days shows that the relative abundance of Q2 silicon sites has
increased. Due to the sharpness and well-defined shape of these bands, the corresponding
silicon sites are likely not assosiated with one predominant amorphous phase and represent
in themselves different silicate structures. The band at 1117cm-1
can be attributed to S–O
streching vibrations in gypsum (Fernández-Carrasco et al. 2012) and Si–O vibrations of
amorphous silicate phases, similar to water based samples. The shifting of the band to a
higher freguency of 1126 cm-1
after 90 days can be assosiated with polycondensation of the
silicon species in the amorphous phase. The band at 670 cm-1
, not present in other samples,
consists of S–O bending vibrations in gypsum.
Figure 8. ATR-FTIR spectra of black ash (red) and NaOH activated black ash after 7
(blue), 28 (green) and 90 (purple) days.

22
Figure 9. ATR-FTIR spectra of black ash (red) and sodium disilicate solution with
SiO2/Na2O ratio 1,5 activated black ash after 7 (blue), 28 (green) and 90 (purple) days.
5.2. 29
Si MAS-NMR spectra of black ash geopolymers
The spectra of initial black ash is shown in Figure 10. The spectra shows a broad peak in
the range from –80 to –105 ppm. This peak can be appointed to the different silicon sites in
amorphus ash glass (Reinik et al. 2007). The resonance line at –72,69 ppm arise from
belite and alite (Mägi et al. 1984), the peak at –108,11 ppm can be assigned to quartz
(Lippmaa et al. 1980). The contributions of every peak to total spectrum are given in
Appendix B.

23
Figure 10. 29
Si MAS-NMR spectrum of untreated black ash.
Figure 11 shows the 28 day 29
Si MAS-NMR spectrum of black ash activated with water.
Locations and proportions of corresponding peaks are shown in Table 4. The spectrum
presents number of peaks compared to initial black ash spectrum. The belite and alite peak
intensity has lowered and quartz peak shows no change. New resonance lines at –79,89;
–85,2; –95,4 and –100,95 ppm can be appointed to Q1, Q2 (Komarineni et al. 1985),
amorphous phase dominated by Q3 and Q3 (Davidovits 2011) silicon sites respectively.
Figure 11. 29
Si MAS-NMR spectra of water activated black ash after 28 and 90 days.

24
Table 4. Locations and proportions of peaks in 29
Si MAS-NMR spectrum of water
activated black ash and original black ash.
After 90 days it seems that initially formed structures have disintegrated and the spectrum
has taken a shape compareable to the spectrum of initial black ash. The peaks of Q1 and
Q2 silicon sites are still present at –82,54 and –86,16 ppm but their intensities have
lowered. A new major resonance line has appeared, centered at –91,63 ppm which is
similarly to original black ash and appointed to the different silicon sites in amorphus ash
glass. The NMR spectra of water activated black ash is in accordance with FTIR spectra
(Figure 6) showing that structures formed at the beginning are depolymerising and
dissapearing.
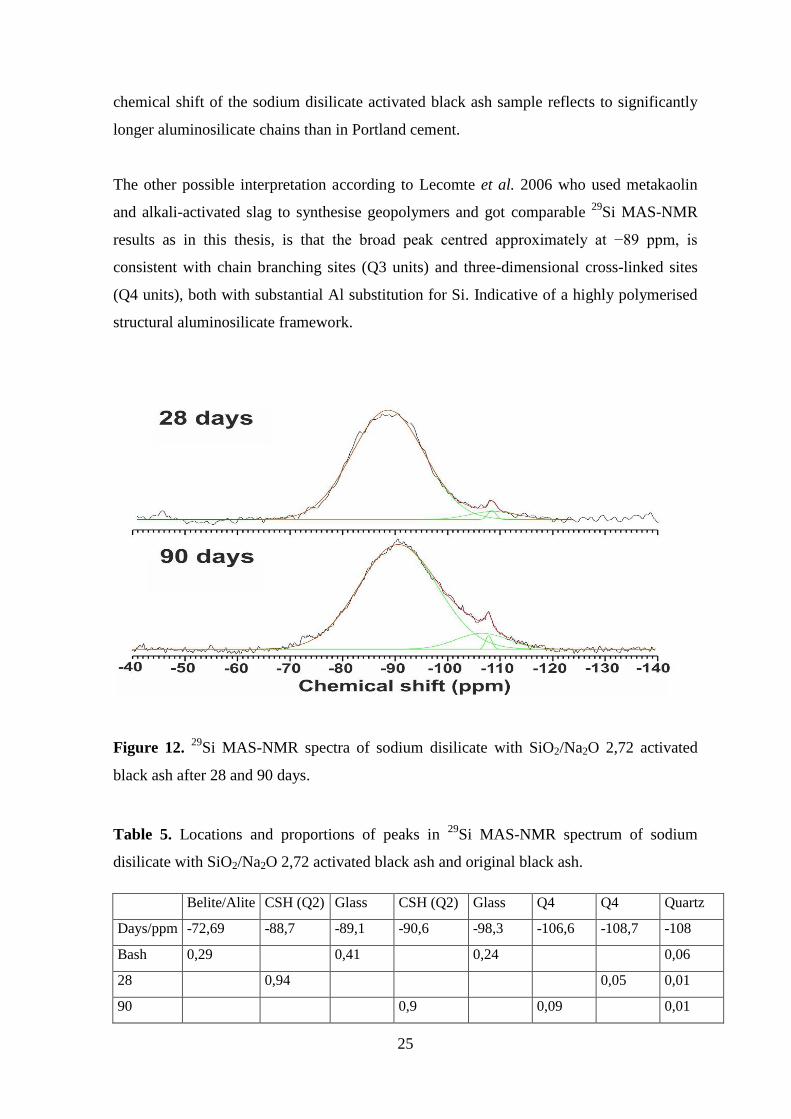
Figure 12 shows the NMR spectra of black ash activated with sodium disilicate SiO2/Na2O
2,72, after 28 days. Locations and proportions of corresponding peaks are shown in Table
5. Compared to original black ash the peak respective to belite and alite has vanished, the
peak of quartz is flattened and one prominent peak has risen in the spectra. Along smaller
peaks at around –108,7 and –108,4 ppm which have been assigned to Q4 silicon sites and
quartz respectively (Lippmaa et al. 1980) one broad peak can be distinguished which
resonance is characteristic of semi-crystalline C–S–H gel. However the C–S–H gel in the
sodium disilicate activated sample is different from the binding gel phase in Portland
cement. The peak is centred approximately at –89 ppm originating from the Q2 middle
groups (Davidovits 2011). The predominance of Q2 middle groups indicate that most of
the silicate tetrahedra are chain mid-members. According to Lecomte et al. 2006, the
29Si MAS-NMR spectra of usual Portland cement shows a peak resonating at –80 and
–86 ppm previously assigned to Q1 end groups and Q2 middle groups, meaning that the
silicate groups are organized in shorter linear finite chains. Also the more negative
Belite/
Alite Q1 Q1 Q2 Q2 Glass Glass
Amorph
(Q3) Glass Q3 Quartz
Days/ppm -73,13 -79,89 -82,54 -85,2 -86,16 -89,1 -91,63 -95,4 -98,3 -100,95 -108
Bash 0,29 0,41 0,24 0,06
E28 0,07 0,19 0,38 0,2 0,06 0,11
E90 0,06 0,15 0,08 0,65 0,06
25
chemical shift of the sodium disilicate activated black ash sample reflects to significantly
longer aluminosilicate chains than in Portland cement.
The other possible interpretation according to Lecomte et al. 2006 who used metakaolin
and alkali-activated slag to synthesise geopolymers and got comparable 29
Si MAS-NMR
results as in this thesis, is that the broad peak centred approximately at −89 ppm, is
consistent with chain branching sites (Q3 units) and three-dimensional cross-linked sites
(Q4 units), both with substantial Al substitution for Si. Indicative of a highly polymerised
structural aluminosilicate framework.
Figure 12. 29
Si MAS-NMR spectra of sodium disilicate with SiO2/Na2O 2,72 activated
black ash after 28 and 90 days.
Table 5. Locations and proportions of peaks in 29
Si MAS-NMR spectrum of sodium
disilicate with SiO2/Na2O 2,72 activated black ash and original black ash.
Belite/Alite CSH (Q2) Glass CSH (Q2) Glass Q4 Q4 Quartz
Days/ppm -72,69 -88,7 -89,1 -90,6 -98,3 -106,6 -108,7 -108
Bash 0,29 0,41 0,24 0,06
28 0,94 0,05 0,01
90 0,9 0,09 0,01

26
When comparing the 28 and 90 day sample spectrums it can be noted that in the 90 day
spectrum the main peak is shifted towards more negative chemical shifts and the less sharp
Si–O–Si Q4 silicon site peak has increased in intensity. This indicates that the
polymerisation process continues – the alumosilicate chains are rearranging and
lengthening for a long time after the initial activation. Thus the 29
Si MAS-NMR is in
accordance with the results from ATR-FTIR.
The 29
Si MAS-NMR spectra of NaOH activated black ash after 28 days is shown in
Figure 13. Locations and proportions of corresponding peaks are shown in Table 6.
Compared to the spectra of the original black ash sample the difference is noticeable. The
relative intensity of the resonance line is increased, the belite and alite peak has decreased
and the different silicon sites attributed to amorphus ash glass are no longer present or
decreased in intensity. The spectra presents resonance lines at –78,92; –81,74; –84,01 and
–100,8 ppm which arise from the silicon sites Q1, Q2(1Al), Q2 and Q3 (Lippmaa et al.
1980), respectively. The broad resonance line at –96,5 ppm may be associated with
amorphous silicate phase formed during the hydration of the black ash. The peak at
–108,02 ppm belongs to quartz. The spectra shows that most of the initial glass phases in
the black ash have dissolved, and formed a silicate structure where the Q1 silicon site is at
the end of the silicate chain and Q2 is linear middle groups in the silicate chain. According
to Equation 1, the mean chain length of silicate structures is 5,3. Q2(1Al) is the chain
middle group where one of the two neighbouring tetrahedra contains aluminium ion and
Q3 is a branching silicate site where one SiO4 tetrahedron links together two chains,
meaning that the site has three nearest neighbour SiO4 tetrahedras. The presence of
Q2(1Al) peak in NMR spectra is also in correspondence with the FTIR spectrum of NaOH
activated black ash (Figure 8).

27
Figure 13. 29
Si MAS-NMR spectra of NaOH activated black ash after 28 and 90 days.
Table 6. Locations and proportions of peaks in 29
Si MAS-NMR spectrum of NaOH
activated black ash and original black ash.
Belite/Alite Q1 Q2(1Al) Q2 Glass Glass Glass Glass Q3 Quartz
Days/ppm -73,13 -78,92 -81,74 -84,01 -89,1 -96,5 -97,3 -98,3 -100,8 -108
Bash 0,29 0,41 0,24 0,06
B28 0,03 0,28 0,19 0,17 0,27 0,01 0,05
B90 0,04 0,22 0,16 0,29
0,26 0,02
After 90 days since the activation with NaOH the spectrum shows a peak shift of the
amorphous silicate phase to lower values. The realtive intensity of the peak corresponding
to Q1 silicon site has decresed. At the same time the relative intensity of the peaks
attributed to Q2 sites increase, meaning that there are more Si–O–Si–O–Si middle groups
and the mean chain length of the silicate structures has increased to 6,8. These features
correspond to the lengthening of the silicate chains and show that the material is
continuously polymerizing after 28 days. The presence of the amorphous phase arising

28
from the hydration of the glass phases reveal that 5M NaOH solution was not sufficient to
dissolve the entire amorphous phase present in the source material. The relatively short
chain lengths of the silicate structure indicate that the dissolved silicon species arising from
the alkaly reaction are only weakly polymerised.
Figure 14 shows the 29
Si MAS-NMR spectra of sodium disilicate with SiO2/Na2O 1,5
activated black ash sample. Locations and proportions of corresponding peaks are shown
in Table 7. When compared with the original black ash the intensities of belite/alite and
quartz peaks are lowered. The new peaks at –79,15; –82,29; –85,5 and –92,45 ppm were
assigned to Q1; Q2; Q2 and C–S–H gel, respectively. The broad C–S–H gel peak is similar
to sodium disilicate activated sample in which the aluminosilicate chains are longer than in
Portland cement because the center of the peak at –92,45 ppm indicates to Q3 branching
silicate sites.
Figure 14. 29
Si MAS-NMR spectra of sodium disilicate with SiO2/Na2O 1,5 activated
black ash after 28 and 90 days.

29
Table 7. Locations and proportions of peaks in 29
Si MAS-NMR spectrum of sodium
disilicate with SiO2/Na2O 1,5 activated black ash and original black ash.
Belite/Alite Q1 Q1 Q2 Q2 Glass CSH Glass Quartz
Days/ppm -73,5 -79,15 -81,23 -82,29 -85,5 -89,1 -92,45 -98,3 -108
Bash 0,29 0,41 0,24 0,06
C28 0,02 0,09 0,15 0,37 0,34 0,03
C90 0,02 0,02 0,02 0,38 0,53 0,02
After 90 days the intensity of the C–S–H peak has risen, indicating that the amount of
C–S–H gel in sample hasincreased. The increase can be attributed to the incorporation of
Q2 silicon chain midmember species into the amorphous structure. The mean chain length
of the silicate structure accompaning the C–S–H phase increases from 13,6 at 28 days to 22
at 90 day. These changes show an ongoing polycondensation reaction from 28 to 90 days.
For an easier overview and comparison of the 29
Si MAS-NMR results, the positions and
corresponding silicate structures of all the samples are collectively given in Appendix C.
5.3. Strength Development
When comparing the structural changes and compressive strength of the samples
(Appendix D) it was observed that water activated sample presents strength development
to high values, which may be associated with microstructure and secondary mineralisation
(Paaver 2014).
Sample activated with NaOH show low initial compressive strength and further growth in
strength correlates well with the dissolution and development of the silicate structures in
NaOH activated samples.
The initial strength in sodium disilicate based samples correlates well with the
geopolymeric structure of the silicate phases. Altough the 29
Si MAS-NMR and ATR-FTIR
show that the polycondensation is ongoing and the structure is strengthening, the observed
lower compressive strength values of the samples can be attributed to shrinkage of the
material and changes in microstructure (Paaver 2014)
30
6. CONCLUSIONS
In the current thesis, three different activator solutions alongside water were used to
synthesise geopolymeric binders from black ash. It was proven that some extent of
geopolymerisation takes place in every sample of activated black ash, indicating that black
ash could be used to produce geopolymeric materials. Producing cement from geopolymers
instead of Portland cement would be 60% energy-efficient and emit up to 80% less carbon
dioxide. Producing cements from black ash would be a sustainable utilization for otherwise
useless hazardous waste.
In sodium disilicate (SiO2/Na2O 2,72) activated sample calcium silicate hydrate gel is
formed, which is the phase connected to the strength of Portland cement. The 29
Si MAS-
NMR and ATR-FTIR spectra indicate that the gel contains polymeric parts in which the
polymer is mainly formed of silicate middle groups (Q2) and the silicate chains are
lengthening in time. These factors are responsible for the strength and further
strengthening of the material. The samples of black ash activated with sodium disilicate
SiO2/Na2O 1,5 show similar characteristics. However the NMR spectrum reveals that the
amorphous geopolymeric phase (C–S–H gel) is accompanied by a two dimensional silicate
chain structure which is also characteristic of C–S–H phase.
In NaOH activated black ash samples, it was observed that it contains silicate structures
with short chain lengths and also a content of undissolved amorphous phase from the
source material. This indicates that NaOH solution was not sufficient in dissolving the
amorphus phase present in source material and the depolymerized silicate species have not
substantially polycondensed.
Based on the results of this thesis the synthesis of geopolymeric products from black ash
can be achieved with activator solutions containing soluble silica. Altough further research
is needed to establish the optimal ratios of activator solutions the results show a proof of
concept.

31
ACKNOWLEDGEMENTS
I would like to thank Ivo Heinmaa from National Institute of Chemical Physics and
Biophysics for the NMR analyses and Signe Vahur for assistance in studying the ATR-
FTIR method. I would also like to thank Peeter Paaver for all the help.

32
REFERENCES
ASTM C618, 2008. Standard Specification for Coal Fly Ash and Raw or Calcined Natural
Pozzolan for Use in Concrete. ASTM International.
Davidovits, J., 1988. Geopolymer chemistry and properties. In: Davidovits, J., Orlinski, J.
(Eds.), Proceedings of the 1st International Conference on Geopolymer ’88, vol. 1,
Compiegne, France, 1–3 June, 25–48.
Davidovits, J., 1991. Geopolymers: Inorganic polymeric new materials. Journal of Thermal
Analysis 37, 1633–1656.
Davidovits, J., 2011. Geopolymer Chemistry and Applications, 3rd Edition. Institut
Géopolymére, France.
Davidovits, J., 2013. A review on Geopolymer cement, as of January 2013. Institut
Géopolymére, France.
Duxson, P., Fernandez-Jimenez, A., Provis, J.L., Lukey, G.C., Palomo, A. & van Deventer,
J.S.J., 2007. Geopolymer technology: the current state of the art. Journal of Materials
Science 42(9), 2917–2933.
Fernández-Carrasco, L., Torrens-Martín, D., Morales, L.M., Martínez-Ramírez, S., 2012.
Infrared Spectroscopy in the Analysis of Building and Construction Materials, Infrared
Spectroscopy – Materials Science, Engineering and Technology, Prof. Theophanides
Theophile (Ed.). ISBN: 978-953-51-0537-4, InTech.
García-Lodeiro, I., Fernandez-Jimenez, A., Blanco-Varela, M.T., Palomo, A., 2007.
Synthesis and characterization of cementitious gels (C–S–H and N–A–S–H). Compability
studies. Eduardo Torroja Institute
García-Lodeiro, I., Macphee, D.E., Palomo, A., Fernández-Jiménez, A., 2009. Effect of
alkalis on fresh C–S–H gels. FTIR analysis. Cement and Concrete Research 39, 147–153.

33
Guo, X., Shi, H. & Dick, W.A., 2010. Compressive strength and microstructural
characteristics of class C fly ash geopolymer. Cement & Concrete Composites 32(2), 142–
147.
Hornak, J.P., 1996. The Basics of NMR. [http://www.cis.rit.edu/htbooks/nmr/inside.htm]
17.05.2014
Komarneni, S., Roy, D.M., 1985. New tobermorite cation exchangers. Journal of Materials
Science 20, 2930–2936.
Komnitsas, K., Zaharaki, D., 2007. Geopolymerisation: A review and prospects for the
minerals industry. Minerals Engineering 20, 1261–1277.
Lecomte, I., Henrist, C., Liegeois, M., Maseri, F., Rulmont, A., Cloots, R., 2006. (Micro)-
structural comparison between geopolymers, alkali-activated slag cement and Portland
cement. Journal of the European Ceramic Society 26, 3789–3797.
Lee, W.K.W., van Deventer, J.S.J., 2003. Use of Infrared Spectroscopy to Study
Geopolymerization of Heterogeneous Amorphous Aluminosilicates. Langmuir 19, 8726–
8734.
Leito, I. 2013. NMR ja ESR spektroskoopia, teoreetiline sissejuhatus.
[http://tera.chem.ut.ee/~ivo/ak2/NMR.pdf] 25.10.2013
Li, Q., Hu, X., Li, B., Li, F., Li, P., Shen, L. & Zhai, J., 2012. Synthesis of geopolymer
composites from blends of CFBC fly and bottom ashes. Fuel 97, 366– 372.
Lippmaa, E., Mägi, M., Samoson, A., Engelhardt, G., Grimmer, A-R., 1980. Structural
studies of silicates by solid state high resolution 29
Si NMR. Journal of the American
Chemical Society 102, 4889–4893.
Mägi, M., Lippmaa, E., Samoson, A., Engelhardt, G., Grimmer, A-R., 1984. Solid state
high-resolution silicon-29 chemical shifts in silicates. Journal of Physical Chemistry 88,
1518–1522.

34
Ots, A., 2006. Oil Shale Fuel Combustion Tallinna Raamatutrükikoda, Tallinn, Estonia.
Paaver, P., 2014. Geopolymerization of the Estonian oil shale solid heat carrier retorting
waste ash: changes in mineral-chemical composition and uniaxial compressive strength
development. Bachelor of Science thesis. University of Tartu.
Rees, C.A., 2007. Mechanisms and kinetics of gel formation in geopolymers. Doctor of
Philosophy thesis. University of Melbourne.
Reinik, J., Heinmaa, I., Mikkola, J.P., Kirso, U., 2007. Hydrothermal alkaline treatment of
oil shale ash for synthesis of tobermorites. Fuel 86, 669–676.
Richardson, I.G., Groves, G.W., 1997. The structure of the calcium silicate hydrate phases
present in hardened pastes of white Portland cement/blast-furnace slag blends.
Journal of Materials Science 32, 4793–4802
Roy, A., Schilling, P.J. & Eaton, H.C., 1996. Alkali Activated Class C Fly Ash Cement –
Patent 5565028
Sedman, A., 2013. Strength and self-cementing properties of oil shale retorting wastes.
Doctor of Philosophy thesis. University of Tartu.
Subaer, Van Riessen, A. 2007. Thermo-mechanical and microstructuraln characterisation
of sodium-poly (sialate-siloxo) (Na-PSS) geopolymers. Journal of Materials Science 42
(9): 3117–3123.
Teearu, A., 2009. Investigation of pigments with ATR-FTIR spectroscopy. Master of
Science thesis. University of Tartu.
Teedumäe, A., Raukas, A., 2006. The possibility of integrating sustainability into legal
framework for use of oil shale reserves. Oil Shale 23 (2) 119–124

35
Van Deventer, J.S.J., Provis, J.L., Duxson, P., Lukey, G.C., 2007. Reaction mechanisms in
the geopolymeric conversion of inorganicwaste to useful products. Journal of Hazardous
Materials 139 (3), 506–513.
Viru Keemia Grupp homepage [http://www.vkg.ee/est/arendustegevus/kasutatavad-
tehnoloogiad/petroter] 17.05.2014
Xu, H., Van Deventer, J.S.J., 2000. The geopolymerisation of aluminosilicate minerals.
International Journal of Mineral Processing 59 (3), 247–266.
Yip, C.K., Lukey, G.C., Van Deventer, J.S.J., 2005. The coexistence of geopolymeric gel
and calcium silicate hydrate at the early stage of alkaline activation. Cement and Concrete
Research 35 (9), 1688–1697.

36
APPENDIXES
Appendix A. Mineralogical compositions of black ash and samples.
Phase/Sample BAsh A7 A28 A90 C7 C28 C90 B7 B28 B90 E7 E28 E90
Quartz 11,71 7,39 6,67 7,85 8,68 13,32 7,75 10,08 13,30 8,39 11,68 11,91 10,72
Orthoclase 14,25 11,83 10,39 12,14 11,16 13,70 10,47 11,99 11,52 10,03 12,54 11,28 12,34
Muscovite 2,64 6,91 7,10 7,21 5,88 8,33 7,15 1,45 5,05 1,74 3,44 5,65
Calcite 26,81 18,85 16,48 19,20 19,56 27,17 20,99 23,64 25,77 21,71 23,23 28,42 25,58
Vaterite 1,48 1,90 2,11 1,37 1,62 1,47 2,40 2,75 2,92 2,88 0,21 1,46
Dolomite 8,52 5,73 5,47 4,97 5,69 4,85 5,88 6,57 7,12 4,70 8,55 11,83 6,04
Lime 2,08
Portlandite 1,51 2,14 0,68 1,21 0,28 0,44
Periclase 7,50 3,16 2,15 2,06 3,77 4,15 2,51 2,49 2,67 2,15 2,19 1,90 1,89
C2S β 3,15 2,33 2,38 2,53 2,67 2,77 2,34 5,77 6,88 6,85 5,75 6,67 7,11
Merwinite 5,22 1,99 2,32 1,47 2,57 3,59 2,14 2,77 2,82 2,45 2,18 1,61 1,34
Melilite 4,19 2,56 3,33 2,65 2,84 2,89 3,02 3,79 3,04 2,13 2,05 2,60 2,89
Wollastonite 1,53 3,67 4,33 4,20 3,96 5,95 4,90 3,79 3,40 3,15 2,50 3,08 4,29
Oldhamite 3,59 1,70 0,84 0,76 1,98 1,31 0,75 0,67 0,56 0,39 0,00 0,00 0,03
Anhydrite 1,10
Gypsum 0,95 1,32 2,33 0,93 0,66 0,95
Hydrocalumite 17,93 13,30 16,55 13,90 5,97 11,08
Ettringite 0,01 4,71 7,59 6,33
Montmorillonite 0,49 0,02 2,09
Hematite 1,09 0,71 0,33 0,79 0,78 0,97 0,64 0,43 0,18 0,13 0,47 0,36 0,60
Magnetite 0,94 0,69 0,92 0,61 0,90 1,26 0,94 1,07 1,58 1,19 1,30 1,80 1,18
Amorphus 5,70 30,98 35,40 31,47 28,22 8,14 29,07 3,67 0,20 7,13 2,18 0,41 0,07
37
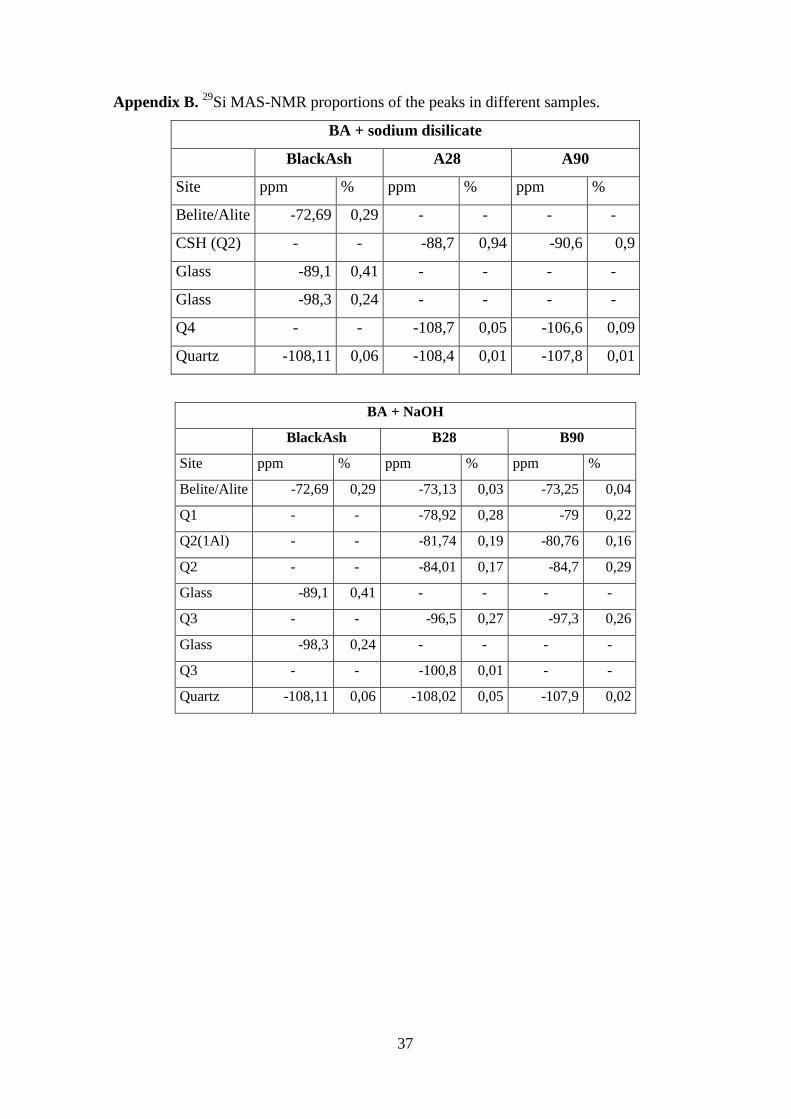
Appendix B. 29
Si MAS-NMR proportions of the peaks in different samples.
BA + sodium disilicate
BlackAsh A28 A90
Site ppm % ppm % ppm %
Belite/Alite -72,69 0,29 - - - -
CSH (Q2) - - -88,7 0,94 -90,6 0,9
Glass -89,1 0,41 - - - -
Glass -98,3 0,24 - - - -
Q4 - - -108,7 0,05 -106,6 0,09
Quartz -108,11 0,06 -108,4 0,01 -107,8 0,01
BA + NaOH
BlackAsh B28 B90
Site ppm % ppm % ppm %
Belite/Alite -72,69 0,29 -73,13 0,03 -73,25 0,04
Q1 - - -78,92 0,28 -79 0,22
Q2(1Al) - - -81,74 0,19 -80,76 0,16
Q2 - - -84,01 0,17 -84,7 0,29
Glass -89,1 0,41 - - - -
Q3 - - -96,5 0,27 -97,3 0,26
Glass -98,3 0,24 - - - -
Q3 - - -100,8 0,01 - -
Quartz -108,11 0,06 -108,02 0,05 -107,9 0,02
38
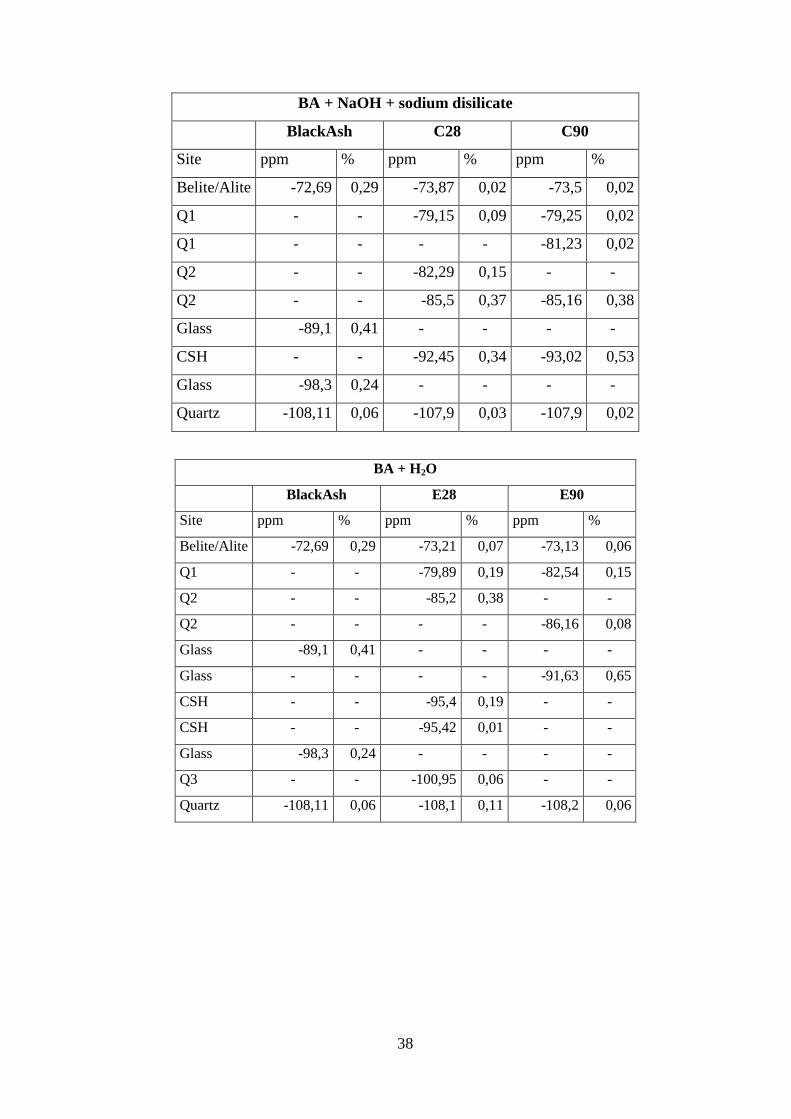
BA + NaOH + sodium disilicate
BlackAsh C28 C90
Site ppm % ppm % ppm %
Belite/Alite -72,69 0,29 -73,87 0,02 -73,5 0,02
Q1 - - -79,15 0,09 -79,25 0,02
Q1 - - - - -81,23 0,02
Q2 - - -82,29 0,15 - -
Q2 - - -85,5 0,37 -85,16 0,38
Glass -89,1 0,41 - - - -
CSH - - -92,45 0,34 -93,02 0,53
Glass -98,3 0,24 - - - -
Quartz -108,11 0,06 -107,9 0,03 -107,9 0,02
BA + H2O
BlackAsh E28 E90
Site ppm % ppm % ppm %
Belite/Alite -72,69 0,29 -73,21 0,07 -73,13 0,06
Q1 - - -79,89 0,19 -82,54 0,15
Q2 - - -85,2 0,38 - -
Q2 - - - - -86,16 0,08
Glass -89,1 0,41 - - - -
Glass - - - - -91,63 0,65
CSH - - -95,4 0,19 - -
CSH - - -95,42 0,01 - -
Glass -98,3 0,24 - - - -
Q3 - - -100,95 0,06 - -
Quartz -108,11 0,06 -108,1 0,11 -108,2 0,06

39
Appendix C. Peak positions, proportions and corresponding silicate structures in 29Si MAS-NMR spectra.
Appendix D. Compressive strengths of the samples (Paaver 2014).
Belite/Alite Q1 Q2(1Al) Q2 Q2 Q2 CSH Amorph CSH Amorp CSH CSH Q3 Amorph Q3 Q4 Q4 Quartz
ppm -73,13 -78,92 -81,74 -82,29 -84,01 -86,16 -88,7 -89,1 -90,6 -91,63 -92,45 -95,4 -96,5 -98,3 -100,9 -106,6 -108,7 -108,1
Bash 0,29
0,41
0,24
0,06
A28
0,94
0,05 0,01
A90
0,9
0,09
0,01
B28 0,03 0,28 0,19
0,17
0,27
0,01
0,05
B90 0,04 0,22 0,16
0,29
0,26
0,02
C28 0,02 0,09
0,15 0,37
0,34
0,03
C90 0,02 0,02 0,02
0,38
0,53
0,02
E28 0,07 0,19
0,38
0,20
0,06
0,11
E90 0,06 0,15
0,08
0,65
0,06
BA+sodiumdisilicate BA+NaOH BA+sodiumdisilicate BA+water
Days 7 28 90 7 28 90 7 28 90 7 28 90
Compressive
strength (Mpa) 10,4 4,9 6,3 1,2 1,5 4,5 7,8 6,7 5,2 2,2 7,2 9,8
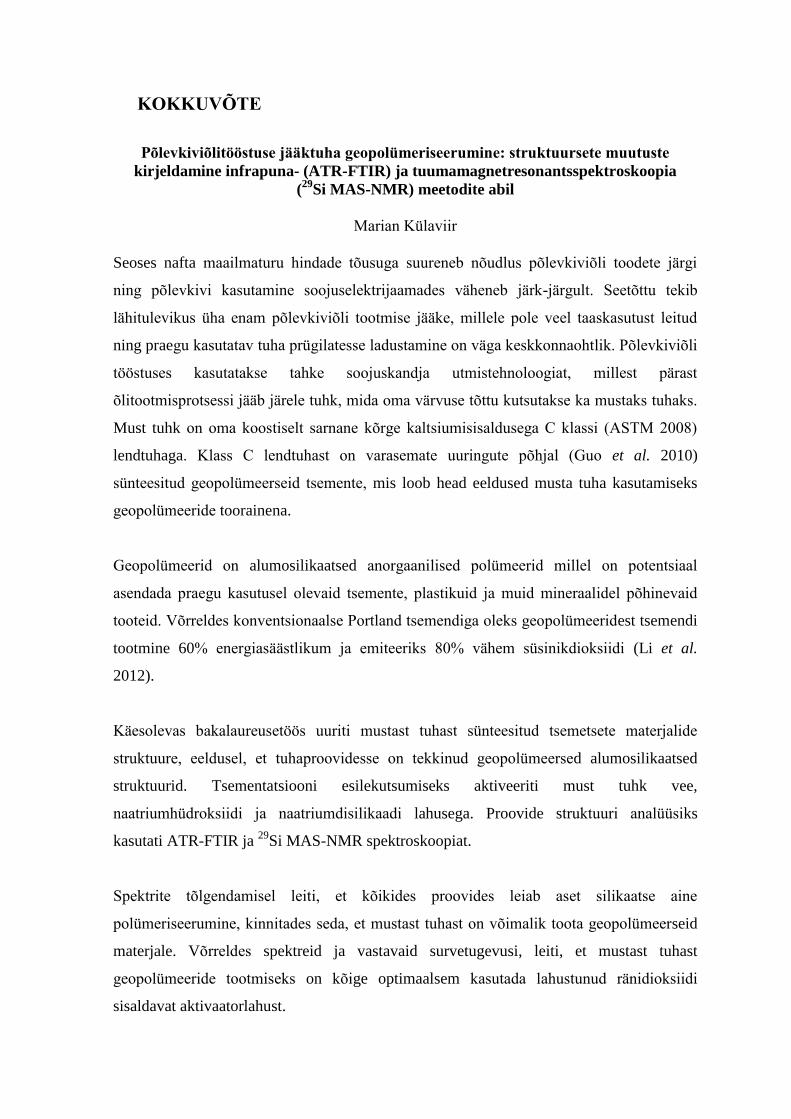
KOKKUVÕTE
Põlevkiviõlitööstuse jääktuha geopolümeriseerumine: struktuursete muutuste
kirjeldamine infrapuna- (ATR-FTIR) ja tuumamagnetresonantsspektroskoopia
(29
Si MAS-NMR) meetodite abil
Marian Külaviir
Seoses nafta maailmaturu hindade tõusuga suureneb nõudlus põlevkiviõli toodete järgi
ning põlevkivi kasutamine soojuselektrijaamades väheneb järk-järgult. Seetõttu tekib
lähitulevikus üha enam põlevkiviõli tootmise jääke, millele pole veel taaskasutust leitud
ning praegu kasutatav tuha prügilatesse ladustamine on väga keskkonnaohtlik. Põlevkiviõli
tööstuses kasutatakse tahke soojuskandja utmistehnoloogiat, millest pärast
õlitootmisprotsessi jääb järele tuhk, mida oma värvuse tõttu kutsutakse ka mustaks tuhaks.
Must tuhk on oma koostiselt sarnane kõrge kaltsiumisisaldusega C klassi (ASTM 2008)
lendtuhaga. Klass C lendtuhast on varasemate uuringute põhjal (Guo et al. 2010)
sünteesitud geopolümeerseid tsemente, mis loob head eeldused musta tuha kasutamiseks
geopolümeeride toorainena.
Geopolümeerid on alumosilikaatsed anorgaanilised polümeerid millel on potentsiaal
asendada praegu kasutusel olevaid tsemente, plastikuid ja muid mineraalidel põhinevaid
tooteid. Võrreldes konventsionaalse Portland tsemendiga oleks geopolümeeridest tsemendi
tootmine 60% energiasäästlikum ja emiteeriks 80% vähem süsinikdioksiidi (Li et al.
2012).
Käesolevas bakalaureusetöös uuriti mustast tuhast sünteesitud tsemetsete materjalide
struktuure, eeldusel, et tuhaproovidesse on tekkinud geopolümeersed alumosilikaatsed
struktuurid. Tsementatsiooni esilekutsumiseks aktiveeriti must tuhk vee,
naatriumhüdroksiidi ja naatriumdisilikaadi lahusega. Proovide struktuuri analüüsiks
kasutati ATR-FTIR ja 29
Si MAS-NMR spektroskoopiat.
Spektrite tõlgendamisel leiti, et kõikides proovides leiab aset silikaatse aine
polümeriseerumine, kinnitades seda, et mustast tuhast on võimalik toota geopolümeerseid
materjale. Võrreldes spektreid ja vastavaid survetugevusi, leiti, et mustast tuhast
geopolümeeride tootmiseks on kõige optimaalsem kasutada lahustunud ränidioksiidi
sisaldavat aktivaatorlahust.

41
Non-exclusive licence to reproduce thesis and make thesis public
I, _____________________Marian Külaviir___________________________,
(author’s name)
1. herewith grant the University of Tartu a free permit (non-exclusive licence) to:
1.1. reproduce, for the purpose of preservation and making available to the public,
including for addition to the DSpace digital archives until expiry of the term of
validity of the copyright, and
1.2. make available to the public via the web environment of the University of Tartu,
including via the DSpace digital archives until expiry of the term of validity of the
copyright,
___ Geopolymerization of the Estonian oil shale solid heat carrier retorting waste ash:
characterization of structural changes through infrared (ATR-FTIR) and nuclear magnetic
resonance spectroscopic (29Si MAS-NMR) analysis_____,
(title of thesis)
supervised by ___________Päärn Paiste and Martin Liira_________________,
(supervisor’s name)
2. I am aware of the fact that the author retains these rights.
3. I certify that granting the non-exclusive licence does not infringe the intellectual
property rights or rights arising from the Personal Data Protection Act.
Tartu 23.05.2014