geophysical surveys of a known karst feature, oak ridge y
TRANSCRIPT

Geophysical Surveys of a Known Karst Feature, Oak Ridge Y-12 Plant, Oak Ridge, Tennessee
William E. Doll’, Jonathan E. Nyquist2, Philip J. CarpenteP, Ronald D. Kaufmann4, and Bradley J. Can-’
Abstract Geophysical data were acquired at a site on the Oak Ridge Reservation, Tennessee
to determine the characteristics of a mud-filled void and to evaluate the effectiveness of a suite of geophysical methods at the site. Methods that were used included microgravity, electrical resistivity, and seismic refraction. Both microgravity and resistivity were able to detect the void as well as overlying structural features. The seismic data provide bedrock depth control for the other two methods, and show other effects that are caused by the void.
Introduction In this paper, we describe a suite of geophysical measurements that were used at a
site on the Oak Ridge Reservation (ORR), Tennessee where a mud-filled void is known to extend from 18 m to at least 30 m depth. The void was discovered during installation of monitoring wells in Bear Creek Valley, adjacent to the Oak Ridge Y-12 Plant. Because the Y-12 plant is a source of radioactive contaminants, mercury, and solvents, any pathway that might accelerate offsite migration of contaminants is of concern and must be investigated.
The study site lies on the lower northeast flank of East Chestnut Ridge, about 90m west of Scarboro Rd. (Figure 1). Approximately 6-23 m of alluvium, colluvium and saprolitic residuum overlie bedrock across the site. The bedrock consists of the Copper Ridge Dolomite (Knox Group), Maynardville Limestone and Nolichucky Shale (Conasauga Group) (Shevenell et al., 1,992). These units dip approximately 45 degrees to the southeast (Hatcher et al., 1992).
The subcropping Maynardville Limestone has a stratigraphic thickness of approximately 135 m at the eastern end of Y-12 (Shevenell et al., 1992). It is primarily composed of dolomitic, oolitic, and micritic limestone. The largest cavities and highest hydraulic conductivities of the Conasauga Group have generally been encountered in the Maynardville Limestone, which has also been classified as part of the Knox aquifer on the ORR (Solomon, 1992).
‘Envir. Sciences Div., Oak Ridge National Laboratory, PO Box 2008, Oak Ridge, TN 37831-6038
2Department of Geology, Temple University, 1901 N 13’h St., Philadelphia, PA 19122-6081
3 Department of Geology, Northern Illinois University, DeKalb, IL 601152854
4Technos Inc., 3333 NW 21”‘St., Miami, FL 33142

Evidence for lateral karst drains (long subsurface channels, parallel to strike) on the ORR includes gravel and cobbles in cavity fill material, secondary travertine, and rapid head responses to storms (during monitoring with pressure transducers) of wells completed in cavities (White, 1993). The Maynardville Limestone along Scarboro Road is believed to be an “exit pathway” for groundwater leaving the ORR (Shevenell et al., 1992). Between 1991 and 1993, a series of monitoring wells were installed across this exit pathway to monitor changes in head and groundwater geochemistry, identify fractures and cavities, and to map lithologies and thickness variations in the Maynardville Limestone. Fractures and cavities were encountered during drilling of all of these wells with the greatest concentration of cavities at a depth of less than 46 m. No cavities were encountered deeper than 72m ( Shevenell and Beauchamp, 1994).
Two wells encountered unusually large cavities. GW734 intersects a mud-filled cavity at 18m that extends to at least 30 m. Pressure transducers in this cavity respond within l-6 hours to storm events, suggesting this cavity is hydraulically connected to the surface. White (1993) suggests this cavity could represent a higher-order “east-flowing lateral dram” in the subsurface karst network. GW722 (46 m south of GW-734 and 4.3m higher at ground surface) also intersected a water-filled cavity between 30-38 m which may be connected to the GW734 cavity (Shevenell et al., 1992). The top of “weathered” bedrock in GW734 is reported in driller’s logs at 10.7m, and the top of “fresh” bedrock
Figure 1. Locations overlain.
N
P -
Contour Interval: 20 pgals
Complete Bouguer Anomaly mai) for the area s&rounding well GW-734. of measurement points, well GW-722 and resistivity sounding R3 are

is reported at 13.1 m. In GW722, weathered bedrock is reported at 16.5m and fresh bedrock is reported at 22.3m.
Geophysical methods may be used for direct detection of karst cavities, or may be used to infer underyling cavities by imaging “near-surface indicators”, shallow features (e.g. sinkholes) that are associated with deeper karst cavities. Carpenter et al. (1998) discussed the evidence for near-surface indicators at the Scarboro Road site with emphasis on ground penetrating radar and shallow electromagnetic measurements. Here we discuss methods that achieve greater penetration, and in some cases direct detection of the cavity.
Microgravity Survey
Microgravity techniques have proven very effective in locating cavities and a large number of case studies have recently been published in which microgravity has been used to identify caves, mine rooms, shafts, and tunnels. Caves and voids typically have anomalies of lo-100 microgals, which require relative elevation accuracies of 0.3-3 cm at measurement points to enable adequate data reduction. Knowledge of near-surface density variations is essential in mapping cavities from microgravity data. Greenfield (1979) notes that a 10 microgal change can be produced by only a 24 cm (10 in) soil thickness change, when the density difference between soil and bedrock is 1 g/cm3.
A “complete” Bouguer gravity anomaly map’(Figure l), is one that eliminates the effects of topographic features in and adjacent to the map area. In this case, we used a digital elevation database with a 30 m grid spacing to remove effects of topography within 2.4 km of GW-734. On this gravity map, the area which is greater than 90 m north of GW734 is relatively flat, and there is a significant gradient between 45 m north and 90 m south of GW734 (Figure 1).
GPR data for a filled depression north of GW734 (Carpenter et al., 1998) and density values derived from reports and recent measurements were used to constrain two- and-a-half dimensional (2.5D) gravity models for the Scarboro Rd. site. The Hypermag workstation software for gravity modeling (Saltus and Blakely, 1993) was used to perform the 2.5D modeling. Mud densities measured at 18.3, 19.9, and 21.3. m depth in GW734 in the spring of 1993 were 1.25, 1.53,, and 1.6 g/cm3 respectively (Shevenell, 1994). Fresh Maynardville Limestone has measured densities of 2.6-2.8 g/cm3 and weathered Maynardville limestone has measured densities of 1.8-2.5 g/cm” (Bailey and Withington, 1988; Wilson, 1991; King and Haase, 1988). Because the terrain corrected data show a steep gravity gradient to the south, we also include formation contacts in our model. Fresh Copper Ridge Dolomite at GW 13 1 has an average density of 2.8 g/cm3. Unweathered Nolichucky at GW239 exhibits an average density of 2.3-2.4 g/cm3 in the Scarboro Road area.
Modeling was conducted along four profile lines to provide a pseudo-3D image of the void. Figure 2 shows the model for Line 2 which is centered on GW734 and has a

I
. ’
north-south (plant grid; rotated 34” counter-clockwise from true north) orientation. The remaining gravity models are given in Carpenter et al., 1995. Density contrasts shown on the figures are based on the measurements discussed in the previous paragraph, and are all relative to unweathered Maynardville Limestone. A trial-and error approach was used to assign a density contrast (0.03 g/cm3) to the filled doline that was identified in GPR data (Carpenter et al., 1998). This value is reasonable if we assume that the doline is filled with a high proportion of chert fragments, or if it has a perched water table or high moisture content. The east-west extent of the void was used to set the in- and out-of- plane distances (for two-and-a-half dimensional modeling) used in the north-south models, including the model for Line 2 (Figure 2). The gravity models indicate that the void has a width (north-south) of 53-91 m, a length (east-west) of 91-122 m, and a height of 7.6-18.3 m. Because its cross-sectional shape changes along strike, the models should be considered representative, and the actual shape may differ significantly from the model shape.
Figure 2. Gravity model for Line 2, which is oriented parallel to grid north (N34”E).
None of the gravity models include effects of changes in density of unconsolidated materials or weathered bedrock because these changes are poorly constrained. It is very possible that these effects contribute to the observed anomalies to the extent that the thickness or lateral extent of the void as shown in the models is somewhat exaggerated. It is encouraging to recognize that if a number of very shallow inhomogeneities were present, the measured gravity values would reflect them, and the

, ) .
gravity field would have much more scatter than observed. Gravity models do not consider the variable thickness of the weathered layer, although we now have estimates of that thickness from seismic refraction data (described later in this paper). It is likely that three-dimensional effects of the void shape play a more important role than the variability of the thickness of the weathered layer. However, it should be noted that the models here assume that fresh bedrock is continuous up to the surface. Furthermore, the models assume a distinct continuous contact between mud and limestone, and it is much more likely that a “halo” surrounds the main void which consists of weathered fractures which may be partially filled with mud or water having densities which differ from that measured. Anomalies may also be due to the cumulative effects of more than one void separated by unweathered rock.
Resistivity Measaurements
Direct-current (DC) resistivity techniques have been very popular in karst studies due to the low equipment cost, relatively simple field procedures and generally rapid interpretation of data. Graphical techniques are commonly used to locate cavities with a variety of array configurations (Kirk and Werner, 198 1; Owen, 1983). Milanovic (198 1) describes the use of azimuthal resistivity surveys in defining karst flow pathways. These resistivity methods, however, are highly sensitive to interference from near-surface heterogeneity, they employ, at times, empirical rules without a theoretical basis, and they produce a high percentage of false anomalies. Also, most of the examples presented in these papers concern air-filled (vadose) caves; very few, if any, purport to map saturated caves or caves filled with sediment. A more effective use of DC resistivity, as noted by Kirk and Werner (198 1) and Milanovic (198 l), may be as a reconnaissance tool in which karstified areas or stratigraphic intervals may be identified through bulk resistivity changes.
Electromagnetic (EM) earth conductivity surveys provide essentially the same information as resistivity profiles, but EM surveying is far quicker. Relatively few papers, however, have been published utilizing EM surveys in karst investigations. Kirk and Werner (1981) noted that EM methods generally worked well in identifying shallow clay-filled sinkholes related to deeper karst features. Time-domain electromagnetic profiles have been combined with seismic studies by Nelson and Haigh (1990) to identify sinkhole-prone areas and possible cavities in the lateritic soils of northern Australia. Yuhr et al. (1993) describes a set of vertical dipole EM profiles over a cave system in southwest Texas. Paleo-collapse features exhibited a 10 mS/m decrease in apparent conductivity, whereas a profile over a solution doline in limestone exhibited a 4 mS/m decrease in apparent conductivity. At our site, time domain methods failed, presumably due to power line interference at the site (Carpenter et al., 1995). DC resistivity methods were more effective.
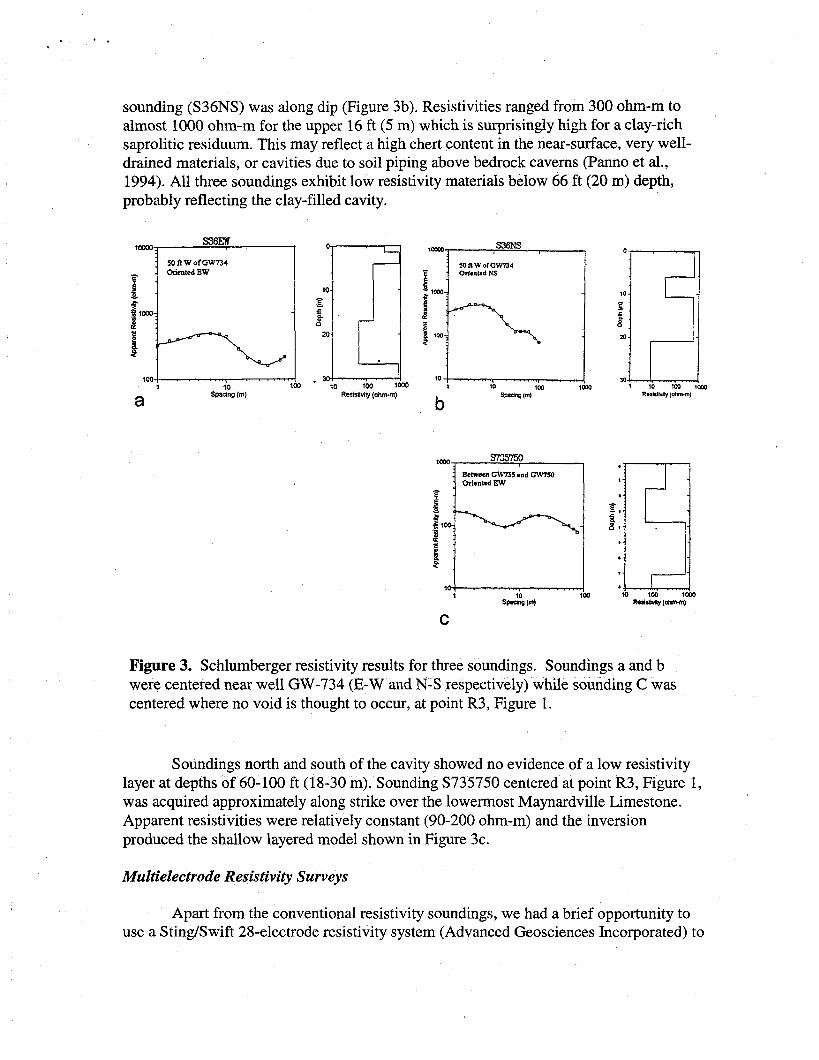
Schlumberger resistivity array soundings were made at the Scarboro Rd. site (Figure 3). Two perpendicular soundings were made over the large Maynardville cavity. The east-west sounding (S36EW) was along strike (Figure 3a) whereas the north-south

. ’ .
sounding (S36NS) was along dip (Figure 3b). Resistivities ranged from 300 ohm-m to almost 1000 ohm-m for the upper 16 ft (5 m) which is surprisingly high for a clay-rich saprolitic residuum. This may reflect a high chert content in the near-surface, very well- drained materials, or cavities due to soil piping above bedrock caverns (Panno et al., 1994). All three soundings exhibit low resistivity materials below 66 ft (20 m) depth, probably reflecting the clay-filled cavity.
Spaun9 64 b’
C
Figure 3. Schlumberger resistivity results for three soundings. Soundings a and b were centered near well GW-734 (E-W and N-S respectively) while sounding C was centered where no void is thought to occur, at point R3, Figure 1.
Soundings north and south of the cavity showed no evidence of a low resistivity layer at depths of 60-100 ft (18-30 m). Sounding S735750 centered at point R3, Figure 1, was acquired approximately along strike over the lowermost Maynardville Limestone. Apparent resistivities were relatively constant (90-200 ohm-m) and the inversion produced the shallow layered model shown in Figure 3c.
M.&electrode Resistivity Surveys
Apart from the conventional resistivity soundings, we had a brief opportunity to use a Sting/Swift 28-electrode resistivity system (Advanced Geosciences Incorporated) to

Geophysical Surveys of a Known Karst Feature, Oak Ridge Y-12 Plant, Oak Ridge, Tennessee
William E. Doll’, Jonathan E. Nyquist2, Philip J. Carpenter3, Ronald D. Kaufmann4, and Bradley J. Car-r’
Abstract Geophysical data were acquired at a site on the Oak Ridge Reservation, Tennessee
to determine the characteristics of a mud-filled void and to evaluate the effectiveness of a suite of geophysical methods at the site. Methods that were used included microgravity, electrical resistivity, and seismic refraction. Both microgravity and resistivity were able to detect the void as well as overlying structural features. The seismic data provide bedrock depth control for the other two methods, and show other effects that are caused by the void.
Introduction In this paper, we describe a suite of geophysical measurements that were used at a
site on the Oak Ridge Reservation (ORR), Tennessee where a mud-filled void is known to extend from 18 m to at least 30 m depth. The void was discovered during installation of monitoring wells in Bear Creek Valley, adjacent to the Oak Ridge Y-12 Plant. Because the Y-12 plant is a source of radioactive contaminants, mercury, and solvents, any pathway that might accelerate offsite migration of contaminants is of concern and must be investigated.
The study site lies on the lower northeast flank of East Chestnut Ridge, about 90m west of Scarboro Rd. (Figure 1). Approximately 6-23 m of alluvium, colluvium and saprolitic residuum overlie bedrock across the site. The bedrock consists of the Copper Ridge Dolomite (Knox Group), Maynardville Limestone and Nolichucky Shale (Conasauga Group) (Shevenell et al., 1.992). These units dip approximately 45 degrees to the southeast (Hatcher et al., 1992).
The subcropping Maynardville Limestone has a stratigraphic thickness of approximately 135 m at the eastern end of Y-12 (Shevenell et al., 1992). It is primarily composed of dolomitic, oolitic, and micritic limestone. The largest cavities and highest hydraulic conductivities of the Conasauga Group have generally been encountered in the Maynardville Limestone, which has also been classified as part of the Knox aquifer on the ORR (Solomon, 1992).
‘Envir. Sciences Div., Oak Ridge National Laboratory, PO Box 2008, Oak Ridge, TN 37831-6038
2Department of Geology, Temple University, 1901 N 13” St., Philadelphia, PA 19122-6081
3 Department of Geology, Northern Illinois University, DeKalb, IL 601152854
4Technos Inc., 3333 NW 21”‘St., Miami, FL 33142

Evidence for lateral karst drains (long subsurface channels, parallel to strike) on the ORR includes gravel and cobbles in cavity fill material, secondary travertine, and rapid head responses to storms (during monitoring with pressure transducers) of wells completed in cavities (White, 1993). The Maynardville Limestone along Scarboro Road is believed to be an “exit pathway” for groundwater leaving the ORR (Shevenell et al., 1992). Between 1991 and 1993, a series of monitoring wells were installed across this exit pathway to monitor changes in head and groundwater geochemistry, identify fractures and cavities, and to map lithologies and thickness variations in the Maynardville Limestone. Fractures and cavities were encountered during drilling of all of these wells with the greatest concentration of cavities at a depth of less than 46 m. No cavities were encountered deeper than 72m ( Shevenell and Beauchamp, 1994).
Two wells encountered unusually large cavities. GW734 intersects a mud-filled cavity at 18m that extends to at least 30 m. Pressure transducers in this cavity respond within l-6 hours to storm events, suggesting this cavity is hydraulically connected to the surface. White (1993) suggests this cavity could represent a higher-order “east-flowing lateral drain” in the subsurface karst network. GW722 (46 m south of GW-734 and 4.3m higher at ground surface) also intersected a water-filled cavity between 30-38 m which may be connected to the GW734 cavity (Shevenell et al., 1992). The top of “weathered” bedrock in GW734 is reported in driller’s logs at 10.7m, and the top of “fresh” bedrock
Figure 1. Locations overlain.
Distance (m)
Complete Bouguer Anomaly map for the area surrounding well GW-734. of measurement points, well GW-722 and resistivity sounding R3 are
interval: 20 vgals

. ’
is reported at 13.1 m. In GW722, weathered bedrock is reported at 16.5m and fresh bedrock is reported at 22.3m.
Geophysical methods may be used for direct detection of karst cavities, or may be used to infer underyling cavities by imaging “near-surface indicators”, shallow features (e.g. sinkholes) that are associated with deeper karst cavities. Carpenter et al. (1998) discussed the evidence for near-surface indicators at the Scarboro Road site with emphasis on ground penetrating radar and shallow electromagnetic measurements. Here we discuss methods that achieve greater penetration, and in some cases direct detection of the cavity.
Microgravity Survey
Microgravity techniques have proven very effective in locating cavities and a large number of case studies have recently been published in which microgravity has been used to identify caves, mine rooms, shafts, and tunnels. Caves and voids typically have anomalies of lo-100 microgals, which require relative elevation accuracies of 0.3-3 cm at measurement points to enable adequate data reduction. Knowledge of near-surface density variations is essential in mapping cavities from microgravity data. Greenfield (1979) notes that a 10 microgal change can be produced by only a 24 cm (10 in) soil thickness change, when the density difference between soil and bedrock is 1 g/cm3.
A “complete” Bouguer gravity anomaly map (Figure l), is one that eliminates the effects of topographic features in and adjacent to the map area. In this case, we used a digital elevation database with a 30 m grid spacing to remove effects of topography within 2.4 km of GW-734. On this gravity map, the area which is greater than 90 m north of GW734 is relatively flat, and there is a significant gradient between 45 m north and 90 m south of GW734 (Figure 1).
GPR data for a filled depression north of GW734 (Carpenter et al., 1998) and density values derived from reports and recent measurements were used to constrain two- and-a-half dimensional (2SD) gravity models for the Scarboro Rd. site. The Hypermag workstation software for gravity modeling (Saltus and Blakely, 1993) was used to perform the 2.5D modeling. Mud densities measured at 18.3, 19.9, and 21.3.m depth in GW734 in the spring of 1993 were 1.25, 1.53, and 1.6 g/cm3 respectively (Shevenell, 1994). Fresh Maynardville Limestone has measured densities of 2.6-2.8 g/cm3 and weathered Maynardville limestone has measured densities of 1.8-2.5 g/cm3 (Bailey and Withington, 1988; Wilson, 1991; King and Haase, 1988). Because the terrain corrected data show a steep gravity gradient to the south, we also include formation contacts in our model. Fresh Copper Ridge Dolomite at GW 13 1 has an average density of 2.8 g/cm3. Unweathered Nolichucky at GW239 exhibits an average density of 2.3-2.4 g/cm’ in the Scarboro Road area.
Modeling was conducted along four profile lines to provide a pseudo-3D image of the void. Figure 2 shows the model for Line 2 which is centered on GW734 and has a

r t ’
north-south (plant grid; rotated 34” counter-clockwise from true north) orientation. The remaining gravity models are given in Carpenter et al., 1995. Density contrasts shown on the figures are based on the measurements discussed in the previous paragraph, and are all relative to unweathered Maynardville Limestone. A trial-and error approach was used to assign a density contrast (0.03 g/cm3) to the filled doline that was identified in GPR data (Carpenter et al., 1998). This value is reasonable if we assume that the doline is filled with a high proportion of chert fragments, or if it has a perched water table or high moisture content. The east-west extent of the void was used to set the in- and out-of- plane distances (for two-and-a-half dimensional modeling) used in the north-south models, including the model for Line 2 (Figure 2). The gravity models indicate that the void has a width (north-south) of 53-91 m, a length (east-west) of 91-122 m, and a height of 7.6-18.3 m. Because its cross-sectional shape changes along strike, the models should be considered representative, and the actual shape may differ significantly from the model shape.
j.63
[ a
/
152
Figure 2. Gravity model for Line 2, which is oriented parallel to grid north (N34’E).
None of the gravity models include effects of changes in density of unconsolidated materials or weathered bedrock because these changes are poorly constrained. It is very possible that these effects contribute to the observed anomalies to the extent that the thickness or lateral extent of the void as shown in the models is somewhat exaggerated. It is encouraging to recognize that if a number of very shallow inhomogeneities were present, the measured gravity values would reflect them, and the

gravity field would have much more scatter than observed. Gravity models do not consider the variable thickness of the weathered layer, although we now have estimates of that thickness from seismic refraction data (described later in this paper). It is likely that three-dimensional effects of the void shape play a more important role than the variability of the thickness of the weathered layer. However, it should be noted that the models here assume that fresh bedrock is continuous up to the surface. Furthermore, the models assume a distinct continuous contact between mud and limestone, and it is much more likely that a “halo” surrounds the main void which consists of weathered fractures which may be partially filled with mud or water having densities which differ from that measured. Anomalies may also be due to the cumulative effects of more than one void separated by unweathered rock.
Resistivity Measaurements
Direct-current (DC) resistivity techniques have been very popular in karst studies due to the low equipment cost, relatively simple field procedures and generally rapid interpretation of data. Graphical techniques are commonly used to locate cavities with a variety of array configurations (Kirk and Werner, 1981; Owen, 1983). Milanovic (1981) describes the use of azimuthal resistivity surveys in defining karst flow pathways. These resistivity methods, however, are highly sensitive to interference from near-surface heterogeneity, they employ, at times, empirical rules without a theoretical basis, and they produce a high percentage of false anomalies. Also, most of the examples presented in these papers concern air-filled (vadose) caves; very few, if any, purport to map saturated caves or caves filled with sediment. A more effective use of DC resistivity, as noted by Kirk and Werner (1981) and Milanovic (1981), may be as a reconnaissance tool in which karstified areas or stratigraphic intervals may be identified through bulk resistivity changes.
Electromagnetic (EM) earth conductivity surveys provide essentially the same information as resistivity profiles, but EM surveying is far quicker. Relatively few papers, however, have been published utilizing EM surveys in karst investigations. Kirk and Werner (198 1) noted that EM methods generally worked well in identifying shallow clay-filled sinkholes related to deeper karst features. Time-domain electromagnetic profiles have been combined with seismic studies by Nelson and Haigh (1990) to identify sinkhole-prone areas and possible cavities in the lateritic soils of northern Australia. Yuhr et al. (1993) describes a set of vertical dipole EM profiles over a cave system in southwest Texas. Paleo-collapse features exhibited a 10 mS/m decrease in apparent conductivity, whereas a profile over a solution doline in limestone exhibited a 4 mS/m decrease in apparent conductivity. At our site, time domain methods failed, presumably due to power line interference at the site (Carpenter et al., 1995). DC resistivity methods were more effective.
Schlumberger resistivity array soundings were made at the Scarboro Rd. site (Figure 3). Two perpendicular soundings were made over the large Maynardville cavity. The east-west sounding (S36EW) was along strike (Figure 3a) whereas the north-south
sounding (S36NS) was along dip (Figure 3b). Resistivities ranged from 300 ohm-m to almost 1000 ohm-m for the upper 16 ft (5 m) which is surprisingly high for a clay-rich saprolitic residuum. This may reflect a high chert content in the near-surface, very well- drained materials, or cavities due to soil piping above bedrock caverns (Panno et al., 1994). All three soundings exhibit low resistivity materials below 66 ft (20 m) depth, probably reflecting the clay-filled cavity.
. 3 7 10 loo mm
Resistivig (ohm-m)
10
z 6
z
20
3ORWofGW734 Ol1enud NS
i7=
Figure 3. Schlumberger resistivity results for three soundings. Soundings a and b were centered near well GW-734 (E-W and N-S respectively) while sounding C was centered where no void is thought to occur, at point R3, Figure 1.
Soundings north and south of the cavity showed no evidence of a low resistivity layer at depths of 60-100 ft (18-30 m). Sounding S735750 centered at point R3, Figure 1, was acquired approximately along strike over the lowermost Maynardville Limestone. Apparent resistivities were relatively constant (90-200 ohm-m) and the inversion produced the shallow layered model shown in Figure 3c.
M&electrode Resistivity Surveys
Apart from the conventional resistivity soundings, we had a brief opportunity to use a Sting/Swift 28-electrode resistivity system (Advanced Geosciences Incorporated) to
* . ,
collect multielectrode resistivity at the Scarboro site while the instrument was rented for another project. The Sting/Swift combination consists of a standard Sting DC resistivity
instrument used in conjunction with a Swift relay system that allows the user to make a sequence of measurements automatically using a string of electrodes connected by a special cable. The system can make over 100 apparent resistivity measurements in less than an hour. The measurements form the basis for a 2-D data inversion program that interactively adjusts a finite difference forward model to find the smoothest resistivity cross section that matches the observed data (Loke, 1996; Loke and Barker, 1996).
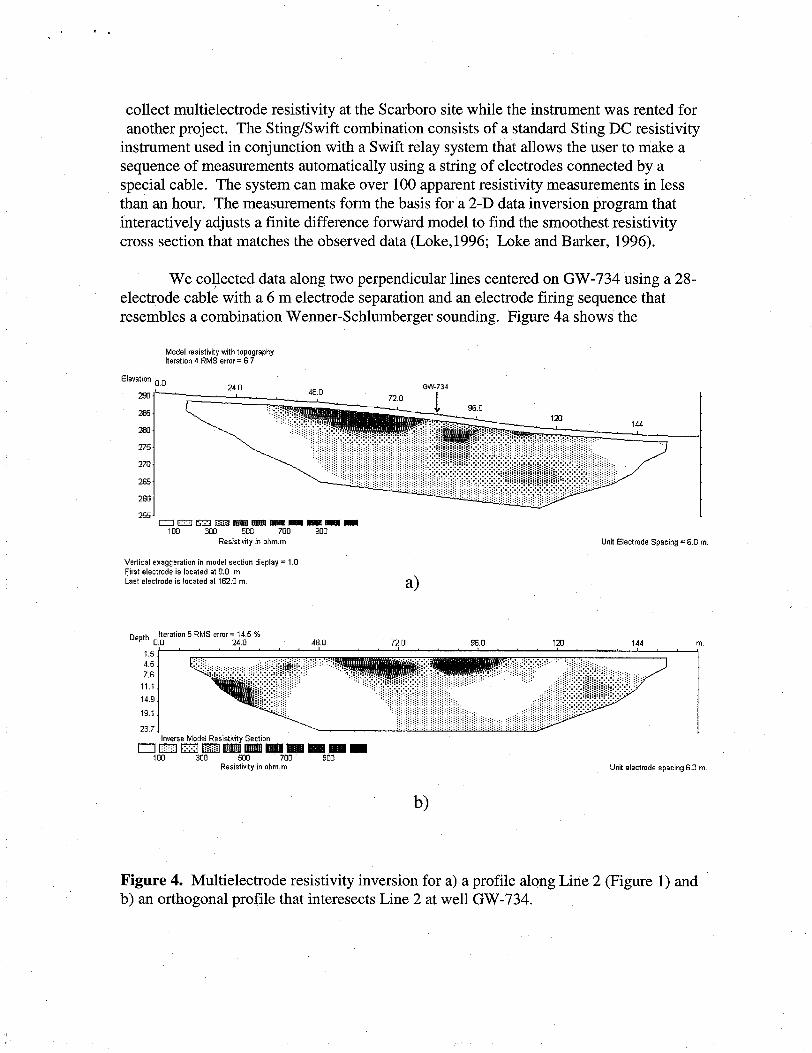
We col,lected data along two perpendicular lines centered on GW-734 using a 2% electrode cable with a 6 m electrode separation and an electrode firing sequence that resembles a combination Wenner-Schlumberger sounding. Figure 4a shows the
Model resistivity with topography Iteration 4 RMS ~rmr = 6.7
Elevation k
290 L
235
280
275
270
265
260
255
1.0
Resiotivity in ohm.m
Vertical exaggeration in model section display = 1.0 First electrode is located at 0.0 m. Last electrode is located at 162.0 m
a>
Unit Electrode Spacing = 6.0 m
Depth Iteration 5 RMS armr = 14.5 % o,. 24.0 48.0 72.0 96.0 120 144 tn.
Resistivity in ohmm Unit electrode spacing 6 0 m.
Figure 4. Multielectrode resistivity inversion for a) a profile along Line 2 (Figure 1) and b) an orthogonal profile that interesects Line 2 at well GW-734.

topographically corrected inversion for the north-south line. The general pattern seen in the conventional resistivity data was a resistive near-surface layer associated with the material filling the doline overlying a more conductive layer. The same pattern is seen in the multi-electrode resistivity data, however the 2-D inversion captures the structure of the doline and agrees well with the radar data. The east-west line (Figure 4b) is similar, but only passes over the southernmost edge of the doline.
Some caution must be used in interpreting these data, because a terrain conductivity survey (Carpenter et al., 1995) found two water mains running across the survey area from southeast to northwest. The line in Figure 4a crosses both of these pipes, which are seen as conductive areas at the north and south ends of the line. Near the center of the resistivity line, away from the two pipes, the shallow resistivity data is unaffected by these utilities. However, for the deeper sounding data collected at the largest electrode separations, the current probably spread out laterally far enough that some of it moved through the pipes. This would exaggerate the decrease in apparent resistivity with depth as the inversion software tried to fit the data with a 2-D model. Similarly, the east-west line (Figure 4b) shows low resistivities at the surface at both ends of the line that are associated with a road (at the east end) and a saturated pit and possible pipeline at the west end. Although the deep conductor is compatible with what would be expected from a mud- filled void, it is suspect because of possible effects from pipelines. This profile does, however, show a response to the doline that may be out-of-plane. Consequently, we can confidently conclude that the multielectrode resistivity data mapped the doline fill material, but it is questionable whether or not the deeper part of the resistivity sections are conductive because of the influence of the underlying cavity, the adjacent metal water mains, or a combination of both. The thin, shallow low resistivity zone north of GW-734 and deeper, thicker low resistivity zone south of the well in Figure 4a have a resemblance to the shape of the void in the gravity model (Figure 2) and might provide a basis for an alternative gravity model.
Seismic Refraction Surveys
Seismic refraction surveys have rarely been used to directly image karst features. This is because refraction methods are in principle unable to resolve decreases in velocity as a function of depth (such as a mud-filled void embedded in limestone), and are vulnerable to errors where the geology is highly heterogeneous and three-dimensional. They have been used to determine average rock velocities for various layers, which then can be related to the dynamic moduli and density which reflects the degree of karstification of the rock mass as a whole. Refraction is used in this context most frequently at dam sites, or in foundation studies for large structures such as nuclear power plants (Milanovic, 198 1).
Two seismic refraction experiments were conducted at the Scarboro Rd. site in February and June, 1994 (Carpenter et al., 1995). These used hammer and shotgun sources that lacked energy required to image deeper than about 6m. In 1998, seismic refraction data were acquired with a Bison Elastic Wave Generator source and a
Geometries 48-channel Strataview seismograph with 10 Hz. geophones at 3m spacing.
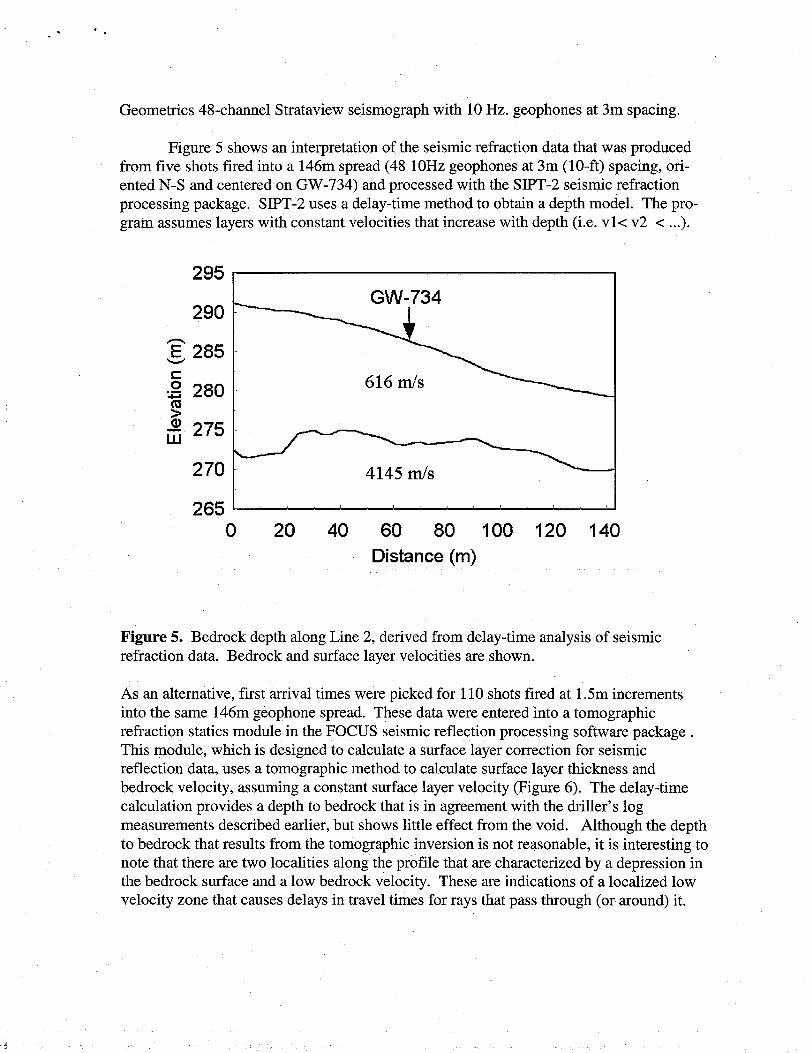
Figure 5 shows an interpretation of the seismic refraction data that was produced from five shots fired into a 146m spread (48 1OHz geophones at 3m (lo-ft) spacing, ori- ented N-S and centered on GW-734) and processed with the SPT-2 seismic refraction processing package. SIPT-2 uses a delay-time method to obtain a depth model. The pro- gram assumes layers with constant velocities that increase with depth (i.e. vlc v2 < . ..).
270
0 20 40 60 80 100 Distance (m)
120 140
Figure 5. Bedrock depth along Line 2, derived from delay-time analysis of seismic refraction data. Bedrock and surface layer velocities are shown.
As an alternative, first arrival times were picked for 110 shots fired at 1.5m increments into the same 146m geophone spread. These data were entered into a tomographic refraction statics module in the FOCUS seismic reflection processing software package . This module, which is designed to calculate a surface layer correction for seismic reflection data, uses a tomographic method to calculate surface layer thickness and bedrock velocity, assuming a constant surface layer velocity (Figure 6). The delay-time calculation provides a depth to bedrock that is in agreement with the driller’s log measurements described earlier, but shows little effect from the void. Although the depth to bedrock that results from the tomographic inversion is not reasonable, it is interesting to note that there are two localities along the profile that are characterized by a depression in the bedrock surface and a low bedrock velocity. These are indications of a localized low velocity zone that causes delays in travel times for rays that pass through (or-around) it.

325
4250 4250
z 4200
5 4150
.g 4100
3 4050
3 4000
z 4200 -
5 4150 -
.g 4100 -
3 4050 -
3 4000 - 3950 3950t ’ I I I I . I ’ ’ ’ . ’ a I I . I
-35 -35 -15 -15 5 5 25 25 45 45 65 65 85 85 105 105 125 125 145 145 165 165
WV-734 + Surface
Refractor
5 25 45 65 85 105 125 145 165 Distance (m)
W Distance (m)
Figure 6. a) depth to bedrock and b) bedrock velocity calculated with a tomographic method for analysis of seismic first arrival times. The void results in two artifacts --an apparent deepening of bedrock and corresponding decrease in bedrock velocity.
Conclusions Microgravity, resistivity and seismic refraction methods all proved effective in
delineating the deeper structure (i.e. > 1Om) at the Scarboro Rd. site. Among these methods, microgravity is least influenced by noise. Both microgravity and DC resistivity directly detected the GW734 cavity. Standard delay-time seismic refraction processing provides an estimate of the depth to bedrock, and tomographic processing shows a depression in the bedrock surface and low velocity bedrock that are artifacts of a low velocity void. Neither of these seismic processing schemes are optimal for karst detection, The preliminary multielectrode resistivity results are very promising, and should be tested with a larger array.
The data suggest that an optimal scheme for detailed karst mapping might consist of multielectrode resistivity surveying followed by joint inversion of gravity and seismic traveltime data. The resistivity results could be used to produce an initial model for the

seismic and gravity inversions. Shear velocities might also be included in such an inversion, using SASW methods (Stokoe et al., 1994) or similar methods (e.g. Park et al., 1998).
Acknowledgements Funding to initiate this effort was provided by the ORNL Groundwater Program
Office. Surveying costs were funded by Y-12 Engineering. Most of the funding for this work was provided by the Y-12 Environmental Restoration Program. We would like to thank Les Beard, Dean Kieswetter and Jeff Wilson for their assistance in collection of the resistivity field data for this study. Oak Ridge National Laboratory is managed by Lockheed Martin Energy Research Corp. for the U. S. Department of Energy under contract number DE-AC05960R22464.
References
Bailey, Z.C. and D.B. Withington, 1988. Well construction, lithology, and geophysical logs for boreholes in Bear Creek Valley near Oak Ridge, TN: U.S.Geol. Surv. Water-Resources Invest. Rep. 88-4068, Nashville, 21 PP.
Carpenter, P. J., W. E. Doll, and R. D. Kaufmann, 1998, Geophysical character of buried sinkholes on the Oak Ridge Reservation, Tennessee, Journal of Environmental and Engineering Geophysics, v.3, p. 133- 146.
Carpenter, P. J., W. E. Doll, and R. D. Kaufmann, 1995, Geophysical surveys over karst features near the Oak Ridge Y-12 Plant, Oak Ridge, TN, report Y/ER-200, Martin Marietta Energy Systems, Inc., 88 pages.
Greenfield, R.J. 1979. Review of geophysical approaches to the detection of karst. Bull. Assoc. Engineering Geol. 16:393-408.
Hatcher, R.D., Jr,, P.J. Leminski, R.B. Dreier, R.H. Ketelle, R.R. Lee, D.A. Leitzke, W.M. McMaster, J.L. Foreman and S.Y. Lee. 1992. Status report on the geology of the Oak Ridge Reservation. ORNL/TM- 12074. Oak Ridge National Laboratory.
King, H.L. and C.S. Haase. 1988. Summary of results and preliminary interpretation of hydrogeologic packer testing in core holes Well GW- 13 1 through Well GW- 135 and CH-157, Oak Ridge Y- 12 Plant, Y/TS-495. Martin Marietta Energy Systems, Inc., Oak Ridge Y-12 Plant, Oak Ridge, Tenn.
Kirk, K.G. and E. Werner. 1981. Handbook of Geophysical Cavity-Locating Techniques With Emphasis on Electrical Resistivity, Federal Highway Admin., U.S. Dept. of Trans., Implem. Package FHWA-IP-81-3, (U.S. Govt. Printing Office #1981-341-428:1112)
Loke, M. H., 1996, RES2DINV ver. 2.1: Rapid 2D resistivity inversion using the least-squares method: Penang, Malaysia.
Loke, M. H. and Barker, R. D., 1996, Rapid least-squares inversion of apparent resistivity pseudosections by a quasi-Newton method: Geophysical Prospecting, v. 44, p. 131-152.
Milanovic, P.T. 1981. Karst Hydrogeology. Water Resources Publications, Littleton, CO.
Nelson, R.G. and J.H. Haigh. 1990. Geophysical investigations of sinkholes in lateritic terrains. pp. 133- 153. In S.H: Ward (ed.), Geotechnical and Environmental Geophysics, Volume III, Society of Exploration

Geophysicists, Tulsa, OK.
Owen, T.E. 1983. Detection and mapping of tunnels and caves. pp. 161-258. In A.A. Fitch (ed.), Developments in Geophysical Exploration Methods, v. 5. Applied Sci. Publ., London..
Panno, S. V., C. P. Wiebel, P. C. Heigold, and P. C. Reed, 1994. Formation of regolitb-collapse sinkholes in southern Illinois: Interpretation and identification of associated buried cavities. Environmental Geology v. 23, pp. 214-220.
Park, C. B. , R. D. Miller, and J. Xia, 1998,Ground roll as a tool to image near-surface anomaly, Expanded Abstracts, 1998 Ann. Meeting. Sot. Expl. Geophy., p. 874-877.
Saltus, R.W. and R.J. Blakely, 1993. HYPERMAG -- An interactive, 2- and 2 l/2-dimensional gravity and magnetic modeling program: Version 3.5, U.S.G.S. Open-file report 93-287.
Shevenell, L.A. 1994. Chemical characteristics of waters in karst formations at the Oak Ridge Y-12 Plant, Y/TS-1001. Martin Marietta Energy Systems, Inc., Oak Ridge Y-12 Plant, Oak Ridge, TN, 83 pp.
Shevenell, L.A. and Beauchamp, J. 1994. Evaluation of cavity occurrence in the Maynardville Limestone and Copper Ridge Dolomite at the Y-12 Plant using logistic and general linear models, Y/TS-1022, Martin Marietta Energy Systems, Inc., Oak Ridge Y-12 Plant, Oak Ridge, TN, 42 pp.
Shevenell, L.A., R.B. Dreier and W.K. Jago. 1992. Summary of fiscal years 1991 and 1992 construction, hydrologic and geologic data from the Maynardville Limestone exit pathway monitoring program. Y/TS- 814. Martin Marietta Energy Systems, Inc., Oak Ridge Y-12 Plant, Oak Ridge, TN.
Solomon, D.K., G.K. Moore, L.E. Toran, R.B. Dreier and W.M. McMaster. 1992. A hydrologic framework for the Oak Ridge Reservation. ORNL/TM- . Oak Ridge National Laboratory.
Stokoe II, K. H., G. W. Wright, A. B. James, and M.R. Jose, 1994, Characterization of geotechnical sites by SASW method, in Geophysical characterization of sites, ISSMFE Technical Committee #iO, edited by R. D. Woods, Oxford Publishers, New Delhi.
USEPA, 1993. Use of Airborne, Surface and Borehole Geophysical Techniques at Contaminated Sites: A Reference Guide (3 volumes). EPA/625/R-921007. U.S. Environmental Protection Agency.
White, W. B ,, 1993. Carbonate terrain hydrogeology at the Oak Ridge Reservation. Internal Correspondence, Feb. 9, 1993. Martin Marietta Energy Systems, Oak Ridge, Tennessee.
Wilson, J.M. 1991. East Chesnut Ridge hydrogeologic characterization -- a geophysical study of two karst features. ECE-91-002. Environ Consult. Engineers, Inc. Prepared for Martin Marietta Energy Systems, Inc., Oak Ridge Y-12 Plant, Oak Ridge, TN.
Yuhr, L., R. Benson and D. Butler. 1993. Characterization of karst features using electromagnetics and microgravity: a strategic approach. pp. 209-228. In R.S. Bell and C.M. Lepper (eds.), 1993 Symp. on the Appl. of Geophys. to Environ. and Engin. Prob., Environmental and Engineering ‘Geophysical Sot., Englewood, CO.