geophysical survey systems, inc. bridgescan™ handbook …€¦ · geophysical survey systems,...
TRANSCRIPT


Geophysical Survey Systems, Inc. BridgeScan™ Handbook GPR Inspection of Bridge Decks
Copyright © 2017 Geophysical Survey Systems, Inc. MN72-618 Rev B All Rights Reserved
Copyright © 2017 Geophysical Survey Systems, Inc. All rights reserved including the right of reproduction in whole or in part in any form Published by Geophysical Survey Systems, Inc. 40 Simon St. Nashua, New Hampshire 03060 USA Printed in the United States SIR, UtilityScan, PaveScan RDM and RADAN are registered trademarks of Geophysical Survey Systems, Inc.
Geophysical Survey Systems, Inc. BridgeScan™ Handbook GPR Inspection of Bridge Decks
Copyright © 2017 Geophysical Survey Systems, Inc. MN72-618 Rev B All Rights Reserved
Table of Contents Introduction ......................................................................................................................................1 Chapter 1: Understanding RADAR Data .................................................................................3 GPR Antenna .....................................................................................................................................3
Antenna – Bridge Deck Interaction ................................................................................ 3 Transmitter – Receiver (T-R) Offset ................................................................................. 3
Material Properties .........................................................................................................................4 Feature Identification ....................................................................................................................6
Concrete Surface .................................................................................................................. 6 Target Reflection (Hyperbola) .......................................................................................... 7 Layer Reflection ..................................................................................................................... 8
BridgeScan .........................................................................................................................................8 Chapter 2: Setting Up ....................................................................................................................9 Assembling Your BridgeScan System (3-Wheel) .................................................................9
Unfold Cart and Attach Wheels ....................................................................................... 9 Mount the Antenna .......................................................................................................... 10
Assembling Your BridgeScan System (4-Wheel) .............................................................. 11 Attach Wheels and Handle ............................................................................................. 11 Attach SIR 4000 .................................................................................................................. 12
Software Setup for BridgeScan ............................................................................................... 12 Chapter 3: Data Collection ........................................................................................................ 15 Survey Design ................................................................................................................................ 15
Transverse Rebar ............................................................................................................... 16 Longitudinal Rebar ........................................................................................................... 16
Data Collection ............................................................................................................................ 17 Data Transfer.................................................................................................................................. 17 Chapter 4: Data Processing ...................................................................................................... 19 Creating a 3D Bridge File ........................................................................................................... 20
Batching Files ...................................................................................................................... 20 3D Assembly ....................................................................................................................... 21
Deterioration Mapping .............................................................................................................. 23 Excel and D Plot ............................................................................................................................ 25 Bridge QA ........................................................................................................................................ 29
Output ................................................................................................................................... 31 Chapter 5: Conclusion ................................................................................................................ 33

Geophysical Survey Systems, Inc. BridgeScan™ Handbook GPR Inspection of Bridge Decks
Copyright © 2017 Geophysical Survey Systems, Inc. MN72-618 Rev B All Rights Reserved

Geophysical Survey Systems, Inc. BridgeScan™ Handbook GPR Inspection of Bridge Decks
Copyright © 2017 Geophysical Survey Systems, Inc. MN72-618 Rev B All Rights Reserved 1
Introduction This Handbook is intended for users of GSSI’s BridgeScan SIR® 4000 system. It contains basic information on RADAR theory and method of operation that you would need to understand to perform a survey. The ultimate goal of this guide is to help you to collect good data and interpret that data in order to provide your client with usable information.
After a discussion of general GPR theory, we will discuss the hardware and software setup. Then, we will go into detail about the different methods of processing data. The BridgeScan setup is primarily used for bridge deck deterioration, but can also be used for QA on newly poured decks. Both methods will be discussed.
We assume here that you are using a 1.6 GHz antenna in a three or four-wheel cart attached to a SIR 4000 control unit, and RADAN® (RAdar Data ANalyzer) processing software for data processing and interpretation.

Geophysical Survey Systems, Inc. BridgeScan™ Handbook GPR Inspection of Bridge Decks
Copyright © 2017 Geophysical Survey Systems, Inc. MN72-618 Rev B All Rights Reserved 2

Geophysical Survey Systems, Inc. BridgeScan™ Handbook GPR Inspection of Bridge Decks
Copyright © 2017 Geophysical Survey Systems, Inc. MN72-618 Rev B All Rights Reserved 3
Chapter 1: Understanding RADAR Data
GPR Antenna The antenna is the crucial element of a RADAR system. It determines data quality, range resolution, maximum depth of penetration, etc. The 1.6 GHz antenna used in BridgeScan represents the state of the art in high-resolution, shallow penetration, ground-based antennas. It possesses the best combination of depth and resolution for the inspection of concrete deterioration in bridge decks. The basic principles explained below apply to most other bi-static antennas as well. Bi-static refers to the fact that the transmitter and receiver are two separate antenna elements even though they exist within the same enclosure. This differs from a mono-static antenna in that a mono-static uses the same antenna element to transmit and receive signals.
Antenna – Bridge Deck Interaction When you hold your antenna up in the air, it radiates energy within a very wide cone, almost a hemisphere. However, the 1.6 GHz and most other GPR antennas are designed to work in contact with or in close proximity to the surface of the bridge. When your antenna is on the bridge, the bridge “pulls” in the antenna’s energy and the antenna becomes coupled to the surface. To get the best performance, the antenna must stay within 1/10th of the wavelength from the surface – roughly one-half inch for the 1.6 GHz. Increasing the air gap should be avoided because a big air gap will cause most of the RADAR energy to be reflected off of the bridge surface rather than penetrate.
The direction of the RADAR energy as it moves into the bridge is mainly determined by the surface of the deck. The signal normally moves perpendicular to the surface, independent of the antenna position. The angle that you hold the antenna over the bridge doesn’t matter. The RADAR energy will still enter perpendicular to the surface.
Transmitter – Receiver (T-R) Offset The antenna housing contains two elements, one of them transmitting the signal and the other receiving the reflections. The offset (distance) between transmitter and receiver (T-R offset) that is often ignored in deep surveys, is comparable to target depth in BridgeScan applications. The T-R offset in the 1.6 GHz antenna is 2.3” (58 mm), and it is certainly possible for you to have objects in the slab that are only 2.3" (58 mm) deep. This value is taken into account for depth calculations in RADAN for BridgeScan software and velocity calculations in Migration (explained later). This spacing is important to know because it is equivalent to the “fuzzy” zone in your data. Targets in the top 2.3” (58 mm) may appear fuzzy in raw data, but will show up fine with a computer processing technique called Background Removal. That process is explained later in this guide.
One other concern with objects in the top 2.3" (58 mm) of the slab is that the depth may be off in raw data. When we think of depth to target, we imagine a straight line down from the bottom of the antenna. This is essentially true for targets deeper that 2.3" (58 mm), but for objects shallower than that, the RADAR signal actually has a relatively long distance to travel. Since the energy must move at an angle rather than straight down and back from the center of the antenna, it may appear slightly deeper in the raw data. RADAN corrects this issue in processing the data.
Geophysical Survey Systems, Inc. BridgeScan™ Handbook GPR Inspection of Bridge Decks
Copyright © 2017 Geophysical Survey Systems, Inc. MN72-618 Rev B All Rights Reserved 4
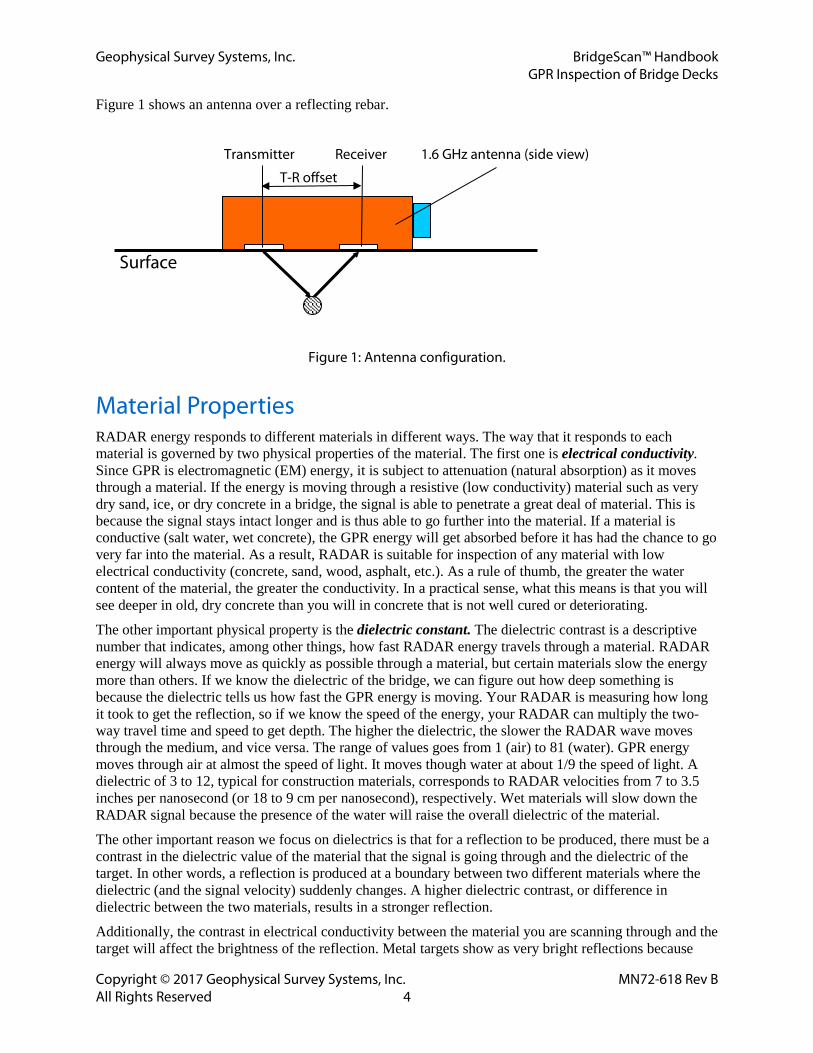
Figure 1 shows an antenna over a reflecting rebar.
Transmitter Receiver 1.6 GHz antenna (side view)
Surface
Figure 1: Antenna configuration.
Material Properties RADAR energy responds to different materials in different ways. The way that it responds to each material is governed by two physical properties of the material. The first one is electrical conductivity. Since GPR is electromagnetic (EM) energy, it is subject to attenuation (natural absorption) as it moves through a material. If the energy is moving through a resistive (low conductivity) material such as very dry sand, ice, or dry concrete in a bridge, the signal is able to penetrate a great deal of material. This is because the signal stays intact longer and is thus able to go further into the material. If a material is conductive (salt water, wet concrete), the GPR energy will get absorbed before it has had the chance to go very far into the material. As a result, RADAR is suitable for inspection of any material with low electrical conductivity (concrete, sand, wood, asphalt, etc.). As a rule of thumb, the greater the water content of the material, the greater the conductivity. In a practical sense, what this means is that you will see deeper in old, dry concrete than you will in concrete that is not well cured or deteriorating.
The other important physical property is the dielectric constant. The dielectric contrast is a descriptive number that indicates, among other things, how fast RADAR energy travels through a material. RADAR energy will always move as quickly as possible through a material, but certain materials slow the energy more than others. If we know the dielectric of the bridge, we can figure out how deep something is because the dielectric tells us how fast the GPR energy is moving. Your RADAR is measuring how long it took to get the reflection, so if we know the speed of the energy, your RADAR can multiply the two-way travel time and speed to get depth. The higher the dielectric, the slower the RADAR wave moves through the medium, and vice versa. The range of values goes from 1 (air) to 81 (water). GPR energy moves through air at almost the speed of light. It moves though water at about 1/9 the speed of light. A dielectric of 3 to 12, typical for construction materials, corresponds to RADAR velocities from 7 to 3.5 inches per nanosecond (or 18 to 9 cm per nanosecond), respectively. Wet materials will slow down the RADAR signal because the presence of the water will raise the overall dielectric of the material.
The other important reason we focus on dielectrics is that for a reflection to be produced, there must be a contrast in the dielectric value of the material that the signal is going through and the dielectric of the target. In other words, a reflection is produced at a boundary between two different materials where the dielectric (and the signal velocity) suddenly changes. A higher dielectric contrast, or difference in dielectric between the two materials, results in a stronger reflection.
Additionally, the contrast in electrical conductivity between the material you are scanning through and the target will affect the brightness of the reflection. Metal targets show as very bright reflections because
T-R offset
Geophysical Survey Systems, Inc. BridgeScan™ Handbook GPR Inspection of Bridge Decks
Copyright © 2017 Geophysical Survey Systems, Inc. MN72-618 Rev B All Rights Reserved 5
they are conductive. In addition to the reflected RADAR wave, metal targets will return a small extra signal that results from them becoming charged. Non-metal, non-conductive targets will only return the reflected energy.
Metal, even as thin as aluminum foil, is a complete reflector of RADAR energy. The reflection from it is clearly visible, but the targets behind it will not be detected. A fine wire mesh (2x2 inch, 5x5 cm or smaller) acts like sheet metal and is impenetrable. You will not see targets beneath such a tight mesh.
The strength (brightness) of a reflection is proportional to the dielectric contrast between the two materials. The greater the contrast, the brighter the reflection (examples follow):
Table 1.
Boundary Dielectric Contrast Reflection Strength
Asphalt - Concrete Medium Medium
Concrete - Sand Low Weak
Concrete - Air High, phase reversal Strong
Concrete Deck - Concrete Beam None No reflection
Concrete - Metal High Strong
Concrete - Water High Strong
Concrete - PVC Low to Medium, phase reversal Weak
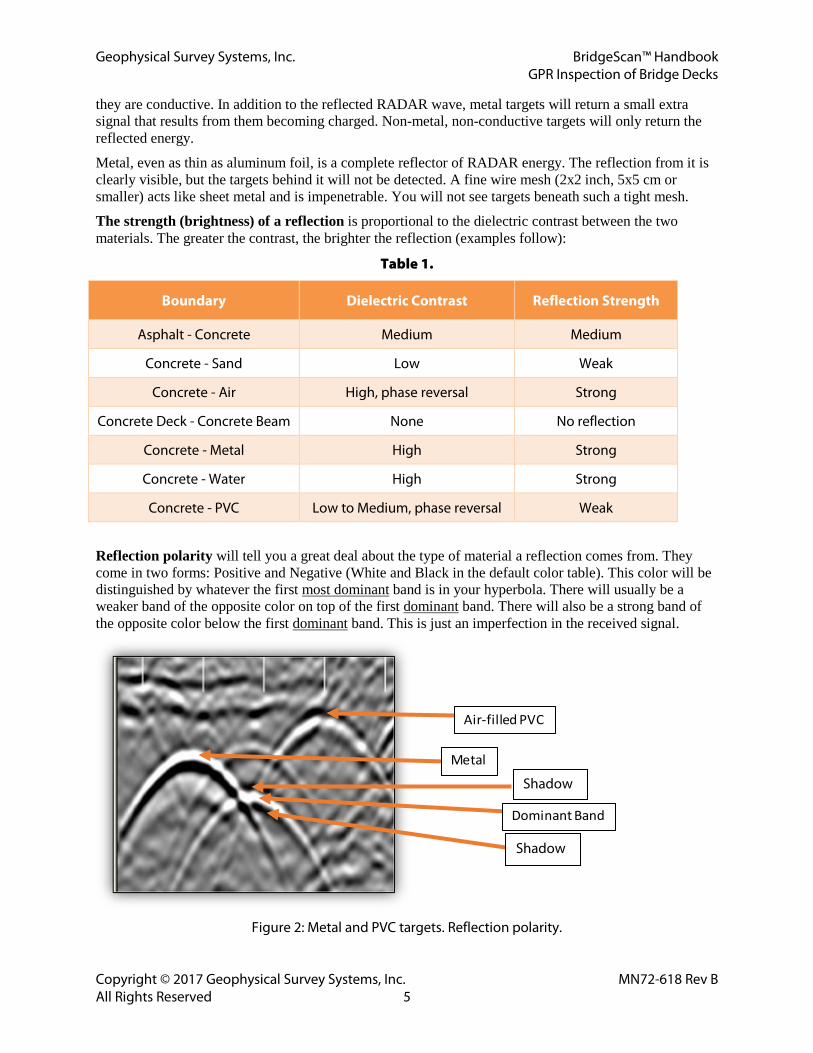
Reflection polarity will tell you a great deal about the type of material a reflection comes from. They come in two forms: Positive and Negative (White and Black in the default color table). This color will be distinguished by whatever the first most dominant band is in your hyperbola. There will usually be a weaker band of the opposite color on top of the first dominant band. There will also be a strong band of the opposite color below the first dominant band. This is just an imperfection in the received signal.
Figure 2: Metal and PVC targets. Reflection polarity.
Air-filled PVC
Metal
Dominant Band
Shadow
Shadow

Geophysical Survey Systems, Inc. BridgeScan™ Handbook GPR Inspection of Bridge Decks
Copyright © 2017 Geophysical Survey Systems, Inc. MN72-618 Rev B All Rights Reserved 6
A negative reflection tells you that the RADAR wave sped up when it reached an object. Often in a bridge or structural scan this means that your wave has reflected off of an air filled PVC or an air void. A RADAR wave will travel fastest through air.
A positive reflection tells you that the RADAR wave has slowed down. In a bridge or structure scan, this usually means that you received a reflection off of a metal object. This metal object could be rebar, a PT cable, a metal conduit, etc. A single reflection won’t tell you exactly what the object is, just a general idea of what the object may be. From here, you have to bring in your own knowledge about the area.
Feature Identification
Concrete Surface The very first signal in a scan is often called “direct coupling” between transmitter and receiver. It is used to identify the surface position in a scan. With the 1.6 GHz antenna, the surface is located at the first positive (white) peak within the direct coupling (see Figure 8).
Direct Surface Coupling
Rebar
Figure 3: Oscilloscope (left) and Linescan displays of a reinforced balcony.
In a Linescan display, direct coupling looks like straight horizontal bands on top of the data window. It is a combination of the transmit pulse in air and surface reflection from the top of the material. It arrives at the receiver before the signal penetrates into the material, so the direct coupling carries little information about the structure.
Yet its amplitude depends on the dielectric of the material (see above). Variations in amplitude may indicate change in properties (increased moisture, for instance).
Direct coupling disguises the beginning of the scan. Making it as short as possible is a major design goal. The 1.6 GHz antenna has an extremely short direct coupling that allows it to detect targets from 1.5" (3.75 cm) below surface and accurately measure their depths. Targets within the first 1.5" from the surface may indicate their presence by changing the appearance of the direct coupling, but their position and depth cannot always be accurately determined.
The negative peak (a straight horizontal black line in the Linescan display) immediately below the surface is a part of the direct coupling. The first positive peak doesn’t show any visible variations, though its amplitude may vary along the profile. Some variations may be seen within the negative peak. They usually indicate changes in concrete properties within the top inch of material, though their accurate interpretation is difficult.
Slab Bottom

Geophysical Survey Systems, Inc. BridgeScan™ Handbook GPR Inspection of Bridge Decks
Copyright © 2017 Geophysical Survey Systems, Inc. MN72-618 Rev B All Rights Reserved 7
Target Reflection (Hyperbola) When the antenna crosses a pipe-like target (pipe, cable, rebar) at a right angle, the resulting image looks like an inverted U or V – a hyperbola is the descriptive term for its shape (note them in Figure 4). This happens because the radiated antenna beam has the shape of a wide cone, thus the RADAR can see the target not only when on top of it, but also in several scans before and after that position. The hyperbola shape reveals the antenna approaching the target and then going away from it. Its summit is exactly where the target is located. The groove at midpoint between transmitter and receiver on the 1.6 GHz antenna housing indicates the target position (see Figure 4). Hyperbolic reflections may sometimes seem a nuisance, but in fact they help the analyst by making even small targets readily visible.
The shape of a hyperbola depends on two parameters:
• Scan spacing: smaller scan spacing (more scans per inch/cm) produces wider hyperbolas;
• RADAR wave velocity: higher velocity (lower dielectric) produces wider hyperbolas and vice versa.
Scan spacing is controlled by the operator, so it is known from the survey data. This allows the velocity to be derived from the shape of a hyperbola using the Migration function in the RADAN post-processing software and on the SIR 4000. This will be discussed in detail later.
The brightness (amplitude) of a single hyperbolic reflection follows the same rules as the examples given in Table 1. Metal objects produce strong clear reflections. In contrast, a PVC pipe reflection will have the same shape, but with a much lower amplitude. Therefore, it’s image will be weaker (dimmer).
Remember: A reflection always comes from the very top of the target.
Receiver Groove Transmitter 1.6 GHz antenna (side view)
Figure 4: Locating a target.
Targets of larger diameter produce brighter reflections. The shape of a hyperbola does not change significantly with target size for any diameter under 2" (5 cm) – all such targets are point-like for the RADAR as their size is a fraction of the wavelength. This means that any targets under 2" (5 cm) in diameter will produce hyperbolas of the same size and shape. Relative sizing is possible for targets of a diameter greater than 2” (5 cm) as long as they are located the same depth, are crossed at the same orientation, and are surrounded by the same material.
Composite targets like a PVC conduit with electric wires inside can produce hyperbolic reflections that do not always have the perfect shape of the hyperbola from a round pipe or rod. There are several reflections within each of them which results in a somewhat distorted hyperbola.
Direct coupling

Geophysical Survey Systems, Inc. BridgeScan™ Handbook GPR Inspection of Bridge Decks
Copyright © 2017 Geophysical Survey Systems, Inc. MN72-618 Rev B All Rights Reserved 8
A hyperbola may also appear distorted or incomplete when the survey line crosses the target diagonally. As the survey line direction becomes nearly parallel to the linear target, the reflection appears as a slightly curved line. If the antenna moves parallel to it, the target looks like a continuous layer. The best way to verify its nature and to locate it is to scan in the transverse direction (across the suspected target) to see if a hyperbolic reflection appears. Layer Reflection When scanning over a continuous layer boundary (asphalt-concrete) the antenna repeatedly receives reflections from sections of that boundary within the antenna footprint. They form a layer reflection that resembles the reflecting boundary.
BridgeScan For our application, we are paying close attention to factors that arise when the concrete in the bridge deck becomes deteriorated. As deterioration occurs, the surrounding concrete tends to break up/weaken. This weakened concrete allows for moisture to seep in, which will increase the dielectric constant as well as the conductivity. A higher dielectric constant means that the RADAR energy will travel slower though the material, which means it will take longer for the reflected wave to return from the reinforcement. If rebar appears to increase in depth, we can assume that deterioration is probable in this area. An increase in conductivity is also an indicator of deterioration. We can observe this by noting the strength of reflection, or amplitude, of waves received from the top layer of rebar on a bridge deck. A high conductivity material will attenuate our transmitted wave faster, making the reflection weaker. So if we assume that the rebar in our deck is of the same type and at the same physical depth – when we see it appear deeper, and/or with a lower amplitude reflection, we can assume that is area is deteriorated. This line of thinking is the basis for the American Society for Testing and Materials (ASTM) method of using GPR for a bridge deck deterioration survey.
Concrete Bottom

Geophysical Survey Systems, Inc. BridgeScan™ Handbook GPR Inspection of Bridge Decks
Copyright © 2017 Geophysical Survey Systems, Inc. MN72-618 Rev B All Rights Reserved 9
Chapter 2: Setting Up This section will review how to assemble the physical hardware (cart, antenna, control unit) and move into software setup with the SIR 4000. We will take note of the most crucial settings and also review how to calibrate your survey wheel. It’s important to do this in a bridge deck examination to make sure that you are tracking distance accurately.
Assembling Your BridgeScan System (3-Wheel)
Unfold Cart and Attach Wheels
1 Unfold the cart frame and insert the black tips of the top assembly into the receivers on the front wheel fork.
2 Insert the wheel shaft into the axle. It will slide all the way in and lock securely. To remove wheels, press the button by the base of the wheel and pull the it straight out. Note: The wheels are foam filled and do not require inflation.
3 Slide the front wheel onto the front wheel fork and tighten clamp. When the clamp is slightly tight, turn the handle to the locked position. This will further tighten the clamp. Exercise care not to over-tighten the front wheel as this may result in damage to the front fork.

Geophysical Survey Systems, Inc. BridgeScan™ Handbook GPR Inspection of Bridge Decks
Copyright © 2017 Geophysical Survey Systems, Inc. MN72-618 Rev B All Rights Reserved 10
Mount the Antenna
4 Place the antenna in the bottom of the tub and stick the white plastic plate with the Velco strips to the Velco on top of the antenna. Secure the assembly with straps. Take care that the ridged, blue cable is coiled above the white, plastic plate.
5 With the arrows on the top of the antenna housing pointing toward the front of the cart (blue antenna tubing comes out of back), place the tub under the cart so that the tub handles face the front and the back of the cart.
6 Lift the tub to fit the white fiberglass brackets under the handle and insert them through the two double holes on the frame.
7 Secure with the metal pins. The antenna tub should just touch the ground surface. It is intended to be loose because it needs to be able to float over small obstacles. Be sure that the antenna is centered in the tub.
8 Connect the female end of the control cable to port that is labeled CONTROL, connect the lead from the survey wheel (4 pin) to the adapter cable, then the adapter cable to the canvas box attached to the antenna. These leads should only be hand tightened.

Geophysical Survey Systems, Inc. BridgeScan™ Handbook GPR Inspection of Bridge Decks
Copyright © 2017 Geophysical Survey Systems, Inc. MN72-618 Rev B All Rights Reserved 11
Assembling Your BridgeScan System (4-Wheel)
Attach Wheels and Handle
1 Attach wheels to cart frame. Line up the flat side of the “D” shaped axle rod with the corresponding flat part of the “D” shaped hole on the cart frame. Slide the rod into the cart frame while keeping the blue/silver button at the center of the wheel hub depressed.
2 Slide the handle bottom into the handle receiver on the cart frame. Flip the handle locking lever up to the closed position to secure the handle in place. You will also need to attach the SIR 4000 mounting bracket to the handle top. The three threaded knobs used for attachment are already in the handle top. Attach the Cable Guide to the back of the handle using the screws on the handle.
3 Place the capsule bottom into the frame and thread the nylon support straps through the buckles on the cart frame corners. Each stitched line is 1 inch (2.54 cm) apart. The capsule bottom is a replaceable item and it is OK for it to drag on the ground. You will extend its life by adjusting the nylon support straps so much of the weight is taken by the straps and the bottom is just slightly in contact with the ground. If you are working in rough terrain then you should adjust the straps for maximum travel to allow the capsule to follow the ground surface topography.

Geophysical Survey Systems, Inc. BridgeScan™ Handbook GPR Inspection of Bridge Decks
Copyright © 2017 Geophysical Survey Systems, Inc. MN72-618 Rev B All Rights Reserved 12
Attach SIR 4000 Unscrew the top two and middle two screws on the back of the SIR 4000 to attach the mounting plate. Screw the plate on to the back and set the two holes along the back of the plate into the mounting screws on the handle mount. Pull in on the back two levers until they snap into place. This will keep the SIR 4000 steady. It can then be angled with the thumbscrew/pull key duo by the handle mount thumbscrews.
Software Setup for BridgeScan 1 Push the green power button in the top-corner to power on the SIR 4000.
2 On the Introduction screen, make sure that Expert Mode is selected. On the bottom bar, set your units appropriately (English or Metric) and make sure the antenna is recognized. If your antenna model is displayed at the bottom, then you do not need to do anything further in this regard.
a) If you see the word Antenna, press the button below it and choose the correct antenna type (1.6 GHz). Then select Done.
3 Select New Project and name your project. The setup screen will load when you choose Apply.

Geophysical Survey Systems, Inc. BridgeScan™ Handbook GPR Inspection of Bridge Decks
Copyright © 2017 Geophysical Survey Systems, Inc. MN72-618 Rev B All Rights Reserved 13
4 Navigate to System > Recall Setup > BridgeScan. This will load the correct parameters for your BridgeScan survey. It may be useful to check that important parameters are set properly:
a) RADAR
o Collect Mode: Distance
o Samples/Scan: 512
o Scans/Unit: 24 scans/ft (~80 scans/m)
o Dielectric: 6.0
o Depth Range: 20 in. (0.5 m)
b) PROCESS
o Gain Mode: Manual
o Edit Gain Curve: 1 point
5 This recall will load a SW calibration which is accurate for flat surfaces. It may be beneficial to calibrate the system on the bridge to be surveyed, as distance traveled and rebar spacing may be important. Navigate to System > Calibrate SW and follow the prompts in the window (5 steps). Calibrate twice and make sure that both values are close to one another (no more than 15 ticks apart).
6 When you are comfortable with the setup, press START to begin data collection.

Geophysical Survey Systems, Inc. BridgeScan™ Handbook GPR Inspection of Bridge Decks
Copyright © 2017 Geophysical Survey Systems, Inc. MN72-618 Rev B All Rights Reserved 14

Geophysical Survey Systems, Inc. BridgeScan™ Handbook GPR Inspection of Bridge Decks
Copyright © 2017 Geophysical Survey Systems, Inc. MN72-618 Rev B All Rights Reserved 15
Chapter 3: Data Collection With a new file open, you first need to determine which layer of rebar is on top. This can sometimes be found in “as-built” drawings of a deck, but it’s much quicker to use your GPR system to discover/confirm this. After recalling the BridgeScan setup on your site and confirming your parameters are correct, press START. Walk along the bridge until you see a few rebar (parallel to traffic) and then walk perpendicular to traffic until you have a few more rebar. It’s easier to keep these walks on the same file, rather than splitting this into two. Your screen may look like the following:
Notice that the rebar on the right appears deeper than the rebar on the left. This would mean that the top rebar is running perpendicular to traffic (transverse) in this example. Your profiles would then need to be collected with the cart moving parallel to traffic. This isn’t always the case, so it’s best to confirm this in the field ahead of time. Your survey design will depend on the outcome of this investigation.
Survey Design A BridgeScan survey will have files collected parallel to one another and spaced 2 feet or 0.5 meter apart. Files must be collected with the antenna moving perpendicular to the direction of the top layer of rebar. If we continue to use the above example, we would need to move the cart parallel to traffic in order to receive good BridgeScan data. We also need to make sure that each file is the same length. Rather than drawing out the start and end points of each line, we can use a strong obvious reflector as our start and end point: the bridge joint. In this case, each file would start before the first bridge joint and end after the last bridge joint. We can then correct for file length using these as guides in RADAN.

Geophysical Survey Systems, Inc. BridgeScan™ Handbook GPR Inspection of Bridge Decks
Copyright © 2017 Geophysical Survey Systems, Inc. MN72-618 Rev B All Rights Reserved 16
Transverse Rebar For top rebar running perpendicular to traffic.
1 Collect data running parallel to traffic.
2 Start first file 2 feet or 0.5 meter from the curb.
3 Collect parallel profile lines spaced 2 feet or 0.5 meter apart.
4 Start each file before the first bridge joint and end after the last bridge joint
5 For long bridges, draw/place physical marks every so often along your profiles to keep the cart moving straight.
Longitudinal Rebar For top rebar running parallel to traffic.
1 Collect data running perpendicular to traffic.
2 Start first file 2 feet or 0.5 meter from first bridge joint.
3 Collect parallel profiler lines spaced 2 feet or 0.5 meter apart.
4 Start each file with the wheels touching the curb at your back, and move until the front wheel(s) touch the far curb.
5 For long bridges, draw/place physical marks every so often along your profiles to keep the cart moving straight.

Geophysical Survey Systems, Inc. BridgeScan™ Handbook GPR Inspection of Bridge Decks
Copyright © 2017 Geophysical Survey Systems, Inc. MN72-618 Rev B All Rights Reserved 17
Data Collection 1 Line up for your first profile and press START to begin data collection.
2 Collect data by pushing the cart forward.
3 When you pass over the last bridge joint (transverse) or the front wheel touches the curb (longitudinal), press STOP. Don’t hold STOP, just a quick press. You may need to select save if you turned autosave off.
4 Line up for your next file and press START.
5 Repeat steps 1-4 until you collect your last file. On your last file, press and hold STOP. You may need to hold STOP again if Autosave is turned off. This will bring you back to the setup screen.
Data Transfer 1 Enter Playback mode from the main menu.
2 Select the files you would like to transfer by either hitting Select All or by highlighting and pressing the scroll wheel to place a check next to files. You may need to switch data-paths to the correct folder.
3 Insert a USB into the SIR 4000 and press Copy to USB.
4 Remove USB and transfer files to your PC for RADAN processing.

Geophysical Survey Systems, Inc. BridgeScan™ Handbook GPR Inspection of Bridge Decks
Copyright © 2017 Geophysical Survey Systems, Inc. MN72-618 Rev B All Rights Reserved 18

Geophysical Survey Systems, Inc. BridgeScan™ Handbook GPR Inspection of Bridge Decks
Copyright © 2017 Geophysical Survey Systems, Inc. MN72-618 Rev B All Rights Reserved 19
Chapter 4: Data Processing RADAN (RADAR Data Analyzer) is a software program developed by GSSI to assist with processing and interpreting GPR data. The various processes are split into different RADAN modules, which can be purchased on an as-needed basis. For our purposes, the BridgeScan module will be necessary to create the final product. Launching the software will display the following screen:
1 GSSI Button
2 My Files/Processes/Proc. List Pane
3 Ribbons
4 Data Pane
5 Global Settings/Properties Pane
6 Tables Pane
We will start with the Global Settings Pane (5). In this pane we can set our Application Specific Display to Ground-Coupled BridgeScan. This will simplify the screen, making it display only the functions and features we need to process BridgeScan data. Our screen will now look like the following.
3 2 4
1 5 6

Geophysical Survey Systems, Inc. BridgeScan™ Handbook GPR Inspection of Bridge Decks
Copyright © 2017 Geophysical Survey Systems, Inc. MN72-618 Rev B All Rights Reserved 20
Creating a 3D Bridge File
Batching Files 1 Open the Global Settings pane if it is not already. This is accessible in Home > Other Windows.
Click on Global Settings to activate it.
2 Double click on Source Directory and navigate to the location of the folder containing your BridgeScan data. Click on the folder and click OK.
3 Change your vertical and horizontal units to appropriate values.
4 Click on the Main Button > Assemble Data File > Batch of Files.
5 Type in a batch file name and click Next.
6 Add the bridge files from the left pane to the right pane by:
a) Double clicking on the File, or
b) Click on the File and click Add >, or
c) If appropriate, click Add All, or
d) Highlight a group of files and click Add >
e) Remove files from the right pane by doing the same procedures in the right pane.

Geophysical Survey Systems, Inc. BridgeScan™ Handbook GPR Inspection of Bridge Decks
Copyright © 2017 Geophysical Survey Systems, Inc. MN72-618 Rev B All Rights Reserved 21
7 Click Finish.
8 Your files will now open. They all now have a [Filename] P_1 version. We want to use these files to assemble our 3D BridgeScan file. These files now contain all of the parameters we collected our data in the field with. These files exist in the Proc folder within your source directory.
3D Assembly
1 Change your Color Xform to 1 – Exp. This will make editing the start and end locations easier.
2 Click on Processing > Create 3D File.
3 Click Browse, navigate to the folder containing your files, and select the Proc folder within.
4 Type in an output filename and click Next.
5 Add the bridge files from the left pane to the right pane by:
a) Double clicking on the File, or
b) Click on the File and click Add >, or
c) If Appropriate, click Add All, or
d) Highlight a group of files and click Add >
e) Remove files from the right pane by doing the same procedures in the right pane.
f) Make sure your files are added in the correct order along the bridge. RADAN will assemble them in the order they are added.
6 Click Next.
7 File Group 3D Area:
a) Enter the length of the bridge.
b) Enter the starting distance of the FIRST line collected from the Curb or Lane Stripe.
c) Enter the spacing between each profile or line.
d) Click the down arrow to select how the files were collected.
e) Select whether the files were collected Standard or Inline (typically Standard).
8 Click Next.
9 Adjust File Group Details: Can edit the individual profiles.
• Filename: The name of each file collected. • Across Dist.: The distance from the curb of each of the files collected.

Geophysical Survey Systems, Inc. BridgeScan™ Handbook GPR Inspection of Bridge Decks
Copyright © 2017 Geophysical Survey Systems, Inc. MN72-618 Rev B All Rights Reserved 22
• Rev. Dir.: If the files were collected in a zig-zag pattern and this was specified, an “X” will automatically be entered that the file will need to be reversed.
• St. Loc.: This is the starting location of the file • Edit St. Loc.: Correct the starting location of the file
as necessary. • End Loc.: This is the ending location of the file. • Edit End Loc.: Correct the ending location of the file
as necessary. 10 To edit the Starting and Ending Locations of each file:
• Click Edit St. Loc. or Edit End Loc. for EACH file, one at a time. • Move the slider bar until the vertical line on the data matches the beginning of the bridge. This
point will likely correspond with the middle of the bridge joint. Use the Left and Right arrow keys on the keyboard to make minor adjustments, as well as clicking on the Up and Down arrows on the screen
• Click OK. • Repeat this process for the Starting and Ending Locations of all files.
11 Click Next.
12 Enter the Bridge Joint Skew Angle: This will be a positive number if the bridge is angled to the right and negative number if the bridge is angled to the left.
13 Click Finish.

Geophysical Survey Systems, Inc. BridgeScan™ Handbook GPR Inspection of Bridge Decks
Copyright © 2017 Geophysical Survey Systems, Inc. MN72-618 Rev B All Rights Reserved 23
Deterioration Mapping This process will perform three functions to our data:
• Time-Zero Correction: not necessary for SIR 4000 data but not detrimental if left on
• Migration: focuses rebar hyperbola into a dot for easier picking
• Auto Target: will attempt to place targets on all rebar. Manual adjustments are recommended.
1 When the Deterioration Mapping icon is selected from the Processing Group, the left pane will display the Deterioration Mapping Process Bar.
2 Velocity Calculation: Choose how the radar wave velocity is calculated.
• Surface: Select the Surface type of the bridge deck. Either Asphalt Overlay or Concrete Surface.
• Time-Zero Amplitude Threshold: RADAN defaults to the location of the surface. If this isn’t calculated correctly it can manually be adjusted.
• Velocity (Top Layer): RADAN will use the velocity from the File Header information. If this is incorrect it can manually be adjusted.
• Dielectric Constant: This is related to the Velocity and will update as the Velocity if modified, and vice versa.
3 Click Apply and Reset, and adjust if necessary. You’ll likely need to change the dielectric a few times to get the correct result. When you click apply, take note of the direction that the tails of the hyperbola point. If they point up, move the dielectric up. Down, move the dielectric down. No tails (dots) is the goal for setting this properly. See pictures below for details.
4 Click OK once desired results are achieved.
Geophysical Survey Systems, Inc. BridgeScan™ Handbook GPR Inspection of Bridge Decks
Copyright © 2017 Geophysical Survey Systems, Inc. MN72-618 Rev B All Rights Reserved 24
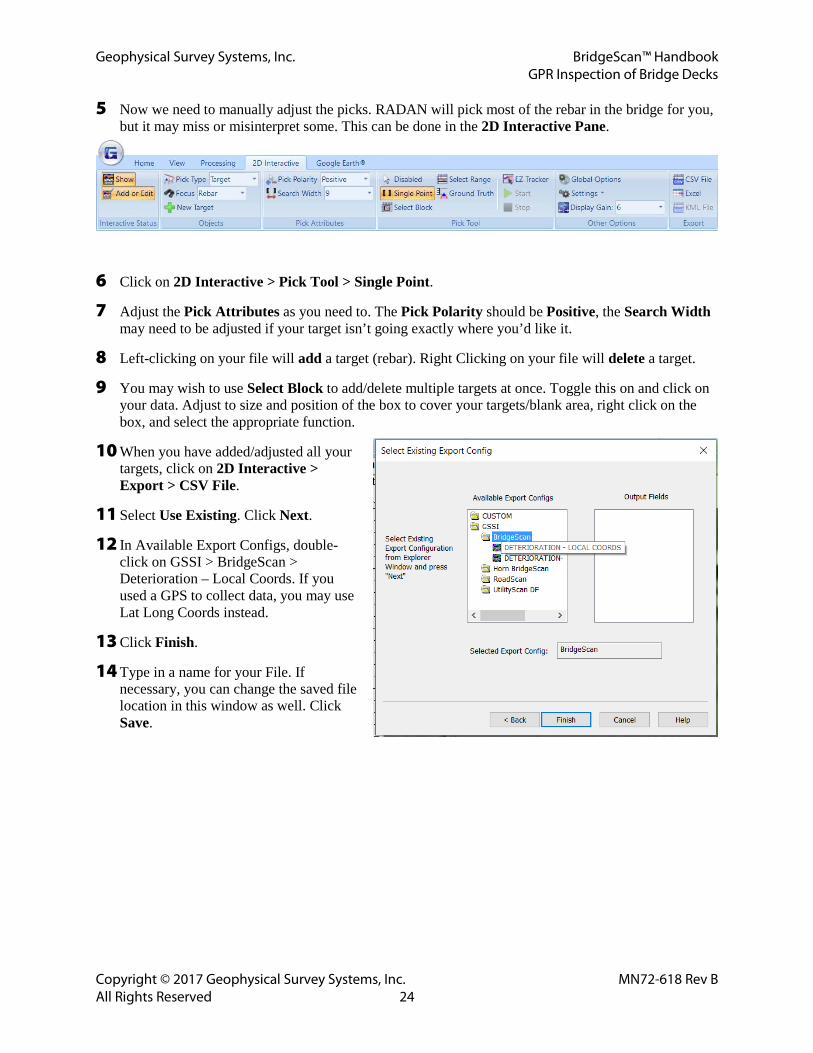
5 Now we need to manually adjust the picks. RADAN will pick most of the rebar in the bridge for you, but it may miss or misinterpret some. This can be done in the 2D Interactive Pane.
6 Click on 2D Interactive > Pick Tool > Single Point.
7 Adjust the Pick Attributes as you need to. The Pick Polarity should be Positive, the Search Width may need to be adjusted if your target isn’t going exactly where you’d like it.
8 Left-clicking on your file will add a target (rebar). Right Clicking on your file will delete a target.
9 You may wish to use Select Block to add/delete multiple targets at once. Toggle this on and click on your data. Adjust to size and position of the box to cover your targets/blank area, right click on the box, and select the appropriate function.
10 When you have added/adjusted all your targets, click on 2D Interactive > Export > CSV File.
11 Select Use Existing. Click Next.
12 In Available Export Configs, double- click on GSSI > BridgeScan > Deterioration – Local Coords. If you used a GPS to collect data, you may use Lat Long Coords instead.
13 Click Finish.
14 Type in a name for your File. If necessary, you can change the saved file location in this window as well. Click Save.

Geophysical Survey Systems, Inc. BridgeScan™ Handbook GPR Inspection of Bridge Decks
Copyright © 2017 Geophysical Survey Systems, Inc. MN72-618 Rev B All Rights Reserved 25
Excel and D Plot This section will assume some experience with the third party software Microsoft Excel and D Plot (as an Excel Add-In). For further questions, please review the user’s manual for these programs.
1 Open Excel.
2 Open the CSV file created in RADAN. You will have three columns:
• X Location of Rebar • Y Location of Rebar • Amplitude of Rebar
3 Select the C Column and Sort & Filter your data sheet from Largest to Smallest. If a warning appears, choose Expand the selection and click Sort.
With our data organized properly, we now need to determine the Threshold Value (amplitude) which separates our “good” rebar from “bad” rebar. There is an ASTM method outlining this procedure (Designation: D 6087-07). GSSI has its own adjusted procedure. Both will be outlined below. It is recommended to do both, and choose the one which best correlates with any additional information you may have on the bridge (pictures, chain dragging, half-cell potential, etc.). It is possible to receive noticeably different results between the two methods. Before continuing, observe the top 5 and bottom 5 amplitude values. If any of them are drastically different (jumping from -23dB to -29dB, for example), delete them. They may have been accidental picks, possibly at the bridge joint. Leaving these in may skew your results.
4 Take note of your total number of rebar. This is will be the last row of your data minus 1 (the first row is not a rebar; it is column titles).
5 Determine the amplitude of the top rebar (ASTM) or the average of the top 10% of rebar (GSSI)
• It’s best to work with your unused cells as you do this. For the ASTM value, type in: =C2. This will make the cell equal the value in C2, which should be the top value after sorting your data. For GSSI’s, you’ll need to remember your total number of rebar, and calculate what 10% of that number is. If we call this number X, type in: =AVERAGE(C2:CX). This will make the cell equal to the average of the top 10% of your bar.

Geophysical Survey Systems, Inc. BridgeScan™ Handbook GPR Inspection of Bridge Decks
Copyright © 2017 Geophysical Survey Systems, Inc. MN72-618 Rev B All Rights Reserved 26
6 Subtract 6 and 7 dBs from both the ASTM and GSSI values. This should leave you with four possible threshold values. These values potentially separate our good rebar from bad rebar. It may be hard to decide one without seeing how much of the bridge is good or bad in each case.
7 To calculate % Good:
• Find your threshold value in Column C. Take note of the row (rebar) number.
• Type in: =(Number of good rebar/Total number of rebar)*100
• NOTE: The “number of good rebar” and “total number of rebar” should be actual numbers.
8 To calculate % Bad:
• Subtract the % Good from 100.
9 Repeat this procedure for all four threshold values.
After obtaining all four values, you’ll need to decide on one to follow through and make your final plot with. Consider any other information you may have on the bridge to make this decision. When a value is decided, the contour map in D Plot can be created. D Plot (www.dplot.com) is an Excel Add-In that must be purchased before use. If you are in possession of another graphing program, it will likely work in a similar manner.
10 Select all three columns in Excel (A, B, and C).
11 Click on Add-Ins > D Plot > XYZ Surface. The D Plot grid window will open.

Geophysical Survey Systems, Inc. BridgeScan™ Handbook GPR Inspection of Bridge Decks
Copyright © 2017 Geophysical Survey Systems, Inc. MN72-618 Rev B All Rights Reserved 27
12 Click on Options > Contour Options.
• Type = Shaded Bands
• Lines/Levels = Adjust intervals. To simplify, choose Custom Levels, click >>, keep the top and bottom interval, delete the middle values and type in your threshold value.
• Colors = Color or Custom. To simplify, choose Custom, click >>, change number of colors to 2, make the low value Red and the high value Green. This will shade the bad portion of bridge (below threshold) red and the good portion of bridge green.
• Scaling = X:1, Y:1.

Geophysical Survey Systems, Inc. BridgeScan™ Handbook GPR Inspection of Bridge Decks
Copyright © 2017 Geophysical Survey Systems, Inc. MN72-618 Rev B All Rights Reserved 28
13 Click Apply to view, and adjust if needed. Click OK when satisfied.
14 To change the Titles/Axes and add captions, go to Text > Titles/Axes
15 When satisfied, click Save and Print to print your plot. You may also choose to screen capture an image of the generated plot to add in to a final report.

Geophysical Survey Systems, Inc. BridgeScan™ Handbook GPR Inspection of Bridge Decks
Copyright © 2017 Geophysical Survey Systems, Inc. MN72-618 Rev B All Rights Reserved 29
Bridge QA The BridgeScan module has a process specifically for quality assurance (QA) studies on new concrete bridge decks. This technique is not applicable to asphalt overlaid decks. The goal of this application is to ensure that there is adequate concrete cover over the top layer of reinforcing steel. A single representative profile per travel lane is all that is required to perform Bridge QA. Typically, this profile is along the wheel path of the lane as opposed to the shoulder. The data must be collected perpendicular to the trend of the top layer of rebar. This means that if the rebar are longitudinal, the profiles must be collected across the bridge deck, not along it. If a complete map of cover thickness is required, then a 3D file can be collected following the instructions given in the SIR System manual. 1 When the Bridge QA icon is selected from the Processing Group, the left pane
will display the Bridge QA Process Bar.
2 Velocity Calculation: Choose how the radar wave velocity is calculated.
• Specify Concrete Velocity: Use this method if Use Calibration Hole Data is not possible. o Enter the estimated concrete velocity or velocity from previously
processed data.
o The default velocity is 3.74 inches/nanosecond (9.5 cm/ns).
• Use Calibration Hole Data (recommended): Calibration data is obtained by measuring the depth to one of the rebar that the antenna passed directly over during data collection.
o Enter the calibration hole location relative to the start of the profile line.
o Enter the measured rebar depth.
3 Manually Adjustable Parameters: The most common use for the Bridge QA module has been on newly constructed concrete bridge decks containing rebar between 1-4 inches (2.5-10 cm) in depth and at a spacing of 6 inches (15 cm) between rebar.
• Minimum Rebar Depth: Closest point to the ground surface where the process will look for rebar.
• Maximum Rebar Depth: Deepest point in the concrete deck where the process will look for rebar.
• Average Spacing between Rebar: Estimated average spacing between rebar.

Geophysical Survey Systems, Inc. BridgeScan™ Handbook GPR Inspection of Bridge Decks
Copyright © 2017 Geophysical Survey Systems, Inc. MN72-618 Rev B All Rights Reserved 30
4 Click Apply and Reset, and adjust if necessary.
5 Click OK once desired results are achieved.

Geophysical Survey Systems, Inc. BridgeScan™ Handbook GPR Inspection of Bridge Decks
Copyright © 2017 Geophysical Survey Systems, Inc. MN72-618 Rev B All Rights Reserved 31
Output
1 Now we need to manually adjust the picks. RADAN will pick most of the rebar in the bridge for you, but it may miss or misinterpret some. This can be done in the 2D Interactive Pane.
2 Click on 2D Interactive > Pick Tool > Single Point.
3 Adjust the Pick Attributes as you need to. The Pick Polarity should be Positive, the Search Width may need to be adjusted if your target isn’t going exactly where you’d like it.
4 Left-clicking on your file will add a target (rebar). Right Clicking on your file will delete a target.
5 You may wish to use Select Block to add/delete multiple targets at once. Toggle this on and click on your data. Adjust to size and position of the box to cover your targets/blank area, right click on the box, and select the appropriate function.
6 When satisfied, this information can be exported into a CSV file for further analysis or recordkeeping. The Bridge QA process also creates an REB file which can be viewed in Excel. This is a pre-made report of how effective the process was, with statistics already calculated on the bridge deck.

Geophysical Survey Systems, Inc. BridgeScan™ Handbook GPR Inspection of Bridge Decks
Copyright © 2017 Geophysical Survey Systems, Inc. MN72-618 Rev B All Rights Reserved 32

Geophysical Survey Systems, Inc. BridgeScan™ Handbook GPR Inspection of Bridge Decks
Copyright © 2017 Geophysical Survey Systems, Inc. MN72-618 Rev B All Rights Reserved 33
Chapter 5: Conclusion • BridgeScan is a complete GPR system for mapping deterioration on bridge decks or other
reinforced surfaces. With a combination of 2D profiles, RADAN, and Excel, a user can go from raw GPR data to an easily digestible map of deteriorated bridge deck portions.
• BridgeScan also contains many components used for other GPR applications. It is a hybrid system of GSSI’s UtilityScan and StructureScan series.
• The 1.6GHz antenna is a standard for StructureScan. The user already has a SIR 4000 and blue control cable as well. The only missing component is a smaller cart. GSSI’s Model 614/615 cart is a smaller, more compact survey device used to obtain data on walls, ceilings, and in tight spaces.
• The 3W or 4W cart used in BridgeScan is standard for UtilityScan. With the SIR 4000 already available, the only missing component is the antenna and control cable. Antennas often used for UtilityScan are the 400 MHz, 270 MHz, 300/800 DF, and the 350 HS.
Please contact [email protected] for more details.