geophysical journal international - uspmarcelo/pdfs/tomo_se_rocha_etal_gji2010.pdf · basin,...
TRANSCRIPT

Geophys. J. Int. (2010) doi: 10.1111/j.1365-246X.2010.04831.x
GJI
Sei
smol
ogy
Upper-mantle seismic structure beneath SE and Central Brazilfrom P- and S-wave regional traveltime tomography
Marcelo Peres Rocha,1 Martin Schimmel2 and Marcelo Assumpcao3
1Institute of Geosciences, University of Brasılia, Brasılia, DF, Brazil. E-mail: [email protected] of Earth Sciences Jaume Almera – CSIC, Barcelona, Spain3Department of Geophysics, IAG, University of Sao Paulo, Sao Paulo, SP, Brazil
Accepted 2010 September 29. Received 2010 September 21; in original form 2009 May 7
S U M M A R YWe present models for the upper-mantle velocity structure beneath SE and Central Brazilusing independent tomographic inversions of P- and S-wave relative arrival-time residuals(including core phases) from teleseismic earthquakes. The events were recorded by a totalof 92 stations deployed through different projects, institutions and time periods during theyears 1992–2004. Our results show correlations with the main tectonic structures and revealnew anomalies not yet observed in previous works. All interpretations are based on robustanomalies, which appear in the different inversions for P- and S-waves. The resolution isvariable through our study volume and has been analyzed through different theoretical testinversions. High-velocity anomalies are observed in the western portion of the Sao FranciscoCraton, supporting the hypothesis that this Craton was part of a major Neoproterozoic plate(San Franciscan Plate). Low-velocity anomalies beneath the Tocantins Province (mainly foldbelts between the Amazon and Sao Francisco Cratons) are interpreted as due to lithosphericthinning, which is consistent with the good correlation between intraplate seismicity and low-velocity anomalies in this region. Our results show that the basement of the Parana Basin isformed by several blocks, separated by suture zones, according to model of Milani & Ramos.The slab of the Nazca Plate can be observed as a high-velocity anomaly beneath the ParanaBasin, between the depths of 700 and 1200 km. Further, we confirm the low-velocity anomalyin the NE area of the Parana Basin which has been interpreted by VanDecar et al. as a fossilconduct of the Tristan da Cunha Plume related to the Parana flood basalt eruptions during theopening of the South Atlantic.
Key words: Inverse theory; Mantle processes; Body waves; Seismic tomography; Dynamicsof lithosphere and mantle; South America.
1 I N T RO D U C T I O N
1.1 Motivation
The South American continent is tectonically formed by the Andeanorogeny in the west, the Precambrian South American Platform inthe centre and east and the Late Paleozoic Patagonian Platform inthe south (Ramos 1999; Almeida et al. 2000). The South AmericanPlatform occupies most of South America and is defined as the sta-ble continental portion of the South American Plate, which has notbeen affected by the Phanerozoic (Andean and Caribbean) orogeniczones. The basement of the platform consists basically of Archeanand Proterozoic lithospheric fragments (cratonic blocks) formedduring the main Proterozoic orogenic events (Trans-Amazonian andLate Mesoproterozoic), which were finally linked by several Neo-proterozoic mobile belts (Brasiliano/Pan African; Almeida et al.2000). A schematic map of the main geological units is shown inFig. 1.
Regional traveltime tomography is a powerful tool to obtain in-formation about the upper mantle and uppermost lower mantle ofthe Earth. In Brazil, several tectonic domains have been imagedin previous tomographic studies (VanDecar et al. 1995; Schimmelet al. 2003; Assumpcao et al. 2004a,b; Feng et al. 2004; Fenget al. 2007). However, due to the sparse and irregular distribution ofearthquakes and seismic stations, the resolution is highly variableand some of the heterogeneities have been poorly resolved. In themean time, the area covered by new stations has been increasedand some stations have also been deployed in some of the poorlyresolved areas. The main goal of this work is to study the maintectonic structures of the upper mantle under SE and Central Brazil(Fig. 1) using regional traveltime tomography for P- and S-waves.Main emphasis is given to the large-scale structures like the To-cantins Province, the Sao Francisco Craton (SFC), the Nazca Plateand the Paranapanema Cratonic Block. In this work, we want to shedlight on some questions that still remain about the tectonic struc-ture of the South America, such as the western limit of the SFC,
C© 2010 The Authors 1Geophysical Journal International C© 2010 RAS
Geophysical Journal International
2 M. P. Rocha, M. Schimmel and M. Assumpcao
Figure 02
S o FranciscoCraton
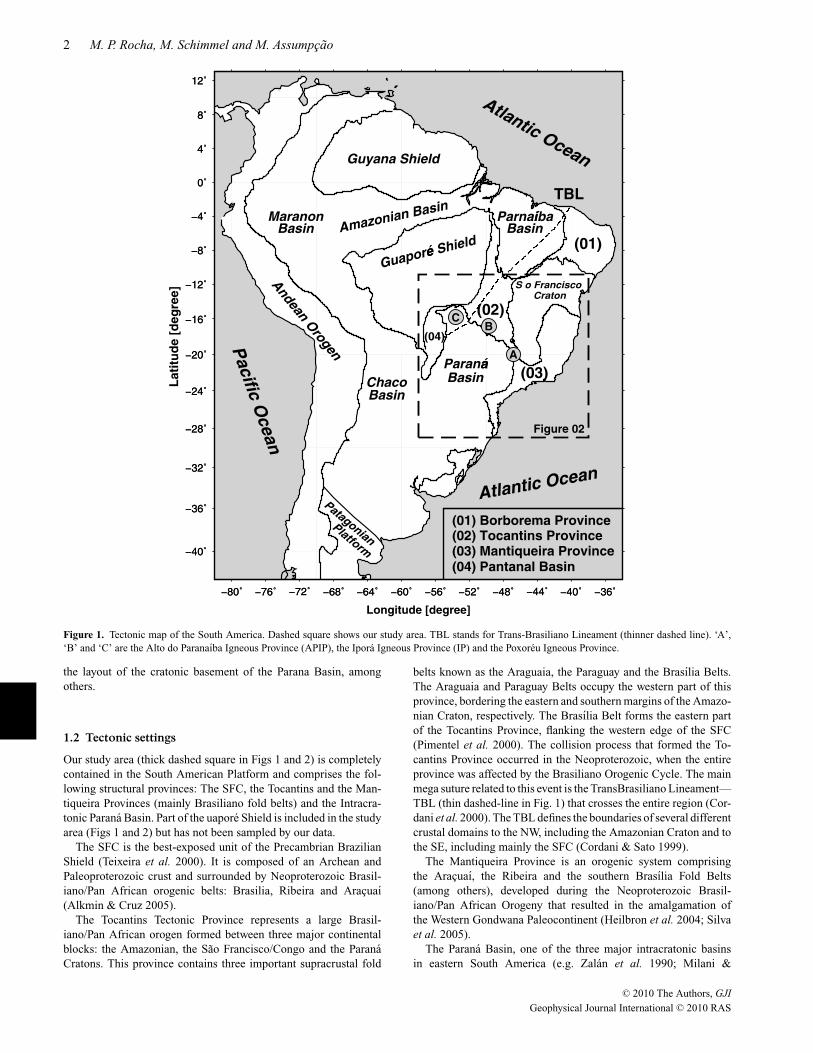
Figure 1. Tectonic map of the South America. Dashed square shows our study area. TBL stands for Trans-Brasiliano Lineament (thinner dashed line). ‘A’,‘B’ and ‘C’ are the Alto do Paranaıba Igneous Province (APIP), the Ipora Igneous Province (IP) and the Poxoreu Igneous Province.
the layout of the cratonic basement of the Parana Basin, amongothers.
1.2 Tectonic settings
Our study area (thick dashed square in Figs 1 and 2) is completelycontained in the South American Platform and comprises the fol-lowing structural provinces: The SFC, the Tocantins and the Man-tiqueira Provinces (mainly Brasiliano fold belts) and the Intracra-tonic Parana Basin. Part of the uapore Shield is included in the studyarea (Figs 1 and 2) but has not been sampled by our data.
The SFC is the best-exposed unit of the Precambrian BrazilianShield (Teixeira et al. 2000). It is composed of an Archean andPaleoproterozoic crust and surrounded by Neoproterozoic Brasil-iano/Pan African orogenic belts: Brasilia, Ribeira and Aracuaı(Alkmin & Cruz 2005).
The Tocantins Tectonic Province represents a large Brasil-iano/Pan African orogen formed between three major continentalblocks: the Amazonian, the Sao Francisco/Congo and the ParanaCratons. This province contains three important supracrustal fold
belts known as the Araguaia, the Paraguay and the Brasılia Belts.The Araguaia and Paraguay Belts occupy the western part of thisprovince, bordering the eastern and southern margins of the Amazo-nian Craton, respectively. The Brasılia Belt forms the eastern partof the Tocantins Province, flanking the western edge of the SFC(Pimentel et al. 2000). The collision process that formed the To-cantins Province occurred in the Neoproterozoic, when the entireprovince was affected by the Brasiliano Orogenic Cycle. The mainmega suture related to this event is the TransBrasiliano Lineament—TBL (thin dashed-line in Fig. 1) that crosses the entire region (Cor-dani et al. 2000). The TBL defines the boundaries of several differentcrustal domains to the NW, including the Amazonian Craton and tothe SE, including mainly the SFC (Cordani & Sato 1999).
The Mantiqueira Province is an orogenic system comprisingthe Aracuaı, the Ribeira and the southern Brasılia Fold Belts(among others), developed during the Neoproterozoic Brasil-iano/Pan African Orogeny that resulted in the amalgamation ofthe Western Gondwana Paleocontinent (Heilbron et al. 2004; Silvaet al. 2005).
The Parana Basin, one of the three major intracratonic basinsin eastern South America (e.g. Zalan et al. 1990; Milani &
C© 2010 The Authors, GJI
Geophysical Journal International C© 2010 RAS
Upper-mantle seismic structure beneath Brazil 3
IPT Stations
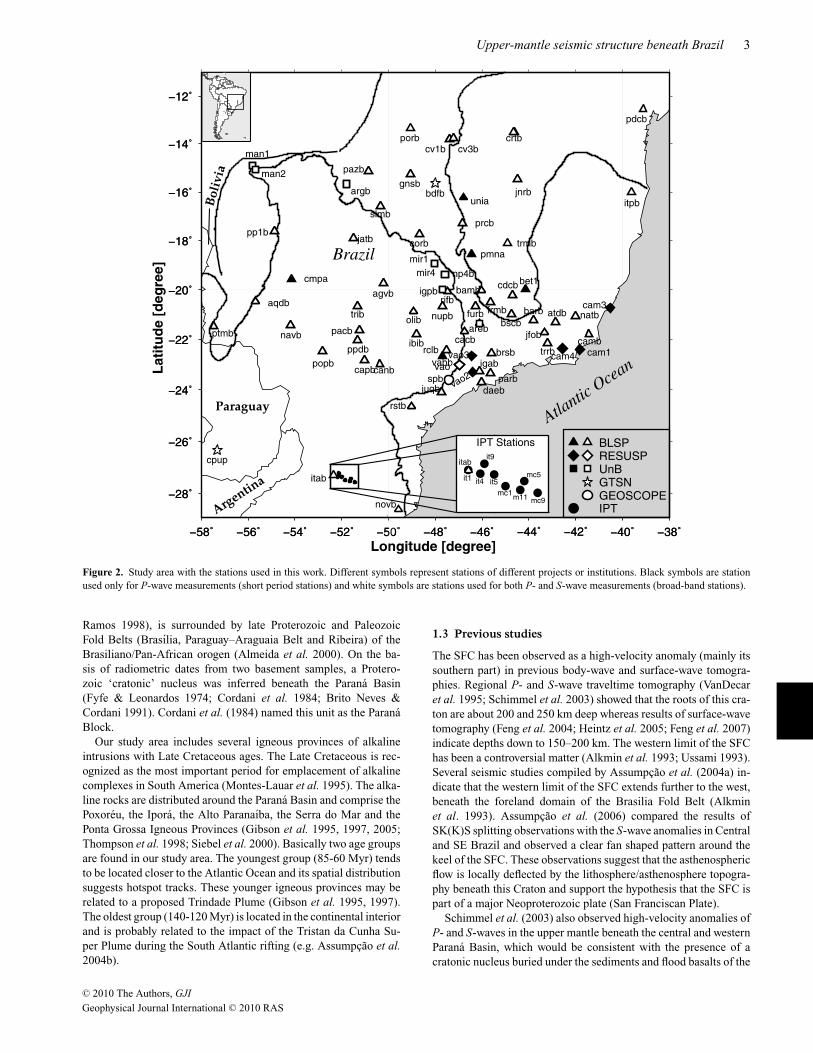
Figure 2. Study area with the stations used in this work. Different symbols represent stations of different projects or institutions. Black symbols are stationused only for P-wave measurements (short period stations) and white symbols are stations used for both P- and S-wave measurements (broad-band stations).
Ramos 1998), is surrounded by late Proterozoic and PaleozoicFold Belts (Brasılia, Paraguay–Araguaia Belt and Ribeira) of theBrasiliano/Pan-African orogen (Almeida et al. 2000). On the ba-sis of radiometric dates from two basement samples, a Protero-zoic ‘cratonic’ nucleus was inferred beneath the Parana Basin(Fyfe & Leonardos 1974; Cordani et al. 1984; Brito Neves &Cordani 1991). Cordani et al. (1984) named this unit as the ParanaBlock.
Our study area includes several igneous provinces of alkalineintrusions with Late Cretaceous ages. The Late Cretaceous is rec-ognized as the most important period for emplacement of alkalinecomplexes in South America (Montes-Lauar et al. 1995). The alka-line rocks are distributed around the Parana Basin and comprise thePoxoreu, the Ipora, the Alto Paranaıba, the Serra do Mar and thePonta Grossa Igneous Provinces (Gibson et al. 1995, 1997, 2005;Thompson et al. 1998; Siebel et al. 2000). Basically two age groupsare found in our study area. The youngest group (85-60 Myr) tendsto be located closer to the Atlantic Ocean and its spatial distributionsuggests hotspot tracks. These younger igneous provinces may berelated to a proposed Trindade Plume (Gibson et al. 1995, 1997).The oldest group (140-120 Myr) is located in the continental interiorand is probably related to the impact of the Tristan da Cunha Su-per Plume during the South Atlantic rifting (e.g. Assumpcao et al.2004b).
1.3 Previous studies
The SFC has been observed as a high-velocity anomaly (mainly itssouthern part) in previous body-wave and surface-wave tomogra-phies. Regional P- and S-wave traveltime tomography (VanDecaret al. 1995; Schimmel et al. 2003) showed that the roots of this cra-ton are about 200 and 250 km deep whereas results of surface-wavetomography (Feng et al. 2004; Heintz et al. 2005; Feng et al. 2007)indicate depths down to 150–200 km. The western limit of the SFChas been a controversial matter (Alkmin et al. 1993; Ussami 1993).Several seismic studies compiled by Assumpcao et al. (2004a) in-dicate that the western limit of the SFC extends further to the west,beneath the foreland domain of the Brasilia Fold Belt (Alkminet al. 1993). Assumpcao et al. (2006) compared the results ofSK(K)S splitting observations with the S-wave anomalies in Centraland SE Brazil and observed a clear fan shaped pattern around thekeel of the SFC. These observations suggest that the asthenosphericflow is locally deflected by the lithosphere/asthenosphere topogra-phy beneath this Craton and support the hypothesis that the SFC ispart of a major Neoproterozoic plate (San Franciscan Plate).
Schimmel et al. (2003) also observed high-velocity anomalies ofP- and S-waves in the upper mantle beneath the central and westernParana Basin, which would be consistent with the presence of acratonic nucleus buried under the sediments and flood basalts of the
C© 2010 The Authors, GJI
Geophysical Journal International C© 2010 RAS

4 M. P. Rocha, M. Schimmel and M. Assumpcao
Parana Basin. The nature of the basement beneath the Parana Basinis still debated. The single cratonic nucleus proposed initially byCordani et al. (1984) and Zalan et al. (1990) has been contested byMilani & Ramos (1998) who propose several smaller blocks sep-arated by mobile belts, rifting and alkaline magmatism. Recently,a third model (Mantovani et al. 2005) of a larger ‘Paranapanemablock’ has been suggested based mainly on gravity anomalies. Pre-vious tomographic results (both, body and surface-wave) did nothave enough resolution to distinguish between the proposed modelsdue to a small amount of stations in this area. Julia et al. (2008)analysed the crustal structure beneath several stations in the ParanaBasin and favoured the model of Milani & Ramos (1998).
VanDecar et al. (1995) detected a low-velocity cylindrical struc-ture in the upper mantle beneath the NE part of the Parana Basin.With the increase of the number of stations, Schimmel et al. (2003)found that this anomaly is confined to the whole upper mantle, al-though it appears as a continuous feature down to about 900 km.Schimmel et al. (2003) interpreted this downwards extension as anartefact due to vertical smearing caused by fewer ray crossings at thetop of the lower mantle. This low-velocity anomaly was observeddown to 300 km depth by Feng et al. (2007) using surface wavetomography, (greater depths are not resolved by their study). Thecauses of this seismic anomaly remain uncertain, however. Van-Decar et al. (1995) interpreted this structure as a fossil conduitthrough which the initial Tristan da Cunha Plume travelled to gen-erate the Parana–Etendeka continental flood basalts. Imaging of the410 and 660 km seismic velocity discontinuities, along an E–Wprofile across South America (∼20◦S; Liu et al. 2003), indicatesa slight thickening of the transition zone rather than the expectedthinning for a hot thermal anomaly in an olivine dominated tran-sition zone, thus indicating a chemical anomaly. Van der Lee &Wiens (2006) suggest a compositional explanation for this anomalyrelated to the water release from the deep subducted Nazca slab.
At depths of 150–250 km, low-velocity anomalies predominatein the fold belt areas, which are mostly correlated with the LateCretaceous Igneous Provinces (VanDecar et al. 1995; Schimmelet al. 2003; Assumpcao et al. 2004a). Schimmel et al. (2003) andAssumpcao et al. (2004a) observed a low-velocity anomaly near theAlto do Paranaıba Igneous Province–APIP (A in Fig. 1). The factthat only the more recent (85–50 Ma) alkaline intrusions occur nearlow-velocity areas may indicate a thermal effect associated withthe generation of the Late Cretaceous igneous activity. A P-wavelow-velocity anomaly was also observed under the Ipora IgneousProvince–IP (B in Fig. 1; Assumpcao et al. 2004a) and was inter-preted as the initial impact of the Trindade Plume at ∼80 Ma, as pro-posed by Gibson et al. (1997). Rocha (2003) and Assumpcao et al.(2004a) also observed a low-velocity trend beneath the Poxoreu Ig-neous Province–PX (C in Fig. 1) and suggested that this anomalycould be part of the Trindade Plume impact. Both anomalies couldbe related to the TBL, indicating a thin and weak lithosphere inthis region (Assumpcao et al. 2004a). Feng et al. (2004, 2007) alsofound in this region a NE–SW trending low-velocity anomaly atabout 100 km depth, possibly related with the TBL. Low-velocityanomalies were also observed in the Serra do Mar and Ponta GrossaProvinces (Escalante 2002; Rocha 2003; Schimmel et al. 2003).
Assumpcao et al. (2004a) show a positive correlation betweenP-wave low-velocity anomalies and the areas with greater seis-micity in SE and Central Brazil. They suggested that the litho-sphere/asthenosphere topography, inferred from P-wave tomogra-phy, is in excellent agreement with the thin spot hypothesis proposedby Gibson et al. (1995, 1997) for the origin of the igneous provincesand still, that the thinning of the lithosphere induced by temperature
can be an important mechanism to help explain earthquake activityin SE and Central Brazil.
A study of the effective elastic thickness of the lithosphere (Te)in South America (Perez-Gussinye et al. 2007) shows low Te in thePantanal Basin and the SE part of the TBL, coincident with low-velocity anomalies and consistent with a thin and weak lithospherein these areas. Greater Te was observed, mainly, in cratonic regions.
Schimmel et al. (2003) found an N–S oriented high-velocityanomaly in the upper mantle, which they interpreted as due to thesubducted Nazca Plate. Their synthetic tests show that a continuousslab is imaged as two separated slab segments, suggesting low res-olution in the lower mantle. Ren et al. (2007) combine tomographywith plate tectonic history to track the subduction underneath theAmericas in time. Also in their images the Nazca/Farallon slab isless well resolved beneath SW Brazil. Both studies do not show acontinuation of this segment below about 1300 km depth.
2 DATA
2.1 Station and event selection
We used relative traveltime residuals obtained from teleseismicevents. These data were recorded by a total of 92 stations de-ployed for different durations in the study area (Fig. 2), during 12yr (1992–2004). Relative residuals were obtained from waveformcross-correlations for up to 12 simultaneously recorded seismo-grams. We included 5647 P-wave and 3466 S-waves traveltime mea-surements from new stations (2000–2004) in the previous databaseof Schimmel et al. (2003), who used events from 1992 to 2000.
Most of the stations were from the BLSP (Brazilian LithosphereSeismic Project—BLSP92, BLSP95 and BLSP02) equipped withthree-component broad-band seismometers. Stations from othersprojects and institutions were also used: RESUSP—University ofSao Paulo Seismic Network; UnB-–University of Brasılia; IPT—Institute of Technological Research; GTSN—Global TelemeteredSeismic Network; GEOSCOPE Institut de Physique du Globe deParis. Only data from broad-band stations were employed in our S-wave study, while we have used also short-period stations to increasethe database for the P-waves. The waveforms of the short periodinstruments have been transformed to mimic broad-band recordsand have been used together with the vertical broad-band data atnarrow frequency bands around 1 Hz.
P- and S-phases were used from events with magnitude largerthan 4.6 mb. For direct (P and S) and core reflected phases (ScS),the epicentral distances range from 30◦ to 95◦ and 10◦ to 30◦, re-spectively. Further, we used core-refracted phases (PKPdf, SKS,SKKS) from events at 100◦ to 180◦. The USGS PDE (U.S. Geo-logical Survey Preliminary Determination of Epicenters) databaseprovided the hypocentre information. Fig. 3 shows the distributionof these earthquakes.
2.2 The relative arrival-time determination
We use relative traveltime residuals to decrease source errors andpath effects outside the investigated volume (Evans & Achauer1993). The relative traveltime residuals have been determined using
ri j = toi j − tci j ⇒ rri j = ri j − 1
N
N∑
i=1
ri j , (1)
where rij is the absolute residual for station i and event j. to and tcstand for observed and theoretical traveltime, respectively. rrij is therelative residual used to build our database.
C© 2010 The Authors, GJI
Geophysical Journal International C© 2010 RAS

Upper-mantle seismic structure beneath Brazil 5
Figure 3. Distribution of the events used in this work. Distances are withrespect to the centre of the study area (black square). (a) P-wave events. (b)S-wave events.
Relative traveltimes were measured using the MultiChannelPhase Cross Correlation (MCPCC) technique (Schimmel et al.2003), which incorporates the Phase Cross-Correlation (PCC) func-tion (Schimmel 1999) into the MultiChannel Cross Correlationtechnique of VanDecar & Crosson (1990). MCPCC uses the similar-ity of the greatest number of coherent samples rather than the largestsum of cross products. Therefore, it is not biased by the large am-plitude portions in the correlation window. The data were inspectedevent by event and the correlation windows were selected by handto include the first swing of the signal. The correlation results weremanually checked to avoid cycle skipping or other problems. Poorsignals were correlated using different parameters and discarded ifnot providing satisfactory and consistent results.
Picking of P- and S-wave phases was performed at a high-frequency band because our inversion procedure adopts ray the-ory (the infinite frequency approximation for wave propagation).The bandwidths for P- and S-waves range between 0.8–2.5 Hz and0.05–0.1 Hz, respectively. The corresponding wavelengths in theupper-mantle are about 12 km for P-waves and 60 km for S-waves.The S and ScS phases were picked on the tangential components to
minimize contamination by P- and P-to-S converted waves. Corephases (SKS and SKKS) were picked on the radial componentswhere they are strongest due to their P-wave path in the outercore.
2.3 The final data sets
The final database consists of 8551 time measures for P-waves(1240 events), 2463 for PKP (338 events), 4707 for S (734 events),697 for ScS (106 events), 1109 for SKSac (171 events) and 1719for SKKSac (262 events). The traveltimes were corrected for stationelevations using the theoretical ray incidence in an upper crust withP-wave velocity of 5.8 km s–1 and S-wave velocity of 3.5 km s–1.Our P- and S-wave relative residuals follow a normal distribution(Fig. 4). The standard deviations for the P- and S-wave data are0.407 s and 1.096 s, respectively. The comparison between the datadistribution and the Gaussian curve allows to find large traveltimeresiduals, which have been removed since they are likely due totiming errors or phase misinterpretations and could influence theinversion.
3 M E T H O D
3.1 Model parameterization
The model has been discretized in a dense grid of knots, which is in-terpolated with splines under tension (Cline 1981, Neele et al. 1993)to obtain the seismic velocities at each location within the grid. Thisinterpolation scheme provides a smooth slowness distribution andtherefore permits an accurate ray tracing. The grid is composedof 64 260 knots, 28 knots in depth (depths between 0–1400 km),45 knots in latitude (latitudes between –30◦ and –10◦) and 51 knotsin longitude (longitudes between –59◦ and –37◦). In the central re-gion of the model (25-15◦S; 53-40◦W; 0–500 km depth), where weexpect to obtain better resolution, the horizontal and vertical knotspacing is 1/3 degrees and 33km, respectively. The knot spacingincreases outside this region to 0.5◦ and 50 km in an intermediatevolume and to 1◦ and 100 km outside this intermediate volume.The parameterization extends outside the area of the stations tominimize the mapping of noise and inconsistencies as unrealisticstructures into the central area of interest (VanDecar et al. 1995).
Note that the hypocenters of all events are outside the study vol-ume and there are no significant down going ScS ray path within thevolume. In our inversion only upgoing ScS rays will be considered.
3.2 Inversion procedure
We use the linear inversion approach of VanDecar et al. (1995)which has been a successful tool to study the upper mantle in dif-ferent areas (e.g. VanDecar et al. 1995; Sol et al. 2002; Wolfe et al.2002; Schimmel et al. 2003; Bastow et al. 2005; Benoit et al. 2006;Lees et al. 2007; Bastow et al. 2008; Schmid et al. 2008; West et al.2009). In this method, P- and S-wave relative residuals are inde-pendently inverted for 3-D velocity structure (velocity anomalies),earthquake relocations and station terms. The station terms are usedin the inversion to absorb systematic time contributions caused bylocal shallow heterogeneities. Also, the source terms are used toaccount for small source mislocations.
The linear system of equations is underdetermined which meansthe inversion is non-unique and different solutions are possible toexplain the data. For this reason we look for smooth models with
C© 2010 The Authors, GJI
Geophysical Journal International C© 2010 RAS

6 M. P. Rocha, M. Schimmel and M. Assumpcao
SKS, SKKS, ScS
Figure 4. Histograms for the relative P-wave (a) and S-wave (b) residuals. Core phases and first arrival distributions are illustrated in white and grey,respectively and the distribution of all phases is shown in black.
the least amount of anomalies to explain the relative time residuals(Occam’s inversion – Constable et al. 1987) by including regulariza-tion through a combination of the first- and second-order differenceoperators. The linear system is inverted iteratively using the con-jugate gradient method LSQR (Paige & Saunders 1982a,b). Weiterate upon these inversions, systematically down-weighting equa-tions associated with outlying residuals from the previous iteration(Huber 1981). This approach produces a robust solution with L2residual minimization for data with residuals smaller than 1.5 timesthe standard deviation and L1 residual minimization for equationsassociated with larger residuals (e.g. Pulliam et al. 1993).
The down-weighting iterations are interrupted when the anoma-lies do not show significant variations from the previous iteration.Our final models explain about 84 per cent of the rms relative resid-ual of the original data set (from 0.41 to 0.06 s) for P-waves andabout 86 per cent of the rms residual (from 1.10 to 0.15 s) for S-waves. We subtracted the station static terms from the delay timesto estimate the proportion of the residuals that are absorbed by thestatic terms. The rms of the relative residual was reduced from 0.40to 0.39 s for P-waves and from 1.10 to 1.07 for S-waves. This in-dicates that about 3 per cent of the rms of the relative residuals isabsorbed by the station terms and about 81 per cent of the residualsare inverted into structure (P-waves), since the total rms reductionis in the order of 84 per cent.
4 U P P E R - M A N T L E S E I S M I CS T RU C T U R E
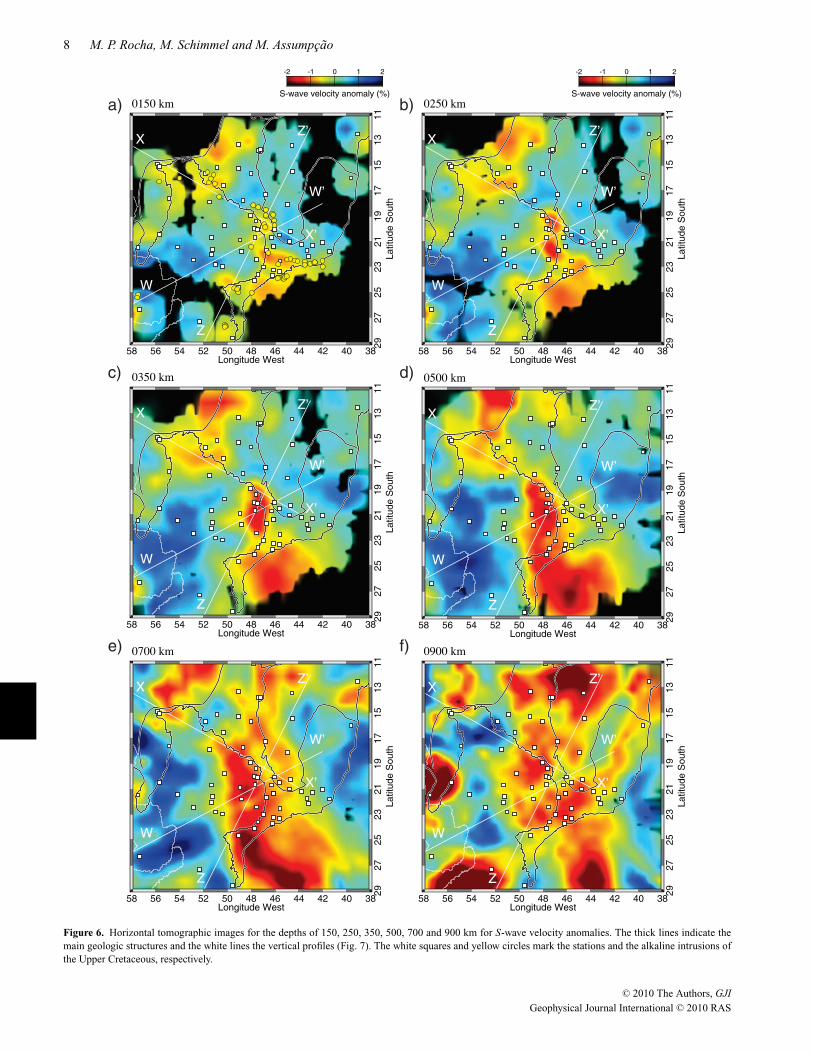
Our results are presented as horizontal (Figs 5 and 6) and verticalsections (Fig. 7). These Figures show velocity perturbations relativeto the IASP91 Earth model (Kennett & Engdahl 1991). Areas withray density less than 20 rays 100 km–3 are shown in black. In thevertical cross-sections the first 50 km are blacked since there is no
ray crossing immediately underneath the stations, which means thatthere is no resolution. White squares are stations and yellow circles(only in Figs 5a and 6a) are the Late Cretaceous alkaline intrusions(90-55 Ma). The final P- and S- velocity anomaly models containsimilar features although they were obtained independently. The S-wave anomalies are more blurred than the P-wave anomalies. Thiseffect is explained by the lower resolution of the S-waves comparedwith P-waves, based on their larger Fresnel volumes.
4.1 Sao Francisco Craton
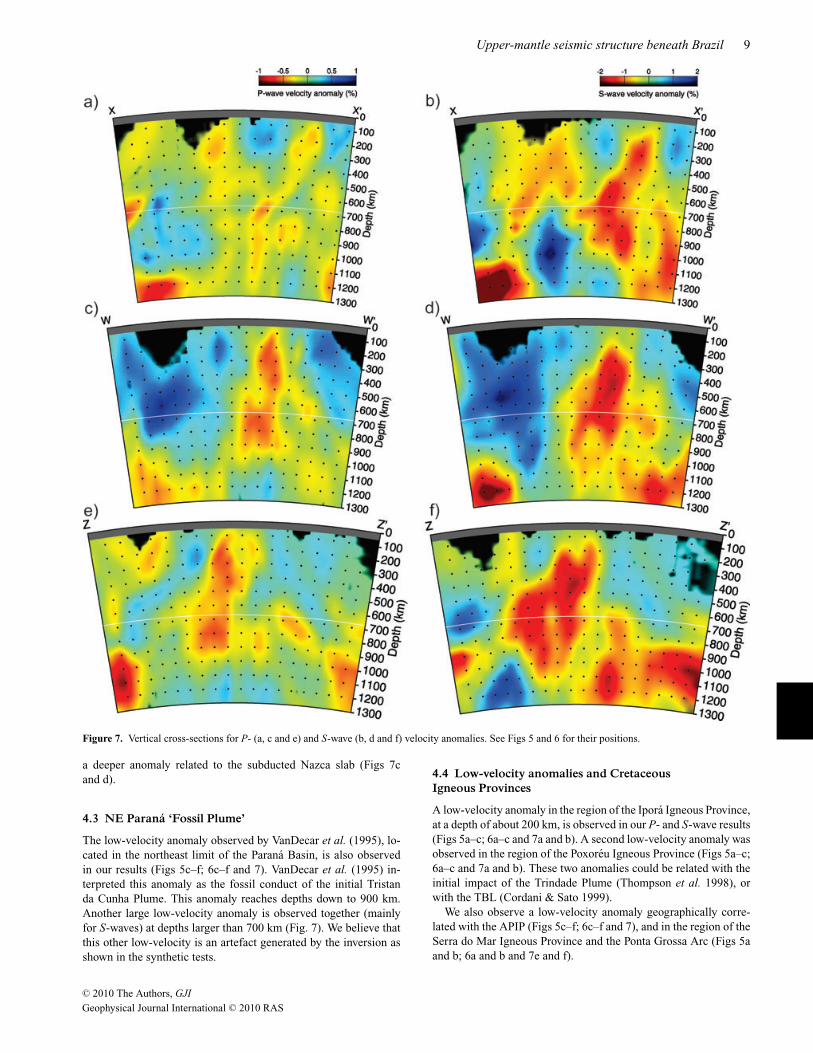
After the installation of new stations in the northern part of the SFC,high-velocities at lithospheric depths are observed in this region(Figs 5a and b; 6a and b). However, the anomaly in the southern partis more intense than in the northern part, due to its better resolutionas shown later. A high-velocity anomaly west of the surface limit ofthe SFC supports the hypothesis that this craton was part of a majorNeoproterozoic plate (San Franciscan Plate—Alkmin et al. 1993;Ussami 1993, 1999). In the vertical cross-sections (Figs 7a and b),the SFC appears as a high-velocity anomaly down to about 300 kmdepth. However, the craton is less deep due to smearing along thedominantly steep ray paths as shown in our resolution tests.
4.2 Basement of the Parana Basin
The high-velocity anomaly observed by Schimmel et al. (2003),beneath the Parana Basin and interpreted as a cratonic block, isconfirmed in our results (Figs 5a and b; 6a and b and 7c and d). Thisanomaly appears with an improved horizontal resolution (based onsynthetic tests). However, despite the increased database, its verticalresolution remained poor, due to few ray crossings and an excessof ray paths from the Andes. This prevents a clear separation of thepossible high-velocity lithosphere beneath the Parana Basin from
C© 2010 The Authors, GJI
Geophysical Journal International C© 2010 RAS

Upper-mantle seismic structure beneath Brazil 7
e) f)
a)
c)
b)
d)
Figure 5. Horizontal tomographic images for the depths of 150, 250, 350, 500, 700 and 900 km for P-wave velocity anomalies. The thick lines indicate themain geologic structures and the white lines mark the vertical profiles (Fig. 7). The white squares and yellow circles mark the stations and the alkaline intrusionsof the Upper Cretaceous, respectively.
C© 2010 The Authors, GJI
Geophysical Journal International C© 2010 RAS
8 M. P. Rocha, M. Schimmel and M. Assumpcao
d)
a) b)
c)
e) f)
Figure 6. Horizontal tomographic images for the depths of 150, 250, 350, 500, 700 and 900 km for S-wave velocity anomalies. The thick lines indicate themain geologic structures and the white lines the vertical profiles (Fig. 7). The white squares and yellow circles mark the stations and the alkaline intrusions ofthe Upper Cretaceous, respectively.
C© 2010 The Authors, GJI
Geophysical Journal International C© 2010 RAS
Upper-mantle seismic structure beneath Brazil 9
Figure 7. Vertical cross-sections for P- (a, c and e) and S-wave (b, d and f) velocity anomalies. See Figs 5 and 6 for their positions.
a deeper anomaly related to the subducted Nazca slab (Figs 7cand d).
4.3 NE Parana ‘Fossil Plume’
The low-velocity anomaly observed by VanDecar et al. (1995), lo-cated in the northeast limit of the Parana Basin, is also observedin our results (Figs 5c–f; 6c–f and 7). VanDecar et al. (1995) in-terpreted this anomaly as the fossil conduct of the initial Tristanda Cunha Plume. This anomaly reaches depths down to 900 km.Another large low-velocity anomaly is observed together (mainlyfor S-waves) at depths larger than 700 km (Fig. 7). We believe thatthis other low-velocity is an artefact generated by the inversion asshown in the synthetic tests.
4.4 Low-velocity anomalies and CretaceousIgneous Provinces
A low-velocity anomaly in the region of the Ipora Igneous Province,at a depth of about 200 km, is observed in our P- and S-wave results(Figs 5a–c; 6a–c and 7a and b). A second low-velocity anomaly wasobserved in the region of the Poxoreu Igneous Province (Figs 5a–c;6a–c and 7a and b). These two anomalies could be related with theinitial impact of the Trindade Plume (Thompson et al. 1998), orwith the TBL (Cordani & Sato 1999).
We also observe a low-velocity anomaly geographically corre-lated with the APIP (Figs 5c–f; 6c–f and 7), and in the region of theSerra do Mar Igneous Province and the Ponta Grossa Arc (Figs 5aand b; 6a and b and 7e and f).
C© 2010 The Authors, GJI
Geophysical Journal International C© 2010 RAS

10 M. P. Rocha, M. Schimmel and M. Assumpcao
4.5 Nazca slab
The deep high-velocity anomaly beneath the Parana Basin inter-preted by Schimmel et al. (2003) as the slab of the Nazca Plate isalso observed in our results. It has a NW–SE orientation (Figs 5c–eand 6c–e), according with the Nazca contour between the latitudes–16◦ and –30◦. Schimmel et al. (2003) observed the slab segmentedinto two parts, but they show that they do not have the resolutionto distinguish between a continuous or segmented slab. A possiblefragmentation still cannot be resolved due to the smearing of theseismic anomalies.
5 R E S O LU T I O N
The resolution of the tomographic images depends on several fac-tors, such as the spatial distribution of data, parameterization ofthe study region, among others. Synthetic tests with known seis-mic structures are normally used to assess the resolution of thetomographic results (e.g. Schimmel et al. 2003; Bastow et al. 2005;Rawlinson et al. 2006).
We inverted synthetic traveltimes, calculated with a 3-D ray tracerfor geometric input models by using the real event/station config-uration. The geometric models are often used for resolution testsand are based on simulations of one or more tectonic features in-dicated by the real data or geological information (e.g. Schimmelet al. 2003; Bastow et al. 2005). A Gaussian residual time errorcomponent, with a standard deviation of 30 per cent of the rms ofthe synthetic data residuals, was added to the traveltimes to gen-erate noisy data and to see how this data inconsistency affects theinversion results.
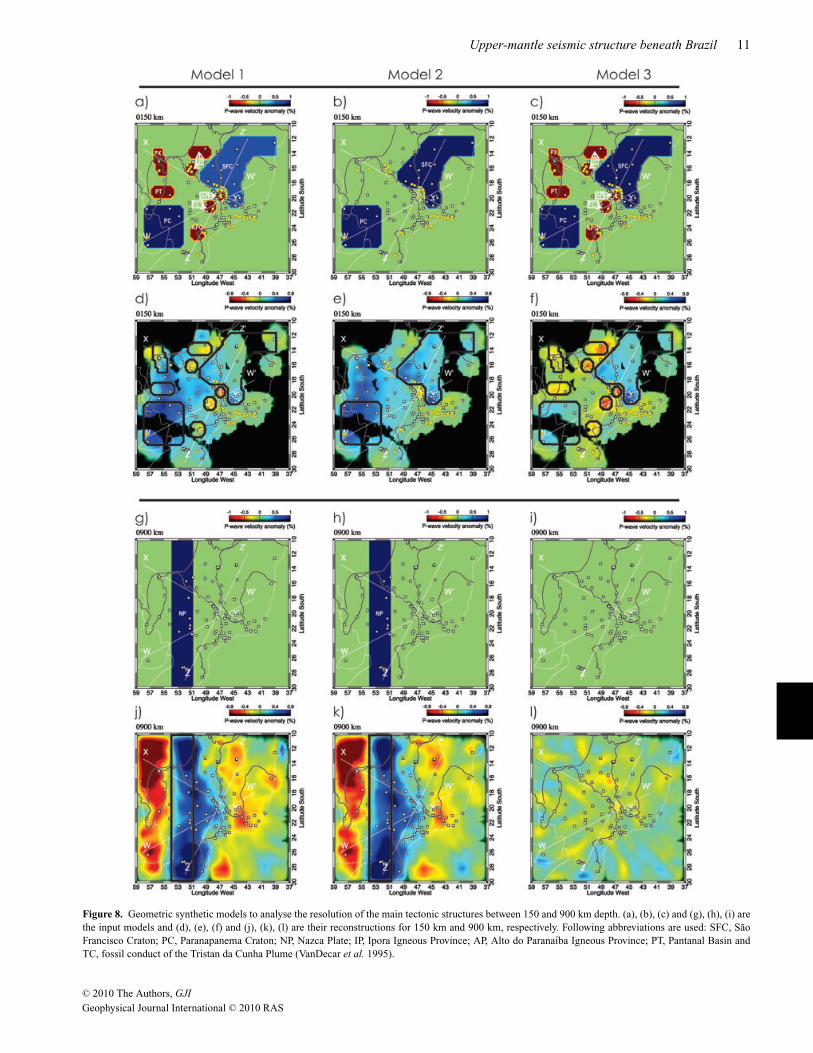
The different synthetic input models and the respective tomo-graphic reconstructions are shown in the Fig. 8 (horizontal cross-sections) and Fig. 9 (vertical cross-sections). As high-velocity struc-tures we have the SFC, Paranapanema Craton (PC) and Nazca Plate(NP) and as low-velocity anomalies we have the Ipora IgneousProvince (IP), Poxoreu Igneous Province (PX), Alto do ParanaıbaIgneous Province (AP), Ponta Grossa Arc (APG), Pantanal Basin(PT) and the anomaly interpreted by VanDecar et al. (1995) as Tris-tan da Cunha Plume head (TC). Model 1 uses all these structuresand Model 2 consists only of high-velocity anomalies. Model 3 issimilar to Model 1 except for the NP. The SFC extends down to 150km, 200 km and 250 km depth for Model 1, Model 2 and Model 3,respectively, to estimate its depth resolution.
Comparisons between real (Figs 5a and 6a) and synthetic results(Fig. 8f) show a good correlation between the images in areas withgood station coverage (central part of the model). The results of theresolution tests show that the lithospheric structures (Figs 8c and9f) are best resolved for the data from Model 3 (without NP). It canbe seen that the anomalies are smeared in depth, which is due tothe dominantly steep ray paths. Owing to this effect, the presenceof the slab in the Model 1 interferes with shallower structures anddecreases their amplitudes. We believe that the slab orientationis not NS (as modelled) since, in the real results, the amplitudesof the northern anomalies do not decrease significantly, suggestingthat its orientation is concordant with the outline of the convergencebetween the South American and Nazca Plates. In the vertical cross-sections (Fig. 9) we observed that NP and PC cannot be resolveddue to the mentioned smearing along the large concentration of raypaths from the Andes.
Comparing the results of the synthetic tests of the three models(Fig. 9) with the real data inversions (Fig. 7) we observed that the
south part of SFC should be deeper than 200 km. In the northernpart however, due to the low resolution caused by the low stationdensity, it is not possible to propose depth limits. The western exten-sion, interpreted as the ‘San Franciscan Plate’, has good resolution,similar to the southern part of this craton.
A large low-velocity anomaly appears in the lower mantle nextto the simulated NP (Figs 8 and 9). This anomaly is an artefactgenerated during the inversion, because there are no low-velocityanomalies at these depths in our model. Model 2 (Figs 8 and 9)contains no low-velocity anomalies at all and still, the lower man-tle artefacts remain and are therefore not due to mis-mapping orsmearing of other low-velocity bodies. Only the removal of the slab(Model 3, Figs 8 and 9) causes the disappearance of the artefacts inthe reconstructions. We attribute this problem to the poor resolutionin the lower mantle. A similar low-velocity anomaly appears in thereal data inversions (Figs 5 and 6—depths 500–900) and can beused as further hint to the presence of the slab.
In general, we observe in the synthetic tests that the central part ofthe model has best resolution due to the highest density of crossingrays in this area. AP and TC have therefore good lateral and verticalresolution. The APG amplitude is slightly lower in the Model 1(with NP) if compared with the Model 3 (without NP), probablydue to the strong influence of the presence of NP that decreases thelow velocity amplitudes.
The percentage velocity scale has been reduced to show the fullrange of amplitudes. The recovered synthetic models are smoothsince strong spatial velocity gradients are reduced through the reg-ularization of the inversion. The amplitudes of the anomalies areunderestimated in the real data inversions since they represent theminimum structure required to explain the data.
6 C AU S E S O F S E I S M I CH E T E RO G E N E I T Y
The origin of lateral seismic heterogeneities in the Earth’s mantleis one of the most important issues in geodynamical applicationsof seismic tomography. In particular, distinguishing thermal fromcompositional origin of heterogeneities is important because thedynamic implication is quite different between the two cases (Karato& Karki 2001). In the upper mantle, temperature is believed tohave more influence than compositional variations in the origin ofthe seismic heterogeneities (e.g. Goes et al. 2000). However, otherstudies showed that a significant part of the seismic anomalies inthe upper mantle cannot be explained by thermal variations (e.g.Deschamps et al. 2002; Artemieva et al. 2004).
In this study, we cannot distinguish between the different originsof heterogeneities from our inversion since we do not resolve abso-lute velocities, since the ray path for P- and S-waves are different,and since the P- and S-wave inversions have different resolutions.Nevertheless, a comparison between P- and S-wave relative arrival-time residuals for common station and event pairs is sometimesused to compare directly the velocity anomalies of the tomographicimages (Bastow et al. 2005). This procedure avoids all the problemsassociated with amplitude recovery (e.g. due to differing numbers oftraveltime observations and regularization levels) and other artefactsassociated with the inversion procedure, such as parameterizationand ray path accuracy.
Fig. 10(a) shows S- versus P-wave relative traveltime residualsfor common earthquake—station pairs. The P- and S-wave dataare measured independently and sample slightly different struc-tures, but are positively correlated as expected. The best fitting
C© 2010 The Authors, GJI
Geophysical Journal International C© 2010 RAS
Upper-mantle seismic structure beneath Brazil 11
Figure 8. Geometric synthetic models to analyse the resolution of the main tectonic structures between 150 and 900 km depth. (a), (b), (c) and (g), (h), (i) arethe input models and (d), (e), (f) and (j), (k), (l) are their reconstructions for 150 km and 900 km, respectively. Following abbreviations are used: SFC, SaoFrancisco Craton; PC, Paranapanema Craton; NP, Nazca Plate; IP, Ipora Igneous Province; AP, Alto do Paranaıba Igneous Province; PT, Pantanal Basin andTC, fossil conduct of the Tristan da Cunha Plume (VanDecar et al. 1995).
C© 2010 The Authors, GJI
Geophysical Journal International C© 2010 RAS

12 M. P. Rocha, M. Schimmel and M. Assumpcao
Figure 9. Geometric synthetic models (vertical profiles) to analyse the resolution of the main tectonic structures in our study area. (a), (b) and (c) are the inputmodels for profile X–X′ and (d), (e) and (f) are the results of the inversions for this profile. (g), (h) and (i) are the input models profile W–W′ and (j), (k) and(l) are the results of the inversions for this profile. See Fig. 8 for abbreviations.
C© 2010 The Authors, GJI
Geophysical Journal International C© 2010 RAS
Upper-mantle seismic structure beneath Brazil 13
a) b) c)
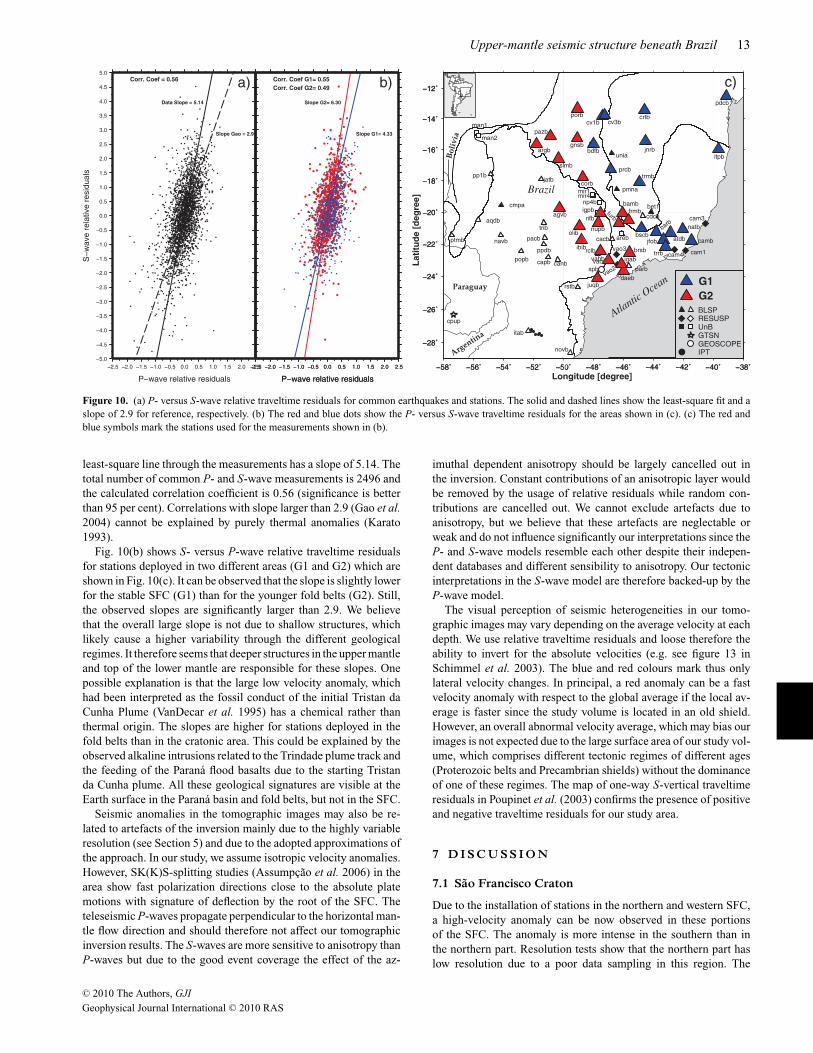
Figure 10. (a) P- versus S-wave relative traveltime residuals for common earthquakes and stations. The solid and dashed lines show the least-square fit and aslope of 2.9 for reference, respectively. (b) The red and blue dots show the P- versus S-wave traveltime residuals for the areas shown in (c). (c) The red andblue symbols mark the stations used for the measurements shown in (b).
least-square line through the measurements has a slope of 5.14. Thetotal number of common P- and S-wave measurements is 2496 andthe calculated correlation coefficient is 0.56 (significance is betterthan 95 per cent). Correlations with slope larger than 2.9 (Gao et al.2004) cannot be explained by purely thermal anomalies (Karato1993).
Fig. 10(b) shows S- versus P-wave relative traveltime residualsfor stations deployed in two different areas (G1 and G2) which areshown in Fig. 10(c). It can be observed that the slope is slightly lowerfor the stable SFC (G1) than for the younger fold belts (G2). Still,the observed slopes are significantly larger than 2.9. We believethat the overall large slope is not due to shallow structures, whichlikely cause a higher variability through the different geologicalregimes. It therefore seems that deeper structures in the upper mantleand top of the lower mantle are responsible for these slopes. Onepossible explanation is that the large low velocity anomaly, whichhad been interpreted as the fossil conduct of the initial Tristan daCunha Plume (VanDecar et al. 1995) has a chemical rather thanthermal origin. The slopes are higher for stations deployed in thefold belts than in the cratonic area. This could be explained by theobserved alkaline intrusions related to the Trindade plume track andthe feeding of the Parana flood basalts due to the starting Tristanda Cunha plume. All these geological signatures are visible at theEarth surface in the Parana basin and fold belts, but not in the SFC.
Seismic anomalies in the tomographic images may also be re-lated to artefacts of the inversion mainly due to the highly variableresolution (see Section 5) and due to the adopted approximations ofthe approach. In our study, we assume isotropic velocity anomalies.However, SK(K)S-splitting studies (Assumpcao et al. 2006) in thearea show fast polarization directions close to the absolute platemotions with signature of deflection by the root of the SFC. Theteleseismic P-waves propagate perpendicular to the horizontal man-tle flow direction and should therefore not affect our tomographicinversion results. The S-waves are more sensitive to anisotropy thanP-waves but due to the good event coverage the effect of the az-
imuthal dependent anisotropy should be largely cancelled out inthe inversion. Constant contributions of an anisotropic layer wouldbe removed by the usage of relative residuals while random con-tributions are cancelled out. We cannot exclude artefacts due toanisotropy, but we believe that these artefacts are neglectable orweak and do not influence significantly our interpretations since theP- and S-wave models resemble each other despite their indepen-dent databases and different sensibility to anisotropy. Our tectonicinterpretations in the S-wave model are therefore backed-up by theP-wave model.
The visual perception of seismic heterogeneities in our tomo-graphic images may vary depending on the average velocity at eachdepth. We use relative traveltime residuals and loose therefore theability to invert for the absolute velocities (e.g. see figure 13 inSchimmel et al. 2003). The blue and red colours mark thus onlylateral velocity changes. In principal, a red anomaly can be a fastvelocity anomaly with respect to the global average if the local av-erage is faster since the study volume is located in an old shield.However, an overall abnormal velocity average, which may bias ourimages is not expected due to the large surface area of our study vol-ume, which comprises different tectonic regimes of different ages(Proterozoic belts and Precambrian shields) without the dominanceof one of these regimes. The map of one-way S-vertical traveltimeresiduals in Poupinet et al. (2003) confirms the presence of positiveand negative traveltime residuals for our study area.
7 D I S C U S S I O N
7.1 Sao Francisco Craton
Due to the installation of stations in the northern and western SFC,a high-velocity anomaly can be now observed in these portionsof the SFC. The anomaly is more intense in the southern than inthe northern part. Resolution tests show that the northern part haslow resolution due to a poor data sampling in this region. The
C© 2010 The Authors, GJI
Geophysical Journal International C© 2010 RAS

14 M. P. Rocha, M. Schimmel and M. Assumpcao
Figure 11. Comparison of the P-wave tomographic results with the model proposed by Gibson et al. (1995, 1997) to explain the presence of Upper Cretaceousalkaline intrusions. (a) Comparison between seismic tomography and the regional seismicity, mainly in the Sao Francisco Craton region. (b) Model proposedby Gibson et al. (1995, 1997), relating the origin of the Upper Cretaceous intrusions with the initial impact of the Trindade Plume. The hatched red line in (c)sketches the Lithosphere–Asthenosphere Boundary (LAB).
southern and western areas are better resolved owing to the higherstation density. The high-velocity anomaly in the western limit ofthis craton (and beyond the surface geological limit) supports thehypothesis that this craton was part of a large Neoproterozoic plate(San Franciscan Plate-–Alkmin et al. 1993; Ussami 1993, 1999).
Fig. 11 shows the earthquake locations obtained from the IAG-USP hypocenter database between the years 1720 and 2004 ontop of a horizontal cross-section for P-wave velocity anomalies at
150 km depth. According to Assumpcao et al. (2004a) the seismic-ity in this area can be explained by stress concentration in the uppercrust due to weaknesses in the lithosphere. As can be seen fromFig. 11, most of the events occur in the Tocantins Province, contour-ing the high-velocity anomaly obtained from seismic tomography.This indicates that it is the suture zone of the collision between theSan Francisco Block and the Amazon and Paranapanema Blocks.Further, directions of the polarization of the fast split SKS waves
C© 2010 The Authors, GJI
Geophysical Journal International C© 2010 RAS
Upper-mantle seismic structure beneath Brazil 15
(Assumpcao et al. 2006) show a fan shaped feature which opensto the east around this anomaly, suggesting an asthenospheric flowaround the keel of this hypothetical San Franciscan Plate.
Vertical images for P- and S-wave velocity anomalies (Figs 7aand b), show the craton as a high velocity body until depths of250 km. This depth is an overestimation due to vertical smearingand we believe, based in our synthetic tests, that a depth around 200km is more appropriate for the root of the craton.
7.2 Low-velocity anomalies
At shallower depths (100–250 km), most low-velocity anomaliescoincide with the provinces of alkaline intrusions of the Early Cre-taceous (Fig. 11). The younger igneous provinces (85-50 MA),such as the Alto do Paranaıba (APIP), Ipora (IP) and Poxoreu (PX)Igneous Provinces are likely related with the Trindade Plume asproposed by Gibson et al. (1995) and Gibson et al. (1997) (Fig. 11).
According to Gibson et al. (1997), the initial impact of theTrindade Plume would have occurred below IP and would then havebeen dispersed to generate other igneous provinces through pocketsof partial melt in thin lithospheric spots. The corresponding seismicanomalies, likely with a strong compositional component as can ex-plain the slopes of Fig. 10, are observed in our tomographic images(Fig. 11) and are also confirmed by inversions of magnetotelluricdata (Bologna et al. 2006).
According to Assumpcao et al. (2004a) the intraplate seismicityin this area can be explained as a result of the concentration of stressin the upper crust due to a weak and thin lithosphere. Zones of theweakness could be caused by temperature anomalies on the orderof 100◦C or more (Assumpcao et al. 2004a). It can be seen fromFig. 11 that there is a tendency of seismic activity in areas withlow-velocity anomalies in the lithosphere.
The low-velocity anomaly interpreted by VanDecar et al. (1995)as being the fossil conduct of the initial Tristan da Cunha Plume(eastern part of the Parana Basin) appears now better defined due tothe data increase. Still, its base is not well imaged, but we believe thatthis anomaly does not extend much below 700 km based on synthetictests. This low-velocity anomaly occupies a large volume below thecentre of our study area and is therefore a likely source of thehigh slope obtained from the common P- and S-wave correlationsshown in Fig. 10. Slopes higher than four are observed for thedifferent regions in our study area. Compositional anomalies needto be invoked to explain slopes above 2.9 (Karato 1993). A commonand deep source is the easiest explanation. In the regions of highestslope (fold belts, 6.3) the relation of low velocity anomalies andthe presence of alkaline intrusions (kamafugites, lamproites andkimberlites) indicates that these anomalies have a compositionalorigin related to their melt sources. In fact, different heterogeneousmantle sources (e.g. due to different depth) have been proposed toexplain variations in the composition of the alkaline intrusions (e.g.Gibson et al. 1995, Bologna et al. 2006).
7.3 Cratonic basement of the Parana Basin
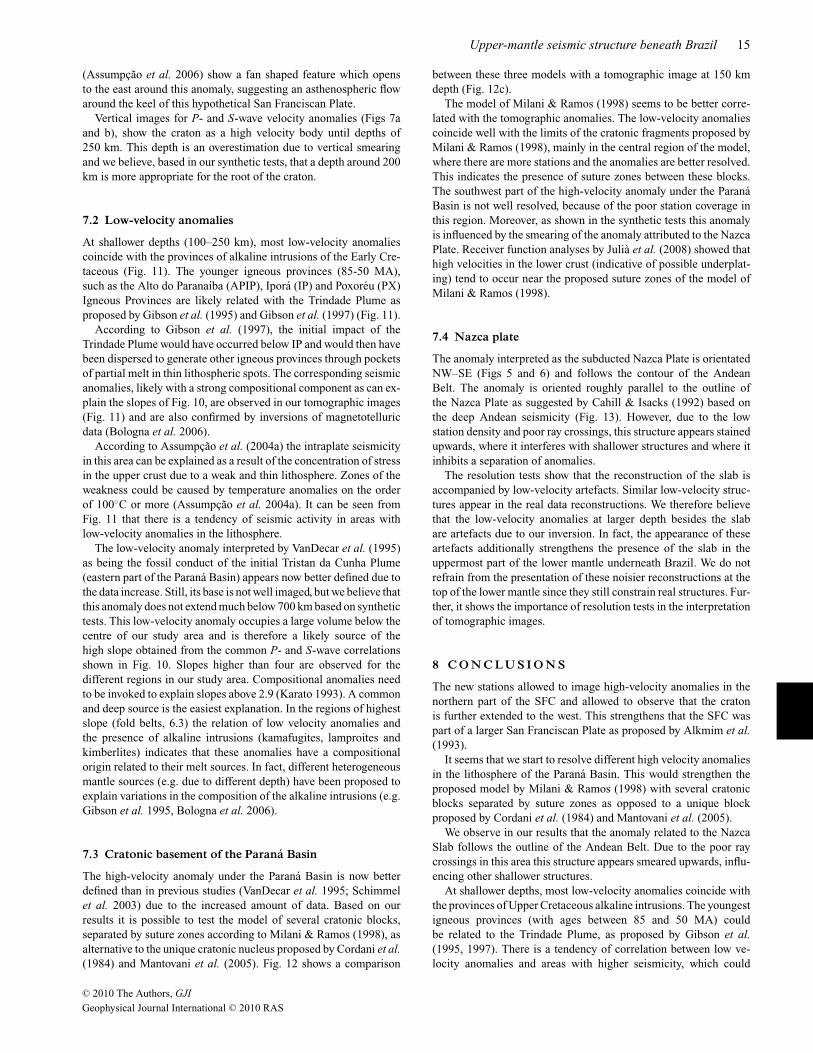
The high-velocity anomaly under the Parana Basin is now betterdefined than in previous studies (VanDecar et al. 1995; Schimmelet al. 2003) due to the increased amount of data. Based on ourresults it is possible to test the model of several cratonic blocks,separated by suture zones according to Milani & Ramos (1998), asalternative to the unique cratonic nucleus proposed by Cordani et al.(1984) and Mantovani et al. (2005). Fig. 12 shows a comparison
between these three models with a tomographic image at 150 kmdepth (Fig. 12c).
The model of Milani & Ramos (1998) seems to be better corre-lated with the tomographic anomalies. The low-velocity anomaliescoincide well with the limits of the cratonic fragments proposed byMilani & Ramos (1998), mainly in the central region of the model,where there are more stations and the anomalies are better resolved.This indicates the presence of suture zones between these blocks.The southwest part of the high-velocity anomaly under the ParanaBasin is not well resolved, because of the poor station coverage inthis region. Moreover, as shown in the synthetic tests this anomalyis influenced by the smearing of the anomaly attributed to the NazcaPlate. Receiver function analyses by Julia et al. (2008) showed thathigh velocities in the lower crust (indicative of possible underplat-ing) tend to occur near the proposed suture zones of the model ofMilani & Ramos (1998).
7.4 Nazca plate
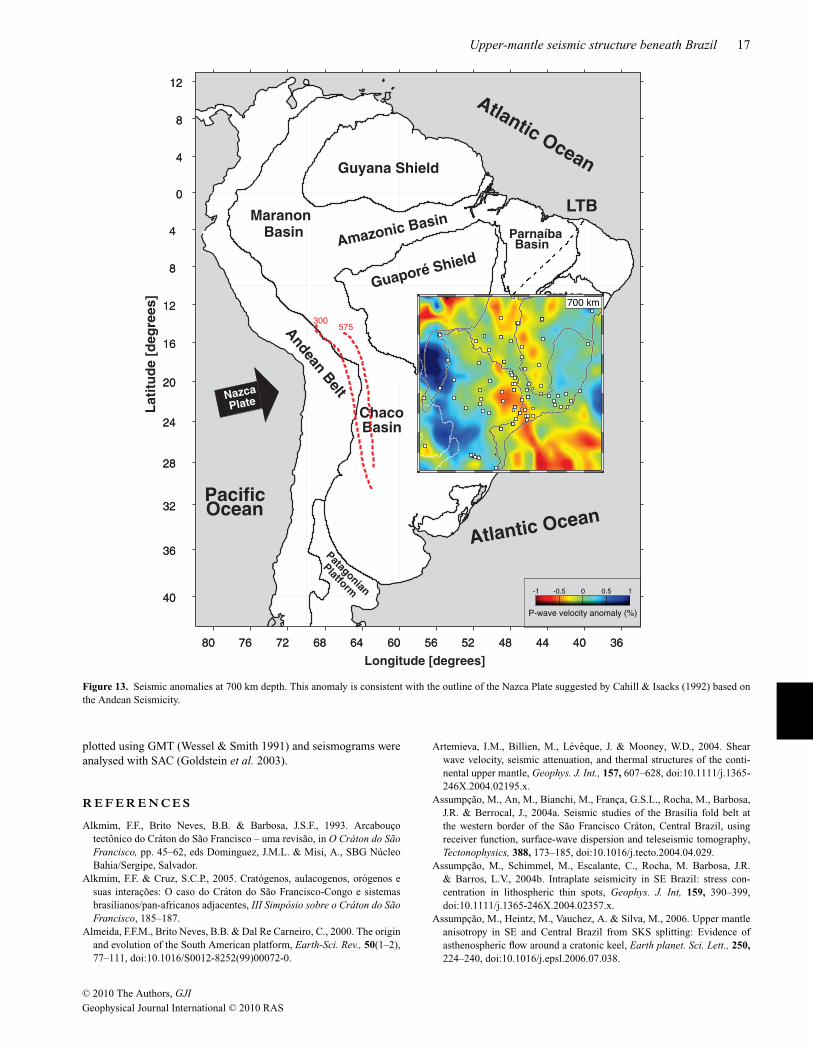
The anomaly interpreted as the subducted Nazca Plate is orientatedNW–SE (Figs 5 and 6) and follows the contour of the AndeanBelt. The anomaly is oriented roughly parallel to the outline ofthe Nazca Plate as suggested by Cahill & Isacks (1992) based onthe deep Andean seismicity (Fig. 13). However, due to the lowstation density and poor ray crossings, this structure appears stainedupwards, where it interferes with shallower structures and where itinhibits a separation of anomalies.
The resolution tests show that the reconstruction of the slab isaccompanied by low-velocity artefacts. Similar low-velocity struc-tures appear in the real data reconstructions. We therefore believethat the low-velocity anomalies at larger depth besides the slabare artefacts due to our inversion. In fact, the appearance of theseartefacts additionally strengthens the presence of the slab in theuppermost part of the lower mantle underneath Brazil. We do notrefrain from the presentation of these noisier reconstructions at thetop of the lower mantle since they still constrain real structures. Fur-ther, it shows the importance of resolution tests in the interpretationof tomographic images.
8 C O N C LU S I O N S
The new stations allowed to image high-velocity anomalies in thenorthern part of the SFC and allowed to observe that the cratonis further extended to the west. This strengthens that the SFC waspart of a larger San Franciscan Plate as proposed by Alkmim et al.(1993).
It seems that we start to resolve different high velocity anomaliesin the lithosphere of the Parana Basin. This would strengthen theproposed model by Milani & Ramos (1998) with several cratonicblocks separated by suture zones as opposed to a unique blockproposed by Cordani et al. (1984) and Mantovani et al. (2005).
We observe in our results that the anomaly related to the NazcaSlab follows the outline of the Andean Belt. Due to the poor raycrossings in this area this structure appears smeared upwards, influ-encing other shallower structures.
At shallower depths, most low-velocity anomalies coincide withthe provinces of Upper Cretaceous alkaline intrusions. The youngestigneous provinces (with ages between 85 and 50 MA) couldbe related to the Trindade Plume, as proposed by Gibson et al.(1995, 1997). There is a tendency of correlation between low ve-locity anomalies and areas with higher seismicity, which could
C© 2010 The Authors, GJI
Geophysical Journal International C© 2010 RAS
16 M. P. Rocha, M. Schimmel and M. Assumpcao
a) b)
-1 -0.5 0 0.5 1
P-wave velocity anomaly (%)
a) Cordani et al. (1984)
b) Milani & Ramos (1998)
c) Mantovani et al. (2005)c)
Figure 12. Comparison between the different models for the basement of the Parana Basin with our P-velocity anomalies at 150 km depth.
indicate stress concentration in the upper crust caused by litho-spheric thinning (possibly related to the impact of warm mate-rial from a Trindade Plume). The deep (300–700km) low-velocityanomaly interpreted by VanDecar et al. (1995) was better resolvedin our results.
The test inversions of synthetic data proved to be essential in ouranalysis, since the resolution varies throughout our study volume. Itcould be shown that the low velocity anomalies besides the NazcaPlate are artefacts due to the data and inversion approach. Theirappearance in the real images strengthens the presence of the NazcaPlate.
Comparison between P- and S-wave relative residual suggeststhat the influence of temperature and composition in the seismicanomalies are different in distinct regions. The slope of the P-versus S-wave relative traveltime correlations is slightly larger formeasurements from areas with mainly low-velocity anomalies thanfor measurements taken from the stable craton. This might be dueto the presence of alkaline intrusions caused by the earlier occur-rence of partial melting in the region. In any case, compositionalheterogeneities are expected to explain the slopes in both areas. A
possible explanation of this observation is that the large low-velocityanomaly in the centre of our study volume, previously interpreted asrelated to the Tristan da Cunha Plume, is actually a compositionalanomaly.
A C K N OW L E D G M E N T S
Work supported by Brazilian grants FAPESP 05/51035-2, 01/06066-6 and CNPq 30.4809/2003-9, 141318/2004-0,20.3726/2005-7. We are grateful to Institute of Technological Re-search of Sao Paulo, Seismological Observatory of the Universityof Brasilia, GTSN and GEOSCOPE Networks and also Suzan Vander Lee (ETH-Z) for sharing part of the data used in this work. TheRegional Seismic Tomography code was kindly provided by JohnVanDecar. We thank Jose Roberto Barbosa for help during fieldwork and also Luıs Galhardo and Dennis Schramm for equipmentservice and maintenance during the tomography experiment. Theconstructive reviews by the associate editor Gabi Laske, the refereeUli Achauer and an anonymous referee improved the manuscript.MS acknowledges PN No. CGL2006-01171 (S-Iberia). Maps were
C© 2010 The Authors, GJI
Geophysical Journal International C© 2010 RAS
Upper-mantle seismic structure beneath Brazil 17
80 76 72 68 64 60 56 52 48 44 40 36
40
36
32
28
24
20
16
12
8
4
0
4
8
12
80 76 72 68 64 60 56 52 48 44 40 36
40
36
32
28
24
20
16
12
8
4
0
4
8
12
Atlantic Ocean
Atlantic OceanGuyana Shield
Guaporé Shield
Amazonic Basin
Bacia do Paranaá
Basin Parnaíba
BasinChaco
BasinMaranon
Cratondo Saão
Francisco Andean B
elt
Platform
Patagonian
LTB
(02)
(03)
(04)
A
BC
Longitude [degrees]
La
titu
de
[d
eg
ree
s]
-1 -0.5 0 0.5 1
P-wave velocity anomaly (%)
Ocean Pacific
PlateNazca
300575
700 km
Figure 13. Seismic anomalies at 700 km depth. This anomaly is consistent with the outline of the Nazca Plate suggested by Cahill & Isacks (1992) based onthe Andean Seismicity.
plotted using GMT (Wessel & Smith 1991) and seismograms wereanalysed with SAC (Goldstein et al. 2003).
R E F E R E N C E S
Alkmim, F.F., Brito Neves, B.B. & Barbosa, J.S.F., 1993. Arcaboucotectonico do Craton do Sao Francisco – uma revisao, in O Craton do SaoFrancisco, pp. 45–62, eds Dominguez, J.M.L. & Misi, A., SBG NucleoBahia/Sergipe, Salvador.
Alkmim, F.F. & Cruz, S.C.P., 2005. Cratogenos, aulacogenos, orogenos esuas interacoes: O caso do Craton do Sao Francisco-Congo e sistemasbrasilianos/pan-africanos adjacentes, III Simposio sobre o Craton do SaoFrancisco, 185–187.
Almeida, F.F.M., Brito Neves, B.B. & Dal Re Carneiro, C., 2000. The originand evolution of the South American platform, Earth-Sci. Rev., 50(1–2),77–111, doi:10.1016/S0012-8252(99)00072-0.
Artemieva, I.M., Billien, M., Leveque, J. & Mooney, W.D., 2004. Shearwave velocity, seismic attenuation, and thermal structures of the conti-nental upper mantle, Geophys. J. Int., 157, 607–628, doi:10.1111/j.1365-246X.2004.02195.x.
Assumpcao, M., An, M., Bianchi, M., Franca, G.S.L., Rocha, M., Barbosa,J.R. & Berrocal, J., 2004a. Seismic studies of the Brasilia fold belt atthe western border of the Sao Francisco Craton, Central Brazil, usingreceiver function, surface-wave dispersion and teleseismic tomography,Tectonophysics, 388, 173–185, doi:10.1016/j.tecto.2004.04.029.
Assumpcao, M., Schimmel, M., Escalante, C., Rocha, M. Barbosa, J.R.& Barros, L.V., 2004b. Intraplate seismicity in SE Brazil: stress con-centration in lithospheric thin spots, Geophys. J. Int, 159, 390–399,doi:10.1111/j.1365-246X.2004.02357.x.
Assumpcao, M., Heintz, M., Vauchez, A. & Silva, M., 2006. Upper mantleanisotropy in SE and Central Brazil from SKS splitting: Evidence ofasthenospheric flow around a cratonic keel, Earth planet. Sci. Lett., 250,224–240, doi:10.1016/j.epsl.2006.07.038.
C© 2010 The Authors, GJI
Geophysical Journal International C© 2010 RAS
18 M. P. Rocha, M. Schimmel and M. Assumpcao
Bastow, I.D., Stuart, G.W., Kendall, J.M. & Ebinger, C.J., 2005.Upper-mantle seismic structure in a region of incipient continentalbreakup: Northern Ethiopian rift, Geophys. J. Int., 162(2), 479–493,doi:10.1111/j.1365-246X.2005.02666.x.
Bastow, I.D., Nyblade, A.A., Stuart, G.W., Rooney, T.O. & Benoit, M.H.,2008. Upper mantle seismic structure beneath the Ethiopian hotspot: Rift-ing at the edge of the African low velocity anomaly, Geochem. Geophys.Geosyst., 9(Q12022), 25 pp., doi:10.1029/2008GC002107.
Benoit, M.H., Nyblade, A.A. & VanDecar, J.C., 2006. Upper mantle P-wavespeed variations beneath Ethiopia and the origin of the Afar hotspot,Geology, 34(5), 329–332, doi:10.1130/G22281.1.
Bologna, M.S., Padilha, A.L., Vitorello, I. & Fontes, S.L., 2006. Tec-tonic insight into a pericratonic subcrustal lithosphere affected by anoro-genic Cretaceous magmatism in central Brazil inferred from long-period magnetotellurics, Earth planet. Sci. Lett., 241(3–4), 603–616,doi:10.1016/j.epsl.2005.11.022.
Brito Neves, B.B. & Cordani, U.G., 1991. Tectonic evolution of SouthAmerica during the Late Proterozoic, Precambrian Res., 53, 23–40,doi:10.1016/0301-9268(91)90004-T.
Cahill, T. & Isacks, B., 1992. Seismicity and shape of the subducted NazcaPlate, J. geophys.Res., 97(B12), 17503–17529, doi:10.1029/92JB00493.
Cline, A.K., 1981. FITPACK – Software package for curve and surface fit-ting employing splines under tension, Department of Computer Sciences,University of Texas, Austin.
Constable, S.C., Parker, R.L. & Constable, C.G., 1987. Occam’s inversion:a pratical algorithm for generation smooth models from electromagneticsounding data, Geophysics, 52, 289–300, doi:10.1190/1.1442303.
Cordani, U.G. & Sato, K., 1999. Crustal evolution of the South AmericanPlatform, based on Nd isotopic systematics on granitoids rocks, Episodes,22(3), 167–173.
Cordani, U.G., Fuck, R.A., Brito Neves, B.B., Filho, A.T. & Cunha,F.M.B., 1984. Estudo preliminar de integracao do Pre-Cambrianocom os eventos tectonicos das Bacias Sedimentares Brasileiras, Re-vista Ciencia-Tecnica-Petroleo, Secao Exploracao de Petroleo, Petro-bras/Cenpes/Sintep, Publicacao no.: 15.
Cordani, U.G., Sato, K., Teixeira, W., Tassinari C.C.G. & Basei, M.A.S.,2000. Crustal evolution of the South American platform, in TectonicEvolution of South America, pp. 19–40, eds Cordani, U.G., Milani, E.J.,Thomaz-Filho, A. & Campos, D.A., Finep, Brazil.
Deschamps, F., Trampert, J., & Snieder, R., 2002. Anomalies of tem-perature and iron in the uppermost mantle inferred from gravity dataand tomographic models, Phys. Earth planet. Inter., 129, 245–264,doi:10.1016/S0031-9201(01)00294-1.
Escalante, C., 2002. Tomografia sısmica do manto superior sob o sudeste ecentro oeste do Brasil, M. Phil thesis. IAG/USP, Sao Paulo, SP, p. 74.
Evans, J.R. & Achauer, U., 1993. Teleseismic velocity tomography usingthe ACH-method: theory and application to continental scale studies, inSeismic Tomography: Theory and Practice, pp. 319–360, ch. 13, eds Iyer,H.M. & Hirahara, K., Chapman and Hall, London.
Feng, M., Assumpcao, M.S. & Van Der Lee, S., 2004. Group-velocity tomography and lithospheric S-velocity structure of theSouth American continent, Phys. Earth planet. Inter., 147, 315–331,doi:10.1016/j.pepi.2004.07.008.
Feng, M., Van Der Lee, S. & Assumpcao, M., 2007. Upper mantle structureof South America from joint inversion of waveforms and fundamentalmode group velocities of Rayleigh waves, J. geophys. Res., 112(B04312),16 pp, doi:10.1029/2006JB004449.
Fyfe, W.S. & Leonardos Jr. O.H., 1974. Ancient metamorphic-migmatitebelts of the Brazilian Atlantic coast: the African conection, Rev. Brasileirade Geociencias, 4, 247–252.
Gao, W., Grand, S.P., Baldridge, W.S., Wilson, D., West, M., Ni, J.F. & Aster,R., 2004. Upper mantle convection beneath the central Rio Grande riftimaged by P- and S wave tomography, J. geophys. Res., 109(B03305),doi:10.1029/2003JB002743.
Gibson, S.A., Thompson, R.N., Leonardos, O.H., Dickin, A.P. & Mitchell,J.G., 1995. The late Cretaceous impact of the Trindade mantle plume:evidence from large-volume, mafic, potassic magmatism in SE Brazil, J.Petrol., 36(1), 189–229, doi:10.1093/petrology/36.1.189.
Gibson, S.A., Thompson, R.N., Weska, A.P., Dickin, A.P. & Leonards, O.H,1997. Late Cretaceous rift-related upwellings and melting of the Trindadestarting mantle plume head beneath western Brazil, Contrib. Mineral.Petrol., 126, 303–314, doi:10.1007/s004100050252.
Gibson, S.A., Thompson, R.N., Day, J.A., Humphris, S.E. & Dickin,A.P., 2005. Melt-generation processes associated with the Tristan man-tle plume: constraints on the origin of EM-1, Earth planet. Sci. Lett.,237(3–4), 744–767, doi:10.1016/j.epsl.2005.06.015.
Goes, S., Govers, R. & Vacher, P., 2000, Shallow mantle temperatures underEurope from P and S wave tomography, J. geophys. Res., 105(B5), 11153–11 169, doi:10.1029/1999JB900300.
Goldstein, P., Dodge, D., Firpo, M. & Lee Minner, 2003. 85.5 SAC2000:Signal processing and analysis tools for seismologists and engineers, inInternational Geophysics, Part 2, International Handbook of Earthquakeand Engineering Seismology, Vol. 81, pp. 1613–1614, eds Lee, W.H.K.,Kanamori, H., Jennings, P.C. & Kisslinger, C., Academic Press, London,doi:10.1016/S0074-6142(03)80284-X.
Heilbron, M., Pedrosa-Soares, A., Neto, M., da Silva, L., Trouw, R. &Janasi, V., 2004. Brasiliano Orogens in Southeast and South Brazil, J.Virtual Explorer, 17, paper 4.
Heintz, M., Debayle, E. & Vauchez, A., 2005. Upper mantle struc-ture of the South American continent and neighboring oceansfrom surface wave tomography, Tectonophysics, 406, 115–139,doi:10.1016/j.tecto.2005.05.006.
Huber, P.J., 1981. Robustic Statistics, Wiley, New York.Julia, J., Assumpcao, M. & Rocha, M.P., 2008. Deep crustal structure of
the Parana Basin from receiver functions and Rayleigh-wave dispersion:evidence for a fragmented cratonic root, J. geophys. Res., 113, B08318,doi:10.1029/2007JB005374.
Karato, S., 1993. Importance of anelasticity in the interpretationof seismic tomography, Geophys. Res. Lett., 20(15), 1623–1626,doi:10.1029/93GL01767.
Karato, S. & Karki, B.B., 2001. Origin of lateral variation of seismic wavevelocities and density in the deep mantle, J. geophys. Res., 106(B10), 21771–21 783, doi:10.1029/2001JB000214.
Kennett, B.L.N. & Engdahl, E.R., 1991. Travel-times for global earth-quakes location and phase identification, Geophys. J. Int., 105, 429–465,doi:10.1111/j.1365-246X.1991.tb06724.x.
Lees, J.M., VanDecar, J., Gordeev, E., Ozerov, A., Brandon, M., Park, J. &Levin, V., 2007. Three dimensional images of the Kamchatka-Pacific PlateCusp., in Volcanism and Subduction: the Kamchatka region, Geophys.Monogr. Ser. 172, pp. 65–75, eds Eichelberger, J., Gordeev, E., Kasahara,M., Tzbekov, P. & Lees, J., Am. geophys. Un., Washington, D.C.
Liu, K.H., Gao, S., Silver, P.G. & Zhang, Y., 2003. Mantle layer-ing across central South America, J. geophys. Res., 108(B11), 2510,doi:10.10219/2002JB002208.
Mantovani, M.S.M., Quintas, M.C.L., Shukowsky, W. & de Brito Neves,B.B., 2005. Delimitation of the Paranapanema Proterozoic block: a geo-physical contribution, Episodes, 28(1), 18–22.
Milani, E.J. & Ramos, V.A., 1998. Orogenias paleozoicas no domınio sul-ocidental do Gondwana e os ciclos de subsidencia da Bacia do Parana,Rev. Brasileira de Geociencias, 28(4), 473–484.
Montes-Lauar, C.R., Pacca, I.G., Melfi, A.J. & Kawashita, K., 1995.Late Cretaceous alkaline complexes, southeastern Brazil: paleomag-netism and geochronology, Earth planet. Sci. Lett., 134(3–4), 425–440,doi:10.1016/0012-821X(95)00135-Y.
Neele, F., Vandecar, J. & Snieder, R., 1993. The use of P-wave amplitude datain a joint inversion with travel times for upper mantle velocity structure,J. geophys. Res., 98, 12033–12054.
Paige, C.C. & Saunders, M.A., 1982a. Algorithm 583, LSQR: sparse linearequations and least squares problems, ACM Trans. Math. Softw., 8(2),195–209.
Paige, C.C. & Saunders, M.A., 1982b. LSQR: an algorithm for sparse linearequations and sparse least squares, ACM Trans. Math. Softw., 8(2), 43–71.
Perez-Gussinye, M., Lowry, A.R. & Watts, A.B., 2007. Efective elas-tic thickness of South America and its implications for intraconti-nental deformation, Geochem. Geophys. Geosyst., 8(5), 22, Q05009,doi:10.1029/2006GC001511.
C© 2010 The Authors, GJI
Geophysical Journal International C© 2010 RAS
Upper-mantle seismic structure beneath Brazil 19
Pimentel, M.M., Fuck, R.A., Jost, H., Filho, C.F.F. & Araujo, S.M., 2000. Thebasement of the Brasılia Fold Belt and the Goias, in Tectonic Evolutionof South America Magmatic Arc, 195-229, 31st International GeologicalCongress, Rio de Janeiro, Brazil.
Poupinet, G., Arndt, N. & Vacher, P., 2003. Seismic tomography beneathstable tectonic regions and the origin and composition of the conti-nental lithospheric mantle, Earth planet. Sci. Lett., 212(1–2), 89–101,doi:10.1016/S0012-821X(03)00258-9.
Pulliam, R.J., Vasco, D.W. & Johnson, L.R., 1993. Tomographic inversionsfor mantle P wave velocity structure based on the minimization of l2 andl1 norms of international seismological centre travel-time residuals, J.geophys. Res., 98(B1), 699–734, doi:10.1029/92JB01053.
Ramos, V., 1999. Plate tectonic setting of the Andean Cordillera, Episodes,22(3), 183–190.
Rawlinson, N., Reading, A.M. & Kennett, B.L.N., 2006. Lithospheric struc-ture of Tasmania from a novel form of teleseismic tomography, J. geophys.Res., 111(B02301), 21 pp, doi:10.1029/2005JB003803.
Ren, Y., Stutzmann, E., Van Der Hilst, R.D. & Besse, J., 2007. Understand-ing seismic heterogeneities in the lower mantle beneath the Americasfrom seismic tomography and plate tectonic history, J. geophys. Res.,112(B01302), doi:10.1029/2005JB004154.
Rocha, M.P., 2003. Ampliacao da Tomografia Sısmica do Manto Superior noSudeste e Centro-Oeste do Brasil com ondas P, M.Phil thesis – IAG-USP,Sao Paulo, p. 71.
Schmid, C., Van Der Lee, S., VanDecar, J.C., Engdahl, E.R. & Giardini, D.,2008. Three-dimensional S velocity of the Mantle in the Africa-EurasiaPlate boundary region from phase arrival times and regional waveforms,J. geophys. Res., 113(B03306), doi:10.1029/2005JB004193.
Schimmel, M., 1999. Phase Cross-Correlation: Design, Comparison, andApplication, Bull. seism. Soc. Am., 89, 1366–1378.
Schimmel, M., Assumpcao, M. & VanDecar, J.C., 2003. Seismic velocityanomalies beneath SE Brazil from P- and S wave travel-time inversions,J. geophys. Res., 108(1–13), doi:10.1029/2001JB000187.
Siebel, W., Becchio, R., Volker, F., Hansen, M.A.F., Viramonte, J., Trumbull,R.B., Haase, G. & Zimmer, M., 2000. Trindade and Martin Vaz Islands,South Atlantic: Isotopic (Sr, Nd, Pb) and trace element constraints onplume related magmatism, J. South Am. Earth Sci., 13(1–2), 79–103,doi:10.1016/S0895-9811(00)00015-8.
Silva, L.C., McNaughton, N.J., Armstrong, R., Hartmann, L.A. & Fletcher,I.R., 2005. The neoproterozoic Mantiqueira Province and its Africanconnections: a zircon-based U-Pb geochronologic subdivision for theBrasiliano/Pan-African systems of orogens, Precambrian Res., 136(3–4),03–240, doi:10.1016/j.precamres.2004.10.004.
Sol, S., Thomsom, C.J., Kendall, J-M., White, D., VanDecar, J.C. & Asudeh,I., 2002, Seismic tomographic images of the cratonic upper mantle be-neath the Western Superior Province of the Canadian Shield – A remnantArchean slab?, Phys. Earth planet. Inter., 34, 53–69, doi:10.1016/S0031-9201(02)00081-X.
Teixeira, W., Sabate, P., Barbosa, J., Noce, C.M. & Carneiro, M.A., 2000.Archean and Paleoproterozoic tectonic evolution of the Sao FranciscoCraton, Brazil, in Tectonic Evolution of South America, pp. 101–137, edsCordani, U.G., Milani, E.J., Thomaz-Filho, A. & Campos, D.A., Finep,Brazil.
Thompson, R.N., Gibson, S.A., Mitchell, J.G., Dickin, A.P., Leonards,O.H., Broad, J.A. & Greenwood, J.C., 1998. Migrating Cretaceous-Eocene Magmatism in the Serra do Mar Alkaline Province, SE Brazil:melts from deflected Trindade Mantle Plume? J. Petrol., 39, 1493–1526.
Ussami, N., 1993. Estudos Geofısicos no Craton do Sao Francisco: EstagioAtual e Perspectivas, in O Craton do Sao Francisco, pp. 35–43, edsDomingues, J. & Misi, A., Soc. Brasileira de Geologia, Brazil.
Ussami, N., 1999. Estruturacao e Limites da Placa Litosferica Sao Francis-cana: Contribuicao Gravimetrica, Tese de livre docencia, Universidade deSao Paulo, 61.
VanDecar, J.C., James, D.E. & Assumpcao, M., 1995. Seismic evidence fora fossil plume beneath South America and implications for plate drivingforces, Nature, 378, 25–31, doi:10.1038/378025a0.
VanDecar, J.C. & Crosson, R.S., 1990. Determination of telesseismic rel-ative phase arrival times using multi-channel cross-correlation and leastsquares, Bull. seism. Soc. Am., 80, 150–169.
Van Der Lee, S. & Wiens, D.A., 2006. Seismological contraints on earthdeep water cycle, in Earth’s Deep Water Cicle, pp. 13–28, Vol. 168, edsJacobsen, Steven D. & Suzan van, der Lee, Geophysical monograph series,AGU, Washington, D.C.
Wessel, P. & Smith, W.H.F., 1991. Free software helps map and display data,EOS, Trans. Am. geophys. Un., 72(41), p. 441, doi:10.1029/90EO00319.
West, J., Fouch, M., Roth, J. & Elkins-Tanton, L., 2009. Vertical mantle flowassociated with a lithospheric drip beneath the Great Basin, Nat. Geosci.,2(6), 439–444, doi:10.1038/ngeo526.
Wolfe, C.J., Bjarnason, I.Th., VanDecar, J.C. & Solomon, S.C., 2002.Assessing the depth resolution of tomographic models of uppermantle structure beneath Iceland, Geophys. Res. Lett., 29(2), 1015,doi:10.1029/2001GL013657.
Zalan, P.V. et al. 1990. The Parana Basin, Brazil, in Interior Cratonic Basins,Vol. 51, pp. 681–708, eds Leighton, M.W., Kolata, D.R., Oltz, D.F., Eidel,J.J., American Association of Petroleum Geologists Memoir, Tulsa.
C© 2010 The Authors, GJI
Geophysical Journal International C© 2010 RAS