geophysical case studies from texas
TRANSCRIPT

Geophysical Case studies From Texas
1

PRESENTATION OUTLINE
Active Growth Faults in Metropolitan Houston1. Hockley2. Tomball3. Long Point4. Pearland
Foundation Case Studies
Karst Geophysics in Austin: Cave, Conduit and Fault Mapping
Conclusions
2

Definitions of Geophysics
Geophysics is the study of earth materials and processes using the methods of physics.
It is, in general, a non-invasive and relatively inexpensive technology that provides unique constrains which are NOT obtainable using traditional engineering geology for site characterization.
REMINDER: Geophysics is just another
•
3

Definitions of Geophyicist
Geophysicist: One who studies and applies geophysics to the solution of geological, environmental and geotechnical problems.
Alternative Definition of a Geophysicist from Google: A slightly below average classical physicist, a slightly below average geologist, a slightly below average engineer.!!
4

Resistivity Method
)
-High-resolution image of shallow subsurface
-Targets: bedrock vs. faults, voids, internal stratigraphy
Depth Exploration: ¼ of profile length 5
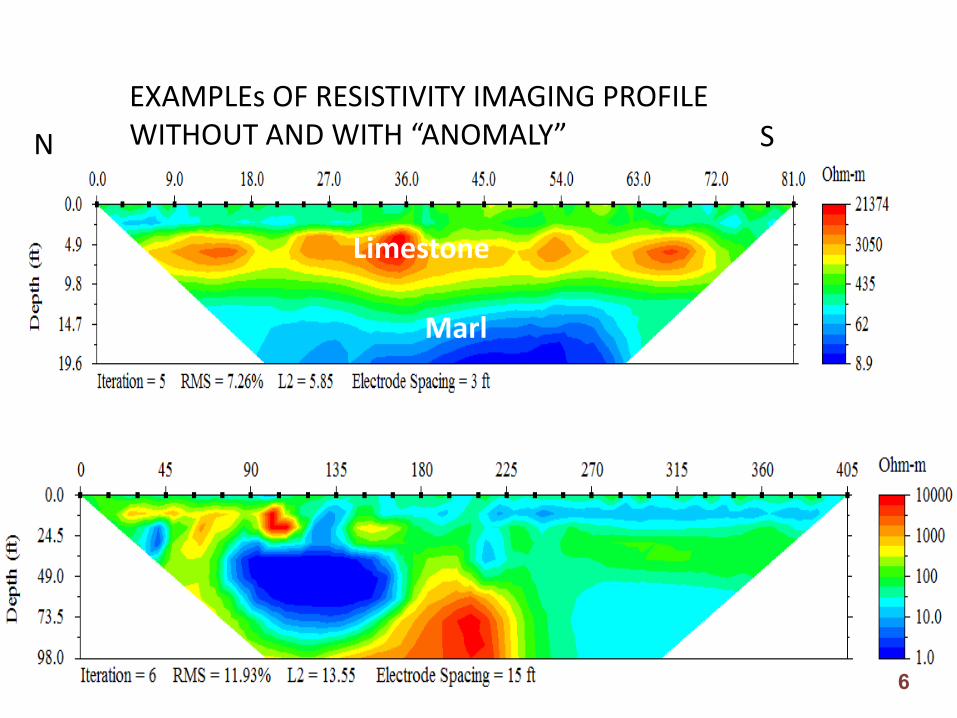
N SEXAMPLEs OF RESISTIVITY IMAGING PROFILE WITHOUT AND WITH “ANOMALY”
Limestone
Marl
6
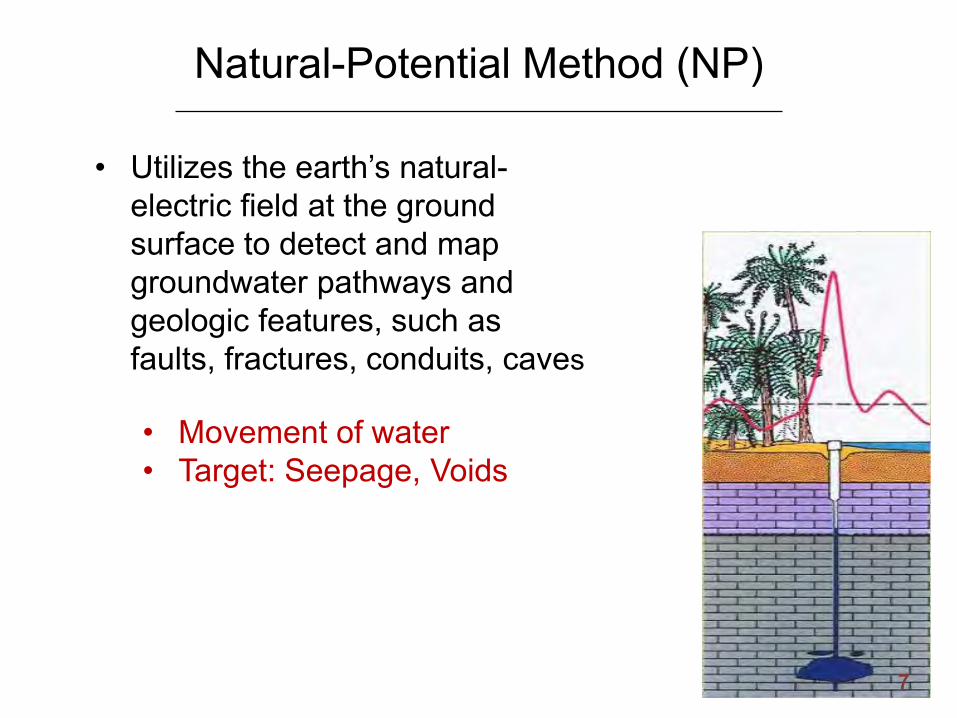
• Utilizes the earth’s natural-electric field at the ground surface to detect and map groundwater pathways and geologic features, such as faults, fractures, conduits, caves
• Movement of water• Target: Seepage, Voids
Natural-Potential Method (NP)
7

mV
8
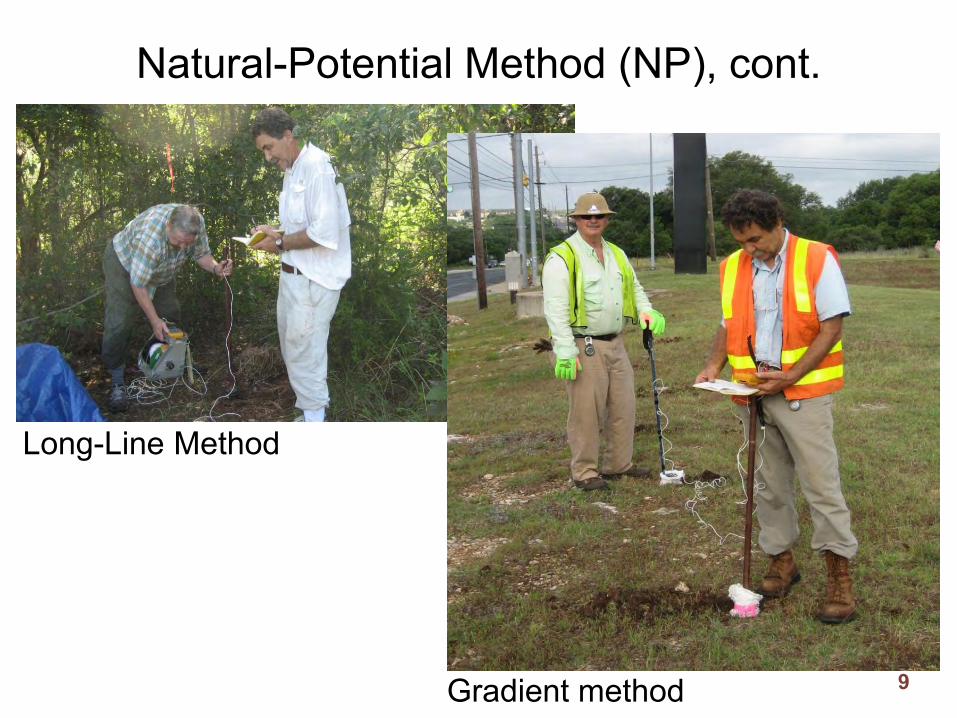
Long-Line Method
Gradient method
Natural-Potential Method (NP), cont.
9
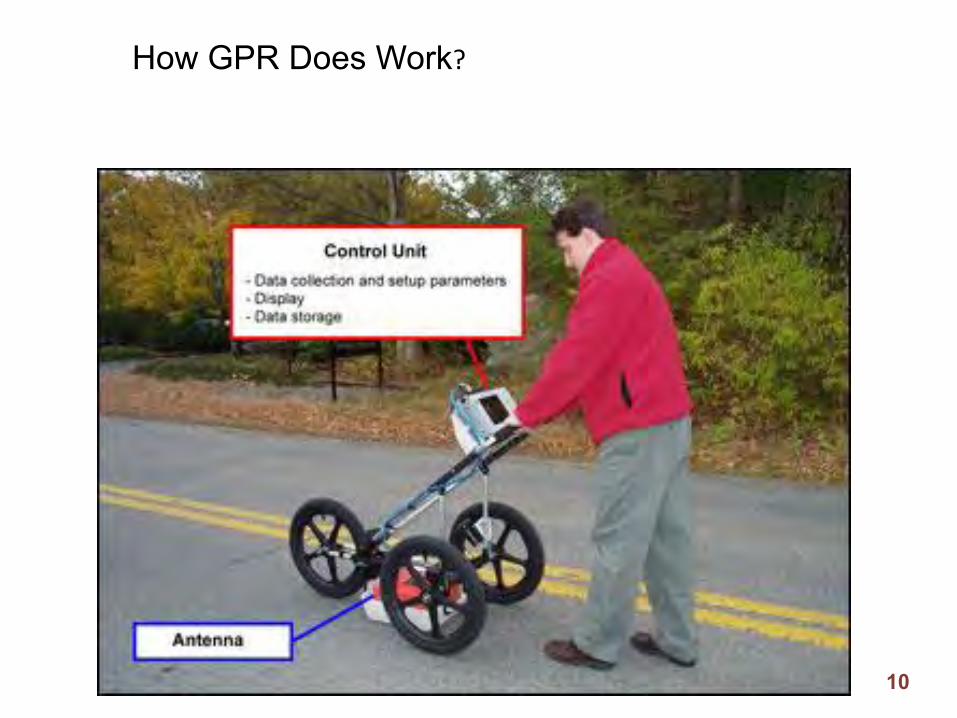
How GPR Does Work?
10

Tomball
LPF-1
LPF-2
Pearland
Lidar elevation map showing major Houston Faults11

12
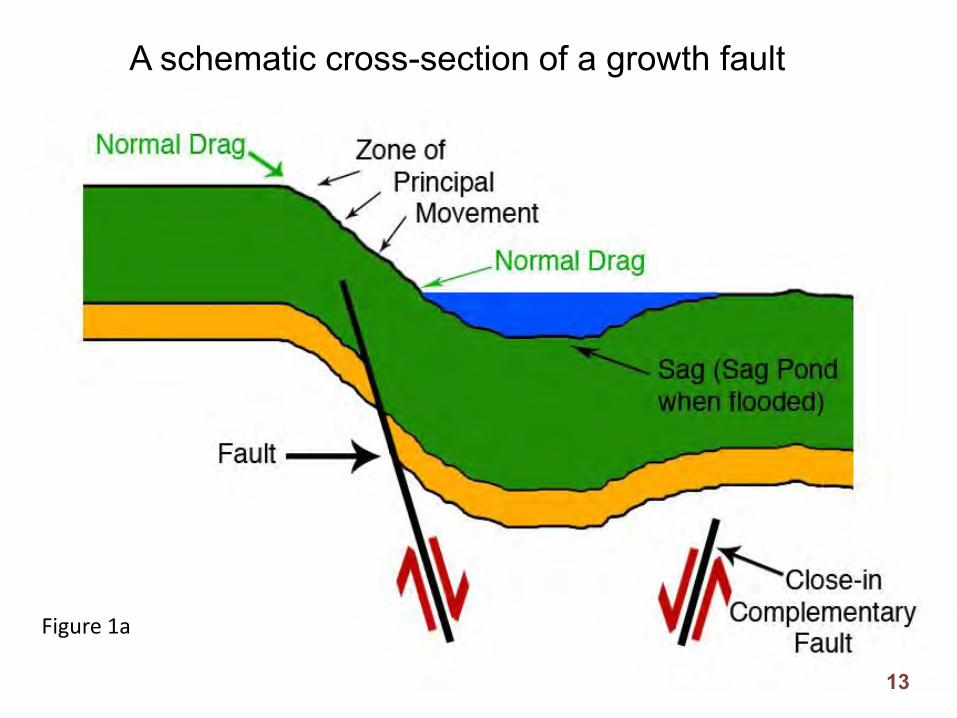
Figure 1a
A schematic cross-section of a growth fault
13

14
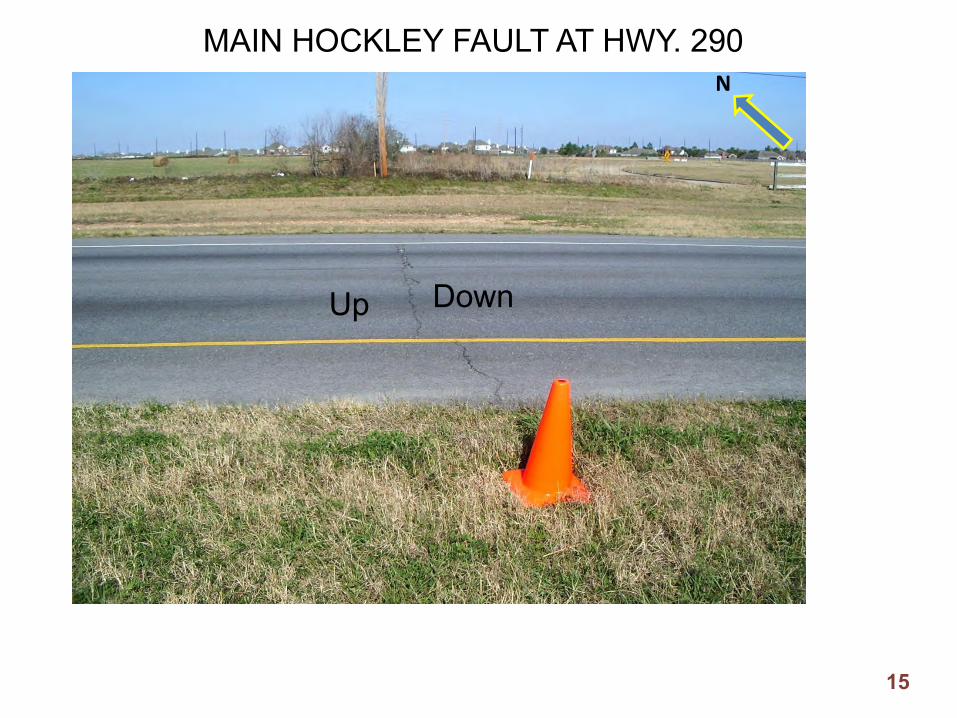
N
Up Down
MAIN HOCKLEY FAULT AT HWY. 290
15

Shopping Mall being built
Highway 290-East Bound
UP
Down
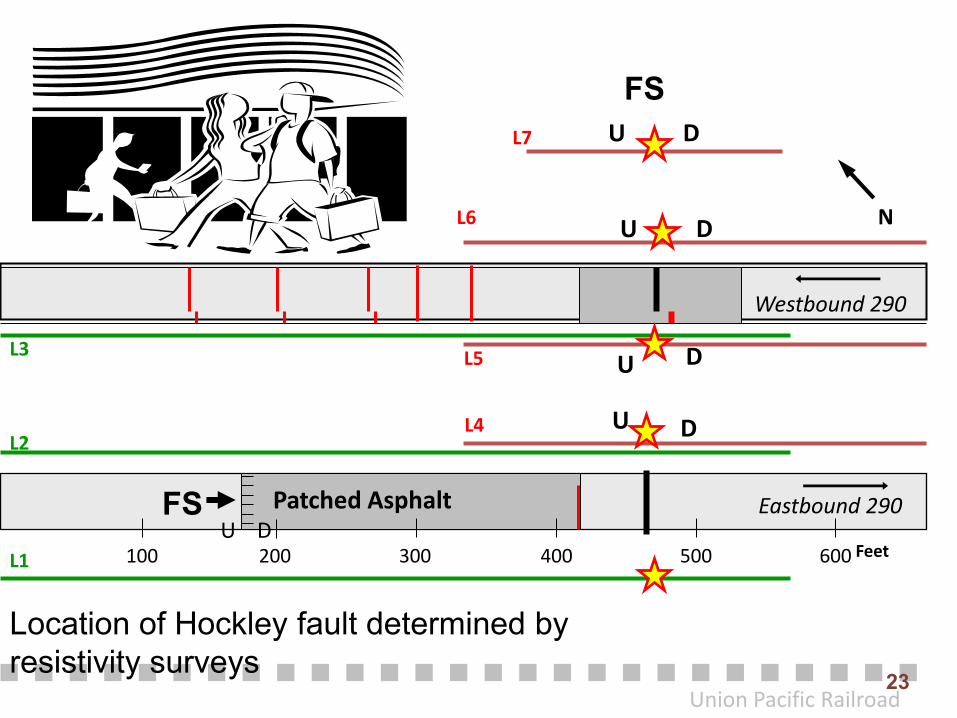
L116

Union Pacific Railroad
Westbound 290
L6
L5
L4
L1
L2
L3
FAULT
Eastbound 290
100 200 300 400 500 600
FAULT SCARP
Patched Asphalt
N
L7
FAULT SCARP
U D
2005 field mapping with resistivity survey locations
(A GPR profile is taken along Line 1)
17

L1 Profile
W E
L2 Profile
Major Crack Location
Resistivity profiles at Hockley Fault
Fault Scarp
18

NW SE
L5 Profile
L6 Profile
Sand
Sand
Sand
Clay/Silty Sand
Silt/SiltySand
Silt/Silty Sand
Resistivity Profiles Across the Main Hockley Fault
19
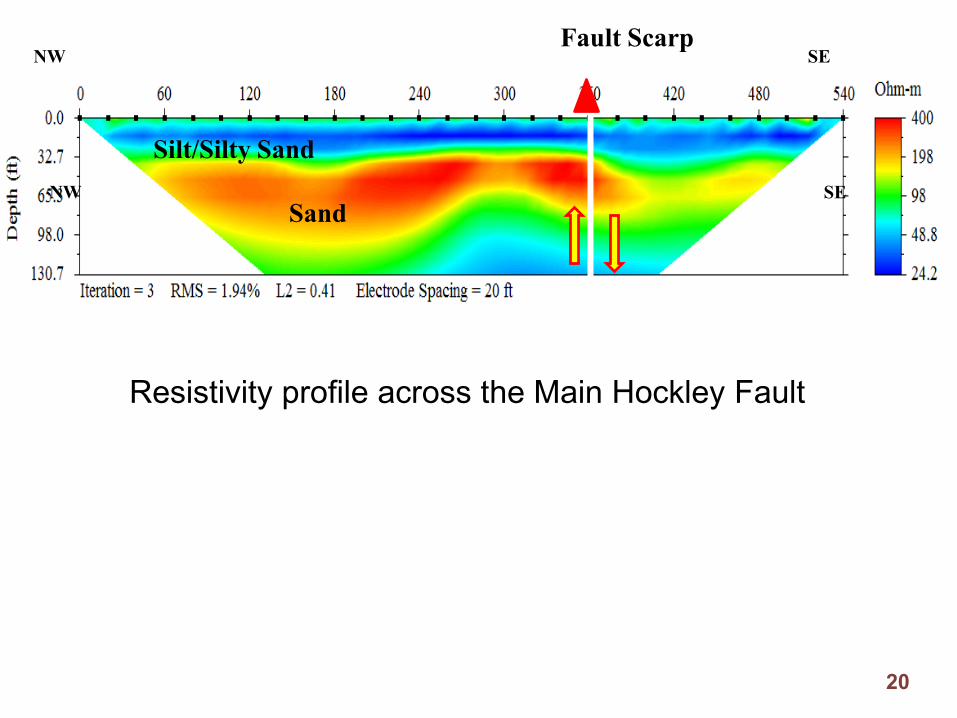
Fault Scarp
Sand
Silt/Silty Sand
NW SE
NW SE
Resistivity profile across the Main Hockley Fault
20

150 155 160 165 170 175 FtNW SE
Fault Scarp
Am
plitu
de
Low
HighFt
GPR Profile across the fault scarp L1-This scarp did not have any resistivity anomaly. So it is NOT considered the main Hockley fault.
L1
21
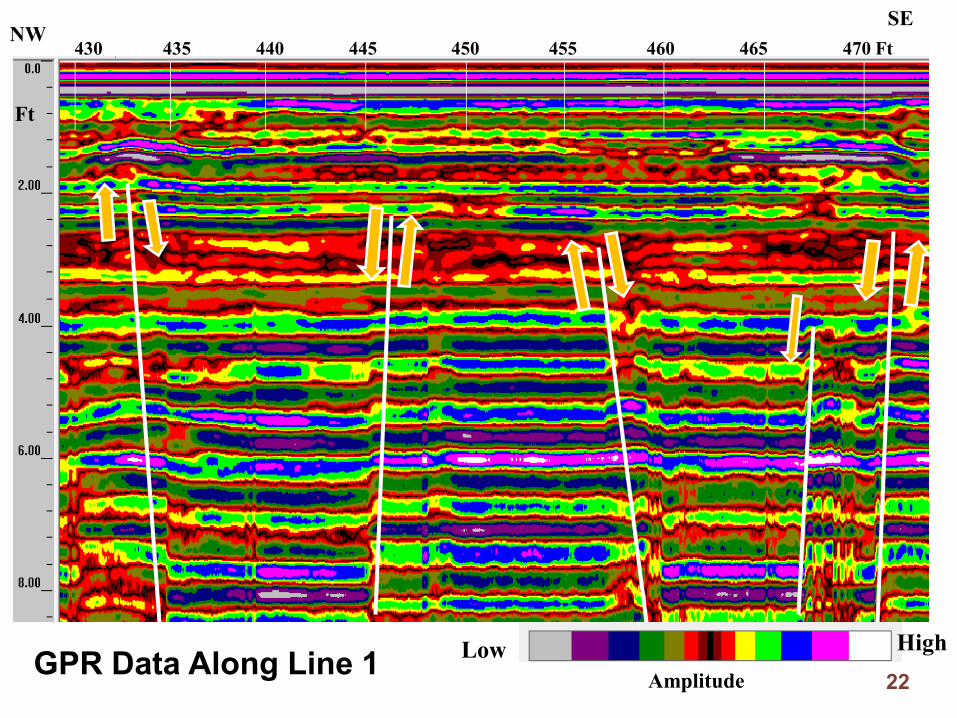
430 435 440 445 450 455 460 465 470 FtNW
SE
Ft
AmplitudeLow High
GPR Data Along Line 1 22
Union Pacific Railroad
Westbound 290
L6
L5
L4
L1
L2
L3
Eastbound 290
100 200 300 400 500 600
FS Patched Asphalt
N
L7 U D
U D
U D
U D
U DFeet
FS
Location of Hockley fault determined by resistivity surveys
23

Location of Fault Zone based on geophysics results
24

August
2010April
2010
AB
Hockley Fault
Deformation
POSTSCRIPT TO GEOPHYSICAL SURVEYS
25
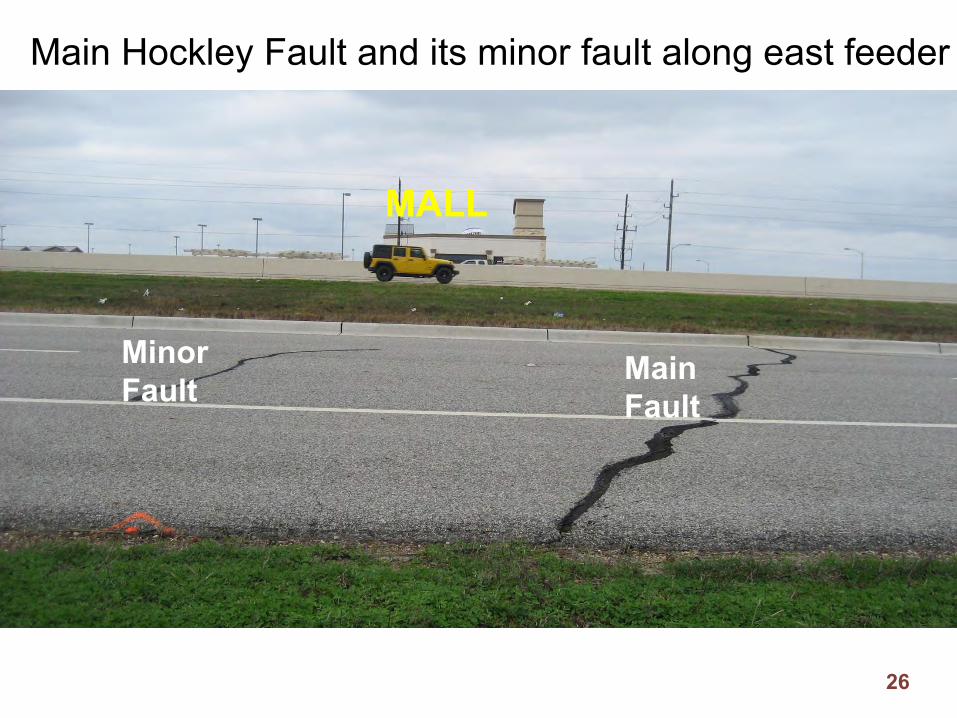
Main Hockley Fault and its minor fault along east feeder
Main Fault
Minor Fault
MALL
26

C
D
Minor faults immediately to the west of the main fault along the wet feeder
27
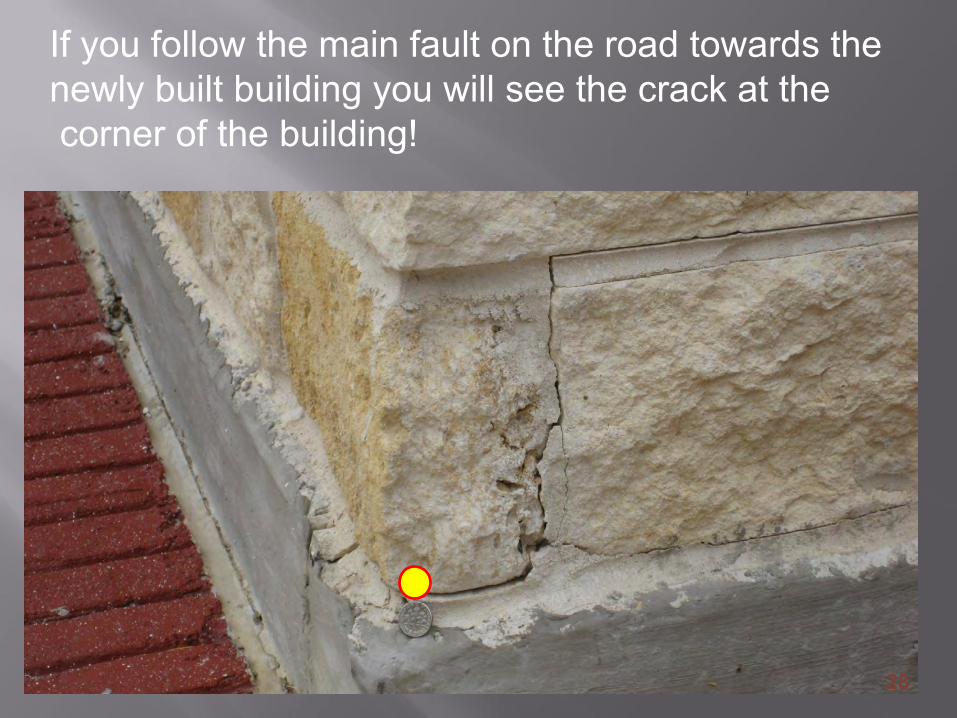
If you follow the main fault on the road towards the newly built building you will see the crack at thecorner of the building!
28

LONG POINT FAULT AT MOOREHEAD STREET
29

30
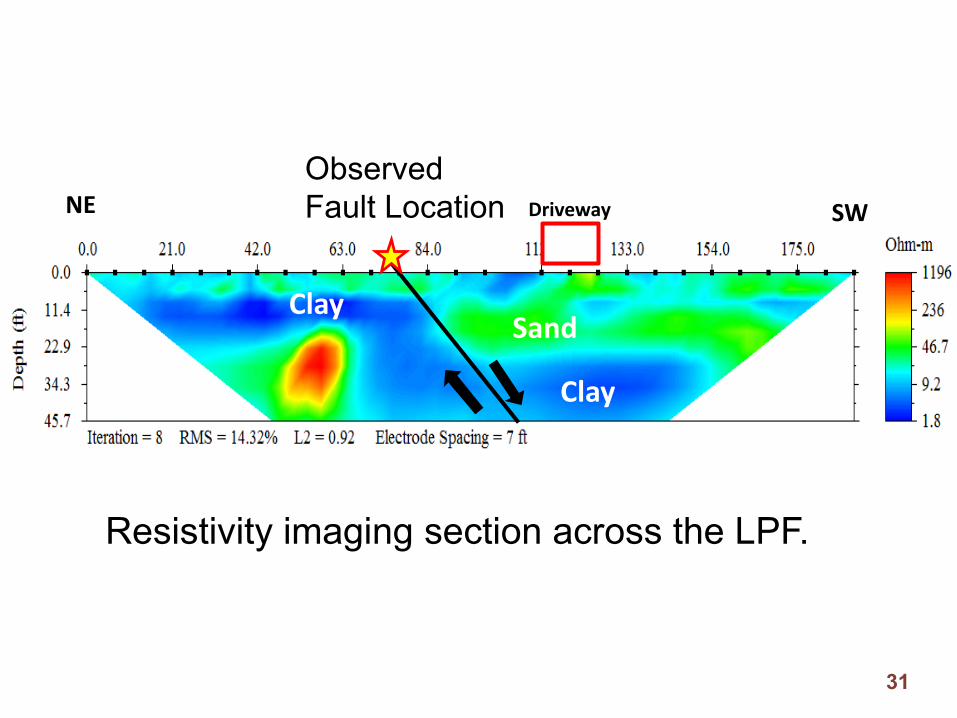
NE SW
Observed Fault Location Driveway
SandClay
Clay
Resistivity imaging section across the LPF.
31

DownUP
32
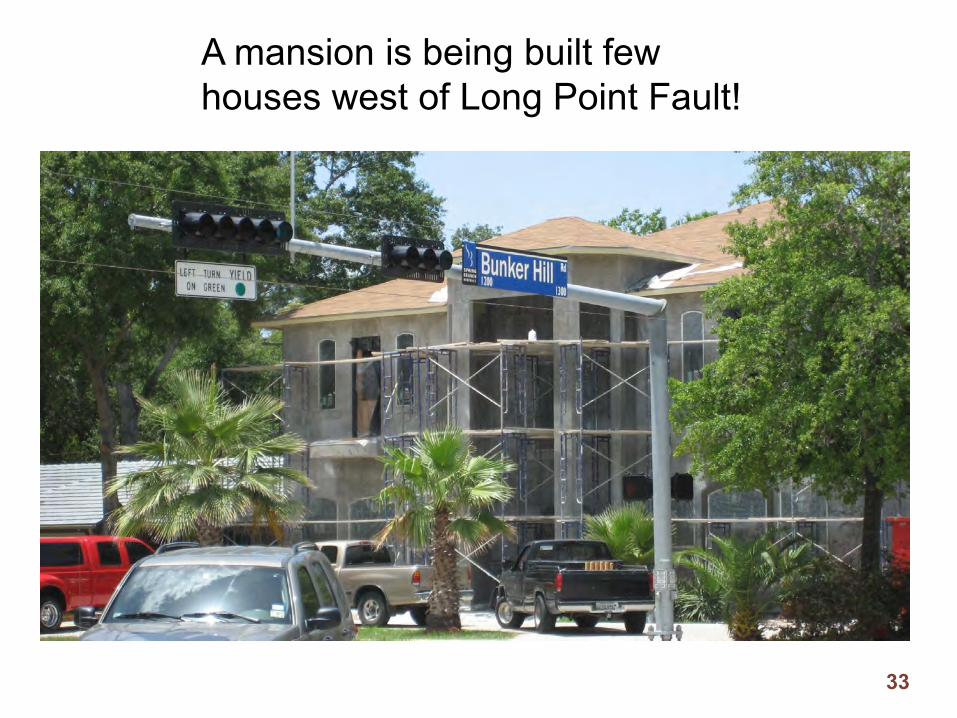
A mansion is being built few houses west of Long Point Fault!
33

Resistivity Line
Resistivity Line
HWY. 249
34

DownUP
RL
A View of Tomball Fault at Demolished Beckondorf Middle School-View to East
35
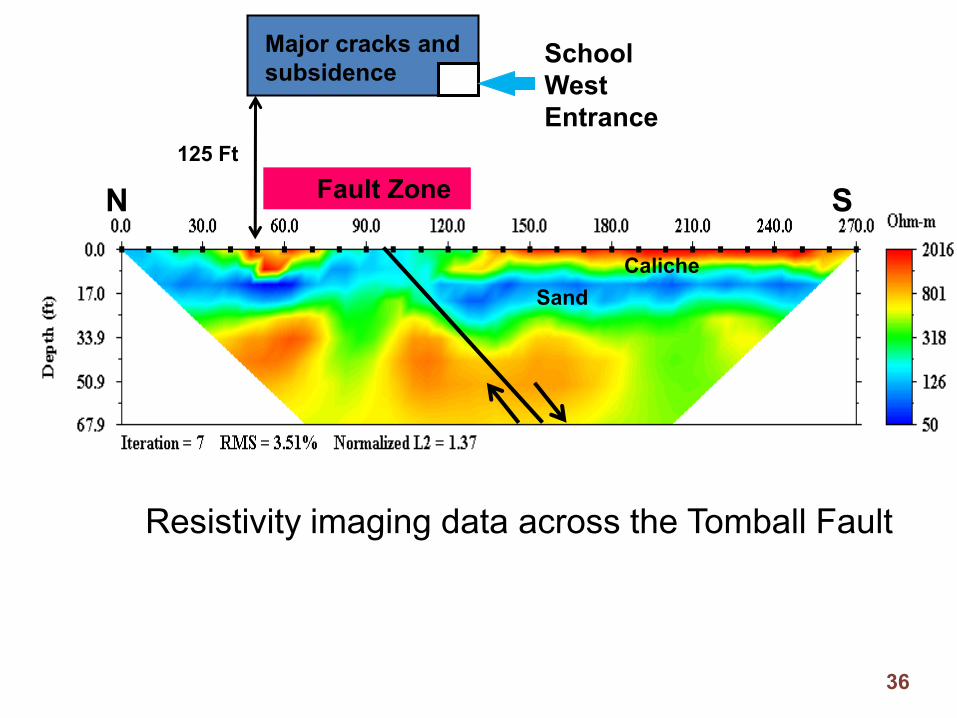
School West Entrance
N S125 Ft
Fault Zone
Major cracks and subsidence
CalicheSand
Resistivity imaging data across the Tomball Fault
36
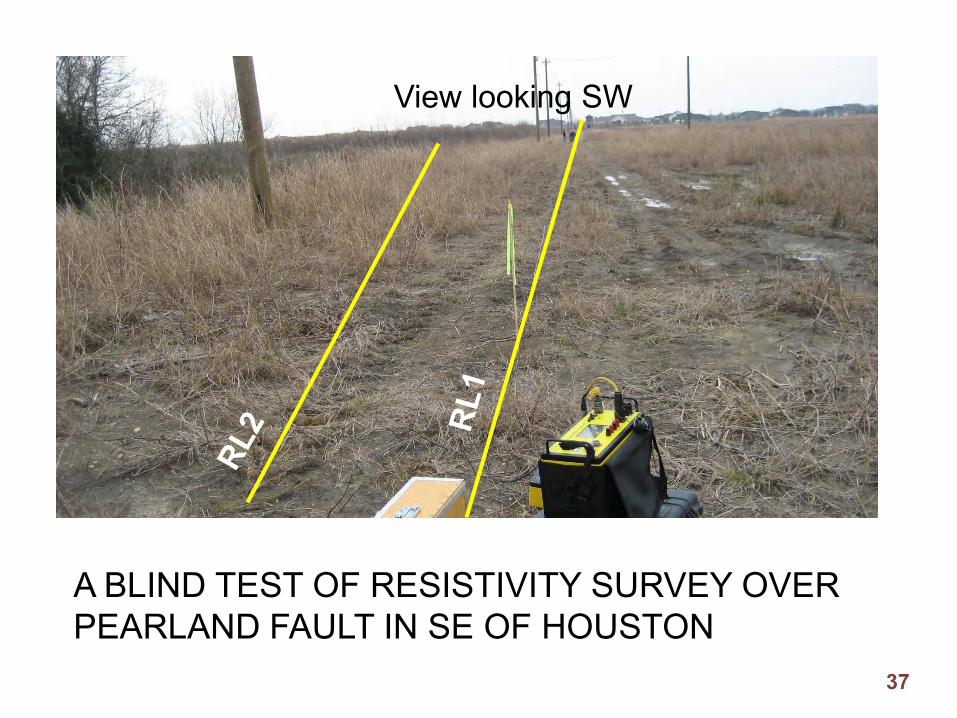
View looking SW
A BLIND TEST OF RESISTIVITY SURVEY OVER PEARLAND FAULT IN SE OF HOUSTON
37

FAULT ZONESW NE
Resistivity Line 1
Resistivity Line 2
Borehole locations
SWNE
SandClay
Clay
Sand Clay
Clay
Silty Clay
Silty Clay
10 feet spacing
Resistivity imaging data across Pearland Fault 38
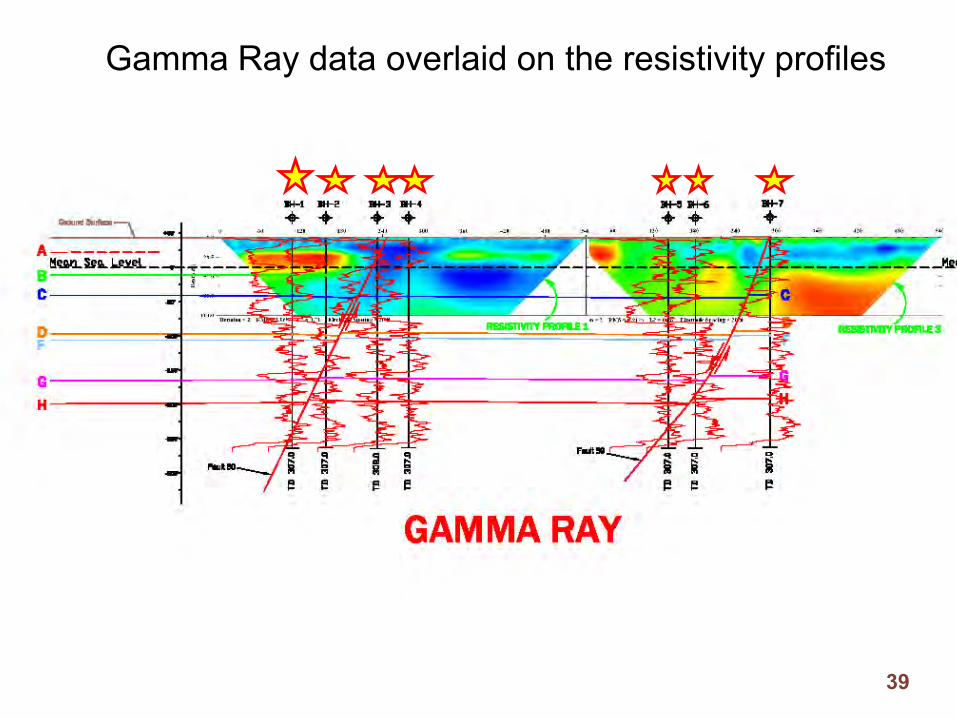
Gamma Ray data overlaid on the resistivity profiles
39
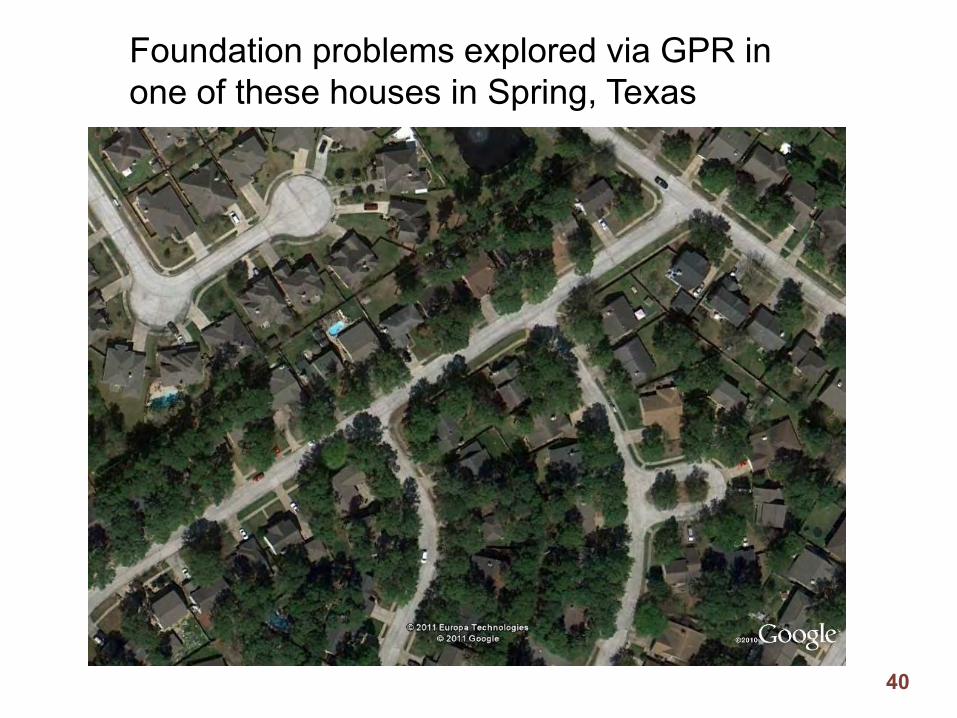
Foundation problems explored via GPR in one of these houses in Spring, Texas
40

25
10
18
1811
11
NEX-1
EX-2
EX-3
Decayed wood floor in the living room!41
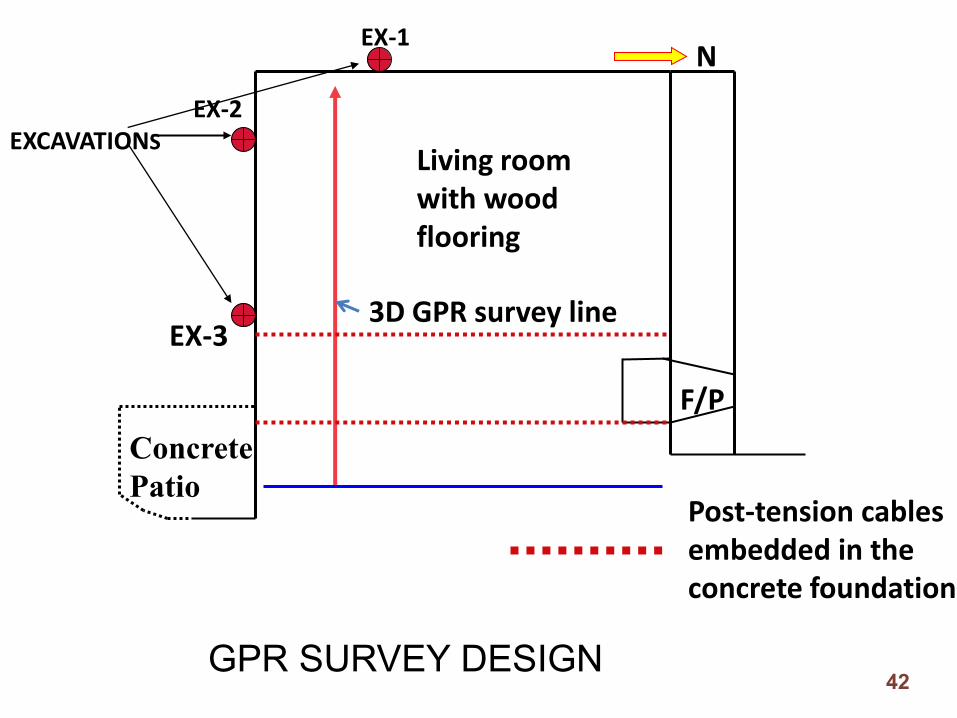
N
Concrete Patio
F/P
EXCAVATIONS
3D GPR survey line
Post-tension cables embedded in the concrete foundation
Living room with wood flooring
EX-1
EX-2
EX-3
GPR SURVEY DESIGN42
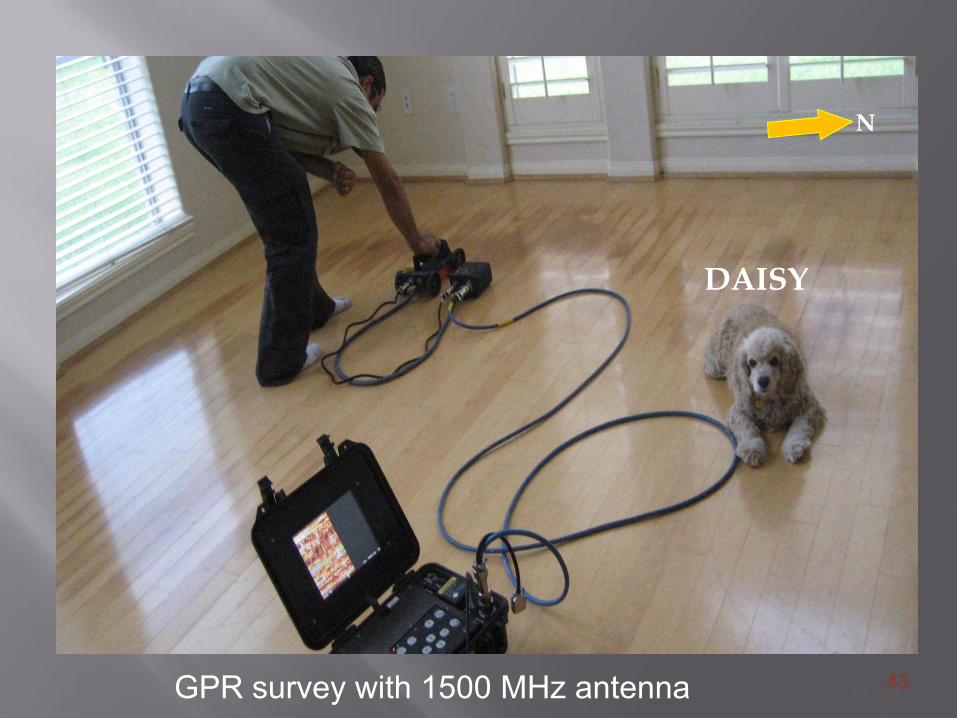
N
DAISY
GPR survey with 1500 MHz antenna 43

N
Low
High
Am
plit
ud
e Sc
ale
3D GPR DATA FROM 1500 MHz ANTENNA 44

N
GPR SURVEY CART WITH 400 MHz Antenna 45

Excavated Void
EX-2
EX-1
N
Low
High
Amplitude Scale
Figure 6
EX3
3D GPR DATA for 400 MHz Antenna: 3 ft depth slice 46

EX-1
EX-2
N
EX-3
Low
High
Amplitude Scale
3D GPR Data for antenna 400 MHz: 5 Ft depth slice 47

EX-3 Void
48

October 8, 2008 October 28, 2008
Water depth is 4 inch
Water depth is one inch
Excavated void location based on the GPR data
49
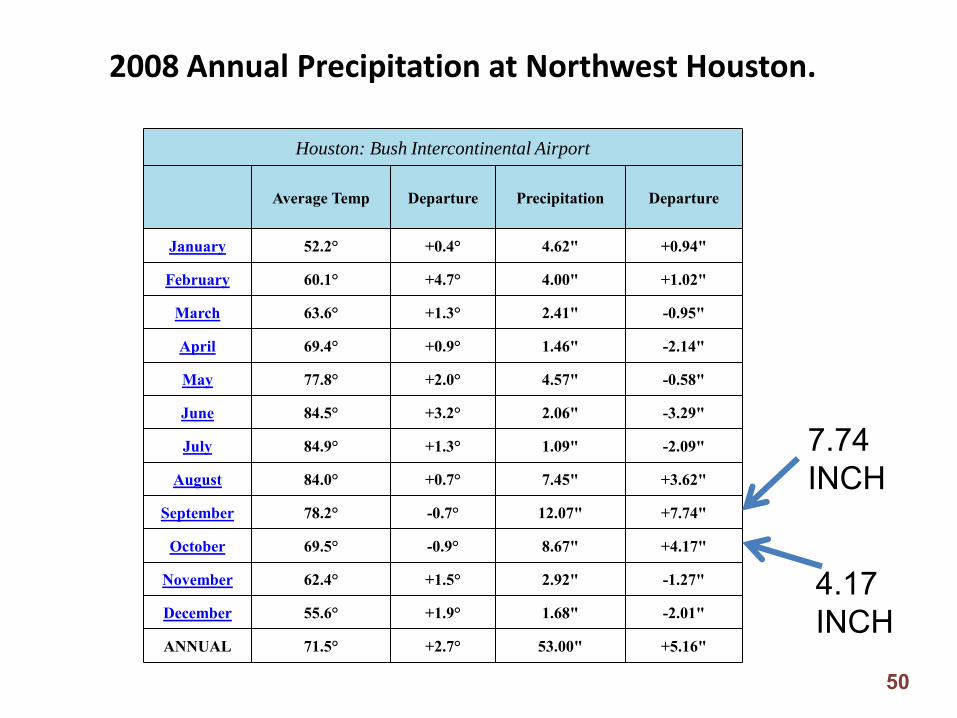
Houston: Bush Intercontinental Airport
Average Temp Departure Precipitation Departure
January 52.2° +0.4° 4.62" +0.94"
February 60.1° +4.7° 4.00" +1.02"
March 63.6° +1.3° 2.41" -0.95"
April 69.4° +0.9° 1.46" -2.14"
May 77.8° +2.0° 4.57" -0.58"
June 84.5° +3.2° 2.06" -3.29"
July 84.9° +1.3° 1.09" -2.09"
August 84.0° +0.7° 7.45" +3.62"
September 78.2° -0.7° 12.07" +7.74"
October 69.5° -0.9° 8.67" +4.17"
November 62.4° +1.5° 2.92" -1.27"
December 55.6° +1.9° 1.68" -2.01"
ANNUAL 71.5° +2.7° 53.00" +5.16"
2008 Annual Precipitation at Northwest Houston.
7.74 INCH
4.17 INCH
50

FRENCH DRAINAGE INSTALLATION
51

Foundation problems few miles away from The Alamo, San Antonio
52

GPR Unit
Foundation Case Study
View to the NE
53

BUILDING X
N
R1
R5
Air-conditioning unitR2
R3
R4STAIRS
Geophysical Profiles Around the Building
54
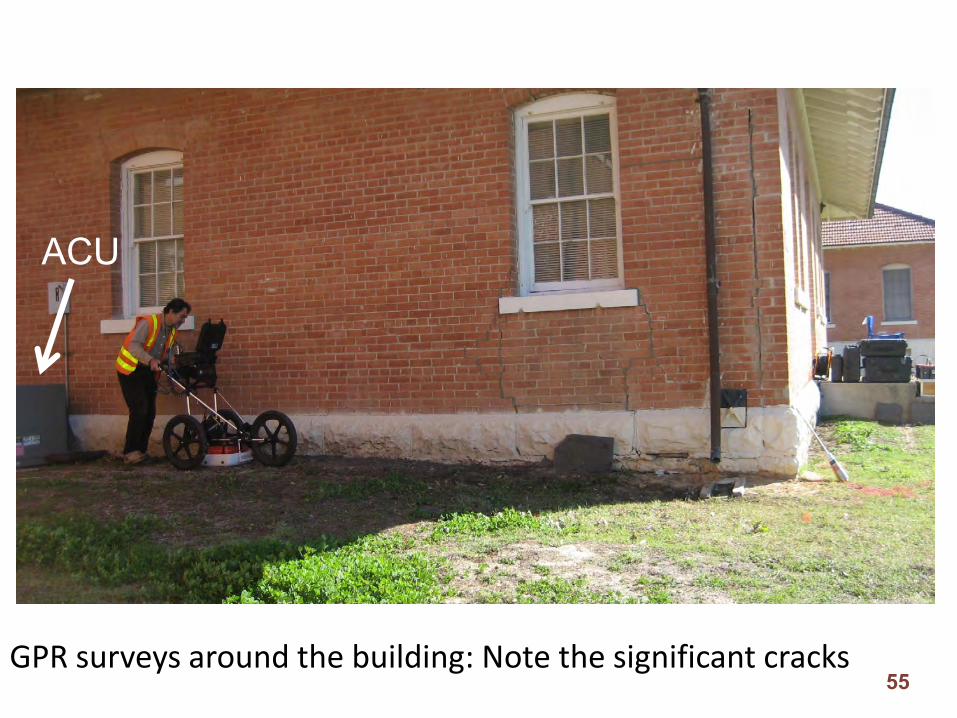
GPR surveys around the building: Note the significant cracks
ACU
55
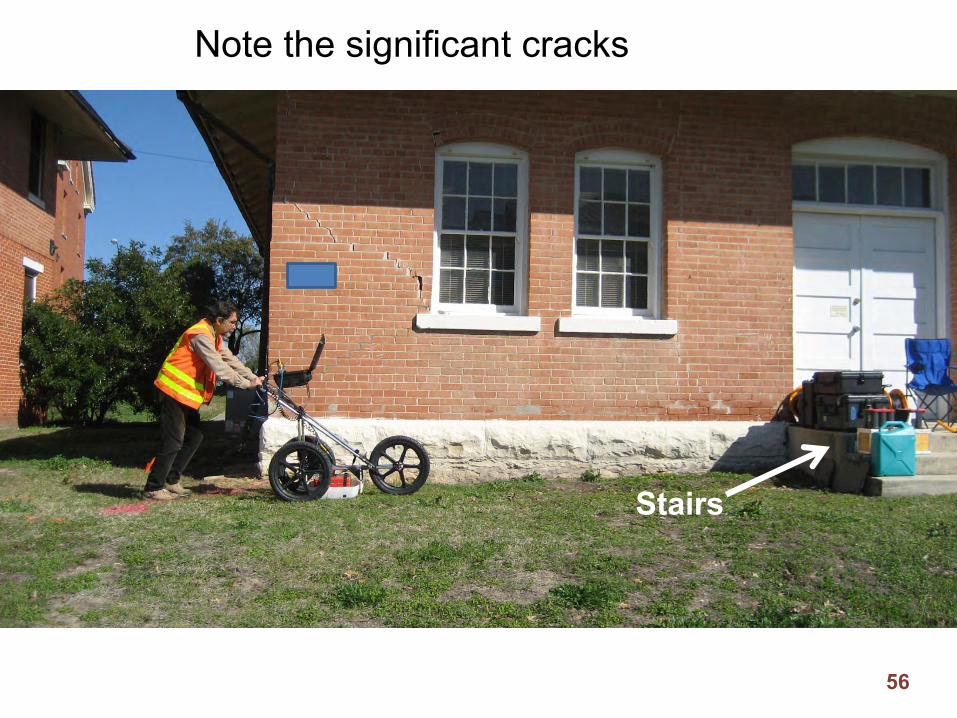
Note the significant cracks
Stairs
56
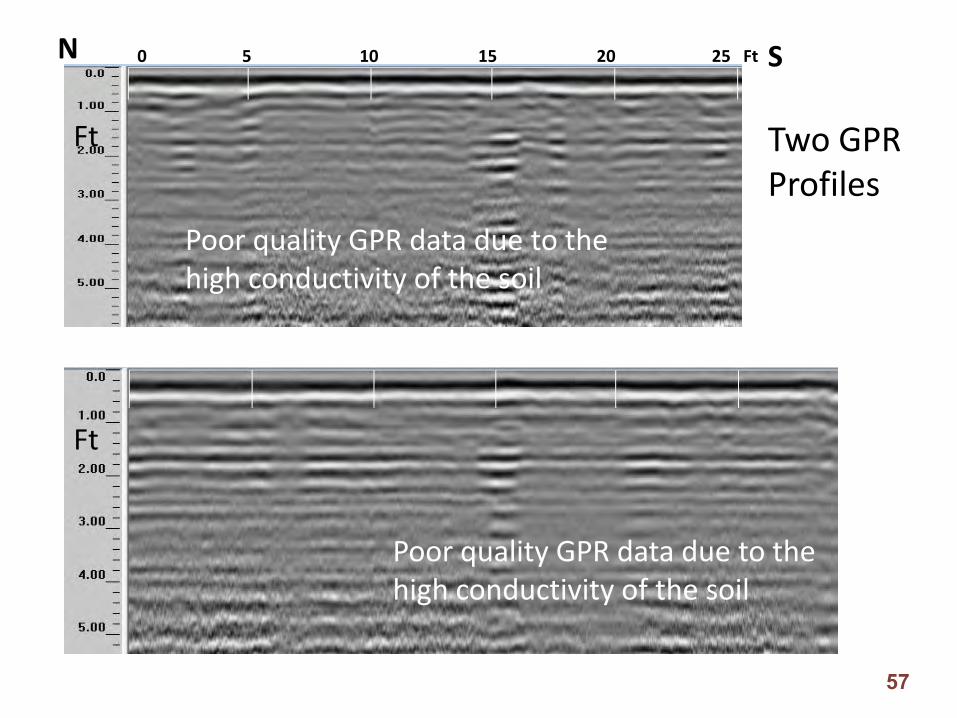
N S0 5 10 15 20 25 Ft
Poor quality GPR data due to the high conductivity of the soil
Poor quality GPR data due to the high conductivity of the soil
Ft
Ft
Two GPR Profiles
57
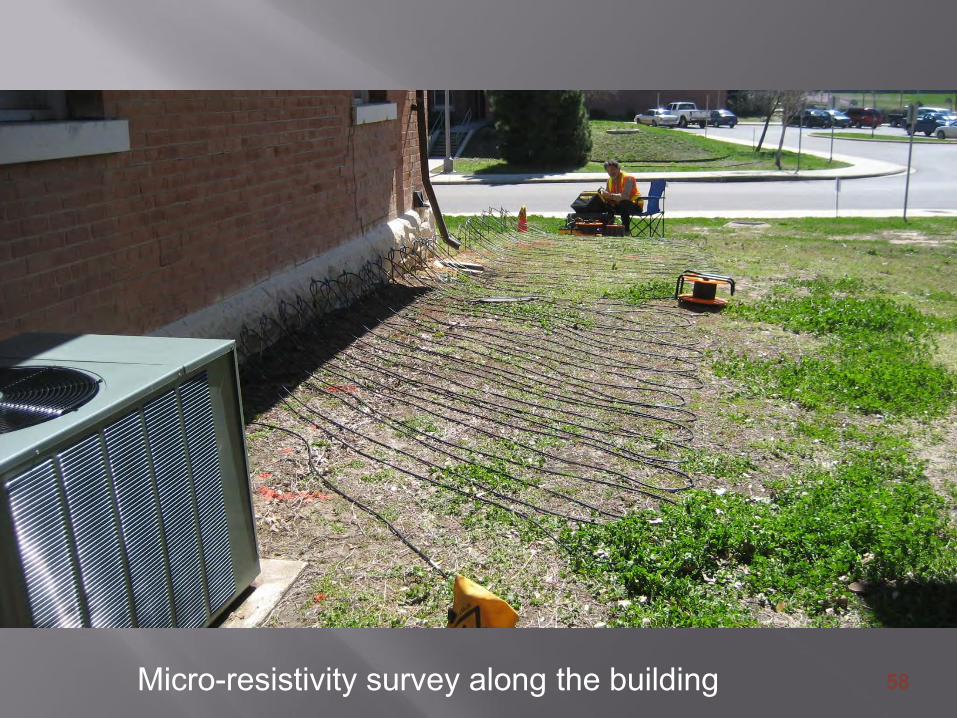
Micro-resistivity survey along the building 58
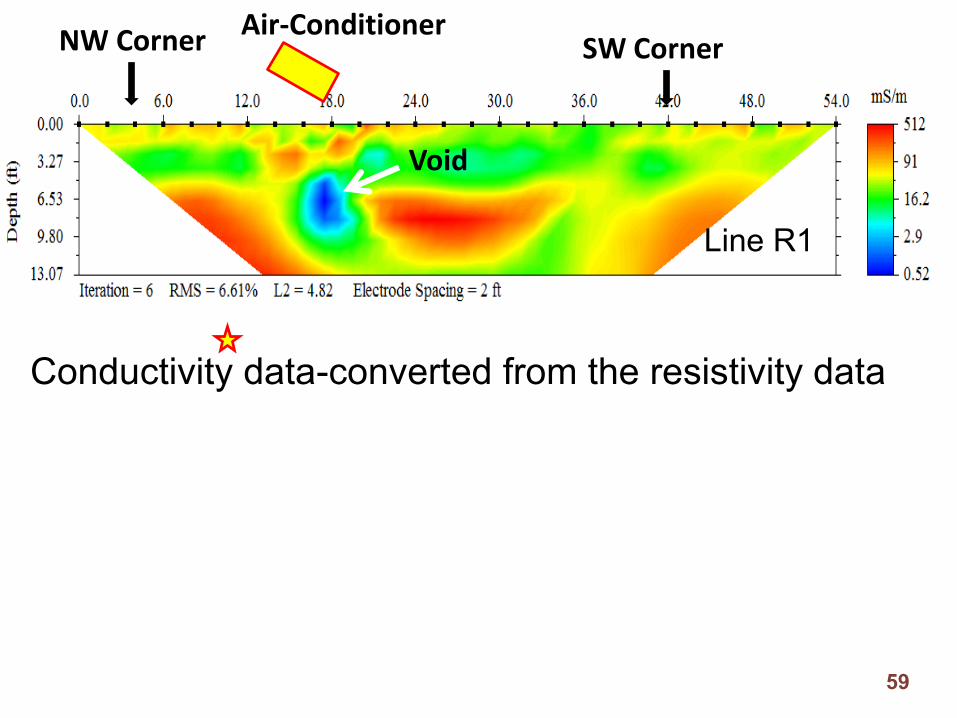
NW CornerAir-Conditioner
SW Corner
Void
Conductivity data-converted from the resistivity data
Line R1
59

Resistivity survey along Line R3 60

SW CornerNext to stairs
W E
SandClay
Clay
Subsidence
Conductivity profile along R3
61
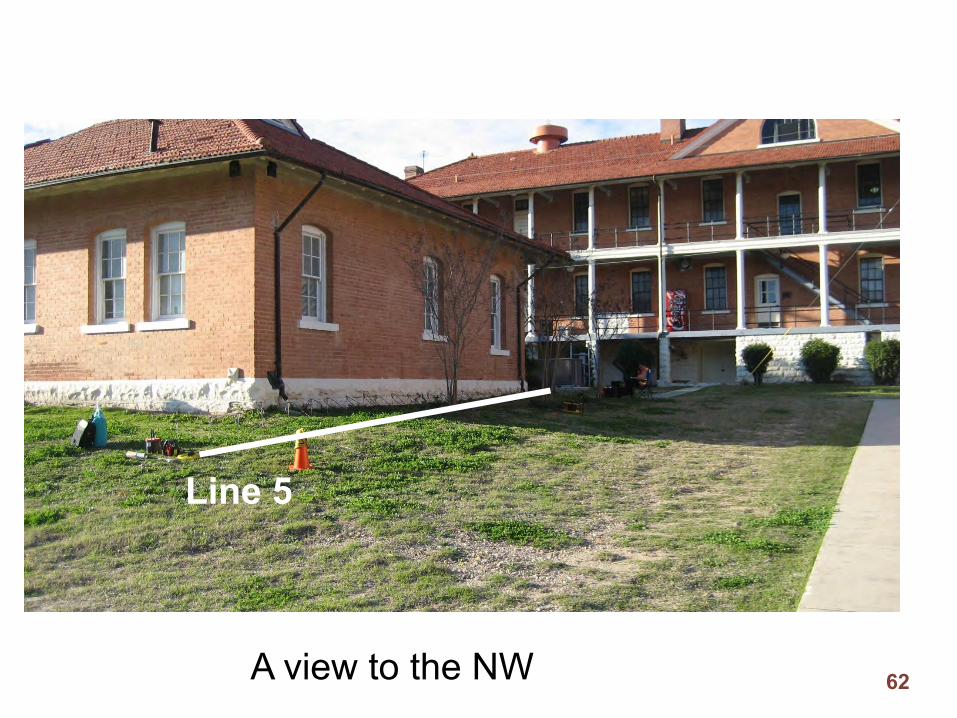
A view to the NW
Line 5
62

B-2SE Corner NE Corner
Sand
Clay
Sand
Sharp Contact-Anomaly?
Conductivity profile along R5
63
Using micro-resistivity surveys, we not only located a number of areas of granular soil where substantial amounts of moisture have accumulated. The resistivity data also indicated the presence of an abandoned sewer main under the building that was not known to be present at the time, but has been verified on old base maps.
GPR results did not yield any information.
RESULTS OF THE FOUNDATION STUDY
64

4th largest spring system in Texas
Water temperature: 68°F (22°C)
Mean discharge: 53 cfs (1,500 lps) (105 acre-feet/day)
D
UUSGS Well
Where is all the water coming from into the Barton Springs Pool?!
65

Geological Map of Barton Springs Pool
AB
DU
Parthenia Zenobia
Eliza
66
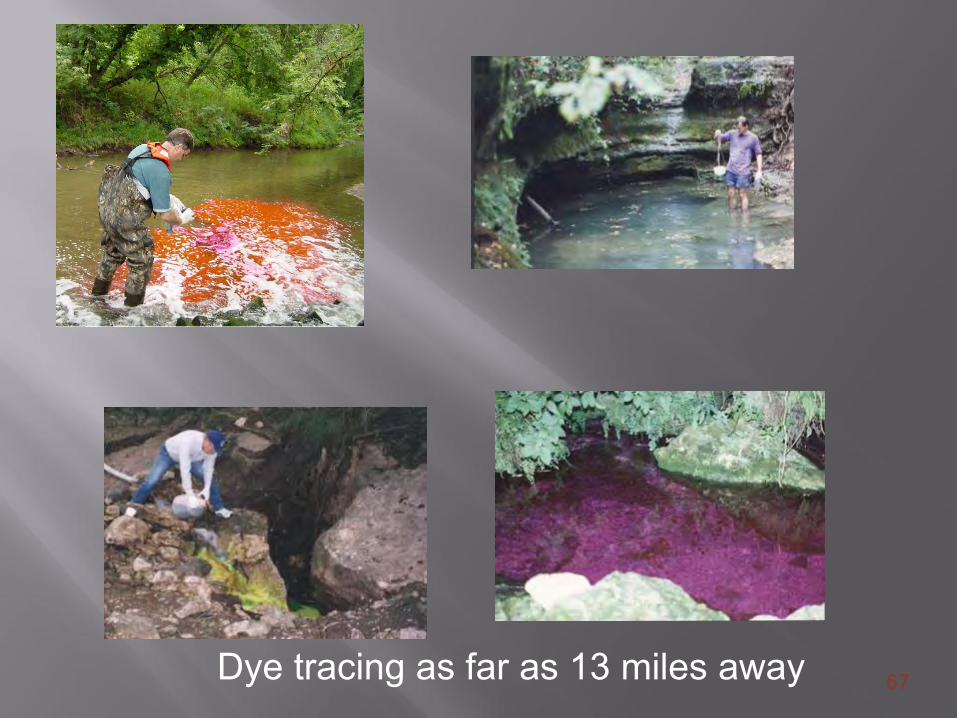
Dye tracing as far as 13 miles away 67

In the 1830s, William Barton owned the land, which included the three springs to which he gave his three daughters’ names: Parthenia, Eliza and Zenobia.
68

• Utilizes the earth’s natural-electric field at the ground surface to detect and map groundwater pathways and geologic features, such as faults, fractures, conduits, caves
• Movement of water• Target: Seepage, Voids
Natural-Potential Method (NP)
69

mV
70
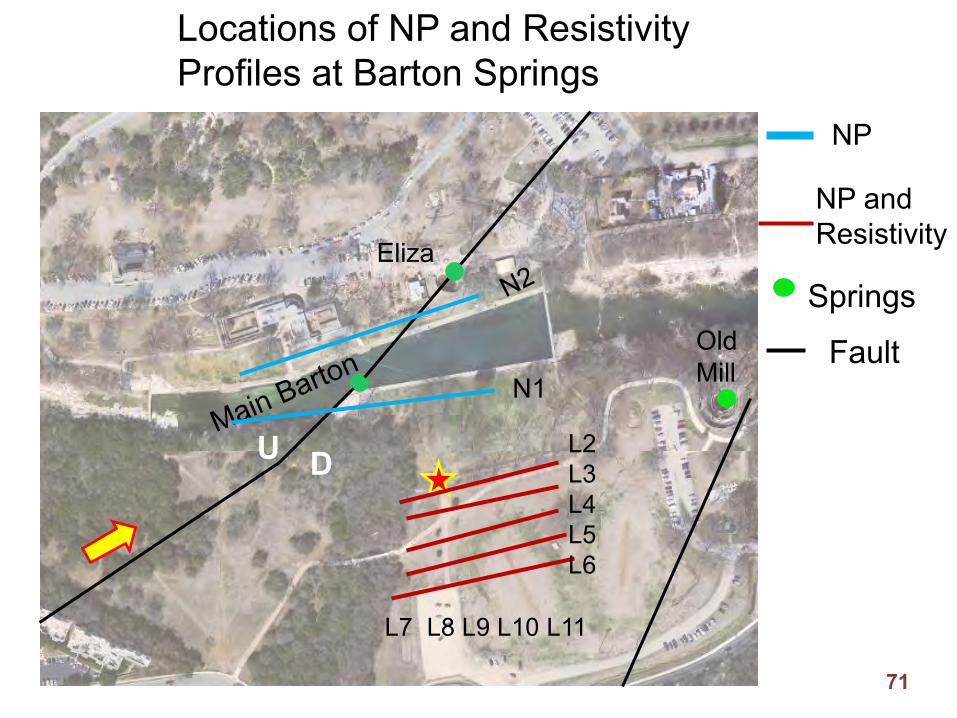
Eliza
Old Mill
Springs
Fault
NP
Locations of NP and Resistivity Profiles at Barton Springs
NP and Resistivity
N1
L2L3L4L5L6
L7 L8 L9 L10 L11
U D
71

Endangered Salamanders of Barton Springs
72

South Bank
North Bank
W E
Water main hole
mV
mV
Fault
NP Data at the Barton Springs Pool
Feet
Positive NP Anomaly
73

Eliza
Old Mill
N
N1
NP Profiles Over Aerial View of Pool
Springs
Fault
Flow-path
NP profile data
Gate to the Pool
Main Barton
74

L2L3
L4
L4L5
L6
Star Kitchen Tent
50-Ft
Pecan Trees
75

W E
Resistivity Data
South Gate Line 2-Resistivity Data
Line 2-NP Data
Feet
mV
Clay-filled Cave ?
Clay layers
NP anomaly
76
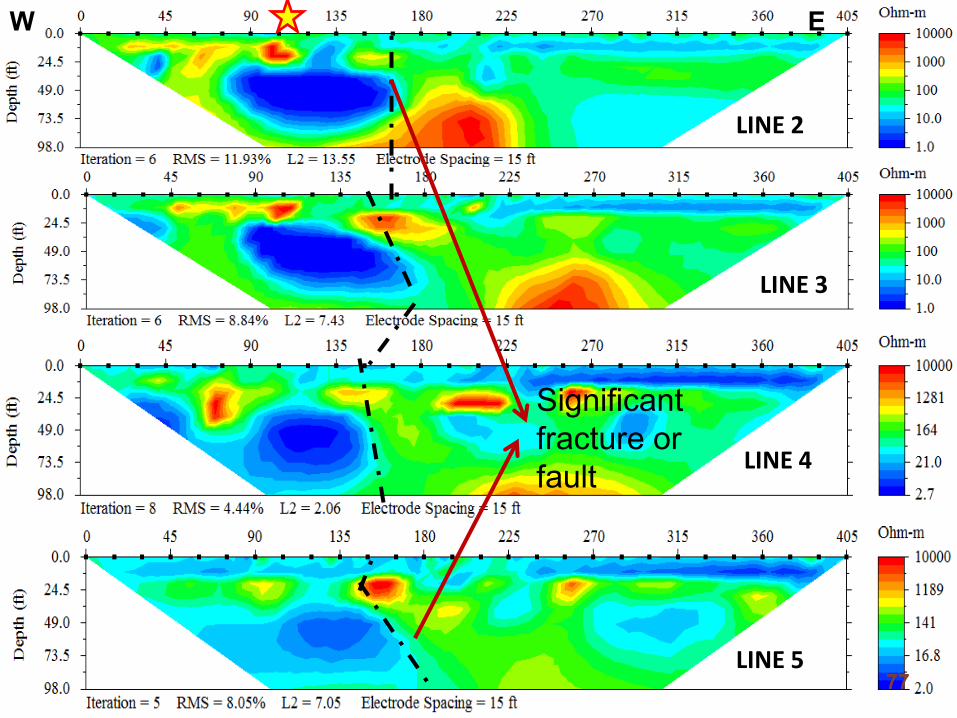
LINE 2
LINE 3
LINE 4
LINE 5
W E
Significant fracture or fault
77
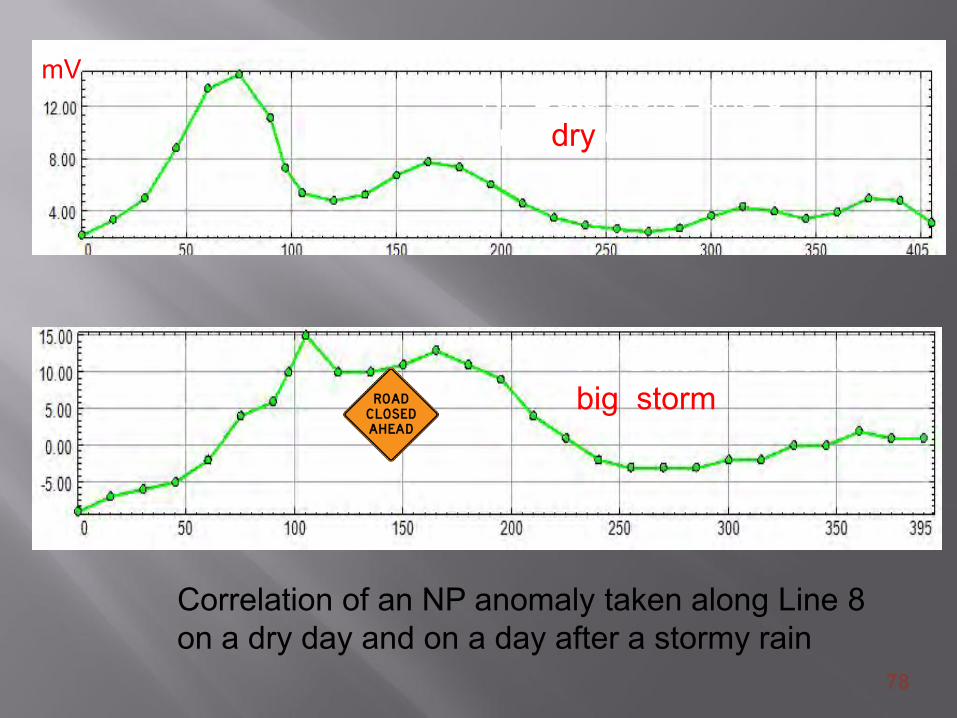
NP Data along Line 8 on a dry day
NP Data Line 8 after a big storm
Correlation of an NP anomaly taken along Line 8 on a dry day and on a day after a stormy rain
mV
78

Extra Resistivity Line
79

West EastSouth Gate
Resistivity Imaging Data
P E C A N T R E E S
80

N
South Gate
3D Resistivity Data in the E-W Direction (view from north to south)
81

Concluding Remarks
• We think we located number of conduits and caves in the Barton Springs area;
• We also think that we located a significant fracture or fault that appears to control the flow of the water into the pool.
Now, it is pool time!
82

83

FRONT YARD GEOPHYSICS IN AUSTIN
84

NP line
Resistivity line
Road patches
1
2
34
5
R1
R2
1
Fixed Sinkholes
Location of Geophysical Lines85

-1
-11-15
-13-18 -22-22
-15
-11-5
-3-5
3-5
-3
00
00
-4-6
-6-12
-16-16
-23
-12 -6-1 3
613
39102
4410
671096
1NP DataPoint
Natural Potential Survey Design
86
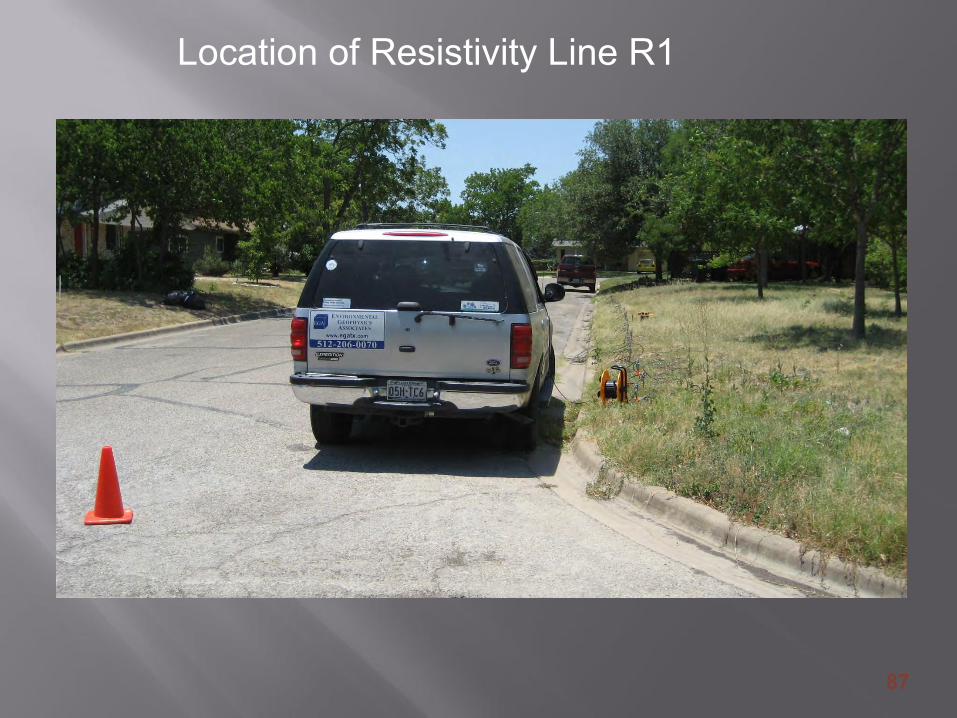
Location of Resistivity Line R1
87

RES ISTIVITY PROFILE R1
NP DATAmV
FEET
W E
Both data sets indicate no anomaly!88
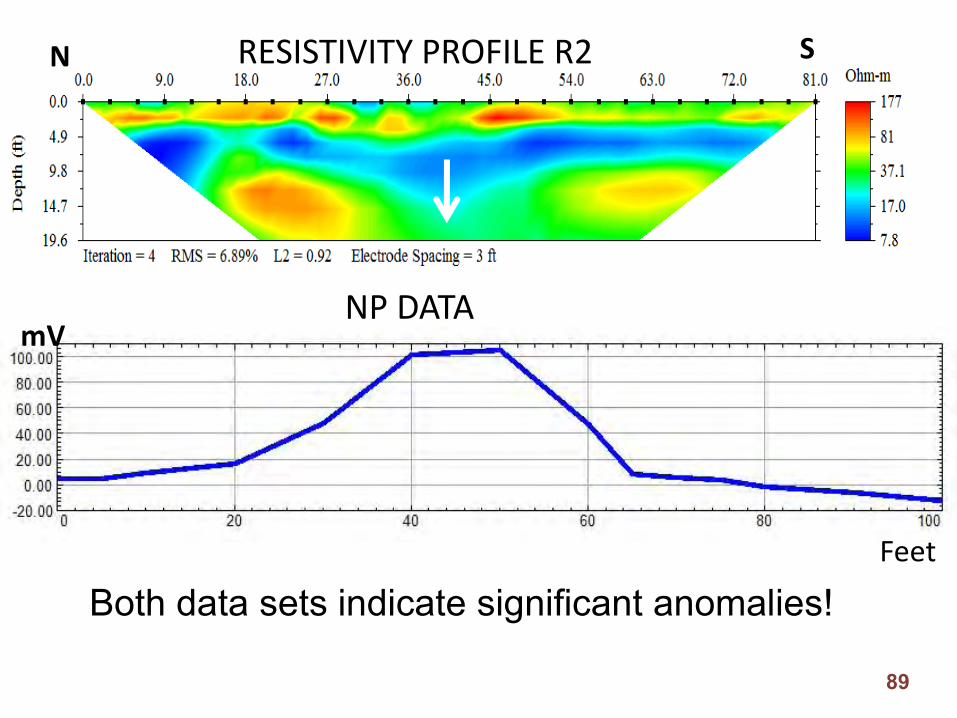
RESISTIVITY PROFILE R2
NP DATAmV
Feet
N S
Both data sets indicate significant anomalies!
89

Q: Do karstic features represent a hazard to the Austin Community?
Q: What do you think?
90

Q: Or do we represent a hazard to the KarsticCommunity?
Taken from 2010 NSS Journal with permission from Dr. George Veni
91
Final Remarks-1
A key factor conducting a successful survey is toselect the proper geophysical methods for the site conditions. There is no one geophysical tool thatcan be considered the proverbial “silver bullet” whichcan uniquely locate, delineate, and characterizeall hazards. .
EGA
92
Final Remarks-2
But clearly geophysics can play a role in advance in reducing the risk many hazards present to public safety and health.
Properly planned and executed, a geophysical survey can provide a wealth of information cost effectively that could NOT be obtained otherwise, such as drilling and/or surface sampling.
EGA
93
EGA
Let’s remember: Geophysics is just another
94