geomorphology - planetary science institute · planetary geomorphology aeolian processes are...
TRANSCRIPT

Geomorphology 101 (2008) 703–720
Contents lists available at ScienceDirect
Geomorphology
j ourna l homepage: www.e lsev ie r.com/ locate /geomorph
Transverse Aeolian Ridges (TARs) on Mars
Matt Balme a,b,⁎, Daniel C. Berman a, Mary C. Bourke a, James R. Zimbelman c
a Planetary Science Institute, 1700 E. Fort Lowell, Suite 106, Tucson, AZ 85719, USAb Department of Earth Sciences, The Open University, Walton Hall, Milton Keynes, England, MK7 6AA, United Kingdomc Center for Earth and Planetary Studies, National Air and Space Museum, Smithsonian Institution, PO Box 37012, National Air and Space Museum,MRC 315, Washington, DC 20013-7012, USA
⁎ Corresponding author. Planetary Science Institute,Tucson, AZ 85719, USA.
E-mail address: [email protected] (M. Balme).
0169-555X/$ – see front matter © 2008 Elsevier B.V. Aldoi:10.1016/j.geomorph.2008.03.011
A B S T R A C T
A R T I C L E I N F OArticle history:
Aeolian processes are prob Received 31 July 2007Received in revised form 26 March 2008Accepted 26 March 2008Available online 9 April 2008Keywords:MarsRipplesDunesAeolianPlanetary geomorphology
ably the dominant ongoing surface process on Mars; Large Dark Dunes (LDDs),particularly common aeolian landforms, were first recognized in the early 1970s. Recent, higher resolutionimages have revealed another, morphologically distinct, large population of smaller, ripple-like aeolianbedforms that have been termed “Transverse Aeolian Ridges” (TARs) as it is unknown whether they formedas large ripples or small dunes. We have begun a new study of TARs that examines their distribution,orientation, and morphology using N10,000 high-resolution Mars Orbiter Camera (1.5 to 8 m/pixelresolution) images in a 45° longitude wide, pole-to-pole survey. The aim of this study is to assess whetherTARs are active, to identify possible sediment sources and pathways, and to determine the volumes ofsediment that they comprise. We present results from the first half of this study, in which we examine thenorthern hemisphere, and describe a new three-part classification scheme used to aid the survey.Our results show that TARs are abundant but not ubiquitous: preferentially forming proximal to friable,layered terrains such as those found in Terra Meridiani — the location of the ongoing Mars Exploration Rover“Opportunity” mission. TAR distribution in the northern hemisphere shows a strong latitudinal dependencewith very few TARs being found north of ∼30° N. We also find that in most cases TARs are less mobile thanLDDs, a conclusion possibly explained by Mars Exploration Rover Opportunity observations that show TAR-like ripples to have a core of fine material armored by a monolayer of granule-sized particles. This coulddisallow significant bedform movement under the current wind regime. That TARs are essentially inactive isconfirmed by superposition relations with slope streaks and LDDs and by observations of superposed impactcraters. We suggest that observations made by the Opportunity Rover in Terra Meridiani indicate that thesmall aeolian bedforms common here are ripples and not small dunes. Farther south, these bedformstransition into larger features indistinguishable from TARs, suggesting that TARs (in the Meridiani area atleast) are ripples and not dunes.
© 2008 Elsevier B.V. All rights reserved.
1. Introduction
Mars currently has an atmosphere about two orders of magnitudethinner than the Earth's and yet hosts a range of aeolian landformssimilar to those of our own planet. Examples of dunes, ripples, dustdevils, dust storms, yardangs, and ventifacts can all be found on Marsand demonstrate coupling between the atmosphere and the surfaceover a range of temporal and spatial scales. Dunes were first identifiedonMars fromMariner 9 images (McCauley et al.,1972; Cutts and Smith,1973). Later, Mariner and Viking orbiter images revealed a series ofextensive ergs around the north pole ice cap (Cutts et al., 1976; Tsoaret al.,1979) and large dune fields in craters in the southern hemisphere(Cutts and Smith, 1973; Thomas, 1981; Lancaster and Greeley, 1987).
1700 E. Fort Lowell, Suite 106,
l rights reserved.
The defining features of both the northern and southern dunefields arethe low albedo and large size of the duneforms. Where dunes arecoalesced, crest to crest wavelengths are typically hundreds to a fewthousands of meters (Greeley et al., 1992; Fig. 1a and b).
However, as noted first from Viking images (Zimbelman, 1987) andmore recently fromMars Global Surveyor (MGS) Mars Orbiter Camera(MOC) narrow angle (NA) images (Thomas et al., 1999; Malin andEdgett, 2001), another morphologically and dimensionally distinctpopulation of aeolian bedforms exists that are generally brighter than,or of similar albedo to, the surrounding terrain (Malin and Edgett,2001; Fig. 1c and d). These features are smaller than the dark dunes,being of decameter scale and appear to form normal to local winds.They tend to have simple, transverse, ‘ripple-like’ morphologiesleading several authors (e.g., Williams et al., 2002; Zimbelman andWilson, 2002; Wilson et al., 2003) to suggest that these bedformsmight be analogous to large terrestrial ripples termed “aeolian ridges”(Bagnold,1941), ‘granule ripples’ (Sharp,1963; Fryberger et al.,1992) or‘mega-ripples’ (Greeley and Iversen, 1985). However, whether these
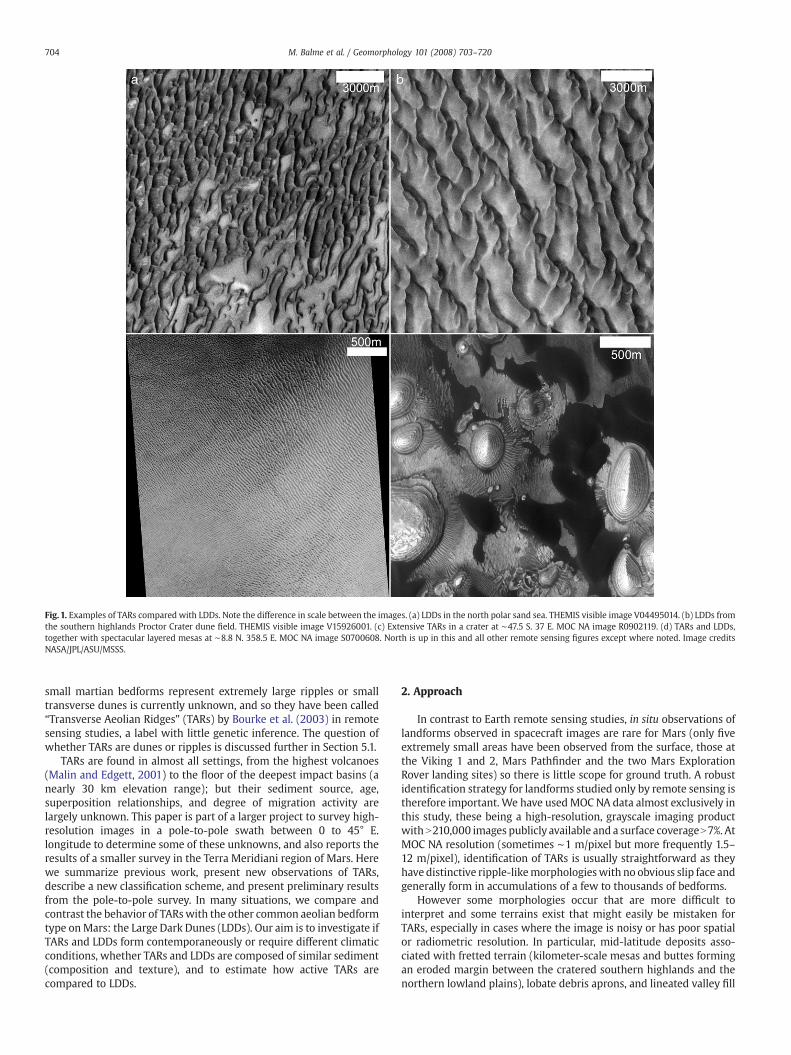
Fig. 1. Examples of TARs compared with LDDs. Note the difference in scale between the images. (a) LDDs in the north polar sand sea. THEMIS visible image V04495014. (b) LDDs fromthe southern highlands Proctor Crater dune field. THEMIS visible image V15926001. (c) Extensive TARs in a crater at ∼47.5 S. 37 E. MOC NA image R0902119. (d) TARs and LDDs,together with spectacular layered mesas at ∼8.8 N. 358.5 E. MOC NA image S0700608. North is up in this and all other remote sensing figures except where noted. Image creditsNASA/JPL/ASU/MSSS.
704 M. Balme et al. / Geomorphology 101 (2008) 703–720
small martian bedforms represent extremely large ripples or smalltransverse dunes is currently unknown, and so they have been called“Transverse Aeolian Ridges” (TARs) by Bourke et al. (2003) in remotesensing studies, a label with little genetic inference. The question ofwhether TARs are dunes or ripples is discussed further in Section 5.1.
TARs are found in almost all settings, from the highest volcanoes(Malin and Edgett, 2001) to the floor of the deepest impact basins (anearly 30 km elevation range); but their sediment source, age,superposition relationships, and degree of migration activity arelargely unknown. This paper is part of a larger project to survey high-resolution images in a pole-to-pole swath between 0 to 45° E.longitude to determine some of these unknowns, and also reports theresults of a smaller survey in the Terra Meridiani region of Mars. Herewe summarize previous work, present new observations of TARs,describe a new classification scheme, and present preliminary resultsfrom the pole-to-pole survey. In many situations, we compare andcontrast the behavior of TARswith the other common aeolian bedformtype onMars: the Large Dark Dunes (LDDs). Our aim is to investigate ifTARs and LDDs form contemporaneously or require different climaticconditions, whether TARs and LDDs are composed of similar sediment(composition and texture), and to estimate how active TARs arecompared to LDDs.
2. Approach
In contrast to Earth remote sensing studies, in situ observations oflandforms observed in spacecraft images are rare for Mars (only fiveextremely small areas have been observed from the surface, those atthe Viking 1 and 2, Mars Pathfinder and the two Mars ExplorationRover landing sites) so there is little scope for ground truth. A robustidentification strategy for landforms studied only by remote sensing istherefore important. We have usedMOC NA data almost exclusively inthis study, these being a high-resolution, grayscale imaging productwith N210,000 images publicly available and a surface coverageN7%. AtMOC NA resolution (sometimes ∼1 m/pixel but more frequently 1.5–12 m/pixel), identification of TARs is usually straightforward as theyhave distinctive ripple-likemorphologieswith no obvious slip face andgenerally form in accumulations of a few to thousands of bedforms.
However some morphologies occur that are more difficult tointerpret and some terrains exist that might easily be mistaken forTARs, especially in cases where the image is noisy or has poor spatialor radiometric resolution. In particular, mid-latitude deposits asso-ciated with fretted terrain (kilometer-scale mesas and buttes formingan eroded margin between the cratered southern highlands and thenorthern lowland plains), lobate debris aprons, and lineated valley fill

705M. Balme et al. / Geomorphology 101 (2008) 703–720
materials, thought to be of glacial origin (Mangold, 2003; Pierce andCrown, 2003), are often similar in appearance to TARs (Fig. 2a).Morphological observations that suggest these features are not TARsinclude the lack of a defined crest ridge, superposition and alterationof pre-existing topography, and burial or exhumation from under asmoother layer (although this does not preclude them being relictaeolian bedforms). In addition, examining MOC wide angle (WA)images for context often reveals that these terrains are associated withdebris aprons around mesas, at the bases of scarps, or within valleys;and they frequently have orientation trends normal to the local slope.Taken together with the morphological observations, these associa-tions suggest that they are not aeolian landforms. Other morphologiesthat are difficult to discern from TARs include network ridge patterns(Fig. 2b) found in certain debris aprons and morphologically similar tothe “sharp ridge” textures described by Pierce and Crown (2003),polygonal terrains similar to networked TARs (Fig. 2c), and lineatedterrain (Fig. 2d) found occasionally in the north and south mid to highpolar regions. These examples might represent the products ofweathered or eroded aeolian bedforms, periglacial processes, orexhumed terrains (e.g., Mangold, 2005).
For the pole-to-pole survey, we first generated a list of MOC NAimages within the study area from the NASA PDS website (http://pds-imaging.jpl.nasa.gov/Missions/MGS_mission.html). The list includes
Fig. 2. Examples of morphologies that might be confused with TARs. (a) Fretted debris apronapron at ∼43.8 N. 35.6 E. MOC NA image M0706084. (c) North polar polygonal terrain. MOCcredits NASA/JPL/MSSS.
all images up to the January 2006 data release. Corrupt, noisy, or lowresolution images (poorer than 10m/pixel) were excluded. Each imagewas searched for TARs at full resolution, erring on the side of cautionto exclude examples withmorphologies/associations described above.The percentile areal coverage of TARs was recorded for each imagestudied as well as a classification of TARs (see Section 3.2 below),associations with other landforms, and general observations. Finally,those images with N5% TAR coverage were reprocessed and map-projected using USGS ISIS software and imported into GeographicalInformation Systems software for analysis.
3. Remote sensing observations of TARs
3.1. Physical description
TARs typically form in small fields of tens to thousands ofindividual bedforms and are characterized by their small size, narrowtransverse dimensions, and elongate and generally simple form. Slipfaces are typically not resolvable in MOC NA images, and lee and stossslopes appear to be approximately symmetric (Malin and Edgett,2001; Bourke et al., 2006).
TARs can be described by three principal morphometric para-meters: the crest-ridge width W, the “down wind” TAR length L, and
at ∼45.9 N. 44.8 E. MOC NA image M0802614. (b) Sharp ridge terrain in fretted debrisNA image E2000607. (d) North polar lineated terrain. MOC NA image E2300658. Image

Fig. 3. Example of morphometric parameters used to describe TARs. The mean profile λis given by the average of λ1–4 MOC NA image E2100624. Image credit NASA/JPL/MSSS.
706 M. Balme et al. / Geomorphology 101 (2008) 703–720
the ridge-to-ridge spacing λ (where λ is the mean spacing calculatedas shown in shown in Fig. 3). In addition, from these basicmeasurements we define plan view aspect ratio a, where a=W / L,and inter-bedform spacing s, where s=λ / L. Wilson and Zimbelman(2004) measured physical dimensions of N340 TARs from 172MOC NAimages and found a mean wavelength of ∼40 m, with a typical rangeof 10–60 m. The mean crest length was 215 m, with a standarddeviation of 155 m. Wilson and Zimbelman (2004) found nounambiguous correlation between wavelength and crest length, butBourke et al. (2003) did find that TARs seem to bemore closely-spacedin the narrowest parts of troughs and valleys. TARs generally have highplan view aspect ratios, typically N6 and sometimes up to 15 (Thomaset al., 1999), although many examples of bedforms with low plan viewaspect ratio exist that we also classify as TARs (Fig. 4). Plan view aspectratio and inter-bedform spacing can be easily estimated in qualitativeterms. For example, closely-spaced TARs with s=1 or b2 are easilydistinguished from widely spaced TARs with sN∼5 (Fig. 5). In generalwe refer to deposits of TARs with s=1 as “saturated”, sb2 as being“closely-spaced”, and those with higher s values as being “discontin-uous” or “widely spaced”.
Fig. 4. Blunt TARs in north Sinus Meridiani with lower crest-ridge width to bedformlength ratios than are found in the majority of TARs. Many of these TARs have plan viewaspect ratios of only 2 or 3. MOC NA image R1201434. Image credit NASA/JPL/MSSS.
Ridge heights are difficult to obtain because of the lack of in situ,high-resolution stereo or reliable photoclinometry data, although thissituation is improving with new images from missions such as Mars
Fig. 5. Examples of variation in TAR inter-bedform spacing. (a) Saturated TARs with s∼1at ∼0.1 N., 37.8 E. MOC NA image R0400111. (b) TARs with a medium inter-bedformspacing (s is ∼2 to 3 for most of these TARs) at ∼24 N., 34.3 E. MOC NA imageM0705509(c) unsaturated or widely spaced TARs (sN5 for most of these TARs) at ∼19.5 N., 35.3 E.MOC NA image M0900169. Image credit NASA/JPL/MSSS.

707M. Balme et al. / Geomorphology 101 (2008) 703–720
Reconnaissance Orbiter (MRO), currently in Mars orbit. Some estimateshave beenmade usingmethods such as low sun-anglemeasurements ofshadow length (TAR height b1.5 m; Zimbelman, 2000); stereo imagingfrom overlapping MOC NA images (TAR height ∼5.7 m; Williams et al.,2003); photoclinometry, slip facemeasurements, and stereography (TARheights 1–7.8 m; Bourke et al., 2006), and extrapolation from terrestrialexamples, (TAR heights 1–3m for a 40mwavelength TAR;Wilson et al.,2003). Few data exist that allow systematic comparisons of ripple index(height/wavelength) for TARs on Mars with the value of ∼1/15 given bySharp (1963) for ripples on Earth, although Zimbelman and Williams(2007) have begun the process using photometric methods and newMRO High Resolution Imaging Science Experiment (HiRISE) data. Theyobtained a transverse height profile of a TAR and compared this withsimilar data for terrestrial granule ripples and transverse dunes, findingthat the TAR was most similar in profile shape to the terrestrial granuleripple but much taller with respect to its wavelength (Fig. 6). The TARwas dissimilar in profile shape to the transverse dunes they studied andalso had a much higher height/wavelength ratio; transverse dunes onEarth in general have lower height/wavelength ratios (1/20 to 1/30;Lancaster, 1995) than ripples or granule ripples.
Fig. 6. Profiles across a large granule ripple in the Great Sand Dunes National Park andPreserve (a) and a TAR on Mars (b). The wind is from the right in (a) and is unknown in(b). The ripple index is ∼1/15 for the granule ripple and 1/8 for the TAR. AfterZimbelman et al. (2007).
3.2. Classification of TAR deposits
TARs have been classified previously by Bourke et al. (2003) andWilson and Zimbelman (2004). Bourke et al. used plan view shape ofthe bedform crest ridges as the basis of their classification scheme butlimited their study to TARs within troughs. Wilson and Zimbelmanbased their classification scheme on a combination of shape, associa-tions, and level of topographic control of the TARs in a deposit. Buildingon the classifications of these authors and our own preliminary globalstudy of several hundred MOC NA images, we present a new three-level scheme that describes TARdeposits in terms of themorphologyofthe crest ridges, the degree of topographic control of the deposit, andthe total size (or number of bedforms) of the deposit.
The aim of the classification scheme is to assist geographic analysisof TAR distribution and evolution. Using the three-part scheme, wecan identify spatial variations in types of TARs, find areas whereregional, rather than local, wind regimes shape TARs, and identifythose areas with the largest TAR deposits.
3.2.1. Crest-ridge morphologyIn this study, we have noted five first-order crest-ridge plan view
morphologies: “simple”, “sinuous”, “forked”, “networked”, and“barchan-like”. Examples of these classifications are shown in Fig. 7.Unlike Bourke et al. (2003), ‘feathered TARs’ are not considered to be afirst-order classification here, but instead this morphology issuggested to represent secondary crests superposed upon the primarybedforms, as discussed in Section 3.6. Sometimes these fivemorphologies can exist within the same TAR deposit: we discuss inSection 3.6 whether these morphologies represent evolutionarystages, are tied to sediment supply, or are a function of wind regime.
3.2.2. Degree of topographic controlThe orientation of TARs can indicate whether local topography or
regional meteorology controls the evolution of the TAR accumulation.In contrast to the Earth where we can study aeolian deposits in situ, onMars we must rely on secondary evidence to provide clues as towhether they are active or inactive, or if the deposit represents adepositional or transportational environment. We have thereforedeveloped a classification scheme for the degree of topographiccontrol of TARs. The scheme considers the situation of the TARs withrespect to local topographic obstructions, whether positive ornegative relief, and their effect on the ridge-crest orientations of theTARs. We have identified four topographic environments: (i) “Con-fined”: the TAR deposit is located within a closed topographic basin ordepression. Crest-ridge orientations and spacing are commonlycontrolled by the boundaries of the depression, reflecting deflectionand modulation of the regional wind by local topography. Whereadjacent TAR deposits exist, crest-ridge orientations can therefore bedissimilar. Impact craters are common environments for confinedTARs (Fig. 8a). (ii) “Controlled”: the TARs are located within adepression or valley or adjacent to a local topographic high. Animportant difference from the confined class is that the depression isopen. Again, the orientation and spacing of the TARs are dominated bythe boundary conditions and reflect local-scale deflections of wind bytopography. Common environments for controlled TARs include thefloors of valleys and troughs and adjacent to the bases of scarps andcliffs (Fig. 8b). (iii) “Influenced”: the overall distribution of the TARs isnot dominated by the terrain, although on a small scale theorientations of individual TARs are clearly influenced by topography.Examples include TARs deflected by small mesas or hills and TARsthat formed over and around small impact craters (Fig. 8c).(iv) “Independent”: the orientation of TARs is consistent over a largearea and not influenced by local topography. Such environmentsinclude very flat or gently sloping topography, regions wheretopographic variations are very minor, or any area where regionalwind regime dominated the effects of local topography (Fig. 8d).

Fig. 7. Examples of each of the five TAR crest-ridge morphologies. (a) Simple, at ∼21.3 N., 39.3 E. MOC NA imageM1104208. (b) Forked, at ∼20.7 N., 41.3 E. MOC NA image M0303703.(c) Sinuous, at ∼45.5 S., 28.7 E. MOC NA image R0802177. (d) Barchan-like, at ∼0.2 N., 0.1 E. MOC NA image M1800277. (e) Networked, at ∼0.1 S., 5.3 E. MOC NA image R2300801.Image credits NASA/JPL/MSSS.
708 M. Balme et al. / Geomorphology 101 (2008) 703–720
3.2.3. Size of TAR accumulationA spatially continuous TAR deposit can bemany square kilometers in
extent and comprise hundreds or thousands of bedforms or can consistof only a few individual TARs and cover an area less than a few 100 m2.
Being able to describe a TARdeposit in simple terms to give an indicationof the volumes of sediment involved and/or the spatial extent of thedeposit is therefore useful. Several challenges to developing aclassification of TAR deposits by size exist: (i) TARswithin large deposits

Fig. 8. Classification of TAR deposits by topographic influence. (a) Confined, at ∼0.4 N., 5.4 E. MOC NA image S0100833. (b) Controlled, at ∼25.9 N., 10.4 E. MOC NA image E1601902.(c) Influenced, at ∼23.2 N., 7.2 E. MOC NA image M1200437. (d) Independent, at ∼42.7 N., 43.9 E. MOC NA image M1003676. Image credits NASA/JPL/MSSS.
709M. Balme et al. / Geomorphology 101 (2008) 703–720
appear to show the same range ofmorphologies as those in smaller sets,therefore any classification by deposit size is not linked with bedformtype and must be arbitrary; (ii) individual TARs within a continuousdeposit can be close together (saturated; s∼1) or can be widely spaced(sN5), thus deposits with the same number of similar bedforms cancover very different areas and deposits of similar area can have largedifferences in volume of sediment. A scheme that classifies deposit sizeby area might be useful for one purpose, but a scheme that classifiesby number of bedforms might be more sensible for another; and(iii) remote sensing studies of Mars dominate our knowledge of TARs,thus smaller features beyond the resolution limits of the data might bemissed in classifications. In terrestrial studies, initial classificationsweredeveloped from fieldwork rather than remote sensing.
For smaller TAR accumulationswe have followed the line ofWilsonand Zimbelman (2004) and refer to deposits of the order of tens ofTARs as “TAR patches”. For larger deposits, of the order of hundreds ofTARs, we use the term “TAR fields”. Larger deposits with thousands ormore TARs or areas N∼50 km2 we refer to as “TAR seas”.
3.3. Composition and particle size
TARs and LDDs have distinct size andmorphological characteristicsthat suggest there is an intrinsic difference in their formation process,in thematerials of which they are composed, or perhaps in their age or
stage of development. A number of lines of evidence suggest that TARsare made up of different types of sediments to LDDs, but whether thedifference is compositional (i.e., different minerals) or physical (e.g.,agglomerates versus solid grains) is unknown. For example, TARs aretypically brighter than the surrounding terrain, especially where theyoverlie the large dunes (Malin and Edgett, 2001); and the albedo ofbright TARs has been measured as N0.21, about twice that of the darkdunes (Edgett and Christensen, 1991, 1994; Edgett, 1997; Edgett andParker, 1998). Some TARs, however, are similar in albedo or darkerthan surrounding terrains. Edgett (1997) suggested that the albedo ofduneforms might serve as an indicator of whether they were active:‘bright’ being thought to indicate ‘dust covered’ and hence inactive.MOC images argue against this, as there are some clear examples ofbright TARs overlying dark dunes as well as dark TARs overlyingbrighter bedrock (although in MOC images only relative albedo can bereliably determined). Edgett and Parker (1998), Malin et al. (1998), andEdgett and Malin (2000) suggested instead that compositionaldifference could explain the albedo contrasts. LDDs in most regionson Mars show a mafic composition (Edgett et al., 1992), with theexception of one large erg near the north pole that shows a stronggypsum component (Langevin et al., 2005). The composition of TARshas been more difficult to measure both because spectrometryinstruments have not had sufficient spatial resolution to imageindividual TARs and because TAR deposits are generally smaller than

Fig. 9. Example of thermophysical properties of TARs. The main image, THEMIS night-time thermal infrared image I00967002, shows part of the Proctor Crater dunefield(approximately centered at 47.7 S 30.5 E). Red and yellow colors represent warm surfacetemperatures; pink and blue colors represent cooler surface temperatures. The whitebox shows the footprint of MOC NA image M1001334. In the MOC image, continuousTAR deposits were mapped and are shown by the yellow outlines in the MOC close-ups.When these mapped regions are matched to the THEMIS infrared image (pale blueoutlines) they correspond to the coolest regions whereas the LDDs correspond to thewarmest regions. This indicates that the TARs cool quicker at night than the LDDs,indicating finer particles or lack of induration. Image credits NASA/JPL/ASU/MSSS.
Fig. 10. Latitude dependence of TAR distributions. (a) Mean percentage TAR cover in allimages studied as a function of latitude. (b) Total area studied as a function of latitude.
710 M. Balme et al. / Geomorphology 101 (2008) 703–720
LDD fields and ergs. Nevertheless, Fenton et al. (2003) used ThermalEmission Spectrometer (TES) data to obtain approximate mineralcompositions for LDDs and TARs, and they found approximatelybasaltic signatures for both and little evidence to suggest that the twotypes of bedforms have radically different compositions.
Although available data suggest LDDs and TARs are composition-ally similar, their albedo and morphological differences might insteadreflect differences in particle size or type (agglomerates versus solidgrains). Remote sensing ‘thermal inertia’ data provide an alternativemeans to in situ sampling for probing the physical properties of TARs.The general principal of thermophysical sampling is that terrains thatstay warmer at night are composed of larger particles, or have a largerfraction of bedrock, than materials that cool down quickly that arecomposed of fine sand or dust (Presley and Christensen, 1997a,b).Thus, thermal inertia can tell us about the size of particles in aeoliandeposits. Several caveats are associated with using such data though:first, measurements integrate over a thermal skin depth that can be ofthe order of several centimeters deep, thus thin layers of sedimentscan be ‘invisible’ as the signal represents dominant material beneath.Also, poorly sorted or bimodal sediments can ‘mix’ the signal to givean average thermal inertia and hence a misleading particle size.Second, pixel sizes of thermal inertia measurements are generallylarger than individual TAR bedforms and can include other surfacefeatures such as boulders, inter-bedform bedrock, or sand or dust driftdeposits. Again, the result is an average thermal inertia rather than atruemeasurement. Finally, induratedmaterial of fine particle sizes canhave high thermal inertia, thus interpretation of thermal inertia mustconsider induration as well as particle size. Fenton et al. (2003) foundthat medium to coarse basaltic sand was the best candidate for TAR-forming materials in Proctor Crater from THEMIS thermal inertiameasurements, but also found that LDDs in a similar regionwere likely
composed of even coarser sand particles. Balme and Bourke (2005)demonstrated that TARs have lower relative thermal inertias thanLDDs using THEMIS night-time images in which both TARs and LDDswere present. Zimbelman (2003) and Fenton and Mellon (2006) alsofound that TARs have relatively low thermal inertias compared toLDDs. In fact, TARs appear darker than LDDs in most night-timethermal images where they occur together, indicating that they have alower thermal inertia (Fig. 9). Assuming that the mineralogy of thesediments are the same, these observations suggests three possibi-lities: (i) TARs are composed of smaller particles than LDDs, (ii) LDDsand TARs have similar particle sizes but in general LDDs are lithified,or (iii) TARs and LDDs have similar particle sizes but that the particlesthat form TARs are agglomerates, porous, or otherwise of low thermalinertia in and of themselves.
3.4. Global or latitude distribution of TARs
TARs are common on Mars and have even been found high on theTharsis volcanoes, an elevation associated with extremely low atmo-spheric pressure (Malin and Edgett, 2001). No global survey of TARshas been performed to date, primarily because of the small size of
711M. Balme et al. / Geomorphology 101 (2008) 703–720
TARs and the limited areal coverage of high-resolution MOC NAimages. In a preliminary pole-to-pole survey that examined ∼5000MOC NA images in a longitude band 180 to 240° E, Wilson andZimbelman (2004) found that the distribution of TARs is notubiquitous and that the percentage of MOC images containing TARsis extremely low in the northern and southern mid to high latitudes.We have performed a similar, but larger, survey that examines∼10,000 images in a pole-to-pole swath on the opposite side of theplanet. Our survey also differs in that we noted the approximate arealcoverage of TARs in each image, rather than simply whether an imagecontained TARs or not, and classified TAR deposits using the criteriadiscussed above.
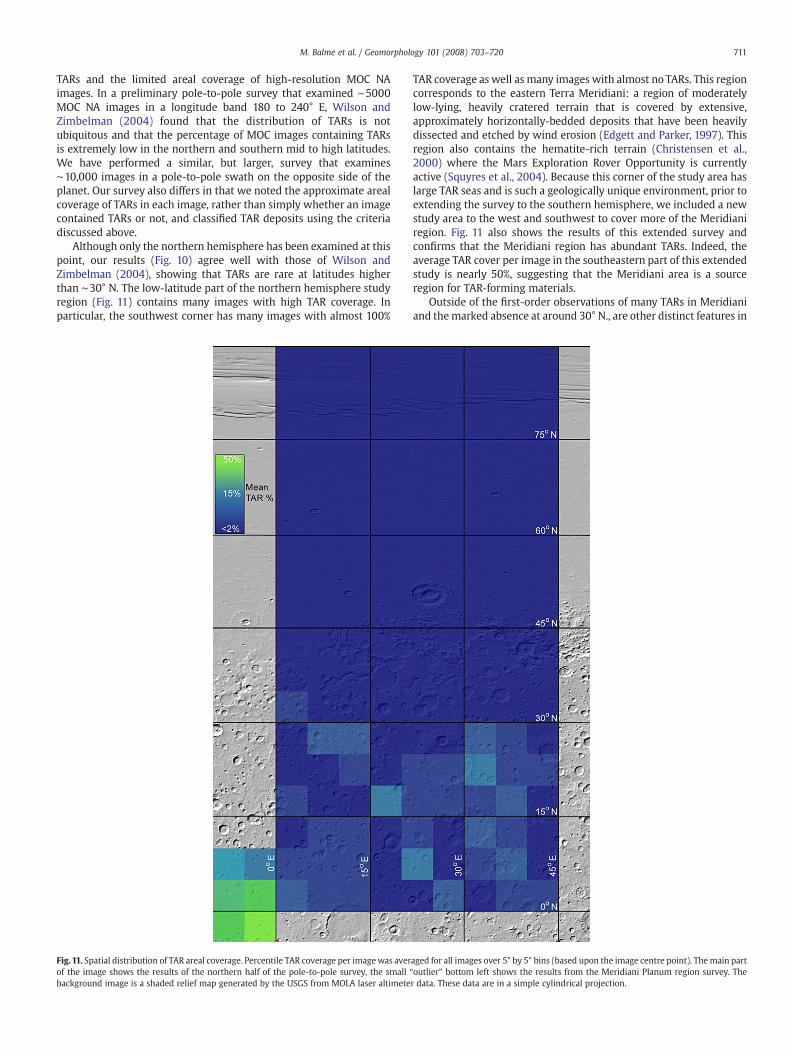
Although only the northern hemisphere has been examined at thispoint, our results (Fig. 10) agree well with those of Wilson andZimbelman (2004), showing that TARs are rare at latitudes higherthan ∼30° N. The low-latitude part of the northern hemisphere studyregion (Fig. 11) contains many images with high TAR coverage. Inparticular, the southwest corner has many images with almost 100%
Fig.11. Spatial distribution of TAR areal coverage. Percentile TAR coverage per imagewas averof the image shows the results of the northern half of the pole-to-pole survey, the small “background image is a shaded relief map generated by the USGS from MOLA laser altimete
TAR coverage as well as many images with almost noTARs. This regioncorresponds to the eastern Terra Meridiani: a region of moderatelylow-lying, heavily cratered terrain that is covered by extensive,approximately horizontally-bedded deposits that have been heavilydissected and etched by wind erosion (Edgett and Parker, 1997). Thisregion also contains the hematite-rich terrain (Christensen et al.,2000) where the Mars Exploration Rover Opportunity is currentlyactive (Squyres et al., 2004). Because this corner of the study area haslarge TAR seas and is such a geologically unique environment, prior toextending the survey to the southern hemisphere, we included a newstudy area to the west and southwest to cover more of the Meridianiregion. Fig. 11 also shows the results of this extended survey andconfirms that the Meridiani region has abundant TARs. Indeed, theaverage TAR cover per image in the southeastern part of this extendedstudy is nearly 50%, suggesting that the Meridiani area is a sourceregion for TAR-forming materials.
Outside of the first-order observations of many TARs in Meridianiand themarked absence at around 30° N., are other distinct features in
aged for all images over 5° by 5° bins (based upon the image centre point). Themain partoutlier” bottom left shows the results from the Meridiani Planum region survey. Ther data. These data are in a simple cylindrical projection.
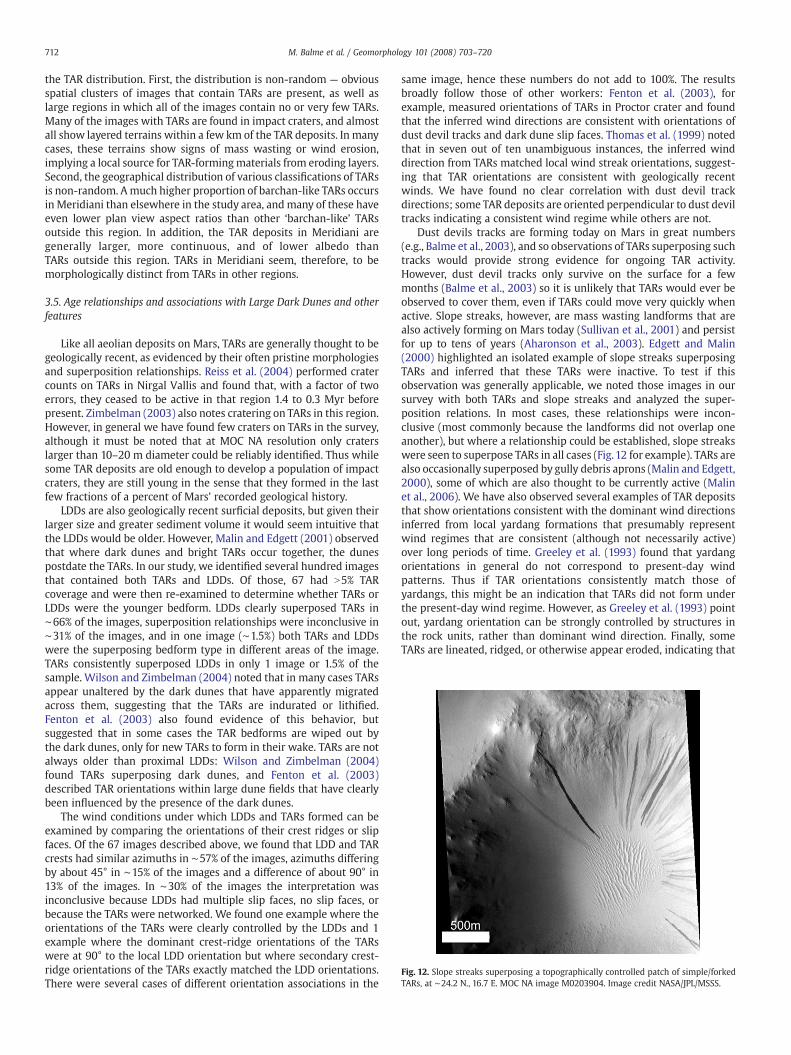
Fig. 12. Slope streaks superposing a topographically controlled patch of simple/forkedTARs, at ∼24.2 N., 16.7 E. MOC NA image M0203904. Image credit NASA/JPL/MSSS.
712 M. Balme et al. / Geomorphology 101 (2008) 703–720
the TAR distribution. First, the distribution is non-random — obviousspatial clusters of images that contain TARs are present, as well aslarge regions in which all of the images contain no or very few TARs.Many of the images with TARs are found in impact craters, and almostall show layered terrains within a few km of the TAR deposits. In manycases, these terrains show signs of mass wasting or wind erosion,implying a local source for TAR-formingmaterials from eroding layers.Second, the geographical distribution of various classifications of TARsis non-random. Amuch higher proportion of barchan-like TARs occursin Meridiani than elsewhere in the study area, andmany of these haveeven lower plan view aspect ratios than other ‘barchan-like’ TARsoutside this region. In addition, the TAR deposits in Meridiani aregenerally larger, more continuous, and of lower albedo thanTARs outside this region. TARs in Meridiani seem, therefore, to bemorphologically distinct from TARs in other regions.
3.5. Age relationships and associations with Large Dark Dunes and otherfeatures
Like all aeolian deposits on Mars, TARs are generally thought to begeologically recent, as evidenced by their often pristine morphologiesand superposition relationships. Reiss et al. (2004) performed cratercounts on TARs in Nirgal Vallis and found that, with a factor of twoerrors, they ceased to be active in that region 1.4 to 0.3 Myr beforepresent. Zimbelman (2003) also notes cratering on TARs in this region.However, in general we have found few craters on TARs in the survey,although it must be noted that at MOC NA resolution only craterslarger than 10–20 m diameter could be reliably identified. Thus whilesome TAR deposits are old enough to develop a population of impactcraters, they are still young in the sense that they formed in the lastfew fractions of a percent of Mars' recorded geological history.
LDDs are also geologically recent surficial deposits, but given theirlarger size and greater sediment volume it would seem intuitive thatthe LDDs would be older. However, Malin and Edgett (2001) observedthat where dark dunes and bright TARs occur together, the dunespostdate the TARs. In our study, we identified several hundred imagesthat contained both TARs and LDDs. Of those, 67 had N5% TARcoverage and were then re-examined to determine whether TARs orLDDs were the younger bedform. LDDs clearly superposed TARs in∼66% of the images, superposition relationships were inconclusive in∼31% of the images, and in one image (∼1.5%) both TARs and LDDswere the superposing bedform type in different areas of the image.TARs consistently superposed LDDs in only 1 image or 1.5% of thesample. Wilson and Zimbelman (2004) noted that in many cases TARsappear unaltered by the dark dunes that have apparently migratedacross them, suggesting that the TARs are indurated or lithified.Fenton et al. (2003) also found evidence of this behavior, butsuggested that in some cases the TAR bedforms are wiped out bythe dark dunes, only for new TARs to form in their wake. TARs are notalways older than proximal LDDs: Wilson and Zimbelman (2004)found TARs superposing dark dunes, and Fenton et al. (2003)described TAR orientations within large dune fields that have clearlybeen influenced by the presence of the dark dunes.
The wind conditions under which LDDs and TARs formed can beexamined by comparing the orientations of their crest ridges or slipfaces. Of the 67 images described above, we found that LDD and TARcrests had similar azimuths in ∼57% of the images, azimuths differingby about 45° in ∼15% of the images and a difference of about 90° in13% of the images. In ∼30% of the images the interpretation wasinconclusive because LDDs had multiple slip faces, no slip faces, orbecause the TARs were networked. We found one example where theorientations of the TARs were clearly controlled by the LDDs and 1example where the dominant crest-ridge orientations of the TARswere at 90° to the local LDD orientation but where secondary crest-ridge orientations of the TARs exactly matched the LDD orientations.There were several cases of different orientation associations in the
same image, hence these numbers do not add to 100%. The resultsbroadly follow those of other workers: Fenton et al. (2003), forexample, measured orientations of TARs in Proctor crater and foundthat the inferred wind directions are consistent with orientations ofdust devil tracks and dark dune slip faces. Thomas et al. (1999) notedthat in seven out of ten unambiguous instances, the inferred winddirection from TARs matched local wind streak orientations, suggest-ing that TAR orientations are consistent with geologically recentwinds. We have found no clear correlation with dust devil trackdirections; some TAR deposits are oriented perpendicular to dust deviltracks indicating a consistent wind regime while others are not.
Dust devils tracks are forming today on Mars in great numbers(e.g., Balme et al., 2003), and so observations of TARs superposing suchtracks would provide strong evidence for ongoing TAR activity.However, dust devil tracks only survive on the surface for a fewmonths (Balme et al., 2003) so it is unlikely that TARs would ever beobserved to cover them, even if TARs could move very quickly whenactive. Slope streaks, however, are mass wasting landforms that arealso actively forming on Mars today (Sullivan et al., 2001) and persistfor up to tens of years (Aharonson et al., 2003). Edgett and Malin(2000) highlighted an isolated example of slope streaks superposingTARs and inferred that these TARs were inactive. To test if thisobservation was generally applicable, we noted those images in oursurvey with both TARs and slope streaks and analyzed the super-position relations. In most cases, these relationships were incon-clusive (most commonly because the landforms did not overlap oneanother), but where a relationship could be established, slope streakswere seen to superpose TARs in all cases (Fig.12 for example). TARs arealso occasionally superposed by gully debris aprons (Malin and Edgett,2000), some of which are also thought to be currently active (Malinet al., 2006). We have also observed several examples of TAR depositsthat show orientations consistent with the dominant wind directionsinferred from local yardang formations that presumably representwind regimes that are consistent (although not necessarily active)over long periods of time. Greeley et al. (1993) found that yardangorientations in general do not correspond to present-day windpatterns. Thus if TAR orientations consistently match those ofyardangs, this might be an indication that TARs did not form underthe present-day wind regime. However, as Greeley et al. (1993) pointout, yardang orientation can be strongly controlled by structures inthe rock units, rather than dominant wind direction. Finally, someTARs are lineated, ridged, or otherwise appear eroded, indicating that

Fig. 13. (a) Example of barchan-like TARs in the Meridiani region (A) merging intosinuous (B) and simple (C) TARs. MOC NA image M1201981. (b) Very small TARsalongside very large TARs in theMeridiani region. The large TARs appear to have formedfrom coalescing smaller TARs and have λ∼80 m. Also visible are “feathered” orsecondary ridge crests. MOC NA image S0100625 (c) Simple TARs (λ∼20 m) withsecondary crest ridges (A) transitioning to networked TARs (B) that still show a slighttrend in orientation. MOC NA image R0902119 at ∼47.45 S., 36.7 E,. Image credit NASA/JPL/MSSSS.
713M. Balme et al. / Geomorphology 101 (2008) 703–720
they are lithified and immobile. Such examples are rare though; mostTARs have a more pristine morphology.
In short, strong evidence exists to show that TARs have a range ofages, although all are classed as ‘geologically recent’, but that generallythey are older than LDDs, also thought to be ‘recent’. Nevertheless,TARs, LDDs, and dust devil tracks often show similar inferredformation wind directions indicating either that many TARs formedunder present-day wind conditions or that wind conditions have beenstable in these regions for millions of years. Finally, while some TARsare clearly younger than some LDDs, the overall relation of TARs toslope streaks suggests either that they are not active today, or thatthey are active on a much longer timescale than slope streaks (i.e.,hundreds to thousands of years rather than tens of years).
3.6. Evolution of TAR morphologies
In the Meridiani area in particular, spatial transitions downwindfrom merging barchan-like TARs into sinuous TARs and then intosimple TARs (Fig. 13a and b) are commonly observed. Spatialtransitions from saturated, sinuous, forked, and simple TARs intonetworked TARs (e.g., Fig. 13c) can also be seen in some regions andare particularly associated with sediment trapped in topographiclows. This response is similar to the evolution and merging of barchandunes into barchanoid ridges on Earth (Lancaster, 1995). Closeexamination reveals that many of the larger simple or sinuous TARsin theMeridiani region formed fromvery small barchan-like TARs thathave coalesced, their ridge-crest merging to form sinuous or simplebedforms. Fig. 13b shows very large TARs (the largest TARs are spacedabout 80 m apart and have crest-ridge lengths of up to 400–500 m)that appear to have coalesced from smaller, saturated barchan-likeTARs (the smallest are b10 m in crest-ridge length and ∼10 m inwavelength).
Also visible in Fig. 13b and c are secondary ridge crests formingapproximatelyperpendicular to the largest TARcrest ridges. Bourkeet al.(2003) classified these features as an independent crest-ridgemorphol-ogy they described as “feathered”. The secondary crest ridgesmost oftenform perpendicular to the main crest ridges but oblique examples arenot uncommon. These ‘feathered’ TARs are somewhat similar tonetworked TARs, but we suggest that networked TARs representprimary bedforms that form together in complex or multi-directionalwind regimes, whereas feathered or secondary crest ridges arecompound forms that develop after the primary set has become largeenough to channel wind flow or where wind directions have system-atically changed. Larger, primary TARs probably respondmore slowly towind changes (or might become inactive or lithified) than smaller TARs,allowing the secondary crest to form over and around them.
4. In situ observations of TARs
In situ observations of martian landforms are few as they requiresuitably instrumented landing craft such as the Viking and MarsPathfinder landers and the Sojourner and twin Mars ExplorationRovers (MERs). Additionally, mission planners have tried to avoid closecontact between a rover and meter-scale or larger aeolian deposits assuch ‘sand-traps’ could easily snare the rover, bringing a multi-milliondollar mission to a premature end. The notable exception to this rule isthe MER Opportunity rover that, over the last three years, hastraversed over 10 km of plains covered by meter-scale aeolianbedforms (Figs. 14a and 15) after having landed in a small impactcrater (Fig. 14b) on theMeridiani plains of Mars in 2004 (Squyres et al.,2004). To reinforce the dangers of aeolian deposits to rovers,Opportunity was trapped in one of these bedforms for severalweeks when its wheels became buried too deeply in the sand(Fig. 15). Opportunities' twin rover, Spirit, has also made observationsof aeolian bedforms but, in general, these have been of smaller, moreisolated examples than at the Opportunity site.
714 M. Balme et al. / Geomorphology 101 (2008) 703–720
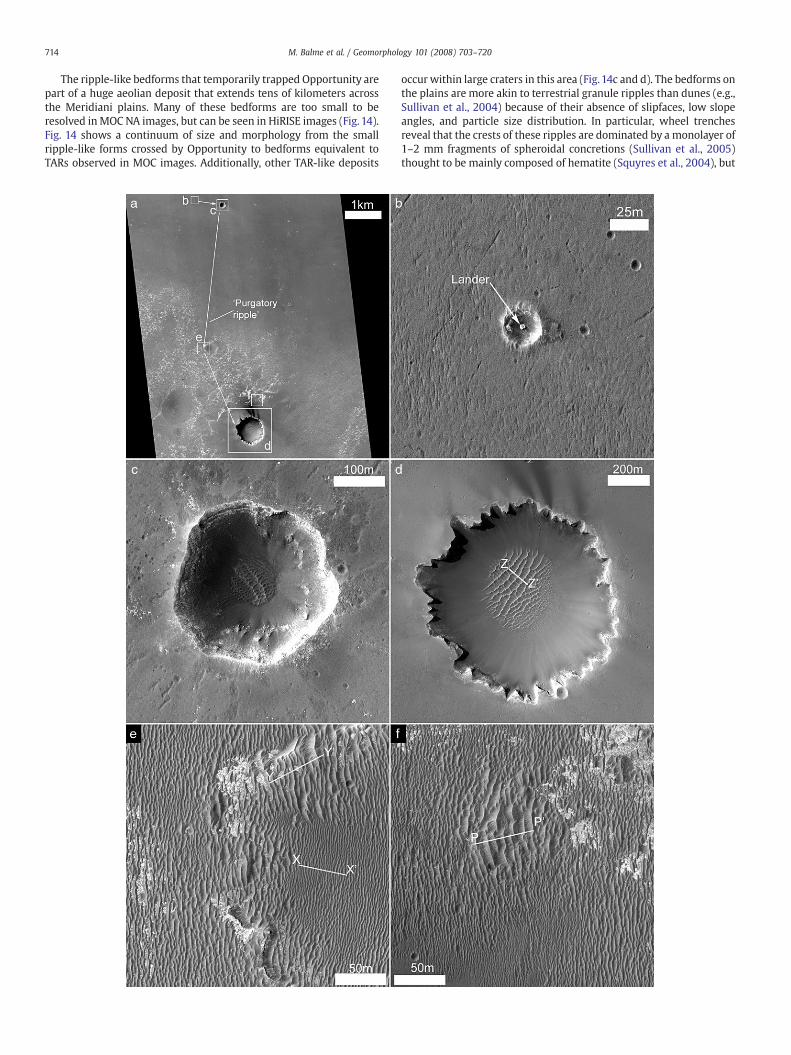
The ripple-like bedforms that temporarily trapped Opportunity arepart of a huge aeolian deposit that extends tens of kilometers acrossthe Meridiani plains. Many of these bedforms are too small to beresolved inMOC NA images, but can be seen in HiRISE images (Fig. 14).Fig. 14 shows a continuum of size and morphology from the smallripple-like forms crossed by Opportunity to bedforms equivalent toTARs observed in MOC images. Additionally, other TAR-like deposits
occur within large craters in this area (Fig.14c and d). The bedforms onthe plains are more akin to terrestrial granule ripples than dunes (e.g.,Sullivan et al., 2004) because of their absence of slipfaces, low slopeangles, and particle size distribution. In particular, wheel trenchesreveal that the crests of these ripples are dominated by a monolayer of1–2 mm fragments of spheroidal concretions (Sullivan et al., 2005)thought to be mainly composed of hematite (Squyres et al., 2004), but

Fig. 15. Looking back at “Purgatory ripple”. MER Opportunity NavCam image taken onsol (martian day) 466 of the mission. The rover was stuck in this ripple for severalweeks. The ripple wavelength here is ∼2.5 m; the ripples are ∼30 cm high. NASAPlanetary Photojournal image PIA07999. Image credit NASA/JPL.
715M. Balme et al. / Geomorphology 101 (2008) 703–720
the interior of the ripples, and the regolith in general, is composed of apoorly sorted mix of ∼100 μm sand particles, dust particles and a fewlarger clasts (Sullivan et al., 2007). Some cohesion exists in the soil,based on observations of trench walls. Inter-ripple areas aredominated by 50–125 μm grains of basaltic sand and additionalconcretion fragments and intact concretions several millimeters indiameter (Sullivan et al., 2005). As the rover continued south, thebedforms became larger (as shown in Fig. 14e and f), and the observedfragments of concretions armoring the ripples became smaller(Sullivan et al., 2007). In addition to these large ripples, Sullivan etal. (2005) noted another population of smaller (∼10 cm wavelength)ripples that formed almost entirely within basaltic sands trapped inlocal topographic hollows such as craters, pits, and troughs. Thesesmall ripples have orientations perpendicular to the current winddirection, inferred from observations of transient wind streaks fromEagle crater. The orientations of the larger ripples differ from this bybetween 10 and 40°, interpreted by Sullivan et al. (2005) to indicate ashift in wind regime and evidence of the larger bedforms beingrelatively inactive. Jerolmack et al. (2006) estimated wind strengthsrequired to create dust streaks and activate the ripples in this region.They found that surface friction wind speeds (u⁎) of ∼3.5 m s−1
(equivalent to ∼70 m s−1 winds at 1 m height) are required to activatethe granule ripples, about twice the wind speed required to create thetransient wind streak. From this they suggest that the ripples mighthave been active in the last decade. In contrast, using analog fieldstudies of the rate of granule ripple movement at Great Sand DunesNational Park and Preserve, USA, Zimbelman et al. (2007) suggestedthat the MER ripples are ancient and have not been recently active.Similarly, Sullivan et al. (2007) showed that ejecta blocks emplaced
Fig. 14. HiRISE image PSP_001414_1780_RED, showing a part of the Meridiani plains where th25 cm/pixel, allowing sub-meter-scale landforms to be studied. (a) The approximate path of(b) to its current location on the rim of “Victoria” crater (d). (b) Eagle crater, still showing thvisible around the crater. These were observed by Opportunity to be a few tens of centimetecontaining small aeolian bedforms. The rover entered this crater and imaged this deposit frocontain two or three small, simple TARs. Higher resolution and surface images show a cosecondary ridge crests. (d) TARs within the larger Victoria crater. This deposit would be dclassification. At the time of writing, the rover has not yet entered Victoria crater, but has im(Z–Z′), similar to networked TARs aroundMars. (e) As the Rover traveled south, the ripple-likthe larger bedforms (Y–Y′) have λ∼6m. The smaller bedforms within the crater (X–X′) haveVictoria crater are the largest bedforms in the HiRISE image (λ∼10 m; P–P′). These show ideparts of Meridiani. Image credit NASA/JPL/UofA.
onto the ripples have eroded to conform to the ripple surface,indicating that this erosion occurs more quickly than the ripples canactually move. These observations strongly suggest that the granuleripples are only rarely active.
The two largest craters visited by Opportunity — Endurance andVictoria — contain aeolian bedforms similar in planform morphologyto TARs (Figs. 14c and d, 16 and 17). Both sets of TARs in these cratersshow crest-ridge morphologies transitional between simple andnetworked and have clear secondary crest ridges. Sullivan et al.(2007) noted that the ripples in the southern part of the Opportunitytraverse also showed evidence of secondary crest ridges, although at asmaller scale. Squyres et al. (2006) interpret the Endurance Craterbedforms to be a combination of small star-dunes and large ripples(Figs. 14c and 16).
5. Discussion
5.1. Terrestrial analogs to TARs: dunes or granule ripples?
Broadly speaking, terrestrial transverse dunes and granule ripplesare distinguished from one another by their scale, and by morpho-logical and textural differences. For example, although terrestrialgranule ripples with wavelengths of up to ∼20 m (Bagnold, 1941) oreven ∼30 m (Malin, 1986) have been observed, they generally haveshorter wavelengths of several meters (e.g., Wilson, 1972; Fryberger etal., 1992; Zimbelman andWilliams, 2007). Transverse dunes, however,can have wavelengths of tens to thousands of meters (e.g., Lancaster,1995; pp 54–59). In terms of morphology, dunes individually alter thelocal airflow, leading to flow separation zones, angle of repose slipfaces and slip face avalanching. They also commonly have smalleraeolian bedforms (such as smaller dunes, granule ripples oraerodynamic ripples) superposed upon them. In contrast, granuleripples are generally not large enough to affect the local winds, havebelow angle of repose slipfaces, and rarely show smaller, aerodynamicripples superposed upon them. Granule ripples are also distinguishedby their texture (e.g. Wilson, 1972), having concentrations of largesand or granules at the surface (and especially at their crests), and finegrained or poorly sorted material within. This contrasts with dunes,which arewell-sorted to verywell-sorted in coastal environments andmoderately sorted to well-sorted in inland environments (Ahlbrandt,1979).
Although TARs seem too large to be granule ripples, given thatterrestrial examples with wavelengths greater than a few meters arerare, calculations byWhite (1979) suggested that the kinetic energy ofsand grains in saltation on Mars can be an order of magnitude greaterthan saltating particles on Earth. Thus, saltating grain impacts willcreate higher energy reptating particle populations. Given that Mars'gravity is about a third that of the Earth's, these particles will thereforehave longer mean reptation lengths. Additionally, grain impacts willcause more severe creep if the impacted particles are too large to bemoved by reptation, and larger particles will be able to be moved bycreep than on Earth. Assuming that the process that governs thescaling of granule ripple wavelength is indeed reptation/creep (e.g.,Anderson, 1987; Ungar and Haff, 1987; Yizhaq, 2004), the maximum
e Opportunity Rover is operating. HiRISE images can have spatial resolutions as good asOpportunity across the Meridiani plains from its initial landing site inside “Eagle” cratere landing craft that carried the rover to the surface. North–south orientated ripples arers across, up to a few meters wide and a few centimeters in height. (c) Endurance craterm the surface (Fig. 16, below). In earlier, low resolution images, the crater appeared tomplex suite of small TARs with a barely dominant ridge-crest orientation and strongescribed as a topographically confined, networked TAR patch in our remote sensing
aged the sediments from the crater rim (Fig. 17). The TARs here have a spacing of ∼30 me bedforms generally became larger. Here, on the rim of a subdued crater named ‘Erebus’λ∼2.5 m and aremore typical of the northern part of Opportunity's traverse. (f) North ofntical morphology to merging barchan-like TARs observed in MOC NA images in other
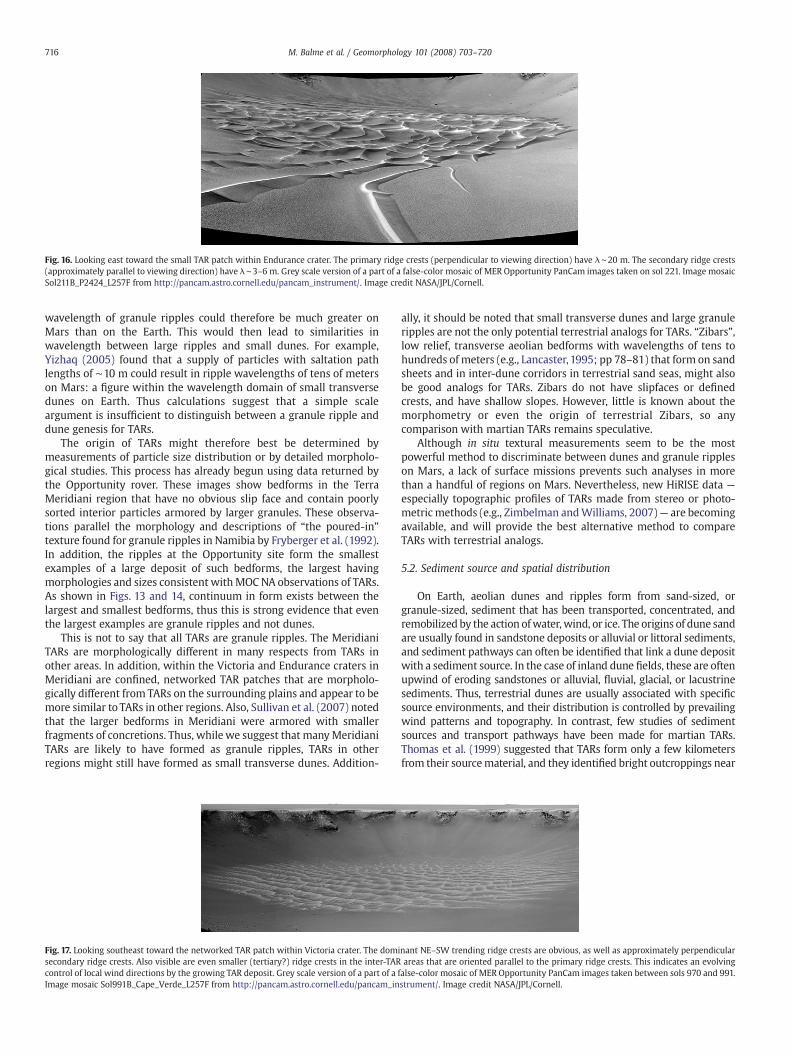
Fig. 16. Looking east toward the small TAR patch within Endurance crater. The primary ridge crests (perpendicular to viewing direction) have λ∼20 m. The secondary ridge crests(approximately parallel to viewing direction) have λ∼3–6 m. Grey scale version of a part of a false-color mosaic of MER Opportunity PanCam images taken on sol 221. Image mosaicSol211B_P2424_L257F from http://pancam.astro.cornell.edu/pancam_instrument/. Image credit NASA/JPL/Cornell.
716 M. Balme et al. / Geomorphology 101 (2008) 703–720
wavelength of granule ripples could therefore be much greater onMars than on the Earth. This would then lead to similarities inwavelength between large ripples and small dunes. For example,Yizhaq (2005) found that a supply of particles with saltation pathlengths of ∼10 m could result in ripple wavelengths of tens of meterson Mars: a figure within the wavelength domain of small transversedunes on Earth. Thus calculations suggest that a simple scaleargument is insufficient to distinguish between a granule ripple anddune genesis for TARs.
The origin of TARs might therefore best be determined bymeasurements of particle size distribution or by detailed morpholo-gical studies. This process has already begun using data returned bythe Opportunity rover. These images show bedforms in the TerraMeridiani region that have no obvious slip face and contain poorlysorted interior particles armored by larger granules. These observa-tions parallel the morphology and descriptions of “the poured-in”texture found for granule ripples in Namibia by Fryberger et al. (1992).In addition, the ripples at the Opportunity site form the smallestexamples of a large deposit of such bedforms, the largest havingmorphologies and sizes consistent withMOCNA observations of TARs.As shown in Figs. 13 and 14, continuum in form exists between thelargest and smallest bedforms, thus this is strong evidence that eventhe largest examples are granule ripples and not dunes.
This is not to say that all TARs are granule ripples. The MeridianiTARs are morphologically different in many respects from TARs inother areas. In addition, within the Victoria and Endurance craters inMeridiani are confined, networked TAR patches that are morpholo-gically different from TARs on the surrounding plains and appear to bemore similar to TARs in other regions. Also, Sullivan et al. (2007) notedthat the larger bedforms in Meridiani were armored with smallerfragments of concretions. Thus, while we suggest that manyMeridianiTARs are likely to have formed as granule ripples, TARs in otherregions might still have formed as small transverse dunes. Addition-
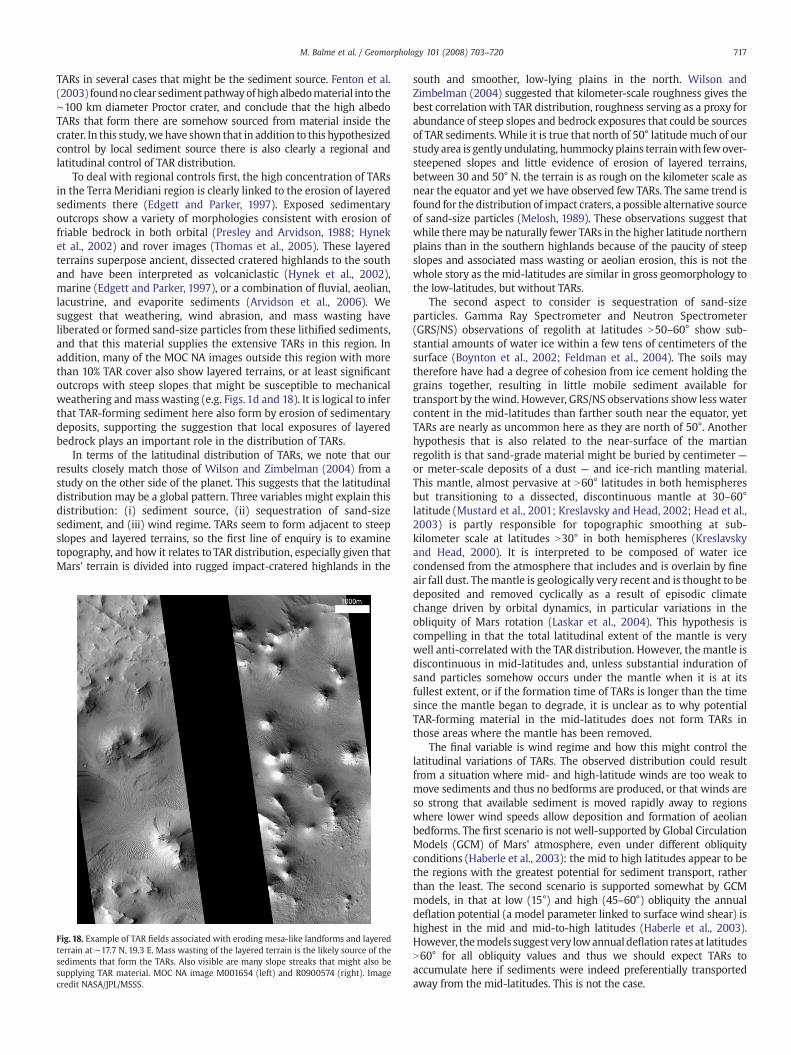
Fig. 17. Looking southeast toward the networked TAR patch within Victoria crater. The domsecondary ridge crests. Also visible are even smaller (tertiary?) ridge crests in the inter-TARcontrol of local wind directions by the growing TAR deposit. Grey scale version of a part of a fImage mosaic Sol991B_Cape_Verde_L257F from http://pancam.astro.cornell.edu/pancam_in
ally, it should be noted that small transverse dunes and large granuleripples are not the only potential terrestrial analogs for TARs. “Zibars”,low relief, transverse aeolian bedforms with wavelengths of tens tohundreds of meters (e.g., Lancaster, 1995; pp 78–81) that form on sandsheets and in inter-dune corridors in terrestrial sand seas, might alsobe good analogs for TARs. Zibars do not have slipfaces or definedcrests, and have shallow slopes. However, little is known about themorphometry or even the origin of terrestrial Zibars, so anycomparison with martian TARs remains speculative.
Although in situ textural measurements seem to be the mostpowerful method to discriminate between dunes and granule rippleson Mars, a lack of surface missions prevents such analyses in morethan a handful of regions on Mars. Nevertheless, new HiRISE data —
especially topographic profiles of TARs made from stereo or photo-metric methods (e.g., Zimbelman andWilliams, 2007)— are becomingavailable, and will provide the best alternative method to compareTARs with terrestrial analogs.
5.2. Sediment source and spatial distribution
On Earth, aeolian dunes and ripples form from sand-sized, orgranule-sized, sediment that has been transported, concentrated, andremobilized by the action ofwater, wind, or ice. The origins of dune sandare usually found in sandstone deposits or alluvial or littoral sediments,and sediment pathways can often be identified that link a dune depositwith a sediment source. In the case of inland dune fields, these are oftenupwind of eroding sandstones or alluvial, fluvial, glacial, or lacustrinesediments. Thus, terrestrial dunes are usually associated with specificsource environments, and their distribution is controlled by prevailingwind patterns and topography. In contrast, few studies of sedimentsources and transport pathways have been made for martian TARs.Thomas et al. (1999) suggested that TARs form only a few kilometersfrom their sourcematerial, and they identified bright outcroppings near
inant NE–SW trending ridge crests are obvious, as well as approximately perpendicularareas that are oriented parallel to the primary ridge crests. This indicates an evolvingalse-color mosaic of MER Opportunity PanCam images taken between sols 970 and 991.strument/. Image credit NASA/JPL/Cornell.
717M. Balme et al. / Geomorphology 101 (2008) 703–720
TARs in several cases that might be the sediment source. Fenton et al.(2003) foundnoclear sedimentpathwayof highalbedomaterial into the∼100 km diameter Proctor crater, and conclude that the high albedoTARs that form there are somehow sourced from material inside thecrater. In this study,we have shown that in addition to this hypothesizedcontrol by local sediment source there is also clearly a regional andlatitudinal control of TAR distribution.
To deal with regional controls first, the high concentration of TARsin the Terra Meridiani region is clearly linked to the erosion of layeredsediments there (Edgett and Parker, 1997). Exposed sedimentaryoutcrops show a variety of morphologies consistent with erosion offriable bedrock in both orbital (Presley and Arvidson, 1988; Hyneket al., 2002) and rover images (Thomas et al., 2005). These layeredterrains superpose ancient, dissected cratered highlands to the southand have been interpreted as volcaniclastic (Hynek et al., 2002),marine (Edgett and Parker, 1997), or a combination of fluvial, aeolian,lacustrine, and evaporite sediments (Arvidson et al., 2006). Wesuggest that weathering, wind abrasion, and mass wasting haveliberated or formed sand-size particles from these lithified sediments,and that this material supplies the extensive TARs in this region. Inaddition, many of the MOC NA images outside this region with morethan 10% TAR cover also show layered terrains, or at least significantoutcrops with steep slopes that might be susceptible to mechanicalweathering and mass wasting (e.g. Figs. 1d and 18). It is logical to inferthat TAR-forming sediment here also form by erosion of sedimentarydeposits, supporting the suggestion that local exposures of layeredbedrock plays an important role in the distribution of TARs.
In terms of the latitudinal distribution of TARs, we note that ourresults closely match those of Wilson and Zimbelman (2004) from astudy on the other side of the planet. This suggests that the latitudinaldistribution may be a global pattern. Three variables might explain thisdistribution: (i) sediment source, (ii) sequestration of sand-sizesediment, and (iii) wind regime. TARs seem to form adjacent to steepslopes and layered terrains, so the first line of enquiry is to examinetopography, and how it relates to TAR distribution, especially given thatMars' terrain is divided into rugged impact-cratered highlands in the
Fig. 18. Example of TAR fields associated with eroding mesa-like landforms and layeredterrain at ∼17.7 N, 19.3 E. Mass wasting of the layered terrain is the likely source of thesediments that form the TARs. Also visible are many slope streaks that might also besupplying TAR material. MOC NA image M001654 (left) and R0900574 (right). Imagecredit NASA/JPL/MSSS.
south and smoother, low-lying plains in the north. Wilson andZimbelman (2004) suggested that kilometer-scale roughness gives thebest correlationwith TAR distribution, roughness serving as a proxy forabundance of steep slopes and bedrock exposures that could be sourcesof TAR sediments. While it is true that north of 50° latitude much of ourstudy area is gently undulating, hummocky plains terrainwith fewover-steepened slopes and little evidence of erosion of layered terrains,between 30 and 50° N. the terrain is as rough on the kilometer scale asnear the equator and yet we have observed few TARs. The same trend isfound for the distribution of impact craters, a possible alternative sourceof sand-size particles (Melosh, 1989). These observations suggest thatwhile theremay be naturally fewer TARs in the higher latitude northernplains than in the southern highlands because of the paucity of steepslopes and associated mass wasting or aeolian erosion, this is not thewhole story as the mid-latitudes are similar in gross geomorphology tothe low-latitudes, but without TARs.
The second aspect to consider is sequestration of sand-sizeparticles. Gamma Ray Spectrometer and Neutron Spectrometer(GRS/NS) observations of regolith at latitudes N50–60° show sub-stantial amounts of water ice within a few tens of centimeters of thesurface (Boynton et al., 2002; Feldman et al., 2004). The soils maytherefore have had a degree of cohesion from ice cement holding thegrains together, resulting in little mobile sediment available fortransport by thewind. However, GRS/NS observations show less watercontent in the mid-latitudes than farther south near the equator, yetTARs are nearly as uncommon here as they are north of 50°. Anotherhypothesis that is also related to the near-surface of the martianregolith is that sand-grade material might be buried by centimeter —or meter-scale deposits of a dust — and ice-rich mantling material.This mantle, almost pervasive at N60° latitudes in both hemispheresbut transitioning to a dissected, discontinuous mantle at 30–60°latitude (Mustard et al., 2001; Kreslavsky and Head, 2002; Head et al.,2003) is partly responsible for topographic smoothing at sub-kilometer scale at latitudes N30° in both hemispheres (Kreslavskyand Head, 2000). It is interpreted to be composed of water icecondensed from the atmosphere that includes and is overlain by fineair fall dust. Themantle is geologically very recent and is thought to bedeposited and removed cyclically as a result of episodic climatechange driven by orbital dynamics, in particular variations in theobliquity of Mars rotation (Laskar et al., 2004). This hypothesis iscompelling in that the total latitudinal extent of the mantle is verywell anti-correlated with the TAR distribution. However, the mantle isdiscontinuous in mid-latitudes and, unless substantial induration ofsand particles somehow occurs under the mantle when it is at itsfullest extent, or if the formation time of TARs is longer than the timesince the mantle began to degrade, it is unclear as to why potentialTAR-forming material in the mid-latitudes does not form TARs inthose areas where the mantle has been removed.
The final variable is wind regime and how this might control thelatitudinal variations of TARs. The observed distribution could resultfrom a situation where mid- and high-latitude winds are too weak tomove sediments and thus no bedforms are produced, or that winds areso strong that available sediment is moved rapidly away to regionswhere lower wind speeds allow deposition and formation of aeolianbedforms. The first scenario is not well-supported by Global CirculationModels (GCM) of Mars' atmosphere, even under different obliquityconditions (Haberle et al., 2003): the mid to high latitudes appear to bethe regions with the greatest potential for sediment transport, ratherthan the least. The second scenario is supported somewhat by GCMmodels, in that at low (15°) and high (45–60°) obliquity the annualdeflation potential (a model parameter linked to surface wind shear) ishighest in the mid and mid-to-high latitudes (Haberle et al., 2003).However, themodels suggest very lowannual deflation rates at latitudesN60° for all obliquity values and thus we should expect TARs toaccumulate here if sediments were indeed preferentially transportedaway from the mid-latitudes. This is not the case.

718 M. Balme et al. / Geomorphology 101 (2008) 703–720
We suggest that the low-latitude TAR distribution is linked closelyto sources of sediment (eroding layered terrain), but further in-vestigation is required to determine the controls on the latitudinaldistribution presented here. A combination of sediment availabilityand wind regime seems to be the most likely control on the present-day distribution of TARs.
5.3. Age and bedform mobility
Observations of impact-cratered TARs (Reiss et al., 2004) and lackof supporting superposition relations suggest that most TARs are notactive today, and in general, they do not appear to be the most recentof aeolian bedforms found on Mars. However, they have a complexrelationship with LDDs: in some regions overlying or being influencedby LDDs, but in most cases being superposed by LDDs. Theserelationships indicate that the TAR-forming materials are generallyless mobile than LDD materials. This is a slightly counter-intuitiveconclusion for two reasons: (i) LDDs are orders of magnitude largerthan TARs, and terrestrial experience suggests that larger bedformsmigrate more slowly than smaller ones (Bagnold, 1941; Gay, 1962);and (ii) the thermophysical properties of TARs suggest that, given thatthey are of similar composition to LDDs, they are composed of finerparticles, again suggesting that they, not LDDs, should be the moremobile bedform.
The Mars Exploration Rover Opportunity found that the regolith inthe Meridiani region was a poorly sorted mix of fine basaltic sand andhematite granule-sized concretion fragments (Sullivan et al., 2005),and the Spirit rover also observed granule-coated ripples where thegranules were comprised of rounded rock fragments (Greeley et al.,2004, 2006). Where the regolith was worked into ripples, a monolayerof fragments was often seen on the ripple crests, with basaltic sandson the flanks, and whole concretions or other clasts mixed withbasaltic sands in the inter-ripple zones. Thus, measurements oftemperature made with instruments that have relatively coarseresolution, such as TES or THEMIS, would average over many ripplesand inter-ripple areas and would also be sensitive to the ‘average’thermal inertia of the upper thermal skin depth layer (up to a fewcentimeters), rather than the topmost monolayer. Thus, the remotelysensed particle size may not represent the armoring monolayer ofgranules that stabilize the ripples in place. We therefore suggest thatmany TARs are armored by granule-sized fragments and this is whythey are relatively immobile compared to LDDs, inferred to becomposed of better-sorted coarse sand.
Almost the only environment where TARs are reliably observed toform contemporaneously with, or after, LDDs is within LDD fields. IfTARs are armored with granules, their mobility within LDD fieldsmight be a result of funneling of winds to produce shear stresses largeenough tomobilize granule-sized particles within the dune fields, or itmight instead be a product of an increased supply of coarse, saltatingsand that can mobilize the TAR granules by reptation or creep. Thisinterpretation is supported by thermal infrared observations of TARswithin the Proctor Crater LDD field (Fenton and Mellon, 2006) thatshowed that TARs here have a higher thermal inertia (more similar tothat of the LDDs) than TARs outside the LDDs. This suggests either thatthe TARs are kept free of dust (that might usually lower their thermalinertia) by saltating sand, or that LDD sand accumulates on or withinthe TARs and artificially raises the thermal inertia.
Zimbelman et al. (2007) have observed similar behavior on Earthduring the passage of a particularly strong storm front over the GreatSand Dunes National Park and Preserve (GSDNPP) in southernColorado. When the documented movement was compared to winddata for the event from a nearby airport, the granule movementoccurred during a 23-hour period when the average wind speed forthis entire period was ∼9 m s−1, which is ∼1.8 times the wind speedneeded to initiate saltation; photographs documented the volume ofgranules that crossed the crest of the granule ripples during this
period. Values of the atmospheric density and the acceleration ofgravity on Mars indicate that the sand flux (which represents thedriving force for granule movement through impact creep) on Marsshould be ∼3.8% of the sand flux on Earth, all other factors remainingconstant. Under these conditions, the GSDNPP granule movement ratecan be used to estimate that a 25 cm high granule ripple on Mars(comparable to those observed in images from MER Opportunity;Sullivan et al., 2005) would require ∼175 Earth-hours (7.3 Earth-days)to move only 1 cm if the wind blew continuously during that time atan average of ∼1.8 times the saltation threshold (Zimbelman et al., inreview). Higher wind speeds would decrease the time required, but itis unreasonable to expect winds above threshold to blow continuouslyfor hours, let alone days, on Mars. The conclusion is that thousands ofyears of more typical wind conditions would be required for martiangranule ripples to move a measurable amount (e.g., one-half of theripple wavelength) under current atmospheric conditions.
5.4. Utility of the classification scheme
In terms of facilitating the survey and simplifying tasks, such asplotting azimuthal orientations of topographically independent TARdeposits, the new classification scheme has been very successful. Wehave been able to filter the extensive dataset by these classificationcriteria to study different aspects of TARs; for example, the higherabundance of barchan-like TARs in the Meridiani region thanelsewhere, which perhaps indicates a different formation mechanism,sediment type or supply, or degree of evolution of the deposits. Also,identifying varying degrees of topographic control has been importantfor understanding whether a region with TARs is dominated bytransport or capture of TAR-forming materials. We will also use thesedata when comparing orientation of TARs with climate models infuture studies.
Although we have not yet fully explored correlations betweenvarious morphologies and morphometry or geographic locations, thecombination of crest-ridge morphology classification and morpho-metric data has already been useful. For example, widely spaced,barchan-like TARs appear to be at one end of a sediment supply/windregime spectrum; and closely-spaced, networked TARs at the other.However, we do not yet know how forked, sinuous, and simple TARsare related to one another; nor what the role is of inter-bedformspacing as a control onmorphology. Further study of the correlation ofspacing, plan view aspect ratio, and crest-ridge classification arerequired and might find more utility in rejecting the current divisionof simple, forked, and sinuous TARs in place of a morphometriccriterion. In summary, the classification scheme is very useful both fordescribing TAR deposits in a consistent manner and also forfacilitating more in-depth research topics.
6. Conclusions
(i) TARs are abundant but not ubiquitous. They preferentially formproximal to friable, layered terrains such as those found inMeridiani. Additionally, TAR distribution in the northernhemisphere shows a strong latitudinal dependence; very fewTARs are found north of ∼30° N. in the study region. No clearcorrelation exists between this distribution and Mars' grossmorphology, but the best explanation seems to be a combina-tion of (1) a lack of sediment supply in the northern lowlandsbecause of a lack of steep slopes and outcrops of layered,sedimentary terrain; (2) a sequestration of TAR-formingmaterials by a periodically emplaced ice-rich mantle; and(3) possible wind regime effects driven by obliquity changes inthe geologically recent past.
(ii) Remote sensing measurements of the thermophysical proper-ties of TARs consistently suggest that TAR materials havesmaller particle sizes than LDDs, yet observations show that in

719M. Balme et al. / Geomorphology 101 (2008) 703–720
most cases TARs are less mobile than LDDs. The particle sizeobservations likely reflect both vertical and horizontal averagingof the thermal properties as the perceived particle size is notrepresentative of Mars Exploration Rover Opportunity observa-tions that TARs have a strongly bimodal particle size. Thus, TARslikely consist of a core of finematerial armored by amonolayer ofgranule-sized particles that hinders TAR movement under thecurrent wind regime in settings other than within LDD fields,where the saltationfluxoffiner sands is high enough tomove thegranules (and hence the TARs) by reptation/creep.
(iii) That TARs are essentially inactive is confirmed by superpositionrelations with slope streaks and LDDs and by observations ofsuperposed impact craters.
(iv) Observations in the Terra Meridiani region by the Opportunityrover suggest that small aeolian bedforms here are ripples andnot small dunes. These small bedforms trend into largerfeatures that have similar morphologies when observed innew HiRISE images and are essentially identical to TARsobserved in MOC NA images in this area. This suggests thatTARs, in the Meridiani area at least, are ripples and not dunes.
(v) We have devised a new classification scheme for TARs basedupon (1) crest-ridge morphology, (2) influence of topographyon the TAR deposit, and (3) the size of the TAR deposit. Thescheme has proved useful for both descriptive purposes and forfacilitating science studies of TARs.
7. Future work
This work is ongoing andwe are continuing the study to extend theTAR survey to the southern hemisphere. This will complete the surveyand demonstrate whether the anti-correlation of TAR distributionwith the icy mantling terrain (which exists in the south as well as thenorth) is valid. In addition, we have begun to map azimuthalorientations of TAR seas that are independent of topography tocompare TAR azimuths with GCM wind direction data for both thecurrent climate and conditions of higher and lower obliquity. For oneor two regions (likely the Terra Meridiani and one other), we willcompare TAR distribution and orientations with local wind regimes,generated using very high-resolution mesoscale climate models.
An unforeseen aspect of this work that we plan to pursue in thefuture is themorphological differences betweenTARs inMeridiani andthose in other areas.Wewill examine TARs inMeridiani and elsewhereand make a statistical sampling of wavelength, crest-ridge length, andTAR width. From these datawe will extract inter-bedform spacing andplan view aspect ratio and investigate whether different spatialpopulations of TARs can be correlatedwithmorphometric populations.
Finally, as more 25 cm/pixel HiRISE data become available, we willexamine these images for detailed morphological studies of TARs andperform rudimentary age dating from impact crater statistics. Inaddition, HiRISE stereo images (∼1–2 m resolution) or photoclino-metry will allow numerous cross sections for TARs to be extracted.This will provide important data for comparison with terrestrialanalog studies (e.g., Zimbelman and Williams, 2007).
Acknowledgements
This work was supported by the NASAMars Data Analysis Programthrough grant number NNG05GQ74G. The authors thank Lori Fenton,John Pelletier and two anonymous referees for their constructivereviews of this paper.
References
Aharonson, O., Schorghofer, N., Gerstell, M., 2003. Slope streak formation and dustdeposition rates on Mars. J. Geophys. Res. 108 (E12). doi:10.1029/2003JE002123.
Ahlbrandt, T.S.,1979. Textural parameters in aeolian deposits. In:McKee, E. (Ed.), A Studyof Global Sand Seas. US Geological Survey paper, vol. 1052, pp. 21–52. Washington.
Anderson, R.S., 1987. A theoretical model for aeolian impact ripples. Sedimentology 34,943–956.
Arvidson, R., Poulet, F., Morris, R.V., Bibring, J.-P., Bell, J.F., Squyres, S.W., Christensen, P.,Bellucci, G., Gondet, B., Ehlmann, B.L., Farrand, W.H., Fergason, R.L., Golombek, M.,Griffes, J.L., Grotzinger, J., Guiness, E.A., Herkenhoff, K., Johnson, J.R., Klingelhöfer, G.,Langevin, Y., Ming, D., Seelos, K., Sullivan, R., Ward, J.G., Wiseman, S.M., Wolff, M.J.,2006. Nature and origin of the hematite-bearing plains of Terra Meridiani basedon analyses of orbital and Mars Exploration Rover data sets. J. Geophys. Res.111 (E12S08). doi:10.1029/2006JE002728.
Bagnold, R.A., 1941. The Physics of Windblown Sand and Desert Dunes. Methuen,London.
Balme, M.R., Bourke, M.C., 2005. Preliminary results from a new study of TransverseAeolian Ridges (TARs) on Mars. LPSC XXXVI [CDROM], Abstract # 1892.
Balme, M.R., Whelley, P.L., Greeley, R., 2003. Mars: dust devil track survey in ArgyrePlanitia and Hellas Basin. J. Geophys. Res. 108. doi:10.1029/2003JE002096.
Bourke, M.C., Wilson, S.A., Zimbelman, J.R., 2003. The variability of TARs in troughs onMars. LPSC XXXIV [CDROM], Abstract # 2090.
Bourke, M.C., Balme, M.R., Beyer, R.A.,Williams, K.K., Zimbelman, J., 2006. A comparison ofmethodsused to estimate the heightof sanddunes onMars. Geomorphology 81 (3–4),440–452.
Boynton, W.V., Feldman, W.C., Squyres, S.W., Prettyman, T.H., Brückner, J., Evans, L.G.,Reedy, R.C., Starr, R., Arnold, J.R., Drake, D.M., Englert, P.A.J., Metzger, A.E.,Mitrofanov, I., Trombka, J.I., d'Uston, C., Wänke, H., Gasnault, O., Hamara, D.K.,Janes, D.M., Marcialis, R.L., Maurice, S., Mikheeva, I., Taylor, G.J., Tokar, R., Shinohara,C., 2002. Distribution of hydrogen in the near surface of Mars: evidence forsubsurface ice deposits. Science 297 (5578), 81–85.
Christensen, P., Bandfield, J.L., Clark, R.N., Edgett, K.S., Hamilton, V.E., Hoefen, T., Kieffer,H.H., Kuzmin, R., Land, M.D., Malin, M.C., Morris, R.V., Pearl, J.C., Pearson, R., Roush,T., Ruff, S.W., Smith, M.D., 2000. Detection of crystalline hematite mineralization onMars by the Thermal Emission Spectrometer: evidence for near-surface water.J. Geophys. Res. 105 (E4), 9623–9642.
Cutts, J.A., Smith, R.S.U., 1973. Aeolian deposits and dunes on Mars. J. Geophys. Res. 78,4139–4154.
Cutts, J.A., Blasius, K.R., Briggs, G.A., Carr, J.R., Greeley, R., Masursky, H., 1976. North polarregions of Mars: imaging results from Viking 2. Science 194, 1329–1337.
Edgett, K.S., 1997. Aeolian dunes as evidence for explosive volcanism in the Tharsisregion of Mars. Icarus 130, 96–114.
Edgett, K.S., Christensen, P., 1991. The particle size of martian aeolian dunes. J. Geophys.Res. 96, 22,765–22,776.
Edgett, K.S., Parker, T.J., 1997. Water on early Mars: possible subaqueous sedimentarydeposits covering ancient cratered terrain in western Arabia and Sinus Meridiani.Geophys. Res. Lett. 24 (22), 2897–2900.
Edgett, K.S., Parker, T.J., 1998. “Bright” aeolian dunes on Mars: Viking orbiterobservations. LPSC XXIX [CDROM], Abstract # 1338.
Edgett, K.S., Christensen, P.R., 1994. Mars aeolian sand: regional variations among darkhued crater floor features. J. Geophys. Res. 99 (E1), 1997–2018.
Edgett, K.S., Malin, M.C., 2000. New views of Mars eolian activity, materials, and surfaceproperties: three vignettes from the Mars Global Surveyor Orbiter camera.J. Geophys. Res. 105, 1623–1650.
Edgett, K.S., Geissler, P., Herkenhoff, K., 1992. Mars: The composition of dunes and otherdark surficial material. LPSC XXIII [CDROM], Abstract # 327.
Feldman, W.C., Prettyman, T.H., Maurice, S., Plaut, J.J., Bish, D.L., Vaniman, D.T., Mellon,M.T., Metzger, A.E., Squyres, S.W., Karunatillake, S., Boynton, W.V., Elphic, R.C.,Funsten, H.O., Lawrence, D.J., Tokar, R.L., 2004. The global distribution of near-surface hydrogen on Mars. J. Geophys. Res. 109 (E9). doi:10.1029/2003JE002160.
Fenton, L.K., Mellon, M.T., 2006. Thermal properties of sand from Thermal EmissionSpectrometer (TES) and Thermal Emission Imaging System (THEMIS): spatialvariations within the Proctor Crater dune field on Mars. J. Geophys. Res. 111 (E06).doi:10.1029/2004JE002363.
Fenton, L.K., Bandfield, J.L., Ward, A.W., 2003. Aeolian processes in proctor crater onMars: sedimentary history as analyzed frommultiple data sets. J. Geophys. Res. 108(E12). doi:10.1029/JE002015.
Fryberger, S.G., Hesp, P., Hastings, K., 1992. Aeolian granule ripple deposits in Namibia.Sedimentology 39, 319–331.
Gay, S.P., 1962. Origen, distribucion y movimiento de las arenas eolicas en el area deYauca a Palpa. Bol. Soc. Geol. Peru 37, 37–58.
Greeley, R., Iversen, J., 1985. Wind as a Geologic Process on Earth, Mars, Venus and Titan.Cambridge University Press, Cambridge.
Greeley, R., Lancaster, N., Lee, S., Thomas, P., 1992. Martian aeolian processes, sedimentsand features. In: Kieffer, H.H., Jakosky, B.M., Snyder, C.W., Matthews, M.S. (Eds.),Mars. University of Arizona Press, Tuscon.
Greeley, R., Skypeck, A., Pollack, J.B., 1993. Martian aeolian features and deposits:comparisons with general circulation model results. J. Geophys. Res. 98 (E2),3183–3196.
Greeley, R., Squyres, S.W., Arvidson, R.E., 24 others, the Athena Science Team, 2004.Wind-related processes detected by the Spirit rover at Gusev crater, Mars. Science305, 810–821.
Greeley, R., Arvidson, R.E., Barlett,19 others, 2006. Gusev crater: wind-related features andprocesses observedby theMars Exploration Rover Spirit. J. Geophys. Res.111 (E02S09).doi:10.1029/2005JE002491.
Haberle, R.M., Murphy, J.R., Schaeffer, J., 2003. Orbital change experiments with a Marsgeneral circulation model. Icarus 161, 66–89.
Head, J.W., Mustard, J.F., Kreslavsky, M.A., Milliken, R.E., Marchant, D.R., 2003. Recent iceages on Mars. Nature 426, 797–802.
Hynek, B.M., Arvidson, R., Phillips, R.J., 2002. Geologic setting and origin of TerraMeridianihematite deposit on Mars. J. Geophys. Res. 107 (E10). doi:10.1029/2002JE001891.
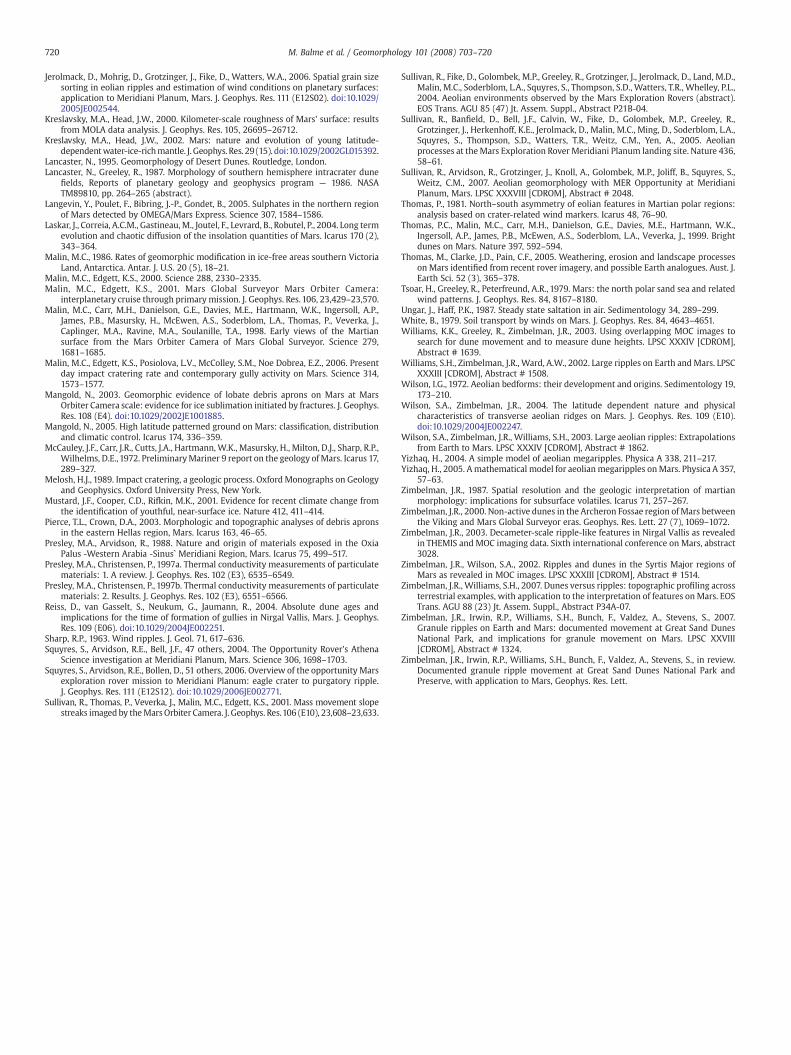
720 M. Balme et al. / Geomorphology 101 (2008) 703–720
Jerolmack, D., Mohrig, D., Grotzinger, J., Fike, D., Watters, W.A., 2006. Spatial grain sizesorting in eolian ripples and estimation of wind conditions on planetary surfaces:application to Meridiani Planum, Mars. J. Geophys. Res. 111 (E12S02). doi:10.1029/2005JE002544.
Kreslavsky, M.A., Head, J.W., 2000. Kilometer-scale roughness of Mars' surface: resultsfrom MOLA data analysis. J. Geophys. Res. 105, 26695–26712.
Kreslavsky, M.A., Head, J.W., 2002. Mars: nature and evolution of young latitude-dependentwater-ice-richmantle. J. Geophys. Res. 29 (15). doi:10.1029/2002GL015392.
Lancaster, N., 1995. Geomorphology of Desert Dunes. Routledge, London.Lancaster, N., Greeley, R., 1987. Morphology of southern hemisphere intracrater dune
fields, Reports of planetary geology and geophysics program — 1986. NASATM89810, pp. 264–265 (abstract).
Langevin, Y., Poulet, F., Bibring, J.-P., Gondet, B., 2005. Sulphates in the northern regionof Mars detected by OMEGA/Mars Express. Science 307, 1584–1586.
Laskar, J., Correia, A.C.M., Gastineau, M., Joutel, F., Levrard, B., Robutel, P., 2004. Long termevolution and chaotic diffusion of the insolation quantities of Mars. Icarus 170 (2),343–364.
Malin, M.C., 1986. Rates of geomorphic modification in ice-free areas southern VictoriaLand, Antarctica. Antar. J. U.S. 20 (5), 18–21.
Malin, M.C., Edgett, K.S., 2000. Science 288, 2330–2335.Malin, M.C., Edgett, K.S., 2001. Mars Global Surveyor Mars Orbiter Camera:
interplanetary cruise through primary mission. J. Geophys. Res. 106, 23,429–23,570.Malin, M.C., Carr, M.H., Danielson, G.E., Davies, M.E., Hartmann, W.K., Ingersoll, A.P.,
James, P.B., Masursky, H., McEwen, A.S., Soderblom, L.A., Thomas, P., Veverka, J.,Caplinger, M.A., Ravine, M.A., Soulanille, T.A., 1998. Early views of the Martiansurface from the Mars Orbiter Camera of Mars Global Surveyor. Science 279,1681–1685.
Malin, M.C., Edgett, K.S., Posiolova, L.V., McColley, S.M., Noe Dobrea, E.Z., 2006. Presentday impact cratering rate and contemporary gully activity on Mars. Science 314,1573–1577.
Mangold, N., 2003. Geomorphic evidence of lobate debris aprons on Mars at MarsOrbiter Camera scale: evidence for ice sublimation initiated by fractures. J. Geophys.Res. 108 (E4). doi:10.1029/2002JE1001885.
Mangold, N., 2005. High latitude patterned ground on Mars: classification, distributionand climatic control. Icarus 174, 336–359.
McCauley, J.F., Carr, J.R., Cutts, J.A., Hartmann, W.K., Masursky, H., Milton, D.J., Sharp, R.P.,Wilhelms, D.E., 1972. PreliminaryMariner 9 report on the geology ofMars. Icarus 17,289–327.
Melosh, H.J., 1989. Impact cratering, a geologic process. Oxford Monographs on Geologyand Geophysics. Oxford University Press, New York.
Mustard, J.F., Cooper, C.D., Rifkin, M.K., 2001. Evidence for recent climate change fromthe identification of youthful, near-surface ice. Nature 412, 411–414.
Pierce, T.L., Crown, D.A., 2003. Morphologic and topographic analyses of debris apronsin the eastern Hellas region, Mars. Icarus 163, 46–65.
Presley, M.A., Arvidson, R., 1988. Nature and origin of materials exposed in the OxiaPalus -Western Arabia -Sinus` Meridiani Region, Mars. Icarus 75, 499–517.
Presley, M.A., Christensen, P., 1997a. Thermal conductivity measurements of particulatematerials: 1. A review. J. Geophys. Res. 102 (E3), 6535–6549.
Presley, M.A., Christensen, P., 1997b. Thermal conductivity measurements of particulatematerials: 2. Results. J. Geophys. Res. 102 (E3), 6551–6566.
Reiss, D., van Gasselt, S., Neukum, G., Jaumann, R., 2004. Absolute dune ages andimplications for the time of formation of gullies in Nirgal Vallis, Mars. J. Geophys.Res. 109 (E06). doi:10.1029/2004JE002251.
Sharp, R.P., 1963. Wind ripples. J. Geol. 71, 617–636.Squyres, S., Arvidson, R.E., Bell, J.F., 47 others, 2004. The Opportunity Rover's Athena
Science investigation at Meridiani Planum, Mars. Science 306, 1698–1703.Squyres, S., Arvidson, R.E., Bollen, D., 51 others, 2006. Overview of the opportunity Mars
exploration rover mission to Meridiani Planum: eagle crater to purgatory ripple.J. Geophys. Res. 111 (E12S12). doi:10.1029/2006JE002771.
Sullivan, R., Thomas, P., Veverka, J., Malin, M.C., Edgett, K.S., 2001. Mass movement slopestreaks imaged by theMarsOrbiter Camera. J. Geophys. Res.106 (E10), 23,608–23,633.
Sullivan, R., Fike, D., Golombek, M.P., Greeley, R., Grotzinger, J., Jerolmack, D., Land, M.D.,Malin, M.C., Soderblom, L.A., Squyres, S., Thompson, S.D., Watters, T.R., Whelley, P.L.,2004. Aeolian environments observed by the Mars Exploration Rovers (abstract).EOS Trans. AGU 85 (47) Jt. Assem. Suppl., Abstract P21B-04.
Sullivan, R., Banfield, D., Bell, J.F., Calvin, W., Fike, D., Golombek, M.P., Greeley, R.,Grotzinger, J., Herkenhoff, K.E., Jerolmack, D., Malin, M.C., Ming, D., Soderblom, L.A.,Squyres, S., Thompson, S.D., Watters, T.R., Weitz, C.M., Yen, A., 2005. Aeolianprocesses at theMars Exploration Rover Meridiani Planum landing site. Nature 436,58–61.
Sullivan, R., Arvidson, R., Grotzinger, J., Knoll, A., Golombek, M.P., Joliff, B., Squyres, S.,Weitz, C.M., 2007. Aeolian geomorphology with MER Opportunity at MeridianiPlanum, Mars. LPSC XXXVIII [CDROM], Abstract # 2048.
Thomas, P., 1981. North–south asymmetry of eolian features in Martian polar regions:analysis based on crater-related wind markers. Icarus 48, 76–90.
Thomas, P.C., Malin, M.C., Carr, M.H., Danielson, G.E., Davies, M.E., Hartmann, W.K.,Ingersoll, A.P., James, P.B., McEwen, A.S., Soderblom, L.A., Veverka, J., 1999. Brightdunes on Mars. Nature 397, 592–594.
Thomas, M., Clarke, J.D., Pain, C.F., 2005. Weathering, erosion and landscape processeson Mars identified from recent rover imagery, and possible Earth analogues. Aust. J.Earth Sci. 52 (3), 365–378.
Tsoar, H., Greeley, R., Peterfreund, A.R., 1979. Mars: the north polar sand sea and relatedwind patterns. J. Geophys. Res. 84, 8167–8180.
Ungar, J., Haff, P.K., 1987. Steady state saltation in air. Sedimentology 34, 289–299.White, B., 1979. Soil transport by winds on Mars. J. Geophys. Res. 84, 4643–4651.Williams, K.K., Greeley, R., Zimbelman, J.R., 2003. Using overlapping MOC images to
search for dune movement and to measure dune heights. LPSC XXXIV [CDROM],Abstract # 1639.
Williams, S.H., Zimbelman, J.R., Ward, A.W., 2002. Large ripples on Earth andMars. LPSCXXXIII [CDROM], Abstract # 1508.
Wilson, I.G., 1972. Aeolian bedforms: their development and origins. Sedimentology 19,173–210.
Wilson, S.A., Zimbelman, J.R., 2004. The latitude dependent nature and physicalcharacteristics of transverse aeolian ridges on Mars. J. Geophys. Res. 109 (E10).doi:10.1029/2004JE002247.
Wilson, S.A., Zimbelman, J.R., Williams, S.H., 2003. Large aeolian ripples: Extrapolationsfrom Earth to Mars. LPSC XXXIV [CDROM], Abstract # 1862.
Yizhaq, H., 2004. A simple model of aeolian megaripples. Physica A 338, 211–217.Yizhaq, H., 2005. Amathematical model for aeolian megaripples onMars. Physica A 357,
57–63.Zimbelman, J.R., 1987. Spatial resolution and the geologic interpretation of martian
morphology: implications for subsurface volatiles. Icarus 71, 257–267.Zimbelman, J.R., 2000. Non-active dunes in the Archeron Fossae region ofMars between
the Viking and Mars Global Surveyor eras. Geophys. Res. Lett. 27 (7), 1069–1072.Zimbelman, J.R., 2003. Decameter-scale ripple-like features in Nirgal Vallis as revealed
in THEMIS and MOC imaging data. Sixth international conference on Mars, abstract3028.
Zimbelman, J.R., Wilson, S.A., 2002. Ripples and dunes in the Syrtis Major regions ofMars as revealed in MOC images. LPSC XXXIII [CDROM], Abstract # 1514.
Zimbelman, J.R., Williams, S.H., 2007. Dunes versus ripples: topographic profiling acrossterrestrial examples, with application to the interpretation of features onMars. EOSTrans. AGU 88 (23) Jt. Assem. Suppl., Abstract P34A-07.
Zimbelman, J.R., Irwin, R.P., Williams, S.H., Bunch, F., Valdez, A., Stevens, S., 2007.Granule ripples on Earth and Mars: documented movement at Great Sand DunesNational Park, and implications for granule movement on Mars. LPSC XXVIII[CDROM], Abstract # 1324.
Zimbelman, J.R., Irwin, R.P., Williams, S.H., Bunch, F., Valdez, A., Stevens, S., in review.Documented granule ripple movement at Great Sand Dunes National Park andPreserve, with application to Mars, Geophys. Res. Lett.