geomorphology and soils of sipaliwini · pdf filerelatie tussen de geomorfologie en de...
TRANSCRIPT

GEOMORPHOLOGY AND SOILS OFSIPALIWINI SAVANNA(SOUTH SURINAME)
H.Th. RIEZEBOS
GEOMORPHOLOGY AND SOILS OFSIPALIWINI SAVANNA(SOUTH SURINAME)
Scanned from original by ISRIC - World Soil Information, as ICSUWorld Data Centre for Soils. The purpose is to make a safedepository for endangered documents and to make the accruedinformation available for consultation, following Fair UseGuidelines. Every effort is taken to respect Copyright of thematerials within the archives where the identification of theCopyright holder is clear and, where feasible, to contact theoriginators. For questions please contact [email protected] the item reference number concerned.
ISW

ISBN 90 6266 014 2 Utrechtse Geografische Studies 12ISBN 90 6266 015 0 thesis
All rights reserved. No part of this publicationmay be reproduced in any form, by print, photoprint,microfilm or any other means, without writtenpermission from the publisher.
GEOMORPHOLOGY AND SOILS OFSIPALIWINI SAVANNA(SOUTH SURINAME)
PROEFSCHRIFT
TER VERKRUGING VAN DE GRAAD VAN DOCTOR IN
DE WISKUNDE EN NATUURWETENSCHAPPEN AAN DE
RIJKSUNIVERSITEIT TE UTRECHT, OP GEZAG VAN DE
RECTOR MAGNIFICUS PROF. DR. A. VERHOEFF,
VOLGENS BESLUIT VAN HET COLLEGE VAN DECANEN
IN HET OPENBAAR TE VERDEDIGEN OP DONDERDAG
17 MEI 1979 DES NAMIDDAGS TE 4.15 UUR
DOOR
HANS THEO RIEZEBOS
GEBOREN OP 5 JANUARI 1943
te AMSTERDAM
DRUKKERIJ ELINKWIJK BV - UTRECHT
PROMOTORES : Prof. Dr. J.I.S. ZONNEVELD
Prof. Dr.Ir.F.R.MOORMANN
AAN MIJN OUDERS
VOOR MADELEINE
TABLE OF CONTENTS
Page
SUMMARYSAMENVATTING
PREFACE
CHAPTER I
CHAPTER IIII. 1II.2II.3II.4II.5II.6
CHAPTER IIIIII. 1III.2III.3
III.4
CHAPTER IVIV. 1IV.2IV.3
IV.4IV. 5
THE SAVANNA PROBLEM AND SIPALIWINISAVANNA
ENVIRONMENTAL CONDITIONSCLIMATE AND PALEOCLIMATEGEOLOGYOUTLINE OF GEOMORPHOLOGYSOILSVEGETATIONSUMMARY AND CONCLUSIONS
GEOMORPHOLOGYPHYSIOGRAPHYGENESISPRESENT-DAY GEOMORPHOLOGICALPROCESSES
RIVERSAND VALLEYFLOORSMASS MOVEMENTSURFACE WASH
EXPERIMENTAL SITESMETHODSRAINFALL CHARACTERISTICSRESULTSINTERPRETATION
SUMMARY AND CONCLUSIONS
SOILSREPRESENTATIVE SOILSCLASSIFICATION (USDA, 1975)STATISTICAL ANALYSIS
RESULTS OF FACTOR ANALYSISINTERPRETA TION
SOIL MICROMORPHOLOGYSUMMARY AND CONCLUSIONS
23
4
5
13141821232529
313137
49505355575759606467
697076869093
102106

Page
CHAPTER V LANDSCAPE DEVELOPMENT 109
ACKNOWLEDGEMENTS . 117
REFERENCES 119
APPENDIX I METHODS 124
APPENDIX II SOIL DESCRIPTIONS AND ANALYTICALDATA 127
CURRICULUM VITAE 168
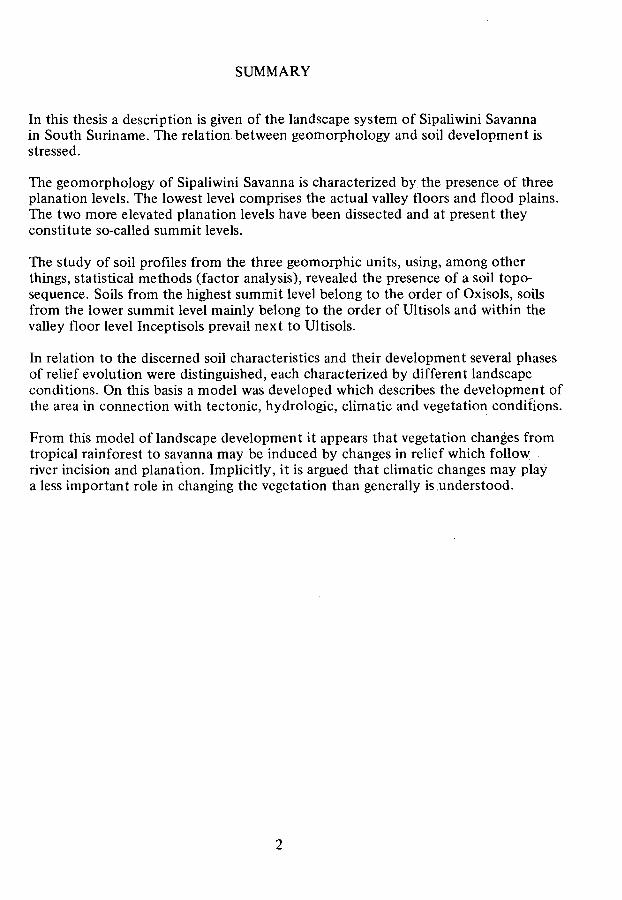
SUMMARY
In this thesis a description is given of the landscape system of Sipaliwini Savannain South Suriname. The relation between geomorphology and soil development isstressed.
The geomorphology of Sipaliwini Savanna is characterized by the presence of threeplanation levels. The lowest level comprises the actual valley floors and flood plains.The two more elevated planation levels have been dissected and at present theyconstitute so-called summit levels.
The study of soil profiles from the three geomorphic units, using, among otherthings, statistical methods (factor analysis), revealed the presence of a soil topo-sequence. Soils from the highest summit level belong to the order of Oxisols, soilsfrom the lower summit level mainly belong to the order of Ultisols and within thevalley floor level Inceptisols prevail next to Ultisols.
In relation to the discerned soil characteristics and their development several phasesof relief evolution were distinguished, each characterized by different landscapeconditions. On this basis a model was developed which describes the development ofthe area in connection with tectonic, hydrologie, climatic and vegetation conditions.
From this model of landscape development it appears that vegetation changes fromtropical rainforest to savanna may be induced by changes in relief which followriver incision and planation. Implicitly, it is argued that climatic changes may playa less important role in changing the vegetation than generally is understood.
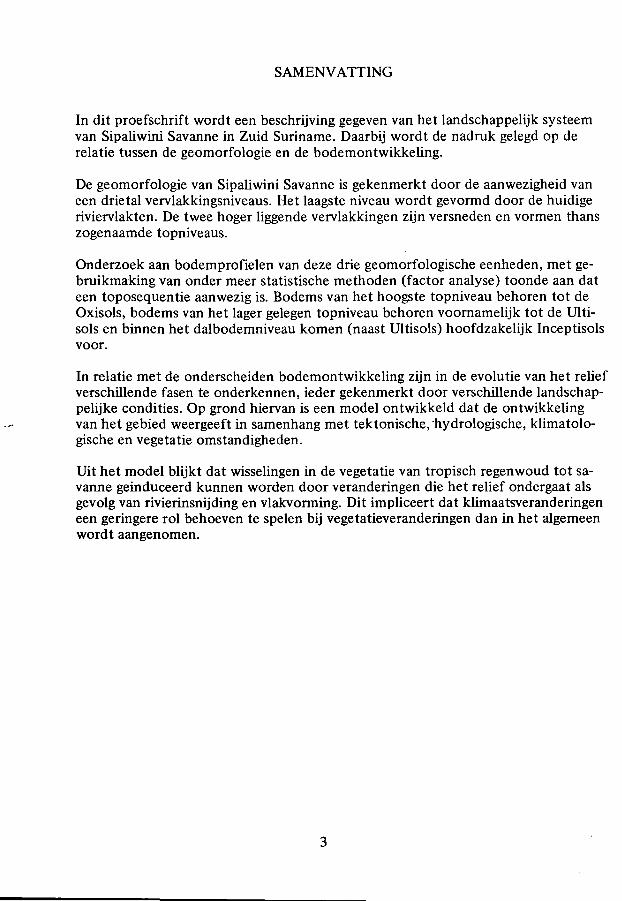
SAMENVATTING
In dit proefschrift wordt een beschrijving gegeven van het landschappelijk systeemvan Sipaliwini Savanne in Zuid Suriname. Daarbij wordt de nadruk gelegd op derelatie tussen de geomorfologie en de bodemontwikkeling.
De geomorfologie van Sipaliwini Savanne is gekenmerkt door de aanwezigheid vaneen drietal vervlakkingsniveaus. Het laagste niveau wordt gevormd door de huidigeriviervlakten. De twee hoger liggende vervlakkingen zijn versneden en vormen thanszogenaamde topniveaus.
Onderzoek aan bodemprofielen van deze drie geomorfologische eenheden, met ge-bruikmaking van onder meer statistische methoden (factor analyse) toonde aan dateen toposequentie aanwezig is. Bodems van het hoogste topniveau behoren tot deOxisols, bodems van het lager gelegen topniveau behoren voornamelijk tot de Ulti-sols en binnen het dalbodemniveau komen (naast Ultisols) hoofdzakelijk Inceptisolsvoor.
In relatie met de onderscheiden bodemontwikkeling zijn in de evolutie van het reliefverschillende fasen te onderkennen, ieder gekenmerkt door verschillende landschap-pelijke condities. Op grond hiervan is een model ontwikkeld dat de ontwikkelingvan het gebied weergeeft in samenhang met tektonische, hydrologische, klimatolo-gische en vegetatie omstandigheden.
Uit het model blijkt dat wisselingen in de vegetatie van tropisch regenwoud tot sa-vanne geinduceerd kunnen worden door veranderingen die het relief ondergaat alsgevolg van rivierinsnijding en vlakvorming. Dit impliceert dat klimaatsveranderingeneen geringere rol behoeven te spelen bij vegetatieveranderingen dan in het algemeenwordt aangenomen.

PREFACE
This publication is part of the outcome of geomorphological and pedologicalinvestigations in the Upper Sipaliwini drainage basin, a savanna area in S. Suriname.Fieldwork was done during two expeditions, financed by the Netherlands Founda-tion for the Advancement of Tropical Research (WOTRO), in co-operation withbotanists of the Institute of Systematic Botany (Utrecht University) and with theaid of the Surinam Department of Forestry.
The area in which Sipaliwini savanna is situated was explored for the first time in1907. The Tumac Humac expedition discovered the nearby small Apikollo savanna( DEGOEJE, 1908) which is now generally known as Palaime savanna.In 1928 the Brazilian expedition of General Rondon reached the source of theWest Paru River which flows only 10-20 km East of the Sipaliwini savanna (DESAMPAIO, 1933).In 1935-1936 the expedition of Van Lynden visited Sipaliwini savanna itself fora period of some months in order to establish and map the Upper Sipaliwini water-divide which forms the border between Suriname and Brazil (VAN LYNDEN, 1939).In 1942 'Baas Schmidt' visited Sipaliwini savanna and followed Amerindian trailsbetween villages on both sides of the Sipaliwini-Paru waterdivide (SCHMIDT, 1942).After the construction of the Sipaliwini-airstrip only short visits to the Sipaliwinisavanna were made by DOST (1962), VAN DER LINGEN (1964), VAN DONSELAAR (1968,1969) and BROOK (1968) until our expedition arrived at Sipaliwini airstrip in 1968.After 1969 two short expeditions by members of our team took place in 1970 and1972.
Fieldstudies in uninhabited, remote areas like Sipaliwini savanna, without roads,bridges or other comfortable provisions are seriously handicapped by problems oflogistics which are time-consuming and restrictive as far as the amounts of equipment,instruments and, last but not least, food are concerned. Most of the problems thatarose could however be solved with the aid of experienced members of the SurinameForest Service. Furthermore, the available aerial photographs (scale 1 : 40.000),photomosaics and topographical maps (1 : 100.000 and 1 : 20.000) proved to bevaluable and indispensable tools.
CHAPTER I
THE SAVANNA PROBLEM AND SIPALIWINI SAVANNA
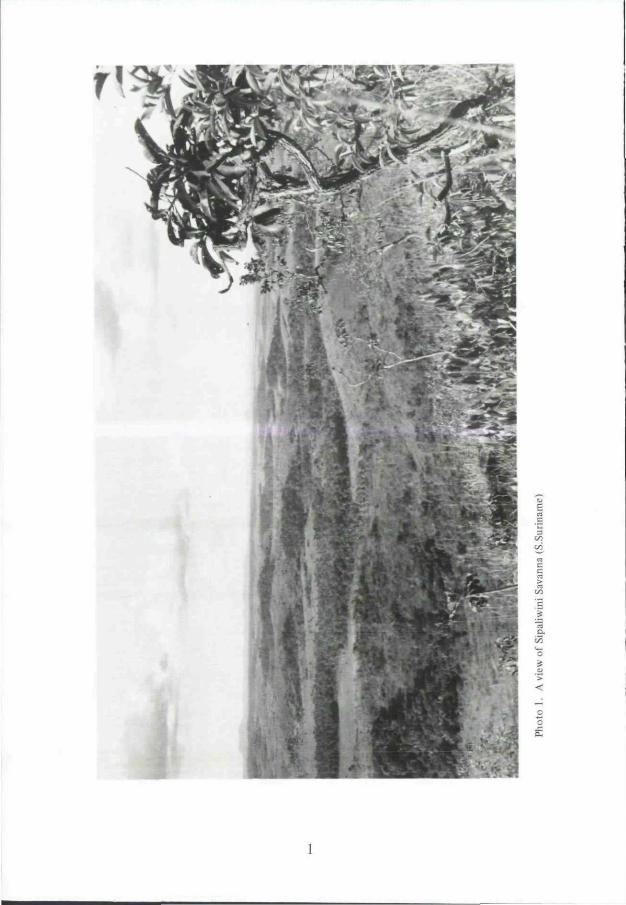
The word 'savanna' is derived from an old Amerindian word. Originally it wasused by OVIEDO in 1535 to describe 'land which is without trees but with muchgrass either tall or short' (COLE, 1960). Recent concepts of savanna vegetationcomprise a variety of physiognomic characteristics and floristic units, occurringunder different conditions of climate, soil, geomorphology and anthropogenicinterference, BEARD (1953) defined savanna as 'a plant formation of tropicalAmerica comprising a virtually continuous ecologically dominant stratum ofmore or less xeromorphic herbs of which grasses and sedges are the principalcomponents, with scattered shrubs, trees or palms sometimes present'.VAN DONSELAAR (1965) left the geographical restriction out of his definition andadded to BEARD'S definition the possible occurrence of trees and shrubs forminga continuous layer or isolated groups. Other definitions, though comparable,have been given by SCHIMPER (1903), LANJOUW (1936), DANSEREAU (1957),HEYLIGERS (1963) and WALTER (1971). Until now, however, none of thedefinitions proposed comprise all types of vegetation which are, in a generalconcept, considered as 'savanna vegetation' (photo 1).
For the Sipaliwini savanna andtthis study a definition is introduced here, being:'savanna is a vegetation formation-type occurring under a tropical climate,characterised by an ecologically dominant, more or less xeromorphic herbaceousgroundlayer with woody plants in various densities and heights'.
A tropical climate is a climate under which the mean temperature of the coldestmonth exceeds 18°C. The concept of ecological dominancy is more difficult tohandle. According to ODUM (1971) species or groups of species may be con-sidered as ecologically dominant when they largely control the energy flow andstrongly affect the environment of all other species. As to the savannavegetation-groundlayer, it is more pragmatic to consider the ecological dominancyas a concept describing a situation in which, by competition under given environ-mental conditions, herbs with more or less xeromorphic characteristics haveacquired a dominant occurrence. The xeromorphic character of the vegetation-groundlayer is represented by structural features which provide resistance todrought.
On the basis of the definition given above, the Upper Sipaliwini drainage basinmay be described as a landscape, dominated by savanna vegetation. In this senseit is called a savanna landscape. It is necessary to make a clear distinctionbetween a 'savanna', indicating a vegetation formation-type, and a 'savannalandscape', describing a landscape which is dominated by that vegetation.
The term savanna will be used in this study to the vegetation as defined, unlessotherwise indicated.
Landscape we define here as a system of interacting biotic and a-biotic compo-nents, forming a recognizable entity at the earth's surface. From this definitionit follows that a landscape represents an ecological system, the physiognomy ofwhich reflects the internal structure and dynamics. Variations in physiognomy,which is dominated by vegetation and relief, represent differences in structureand dynamics of the underlying ecosystem.
Within the Sipaliwini savanna landscape several savanna vegetation formationsmay be recognized (apart from other formations like e.g. forest islands, swampcommunities and gallery forest). Thus, within the savanna landscape, severalecosystems may be distinguished. This differentiation in ecosystems is by fargreater than the definition of savanna suggests. In other words, there are manydifferent ecosystems with a physiognomy that fits into the savanna definition.The constituting elements of these ecosystems may be grouped at different levelsof organization. In this way it is generally possible to establish a hierarchy oforganization and to distinguish ecological subsystems, represented by variationsin vegetation- and relief-physiognomy. They form the basis of physiographicalunits that constitute the landscape of Sipaliwini savanna.
The main problem that arises out of the presence of savanna vegetation, thesavanna problem, may be summarized in the question, as asked by SARMIENTO &MONASTERio (1975): '.... if rain forests occur under wet tropical conditions anddry deciduous and thorn forests under drier environments, why do grass- andherb-dominated formations appear in the middle of this water gradient?'According to HILLS (1965), theories and explanations on the occurrence ofsavanna vegetation fall into four categories: climatic, edaphic, geomorphic andanthropic.
The interpretation of savannas based on the presence of a climate with alter-nating wet and dry seasons, has been postulated as early as 1872 by Grisebach.Later SCHIMPER (1903), WARMING (1892, cited in Goodland, 1970), MYERS (1936),JAEGER (1945), LAUER (1952) and TROLL (1956) emphasized the significance ofthe alternation of a large water surplus during the rainy season and a water deficitprevailing in the dry season, KOPPEN (1918, 1931) called the tropical wet and dryclimate 'savanna climate' (Aw) and, in doing so, suggested that this climate isassociated with areas of savanna vegetation. As a consequence, advocates of theclimatic interpretation consider savanna vegetation as a formation which is bestadjusted to alternating wet and dry climatic conditions.
Although it can not be denied that climate affects the character of vegetation- in fact, extensive areas with an Aw-climate are covered with savanna vegetation -
many studies have shown that there is no climate that automatically causes thedevelopment of savanna ( EYRE , 1968). Savannas occur under other tropicalclimates than Aw as well, whereas under Aw-climates other vegetation formationsthan savanna occur.
Soil and regolith characteristics, or edaphic factors, which in some savanna inter-pretations are considered to be determinants for savanna, are drainage properties,water retention capacity and fertility. The occurrence of savanna has beenattributed to alternating conditions of excessively wet and desiccated soils byWAIBEL(1948), BEARD (1953) and WALTER (1971). In general, this alternation mayoccur under alternating wet and dry climates in soils with impeded drainage, forinstance in valleys and floodplains where in the wet season even the upper partof the soil has anaerobic conditions, while during the dry season these horizonsdesiccate. Permeable soils may suffer from wet and dry alternation in cases wheresoil moisture conditions do not only depend on precipitation, but also on afluctuating groundwater table. The contrast in soil moisture conditions is thoughtto prevent the germination and development of most species of tree ( EYRE, 1968).TRiCART (1965) refers to another edaphic savanna interpretation in which theoperative factor is an excessively dry soil. This may occur when the texture ofthe soil results in a very low water retention capacity such as in sand or gravel.Whenever such conditions prevail, the vegetation will suffer a water deficitduring dry seasons and even under rainy climates physiological drought mayoften occur. However, there are areas having alternating soil moisture conditionsas described above without having savanna vegetation. On the other hand thereare areas without such conditions, still covered by savanna. It seems thereforenot justified to look upon these edaphic factors as sole determinants forsavanna.
Several authors pointed to very low nutrient supplies of soils under savannas,either as a result of poor parent material or as a result of severe leaching.Because of this low natural fertility forest growth would be hampered, LANJOUW(1936), WAIBEL (1948) and HEYLIGERS (1963) assume that originally poor orimpoverished soils cannot maintain forest, in which case savanna takes over.SOMBROEK (1966), however, states that low natural fertility can be ruled out ascause of savanna since all forested soils have a very low base saturation and evensoils with extremely low cation exchange capacities often have a forest cover.Furthermore, SOMBROEK ( 1966) points out that 'the closed nutrient cycle of thetropical forest coverage, once established, does not apparently depend uponfertility of the soil'. Whenever nutrient levels are observed, which are lowerunder savanna than under forest, the lower fertility may rather be a result ofsavanna than a cause (HILLS, 1969). In relation to soil impoverishment twoother factors must be mentioned: fire and soil erosion. Fire, apart from actingas a selective filter through which only fire-resistant or fire-tolerant speciespass, may add to the accumulation of mineral elements at the soil surface after

Note that p.B and p.10
have been interchanged

components are in a stable equilibrium. In maintaining such an ecosystem, the in-teracting and interdépendant components of the system must be kept constant intheir behaviour and their relative values must remain between certain limits. In asomewhat cryptyc way it may be said that the components all 'point in the samedirection'. Thus, there is no primacy of the system components. The problem arisesnow whether the physiognomy of the ecosystem, viz. the savanna vegetation, iscompletely representative for the underlying system, in which case the stable equi-librium between the system components exists. On the other hand it is possible toimagine that most components have already changed whereas others have not. Inthat case a discrepancy exists between physiognomy and system, a desequilibrium.The system components that prevent an adjustment and maintain the savannavegetation may then be considered determinants and a primacy of factors may bepostulated. A lot of misunderstanding around the savanna problem is due to thefact that no clear distinction is made between the approach of the problemregarding its origin. As to the origin, it may be stated in general terms, that theorigin of a savanna ecosystem is the result of an alteration of another ecosystem.The system component that initially changed, or rather the agent that forced itto change, may be considered the determinant of the savanna origin. The sequenceand magnitude of the changes in other components, induced by the change of thefirst one, provide the possibility to establish a sequence of primacies. So, thesavanna problem is split up into the problem of the origin of an ecosystem witha savanna physiognomy and the problem of maintainance of such an ecosystem.In partial contradiction to HILLS' statement (1969) it is argued that, in using theecosystem as a basic concept, it'is only invalid to postulate a primacy of factorsdetermining savanna in the case of maintainance of a savanna ecosystem which isin a stable equilibrium. In other cases of maintainance and in relation to the originof savanna ecosystems the postulation of a primacy of determinant factors isconsidered valid.
Based on the considerations given above, we may now evaluate the savannaproblem in more detail and give an account of the aims of this study. Savannavegetation, as defined, is considered to be the dominant part of the physiognomyof an ecosystem of which it is at the same time a relatively fast reacting compo-nent. The relation between vegetation and other, a-biotic ecosystem componentsmay be described in three ways:
- the vegetation, being part of the system physiognomy, may reflect the structureand dynamics of the ecosystem in which case the vegetation may be consideredas an ecological climax
- the vegetation may not be in equilibrium with the underlying ecosystem whilesome system component or components prevent an adjustment to take place
- the savanna vegetation forms a phase in a succesion of vegetations.
Whatever be the case may result from a description and analysis of actual compo-
nents and a comparison with the outcome of research into the conditions that haveled to the present system. The analysis of the actual vegetation component in theSipaliwini area was performed by botanists (OLDENBURGER & NORDE, in prep.), where-as investigations on a-biotic system components by the present author are focussedon geomorphology and soils.
The a-biotic system components may be arranged in different ways, SARMIENTO& MONASTERio (1975) discriminate between three main types of savanna eco-systems, two of which occur under tropical wet and dry climates and the thirdmay be present under everwet tropical climates:
1. under wet and dry climates and good drainage conditions a seasonal savannaecosystem occurs on soils with a low water retaining capacity in the upperhorizons. Whenever drainage is less adequate or the water retaining capacityof the soils is higher and the fertility of the soils is at medium levels, drydeciduous forest is present
2. a hyperseasonal savanna ecosystem is found when waterlogging and waterdeficiency alternate during the year. Generally this is the case on imperfectlydrained, fine-textured soils
3. in everwet tropical regions a non-seasonal savanna ecosystem may be main-tained where soils are excessively drained and have a low mineral status. Thepermanence of this system depends on the frequency of fires.
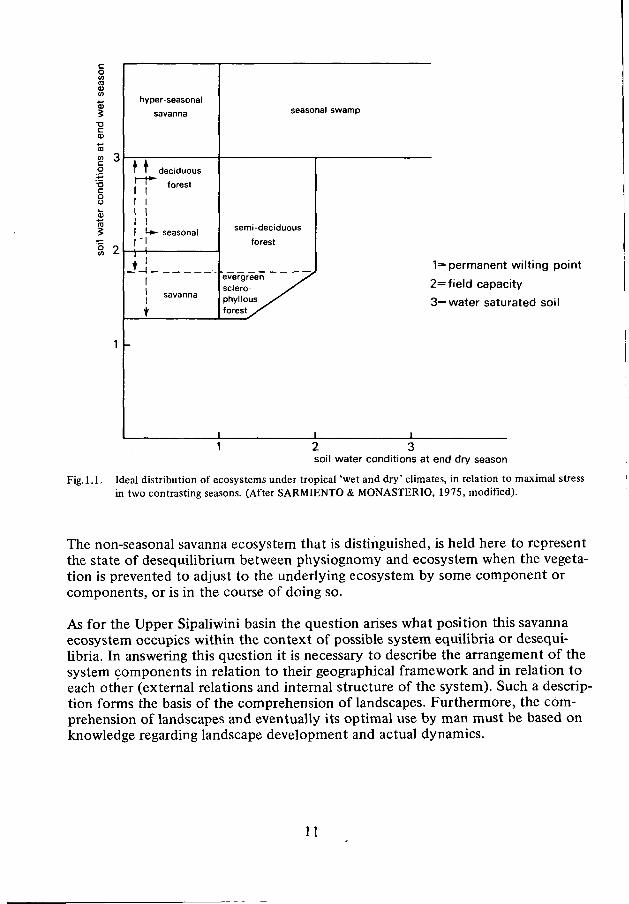
It is hypothesized implicitly by SARMIENTO & MONASTERIO (1975), and this hypoth-esis is adopted here, that in the first two cases the origin of the savanna ecosystemis determined by alternating wet and dry soil water conditions. It is realized thatthis forms a rigourous simplification of reality. However, in reducing the ecologi-cal complexity to soil water conditions, SARMIENTO & MONASTERIO (1975) were ableto present a graph in which the distribution of different types of ecosystems undertropical wet and dry climates is given. One axis of this diagram renders the soilmoisture conditions in the most unfavourable period of the year, the other axisreflects soil water conditions at the wettest point of the year. Apart from thesavanna ecosystems ( 1 ) and (2) SARMIENTO & MONASTERIO (1975) describe sixother ecosystems in relation to soil moisture conditions.
From fig. 1.1 may be seen that the occurrence of a seasonal savanna ecosystem isrelated to moisture conditions below the permanent wilting point at the end ofthe dry season and conditions wetter than the permanent wilting point up towater-saturation at the end of the wet season. Conditions below the permanentwilting point at the end of the dry season and water-saturated soil at the end ofthe wet season would result in the presence of a hyperseasonal savanna ecosystem.Both savanna ecosystems are provisionally considered to represent the case,pictured above, in which the vegetation is in equilibrium with the underlyingecosystem.
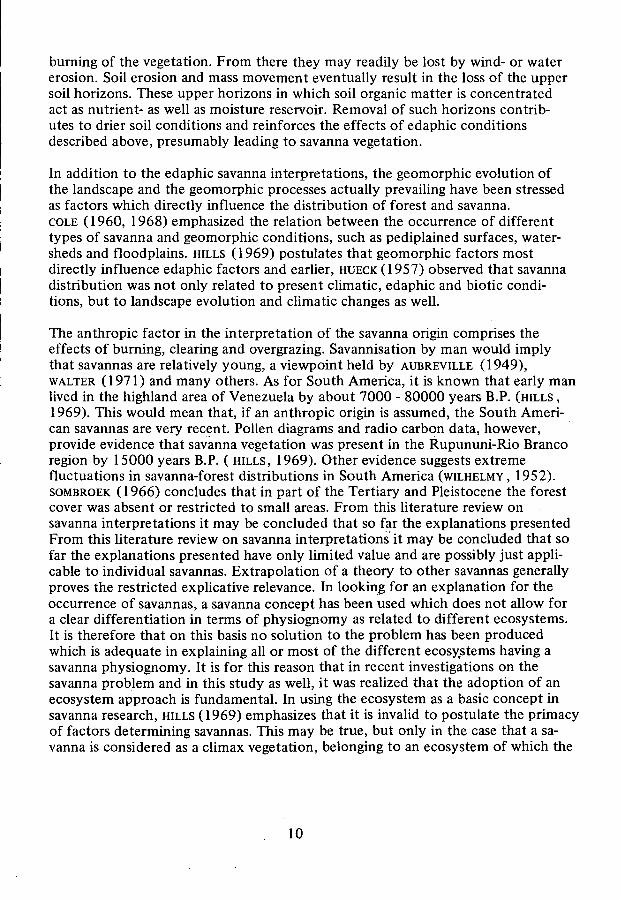
burning of the vegetation. From there they may readily be lost by wind- or watererosion. Soil erosion and mass movement eventually result in the loss of the uppersoil horizons. These upper horizons in which soil organic matter is concentratedact as nutrient- as well as moisture reservoir. Removal of such horizons contrib-utes to drier soil conditions and reinforces the effects of edaphic conditionsdescribed above, presumably leading to savanna vegetation.
In addition to the edaphic savanna interpretations, the geomorphic evolution ofthe landscape and the geomorphic processes actually prevailing have been stressedas factors which directly influence the distribution of forest and savanna.COLE (1960, 1968) emphasized the relation between the occurrence of differenttypes of savanna and geomorphic conditions, such as pediplained surfaces, water-sheds and floodplains. HILLS (1969) postulates that geomorphic factors mostdirectly influence edaphic factors and earlier, HUECK(1957) observed that savannadistribution was not only related to present climatic, edaphic and biotic condi-tions, but to landscape evolution and climatic changes as well.
The anthropic factor in the interpretation of the savanna origin comprises theeffects of burning, clearing and overgrazing. Savannisation by man would implythat savannas are relatively young, a viewpoint held by AUBREVILLE (1949),WALTER (1971) and many others. As for South America, it is known that early manlived in the highland area of Venezuela by about 7000 - 80000 years B.P. (HILLS ,1969). This would mean that, if an anthropic origin is assumed, the South Ameri-can savannas are very recent. Pollen diagrams and radio carbon data, however,provide evidence that savanna vegetation was present in the Rupununi-Rio Brancoregion by 15000 years B.P. ( HILLS, 1969). Other evidence suggests extremefluctuations in savanna-forest distributions in South America (WILHELMY , 1952).SOMBROEK (1966) concludes that in part of the Tertiary and Pleistocene the forestcover was absent or restricted to small areas. From this literature review onsavanna interpretations it may be concluded that so far the explanations presentedFrom this literature review on savanna interpretations it may be concluded that sofar the explanations presented have only limited value and are possibly just appli-cable to individual savannas. Extrapolation of a theory to other savannas generallyproves the restricted explicative relevance. In looking for an explanation for theoccurrence of savannas, a savanna concept has been used which does not allow fora clear differentiation in terms of physiognomy as related to different ecosystems.It is therefore that on this basis no solution to the problem has been producedwhich is adequate in explaining all or most of the different ecosystems having asavanna physiognomy. It is for this reason that in recent investigations on thesavanna problem and in this study as well, it was realized that the adoption of anecosystem approach is fundamental. In using the ecosystem as a basic concept insavanna research, HILLS ( 1969) emphasizes that it is invalid to postulate the primacyof factors determining savannas. This may be true, but only in the case that a sa-vanna is considered as a climax vegetation, belonging to an ecosystem of which the
10
T3C
•ocoo
Fig.1.1.
hyper-seasonalsavanna
deciduous
forest
seasonal
seasonal swamp
semi-deciduous
forest
evergreensclero-phyllousforest
1= permanent wilting point
2= field capacity
3= water saturated soil
1 2 3soil water conditions at end dry season
Ideal distribution of ecosystems under tropical 'wet and dry' climates, in relation to maximal stressin two contrasting seasons. (After SARMIENTO & MONASTERIO, 1975, modified).
The non-seasonal savanna ecosystem that is distinguished, is held here to representthe state of desequilibrium between physiognomy and ecosystem when the vegeta-tion is prevented to adjust to the underlying ecosystem by some component orcomponents, or is in the course of doing so.
As for the Upper Sipaliwini basin the question arises what position this savannaecosystem occupies within the context of possible system equilibria or desequi-libria. In answering this question it is necessary to describe the arrangement of thesystem components in relation to their geographical framework and in relation toeach other (external relations and internal structure of the system). Such a descrip-tion forms the basis of the comprehension of landscapes. Furthermore, the com-prehension of landscapes and eventually its optimal use by man must be based onknowledge regarding landscape development and actual dynamics.
11

One of the main entrances for acquiring such knowledge is geomorphology. Thegeomorphological properties of landscapes contain much information on the waythey were formed. Part of the landscape forming processes may be deduced fromthis (past ecosystem dynamics). Pedology is another main source of informationon landscape evolution. Moreover, soil properties, together with present-daygeomorphological processes, reflect the actual dynamics of the landscape systemwhich comprise the elements that determine the maintainance of the savanna.
Landscape was defined primarily as a system of interacting a-biotic componentsand it was noticed that this functional system has a physiognomy which reflectsthe internal structure and dynamics of this system. As a system function is lesseasily conceived, landscape studies in geomorphology and pedology commonlyare based on analysis of physiography which is part of the physiognomy.
Physiography is a much abused concept which is here defined as the descriptionof physical characteristics of landscapes, like the topographical (relief) propertiesas well as the biotic elements (i.e. vegetation). These latter elements are indispens-able, fast reacting indicators of the internal structure and dynamics of the land-scape system.
The problems mentioned above were the main concern of this study and may besummarized as:
1. What is the position of Sipaliwini savanna in the geographical framework(external relations of the landscape system) and what is the character of andthe relation between the a-biotic system components (internal structure ofthe system).
2. Under what conditions has the present landscape system been developed(genesis) and which conditions actually determine the maintainance of thesavanna (dynamics of the system).
3. What is the relation between genesis, structure and dynamics of the system.
The external relations and internal structure of the Upper Sipaliwini basin will bedescribed in Chapter II.In Chapters III and IV the problem of landscape evolution, as deduced fromgeomorphology and pedology, is raised whereas simultaneously the past andpresent dynamics of the system are discussed.In Chapter V an attempt is made to describe the landscape development of Sipa-liwini savanna in relation to past and present environmental conditions anddynamics.
12
CHAPTER II
ENVIRONMENTAL CONDITIONS
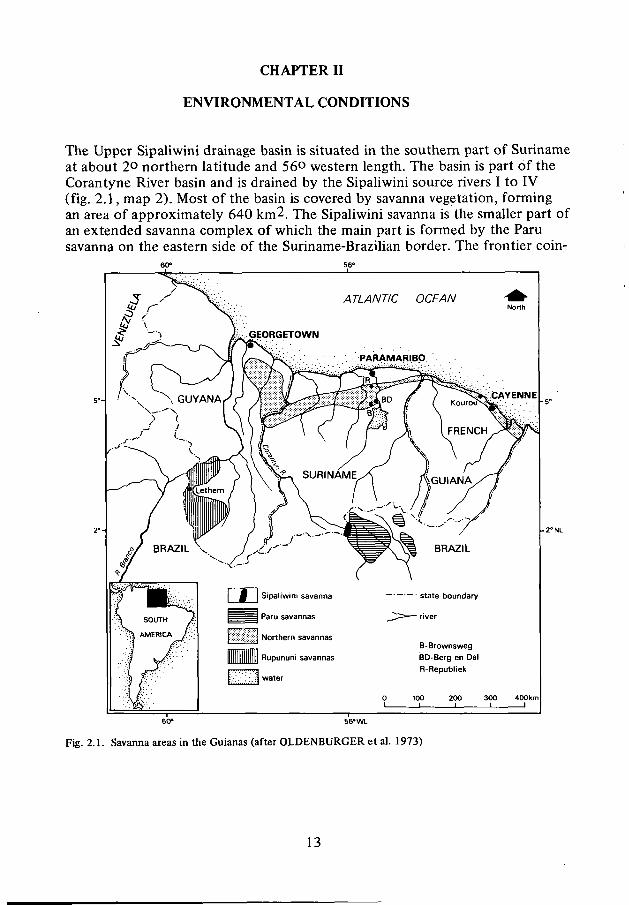
The Upper Sipaliwini drainage basin is situated in the southern part of Surinameat about 2o northern latitude and 56° western length. The basin is part of theCorantyne River basin and is drained by the Sipaliwini source rivers I to IV(fig. 2.1, map 2). Most of the basin is covered by savanna vegetation, formingan area of approximately 640 km2. The Sipaliwini savanna is the smaller part ofan extended savanna complex of which the main part is formed by the Parusavanna on the eastern side of the Suriname-Brazilian border. The frontier coin-
I M l Sipaliwini savanna
| | Paru savannas
|:::;:;:;||;i;:;:;| Northern savannas
Illllllllllllllll Rupununi savannas
f;'.':'.'.:.if water
state boundary
j _ ^ > - ~ river
B-BrownswegBD-Berg en DalR-Republiek
0 100 200 300 400km
60° 56° WL
Fig. 2.1. Savanna areas in the Guianas (after OLDENBURGER et al. 1973)
13

cides with the flat waterdivide between the West Paru River, tributary to theAmazon River, and the Corantyne River basin. The investigations were focussedon the Sipaliwini savanna area.
II.I CLIMATE AND PALEOCLIMATE
In the northern and north-eastern part of S.America three major types of climatemay be distinguished on the basis of the Koppen classification system (KOPPEN,1931, 1936). They are all tropical, being Af, Aw and Am (EIDT, 1968; fig.2.1.1).
60° 50° 40°
-10°
-O°NL
60° 50°
Fig. 2.1.1. Major climates in northern S.America (after EIDT, 1968)
40° WL
The circulation of air and the distribution of rainfall over these parts ofS.America is dominated by the position and shift of the intertropical convergen-cy zone (ITCZ). The lowland area of the Amazon basin allows the tropical windsfrom the coast to enter and blow upriver to bring large quantities of moisture tothe lowland. The moisture condenses during strong convectional heating. Thecombination of constant convection and orographie uplift of the winds at theedges of the basin produces an Af climate. Within the Amazon basin there arevariations in amount and timing of rainfall. During a period from approximatelyJune - November strong easterly winds from the South Atlantic high pressure cellblow inland from the Atlantic coast into the spout of the Amazon basin andbring drier weather in part of the basin. In fact, there is a sufficiently long periodof lower precipitation during these months to classify the area as having an Amclimate. The Guiana Highlands block the NE trade winds and produce dry winterconditions on their leeward slopes. Such climates are known as Aw or savannaclimate. The criterion by which the savanna climate distinguishes itself fromother tropical climates is found in the relation between the precipitation in thedriest month and the total annual precipitation, in such a way that:
14

J F M A M J J A S O N D
MEAN MONTHLY MAXIMUM TEMPERATURE^^''
MEAN MONTHLY TEMPERATURE
MEAN MONTHLY MINIMUM TEMPERATURE "'
J F M A M J J A S O N D
J F M A M J J A S O N D
Fig. 2.1.2. Climatological data of Sipaliwini Savanna
15
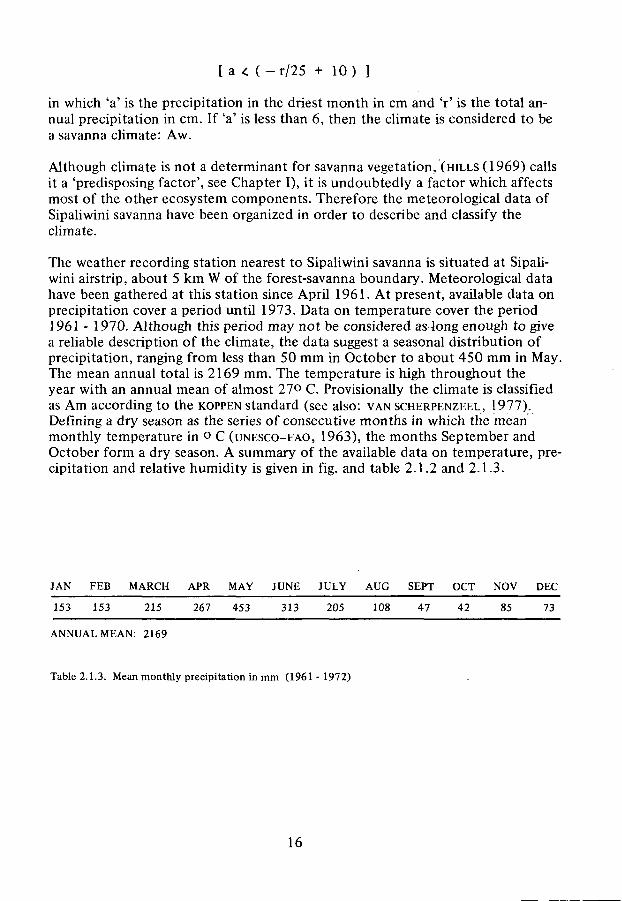
[ a < ( - r / 2 5 + 10) ]
in which 'a' is the precipitation in the driest month in cm and 'r' is the total an-nual precipitation in cm. If 'a' is less than 6, then the climate is considered to bea savanna climate: Aw.
Although climate is not a determinant for savanna vegetation, (HILLS (1969) callsit a 'predisposing factor', see Chapter I), it is undoubtedly a factor which affectsmost of the other ecosystem components. Therefore the meteorological data ofSipaliwini savanna have been organized in order to describe and classify theclimate.
The weather recording station nearest to Sipaliwini savanna is situated at Sipali-wini airstrip, about 5 km W of the forest-savanna boundary. Meteorological datahave been gathered at this station since April 1961. At present, available data onprecipitation cover a period until 1973. Data on temperature cover the period1961 - 1970. Although this period may not be considered as4ong enough to givea reliable description of the climate, the data suggest a seasonal distribution ofprecipitation, ranging from less than 50 mm in October to about 450 mm in May.The mean annual total is 2169 mm. The temperature is high throughout theyear with an annual mean of almost 270 C. Provisionally the climate is classifiedas Am according to the KOPPEN standard (see also: VAN SCHERPENZEEL, 1977).Defining a dry season as the series of consecutive months in which the meanmonthly temperature in o c (UNESCO-FAO, 1963), the months September andOctober form a dry season. A summary of the available data on temperature, pre-cipitation and relative humidity is given in fig. and table 2.1.2 and 2.1.3.
JAN
153
FEB
153
MARCH
215
APR
267
MAY
453
JUNE
313
JULY
205
AUG
108
SEPT
47
OCT
42
NOV
85
DEC
73
ANNUAL MEAN: 2169
Table 2.1.3. Mean monthly precipitation in mm (1961 - 1972)
16
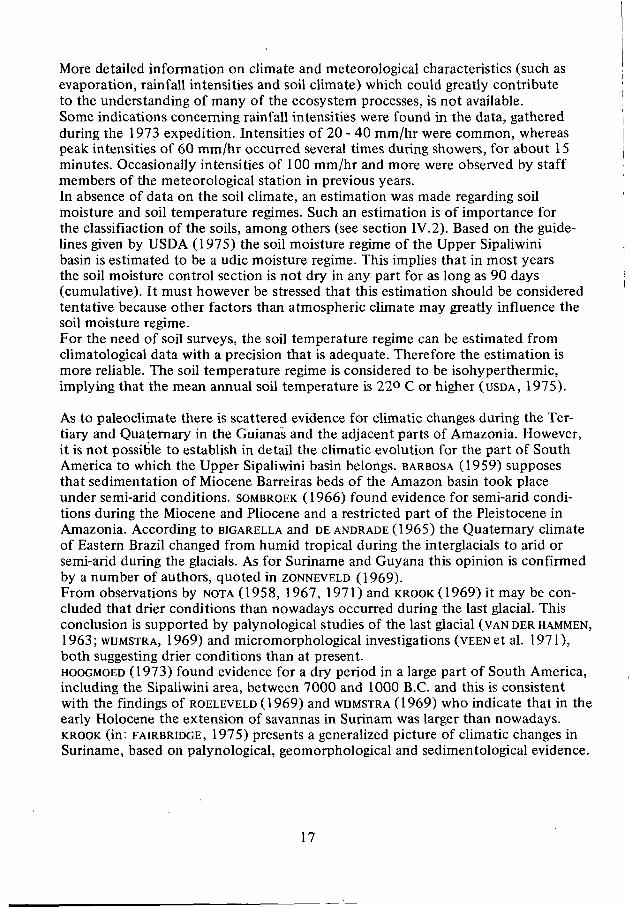
More detailed information on climate and meteorological characteristics (such asevaporation, rainfall intensities and soil climate) which could greatly contributeto the understanding of many of the ecosystem processes, is not available.Some indications concerning rainfall intensities were found in the data, gatheredduring the 1973 expedition. Intensities of 20 - 40 mm/hr were common, whereaspeak intensities of 60 mm/hr occurred several times during showers, for about 15minutes. Occasionally intensities of 100 mm/hr and more were observed by staffmembers of the meteorological station in previous years.In absence of data on the soil climate, an estimation was made regarding soilmoisture and soil temperature regimes. Such an estimation is of importance forthe classifiaction of the soils, among others (see section IV.2). Based on the guide-lines given by USDA (1975) the soil moisture regime of the Upper Sipaliwinibasin is estimated to be a udic moisture regime. This implies that in most yearsthe soil moisture control section is not dry in any part for as long as 90 days(cumulative). It must however be stressed that this estimation should be consideredtentative because other factors than atmospheric climate may greatly influence thesoil moisture regime.For the need of soil surveys, the soil temperature regime can be estimated fromclimatological data with a precision that is adequate. Therefore the estimation ismore reliable. The soil temperature regime is considered to be isohyperthermic,implying that the mean annual soil temperature is 22° C or higher (USDA, 1975).
As to paleoclimate there is scattered evidence for climatic changes during the Ter-tiary and Quaternary in the Guianas and the adjacent parts of Amazonia. However,it is not possible to establish in detail the climatic evolution for the part of SouthAmerica to which the Upper Sipaliwini basin belongs, BARBOSA (1959) supposesthat sedimentation of Miocene Barreiras beds of the Amazon basin took placeunder semi-arid conditions, SOMBROEK ( 1966) found evidence for semi-arid condi-tions during the Miocene and Pliocene and a restricted part of the Pleistocene inAmazonia. According to BIGARELLA and DE ANDRADE (1965) the Quaternary climateof Eastern Brazil changed from humid tropical during the interglacials to arid orsemi-arid during the glacials. As for Suriname and Guyana this opinion is confirmedby a number of authors, quoted in ZONNEVELD (1969).From observations by NOTA (1958, 1967, 1971) and KROOK(1969) it may be con-cluded that drier conditions than nowadays occurred during the last glacial. Thisconclusion is supported by palynological studies of the last glacial (VAN DER HAMMEN,1963; WUMSTRA, 1969) and micromorphological investigations (VEEN et al. 1971),both suggesting drier conditions than at present.HOOGMOED (1973) found evidence for a dry period in a large part of South America,including the Sipaliwini area, between 7000 and 1000 B.C. and this is consistentwith the findings of ROELEVELD (1969) and WUMSTRA (1969) who indicate that in theearly Holocene the extension of savannas in Surinam was larger than nowadays.KROOK (in: FAIRBRIDGE, 1975) presents a generalized picture of climatic changes inSuriname, based on palynological, geomorphological and sedimentological evidence.
17
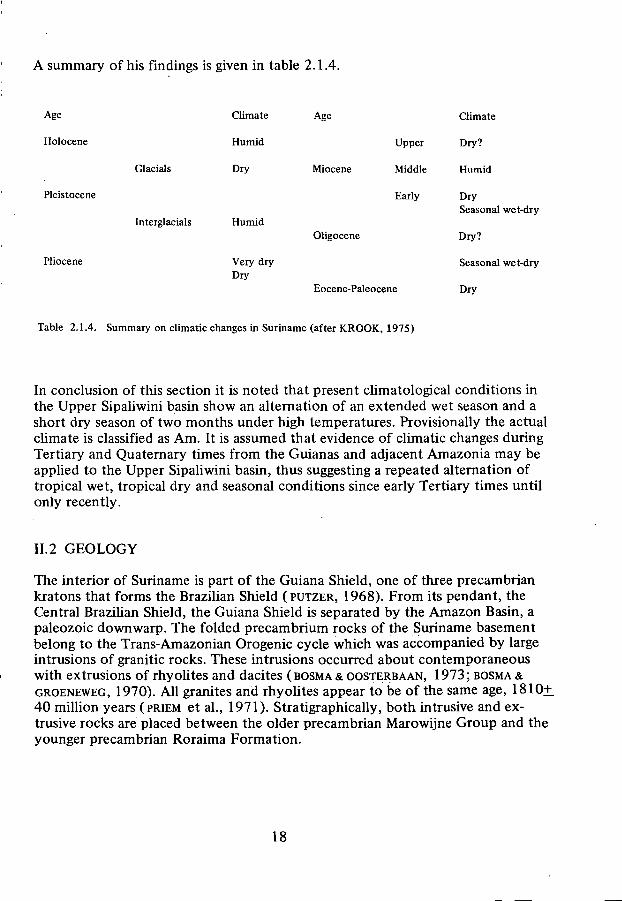
A summary of his findings is given in table 2.1.4.
Age
Holocene
Pleistocene
Pliocene
Glacials
Inteiglacials
Climate
Humid
Dry
Humid
Very dryDry
Age
Miocene
Oligocène
Upper
Middle
Early
Eocene-Paleocene
Climate
Dry?
Humid
DrySeasonal wet-dry
Dry?
Seasonal wet-dry
Dry
Table 2.1.4. Summary on climatic changes in Suriname (after KROOK, 1975)
In conclusion of this section it is noted that present climatological conditions inthe Upper Sipaliwini basin show an alternation of an extended wet season and ashort dry season of two months under high temperatures. Provisionally the actualclimate is classified as Am. It is assumed that evidence of climatic changes duringTertiary and Quaternary times from the Guianas and adjacent Amazonia may beapplied to the Upper Sipaliwini basin, thus suggesting a repeated alternation oftropical wet, tropical dry and seasonal conditions since early Tertiary times untilonly recently.
II. 2 GEOLOGY
The interior of Suriname is part of the Guiana Shield, one of three precambriankratons that forms the Brazilian Shield (PUTZER, 1968). From its pendant, theCentral Brazilian Shield, the Guiana Shield is separated by the Amazon Basin, apaleozoic downwarp. The folded precambrium rocks of the Suriname basementbelong to the Trans-Amazonian Orogenic cycle which was accompanied by largeintrusions of granitic rocks. These intrusions occurred about contemporaneouswith extrusions of rhyolites and dacites ( BOSMA & OOSTERBAAN, 1973 ; BOSMA &GROENEWEG, 1970). All granites and rhy olites appear to be of the same age, 1810+_40 million years (PRIEM et al., 1971). Stratigraphically, both intrusive and ex-trusive rocks are placed between the older precambrian Marowijne Group and theyounger precambrian Roraima Formation.
18
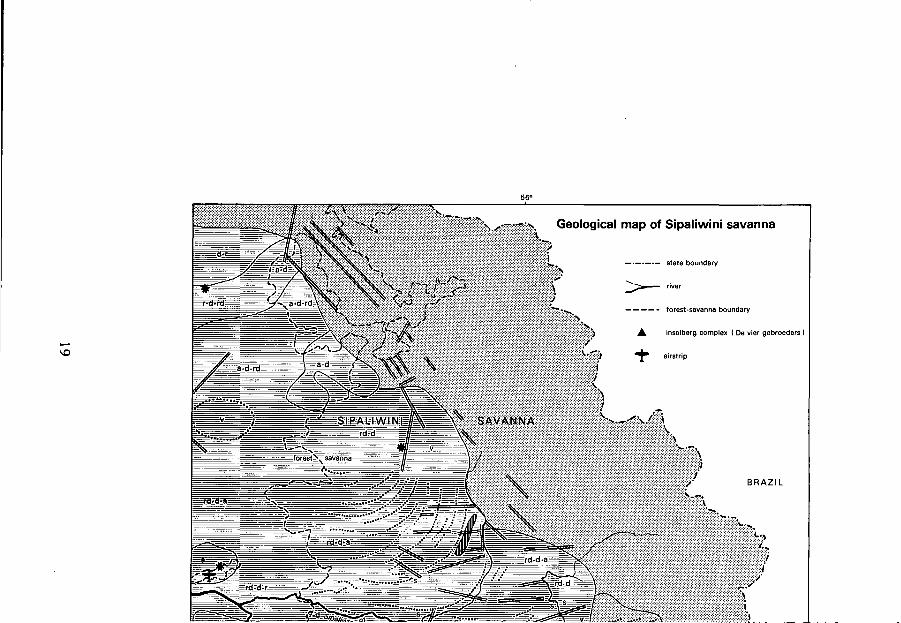
Geological map of Sipaliwini savanna
state boundary
forest-savanna boundary
inselberg complex { De vier gebroeders )
BRAZIL
!fiiiiiiiiiiiiîii'WÊËÊËÊÊÊKÊË?'mm
too
%•*Wj
•*ïi north
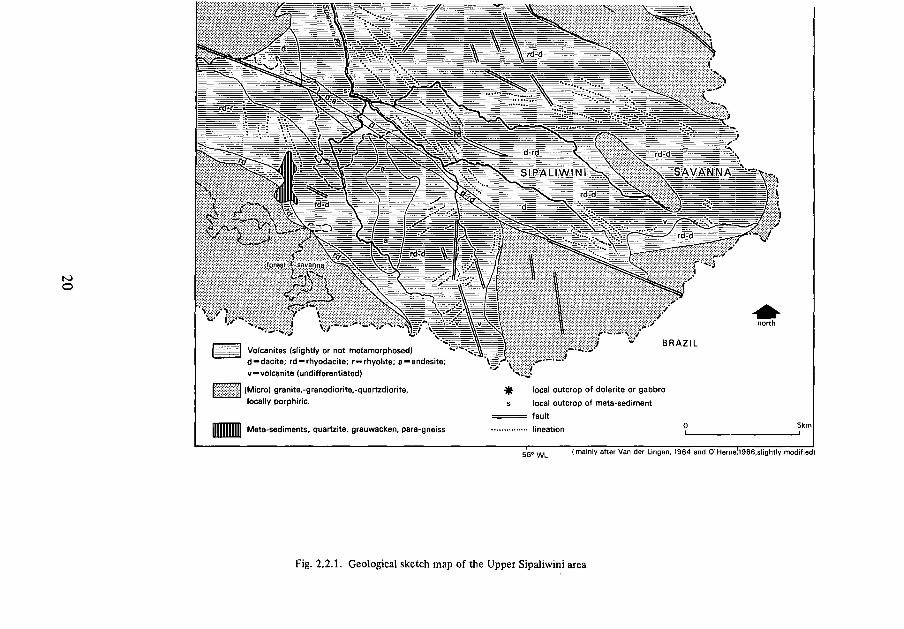
[ z ^ r ^ l Volcanites (slightly or not metamorphosed)d~dacite; rd~rhyodacite; r —rhyolite; a~andesite;v—volcanite (undifferentiated)
p lHH ] (Micro) granite,-granodiorite,-quartzdiorite,locally porphiric.
Illllllllll Mâta-sediments, quartzite, grauwacken, para-gneiss
BRAZIL
local outcrop of dolerite or gabbrolocal outcrop of meta-sediment
: fault•••• lineation 5km
56° WL ( mainly after Van der Lingen, 1964 and O'Herne!i966,slightly modified)
Fig. 2.2.1. Geological sketch map of the Upper Sipaliwini area

The complex structural pattern of the Suriname basal complex is mainly determinedby tectonics of an 'Alpine' type (folded belt) and a 'Saxonic' type (a block faultedregion) (VANBOECKEL, 1968).The Suriname basement has been strongly deformed during precambrian orogeneses.It has afterwards been subject to cyclic epirogenic motions and VAN BOECKEL( 1968) draws special attention to the subsidence of the Corantyne basin in north-eastern Suriname. On the other hand,the same author showed the existence of anextended zone of intensive negative gravity anomalies in the northern part of thebasement. This negative belt was interpreted as a possibly rising structural unit.The axis of this unit lies about 250 km N of the Sipaliwini area.
It has been suggested by BAKKER ( 1949, in VAN BOECKEL, 1968) that even today theSuriname basement is not as rigid as was believed, an opinion endorsed by manyother authors (VAN BOECKEL, 1968), and it is possible that recent block faultingmay still be controlled by the 'Saxonic' and 'Alpine' structural trends.
The Sipaliwini area is part of the Suriname basal complex. Its structure shows someof the characteristics of the precambrian orogeneses, faults having a NE or NW strike.The lithology of the Sipaliwini savanna is not known in great detail, VAN DER LINGEN(1964) paid a short visit to the area. The geological map he drew, indicates thepresence of granites in the waterdivide area and acid to intermediate volcanitesand acid volcanites in the western, central and southern part of the savanna.O'HERNE ( 1966) published a geological map, mainly based on interpretation ofaerial photographs. Based on the maps of both Van der Lingen and O'Herne andfield observations a geological sketch map was prepared (fig.2.2.1).Apart from the granite and volcanite areas the local occurrence of meta-sedimentslike quartzite is indicated. Granites range from andesine-rich quartz-diorites tograno-diorites and granites rich in K-feldspars. Locally the granites may be porphiric.The acid volcanites comprise dacite, rhyodacite and rhyolite whereas andesiterepresents the intermediate volcanites.
II.3 OUTLINE OF GEOMORPHOLOGY
The absence of major orogenetic movements of the Guiana Shield since thePrecambrian allowed other factors, mainly geomorphogenic, to play a decisiverole in the development of the landscapes. Following the Precambrian a veryextensive denudation and planation of the surface took place ( SOMBROEK, 1966).Geomorphological studies of the interior of the Guiana Shield and sedimentologicalstudies of the coastal area showed that unconformities in the Cenozoic sedimentscould be correlated with erosion bevels in the interior (KING et al. 1964: MCCONNELL,1966).As indicated by the unconformities of the deposits in the coastal area of theGuianas, the formation of these erosion surfaces has a cyclic character, invoked
21
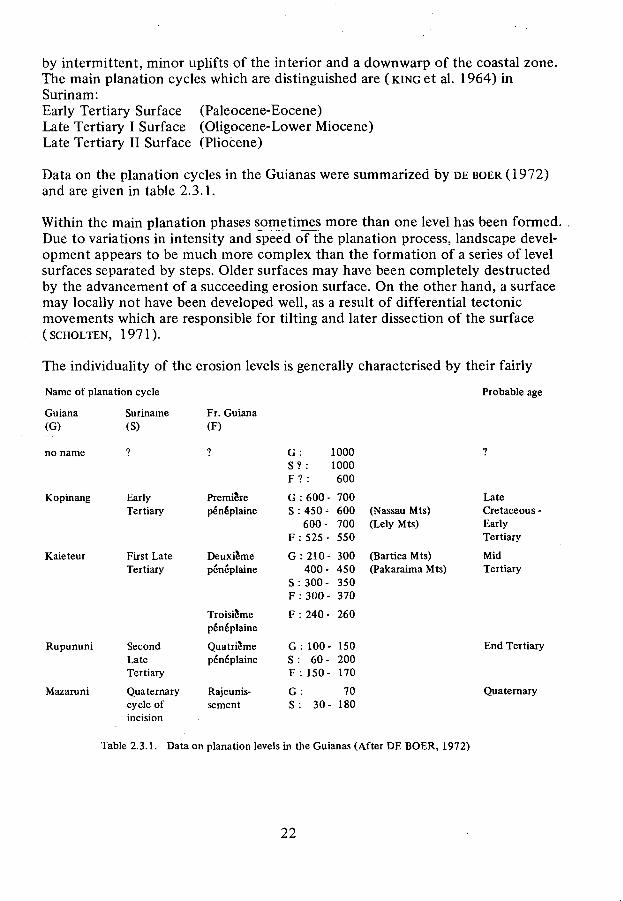
by intermittent, minor uplifts of the interior and a downwarp of the coastal zone.The main planation cycles which are distinguished are ( KING et al. 1964) inSurinam:Early Tertiary Surface (Paleocene-Eocene)Late Tertiary I Surface (Oligocene-Lower Miocene)Late Tertiary II Surface (Pliocene)
Data on the planation cycles in the Guianas were summarized by DE BOER (1972)and are given in table 2.3.1.
Within the main planation phases sometimes more than one level has been formed.Due to variations in intensity and speed of the planation process, landscape devel-opment appears to be much more complex than the formation of a series of levelsurfaces separated by steps. Older surfaces may have been completely destructedby the advancement of a succeeding erosion surface. On the other hand, a surfacemay locally not have been developed well, as a result of differential tectonicmovements which are responsible for tilting and later dissection of the surface(SCHOLTEN, 1971).
The individuality of the erosion levels is generally characterised by their fairly
Name of planation cycle Probable age
Guiana(G)
no name
Kopinang
Kaieteur
Rupununi
Mazaruni
Suriname(S)
i
EarlyTertiary
First LateTertiary
SecondLateTertiary
Quaternarycycle ofincision
Fr. Guiana(F)
Premièrepénéplaine
Deuxièmepénéplaine
Troisièmepénéplaine
Quatrièmepénéplaine
Rajeunis-sement
G :S ? :F ? :
G : 600 -S : 450 -
600-F : 525 -
G: 210-400-
S : 300 -F : 300 -
F : 240 -
G : 100-S: 60-F : 150-
G :S: 30-
10001000600
700600700550
300450350370
260
150200170
70180
(Nassau Mts)(Lely Mts)
(Bartica Mts)(Pakaraima Mts)
LateCretaceousEarlyTertiary
MidTertiary
End Tertia
Quaternarj
Table 2.3.1. Data on planation levels in the Guianas (After DE BOER, 1972)
22
constant altitudes, although they may display a slope of a few percent.The planation surface is usually separated from the next younger one by a moreor less pronounced scarp whereas the surfaces are sometimes latérite capped. Dueto lowering of the erosion base and climatic changes the planation surfaces havebeen dissected and often largely destroyed, leaving only remnants of the originalsurface, such as flat-topped hills and small plateaux which together constitute theso-called summit levels.As to the formation of planation surfaces, like those in S.America, KING (1953)suggests a process of riverincision, slope retreat and pedimentation at the footof the retreating slope, JESSEN (1938) takes into account a parallel slope retreat,induced by chemical weathering, whereas WAYLAND (1933), BUDEL(1954),MABBUTT ( 1961 ) and THOMAS (1965, 1974) think in terms of deep chemicalweathering combined with stripping, PENCK (1919) however, suggested a combina-tion of depth erosion of the rivers and hillslope denudation. An equilibriumsituation between river density, the degree of depth erosion and slope developmentwould give rise to the formation of a so-called 'oberes Denudationsniveau' (upperdenudation level) which has no relation to any former real surface. According toZONNEVELD ( 1969) the most probable explanation of the various summit levelsin Suriname is the one that takes into account climatic and vegetational conditionscomparable with those, actually present in East Africa. There must have been arelative upheavel of the land, causing knickpoints in the longitudinal profile ofthe rivers. The knickpoints must retreat at the same rate or slightly faster than thevalley sides, resulting in an undulating relief upstream of the knickpoint with slopesof some percent (ZONNEVELD, 1969; 1979, in prep.)Whatever conditions and processes are involved in the formation of planationlevels, it is generally held that flowing water is the main agent. In the course offormation of the levels, either on fresh rock or in weathering mantles, more orless loose material has been transported, removed or deposited. It may thereforebe assumed that an eventually resulting planation level is more ore less adjustedto a local erosion base. Changes in climate and vegetation caused a conversion of theconditions favourable for planation into conditions under which dissection couldtake place, at least during parts of the Quaternary when tropical rainforestsettled on the stepped surfaces.
Summarizing: the landforms of the Guiana Shield appear to be dominated by aseries of stepped planation levels. In many cases the original planation surfaces havebeen dissected, leaving remnants like more or less continuous summit levels.
II.4 SOILS
With regard to the northern and northeastern parts of S.America two major soil re-gions may be distinguished: the Guiana Uplands and the Amazon Lowlands (BEEK &BRAMAO, 1968). Soils of the Amazon basin have developed on mainly Tertiary and
23
Pleistocene unconsolidated sediments, predominantly consisting of kaolinitic claysand quartz sand. Most common soils are called Pale Yellow Latosols by theseauthors. On imperfectly drained parts groundwater latente soils developed.
The Guiana Uplands are modelled into a complex of extensive rolling to hillycrystalline uplands, level pediplains and mountain areas. The hilly crystalline uplandscomprise a number of erosion levels. According to BEEK& BRAMAO (1968) the olderhigh standing planation levels were strongly dissected after the Plio-Pleistoceneuplift of the Guiana Shield. On steep slopes shallow latosols are present, sometimeswith a high content of iron concretions. Hilltops are still covered by concretionarysoils, mainly Latosols with Red Yellow Podzolic soils where the underlying acidicrocks have been exposed. The soils have an extremely low activity of the clayfraction and a very low sum of bases which is considered remarkable for soils in arugged topography. However, the soil material is poly cyclic and has repeatedly beenweathered and transported. ( BEEK & BRAMAO , 1968).
According to the FAO Soil Map of the World ( FAO - UNESCO , 1971 ) the soils of theUpper Sipaliwini basin belong to the Orthic Acrisols. Acrisols are acid soils thathave an argillic B-horizon in which the base saturation is less than 50%, at least inthe lower part of the horizon. The Acrisols include those tropical soils that areinsufficiently weathered to be Ferralsols. In the nomenclature of the SOIL TAXONOMY(1975) these soils belong to the order of Ultisols.
Adjacent to the Upper Sipaliwini area, Ferrallic Arenosols occur to the North whileto the East (Paru savanna) the presence of Orthic Ferralsols is indicated,is indicated.
It thus appears that most of the soils in the Upper Sipaliwini basin belong to theclass of Latosols as defined by KELLOGG ( 1949) as soils in tropical and equatorialregions, having their dominant characteristics associated with low silica-sesquioxiderations of the clay fraction, low base exchange capacities, low activities of clay,low content of most primary minerals, low content of soluble constituents and ahigh degree of aggregate stability.
DOST (1962) and BROOK (1968), having paid short visits to the Sipaliwini savanna,reported brown to orange-red and red soils on the hills and sandy, shallow hydro-morphic soils in valleys and depressions. Marked differences between soils underforest cover and soils under savanna vegetation were observed. The first having sandytoplayers with an intensive'biological activity and a heavy structured subsoil withmottling. The latter lack most of the sandy toplayer. The massive subsoil is some-times even present at the surface.
In summary, it is held that soils of the Upper Sipaliwini drainage basin, developedon granitic and volcanite parent material, generally belong to the soil class charac-
24
terized by a high degree of weathering, i.e. a predominantly low or négligeablecontent of weatherable minerals in the solum, a dominancy of kaolinite, Fe- and Al-oxides in the clay fraction and a low base saturation to considerable depth. Themain differentiation within this class is related to the presence of different erosionsurfaces.
II. 5 VEGETATION
The Sipaliwini-Paru savannas are situated amongst the worlds greatest reserve oftropical rainforest in the Amazon basin and the rainforest on the Guiana Shield.A floristic comparison between the Brazilian Campos Cerrados (814 species), thenorthern Guiana savanna belt (288 species in Suriname) and Sipaliwini savanna(675 species) was made by OLDENBURGER (1973). On the basis of this floristic com-parison Oldenburger concludes that Sipaliwini savanna takes an intermediateposition in a hypothetical floristic chain that links the Campos Cerrados of theBrazilian Planalto via Sipaliwini Savanna, over the Venezuelan Llanos with theGuiana coastal savanna belt.
Within the Upper Sipaliwini region two main ecological zones are recognized,characterized by two vegetation formation types, e.g. open orchard savanna (park-land savanna, campo coberto) and semi-deciduous tropical forest (OLDENBURGERet al., 1973; OLDENBURGER & NORDE, in prep.).Since the investigations were mainly directed toward the savanna ecosystem, inven-tarisation and analysis of the forest vegetation has been limited. Its classificationis therefore provisional. The open orchard savanna is characterized by widelyinterspaced, gnarled trees on hilltops and slopes. Dominant and subdominant treesare:
Salvertia convallariodora St.Hil.Curatella americana L.Byrsonima crassifolia (L.) L.C.Rich.Tabebuia caraiba (Mart.) Bur.Bowdichia virgilioides H.B.K.
The wide valleys are characterised by a cover of short grasses and sedges withouttrees. Along the water courses seasonal swamps occur with 'Maurisie' palms (Mauritiaflexuosa L.f.). Main creeks are sometimes accompanied by gallery forest or gallerywoodland.All over the savanna area isolated mesophytic forest islands occur. Inselberg slopesare mainly covered with a scrub woodland vegetation, OLDENBURGER & NORDE ( inprep.) distinguish nine floristic-ecological groups or formations which are corre-lated with a certain habitat. The character of these formations is summarized below(fig.2.5.1). For a detailed description of the formations and communities the reader
25
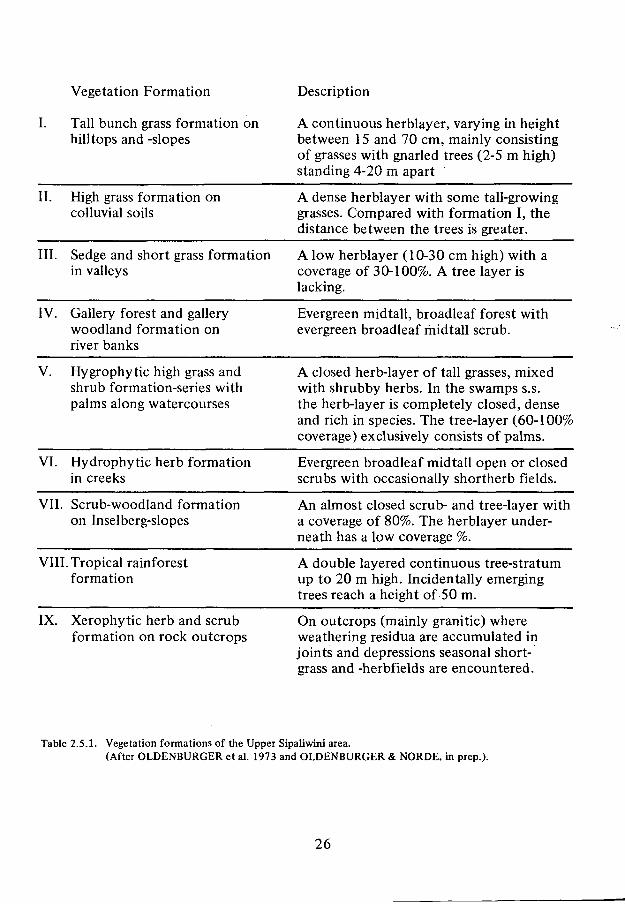
Vegetation Formation Description
Tall bunch grass formation onhilltops and -slopes
A continuous herblayer, varying in heightbetween 15 and 70 cm, mainly consistingof grasses with gnarled trees (2-5 m high)standing 4-20 m apart
II. High grass formation oncolluvial soils
III. Sedge and short grass formationin valleys
A dense herblayer with some tall-growinggrasses. Compared with formation I, thedistance between the trees is greater.
A low herblayer (10-30 cm high) with acoverage of 30-100%. A tree layer islacking.
IV. Gallery forest and gallerywoodland formation onriver banks
Evergreen midtall, broadleaf forest withevergreen broadleaf midtall scrub.
V. Hygrophytic high grass andshrub formation-series withpalms along watercourses
A closed herb-layer of tall grasses, mixedwith shrubby herbs. In the swamps s.S.the herb-layer is completely closed, denseand rich in species. The tree-layer (60-100%coverage) exclusively consists of palms.
VI. Hydrophytic herb formationin creeks
Evergreen broadleaf midtall open or closedscrubs with occasionally shortherb fields.
VII. Scrub-woodland formationon Inselberg-slopes
An almost closed scrub- and tree-layer witha coverage of 80%. The herblayer under-neath has a low coverage %.
VIII. Tropical rainforestformation
A double layered continuous tree-stratumup to 20 m high. Incidentally emergingtrees reach a height of 50 m.
IX. Xerophytic herb and scrubformation on rock outcrops
On outcrops (mainly granitic) whereweathering residua are accumulated injoints and depressions seasonal short-grass and -herbfields are encountered.
Table 2.5.1. Vegetation formations of the Upper Sipaliwini area.(After OLDENBURGER et al. 1973 and OLDENBURGER & NORDE, in piep.).
26
is referred to OLDENBURGER et al. (1973) and OLDENBURGER & NORDE (in prep.)- Themain outcome of grouping of plantcommunities is the establishment of a dry-wetgradient, showing the savanna vegetation as a continuum from hilltops down todepressions and valley floors. Different vegetation habitats may be distinguishedaccordingly. Hilltops and slopes, together with Inselbergslopes and bare rock out-crops form the dry habitats (with the exception of some hillslopes covered bymesophytic forest). Moisture availability in the dry habitats is restricted to the wetseason and even then, the external drainage, increased by surface sealing, results inan only limited uptake of water by the soil. Downslope, water availability is in-creased because of the occurrence of seepage and the accumulation of surfacerunoff at the foot of the slopes where generally colluvial material is present. In thedry season however, the soils desiccate completely. In the floodplains and on theriverbanks the groundwater level is generally close to the surface (within 2 m) inthe dry season. During the wet season waterlogging and inundation are common.Near to the creeks and rivulets in the wide valley floors, waterlogging occursthroughout the year.A schematic distribution of vegetation formations in relation to habitat is given infig.2.5.2.At the classification level of the 9 formations, indicated in fig.2.5.2, no relation wasfound with other soil characteristics than those influencing soil-water availability.However, at lower levels of vegetation classification (e.g. plantcommunities) differ-ences in vegetation composition could be related to certain other soil properties.The relation between soils and plant-communities will be discussed in a forthcomingpublication (OLDENBURGER ÄRIEZEBOS, in prep.).
The predominant factor governing the distribution of the 9 vegetation formationswhich could be distinguished in the Upper Sipaliwini area, seems to be soil-wateravailability. Climatological, pedological and relief conditions result in a wateravailability gradient from dry to wet. Vegetation formations and habitats arearranged accordingly.
27
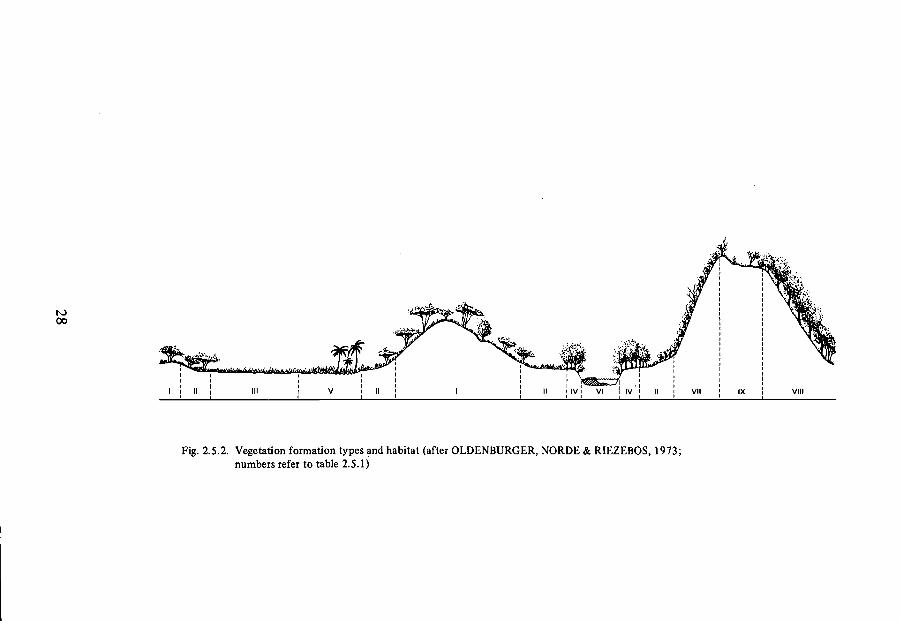
Ni00
VIII
Fig. 2.5.2. Vegetation formation types and habitat (after OLDENBURGER, NORDE & RIEZEBOS, 1973;numbers refer to table 2.5.1)
II.6 SUMMARY AND CONCLUSIONS
The geographical framework of Sipaliwini, the character of the a-biotic systemcomponents and some of the relations between these components are described inChapter II.
Basic to the landscape system of the Upper Sipaliwini drainage basin is the presenceof precambrian crystalline rocks of the Guiana Shield, which has been subject tocyclic epeirogenic movements, erosion and denudation since their time of origin.It seems justified to take into account the possibility of even recent tectonicmovements of the Shield. In relation to differential tectonic movements and cli-matic changes since early Tertiary times, several erosion surfaces were formed onthe Guiana Shield which may presently be recognized as dissected levels. Togetherwith climatic changes from tropical dry to humid, vegetation changes are supposedto have occurred, influencing the landscape denudation processes. Soils are stronglyweathered and their differentiation is probably related to the occurrence ofdifferent erosion levels.
At present, landscape physiognomy is characterised by the dominant presence ofsavanna vegetation under a climate which is provisionally classified as Am accor-ding to the Koppen standards. Patterns within the savanna vegetation (i.e. differentformations) are related to soil water conditions which in their turn depend, in thegiven climatological setting, on topographical and relief properties.
29

30
CHAPTER III
GEOMORPHOLOGY
Geomorphology is the study of landforms, especially regarding their nature, theirspatial variations and their past and present development. As it was recognized(Chapter I) that landforms are part of a landscape system, landform studies mayreveal the function of the landscape system. Landform studies are commonlybased on analysis of certain aspects of the landscape physiognomy, the physiogra-phy. Physiography of the Sipaliwini savanna landscapes, its geomorphogeneticalimplications and the present-day processes will be discussed in this chapter.
III. 1 PHYSIOGRAPHY
Physiography is the description of nature or natural phenomena. The conceptwrongly has been used as an equivalent of geomorphology. Apart from being de-scriptive, geomorphology must be interpretive. In this section, physiography isused in a descriptive sense. The class of objects described comprises landformsand landform patterns and includes vegetation physiognomy.
The assessment of the physiography of a region may be rapidly performed byland system mapping. The mapping procedure involves a subdivision of the land-scape into areas that 'have within them common physical attributes that aredifferent from those of adjacent areas' (COOKE & DOORNKAMP, 1974). A landsystem is characterized by a usually recurring pattern of relief properties, soilsand vegetation (CHRISTIANA STEWART , 1952). The size of a land system may varyfrom some tens of km2 to several hundreds of km2. Depending on the mapscale,magnitude and complexity of landforms, land systems can be subdivided intoland units and -elements. The basic method to identify separate land systemsconsists primarily of an analysis of the relief- and vegetation characteristics,using aerial photographs. Starting with photomosaics, areas with differing photo-graphic images are delimitated. With stereo-pairs of photographs, the boundariesare tested on their validity and others are drawn based on differences in relief,relief forms and vegetation physiognomy.Differentiating criteria used, are mainly qualitative land surface properties suchas relative altitude, relief energy (relative relief), degree of dissection, valleywidth, slope form, erosional features and vegetation physiognomy. Mapping wasbased on the available photomosaics and monochromatic aerial photographs ata scale 1 : 40.000 and topographical maps 1 : 20.000. As far as possible theestablished boundaries were checked in the field and revised if necessary.The distinguished land systems of the Sipaliwini savanna are generally composedof several land units which are indicated om map I. as well. The land units are
31
System tl III IV
Altitude
Relativerelief
Dissection
Vegetation
Slope form
Valley width
Landslips
Gullies/
very highhighmediumlow
very highhighmediumlow
stiuiig
mediumweak
numbers referto table 2.5.1
convexconvex-concaveconcave
very widewidemediumnarrow
absentfewmediumfrequent
fewmediumfrequent
X
X
X
I, (II),V, VIII
XX
X(X)
(X)
X
(X)
X
X
XX
(X)
XX
I, II,V, VI
X
XXX
(X)X
X(X)
X
X
(X)
VII, IX,VIII
(X)X
X
X
X(X)
X
X
X
(I), (II),III, IV, V
X
X
X
Table 3.1.1. Land systems of the Sipaliwini Savanna
32

Photo 2. Example of Mono Grande Landscape
Photo KLM-Aerocarto, copyright C.B.L.
33
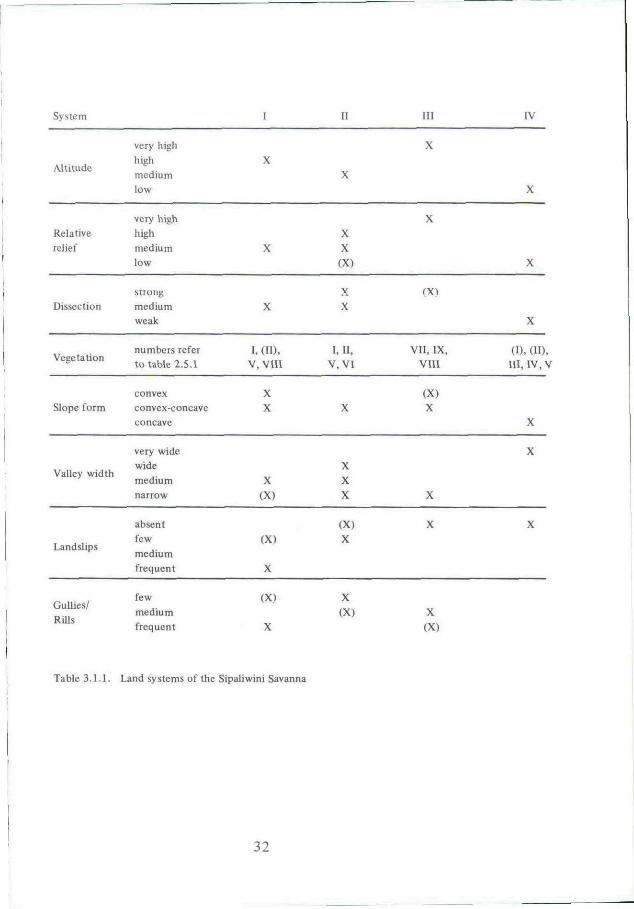
Photo 3. Kxample of Sipaliwini Landscape
Photo KLM-Aerocarto, copyright C.B.L.
34

Photo 4. Example of Inselbeig Landscape (Morro Grande Inselberg)
Photo KLM-Aerocarto, copyright C.B.L.
35

Photo 5. Example of Valley Floor Landscape
Photo KLM-Aerocarto, copyright C.B.L.
36
characterized by the same physiographic properties as the land systems to whichthey belong. HoweveT, one or more properties deviate in that they are differentfrom those of the land systems, or absent. In some cases the land units werediscerned on the basis of additional physiographic characteristics. Land units willnot be discussed separately here, as their specific geomorphological interpretationcould not be established in detail within the given period of fieldwork.
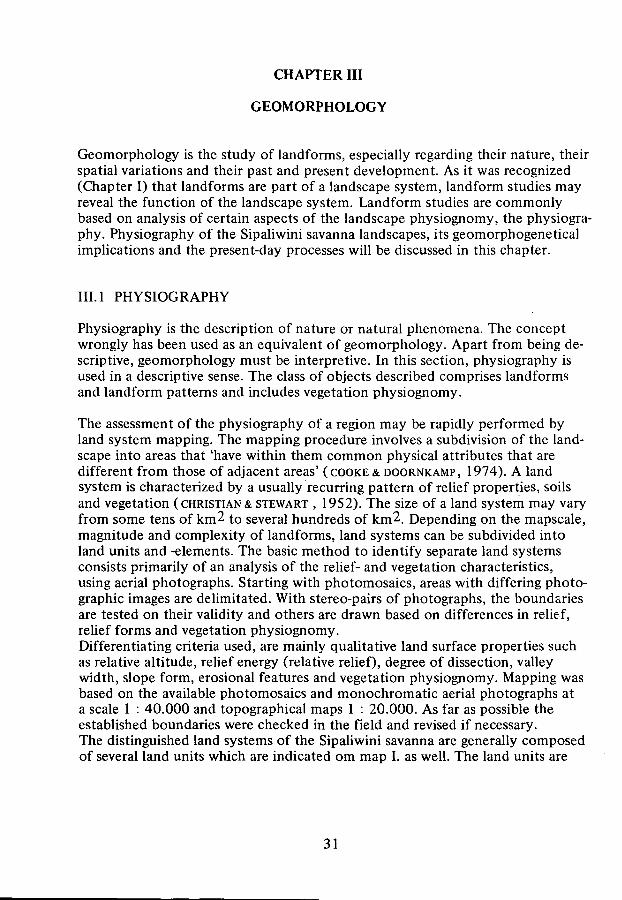
A computerized quantitative analysis of the physiography of the Upper Sipaliwinidrainage basin will be given in a forthcoming paper (RIEZEBOS & HERWEYER, in prep.).The results of the qualitative analysis of physiography is summarized in table 3.1.1.Most differentiating criteria have been subdivided into a relative scale of magnitudeor relative frequency of occurrence.Instead of a verbal description of the various land systems, their physiognomy isillustrated in photographs 2, 3. 4 and 5.
Land system I may be designated as a high altitude, medium high relief system,called Morro Grande Landscape. Land system II is a medium high altitude, mediumto high relief system, called Sipaliwini Landscape. Land system III is characterizedas a very high altitude, very high relief system, called Inselberg Landscape andland system IV is a low altitude, low relief system, called Valley Floor Landscape.
III.2 GENESIS
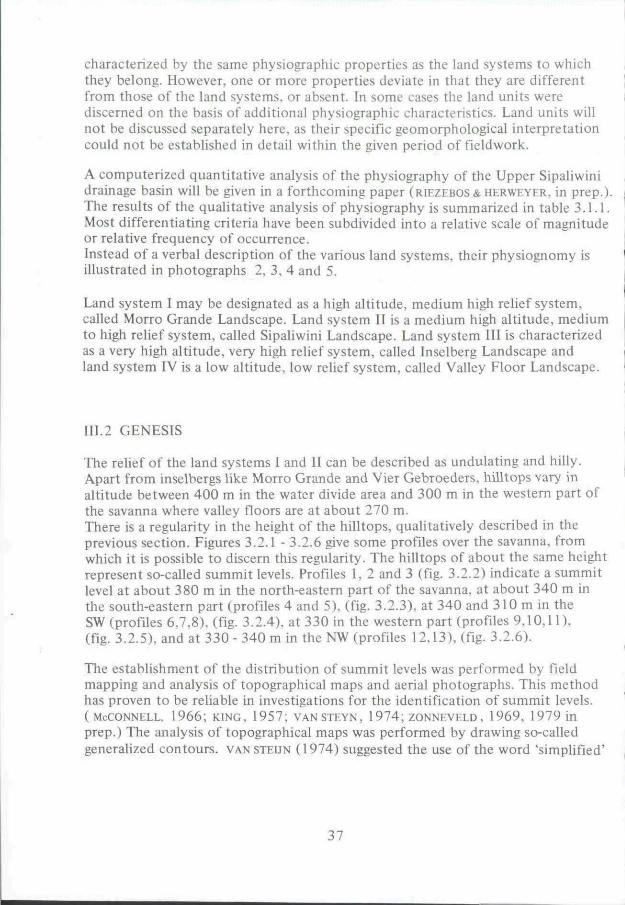
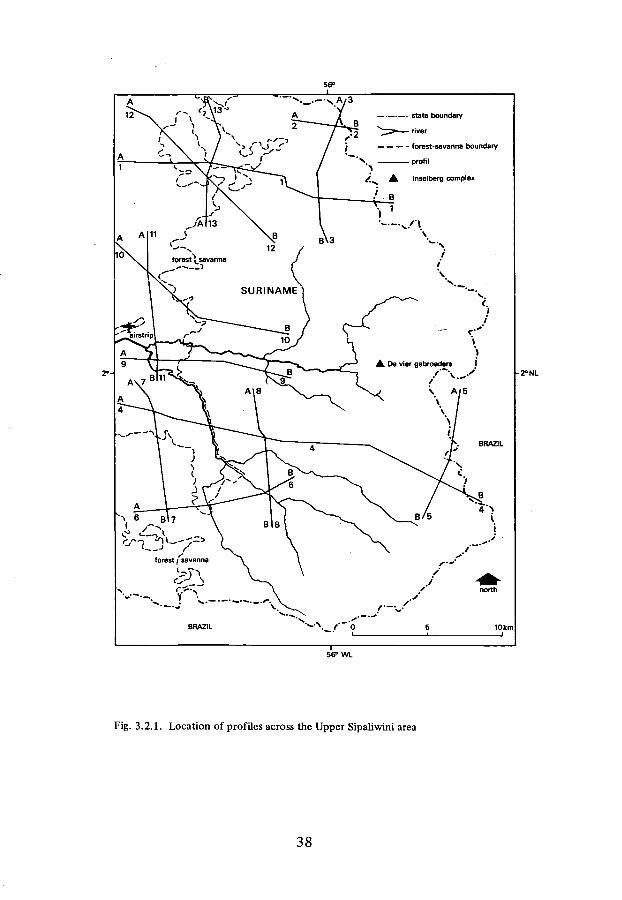
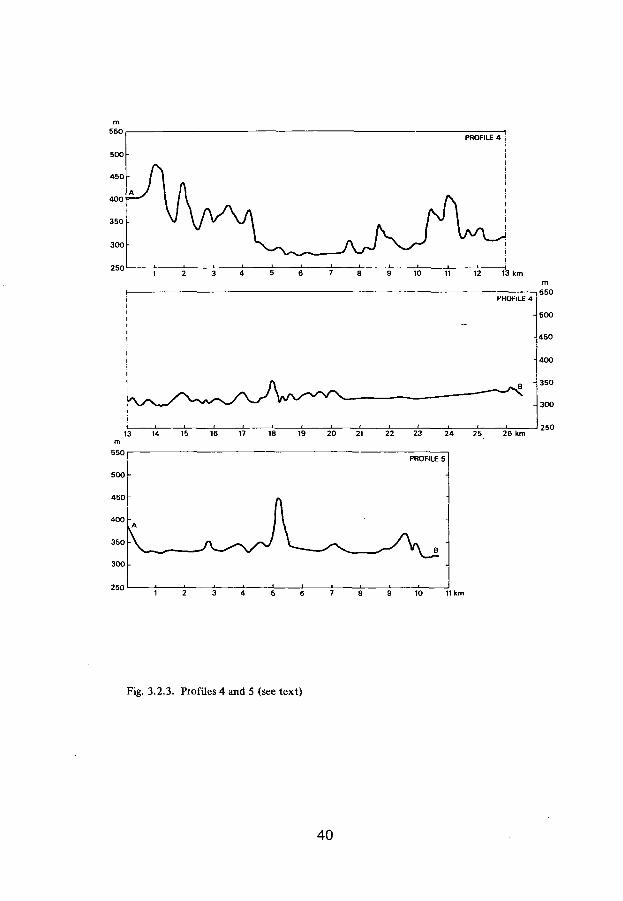
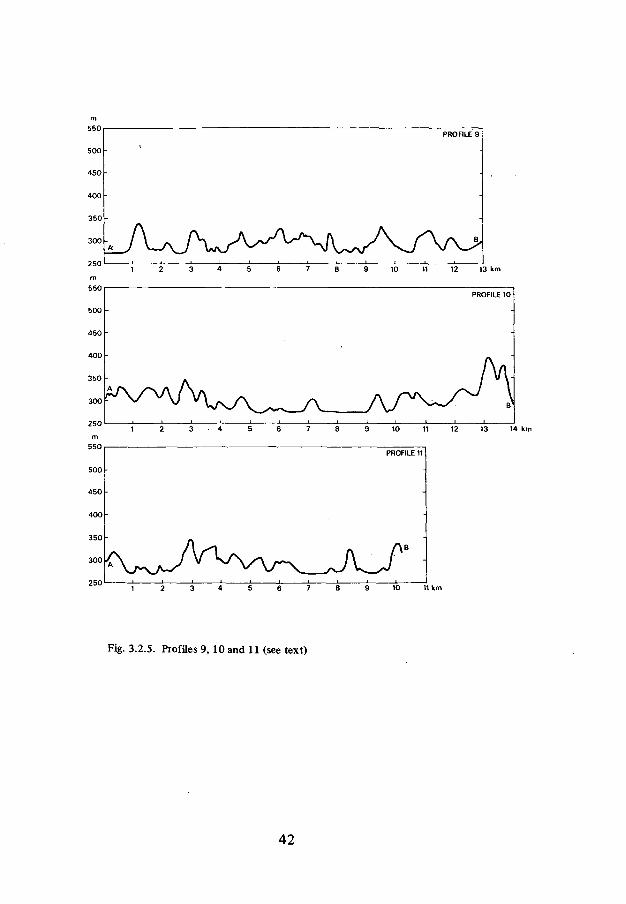
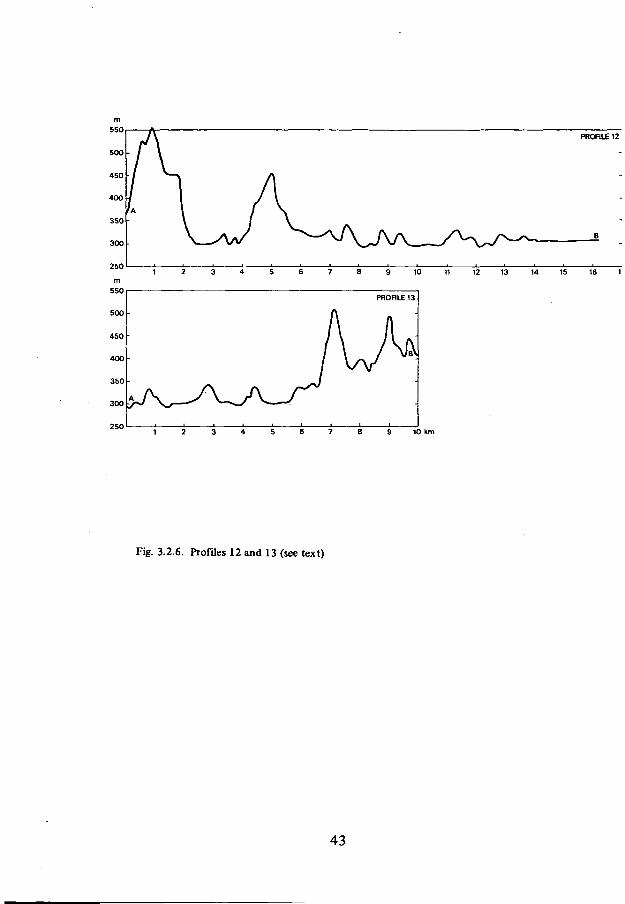
The relief of the land systems I and II can be described as undulating and hilly.Apart from inselbergs like Morro Grande and Vier Gebroeders, hilltops vary inaltitude between 400 m in the water divide area and 300 m in the western part ofthe savanna where valley floors are at about 270 m.There is a regularity in the height of the hilltops, qualitatively described in theprevious section. Figures 3.2.1 - 3.2.6 give some profiles over the savanna, fromwhich it is possible to discern this regularity. The hilltops of about the same heightrepresent so-called summit levels. Profiles 1, 2 and 3 (fig. 3.2.2) indicate a summitlevel at about 380 m in the north-eastern part of the savanna, at about 340 m inthe south-eastern part (profiles 4 and 5), (fig. 3.2.3), at 340 and 310 m in theSW (profiles 6.7.8), (fig. 3.2.4). at 330 in the western part (profiles 9,10,11),(fig. 3.2.5). and at 330 - 340 m in the NW (profiles 12,13), (fig. 3.2.6).
The establishment of the distribution of summit levels was performed by fieldmapping and analysis of topographical maps and aerial photographs. This methodhas proven to be reliable in investigations for the identification of summit levels.( McCONNELL. 1966; KING, 1957; VANSTEYN, 1 974; ZONNEVELD , 1969, 1 979 inprep.) The analysis of topographical maps was performed by drawing so-calledgeneralized contours, VAN STEUN (1974) suggested the use of the word 'simplified'
37
2»NL
56° WL
Fig. 3.2.1. Location of profiles across the Upper Sipaliwini area
38
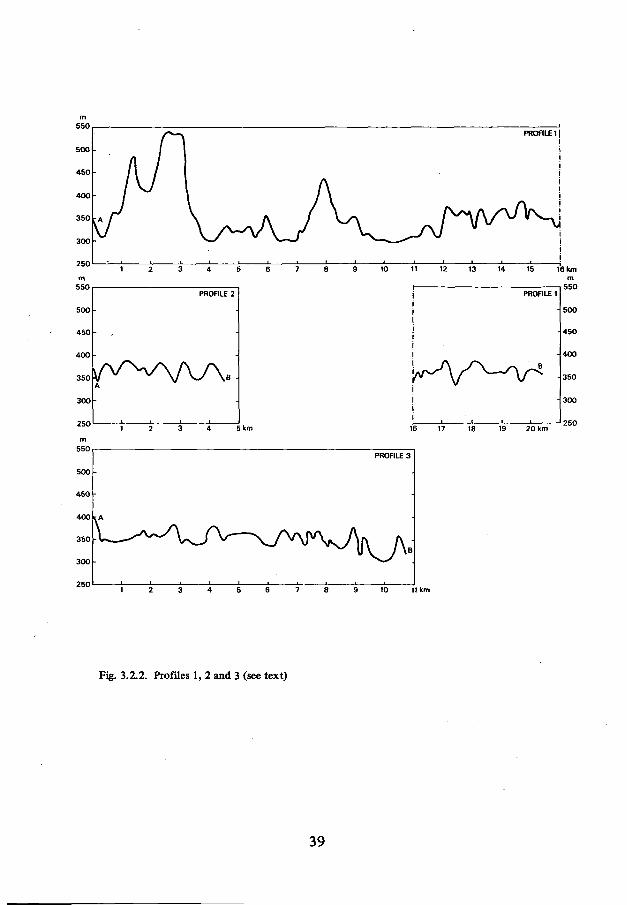
Fig. 3.2.2. Profiles 1, 2 and 3 (see text)
39
250
Fig. 3.2.3. Profiles 4 and 5 (see text)
40

7 8 9 10 11 12 13 14 km
2507 8 9 10 11 km
Fig. 3.2.4. Profiles 6, 7 and 8 (see text)
41
8 9 10 11 12 13 14 km
10 11 km
Fig. 3.2.5. Profiles 9, 10 and 11 (see text)
42
9 10 km
Fig. 3.2.6. Profiles 12 and 13 (see text)
43
— — — State boundary
river
forest-savanna boundary
well developed steps withindication of altitude (m)»^••••B» between levels I and II
3 6 0 between levels II and IIIweakly developed steps
between levels I and II/ , between levels II and III
inselberg complex
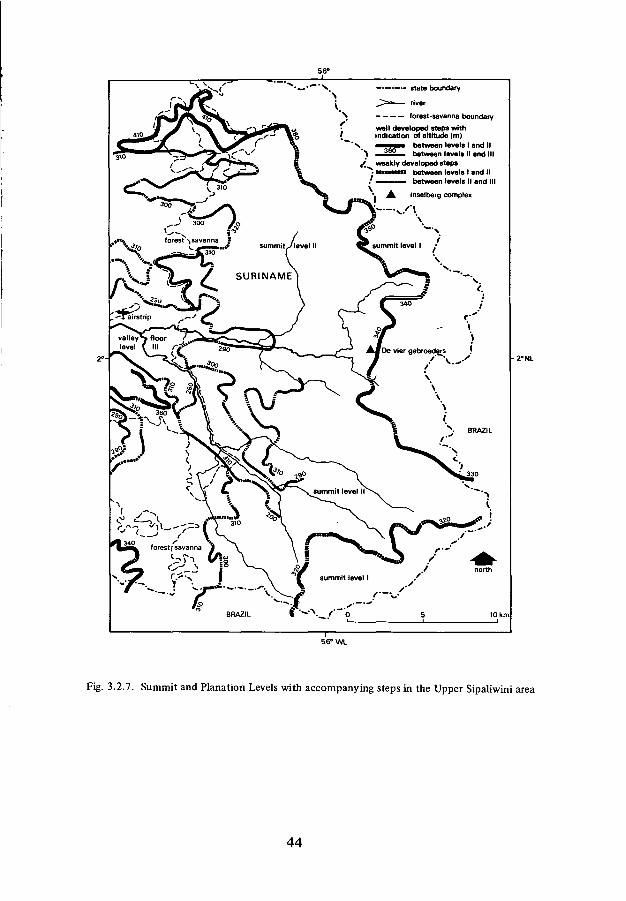
Fig. 3.2.7. Summit and Pianation Levels with accompanying steps in the Upper Sipaliwini area
44
instead of 'generalized', a suggestion which will be followed here. The methodessentially consists of the elimination of the effects of later dissection (PANNEKOEK,1967). In this way the headlines of the relief are obtained and it is possible todistinguish gently sloping former surfaces and steps. The preparation of a simpli-fied contour map is extensively discussed by VAN STEUN (1974) and for short thereader is referred to that publication.
From the simplified contour maps of the Sipaliwini Savanna the scarps, separatingthe summit levels were extracted and in combination with the results of fieldmapping, a map was prepared, showing the occurrence of steps (fig. 3.2.7). It isstressed that this map does not just show actual steps. In fact, the lines indicatesteps that are recognizable in the field as well as steps that could be reconstructedfrom simplified contours. From fig. 3.2.7 it may be seen that the steps are notcontinuous nor constant in altitude. There appears to be a tendency for decreasingaltitude going from North to South. The height of the steps is generally 20 - 30 m.Two steps, accompanying three levels can be distinguished. The highest summitlevel (I) is situated along the waterdivide. In the SE and S this summit level isinterrupted and a lower summit level is present, separated from summit level I bya distinct step. Some relation with parent rock may be assumed since, accordingto the geological map, the step coincides with the boundary between granite andvolcanites in some instances. At other places, however, summit level II is cutacross the volcanite-granite boundary without showing a step whatsoever.Enclosed in summit level II isolated groups of hills have altitudes that fit those ofsummit level I. Because of cartographic generalization__they are not shown on themap. Within the area of summit level II another step is recognized. The step hasa fragmentary, discontinuous character and in some cases it passes into the moredistinct and continuous step of level II. Because of its character it was not con-sidered justified to distinguish between two separate levels within the area ofsummit level II, although the local presence of the step may be taken as an indi-cation of a two phase development of level II. The third level (III) is not a summitlevel since it is confined to the valley floors and floodplains. Not all level valleyfloors are indicated in fig. 3.2.7. Some of them are enclosed in the area of summitlevel I or II.
In some areas where relative relief is very low, it is not possible to distinguishbetween summit level II and the valleyfloor level. In these cases there is a gradualtransition from one level into the other and no steps could be found, notably inthe areas of the Upper Sipaliwini Rivers in the southern and south-western part ofthe savanna. As was the case with summit level II, the level floodplains of the valley-floor level may include hills which with regard to their altitude belong to summitlevel II. Because of the degree of simplification used in drawing the simplifiedcontours and the necessary cartographic generalization these parts of summit levelII are not indicated on the map.
45
In comparing the summit level map with the land system map it appeared thatthere is a close correspondence between the Morro Grande Landscape and summitlevel I and between Sipaliwini Landscape and summit level II. The correspondencebetween the Valleyfioor Landscape and the valleyfioor level is obvious as well.From the close correspondence it was concluded that the summit levels and thevalleyfloor level form the link between the discerned descriptive land systems andthe geomorphological evolution of the landscapes.
The genesis of stepped planation levels has briefly been discussed in section II.3.It was concluded from the literature, that summit levels initially were formed asplanation levels which, due to a conversion of the conditions favourable for plana-tion into conditions in favour of vertical erosion, were dissected, leaving onlyremnants of the uiiginal plain. There has been, and still is much discussion aboutthe origin of planation levels. The main arguments regard, in summary, the conceptof etchplanation, which involves the denudation of previously weathered regoliths(landscape stripping), versus the concept of pediplanation, involving retreat ofhillslopes by which replacement slopes (pediments) are formed, extending as the •,hillslopes retreat. For a great deal, the discussion on etchplanation and pediplana-tion has gradually become a discussion on terminology with many speculationsabout environmental conditions during etchplanation and pediplanation. Whetherstripping of a deeply weathered regolith or hillslope retreat and the formation ofreplacement slopes is taking place, the processes at work, being weathering, surfacewash and fluvial action are very much the same. It is only their relative intensityand spatial variation that differs and decides what kind of definition can be appliedto the resultant landform: etchplain or pediplain.
The variables, controlling the intensity and spatial variations of the processesmentioned, are generally little known. The variables may be grouped under headingslike: climate, vegetation, relief and regolith. Since many of the variables involvedmay vary from region to region and from place to place, it is possible that bothtypes of planation may occur concurrently within one area or subsequent whenclimate or vegetation or relief and regolith properties have changed. As THOMAS(1966) concluded from his study on the Jos Plateau, patterns of deep and shallowweathering, resulting from etchplanation, were the primary feature of the terrainwhereas lateral planation (pediplanation) of residual hills followed incision andstripping of the regolith.Most factors related to climate, vegetation and relief affect the properties of theregolith and the soils that develop within it. Therefore, regolith and soil profilesdeserve more attention, as they contain much information on past and presentenvironmental conditions.
The regolith in the Upper Sipaliwini area has a varying thickness. The maximum
46
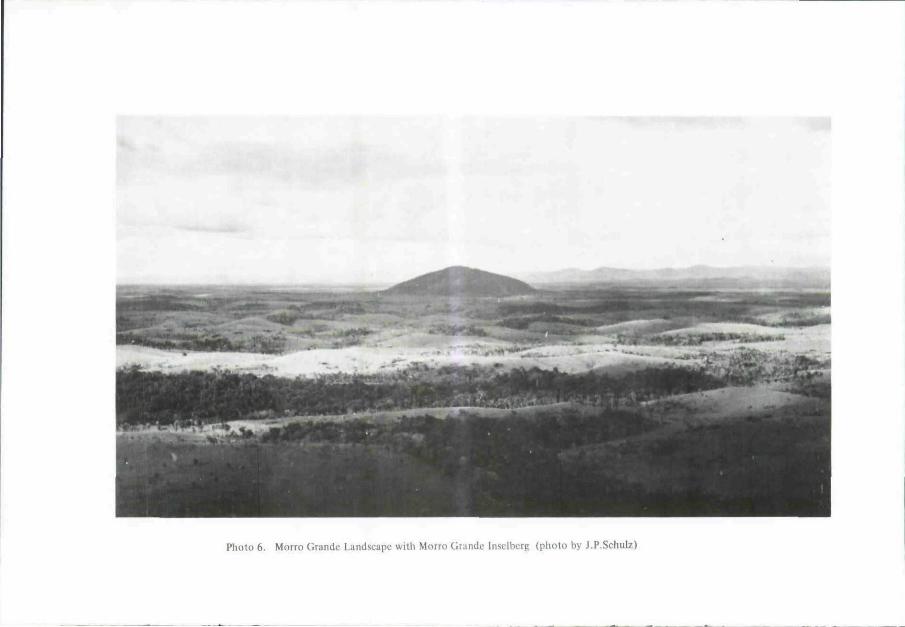
Photo 6. Morro Grande Landscape with Morro Grande Inselberg (photo by J.P.Schulz)
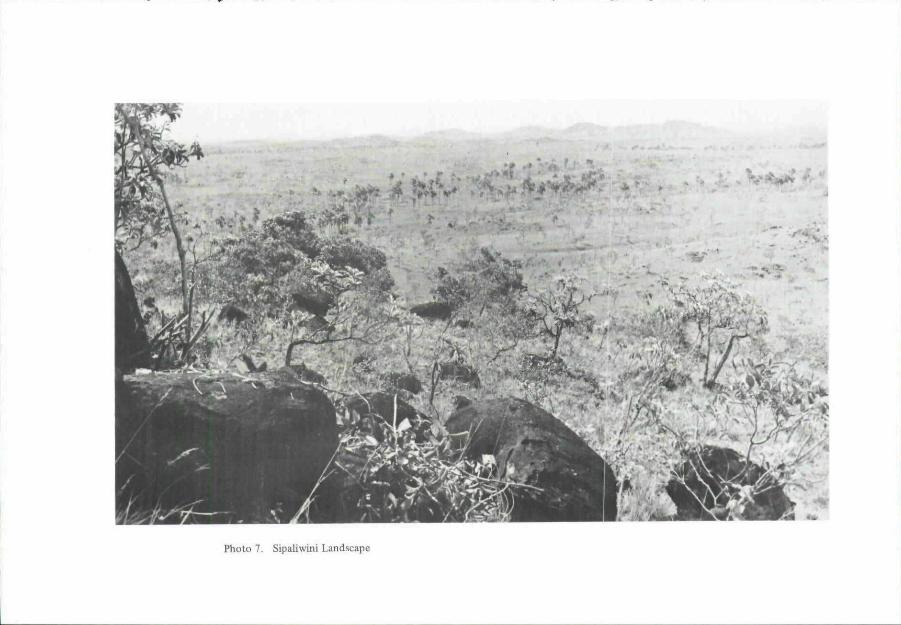
Photo 7. Sipaliwini Landscape
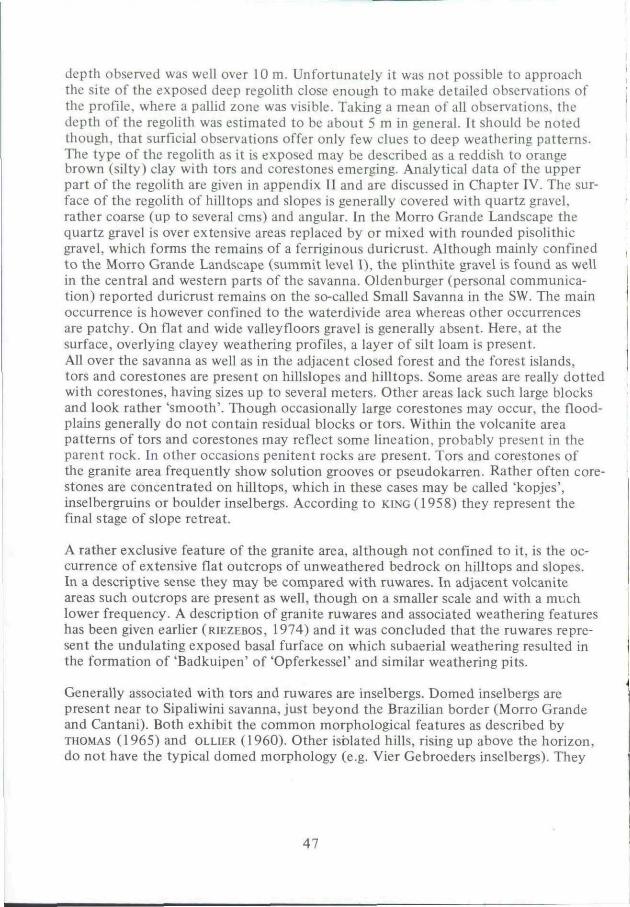
depth observed was well over 10 m. Unfortunately it was not possible to approachthe site of the exposed deep regolith close enough to make detailed observations ofthe profile, where a pallid zone was visible. Taking a mean of all observations, thedepth of the regolith was estimated to be about 5 m in general. It should be notedthough, that surficial observations offer only few clues to deep weathering patterns.The type of the regolith as it is exposed may be described as a reddish to orangebrown (silty) clay with tors and corestones emerging. Analytical data of the upperpart of the regolith are given in appendix II and are discussed in Chapter IV. The sur-face of the regolith of hilltops and slopes is generally covered with quartz gravel,rather coarse (up to several cms) and angular. In the Morro Grande Landscape thequartz gravel is over extensive areas replaced by or mixed with rounded pisolithicgravel, which forms the remains of a ferriginous duricrust. Although mainly confinedto the Morro Grande Landscape (summit level I), the plinthite gravel is found as wellin the central and western parts of the savanna. Oldenburger (personal communica-tion) reported duricrust remains on the so-called Small Savanna in the SW. The mainoccurrence is however confined to the waterdivide area whereas other occurrencesare patchy. On flat and wide valleyfloors gravel is generally absent. Here, at thesurface, overlying clayey weathering profiles, a layer of silt loam is present.All over the savanna as well as in the adjacent closed forest and the forest islands,tors and corestones are present on hillslopes and hilltops. Some areas are really dottedwith corestones, having sizes up to several meters. Other areas lack such large blocksand look rather 'smooth'. Though occasionally large corestones may occur, the flood-plains generally do not contain residual blocks or tors. Within the volcanite areapatterns of tors and corestones may reflect some lineation, probably present in theparent rock. In other occasions penitent rocks are present. Tors and corestones ofthe granite area frequently show solution grooves or pseudokarren. Rather often core-stones are concentrated on hilltops, which in these cases may be called 'kopjes',inselbergruins or boulder inselbergs. According to KING (1958) they represent thefinal stage of slope retreat.
A rather exclusive feature of the granite area, although not confined to it, is the oc-currence of extensive flat outcrops of unweathered bedrock on hilltops and slopes.In a descriptive sense they may be compared with ruwares. In adjacent volcaniteareas such outcrops are present as well, though on a smaller scale and with a muchlower frequency. A description of granite ruwares and associated weathering featureshas been given earlier (RIEZEBOS, 1974) and it was concluded that the ruwares repre-sent the undulating exposed basal furface on which subaerial weathering resulted inthe formation of 'Badkuipen' of 'Opferkessel' and similar weathering pits.
Generally associated with tors and ruwares are inselbergs. Domed inselbergs arepresent near to Sipaliwini savanna, just beyond the Brazilian border (Mono Grandeand Cantani). Both exhibit the common morphological features as described byTHOMAS (1965) and OLLIER (1960). Other isolated hills, rising up above the horizon,do not have the typical domed morphology (e.g. Vier Gebroeders inselbergs). They
47

are in the granite area as well and have concave slopes covered with weatheringmaterial of varying thickness. Real blockfields and exposed bedrock may be foundall over the slopes and on the tops.
Within the tropics the occurrence of a thick regolith is a widespread feature.Extensive areas in Australia, Africa, Asia and South America know deep weatheringprofiles of which a thickness between 10 and 50 m is considered typical (YOUNG,1976). A deep regolith profile may be subdivided into several zones that occur ina fairly constant arrangement. Apart from the soil sensu stricto, RUXTON & BERRY(1961) distinguish four of such (morphological) zones in a characteristic weatheringprofile on granite:
Zone I: a residual debris zone of structureless reddish-brown clay sand or sandy clay in which often anon-mottled upper layer and a mottled lower layer may be distinguished.
Zone II: a generally pale silty sand, still containing the structure of the parent granite and with minoramounts of unweathered rock as corestones (less than 50 °ó).
Zone III: à zone with a dominant content of corestones (over 50 °fo) and some residual debris.Zone IV: slightly weathered, massive, solid rock with less than 10 °/b debris.^
The transition to the fresh bedrock is usually shown at the base of zone III ratherthan zone IV (THOMAS, 1974). Although many variations on the described sequencemay occur, in most cases it is possible to refer to a basal surface of weathering orweathering front. The degree of rock decomposition is generally progressive, goingfrom the basal surface to the ground surface. Nevertheless, this trend may be inter-rupted by the occurrence of residual corestones in the various zones of weatheringprofiles. In general, a deep regolith may be considered as an expression of theprogress of chemical weathering.
Chemical weathering processes like hydrolysis, oxidation, hydration and synthesizingof new minerals, result in the alteration of the parent rock. The chemical changesthat rocks undergo upon weathering may be summarized as a loss of more readilyweatherable elements and a relative enrichment of iron, aluminium and someresistent elements like titanium. Consequently the silica-sesquioxide ratio is loweredcompared to the parent rock.Mineralogical changes comprise the decomposition and transformation of silicatesand other minerals, accompanied by newformation of minerals of clay size, such asclayminerals and iron and aluminium oxides and hydroxides.
In order to attain great depths of regolith material, weathering must take placeunder conditions where lowering of the weathering front proceeds at higher rates thanthe lowering of the ground surface. It is thought that such conditions have been andstill are present at low-relief erosion surfaces on which maximum slope angles do notexceed 2-3° (YOUNG, 1976). Rejuvenation of these surfaces may disturb the desequi-librium between the lowering of the basal surface and that of the ground surface. Anincreased rate of denudation will decrease the depth of the regolith or bring about anequilibrium between ground surface and basal surface lowering.
48
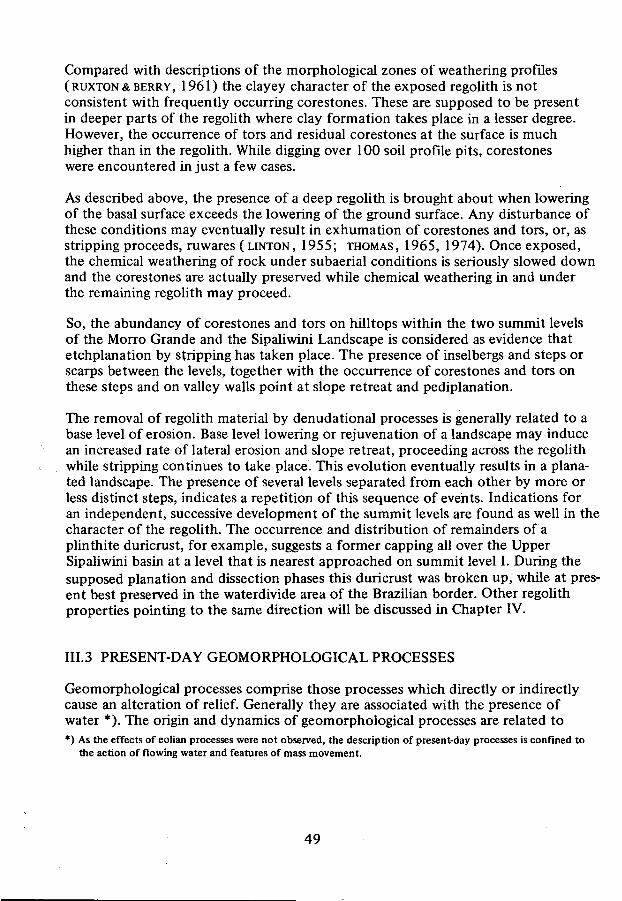
Compared with descriptions of the morphological zones of weathering profiles(RUXTON& BERRY, 1961) the clayey character of the exposed regolith is notconsistent with frequently occurring corestones. These are supposed to be presentin deeper parts of the regolith where clay formation takes place in a lesser degree.However, the occurrence of tors and residual corestones at the surface is muchhigher than in the regolith. While digging over 100 soil profile pits, corestoneswere encountered in just a few cases.
As described above, the presence of a deep regolith is brought about when loweringof the basal surface exceeds the lowering of the ground surface. Any disturbance ofthese conditions may eventually result in exhumation of corestones and tors, or, asstripping proceeds, ruwares (LINTON, 1955; THOMAS, 1965, 1974). Once exposed,the chemical weathering of rock under subaerial conditions is seriously slowed downand the corestones are actually preserved while chemical weathering in and underthe remaining regolith may proceed.
So, the abundancy of corestones and tors on hilltops within the two summit levelsof the Morro Grande and the Sipaliwini Landscape is considered as evidence thatetchplanation by stripping has taken place. The presence of inselbergs and steps orscarps between the levels, together with the occurrence of corestones and tors onthese steps and on valley walls point at slope retreat and pediplanation.
The removal of regolith material by denudational processes is generally related to abase level of erosion. Base level lowering or rejuvenation of a landscape may inducean increased rate of lateral erosion and slope retreat, proceeding across the regolithwhile stripping continues to take place. This evolution eventually results in a plana-ted landscape. The presence of several levels separated from each other by more orless distinct steps, indicates a repetition of this sequence of events. Indications foran independent, successive development of the summit levels are found as well in thecharacter of the regolith. The occurrence and distribution of remainders of aplinthite duricrust, for example, suggests a former capping all over the UpperSipaliwini basin at a level that is nearest approached on summit level I. During thesupposed planation and dissection phases this duricrust was broken up, while at pres-ent best preserved in the waterdivide area of the Brazilian border. Other regolithproperties pointing to the same direction will be discussed in Chapter IV.
III.3 PRESENT-DAY GEOMORPHOLOGICAL PROCESSES
Geomorphological processes comprise those processes which directly or indirectlycause an alteration of relief. Generally they are associated with the presence ofwater *). The origin and dynamics of geomorphological processes are related to*) As the effects of eolian processes were not observed, the description of present-day processes is confined to
the action of flowing water and features of mass movement.
49

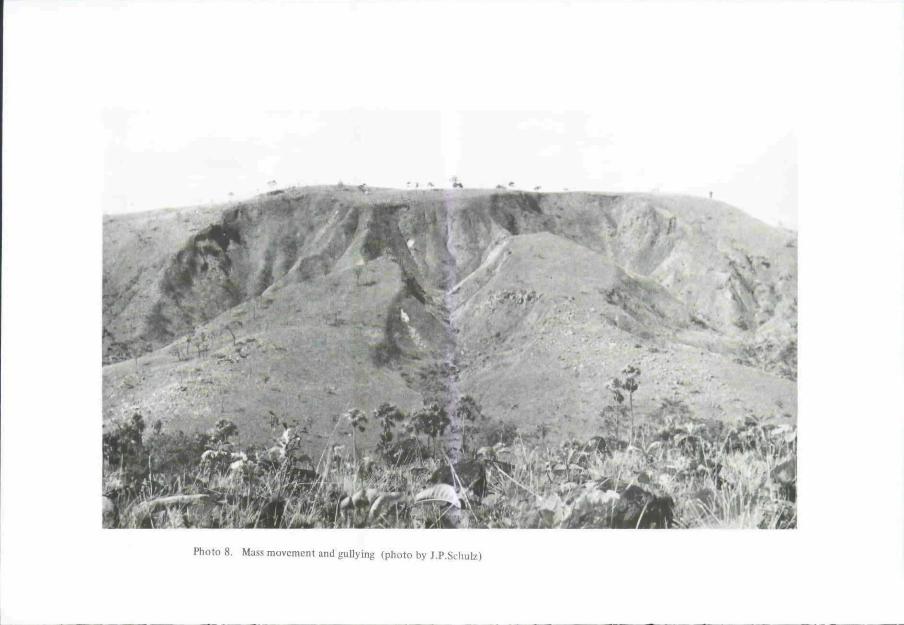
I '• O *
Photo 8. Mass movement and gullying (photo by J.P.Schulz)
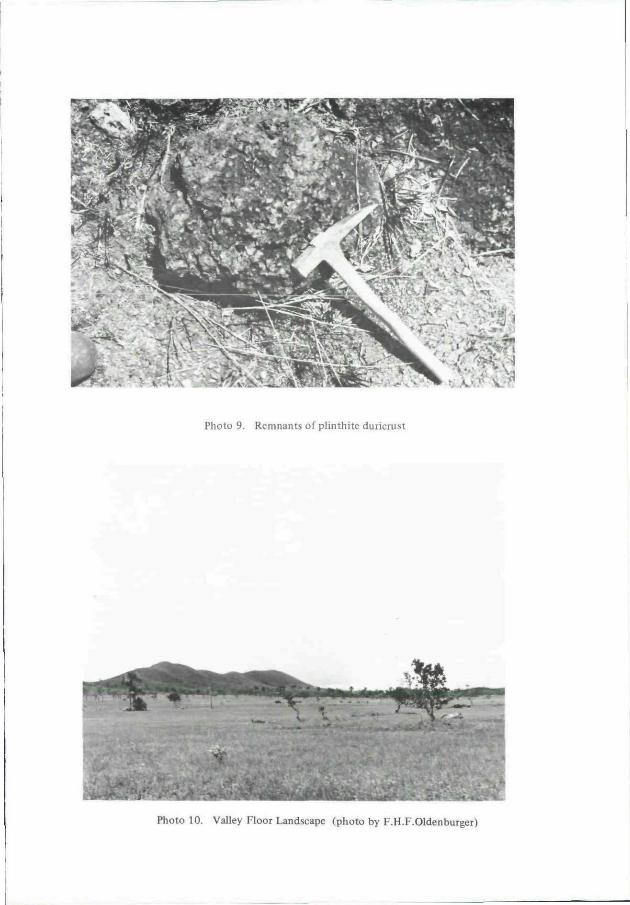
Photo 9. Remnants of plinthite duricrust
Photo 10. Valley Floor Landscape (photo by F.H.F.Oldenburger)

climate and gravity and their intensity is influenced by the properties of the com-ponents of the morphological system.Apart from changing relief, flowing water is the agent by which sediments andsolutes move within the systems and from one system to another. Therefore,geomorphological processes are important in an ecological context.The observations on present-day processes made during the fieldwork are mainlyqualitative since the character of the expeditions did not allow for a full quantitat-ive approach. The qualitative observations regard channel run off, mass movementand surface run off on slopes whereas some measurements were made on infiltrationand soil erodibility.
RIVERSAND VALLEYFLOORS
Apart from their importance for the drainage of their catchments, rivers influencethe denudation processes in their basins. They form the local base leve! of erosionto which the relief is eventually adjusted and their transport capacity forms theboundary conditions for the amount of mass which may be removed. Furthermore,rivers themselves contribute to denudation because of their ability to erode theirbeds and banks.The erosive power of rivers depends mainly on discharge, gradient and sedimentload whereas theoretically denudation within the watershed continues until there isno difference in height between the landsurface and the local erosion base level.Lowering of the local erosion base by river incision (rejuvenation) causes a newdenudational cycle of slope retreat in the drainage basin. It may therefore be saidthat denudational processes in the watershed are related to the flow regime of therivers and the changes that the longitudinal river profiles undergo.The main rivers of Sipaliwini savanna have a low gradient. Long profiles of therivers and their main tributaries are given in fig. 3.3.2. Gradients of the Sipaliwinirivers range between 1.8 qbo and 4.6 Sbo. Gradients of the main tributaries aresomewhat greater and their profiles are less smooth, showing steps. Although lessprominantly, steps occur in the long profile of the Sipaliwini rivers as well. In allcases steps in the long profiles are bound to the occurrence of resistent fresh bed-rock. Apart from the sites of the steps, the bed of creeks and rivulets is developedin weathered rock. The bed of the main rivers is developed in fresh rock. Theirbanks are formed by the strongly weathered regolith of the valleyfloors which liesabout 2 m higher than the riverbed. The steps in the longprofile of the rivers are notshown in fig. 3.3.2 because of the reduced scale. In the field however, the steps maybe associated with numerous small rapids which are known as 'soela's'. For the mid-and lower part of Sipaliwini River I the location of the soela's is indicated (fig.3.3.2).The difference in magnitude of the steps between the Sipaliwini rivers and the maintributaries may be attributed to the greater erosive power of the rivers compared tothat of the tributaries.The regime of the rivers and tributaries shows great fluctuations in discharge, partlydue to the generally low gradient. During dry periods the rivers have a very low
50

r \i ^
\.
"Zforest\savi
^—
l .-7
K
: irstrip (gV~/
^ * \
i
sl
^ v( .-
forest'savanna
f
nna /
(
SURINAME 1
\
Vmp y '
, S I P A L I W I N I
/ " ^^%-
BRAZIL
v• \
f'\
1 1SAVANNA
--—
't\"j
A
——.- state boundary
^i river
forest-savanna boundary
A inselberg complex
\
\
\ ~ -—•
'l1
De vier gebroeders 1
'\\
\
^j BRAZIL
t .
K
y north
5 10 km
-2»NL
Fig. 3.3.1. Sipaliwini Rivers and Main Creeks (numbers refer to river long profiles of fig. 3.3.2.)
51
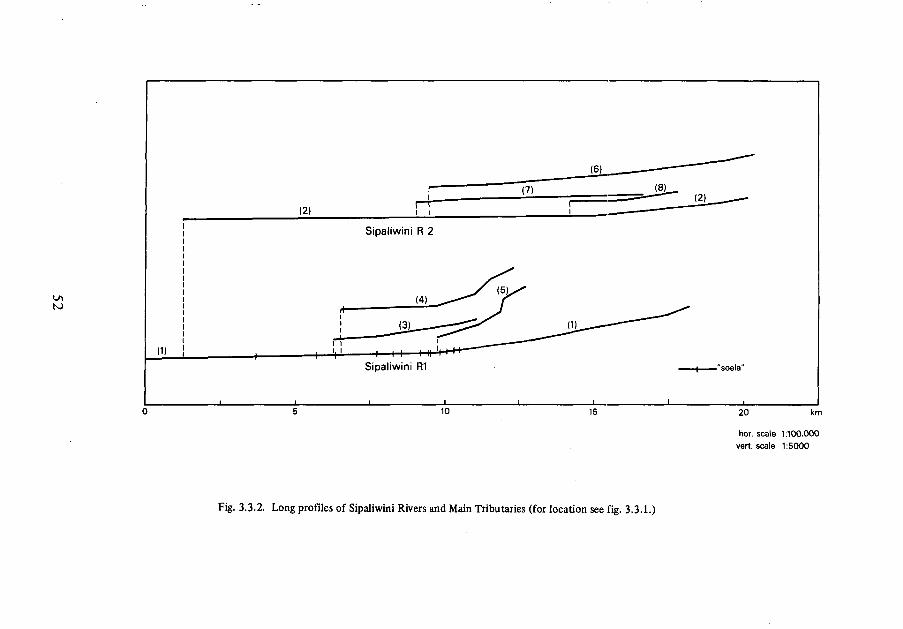
Ui(O
(1)
(2)
Sipaliwini R 2
Sipaliwini R1
10 15
"soela"
20 km
hor. scale 1:100.000vert, scale 1:5000
Fig. 3.3.2. Long profiles of Sipaliwini Rivers and Main Tributaries (for location see fig. 3.3.1.)
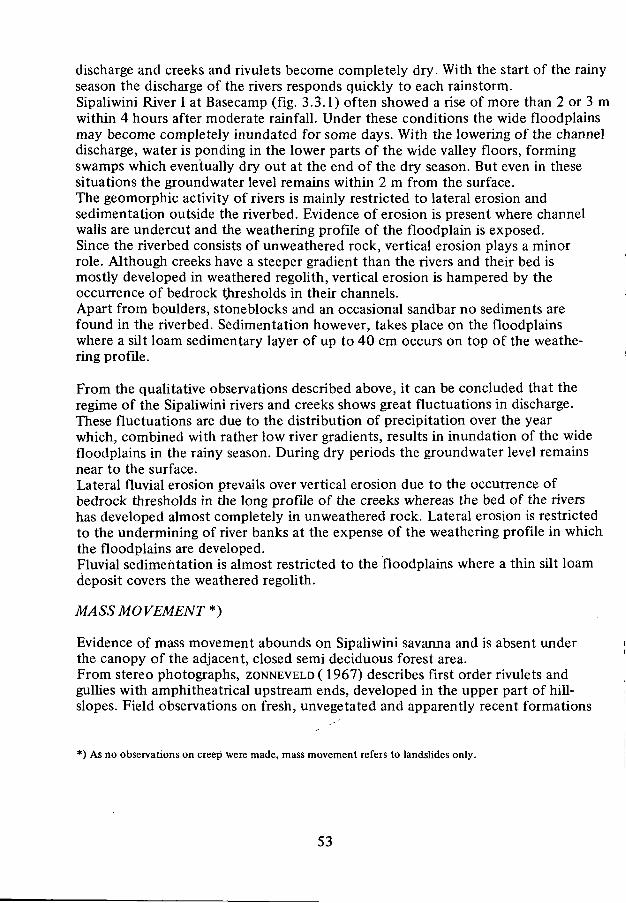
discharge and creeks and rivulets become completely dry. With the start of the rainyseason the discharge of the rivers responds quickly to each rainstorm.Sipaliwini River I at Basecamp (fig. 3.3.1) often showed a rise of more than 2 or 3 mwithin 4 hours after moderate rainfall. Under these conditions the wide floodplainsmay become completely inundated for some days. With the lowering of the channeldischarge, water is ponding in the lower parts of the wide valley floors, formingswamps which eventually dry out at the end of the dry season. But even in thesesituations the ground water level remains within 2 m from the surface.The geomorphic activity of rivers is mainly restricted to lateral erosion andsedimentation outside the riverbed. Evidence of erosion is present where channelwalls are undercut and the weathering profile of the floodplain is exposed.Since the riverbed consists of unweathered rock, vertical erosion plays a minorrole. Although creeks have a steeper gradient than the rivers and their bed ismostly developed in weathered regolith, vertical erosion is hampered by theoccurrence of bedrock thresholds in their channels.Apart from boulders, stoneblocks and an occasional sandbar no sediments arefound in the riverbed. Sedimentation however, takes place on the floodplainswhere a silt loam sedimentary layer of up to 40 cm occurs on top of the weathe-ring profile.
From the qualitative observations described above, it can be concluded that theregime of the Sipaliwini rivers and creeks shows great fluctuations in discharge.These fluctuations are due to the distribution of precipitation over the yearwhich, combined with rather low river gradients, results in inundation of the widefloodplains in the rainy season. During dry periods the groundwater level remainsnear to the surface.Lateral fluvial erosion prevails over vertical erosion due to the occurrence ofbedrock thresholds in the long profile of the creeks whereas the bed of the rivershas developed almost completely in unweathered rock. Lateral erosion is restrictedto the undermining of river banks at the expense of the weathering profile in whichthe floodplains are developed.Fluvial sedimentation is almost restricted to the floodplains where a thin silt loamdeposit covers the weathered regolith.
MASS MO VEMENT *)
Evidence of mass movement abounds on Sipaliwini savanna and is absent underthe canopy of the adjacent, closed semi deciduous forest area.From stereo photographs, ZONNEVELD ( 1967) describes first order rivulets andgullies with amphitheatrical upstream ends, developed in the upper part of hill-slopes. Field observations on fresh, unvegetated and apparently recent formations
*) As no observations on creep were made, mass movement refers to landslides only.
53

Photo 11. Stereo-pair, illustrating landslip scars and gullying on Sipaliwini Savanna
Photo KLM-Aerocarto, copyright C.B.L.
of these hillside depressions clearly indicate an origin as landslip, associated withgullying. The horse-shoe shaped hillside depressions have almost perpendicularsidewalls with heights that range from some decimeters to several meters. Thesidewalls, in which the weathering profile is exposed, pass abruptly into a low-anglecirque-floor, drained by one or more gullies and with a hummocky topography ofthe landslip mass. The landslip mass consists of clayey regolith material which maycontain corestones and strongly weathered boulders. The original form of thelandslips as observed on fresh formations, is in many cases modified by more recentsurface erosion- and sedimentation processes. These resulted in smoothening ofthe scarps between hillslope and sidewalls of the slip and in the development of agradual transition between sidewalls and cirque-floor. The cirque-floor even mayhave been dissected by gullying to such an extent that it is not recognizable as such.In all cases the modified landslides are revegetated, either by savanna vegetation orby dense forest. In fact, most of the forest islands present on the savanna, are asso-ciated with the occurrence of landslips.Comparable mass movement features in deep regoliths of Nyika Plateau, Malawi,have recently been described and explained by SHRODER (1976). Mass movement onhillslopes is presumably generated whenever local watersaturation of the deepregolith leads to failure. On several occasions, even in the dry season, seepage waterwas observed on the higher part of hillslopes. Under these circumstances springsapping may occur. The development of gullies on such hillslopes may greatly con-tribute to landslide failure as gullies tend to undermine the upslope regolith.The revegetation of landslip scars by forest is promoted by favourable soil waterconditions in these moist sites whereas the topography of the hillside depressionsoffers protection from fire.
SURFACE WASH
The presence of truncated soils all over the savanna area together with the patchyoccurrence of bare, unvegetated surfaces covered with quartz gravel suggest activesurface wash processes.In order to obtain indications concerning the rates of surface wash both undersavanna and forest conditions, measurements of infiltration capacity and sedimenttransport by overland flow were performed on slopes on the savanna and under aforest canopy.
The effectiveness of surface wash processes is related to a number of soil properties,vegetation characteristics and topographic conditions. The role of many of thevariables involved is not yet well understood and there seems to be no reliableindex of soil erodibility (BRYAN, 1976).Since these properties vary with different physiographic units, 5 representativeslopes were selected where measurements on surface wash and infiltration ratescould be made. Selection criteria had to be a compromise between physiographicproperties and trivial aspects like reachability.
55

r \ \nr-,
forests savanna ƒ
•~> 1 SURINAME |
Äxl»teteo"T * 2 \-5?®Sta«on "p /
forest / savanna i, \
x~... f \ A-.-..• - v V ^
BRAZIL • »
• \
i
* 4
/
\
\
— state boundary
^—^ - river
forest-savanna boundary
A inselberg complex
^ expirimental sites
ƒ\"l"—-v/'l
j
j« • • ' '
• De vier gebroeders 1
\\
\ BRAZIL
•* north
y
S 10 km
Fig. 3.3.3. Location of experimental sites for surface wash measurements
56
EXPERIMENTAL SITES
Sipaliwini landscape
Within the Sipaliwini landscapes 3 slopes were instrumented (fig.3.3.3). Site 1 isunder semi-deciduous forest, near to the forest-savanna boundary. Mean slopeangle is 8.5 % and the slope length is 130 m. The soil surface is relatively barealthough some litter as well as some corestones are présent. Erosional featuresare restricted to the lower part of the slope where a gully has been formed. Thesoil toplayer is orange and is underlain by a bright brown B-horizon.Sites 2 and 3 are on the savanna. Site 2 has a slope angle of 14.2 %. Slope lengthis 115 m. The slope angle of site 3 is 8.6 % and its length is 150 m. The vegetationon both sites is that described under formation I (see table 2.5.1).The soil surface on slope 2 is locally bare. Litter is absent and some corestonesoccur between a discontinuous layer of quartz gravel. The same holds for slope 3,but for the corestones which here occur very frequently. Several rills and gulliesare present on both slopes. The soil profiles of sites 2 and 3 have a yellowish browntopsoil underlain by a bright reddish brown B-horizon.
Morro Grande landscape
In the Morro Grande landscapes 2 slopes were selected. Slope 4 is situated in aforest island in the NE of the savanna. Slope length is 95 m and the mean slope angleis 27 %. The topsoil-horizon is dark brown -brown and the subsoil is reddish brown.Apart from some litter the soil surface is bare. Large granitic corestones are scatteredover the slope. Site 5 is a slope under a thin cover of savanna grasses with occasionallygnarled trees present. Mean slope angle is 24.4 % and the slope length amounts 170 m.At the surface a patchy layer of indurated iron concretions occurs and corestones orrock outcrops are absent. The topsoil is dull yellowish brown and the subsoil isbrown to yellowish brown.
METHODS
Surface wash resulting from rainsplash and overlandflow was measured by means ofstakes (SCHUMM, 1956) and sediment traps (YOUNG, 1960; GERLACH, 1967). The stakewere driven into the ground at about every 10 m along a line perpendicular to thecontours. The distance between the top of the stake and the groundsurface wasmeasured on the downslope side of the stake at the start of the experiment and atthe end. Measurements in-between were not possible.Over the same experimental period sediment traps collected soil particles transportedby overland flow. The PVC-traps, 50 cm wide and 10 cm deep, were dug into the soilprofile. An aluminium lip, with which the traps were provided at one long side, wascarefully pressed into the soil profile parallel to the surface at a depth of 2 - 3 cm.An aluminium cover plate, leaving a front opening of 2 cm high, protected the sedime;
57
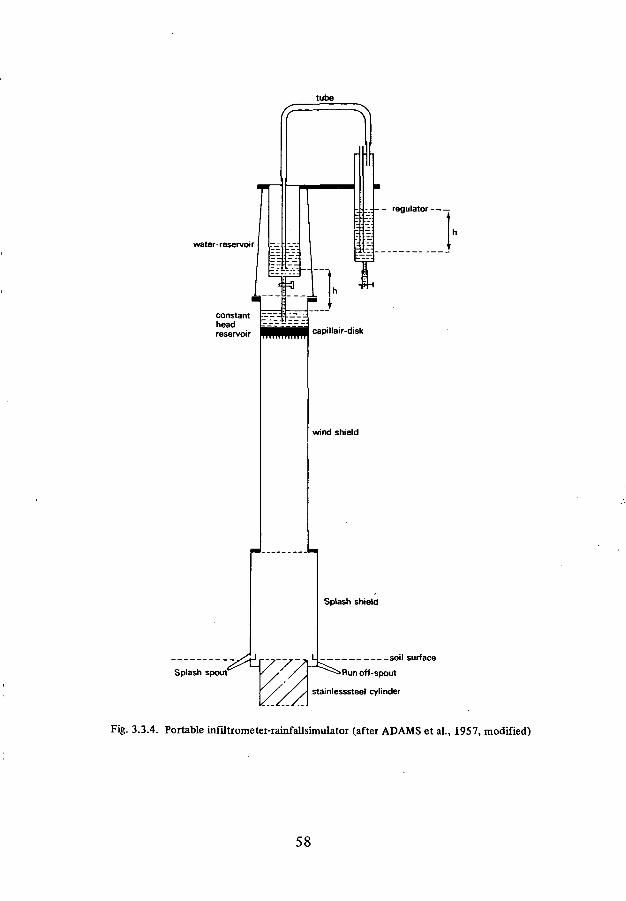
tube
water-reservoir
constantheadreservoir
r . - - - regulator
capillair-disk
wind shield
Splash spout
Splash shield
soil surface
~~^=> Run off-spout
stainlesssteel cylinder
Fig. 3.3.4. Portable infiltrometer-rainfallsimulator (after ADAMS et al., 1957, modified)
58
trap from influences of rain splash. A 10 or 20 1. container was dug into theground downslope of the trap and connected with an overflow pipe in the bottomof the trap by a piece of waterhose. Thus, it was assumed, any surplus of water,eventually with suspended load, would be collected. Unfortunately, the amountof trapped water exceeded the volume of most of the containers. A relationshipbetween sediment- and water discharge could therefore not be established.Infiltration rates were measured by means of 10 cm long pipes, 5 cm in diameter.The pipes were driven into the ground for 5 cm in order to prevent lateral escapeof infiltrating water over that depth. During the tests a constant hydraulic headof 40 mm was maintained (HILLS , 1970). The use of double-ring infiltrometerswith greater diameters was not possible because of their greater weight andpacking volume, prohibitive factors in expeditions like the ones made. Infiltrationtests were performed at several points along the slope profile, at each pointseveral times. Apart from the infiltration tests and wash measurements describedabove, integral measurements of infiltration, wash and splash were made using aportable infiltrometer-rainfallsimulator. The device (after ADAMS et al., 1957,modified, fig.3.3.4) consists of a stainless steel cylinder (14.5 cm <f> and 14.5 cmhigh) which is driven completely and carefully into the soil. On the upper side ofthe cylinder a small gutter is present in which run off is gathered during rainfallsimulation. A small spout leads to a sample bottle. On the edge of the run offgutter rests a plexiglass splash shield provided with another gutter and spout inorder to collect the splashed soil particles dripping from the inside of the shield.A plexiglass wind shield is placed on top of the splash shield. On the wind shieldrests a supply tank with a rotable disk, containing raindrop applicators. A 1 literreservoir supplies water to the supply tank and is connected by a flexible tubingwith the pressure-head regulator which controls the rainfall intensity.All tests were performed with a constant rainfall intensity of 80 mm/hr over a hor-izontal surface of 165 cm2. The rainfall applicator disk, giving raindrops with adiameter of 5.8 mm, was turned during the test to ensure a regular distributionof rain over the surface. At each site but slope 3, several tests were performed withthe rainfall simulator-infiltrometer at about midway of the slope. In view of occur-ring side effects, the test showing the lowest infiltration rate was considered as rep-resentative.
RAINFALL CHARACTERISTICS
Statistically rainfall in the months May, June and July amounts to 309, 385 and215 mm respectively. However, the expected depth of rain in 1972 lagged behind.For the longest experimental period (7 weeks for site 1 and 2) the total precipi-tation was only 197.5 mm.From the records of the meteorological station at Sipaliwini airstrip and ownobservations the maximum intensity and amount of rainfall per shower were com-puted (table 3.3.5). Over the period of 7 weeks 26 showers occurred. Total depthsof rain per shower varied between 17.4 and 0.1 mm. Maximum intensities rangedfrom 0.6 mm/hr to 56.8 mm/hr. Only 12 showers reached intensities of 25 mm/hr
59
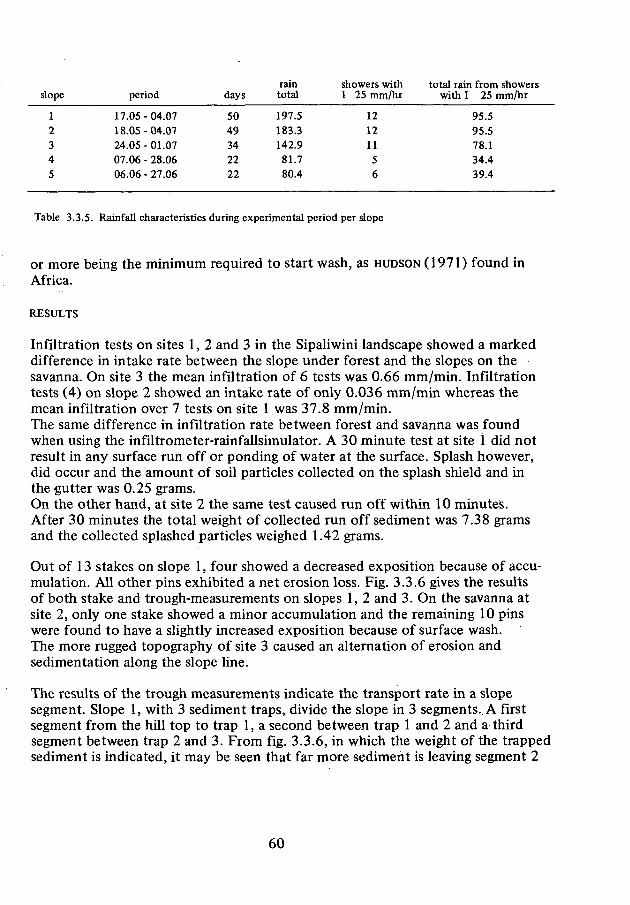
slope
12
34
5
period
17.05 - 04.0718.05 - 04.0724.05 - 01.0707.06 - 28.0606.06 - 27.06
days
5049342222
raintotal
197.5183.3142.981.780.4
showers withI 25 mm/hr
12121156
total rain from showerswith I 25 mm/hr
95.595.578.134.439.4
Table 3.3.5. Rainfall characteristics during experimental period per slope
or more being the minimum required to start wash, as HUDSON (1971) found inAfrica.
RESULTS
Infiltration tests on sites 1, 2 and 3 in the Sipaliwini landscape showed a markeddifference in intake rate between the slope under forest and the slopes on thesavanna. On site 3 the mean infiltration of 6 tests was 0.66 mm/min. Infiltrationtests (4) on slope 2 showed an intake rate of only 0.036 mm/min whereas themean infiltration over 7 tests on site 1 was 37.8 mm/min.The same difference in infiltration rate between forest and savanna was foundwhen using the infiltrometer-rainfallsimulator. A 30 minute test at site 1 did notresult in any surface run off or ponding of water at the surface. Splash however,did occur and the amount of soil particles collected on the splash shield and inthe-gutter was 0.25 grams.On the other hand, at site 2 the same test caused run off within 10 minutes.After 30 minutes the total weight of collected run off sediment was 7.38 gramsand the collected splashed particles weighed 1.42 grams.
Out of 13 stakes on slope 1, four showed a decreased exposition because of accu-mulation. All other pins exhibited a net erosion loss. Fig. 3.3.6 gives the resultsof both stake and trough-measurements on slopes 1, 2 and 3. On the savanna atsite 2, only one stake showed a minor accumulation and the remaining 10 pinswere found to have a slightly increased exposition because of surface wash.The more rugged topography of site 3 caused an alternation of erosion andsedimentation along the slope line.
The results of the trough measurements indicate the transport rate in a slopesegment. Slope 1, with 3 sediment traps, divide the slope in 3 segments. A firstsegment from the hill top to trap 1, a second between trap 1 and 2 and a thirdsegment between trap 2 and 3. From fig. 3.3.6, in which the weight of the trappedsediment is indicated, it may be seen that far more sediment is leaving segment 2
60
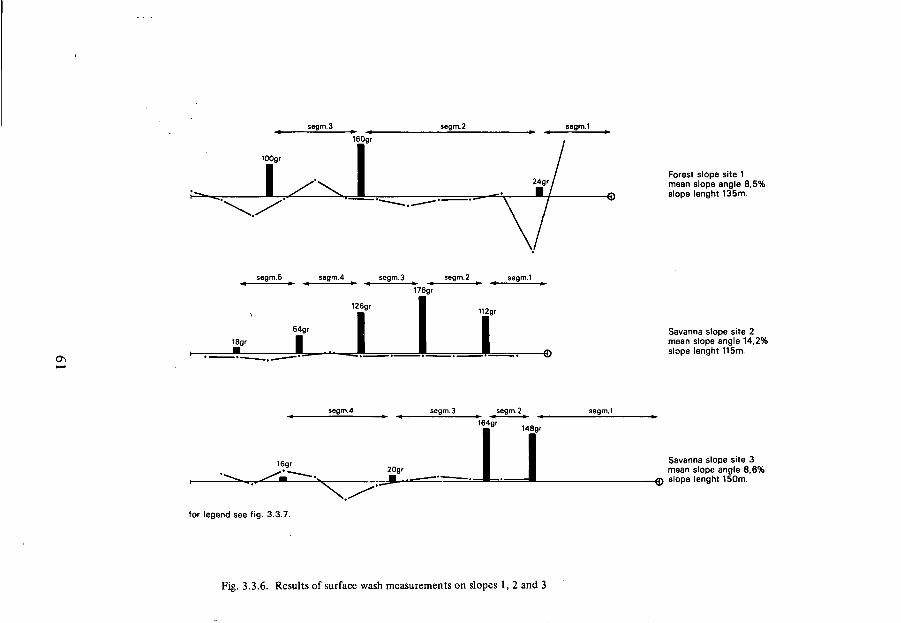
segm.3 segm.2 segm.1
160gr
100gr
Forest slope site 1mean slope angle 8,5%slope lenght 135m.
segm.5 segm.4 segm.3 segm.2 segm.1
176gr
126gr
54gr I18gr | I
112gr
O\
Savanna slope site 2mean slope angle 14,2%slope lenght 115m.
segm.3 segm.2
164gr148gr
segm.1
16gr20gr
for legend see fig. 3.3.7.
Savanna slope site 3mean slope angle 8,6%slope lenght 150m.
Fig. 3.3.6. Results of surface wash measurements on slopes 1, 2 and 3
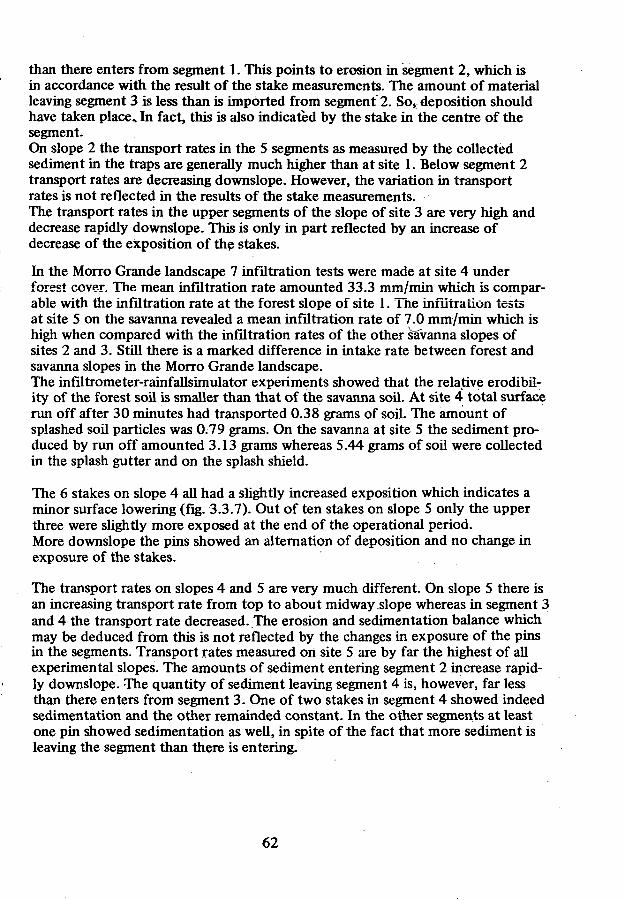
than there enters from segment 1. This points to erosion in segment 2, which isin accordance with the result of the stake measurements. The amount of materialleaving segment 3 is less than is imported from segment 2. So*, deposition shouldhave taken place. In fact, this is also indicated by the stake in the centre of thesegment.On slope 2 the transport rates in the 5 segments as measured by the collectedsediment in the traps are generally much higher than at site 1. Below segment 2transport rates are decreasing downslope. However, the variation in transportrates is not reflected in the results of the stake measurements.The transport rates in the upper segments of the slope of site 3 are very high anddecrease rapidly downslope. This is only in part reflected by an increase ofdecrease of the exposition of the stakes.
In the Morro Grande landscape 7 infiltration tests were made at site 4 underforest cover. The mean infiltration rate amounted 33.3 mm/min which is compar-able with the infiltration rate at the forest slope of site i. The infiltration testsat site 5 on the savanna revealed a mean infiltration rate of 7.0 mm/min which ishigh when compared with the infiltration rates of the other savanna slopes ofsites 2 and 3. Still there is a marked difference in intake rate between forest andsavanna slopes in the Morro Grande landscape.The infiltrometer-rainfallsimulator experiments showed that the relative erodibil-ity of the forest soil is smaller than that of the savanna soil. At site 4 total surfacerun off after 30 minutes had transported 0.38 grams of soil. The amount ofsplashed soil particles was 0.79 grams. On the savanna at site 5 the sediment pro-duced by run off amounted 3.13 grams whereas 5.44 grams of soil were collectedin the splash gutter and on the splash shield.
The 6 stakes on slope 4 all had a slightly increased exposition which indicates aminor surface lowering (fig. 3.3.7). Out of ten stakes on slope 5 only the upperthree were slightly more exposed at the end of the operational period.More downslope the pins showed an alternation of deposition and no change inexposure of the stakes.
The transport rates on slopes 4 and 5 are very much different. On slope 5 there isan increasing transport rate from top to about midway slope whereas in segment 3and 4 the transport rate decreased. The erosion and sedimentation balance whichmay be deduced from this is not reflected by the changes in exposure of the pinsin tiie segments. Transport rates measured on site 5 are by far the highest of allexperimental slopes. The amounts of sediment entering segment 2 increase rapid-ly downslope. The quantity of sediment leaving segment 4 is, however, far lessthan there enters from segment 3. One of two stakes in segment 4 showed indeedsedimentation and the other remainded constant. In the other segments at leastone pin showed sedimentation as well, in spite of the fact that more sediment isleaving the segment than there is entering.
62
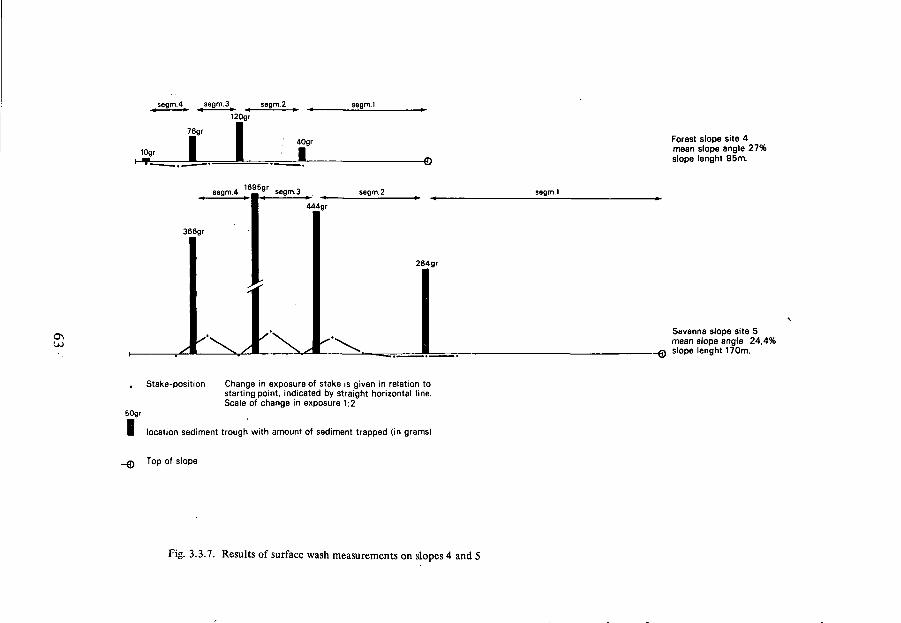
segm.4_ segm.3^ segm.2
120gr
Lsegm.l
10gr40gr
-©
Forest slope site 4mean slope angle 27%slope lenght 95m.
ON
366gr
264gr
segm.l
Savanna slope site 5mean slope angle 24,4%
0 slope lenght 170m.
, Stake-position Change in exposure of stake is given in relation tostarting point, indicated by straight horizontal line.Scale of change in exposure 1:2
50gr
I location sediment trough with amount of sediment trapped (in grams)
Top of slope
Fig. 3.3.7. Results of surface wash measurements on slopes 4 and 5
INTERPRETATION
Surface wash may be defined as the downslope transport of regolith materialacross the groundsurface through the agency of moving water (YOUNG, 1972).The processes involved are raindrop impact and overlandflow. Whenever rainfallintensity exceeds the infiltration capacity of the soil, excess of water startsponding. The eventually resulting overland flow may entrain soil particles. Thisentrainment is for the greater part depending on the action of splash by which soilparticles are detached (VANASCH, 1979 in press; BRYAN, 1976; FËÖDOROFF, 1965).Initially, overland flow is unconcentrated but, depending on slope angle, microtop-ography and slope length the flow tends to concentrate in small channels or rills.This change in type of flow will affect the amount of transported material as well asthe effectiveness of drop impact in detaching soilparticles.The methods of measurement described above did not distinguish between splasherosion and sheet or riii wash. Any change in stake exposure shows the net resultof erosion or sedimentation by rainsplash or overland flow.It is not possible to give a detailed interpretation of the observed denudation ordeposition as a consequence of the short period over which the measurementswere made together with the limitations of the methods used and the relativelysmall number of tests.From the results the following discrepancies come forward. First of all there is theproblem of high infiltration rates measured under forest and yet there is transportby overland flow, as revealed by the contents of sediment traps. Secondly, thetransport rates of the different slope segments is generally not consistent with theobserved erosion and deposition near the stakes which were placed next to theslope line on which the sediment traps were installed.Overland flow accompanied by sediment wash occurs on forest slopes, thoughgenerally to a much lesser degree than on savanna slopes, in spite of the establischedhigh infiltration rates. Although infiltration measurements by means of smalldiameter rings cannot be considered very accurate, the results are consistent withthose of the infiltrometer-rainfall simulator which has a ring with a greater diameteras well as a greater depth. It is suggested that the rainfall intensities that wererecorded during the experimental period resulted in saturation of the topsoil. Onslope 1 the topsoil contains 18% clay, a percentage which rapidly increases to 41%in the subsoil that starts at a depth of 20 cm. At site 4 the topsoil is a sandy loamwith 14% clay whereas the subsoil at 25 cm contains 33% clay. As the intake ratesof soils generally decrease with increasing clay content, it is assumed that duringthe infiltration tests over small surfaces infiltrating water escaped laterally, causinghigh intake rates which are not effective during rainfall.The inconsistency between transport rates and net erosion and deposition hasprobably been caused by microtopographical conditions on the slopes. A slope maybe considered as composed of numerous small interconnected drainage basins. Thelocation of a stake or trap within the structure of such microdrainage basins is
64
likely to affect the measurements considerably. Apart from these spatial variationsof physiographic properties of the slope there is a temporal variation as well.Rill- and interrill-zones on the slope alternate and shift in time (MEYER et al., 1975)and this variation will affect the results of measurement too. Only long-termmeasurements would suppress these effects. As the sediment traps have largerdimensions their measurement results are probably more reliable than the pointobservations of the erosion pins.
Another point of interest is the comparison between the effectiveness of surfacewash under forest and under savanna conditions. It has been assumed by manyauthors that erosion rates rapidly decrease when a continuous vegetation cover ispresent (LANGBEIN & SCHUMM, 1958; FOURNIER, 1962; SCHUMM, 1964). On the otherhand, several authors pointed to the effectiveness of surface wash under tropicalrainforest (BIROT, 1960; RUXTON , 1967; ROUGERIE, 1956), although as THOMAS(1974) states, most examples are connected with conditions of high relief andsteep slopes. Such conditions are not applicable to Sipaliwini savanna. Nevertheless,erosion rates on the savanna are higher than under forest. The mean volumetricmovement of soil particles may be calculated from the amounts of sediment trappedin the troughs under forest and savanna conditions over a width of 50 cm. On thebasis of a total amount of precipitation of 197.5 mm for each slope and a soil bulkdensity of 2.5 gr/cm3, the mean volumetric movement of soil particles on the twoforest slopes is 1.2 cra^/cm. On the savanna slopes the mean volumetric movementis 5.13 cm3/cm. An extrapolation of these figures to the mean yearly rainfall of2169 mm would be inappropriate since no proper data are available on rainfallintensities. The high transport rates on the savanna slopes are due to low infiltrationrates. Soil aggregation and aggregate stability in forest soils is promoted by the highbiological activity as contrasted with savanna soils. Analysis of aggregate stabilityproved to be impossible after shipping and arrival of the samples. However, fromfield descriptions of the soil structure (table 3.3.8) and data on carbon and nutrientcontents (table 3.3.9), important factors for aggregation and (micro)biologicalactivity, it is deduced that aggregate stability of forest soils is likely to be greaterthan that of savanna soils. As a consequence the aggregates of savanna soils willmore easily be decomposed under the impact of raindrops. The fine particles aredetached and fill up the soil pores. The result is surface sealing and an increase ofsurface run off which will entrain detached soil particles.
65

slope
1
2
3
4
5
structure
moderately well developedmedium subangular blocky
weakly developedvery fine subangular blocky
weakly developedfine subangular blocky
structurelesssingle grain
moderately well developedfine subangular blocky
Table 3.3.8. Structure of the topsoil on the experimental slopes
CaO
ppm
MgO
ppm
K2O
ppm
Na2O
ppm
Fe2O3 A12O3 MnO
ppmP2O5ppm
forest soils
savanna soils
1030
90
750
50
570
40
30
25
2.4
1.5
0.6
0.7
240
20
200
20
2.4
0.9
Table 3.3.9. Mean values of nutrient- and carbon content of the soils from the experimental slopes
66

III.4 SUMMARY AND CONCLUSIONS
In Chapter I it was suggested that the position of Sipaliwini Savanna within thecontext of possible ecosystem equilibria or desequilibria was related to soil waterconditions at the end of the wet season and at the end of the dry season. Withouthaving available measurement data on soil water conditions, it is still possible todeduce from the observations and interpretations given in Chapter III, that partof the savanna landscape, at least the lower parts of the valley floors, suffer fromwater saturation during some time of the wet season. During dry periods desicca-tion occurs. On this basis, the savannas of the Valley Floor Landscape may beconsidered hyperseasonal savannas which represent a hypothetical equilibriumbetween vegetation and a-biotic ecosystem factors. Maintainance of this equilibriumdepends on the conditions of climate and more especially the conditions prevailingin the higher parts of the basin, the Sipaliwini and Morro Grande Landscapes. Inthese high and medium relative relief landscapes soil water conditions dependpartly on precipitation and evapotranspiration and are strongly affected by limitedinfiltration rates due to surface sealing and high clay contents of the regolith. Aswas observed, the soils of Sipaliwini and Morro Grande Landscapes suffer fromdesiccation and are below permanent wilting point during the dry season, due tothe high degree of external drainage. These conditions contribute to extra wet soilmoisture conditions during rain in the Valley Floor Landscape.
For the Sipaliwini and Morro Grande Landscape it is difficult to decide whetherthe savanna vegetation is in equilibrium with the a-biotic ecosystem components.The groundwater level is generally deep and since infiltration rates are low, soilwater conditions on hilltops and -slopes range from permanent wilting point in thedry season to field capacity in some parts of the wet season. This points at aseasonal savanna system which is considered an equilibrium state of the ecosystem.However, under adjacent forest cover in the closed rainforest as well as in theforest islands, soil water conditions show a smaller variance. Here, due to higherinfiltration rates, soils are mainly at field capacity during wet periods and due toa lesser degree of evapotranspiration, soil moisture conditions are only slightlybelow field capacity during the short dry season. It is therefore, that the savannavegetation of the Sipaliwini and Morro Grande Landscape is not considered to rep-resent the hypothetical equilibrium state. The savanna is, nevertheless, maintainedby the existing low infiltration rates which are the consequence of a low soil coverpercentage. Where the infiltration rates increase, e.g. when land slips occur and thesealed surface is disturbed, it was observed that the regeneration of forest mayproceed succesfully. Next to surface sealing, the occurrence of rather frequentfires contributes to maintainance of savanna since reforestation is strongly hamperedby fire. Another maintaining factor is formed by the generally high rate of surfacewash, restricting the development of a topsoil horizon containing organic matterwhich would greatly contribute to a better soil water regime.
67
In summary, it may be said that the savanna of the Sipaliwini and Morro GrandeLandscape does not represent an equilibrium but is in the course of developmentinto rainforest. On one hand this development is hampered by conditions associ-ated with the present savanna system, including fires. On the other hand, the in-tensity of gemorphological processes under savanna conditions shows a tendencywhich will eventually lead to the loss of relative relief by mass movement, surfacewash and lateral erosion by rivers. Finally these processes will bring about reliefconditions under which drainage of the area is retarded and the available soil waterwill be increased in all seasons.The geomorphological development which led to present conditions may be at-tributed to a repetitive sequence of rejuvenation and planation. Dissection of anoriginally level landscape resulted in a faster drainage of the landsurface andregolith.Concurrent with these geomorphological events climatic conditions may have pro-moted the replacement of an assumed forest vegetation by savanna. The savannavegetation promoted planation processes, both pediplanation and etchplanation.In relation with changes in the long profiles of the main rivers, part of the dissectedlandscape was planated, thus promoting alterations of ecosystem factors in favourof tropical rainforest. A renewed incision started a second cycle of increasedrelative relief, better drainage and regolith desiccation, a vegetation change and anincreased intensity of planation processes. Out of the level of the river beds, valley-wall retreat produced pediplains which form the present Valley Floor Landscape.This planated, slightly or not dissected Landscape should have a-biotic ecosystemcomponents in favour of rainforest, if it were not for the strong alternation of soilwater conditions. These conditions may not be attributed to climate alone, sincethey are to a considerable extent the consequence of the soil water regime in theupstream parts of the basin.
The repetitive rejuvenation of the Upper Sipaliwini basin was followed by dissec-tion and planation. Three erosion surfaces were formed. The two higher planationsurfaces originated from pediplanation and etchplanation and were dissected, atpresent forming summit levels. The third and lowest planation surface forms theactual valley floors.
The physiography of the three levels is different, due to their relatively indepen-dent development. The highest summit level (I) coincides with a land system whichis called Morro Grande Landscape. The lower summit level (II) coincides with thelandsystem of the Sipaliwini Landscape and the main floodplains, wide and ratherlevel surfaces, form the Valley Floor Landscape.
68
CHAPTER IV
SOILS
Soil properties reflect past, as well as present conditions of soil formation fromwhich conditions of landscape evolution may be inferred. In this sense, the studyof soils may reveal part of the dynamics of landscape systems during their develop-ment and some of the dynamics of the actual landscape systems which compriseelements that determine the maintainance of the savanna ecosystem. Moreover, theinterpretation of soils provides a mean to test the geomorphogenetical model de-scribed in Chapter III.
The main point in this model is the successive formation of three erosion surfacesin alternation with two phases of dissection. Simultaneously with this evolution,the three different geomorphological units acquired such properties that it waspossible to distinguish between them as different land systems or landscapes. It washypothesized that the relative age of the land systems is connected with the heightof the summit level to which they belong. In other words, the land system MorroGrande of the highest summit level (I) is the oldest and the Sipaliwini land systemof summit level II developed in it. On its turn, the Valley Floor Landscape wasformed at the expense of the Sipaliwini Landscape.
The ecosystem concept applied to landscapes, implies that differences in landscapesmay be reflected in the properties of soils belonging to the various landscapes.However, since each pedon is unique, the only way to reveal the relation betweensoils and landscape is to classify, to group these soils according to the propertiesthat the (unique) soils have in common. If it is possible to arrange the soils in groupswhich are related to the different landscapes in the sense that these groups haveproperties associated with the geomorphological evolution, the classification and itsinterpretation form supporting evidence for the proposed geomorphogenetical model.Put otherwise, the soils of the Morro Grande Landscape should have properties fromwhich it may be concluded that they are older than the soils of the Sipaliwini Land-scape and the Valley Floor Landscape. Furthermore, the differentiating propertieson which the classification was based, may reveal information on the differences inthe evolution of the various landscapes.
The theoretical considerations and hypotheses described above lead to the followingquestions :
- Is it possible to bring about a grouping of soils according to their properties, agrouping which coincides with the main landscapes distinguished.
- If so, what are the differentiating properties on the basis of which the soil groupsare discerned, and
69

- in what respect can these properties be interpreted in order to infer conditionsof landscape evolution.
At the basis of answering these questions stands classification, probably not onetype of classification but more, each depending on the different purposes intended.In this chapter classification of soils is founded on soil properties which have provento be indicative of the nature of soils (USDA, 1975). These properties comprise soilhorizons and other field characteristics as well as various physical and chemicalcharacteristics (Appendix II). Additionally, some soils have been studied as to theirmicro-morphological properties as well (section IV.4).
The first method of classification used, was according to the system of the USDASoil Taxonomy (1975). Apart from the intended purposes mentioned above, thissystem was used since it provides the means to describe and characterise soils in ageneral way which is internationally understood. Next to this classification systeman attempt was made to classify the soils with the aid of a rnultivariate method.The type of multivariate analysis that has been chosen is factor analysis. Factoranalysis provides for possibilities of classification as well as for testing and creatinghypotheses.
Before going into some aspects of classification, the selection of representative soilswill be discussed.
IV. 1 REPRESENTATIVE SOILS
The selection of representative profiles is a delicate procedure. Generally the selec-tion is made during the phase of field survey when only macroscopical observationson profiles are available. Representative profiles should reflect the range over whichvariation in soil properties occurs and at the basis of selection are always someimportant assumptions. The main assumption is that differences in macroscopicalproperties reflect differences in physical and chemical qualities. Furthermore it isassumed (section III. 1) that within a physiographic unit soil properties and patternsare homogeneous within narrow limits and that the attributes of one physiographicunit deviate from those of other physiographic units. In handling these assumptionsthere is an additional amount of 'best professional judgement' involved. However,the selection procedure with its assumptions and subjectivity has been used in numer-ous pedological studies and has been found satisfactory.
Based on the subdivision of the Sipaliwini area into land systems and land-units (thelatter are not discussed in this thesis) by analysis of aerial photographs and fieldsurvey, four sample areas (key areas) were selected representing the most importantphysiographic properties of the land systems (section III. 1 ) and -units. Pedologicalinvestigations were focussed on these key areas and about 150 soil profiles were de-
70
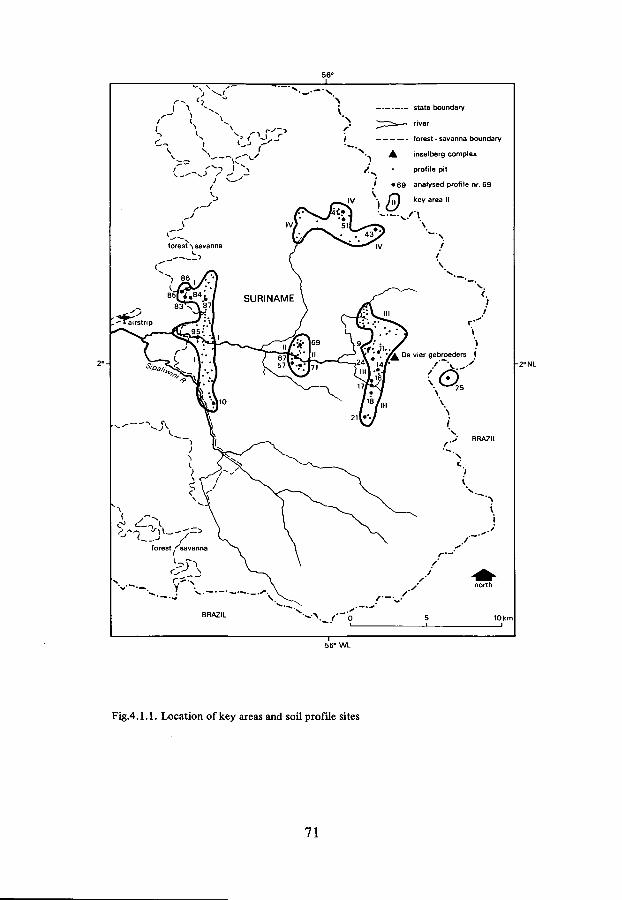
/ s \ ^ „^,? v^ V i"*0/—r
y v — •
f*V 1 'f- s VZfforest savanna T^ _ ^ , /
^"i 86 , /
-^rairstrrp ^p* . ''•
SURINAME \
/
Î l ^ v
— ' ^v \forest /'savanna \ \
X— - y''N. \
BR;IZIL v - ^
f' "I
N
i. iv -,
/7
-v.rx
. - .—. - state boundary
;Z^»-— river
forest - savanna boundary
A inselberg complex
• profite pit
• 69 analysed profile nr. 69
f j | l key area II
Sz. /\v ^ \
/\
/
y ^ De vier gebroeders 1
f' /'~\.~-'II x
*.s BRAZIL
" ' S
'v
i
V . /
./' _^^_y north
5 10 km
56° WL
Fig.4.1.1. Location of key areas and soil profile sites
71
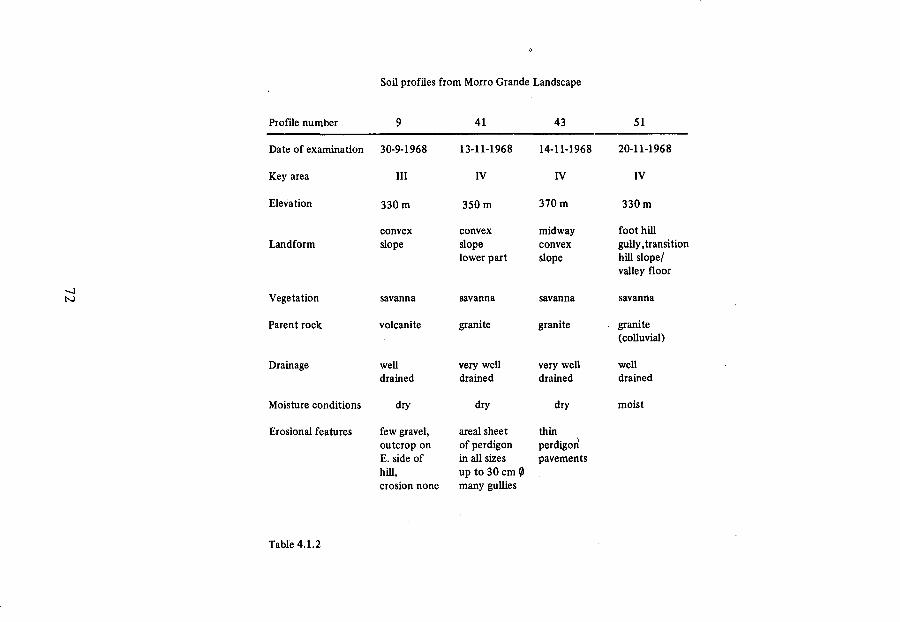
Soil profiles from Morro Grande Landscape
to
Profile number 41 43
Key area
Elevation
Landform
Vegetation
Parent rock
Drainage
Moisture conditions dry dry dry
Erosional features few gravel,outcrop onE. side ofhill,
areal sheetof perdigonin all sizesup to 30 cm 0
thinperdigonpavements
51
30-9-1968
III
330 m
convexslope
savanna
volcanite
welldrained
13-11-1968
IV
350 m
convexslopelower part
savanna
granite
very welldrained
14-11-1968
IV
370 m
midwayconvexslope
savanna
granite
very welldrained
20-11-1968
IV
330 m
foot hillgully, transitionhill slope/valley floor
savanna
granite(colluvial)
welldrained
moist
erosion none many gullies
Table 4.1.2
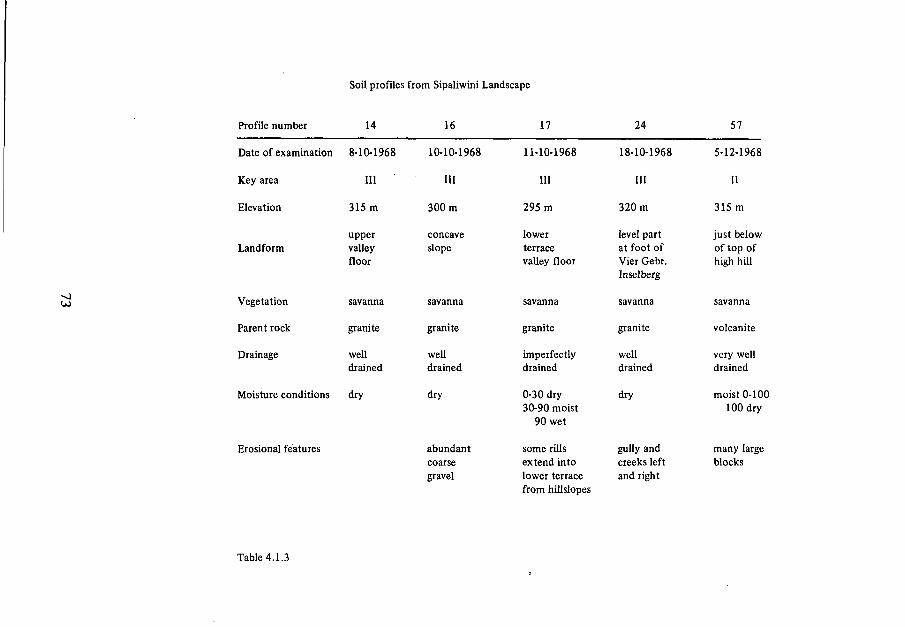
Soil profiles from Sipaliwini Landscape
Profile number
Date of examination
Key area
Elevation
Landform
Vegetation
Parent rock
Drainage
Moisture conditions
Erosional features
14
8-10-1968
III
315 m
uppervalleyfloor
savanna
granite
welldrained
dry
16
10-10-1968
III
300 m
concaveslope
savanna
granite
welldrained
dry
abundantcoarsegravel
17
11-10-1968
III
295 m
lowerterracevalley floor
savanna
granite
imperfectlydrained
0-30 dry30-90 moist
90 wet
some rillsextend intolower terracefrom hillslopes
24
18-10-1968
III
320 m
level partat foot ofVier Gebr.Inselberg
savanna
granite
welldrained
dry
gully andcreeks leftand right
57
5-12-1968
II
315 m
just belowof top ofhigh hill
savanna
volcanite
very welldrained
moist 0-100100 dry
many largeblocks
Table 4.1.3

Soil profiles from Sipaliwini Landscape (continued)
Profile number R69 R 8 3 R 8 4 R 8 5 R 8 6 R 8 7
Date of examination 11-12-1968
Key area
Elevation
Landform
Vegetation
Parent rock
Drainage
Moisture conditions
Erosional features
II
320 m
highsituateddepression
savanna
volcanitecolluvial
very welldrained
27-12-1968
I
320 m
top hill
forest-savannaboundary
volcanite
very welldrained
moist -7575 dry (-150)
none highvegetation
27-12-1968
I
320 m
top hill
savanna
28-12-1968
I
315 m
just belowtop of hill
forest
28-12-1968
I
310m
just belowtop of hill
forest-savannaboundary
30-12-1968
I
315 m
just belowtop of hill
savanna
volcanite
very welldrained
moist -6767 dry
few outcropsor blocks
volcanite
very welldrained
moist 0-9696 dry
'very fewblocks
volcanite
welldrained
moist -6565 dry
volcanite
very welldrained
moist 0-9696 dry
not observable very fewhigh trypsacum, blocksprobably fewblocks
Table 4.1.3 (continued)
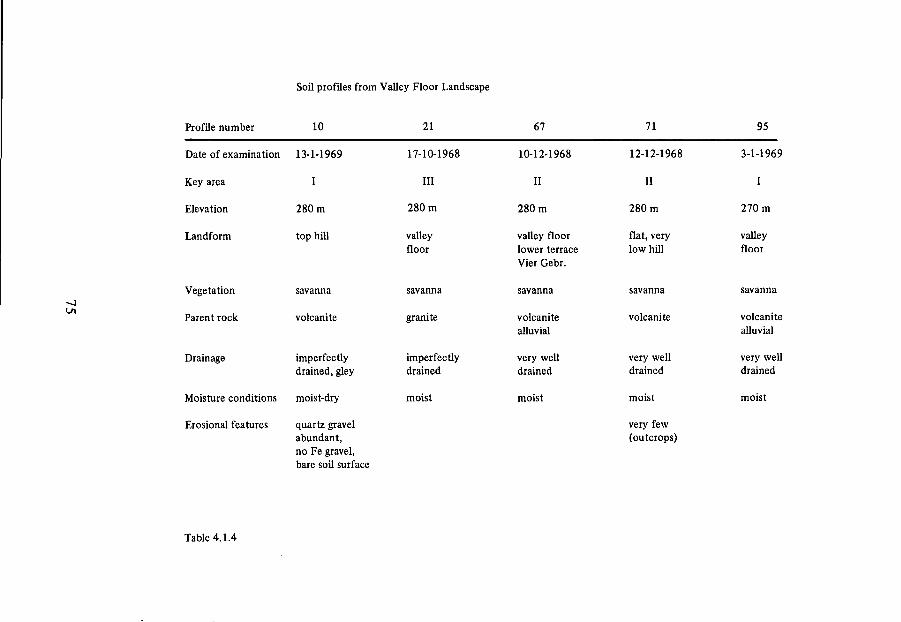
Soil profiles from Valley Floor Landscape
Profile number 10 21 67 71 95
Date of examination 13-1-1969
Key area I
Elevation 280 m
Landform top hill
Vegetation
Parent rock
Drainage
savanna
volcanite
imperfectlydrained, gley
Moisture conditions moist-dry
Erosional features quartz gravelabundant,no Fe gravel,bare soil surface
17-10-1968
III
280 m
valleyfloor
savanna
granite
imperfectlydrained
moist
10-12-1968
II
280 m
valley floorlower terraceVier Gebr.
savanna
volcanitealluvial
very welldrained
moist
12-12-1968
II
280 m
flat, verylow hill
savanna
volcanite
very welldrained
moist
very few(outcrops)
3-1-1969
I
270 m
valleyfloor
volcanitealluvial
very welldrained
moist
Table 4.1.4

scribed and sampled, generally in accordance with the guidelines set by the FAO(1966). The location of the key areas and profile sites is given in fig. 4.1.1.
The combination of the results of field descriptions, the physiography and theresults of vegetation research (section II.5) led to the selection of 20 representa-tive profiles. Descriptions of these profiles and analytical data are given inAppendix II. Information on the sample sites is given in tables 4.1.2-4.1.4.The soils are grouped according to the landscape system for which they areconsidered representative. Additionally, three profiles have been selected, that,as to their location belong to the Sipaliwini land system, but, as to their sites,must be regarded as valley floor soils.
The description and sampling of freely drained soils took place in pits upto a depthof 1.8 m, while in poorly drained soils borings were made and soil sampling wasperformed by auger. Samples were taken by horizons with a maximum verticaldistance of 40 cm between samples, though beiow a depth of 1 m this distancemay be greater.
IV.2 CLASSIFICATION (USDA, 1975)
The representative soils may be grouped according to their physiographic andsupposed geomorphological position into :
1. soils of the upper summit level (Morro Grande Landscape)2. soils of summit level II (Sipalisini Landscape)3. soils of the valley floors within summit level II4. soils of the lowest planation level (Valley Floor Landscape).
This grouping is relevant for testing the results of classification against the physio-graphic and geomorphological background.
Out of ten Orders, recognized in the USDA Soil Taxonomy, three are identified inthe Upper Sipaliwini drainage basin: Inceptisols, Ultisols and Oxisols.The representative profiles are classified down to the Subgroup level in table 4.2.1.A schematic summary of the most salient differentiae used in classification, undergiven environmental conditions of a warm, isohyperthermic soil temperature regimeand a udic soil moisture regime, is depicted in fig. 4.2.2 - 4.2.4.
The main problem of classification was the identification of an argillic horizon.Many soils show an increase of clay content with depth together with the occurrenceof shiny ped surfaces, which only in a few cases could be positively identified inthe field as clay skins. However, in anticipation of section IV.4, it is already mentionedhere that micro-morphological observations on some of the representative profiles
76
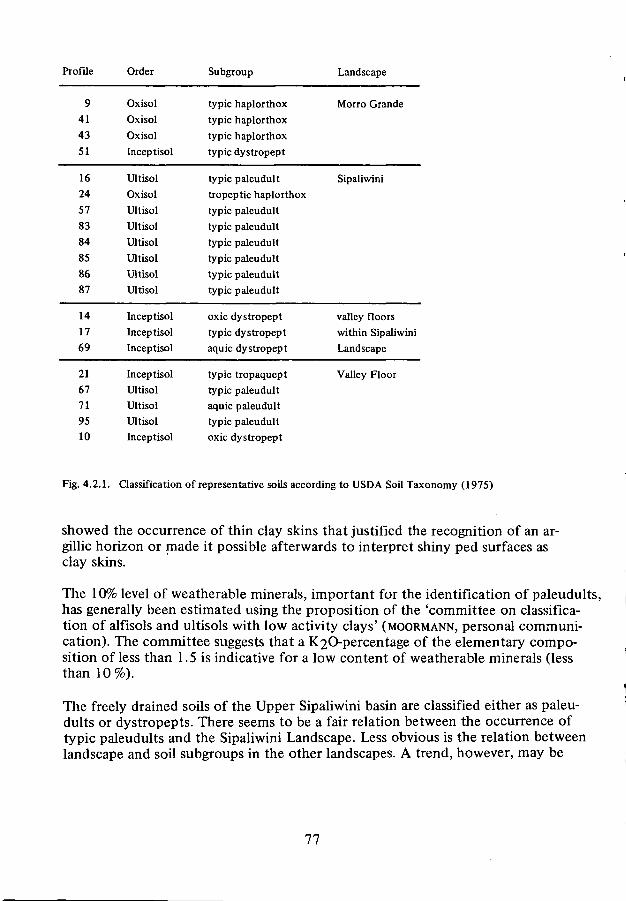
Profile Order Subgroup Landscape
941
43
51
16
24
57
83
84
85
86
87
14
17
69
21
67
71
95
10
OxisolOxisolOxisolInceptisol
UltisolOxisolUltisolUltisolUltisolUltisolUltisolUltisol
InceptisolInceptisolInceptisol
InceptisolUltisolUltisolUltisolInceptisol
typic haplorthoxtypic haplorthoxtypic haplorthoxtypic dystropept
typic paleudulttropeptic haplorthoxtypic paleudulttypic paleudulttypic paleudulttypic paleudulttypic paleudulttypic paleudult
oxic dystropepttypic dystropeptaquic dystropept
typic tropaquepttypic paleudultaquic paleudulttypic paleudultoxic dystropept
Morro Grande
Sipaliwini
valley floorswithin SipaliwiniLandscape
Valley Floor
Fig. 4.2.1. Classification of representative soils according to USDA Soil Taxonomy (1975)
showed the occurrence of thin clay skins that justified the recognition of an ar-gillic horizon or made it possible afterwards to interpret shiny ped surfaces asclay skins.
The 10% level of weatherable minerals, important for the identification of paleudults,has generally been estimated using the proposition of the 'committee on classifica-tion of alfisols and ultisols with low activity clays' (MOORMANN, personal communi-cation). The committee suggests that a K2O-percentage of the elementary compo-sition of less than 1.5 is indicative for a low content of weatherable minerals (lessthan 10%).
The freely drained soils of the Upper Sipaliwini basin are classified either as paleu-dults or dystropepts. There seems to be a fair relation between the occurrence oftypic paleudults and the Sipaliwini Landscape. Less obvious is the relation betweenlandscape and soil subgroups in the other landscapes. A trend, however, may be
77

recognized in that mainly Oxisols occur in the Morro Grande Landscape. This trendis supported by the field descriptions of about 10 other profiles from the MorroGrande Landscape. The soils of the valley floors within summit level II appear tobe Inceptisols, whereas both Inceptisols and Ultisols are present in the Valley FloorLandscape.
A relation between soil subgroup and parent rock may be expected since allhaplorthoxs are developed on granites. On the other hand, the typic dystropeptsof profiles 53 and 17 and the oxic dystropept of profile 14 are developed on gra-nites as well, so soil development is not considered as dominated by parent rock.Analyses of the elementary composition of some granites and volcanites do notpoint at great chemical differences (table 4.2.5).
Profile nr. Parent Rock Na2Û MgO P2O5 SiC>2 AI2O3
14
21
43
51
9
71
84
87
14
21
43
51
granites
volcanites
granites
1.2
1.7
2.2
2.3
2.3
1.7
1.5
1.9
K2O
4.8
4.6
4.4
4.8
0.420.531.3
0.9
1.8
0.8
0.8
1.1
CaO
0.2
0.4
1.5
0.5
0.010.020.030.02
0.240.050.030.12
TiO2
0.2
0.1
0.3
0.1
79.479.071.777.5
58.473.277.265.1
Fe2O3
1.3
3.1
2.8
0.9
10.410.414.512.3
17.312.013.017.4
9 volcanites 0.6 8.2 0.8 10.371 " 4.7 0.4 0.3 4.784 " 3.6 0.9 0.5 2.487 " 2.4 3.8 0.6 6.210 " 3.7 2.1 0.7 5.4
Table 4.2.5 Elemental composition of some parent rocks
78
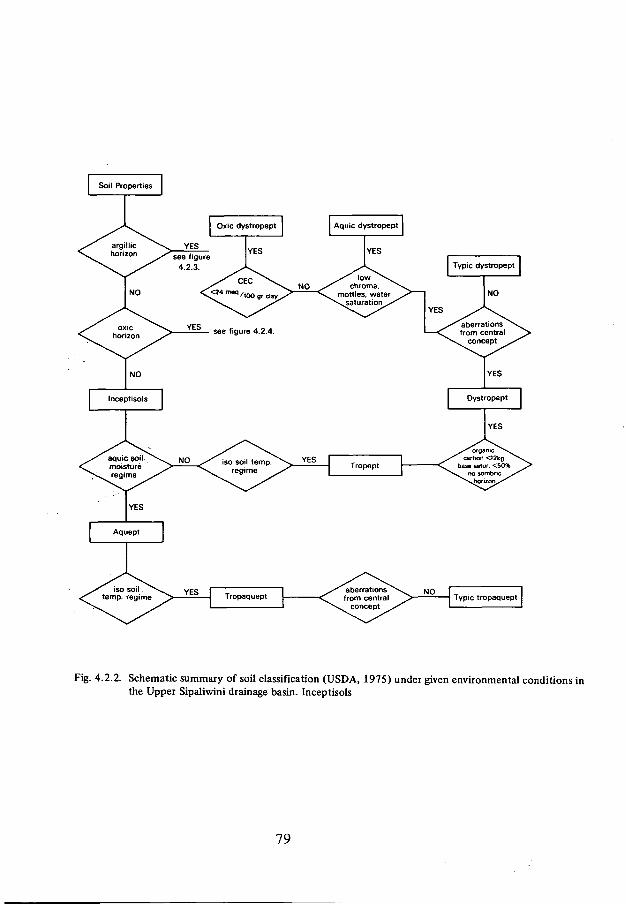
Fig. 4.2.2. Schematic summary of soil classification (USDA, 1975) under given environmental conditions inthe Upper Sipaliwini drainage basin. Inceptisols
79
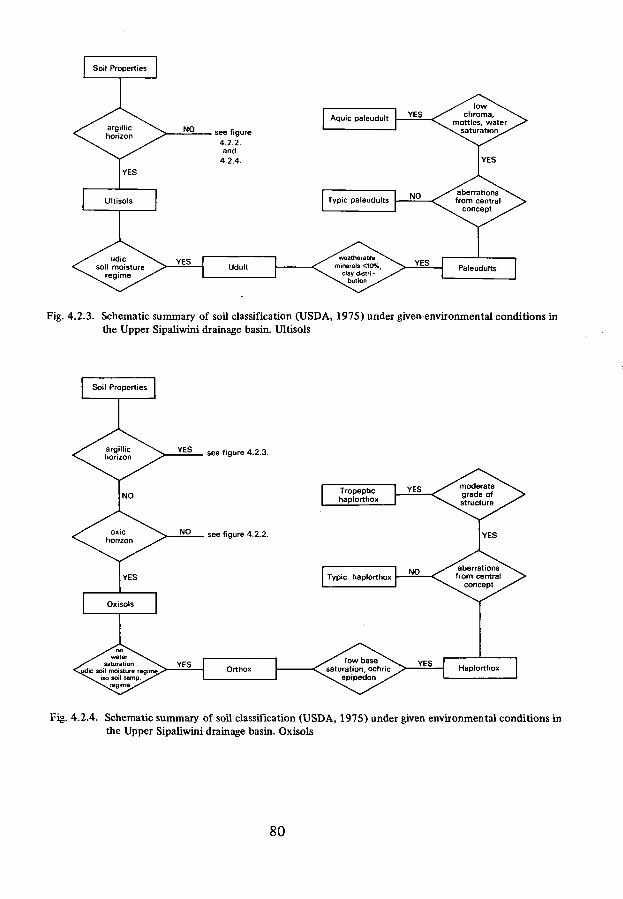
Fig. 4.2.3. Schematic summary of soil classification (USDA, 1975) under given environmental conditions inthe Upper Sipaliwini drainage basin. Ultisols
Fig. 4.2.4. Schematic summary of soil classification (USDA, 1975) under given environmental conditions inthe Upper Sipaliwini drainage basin. Oxisols
80

The main differences are physical, in that the density of volcanites is greater thanthat of granites. Furthermore granites are medium textured and volcanites are fineor very fine textured.
The following description of main characteristics of Inceptisols, Ultisols and Oxisolsis based on Soil Taxonomy (USDA, 1975)Inceptisols are soils of humid regions with altered horizons containing still someweatherable minerals but having lost bases or iron and aluminum. The Inceptisolsdo not have illuvial horizons. They may have many kinds of diagnostic horizons ofwhich in the Sipaliwini area the cambic horizon is most common. The cambic hor-izon has generally lost some sesquioxides and bases by leaching. It may have beenenriched in water and organic matter, but the alteration has not resulted from illu-viation of mineral substances. In the study area Inceptisols are developed on pre-weathered materials. Inceptisols are generally restricted to post-Pleistocene surfacesif evapotranspiration exceeds precipitation at some time of the year.
Ultisols are soils of mid and low latitudes with an argillic horizon but few basis.They are most extensive in warm humid climates that have a seasonal deficit ofprecipitation. At some season there is an excess of precipitation over evapotrans-piration and some water moves through the soil. Normally most bases are held inthe vegetation and the upper topsoil. Ultisols are mainly on Pleistocene or oldersurfaces.The Ultisols of the Upper Sipaliwini basin are characterized by the presence of anargillic horizon. An argillic horizon is illuvial and it is assumed that the clay hasbeen carried by water. Furthermore it is assumed that clay illuviation does gener-ally not take place under per-humid climates. Argillic horizons are, on the otherhand, common under climates where soils become thoroughly or partially dry atsome season. Evidences of clay illuviation are usually at a minimum when the clayis kaolinitic. Clay skins are normally not present in the upper part of the argillichorizon and are best preserved in the lower part.
Oxisols are generally without clearly marked horizons and boundaries may bearbitrary. They have either an oxic horizon within 2 m of the soil surface or haveplinthite as a continuous phase within 30 cm of the soil surface. The latter wasnot found in the study area. However, as already metioned in section III, remnantsof a-plinthite cuirass abound in some parts of the Sipaliwini area, especially in theMorro Grande Landscape. Oxisols do not have an argillic or spodic horizon thatoverlies the oxic horizon. Because Oxisols are on old, stable surfaces, weatheringproceeded to a great depth and has produced a thick regolith. Oxisols containmixtures of quartz, kaolin, free oxides and organic matter.The oxic horizon of Oxisols is intended to characterize a mineral subsurface horizonin an advanced stage of weathering. Oxic horizons are generally in soils of very old,stable geomorphic surfaces, mainly below elevations of 1500 - 2000 m and then-distribution is largely independent of present rainfall, suggesting that some formed
81

under much higher rainfall than is received today. Although the properties of anoxic horizon are defined rather clear, its genesis remains much to be learned about.Weathering has been extreme, leaving only highly insoluble primary minerals andhydrated iron and aluminum oxides together with the most resistent silicate clayminerals. The clay fraction is very stable and immobile since there is no evidencethat clay is moving.
From the description and classification of the representative profiles it may beconcluded that there are indications that the character of the soils is in manycases related to the discerned geomorphic units. The classification system of theUSDA (1975) and the level to which the soils were classified did not result howeverin a complete coverage of soil subgroups and geomorphic units. The generalizeddistribution of soil orders over geomorphic units is depicted in fig. 4.2.6.
Valley Floorlandscape
Inceptisol(ultisol)
Sipaliwinilandscape
fUltisol
(inceptisol
i
Möfro Grandelandscape
Oxisol
Fig. 4.2.6 Provisional and schematic distribution of soil orders in relation with landscapes
The trend, indicated in this figure, is reinforced by the interpretation of the ana-lytical data from the subsurface horizons of the profiles listed in table 4.2.1. Insummary, the following observations can be made (see tables 4.2.7 and 4.2.8).
1. The CEC of the Oxisols of the Morro Grande Landscape is low. Equally low isthat of the Ultisols of the Sipaliwini Landscape. The low CEC-values are indica-tive of a high degree of weathering of the soils in these landscapes. CEC-valuesof Ultisols of the Valley Floor Landscapes are much higher, pointing to a dis-dinct rejuvenation in a pedological sense. The same holds for the Inceptisols of
82

Morro Grande Landscape
Oxisols
Sipaliwini Landscape
Ultisols
Valley Floor Landscape
Ultisols
Valley Floor Landscapeand valley floors
Inceptisols
number ofsamples
8
19
8
12
CECmean
13.7
13.6
27.4
23.9
standarddeviation
On-1
3.4
2.4
8.9
8.5
Table 4.2.7 CEC/100 g clay of 2 or 3 subhorizons (below ± 15 cm to ± 100 cm)
Mono Grande Landscape
Oxisols
Sipaliwini Landscape
Ultisols
Valley Floor Landscape
Ultisols
Valley Floor Landscapeand valley floors
Inceptisols
number ofsamples
14
28
9
20
SiO2/Al2<I>3mean
1.2
3.0
4.4
4.5
standarddeviation
On-1
0.2
1.2
2.5
2.7
Table 4.2.8 SiO2/Al2C>3 molar ratios of the fine earth of subsurface horizons(below ± 1 5 cm)
83
valley floors and the Valley Floor Landscape, which equally have undergone re-juvenation. The greater standard deviation of the CEC-values of Inceptisols andValley Floor Landscape Ultisols points to a probably 'mixed' origin of the soilmaterials in the valleys.
2. The SiC>2/Al2O3 ratio (molar) of the fine earth of the subsurface horizons (table4.2.8) shows that these are significantly lowest for the Oxisols of the Morro GrandeLandscape, corroborating the interpretation of greatest weathering in this land-scape. A significant difference exists between the Ultisols of the Sipaliwini Land-scape and the Valley Floor Landscape. The mean ratio SiO2/Al2O3 of the sub-surface horizons of the Inceptisols from valleyfloors is slightly higher than thoseof the Ultisols of the Valley Floor Landscape and significantly higher than themean molar ratio of the Ultisols from Sipaliwini Landscape. This may be taken asan indication for a different degree of weathering in the Sipaliwini Landscapecompared with the Valley Floor soils. The difference in degree of weatheringbetween the Ultisols of the Valley Floor Landscape and the Inceptisols of theValley Floor Landscape and the valley floors is not significant, pointing to a closesimilarity with regard to the pre-weathered parent material. The differentiationbetween soils within the Valley Floor Landscape is therefore considered to berelated to recent soil development processes rather than to differences in stageof weathering of the parent material. The Ultisols of the Valley Floor Landscapeare present on topographical sites which are a few meters higher than the sur-rounding floodplain. Soil water conditions are periodically drier, giving rise to theformation of an argillic horizon whereas on topographically lower sites in thesame pre-weathered material, the soil water conditions prevent the formation ofan argillic horizon.
However, much as the trend of soil distribution over geomorphic units may bedoubted because of the exceptions present and the relatively small number ofprofiles involved, a toposequence like the one given in fig. 4.2.6 is not uncommon.LEPSCH&BUOL (1974) describe an Oxisol-Ultisol toposequence in S.Paulo State,Brazil and conclude that an oxic horizon is most highly expressed where the surfaceis geomorphologically older and where there is a thicker and more weathered rego-lith mantle. The argillic horizon is more expressed where the surface is geomorpho-logically younger and the regolith is less weathered, LEPSCH & BUOL (1974) hypothesizethat with an increased soil age and stage of weathering the oxic horizon soil plasmais flocculated and organized into a compacted granular structure. This structurereduced clay illuviation and allows pedoturbation processes to homogenize the pro-files. The best developed argillic horizon is present in less weathered material onyounger surfaces where time was not sufficient to organize the plasma into a compactstructure.BEINROTH et al. ( 1974) describe a toposequence of Oxisols on plateaus, Ultisols onupper parts of slopes and Inceptisols on lower slope parts and in valley floors. Thetransition of Oxisols to Ultisols is explained by reactivation of the clays. On erosional
84
slopes, creep causes shear planes and the shear process causes a breakdown of thestructural skeleton of the clay and a disruption of the interparticle bonds of thestable fabric. In this example of a toposequence from Hawaii, the Inceptisols arepresent where bedrock is near the surface.
The theory on the reactivation of clays by mass movement processes would alsogive an explanation for the common occurrence of shiny ped surfaces which couldnot be identified as clay skins. An origin by swelling is not very plausible in viewof the character of the clay minerals (Kaolinite and some illite), but processes ofslow or fast mass movement which are known to occur frequently in the Sipaliwiniarea could have gi.ven rise to the presence of press cutans, having the appearance ofshiny ped surfaces.
It may be concluded that the classification of representative soils according to theUSDA Soil Taxonomy (1975) revealed the presence of a toposequence. On thehighest summit level (Morro Grande Landscape haplorthoxs prevail. Soils on thehills of summit level II (Sipaliwini Landscape) are mainly paleudults while in thevalleys dystropepts occur. Within the Valley Floor Landscape there is a differenti-ation between Inceptisols, present in the lower parts of the landscape, and Ultisols,occurring on the more elevated parts of the wide valley floors.
The presence of this toposequence is interpreted in terms of different stages ofregolith weathering, related to the different geomorphological units. The soils ofMorro Grande Landscape developed in more strongly weathered material thanthose of Sipaliwini Landscape and Valley Floor Landscape. Both latter landscapeshave soils that do not differ significantly with regard to the stage of weathering oftheir parent material. However, a differentiation exists in that the soils of the hillsof Sipaliwini Landscape are characterized by the presence of an argillic horizonwhich is absent in the soils of the valleys and the lower parts of the Valley FloorLandscape. It is suggested that the argillic horizon is related to higher topographicalpositions with better drainage conditions.
85
IV.3 STATISTICAL ANALYSIS
One of the main problems this study of soils is concerned with, regards the inter-pretation of soil properties for inferring landscape evolution and for testing themodel of geomorphic evolution. Such an interpretation of soil properties mustbe based on the study of weathering and eventually the establishment of differentstages of wathering.
As already stated in section IV.2, the stage of weathering is considered an indica-tion of the age of soil and regolith formation since macro-climate is similar all overthe area and the influence of parent rock on weathering is rather limited.
Weathering involves the breakdown of primary minerals and the formation ofsecondary minerals. In analysing weathering as the main factor in soil formation,there is a large amount of soil data to take into account since they all may be relatedin some way to weathering processes.
Most of the data is expressed quantitatively and this offers the possibility to analysethem numerically.In order to establish eventual significant differences in the values of variables pergeomorphic unit, means and variances of each variable listed in table 4.3.1 werecomputed for the profiles and samples indicated in table 4.3.2. A small FORTRANroutine was used to print on-line histograms. These procedures were followed by theperformance of a CHI-square test and in some cases an F-test (see e.g. DAVIS, 1973)with the computed means and variances of the variables. In this way it could beconcluded which variables were significant in differentiating between the soils of thevarious geomorphic units. However, in using these relatively simple statistical tech-niques, it was not possible to establish the relationships between the significantvariables. In looking for such relationships which may be interpreted in terms ofprocesses, it is appropriate to use a covariance-variance analysis of the data. Thetechnique that preferably may be used for covariance-variance analysis is canonicalcorrelation. In using this method it is possible to find the weighted sum of severaldependent variables (y's) which correlate maximally with the weighted sum of pre-dictor variables (x's) (MAXWELL, 1977).Although canonical correlation may be regarded preferable, a well tested computerprogram for such an analysis of soil analytical data was not available. In view of itsaims, applications and computing techniques, it was therefore decided to performfactor analysis in which covariance-variance matrices are used. A computer programfor factor analysis was obtained from the Department of Soil Science, UtrechtUniversity. The program is a modification of FACTOR (program 7.12, DAVIS, 1973).
The most common applications of factor analysis are in: (JAE-ON KIM, 1970)- exploratory uses; exploration and detection of patterning of variables with a
view to the discovery of new concepts and reduction of data
86
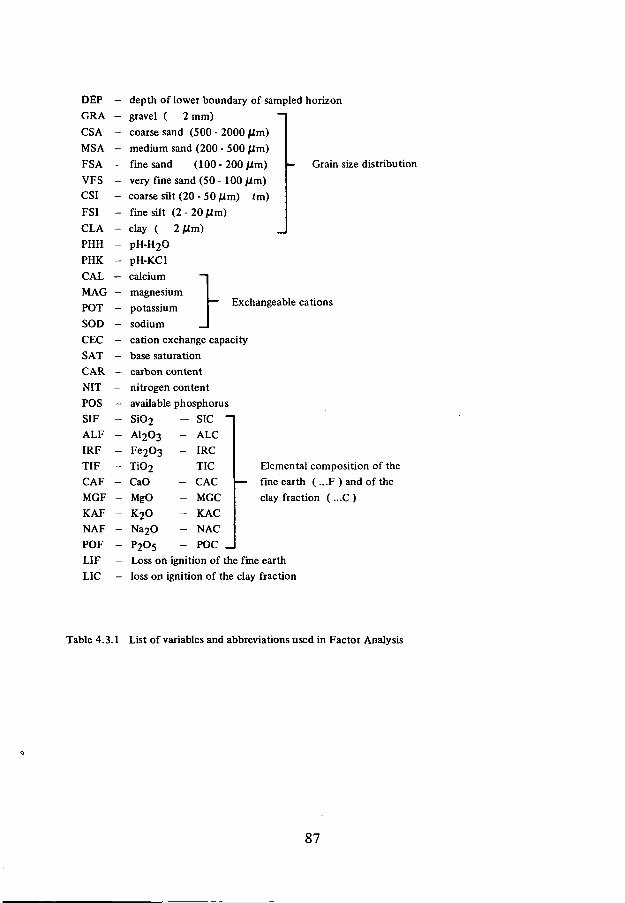
DEP
GRA
CSA
MSA
FSA
VFS
CSI
FSI
CLA
PHH
PHK
CAL
MAG
POT
SOD
CEC
SAT
CAR
NIT
POS
SIF
ALF
IRF
TIF
CAF
MGF
KAF
NAF
POF
LIF
LIC
depth of lower boundary of sampled horizon
gravel ( 2 mm)
coarse sand (500 - 2000 /im)
medium sand (200 - 500 /im)
fine sand (100-200 JUm)
very fine sand (50 - 100 /im)
coarse silt (20 - 50 /im) tm)
fine silt (2 - 20 /im)
clay ( 2/im)
"~ Exchangeable cations
- Grain size distribution
pH-KCl
calcium
magnesium
potassium
sodium
cation exchange capacity
base saturation
carbon content
nitrogen content
available phosphorus
SiO2 - SIC
AI2O3 - ALC
Fe2O3 - IRC
TiO2 - TIC
CaO - CAC
MgO - MGC
K2O - KAC
Na2O - NAC
P2O5 - POC J
Loss on ignition of the fine earth
loss on ignition of the clay fraction
Elemental composition of the
— fine earth ( ...F ) and of the
clay fraction ( ...C )
Table 4.3.1 List of variables and abbreviations used in Factor Analysis
87
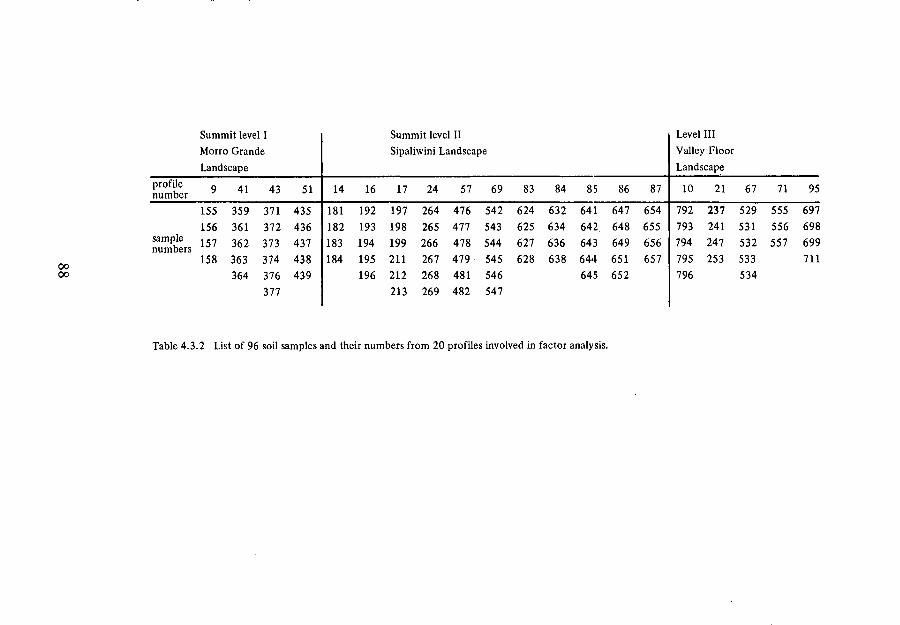
oooo
profilenumber
samplenumbers
Summit level IMorro GrandeLandscape
9
155156157158
41
359361362363364
43
371372373374376377
51
435436437438439
14
181182183184
16
192193194195196
Summit level IISipaliwini Landscape
17
197198199211212213
24
264265266267268269
57
476477478479481482
69
542543544545546547
83
624625627628
84
632634636638
85
641642643644645
86
647648649651652
87
654655656657
Level IIIValley FloorLandscape
10
792793794795796
21
237241
247253
67
529531532533534
71
555556557
95
697698699711
Table 4.3.2 List of 96 soil samples and their numbers from 20 profiles involved in factor analysis.

oo
Vari-ables
CLA
SIF
ALF
IRF
TIF
SIC
IRC
MORRO GRANDELANDSCAPE
N=20
S 2
137.36
18.84
11.63
16.16
0.21
19.98
32.83
X l
53.10
57.67
27.80
11.13
1.71
46.81
10.08
C.V. =1.78
1.16
10.86
44.00
14.85
21.35
C.V. =2.07
CO
toto
s2
2.71
2.90
SIPALIWINILANDSCAPE
N=55
S 2S2
118.81
51.12
33.76
1.49
0.05
1.35
1.54
*2
28.71
81.40
14.05
2.04
0.53
52.09
3.78
CV.=1
s2
s2
1.03
2.08
1.88
2.87
2.35
•74FC.V. =1.65
s2
s2
1.28
1.44
VALLEY FLOORLANDSCAPE
N=41
S 2S3
115.56
24.60
17.98
1.52
0.02
1.72
2.22
X3
26.66
83.98
12.07
1.41
0.48
52.70
4.13
1C.V. =1.85
T1.19
31.17
9.40
11.64
14.79
-C.V. =2.07
•is2
1.31
1.55
Table 4.3.3. Mean, variance and F-tests of some soil analytical data. Critical values (C.V.) are taken for (X.= 5 % .
For abbreviations see table 4.3.1.
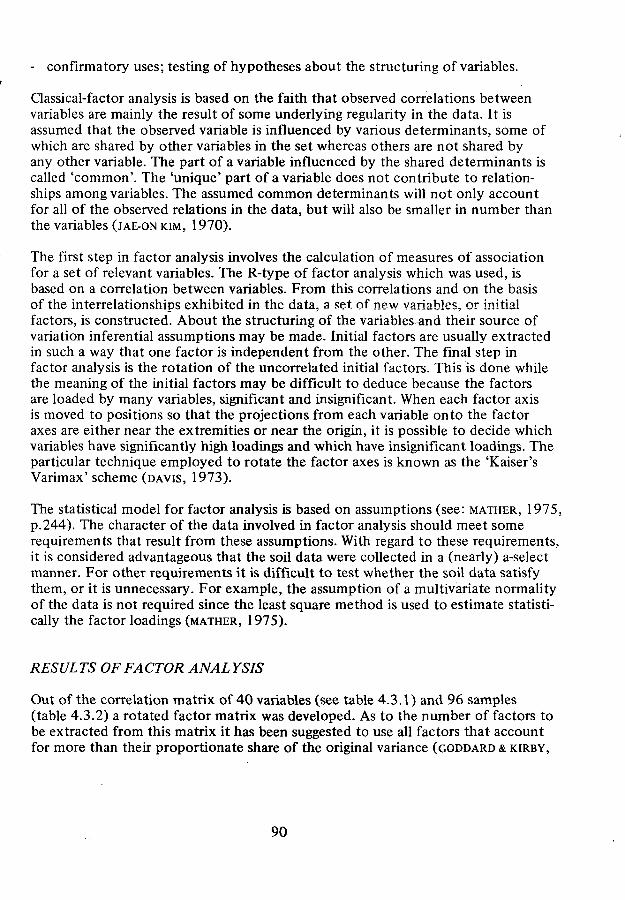
- confirmatory uses; testing of hypotheses about the structuring of variables.
Classical-factor analysis is based on the faith that observed correlations betweenvariables are mainly the result of some underlying regularity in the data. It isassumed that the observed variable is influenced by various determinants, some ofwhich are shared by other variables in the set whereas others are not shared byany other variable. The part of a variable influenced by the shared determinants iscalled 'common'. The 'unique' part of a variable does not contribute to relation-ships among variables. The assumed common determinants will not only accountfor all of the observed relations in the data, but will also be smaller in number thanthe variables (JAE-ON KIM, 1970).
The first step in factor analysis involves the calculation of measures of associationfor a set of relevant variables. The R-type of factor analysis which was used, isbased on a correlation between variables. From this correlations and on the basisof the interrelationships exhibited in the data, a set of new variables, or initialfactors, is constructed. About the structuring of the variables and their source ofvariation inferential assumptions may be made. Initial factors are usually extractedin such a way that one factor is independent from the other. The final step infactor analysis is the rotation of the uncorrelated initial factors. This is done whilethe meaning of the initial factors may be difficult to deduce because the factorsare loaded by many variables, significant and insignificant. When each factor axisis moved to positions so that the projections from each variable onto the factoraxes are either near the extremities or near the origin, it is possible to decide whichvariables have significantly high loadings and which have insignificant loadings. Theparticular technique employed to rotate the factor axes is known as the 'Kaiser'sVarimax' scheme (DAVIS, 1973).
The statistical model for factor analysis is based on assumptions (see: MATHER, 1975,p.244). The character of the data involved in factor analysis should meet somerequirements that result from these assumptions. With regard to these requirements,it is considered advantageous that the soil data were collected in a (nearly) a-selectmanner. For other requirements it is difficult to test whether the soil data satisfythem, or it is unnecessary. For example, the assumption of a multivariate normalityof the data is not required since the least square method is used to estimate statisti-cally the factor loadings (MATHER, 1975).
RESULTS OF FACTOR ANALYSIS
Out of the correlation matrix of 40 variables (see table 4.3.1) and 96 samples(table 4.3.2) a rotated factor matrix was developed. As to the number of factors tobe extracted from this matrix it has been suggested to use all factors that accountfor more than their proportionate share of the original variance (GODDARD & KIRBY,
90
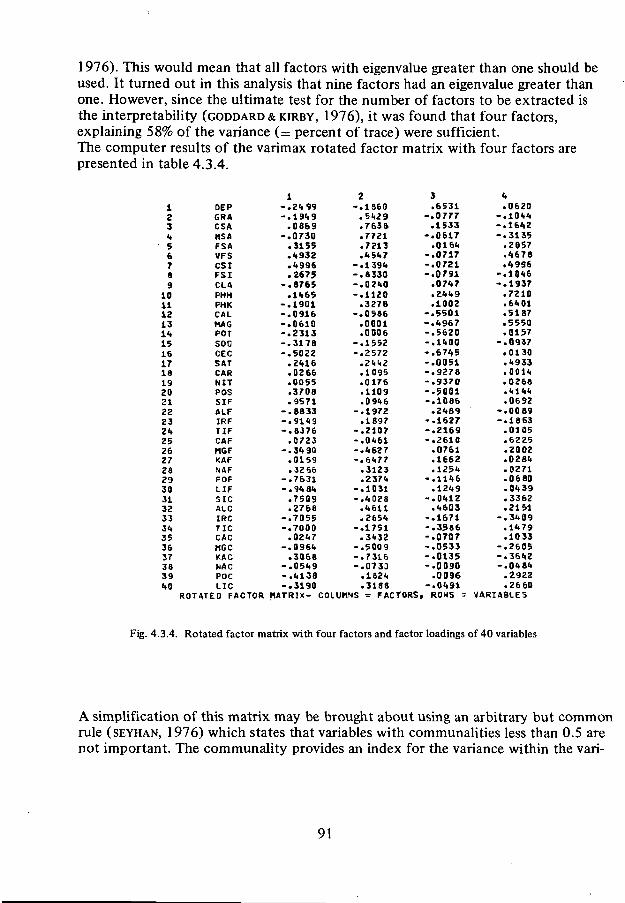
1976). This would mean that all factors with eigenvalue greater than one should beused. It turned out in this analysis that nine factors had an eigenvalue greater thanone. However, since the ultimate test for the number of factors to be extracted isthe interpretability (GODDARD & KIRBY, 1976), it was found that four factors,explaining 58% of the variance (= percent of trace) were sufficient.The computer results of the varimax rotated factor matrix with four factors arepresented in table 4.3.4.
t23•»567S9
101112131".1516171819202122232<t2526272829303132333<*35363738391.0
DEPGRACSAHS«FSAVF SCSIFSICLAPHHPHKCALHAGPOTsooCECSATCARNITPOSSIFALFIRFTIFCAFMGFKAFNÄFPOFLIFS I CALCIRCTICCACMGCKACMACPOCLIC
ROTATED FACTOR
1-.2i»99-.19«.9
.0869- .0730
.3155
.1.932
.1.996
.2675- . 8 7 6 5
.11.65- . 1 9 0 1- .0916- .0610- . 2 3 1 3- . 3 1 7 8- .5022
.21.16
.02 66
.0055
.3708
.9571-.8B33- .9149- .8376
.0723- .3«f90
.0159
.3266- .7631- .91. 8^
.7509
.2768- . 7 0 5 5- . 7 0 0 0
• 02«.7- .0961 .
. 3068- .051.9- . ( . 138- . 3 1 9 0
MATRIX-
2- . I 8 6 0
.51.29
. 7 6 3 a
.7721
.7213.1*51*7
- .1391 .- . 8 3 3 0- . 0 2 4 0- . 1 1 2 0
.3278- . 0 5 8 6
.0001
.0006- . 1 5 5 2- . 2 5 7 2
.2<<<.2
.1095
.0176.1109.0 91.6
- . 1 9 7 2.1897
- . 2 1 0 7- . 0 d 6 1-. '•627- .6<i77
.3123
.2371.- . 1 0 3 1- . ' . 028
.1.611
.265«.- . 1 7 5 1
.3<i32- . 5 0 0 9- . 7 3 1 6-.073Q
.152'.
.3188COLUMNS = FACTORS,
3.6531
- . 0 7 7 7. 1 5 3 3
- . 0 6 1 7.0161.
- . 0 7 1 7- . 0 7 2 1- . 0 7 9 1
.07*7
.21.1.9
.1002- .5501- .«1967- .5620-.11.00- .6745- .0051- .9278- . 9 3 7 0- .5001- .1086
.21.89- .1627- . 2 1 6 9- .2610
.0761
.1662
.125'.-.111.6
.121.9-.01.12
.1.603- .1671- .3586- .0707- .0533- . 0 1 3 5- .0090
.0096-.01.91
ROMS =
d. 0 6 2 0
- . 1 0 < I < I- . 16« ,2- . 3 1 3 5
. 2 0 5 7
.1(678
.4996-.10<l6- . 1937
.7210
.61.01
.5187
.5550
.0157- .0937
.0130
.••933
.0011.
.0266.1.11.1.
.0692- . 0 0 8 9- . 18 63
.0105
.6225
.2002
.0281.
.0271
.0680
.01.39
.3362
.2151-.31.09
.1479
.1033- . 2 6 0 5-.36«-.01.81.
.2922
.26 60VARIABLES
Fig. 4.3.4. Rotated factor matrix with four factors and factor loadings of 40 variables
A simplification of this matrix may be brought about using an arbitrary but commonrule (SEYHAN, 1976) which states that variables with communalities less than 0.5 arenot important. The communality provides an index for the variance within the vari-
91
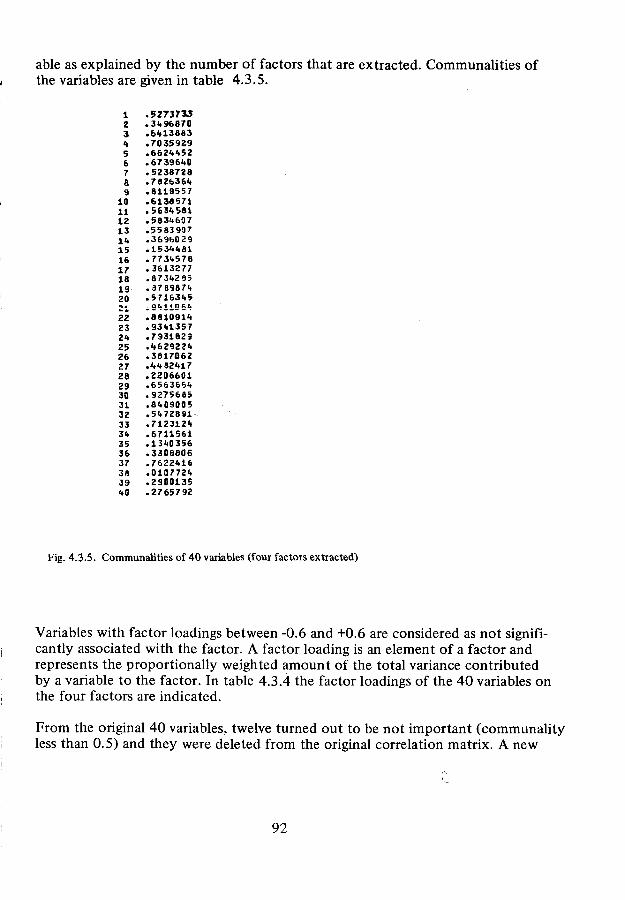
able as explained by the number of factors that are extracted. Communalities ofthe variables are given in table 4.3.5.
123<»567
a9
101112131<>151617181920
22232<t2526272829303132333't3536373839
<»a
• 5Z737W.31.96870.6*13881.7035929.662'. 1.52.67396U0.5238728.7826361..8119557.6138571.5634 581.583<.607.5583 907.3696029.15344.81.7731.578.3613277.8731.295.3769871..5 71631,5.aiinnr.1.
.881091')
.931.1357
.7931829
.1.62922 <.
.3817062
.*.<» 82417
.2206601
.6563661.
.9275685
.81.09005
.51.72891•7123124.6711561.131.0356.3308806.7622416.0107721..2900135.2765792
Fig. 4.3.5. Communalities of 40 variables (four factors extracted)
Variables with factor loadings between -0.6 and +0.6 are considered as not signifi-cantly associated with the factor. A factor loading is an element of a factor andrepresents the proportionally weighted amount of the total variance contributedby a variable to the factor. In table 4.3.4 the factor loadings of the 40 variables onthe four factors are indicated.
From the original 40 variables, twelve turned out to be not important (communalityless than 0.5) and they were deleted from the original correlation matrix. A new
92
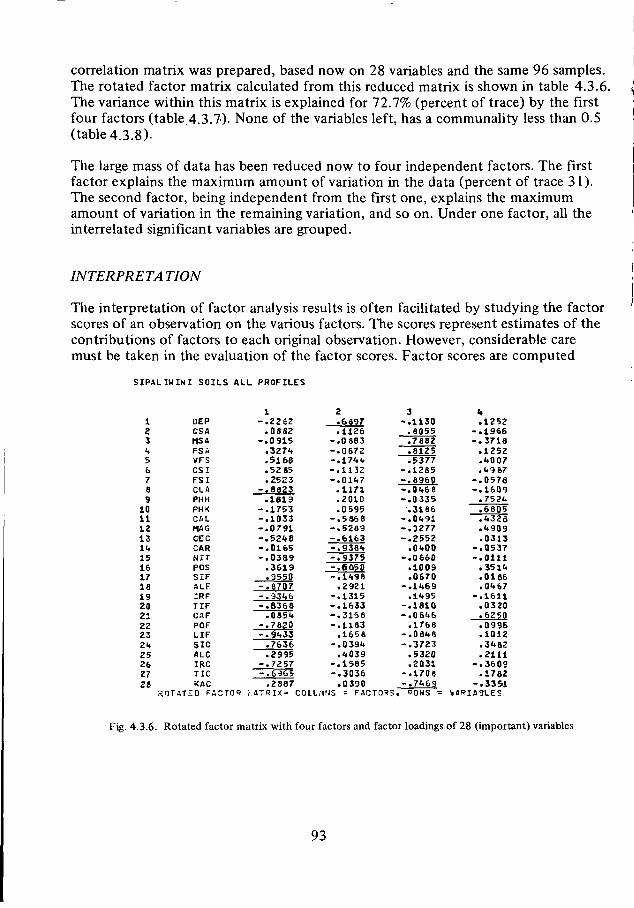
correlation matrix was prepared, based now on 28 variables and the same 96 samples.The rotated factor matrix calculated from this reduced matrix is shown in table 4.3.6.The variance within this matrix is explained for 72.7% (percent of trace) by the firstfour factors (table.4.3.7). None of the variables left, has a communality less than 0.5(table 4.3.8).
The large mass of data has been reduced now to four independent factors. The firstfactor explains the maximum amount of variation in the data (percent of trace 31 ).The second factor, being independent from the first one, explains the maximumamount of variation in the remaining variation, and so on. Under one factor, all theinterrelated significant variables are grouped.
INTERPRETATION
The interpretation of factor analysis results is often facilitated by studying the factorscores of an observation on the various factors. The scores represent estimates of thecontributions of factors to each original observation. However, considerable caremust be taken in the evaluation of the factor scores. Factor scores are computed
SIPALIWINI SOILS ALL PROFILES
12345678910111213141516171819202122232425262728
DEPCSA(ISAFS AVFSCS IFS ICLAPHHPHKCALMAGCECCARNITposSIFALFIRFTIFCAFPOFLIFSICALCIRCTICKAC
ROTATED FACTOR
1-.2262.0882
-.0915.3274.5168.52 85.2523
-.8823.1619
-.1753-.1033-.0791-.5248-.0165-.0389.3619.9550
-.8707-.9346-.8368.0854
-.7820-.9433.7636.2995
-.7257-.6965.2887
hATRIX- COlt
2.6897.1126
-.0883-.0572-.1744-.1132-.0147.1171.2010.0 595
-.5868-.5289-.6163-.9384-.9375- * 6 05 0-.1498.2921
-.1315-.1633-.3168-.1183.1658
-.0394.4039
-.1585-.3036.0390
MNS = FACTORS
3-.1130.8055.7882.8125.5377
-.1285-.8960-.0468-.0335.3186
-.0491-.0277-.2552.0400
-.0660.1009.0670
-.1469.1495
-.1810-.0646.1768
-.0848-.3723.5320.2031
-.1708-.7469. "QMS = *
ii
.1252-.1966-.3718.1252.4007.4967
-.0578-.1609.7524.6805.4328.4909.0313
-.0537-.0111.3514.0186.0467
-.1611.0320.6250.0996.1012.3462.2111
-.3609.1782
-.3351
Fig. 4.3.6. Rotated factor matrix with four factors and factor loadings of 28 (important) variables
93
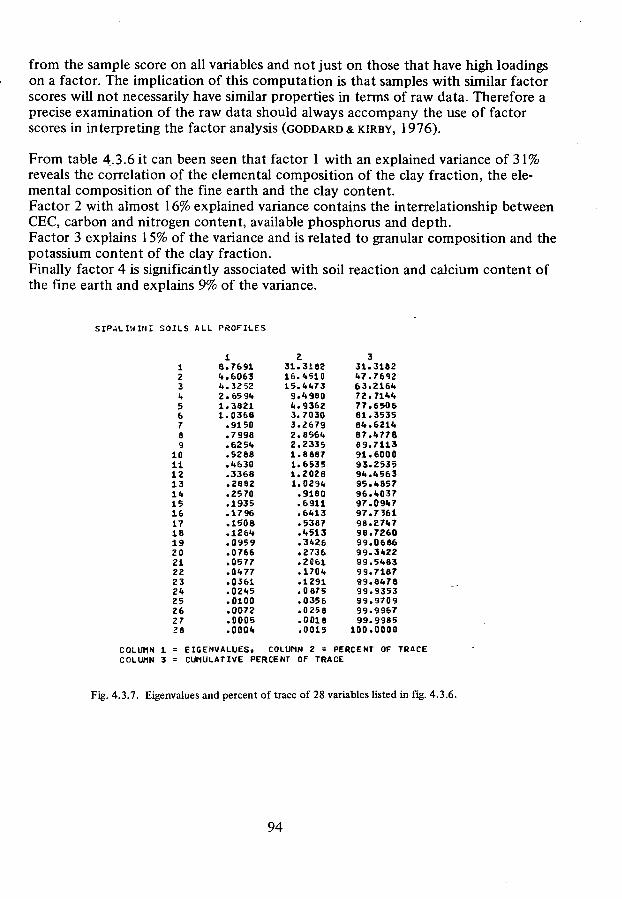
from the sample score on all variables and not just on those that have high loadingson a factor. The implication of this computation is that samples with similar factorscores will not necessarily have similar properties in terms of raw data. Therefore aprecise examination of the raw data should always accompany the use of factorscores in interpreting the factor analysis (GODDARD & KIRBY, 1976).
From table 4.3.6 it can been seen that factor 1 with an explained variance of 31%reveals the correlation of the elemental composition of the clay fraction, the ele-mental composition of the fine earth and the clay content.Factor 2 with almost 16% explained variance contains the interrelationship betweenCEC, carbon and nitrogen content, available phosphorus and depth.Factor 3 explains 15% of the variance and is related to granular composition and thepotassium content of the clay fraction.Finally factor 4 is significantly associated with soil reaction and calcium content ofthe fine earth and explains 9% of the variance.
SIPÄLIWINI SOILS ALL PROFILES
123' t
56789
1011121 314151617181 92021222 32«25262726
81»
i t
211
1.7691.6063.32 52.65 94.3821.0368.9150.7 998.6251..5288.4630.3368.2882.2570.1935.1796.1508.126"*.0959.0766.0577.0477.0361.0245.0100.0072.0005.000».
231.318216.451015.41.73
9.43804.93623.70303.26792.85642.23351.88871.65351.Z0281.0234
.9180
.6911
.6413
.5387
.4513
.3426
.2736
.2061
.1704
.1291
.0 875
.0356
.0258
.0018
.0015
331.318247.76S263.216472.714477.650681.353584.621487.477869.711391.600093.253594.456395.485796.403797.094797.736198.274798.726099.068699.342299.548399.718799.847899.935399.970999.996799.9985
100.0000
COLUMN 1 = EIGENVALUES, COLUMN 2 = PERCENT OF TRACECOLUMN 3 = CUMULATIVE PERCENT OF TRACE
Fig. 4.3.7. Eigenvalues and percent of trace of 28 variables listed in fig. 4.3.6.
94
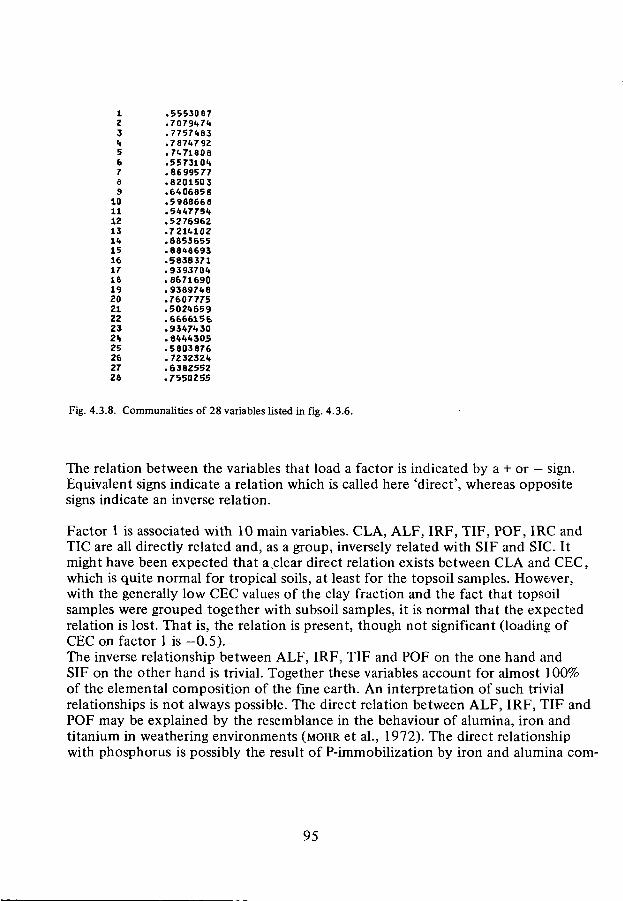
1z3<<56789
1011121311»151617i e19202122232425262728
.5553087
.70791.71.
.77571.83
.7874792
.71.71808
.5573101«
.86 99577
.820150 3
.6406858
.5988668
.54477511
.5276962
.7214102
.8853655
.8848693
.5838371
.9393704
.8671690
.9389748
.7607775
.5024659
.6666156
.9347430
.8444305
.5803 876
.7232324
.6382552
.7550255
Fig. 4.3.8. Communalities of 28 variables listed in fig. 4.3.6.
The relation between the variables that load a factor is indicated by a + or — sign.Equivalent signs indicate a relation which is called here 'direct', whereas oppositesigns indicate an inverse relation.
Factor 1 is associated with 10 main variables. CLA, ALF, IRF, TIF, POF, IRC andTIC are all directly related and, as a group, inversely related with SIF and SIC. Itmight have been expected that a,clear direct relation exists between CLA and CEC,which is quite normal for tropical soils, at least for the topsoil samples. However,with the generally low CEC values of the clay fraction and the fact that topsoilsamples were grouped together with subsoil samples, it is normal that the expectedrelation is lost. That is, the relation is present, though not significant (loading ofCEC on factor 1 is -0.5).The inverse relationship between ALF, IRF, TIF and POF on the one hand andSIF on the other hand is trivial. Together these variables account for almost 100%of the elemental composition of the fine earth. An interpretation of such trivialrelationships is not always possible. The direct relation between ALF, IRF, TIF andPOF may be explained by the resemblance in the behaviour of alumina, iron andtitanium in weathering environments (MOHR et al., 1972). The direct relationshipwith phosphorus is possibly the result of P-immobilization by iron and alumina com-
95
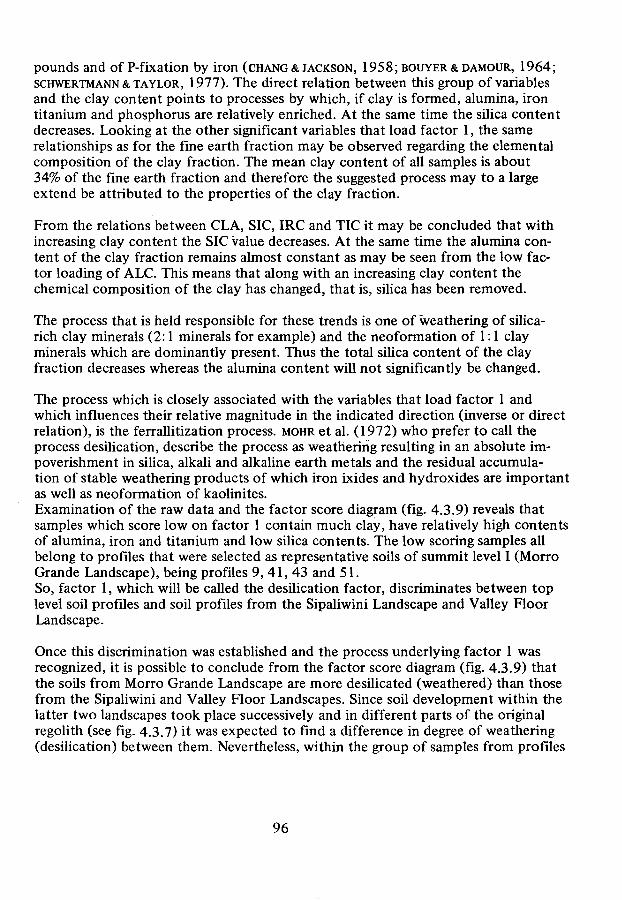
pounds and of P-fixation by iron (CHANG & JACKSON, 1958;BOUYER&DAMOUR, 1964;SCHWERTMANN & TAYLOR, 1977). The direct relation between this group of variablesand the clay content points to processes by which, if clay is formed, alumina, irontitanium and phosphorus are relatively enriched. At the same time the silica contentdecreases. Looking at the other significant variables that load factor 1, the samerelationships as for the fine earth fraction may be observed regarding the elementalcomposition of the clay fraction. The mean clay content of all samples is about34% of the fine earth fraction and therefore the suggested process may to a largeextend be attributed to the properties of the clay fraction.
From the relations between CLA, SIC, IRC and TIC it may be concluded that withincreasing clay content the SIC value decreases. At the same time the alumina con-tent of the clay fraction remains almost constant as may be seen from the low fac-tor loading of ALC. This means that along with an increasing clay content thechemical composition of the clay has changed, that is, silica has been removed.
The process that is held responsible for these trends is one of weathering of silica-rich clay minerals (2:1 minerals for example) and the neoformation of 1:1 clayminerals which are dominantly present. Thus the total silica content of the clayfraction decreases whereas the alumina content will not significantly be changed.
The process which is closely associated with the variables that load factor 1 andwhich influences their relative magnitude in the indicated direction (inverse or directrelation), is the ferrallitization process, MOHR et al. (1972) who prefer to call theprocess desilication, describe the process as weathering resulting in an absolute im-poverishment in silica, alkali and alkaline earth metals and the residual accumula-tion of stable weathering products of which iron ixides and hydroxides are importantas well as neoformation of kaolinites.Examination of the raw data and the factor score diagram (fig. 4.3.9) reveals thatsamples which score low on factor 1 contain much clay, have relatively high contentsof alumina, iron and titanium and low silica contents. The low scoring samples allbelong to profiles that were selected as representative soils of summit level I (MorroGrande Landscape), being profiles 9, 41, 43 and 51.So, factor 1, which will be called the desilication factor, discriminates between toplevel soil profiles and soil profiles from the Sipaliwini Landscape and Valley FloorLandscape.
Once this discrimination was established and the process underlying factor 1 wasrecognized, it is possible to conclude from the factor score diagram (fig. 4.3.9) thatthe soils from Morro Grande Landscape are more desilicated (weathered) than thosefrom the Sipaliwini and Valley Floor Landscapes. Since soil development within thelatter two landscapes took place successively and in different parts of the originalregolith (see fig. 4.3.7) it was expected to find a difference in degree of weathering(desilication) between them. Nevertheless, within the group of samples from profiles
96
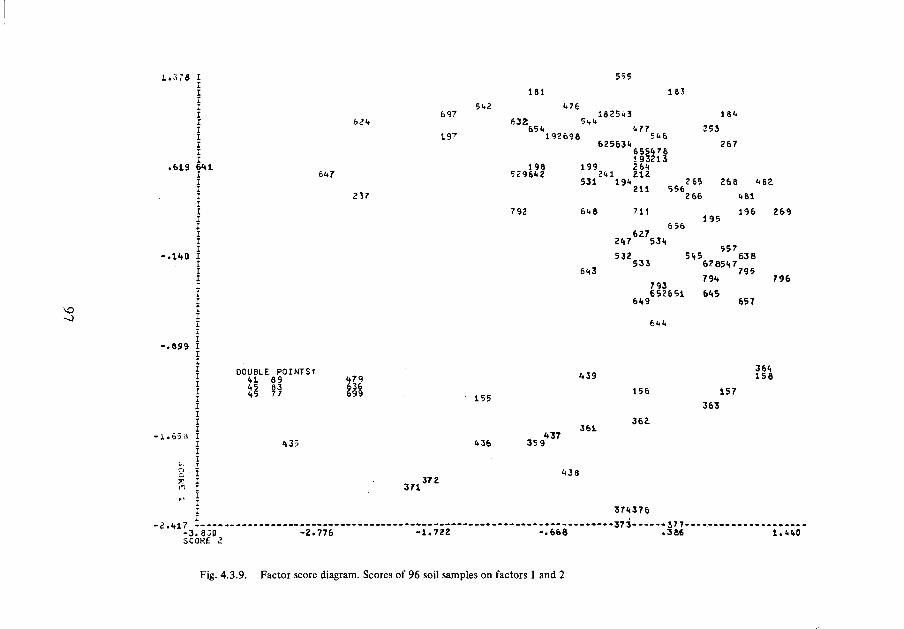
1 . 3 - a I 555
I 181 163
I 51.2 1.76II bZ-t
Î. bl9 641
I 6<t7
-.699 II
237
I
697
197
ifl 25 ÎI 3632 5<»4
651. 1.77192696 51*6
625631.655478193213
196 199 £64
531 * 194 265211 556
2 66
792 61.6 711
656627
247 53i»
532 5i»5533
643
793652651
649
5 8**
253
267
268 1.1
1.61
1961 9 5
55763 6
795
6^5657
j 2
269
796
Ï DOUBLE POINTSI . , „ ?c«89 479 't39 i 5 6
XX\ W 11% . 1 5 5 156 157I 363
I 362I 361
-1.65 a I <»37I 435 *36 35 9I
IIi". I 371»' Ï
I 371(376-2.<tl7 373 37 7
-3.830 -2.776 -1 .722 - . 6 6 6 .366 1.1.1.0SCORE 2
Fig. 4.3.9. Factor score diagram. Scores of 96 soil samples on factors 1 and 2

of the Sipaliwini and Valley Floor Landscapes there is no systematic or consistentdifference regarding the degree of desilication (score on factor 1 ). The absence of adifferentiation may be attributed both to the short time elapsed between the for-mation of summit level II and the valley floor level and to rejuvenation of the soilforming material. This explanation is consistent with the character of the levels,described in section III.2. The valley floor level contains low hills which, with regardto their height, may belong to summit level II. In other areas it is not possible todistinguish between summit level II and the valley floor level as there is a gradualtransition between them and no step can be recognized. Moreover, eventual differ-ences in weathering could have been balanced by the environmental conditionsprevailing in the Valley Floor Landscape in which surface water is concentratedmore than in the dissected Sipaliwini Landscape.
Factor 2 is significantly associated with the variables DEP, CAL, CEC, CAR, NITand POS. Although the second factor generally displays less important patterns, itis interesting to notice that there exists an inverse relationship between DEP and theother variables, which are associated with cation exchange, organic matter and asso-ciated nutrient elements. The inverse relationship with DEP indicates a decrease ofthe variable values with depth.
Considering the raw data it will be clear that especially with regard to carbon andnitrogen content the decrease with depth is not a gradual one. In most cases thechange in content is rather abrupt. The factor sore diagram of figure 4.3.9 showsthat samples that score low (less than about —1.722) on factor 2 are all topsoilsamples or samples from horizons immediately below the topsoil horizon. An inter-mediate group of topsoil samples scores between —1.722 and —0.668, whereas onlyone topsoil sample 264 from profile 24 does not distinguish itself from subsoilsamples by scoring about +0.2 on factor 2.
For the interpretation of factor 2 in terms of an underlying process, the data on thenutrients analysis have been taken into account. Unfortunately these variables couldnot be incorporated in the factor analysis because not all samples were analysed ontheir nutrients. However, from the available data, given in Appendix II it may readi-ly be seen that there exists a marked difference between top- and subsoil samples.One of the effects of savanna vegetation on soil properties is the decrease of infil-tration capacity due to surface sealing. So, leaching of soluble soil components willdecrease as well. On the other hand, the biocycling of mineral components by plantswill continue. After dying of the plants these mineral components accumulate in thetopsoil from which they may be removed depending on the rate of leaching thattakes place. In this way the accumulation of nutrients and organic matter may bebrought about, CHROSTOWSKI & DENEVAN (1970) mention the increase of phosphorousand calcium under the influence of fire, an agent that intensifies the process ofaccumulation of nutrients and carbon in the topsoil. The combined effect of biologi-cal processes and fire are supposed to underly factor 2 which will be called therefore
98
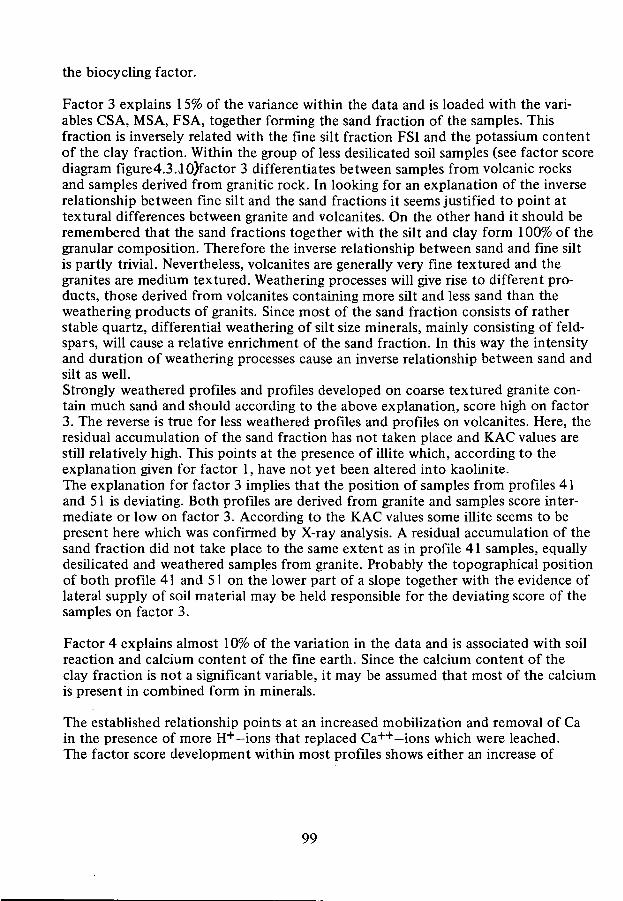
the biocycling factor.
Factor 3 explains 15% of the variance within the data and is loaded with the vari-ables CSA, MSA, FSA, together forming the sand fraction of the samples. Thisfraction is inversely related with the fine silt fraction FSI and the potassium contentof the clay fraction. Within the group of less desilicated soil samples (see factor scorediagram figure4.3.10)factor 3 differentiates between samples from volcanic rocksand samples derived from granitic rock. In looking for an explanation of the inverserelationship between fine silt and the sand fractions it seems justified to point attextural differences between granite and volcanites. On the other hand it should beremembered that the sand fractions together with the silt and clay form 100% of thegranular composition. Therefore the inverse relationship between sand and fine siltis partly trivial. Nevertheless, volcanites are generally very fine textured and thegranites are medium textured. Weathering processes will give rise to different pro-ducts, those derived from volcanites containing more silt and less sand than theweathering products of granits. Since most of the sand fraction consists of ratherstable quartz, differential weathering of silt size minerals, mainly consisting of feld-spars, will cause a relative enrichment of the sand fraction. In this way the intensityand duration of weathering processes cause an inverse relationship between sand andsilt as well.Strongly weathered profiles and profiles developed on coarse textured granite con-tain much sand and should according to the above explanation, score high on factor3. The reverse is true for less weathered profiles and profiles on volcanites. Here, theresidual accumulation of the sand fraction has not taken place and KAC values arestill relatively high. This points at the presence of illite which, according to theexplanation given for factor 1, have not yet been altered into kaolinite.The explanation for factor 3 implies that the position of samples from profiles 41and 51 is deviating. Both profiles are derived from granite and samples score inter-mediate or low on factor 3. According to the KAC values some illite seems to bepresent here which was confirmed by X-ray analysis. A residual accumulation of thesand fraction did not take place to the same extent as in profile 41 samples, equallydesilicated and weathered samples from granite. Probably the topographical positionof both profile 41 and 51 on the lower part of a slope together with the evidence oflateral supply of soil material may be held responsible for the deviating score of thesamples on factor 3.
Factor 4 explains almost 10% of the variation in the data and is associated with soilreaction and calcium content of the fine earth. Since the calcium content of theclay fraction is not a significant variable, it may be assumed that most of the calciumis present in combined form in minerals.
The established relationship points at an increased mobilization and removal of Cain the presence of more H+—ions that replaced Ca"*"1"—ions which were leached.The factor score development within most profiles shows either an increase of
99
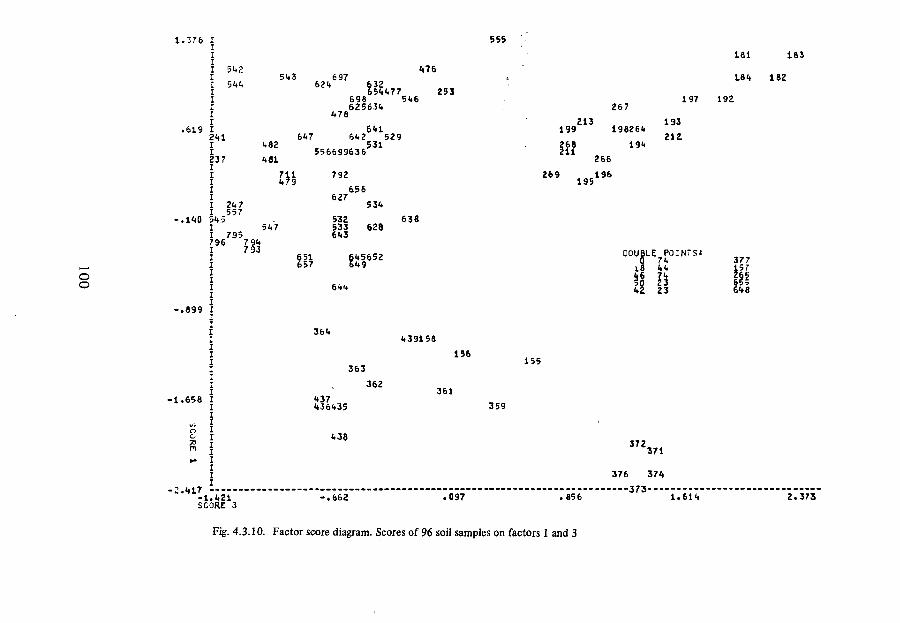
.619
- .899
III 5<»2IIIII
I2mII237IIII
II 735796 7I 7II\
I
I
I
ffI
555
697621* 632
65<«l«77698 51.6625631»
».78
lai
18i(
1 6 Î
182
253
(482
«ifll
bU76U1
61.2 529531
556699636
1 9 9 Z
268211
9 Z 1 3
267
19826*.19<<
197 192
212
7111.79
792 269
5 , 7
6627
HI6<»3
6567
195
266196
5 3 .
628
651657
6,565261.9
DOUB
aLE POINTSI
71.1.1*
23
377157||S65^6<*8
,39158
363
!
I i*> I
I376
SCORE 3 Ill 7Ô97 Ulli £7375
Fig. 4.3.10. Factor score diagram. Scores of 96 soil samples on factors 1 and 3
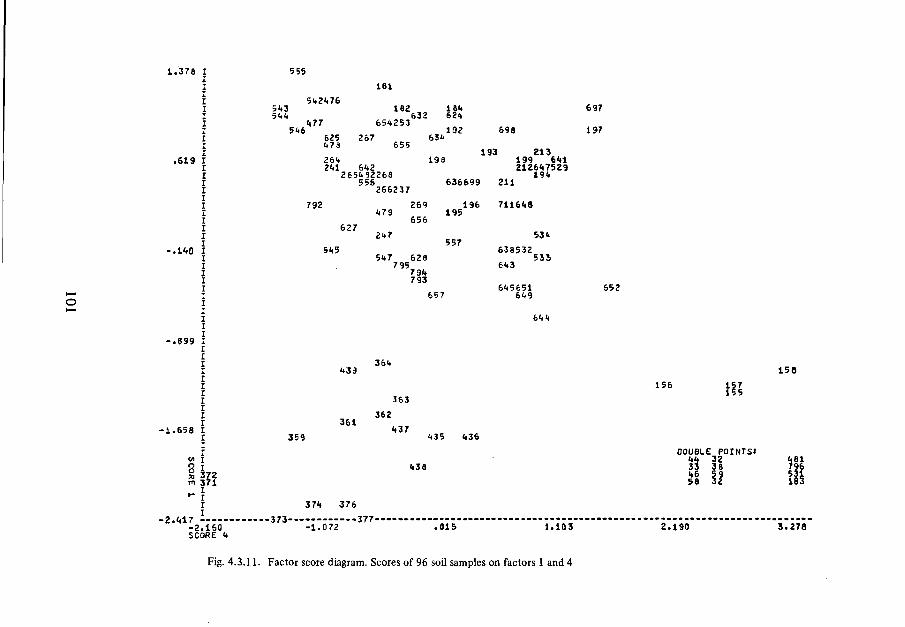
1.378 I 555
I 181
I 5l.2l.76I 5ft3 182 lift 697I 5ftft 632 62ftI ft77 65ft253I 5ft6 192 698 197I 625 267 63tI ft78 655I 193 213
.619 I 261. 198 199 6ftl
I 2651.32268 i9kI 556 636699 211I 266237
I 792 269 196 7116ft8I ft79 195I 656
I-.IM) I 5ft5 638532
I 5ft7 628 533I . 795 6ft3I 7 9ftI 793I 61.5651 652I 657 61.9I
I 6fti.I
- . 8 9 9 I
I 36ftI ft39 158
I 363
I 362I 361
-1 .658 I ^37I 359 1.35 ft36I DOUBLE POINTS«
«I ftft 32 ftSl
§s?« U9 ii i! ftfn 371 58 32 l i ;
I 37ft 376
"2*< 4 lI27Î6Ô 373 -Ï7Ô72 377 TÔÎ5 " . I l l 2*190 i'lrSCORE ftFig. 4.3.11. Factor score diagram. Scores of 96 soil samples on factors 1 and 4

calcium and pH with depth or a fairly constant score throughout the profile(fig. 4.3.11). Some profiles show an irregular score on factor 4 (e.g. samples fromprofiles 51, 16, 85, 95). This may be considered as an indication for colluviationprocesses that brought allochthonous weathering material with a divergent degreeof mineral alteration.
IV.4 SOIL MICROMORPHOLOGY
In addition to physical and chemical analysis of soil samples, micromorphologicalobservations of thin sections were made in order to assess soil forming processeswhich so far were not recognized by other analytical methods. Based on pedologi-cal and geomorphological field observations, six profiles were selected (profiles 9,85, 87, 57, 24 and 43). From these profiles 13 large thin sections ( 1 5 x 8 cm) wereprepared of undisturbed samples. The results of micromorphological analysis areillustrated here by the description of 6 thin sections coming from profiles 85, 57and 43. The thin sections were prepared according to procedures described byjONGERius & HEiNTZBERGER ( 1964). The micromorphological terminology used inthe descriptions is basically according to BREWER (1964).
Profile 85, typic paleudult, thin section 1 (depth 0 - 8 cm)
Groundmass: the skeleton grains consist mainly of quartz with some altered feldspars, micas, heavyminerals and rock fragments ini a random distribution pattern. The plasma consists of clayminerals, iron and organic matter. The basic fabric is porphyroskelic and the plasmic fabricis sepic. Voids are mainly craze planes with some skew planes and vughs.
Special features: plane and normal void ferriargillans (10 - 50 /im) occur frequently. Locally the ferriargillansare iron-impoverished, whereas at other places ferriargillans are iron-enriched. In some casesthe cutans consist of an alternation of clay and a fine matrix component. Along planes,bleached zones are present as well as neoferrans and quasiferrans (100 - 200 JUm).Aggrotubules and some papules occur.
Profile 85, thin section 2 (depth 22 - 30 cm)
Groundmass: as in sample 1. The plasma may be divided into 2 differently coloured types: a brown plasmaand a red coloured type. Boundaries between the two are distinct and abrupt. The brownplasma consists of aggrotubules. The plasmic fabric is sepic. The basic fabric is porphyros-kelic and the plasma consists of clay minerals and iron and some organic matter.Voids: vughs, interconnected vughs, skew and craze planes are common.
Special features: the brown plasma has an insepic plasmic fabric. Some normal void ferriargillans, locallycompound ferriargillans-matrans are present. Cutans are less than 50 ßm thick.The ferriargillans are sometimes discontinuous, they end abruptly at the boundary betweenbrown and red plasma. Thinner cutans, however, may be continuous. Both the argillan typeand the iron-rich type of cutans occur as in sample 1. Rounded papules occur rather fre-quently. Distinct rounded pedorelicts consisting of red plasma and containing clay illuviationare frequently present. The red plasma consists of clay minerals and much iron. It isconcentrated in pedotubules and the plasmic fabric is mosepic. The basic fabric is porphy-
102
roskelic. Voids are mainly craze planes, though some vughs occur as well. The porosity ofthe red plasma is lower than in the 0 - 8 cm sample and also lower than in the brown plasma.
Special features of the red plasma: the mainly mosepic plasma shows locally an omnisepic plasma reorien-tation. Along all voids, ferriargillans are present, locally only fine clay. The thickness of thecutans varies between 10 and 150 ßm. Though scarcely present, iron segregation may berecognized. Papules occur frequently and there are only few pedotubules.
The pedorelicts consisting of red plasma originated from a profile in which strongclay illuviation had taken place before the plasma was mixed with brown plasma.After mixture, which did not result from biological activity, a second phase ofweak clay illuviation resulted in the formation of the ferriargillans that are continu-ous and pass the boundary between brown and red plasma. The presence of feldsparsand the mainly mosepic, sometimes insepic plasmic fabric indicates a relatively youngage. The parent material in which the soil developed is not extremely weathered and,presumably, originates from a deeper part of the regolith in which a strong clayilluviation already had taken place.
Profile 57, typic paleudult, thin section 3 (depth 9-17 cm)
Groundmass: the skeleton grains consist of frequently occurring quarz grains ( >500 /Xm). The plasma is madeup of clay minerals with some iron. Basic fabric is porphyroskelic with a clustered distri-bution pattern. The plasmic fabric is silasepic. Voids are mainly vughs whereas some channelsoccur.
Special features: few weakly developed neoferrans. The plasma has strongly been impoverished in iron compounds.There are no indications of clay illuviation. Pedorelicts, rich in iron, are common and very fewpedotubules occur.
Profile 57, thin section 4 (depth 77 - 85 cm)
Groundmass: as in sample 3, though a few feldspars may be recognized. The plasma consists of clay mineralswith much iron. It is rather rich in sericite. The basic fabric is mosepic. Voids are skew planes,some craze planes and very few channels.
Special features: along planes iron segregation has taken place. The bleaching occurs patchy, parallel to structuralelements and sometimes along small channels. Plane quasiferrans are present as well as ferricnodules in varying sizes. Thin (20 - 30 JtXm) plane ferriargillans are recognized. Fecal pellets andpedotubules are absent.
The upper part of profile 57 with its silasepic plasmic fabric does not belong geneti-cally to the deeper part of the soil (mosepic). Mineralogical contents of the silt frac-tion differ as well. It is suggested here that the upper soil has a colluvial origin where-as the deeper part developed in situ by weathering of a rather fresh rotten rock zone(rubéfaction and weak clay illuviation).
103
Profile 43, typic haploithox, thin section 5 (depth 7-15 cm)
Groundmass: the skeleton grains consist of quartz in varying sizes up to 2000 jUm in a random distributionpattern. The basic fabric is porphyroskelic. Plasma is made up of clay minerals with much ironand some charcoal in a clustered distribution pattern. The plasmic fabric is sepic. Voids arecompound packing voids and craze planes. Channels are absent.
Special features: iron-rich pedorelicts are very frequently present. Aggrotubules are common, together withmetric fecal pellets.
Profile 43, thin section 6 (depth 67 - 75 cm)
Groundmass: skeleton grains as in sample 5. The basic fabric is a transition between porphyroskelic andagglomeroplasmic. The plasmic fabric is sepic and consists of clay minerals and iron.Voids are compound packing voids and craze planes which are more continuous than insample 5.
Special features: the plasmic fabric is mosepic to skelsepic. The occurrence of ferric nodules is less frequentthan in sample 5. The same is true for the presence of aggrotubules and fecal pellets.
Profile 43 has been developed in a thoroughly weathered regolith. There are nosigns of clay illuviation and the soil development has a ferrallitic character. Thetopsoilmicromorphology indicates degradation (lower porosity), and features ofbiological activity, though less frequent, are better preserved in the deeper partof the soil than in the upper part. The upper part of the soil is considered to be ofcolluvial origin because of its insepic plasma and the frequently occurring ferricnodules. The ferric nodules have a very distinct boundary and contain far lessskeleton grains than the basic fabric in which they are present. Therefore, and be-cause their possible origin cannot be connected with a mosepic or insepic plasmicfabric, the ferric nodules are considered as pedorelicts. Within the nodules, bandsof kaolinite are sometimes present, suggesting an origin in a deeper part of a re-golith profile, rather than in some B-horizon.
An important outcome of the micromorphological observations is the assessmentof a polycyclic soil development in the Sipaliwini area. Profile 85 indicates aprimarily strong clay illuviation followed by a more recent development underconditions that allowed for only minor clay migration. The two phases are separ-ated by an intensive mixing of both soil materials by mass movement or someother colluviation process.Although the older phase of strong clay illuviation could not be recognized inprofile 57, the more recent weak illuviation is present, as well as evidence forcolluviation.The second important process which was assessed by micromorphological investi-gations is the iron segregation, present in profile 85 and 57. This points at impededdrainage conditions, which is consistent with field observations.A polycyclic soil development, though different from the one described above, was
104

found for profile 43. Two phases of soil formation may be distinguished. The firstone indicates the formation of a plinthite soil. After hardening of the plinthite theduricrust was destructed and mass movement or colluviation resulted in the mixingof soil materials. Presently, soil formation has a ferrallitic character without ironsegregation showing in the solum. The upper part of the profile is in the course ofdegradation.
It is concluded that the micromorphological observations corroborate the classifi-cation of the major soils of the two landscapes involved (table 4.2.1).
105
IV. 5 SUMMARY AND CONCLUSIONS
In order to infer conditions of landscape evolution, soils of Sipaliwini savanna werestudied. Based on soil profile descriptions and analytical data, 20 representativesoils were classified according to USDA SOIL TAXONOMY (1975) revealed a groupingthat coincides with the main landscapes distinguished. In the Morro GrandeLandscape haplorthoxs prevail and soils of the hills in Sipaliwini Landscape aremainly paleudults while in the valleys dystropepts occur. Within the Valley FloorLandscape there is a differentiation between Inceptisols, present in the lower partsof the landscape, and Ultisols, occurring on the more elevated parts of the valleyfloors, i.e. the low rounded hills that lie within this planation level.
Soil development in the Upper Sipaliwini area is characterized by processes whichmay be headed on the one hand under weathering and former soil formation andon the other hand under recent soil formation.The processes of weathering and former soil formation comprise plinthite formationand hardening of plinthite, desilication, clay mineral formation and alteration anddifferential weathering of sand and silt size minerals. Processes of recent soil forma-tion comprise iron segregation, clay illuviation, truncation of profiles, colluviation,mass movement and accumulation of nutrients in the topsoil horizons.
The oldest phase of soil formation that may be recognized is one of formation ofplinthite, followed by hardening of the plinthite and destruction of the duricrust.As already mentioned in section III.2, remnants of this duricrust are found all overthe area with a maximum occurrence on summit level I. On summit level II itsoccurrence is only patchy. On level III plinthitic gravel was found in some boringsas well as in a few occasions (near Sipaliwini airstrip) as a sedimentary layer at thesurface.Apart from the formation of plinthite, desilication took place, resulting in an abso-lute impoverishment in silica, alkali and alkaline earth metals, a residual accumula-tion of iron, alumina and neoformation of clay minerals. This process was clearlyrecognized by factor analysis. It was shown that soils from Morro Grande Landscape ,are more intensely desilicated than those from Sipaliwini Landscape and Valley FloorLandscape. Along with desilication the formation of 2:1 lattice clay minerals tookplace. The stability of these minerals, mainly illites, depends predominantly on the[K+] / [H+] ratio in the soil solution (MOHR et al., 1972), Lowering of this ratioupon proceeded leaching caused the alteration of illites into kaolinites. This processhas mainly been recognized in the profiles of summit level I.
As to the chronology of duricrust formation and desilication, it may be assumedthat some of the desilication may have taken place before hardening of the plinthite(MOHR et al., 1972). The established difference in desilication between soils fromsummit level I and soils from summit level II and III resulted from rejuvenation andplanation by which less intensely weathered (desilicated) regolith material from a
106
deeper part of the weathering profile came to the surface. The lack of difference indesilication between soils from level II and soils from the Valley Floor Landscapemay be attributed to a relatively short time elapsed between the first rejuvenationphase and the second rejuvenation which led to the formation of the present valleyfloors. Moreover, it is possible that the soils of the Valley Floor Landscape havebeen enriched in silica by a lateral influx.
Weathering processes so far described resulted in a spatial differentiation of soils inrelation to geomorphological events and not in relation to differences in parentrock. There is however, some differentiation in weathering products of granites andvolcanites. Soils on intensely weathered granites are relatively coarse textured andsoils on volcanites, generally less weathered, are finer textured. These textural differ-ences which generally coincide with level I and levels II and HI soils, may at leastbe partly related to parent rock, granite being medium textured and volcanitesbeing fine or very fine texture. Processes of differential weathering resulted in theresidual accumulation of the sand fraction (mainly quartz) in strongly weatheredsoils which happen to occur mainly on granite. Less weathered soils contain muchmore silt and occur predominantly on volcanites but in some areas on granite as well.
The most widespread recent process influencing soil formation is one of colluviationor mass movement. There is much macro- and micromorphological evidence indi-cating a high intensity of geomorphological processes that resulted in truncation ofsoils, sedimentation from upslope and mixing of soil horizons. Micromorphologicalindications of clay illuviation, preceeding a phase of mass movement were found inprofiles from the western and central part of the savanna. Following mass movementanother phase of minor clay illuviation could be recognized in profile 85.In most profiles of the Sipaliwini and Valley Floor Landscapes features of impededdrainage are present. Mottling occurs in many cases, even in soils which are in hightopographic positions, in the surface horizons, and deeper. Micromorphologicalevidence for iron segregation was found as well. The iron segregation appears tofollow the clay illuviation and mass movement phases.
As to the environmental conditions under which weathering and soil formation pro-cesses took place, it is thought that the formation of deep weathering profiles withplinthite occurs under conditions of a fluctuating ground water table (MOHRet al.,1972). Duricrusts generally form by irreversible desiccation of the plinthite horizon.Desilication or ferrallitization preferably takes place under conditions of high rain-fall and high permeability. Generally, the vegetation cover is tropical rainforest.Rejuvenation of soils may result from either a geomorphological rejuvenation bywhich soil formation takes place in less weathered parent material from a deeperpart of the regolith that has come to the surface, or by lateral influxes of weatheringproducts that enrich the environment of soil formation. As it was shown that thesequence of weathering processes comprise desilication and primarily formationof 2 : 1'lattice clays, followed by alteration of these clays into kaolinite, it is assumed
107
that the rejuvenation of the soils generally resulted from geomorphological pro-cesses that brought less desilicated parent material to the surface. Nevertheless, itmay not be precluded that lateral enrichment of parent material has taken place aswell, especially in the Valley Floor Landscape soils.
The translocation of clay, which was not observed in soils of the Morro GrandeLandscape, followed upon rejuvenation. Translocation of clay is held to occur underconditions of alternating wetting and drying of the soil (USDA, 1975). Such condi-tions may have been present in the Morro Grande Landscape as well, but the char-acter of the clay is one of low activity, whereas the clays of Sipaliwini contain more2:1 lattice minerals.After translocation of clay, especially in the soils of Sipaliwini Landscape, iron seg-regation took place in the upper parts of the solum because of impeded drainageconditions in these parts of the soil profile.Finally, the accumulation of nutrients in the topsoil horizons resulted from presentsavanna conditions with its frequently occurring fires.
108
CHAPTER V
LANDSCAPE DEVELOPMENT
In the previous chapters environmental conditions of the Upper Sipaliwini drainagebasin, the geomorphological evolution and soil development have been described.The development of land systems and geomorphological units has been attributedto a sequence of planation and rejuvenation phases. The distribution of soil proper-ties over these units shows a rather regular character and the interpretation of bothgeomorphology and soils permits the proposition of a model of landscape develop-ment which finally led to the actual savanna landscapes of the Upper Sipaliwini basin.
Basic assumptions and starting point for this model are:
- a repetitive rejuvenation of the drainage basin.- the occurrence of climatic changes that predispose vegetation changes.- parallel to vegetation changes, the dominant geomorphic processes vary between
landscape dissection and landscape planation, dissection taking place mainlyunder a forest cover and planation occurring under savanna vegetation.
- soil water conditions, whether alternating wet and dry or continuously wet or dry,are influenced not only by climate, but also by drainage possibilities which ontheir turn depend on soil properties, relief, and the distance to the ground watertable.
Rejuvenation of a landscape or dissection is the reaction on disturbance of anequilibrium between the river long profiles and the height of the base level of erosionunder given climatological and vegetation conditions. The origin of any disturbancemay therefore be the result of either a relative uplift of parts of the drainage basinor changes in climate and vegetation. As to the Upper Sipaliwini drainage basin it isassumed that both have occurred. The evidence of tectonic upheaval of the GuianaShield is given in section II.2. Together with climatic changes and supposed variationsin the vegetation, the rejuvenation phases were elaborated in Chapter III.
Supporting evidence for the second assumption is given in section II. 1. It should benoted that the danger of circular reasoning is present there. In many cases formervegetation conditions have been established by means of pollen data. These are inter-preted in terms of certain climatic conditions. The interpreted climates are then usedas basis for an assumed vegetation type in areas where no factual data are available.It must however be stressed that it may not be precluded that some of the establishedvegetation changes are not the result of climatic changes, but that they are initiatedby changes in geomorphic and edaphic conditions.
The reasoning behind the third basic assumption is based on erosion measurements
109
(section III.3) and literature data, THOMAS (1974) concludes that the rate of surfaceerosion in regions with gentle slopes increases to a maximum within seasonal sa-vanna areas, then will fall gradually as the vegetation cover becomes more protectiveas under wet forest conditions. High erosion rates will be seen, especially in rapid .denudation from interfluves, combined with a relatively slow rate of channel cuttingin streams subject to seasonal discharge and high sediment yields. In high rainfallareas with forest, the continuous and consistently high channel discharge, combinedwith rather localized denudation on slopes, results in relatively strong channelcutting.
With regard to the fourth starting point of the model, a distinction should be madebetween infiltration capacity and soil permeability. Infiltration capacity may bedefined as the ability of the soil surface layer to soak up water, whereas permeabili-ty is the ability to conduct soil water to lower layers of the profile (MOHR et al., 1972).During precipitation the infiltration rate initially depends on the infiltration capaci-ty. After saturation of the top soil sorizons however, permeability dominates. Apartfrom given soil properties that determine the conductivity for water, the height ofthe ground water table and its gradient influence permeability. In situations wherethe ground water table is near the surface and having a low gradient, saturation ofthe upper soil horizons will soon be reached since permeability is absent and theflow of ground water is extremely slow. Furthermore, desiccation of the upper partof the soil during dry periods by evapotranspiration will be retarded due to additio-nal moisture supply from capillary rise of ground water. On the other hand, underconditions of a higher relief, the ground water table is lowered and its gradient isincreased. Its influence on surface soil moisture content and the permeability is verymuch reduced. As the supply of infiltrating water varies under a cycle of wet anddry periods, so will the moisture content. At high supply rates the soil may drainmore or less freely, dependent on its own properties and independent of the groundwater table. During dry periods the upper part of the soil desiccates, having noadditional supply of capillary ascending groundwater.
The oldest geomorphic unit that is recognized at present is the upper summit level I.of the Morro Grande Landscape with remnants of a deep weathering profile withplinthite. The formation of deep weathering profiles with plinthite is thought tooccur under conditions in which a fluctuating ground water table is present. Allcircumstances favouring such a fluctuation promote plinthite formation, e.g. hightemperatures, an uneven distribution of the precipitation over the year and aphysiography with a low relative relief (MOHR et al., 1972). Such a relief has probablybeen developed under savanna vegetation conditions. Following these conditions,tropical rainforest settles on the surface. This landscape, extending over the areawhere actually the Morro Grande -, the Sipaliwini - and the Valley Floor Landscapeare present, forms the assumed starting situation of the model of landscape develop-ment.
110

The planated landscape (see fig. 5.1 .A) has a low to very low relative relief with apreviously developed deep weathering mantle. Under the influence of a fluctuatingground water table a plinthite horizon has been formed. The lowering of the baselevel of erosion causes a knickpoint in the river long profile. As the knickpointmigrates upstream, the part of the landscape downstream of the knickpoint isdissected under conditions of an everwet tropical climate and rainforest vegetation,and desilication is promoted. When the upstream movement of the knickpoint isslowed down, e.g. by a climatic shift to wet and dry conditions, the dissected land-scape has better lateral and external drainage conditions (fig.5.1.B). Due to improveddrainage conditions and a generally drier climate, the groundwater level is loweredin the areas II and III. Though to a lesser degree, the same holds for area I. Theplinthite horizon has been hardened and in combination with a decreased avail-ability of soil moisture, the already low mineral status of the strongly weatheredsoils, the tropical rainforest vegetation is gradually replaced by a seasonal savannaon the newly formed hills. On the valley floors where seasonal waterlogging alter-nates with desiccation, a hyperseasonal savanna vegetation develops (fig. 5.1.C).
Initially the hardened plinthite layer may have acted as an aquifer on which forestcould be maintained, but as dissection proceeds the layer is progressively drainedand seepage eventually results in sapping of the indurated cuirass on top of thehills. Pianation processes that now prevail under the climatic and vegetation con-ditions, lead to the formation of an erosion surface which is adjusted to the newerosion base level. The occurrence of the original planation level is in this phaserestricted to the area of the present water divide (area I, fig. 5.1.D).
It may not be precluded that even in this stage with a seasonal climate a rainforestcover persisted in areal The lowering of the groundwater level will not have beengreat. Dissection of area I had only been of minor importance as was the drainageof the plinthite aquifer.
The first planation phase is followed by a climatic change to everwet conditions.In area II and III the hyperseasonal and seasonal environment makes way fortropical rainforest. Apart from the climate, the vegetation change is favoured bythe mineral status of the soils. Owing to planation, a less weathered part of theregolith profile has come to the surface in areas II and III and now serves as parentmaterial for soil formation (fig. 5.1.E).
Under the rainforest cover in area II and III, rockweathering is accelerated and theweathering front (basal surface) is gradually lowered. The lowering of the basalsurface under area I in the meantime, has lagged behind due to the reduced perco-lation of rainwater to the deeper horizons since the hardened plinthite is stillpresent.
As a second rejuvenation takes place under the climatic everwet and rainforest con-
111
ditions, the knickpoint in the river long profile belonging to the first rejuvenationphase is cleared away and replaced by the knickpoint of the second rejuvenation.This means that all over the area the local base level of erosion is lowered. While thebase level lowering proceeds, the second planation level of areas II and III is dissectedas is the initial planation level of area I. Thus, at the end of the second rejuvenationphase, summit level I and II have come into being. Drainage of the regolith and soilson the hills is strongly improved since the relative relief is increased by lowering ofthe local base level of erosion and the consequent lowering of the ground water table.Furthermore, in area I the indurated plinthite has come to the surface and is graduaally broken up (fig. 5.1.F).
In this situation, a climatic change to drier conditions or possibly just the decreasedsoil water availability initiates a replacement of the forest vegetation by a morexeromorphic formation of a seasonal savanna. However, on hillslopes where seepageoccurs, the forest is maintained or its replacement is retarded. On valley floors con-ditions again favour the establishment of hyperseasonal savanna and swamp commun-ities (fig. 5.1.G).
In those parts of the landscape where drainage is most adequate, notably in thedownstream part of area II where incision is deepest, especially along the main rivers,the vegetation change promotes planation processes which result in valley wall re-treat. Here, wide valley floors are formed, representing the actually present ValleyFloor planation level in area III (fig. 5.1 .H).
Slope retreat and therefore lateral planation is favoured in zones where the regolithprofile is as deep as the incision is or even deeper. The occurrence of a deep rego-lith, extending laterally, is related to humid environments with a continuous supplyand removal of infiltrated water. Such environments are most likely to occur alongmain drainage courses. Valleywalls, developed in these zones, will retreat relativelyunhindered whereas in zones where the lateral extension of a deep regolith issmaller, slope retreat is hampered by frequently occurring corestones or fresh parentrock itself. In this sense, the Valley Floor Landscape of area III may be consideredan inherited landform, related to a former drainage pattern. In area I (Morro GrandeLandscape) slope retreat is hampered by the presence of residually accumulatedcoarse material at the surface of the strongly weathered regolith and plinthite soil.
The most recent change of climate to wetter conditions did not result in a vegetationchange. On the hills the soils are well drained due to surface sealing which providesfor a fast external drainage. On the floodplains hyperseasonal conditions are presentand along the watercourses swamp communities occur along with gallery forest insituations where the river incision in the floodplain is deeper and riverbanks aremore elevated.Regarding climate, present environmental conditions in the Upper Sipaliwini area
112

are considered to tend to an ecosystem of which rainforest dominates the physiog-nomy. The geomorphic and pedological evolution however resulted in changes ofedaphic and hydrological factors which prevent reforestation. Infiltration takesplace to a limited extent and is very slow. External drainage is fast due to surfacesealing and the short dry season is long enough to desiccate the eventually moistenedsoil horizons. Consequently, in the low gradient valley floors waterlogging is restric-ted to the rainy season. Nevertheless under similar ecological conditions adjacentfloodplains are covered with forest. However, since for the greater part the boundarybetween the forest and savanna vegetation is associated with the presence of riversand swamps, the distribution of savanna and forest is considered to be influencedby fire.
At the moment Sipaliwini savanna is uninhabited but there are numerous indica-tions for a former dense occupation, BUBBERMAN (1973), who discovered a strikingstone block with Amerindian inscriptions and many workshops for the manufactu-ring of obsidian and other volcanite artefacts as arrowheads, knifes etc., assumesthat in earlier times the Upper Sipaliwini area played an important role as a transitfor population flows of groups migrating from the Amazon basin to the Corantynebasin and vice versa. At present, Trio Amerindians inhabit some semi-permanentsettlements of which Pouso Tirio, a missionary post on the Paru River, is functioningas a place of convergence for all neighbouring Trio subgroups (RIVIERE, 1969). Eachdry season, the Trio Amerindians set enormous fires intentionally, by whichextensive savanna areas are burnt. Eventually the fires extinct where they meet thebarriers of main rivers and swamps which they are unable to pass. At other placesthe forest boundary retreats gradually under the influence of fires.
As to the chronology of the events depicted in the model above, only speculationscan be made in the absence of absolute dating possibilities.The summit level of Morro Grande Landscape may be correlated with other levelsin Suriname at comparable altitudes . These are tentatively dated as mid-Tertiary(DE BOER, 1972). The described first rejuvenation would then have taken place afterthis time.
It is generally accepted that Inceptisols are soils of post-Pleistocene surfaces (USDA,1975) and so would be the Valley Floor Landscape.The features of clay illuviation in the soils of Sipaliwini Landscape point at condi-tions under which clay particles become dispersed and are transported by waterthrough pores. A summary on clay movement (USDA, 1975) mentions that claymovement has not been reported in the soils of the youngest landscapes, that itoccurs more frequently under forest than under grass vegetation in the same land-scape and that the mechanism of clay movement is favoured in several ways by aseasonal water deficit. For the soils of the Sipaliwini Landscape it may furthermorebe assumed that clay movement took place over a relatively short period since theilluviation is rather weak. During illuviation the eluviation horizons were still
113

present. Later, denudation of the interfluves deprived the profiles of their topsoilhorizons and, in part, covered them with a colluvial layer. The illuviation is probablynot older than about 15.000 years, since it is assumed that recent soil formation andbiological activity would have destroyed the (ferri)argillans over such a period oftime.
It is tempting to relate these assumptions and conditions to the suggested last vegeta-tion phase, when the forest ecosystem equilibrium was disrupted and replaced by asavanna ecosystem. In that case, the vegetation change could not be older than about15.000 years. This implies that the formation of the Valley Floor Landscape wouldhave been realised in that period of time which is not unreasonable to assume.
114
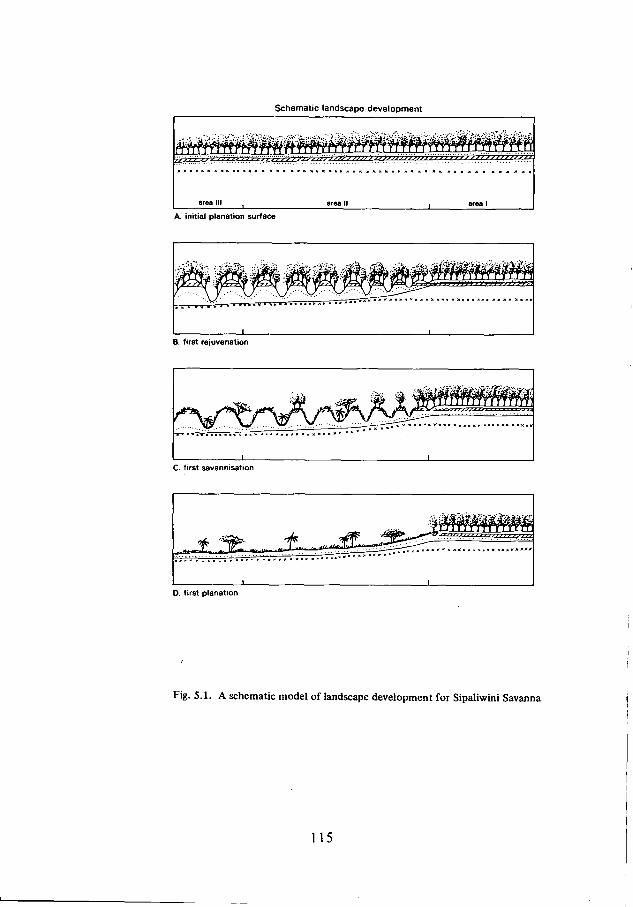
Schematic landscape development
area III
A. initial planation surface
B. first rejuvenation
C. first savannisation
D. first planation
Fig. 5.1. A schematic model of landscape development for Sipaliwini Savanna
115
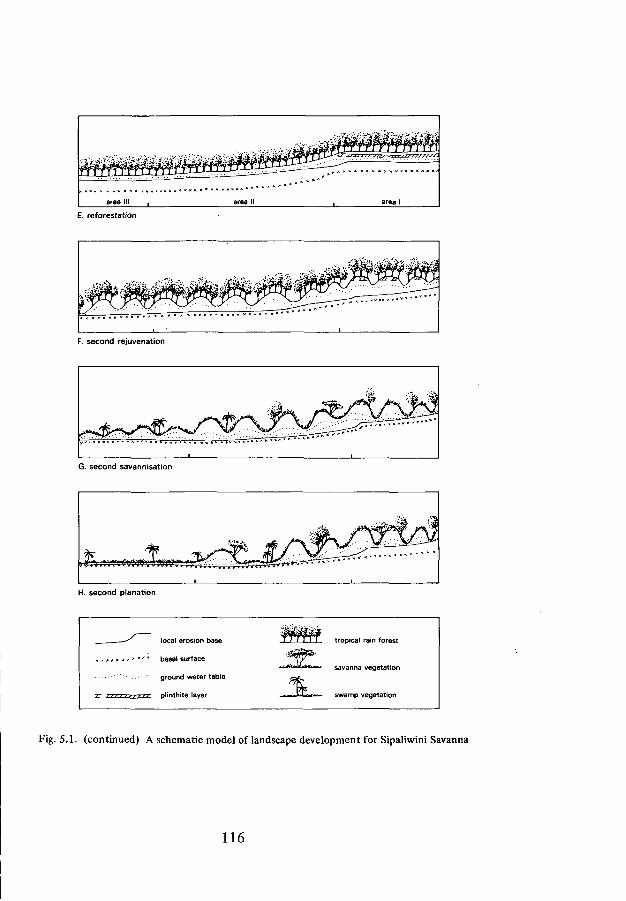
•a i .
are 3 III | area II , are a 1
E. reforestation
F. second rejuvenation
G. second savannisation
H. second planation
local erosion base
basal surface
ground water table
plinthite layer
T / 7 7 1 T tropical rain forest
•f-..iifft^tf**«'.—r savanna vegetation
swamp vegetation
Fig. 5.1. (continued) A schematic model of landscape development for Sipaliwini Savanna
116

ACKNOWLEDGEMENTS
This study would not have been possible without the help of many persons andorganizations.First of all I am greatly indebted to my promotors PROF.DR.F.R.MOORMANN for hishighly appreciated involvement and efforts, and PROF.DR.J.I.S.ZONNEVELD for hiscontinuous support and encouragement.I am most grateful to DRJ.HJ.TERWINDT for his many constructive critical remarksand to DR.J.P.HERWEUER for his valuable contributions to this treatise.I gratefully acknowledge the pleasant discussions with DR.IR.S.SLAGER, his wiseadvice and comments on soil micromorphology.
Special thanks are due to my co-expeditionairs MR.R.NORDE and DRS.F.H.F.OLDEN-BURGER, who supported me more than they realize during the lonesome months onthe savanna.I am much indebted to my many Surinam friends who accompanied and assistedme during the two expeditions and without whom I wouldn't have even survived.Especially MR.PIKIN PAI, MR.LEO ROBERTS and MRJOHN TAWJOERAN must be mentioned.
The cooperation of the SURINAM DEPARTMENT OF FORESTRY, the SURINAM FOUNDATIONFOR NATURE PRESERVATION and t h e SURINAM DEPARTMENT OF SOIL SURVEY was h ighlyappreciated. I am particularly indebted to DRJ.P.SCHULZ, IR.F.C.BUBBERMAN andDRS.P.A.TEUNISSEN, who greatly contributed to the succes of the expeditions.
The research was made possible by grants from the NETHERLANDS FOUNDATION FORTHE ADVANCEMENT OF TROPICAL RESEARCH (WOTRO), whose representative in Suriname,DRS.iR.s. RUINARD I wish to thank for his good offices, particularly in times of distress.
I express my cordial gratitude to my colleagues of the DEPARTMENT OF PHYSICALGEOGRAPHY, UTRECHT UNIVERSITY, who displayed a stimulating attitude towards mywork, especially DRS.w.ThJ.VAN ASCH, DR.P.G.E.F.AUGUSTINUS and DR.H. VAN STEUN,who all freed me from many tiresome jobs during the preparation of the manuscript.
Furthermore, I would like to express my appreciation to the technical staff of theLABORATORY FOR PHYSICAL GEOGRAPHY, UTRECHT UNIVERSITY, for m a n y of t h e SOUanalytical determinations. In particular MR.H.A.MAARSCHALKERWEERD.MR.A.ROMEINand MR.G.H.ouwERKERK must be mentioned.I thank the staff of the DEPARTMENT OF GEOGRAPHY, UTRECHT UNIVERSITY, for the manyservices rendered: DRJ.HEERING for his kind encouragement, MR.M.ROOK for hisefforts, MR.Ph.L.RiEFF for the drawings and MR.G.H.HUYGEN for the photographicalwork.
I am much indebted to the staff of the DEPARTMENT OF SOIL SCIENCE, UTRECHT UNIVERSITY,
117

for their cooperation, especially the late PROF.DR.IR.F.A.VAN BAREN, whose lecturesare remembered gratefully, and DRS.N.M.DE ROOU, who assisted in X-ray fluorescense -,X-ray diffraction - and factor analysis.
Several students assisted during the research. I am particularly grateful to DRS.V.W.P.VAN ENGELEN, who assisted me during the second expedition, to DRS.G.T.A.HOF,DRS.W.HOOGENDOORN, DRS.O.KOOU and MR.P.M.SCHOOT, who fixed many tiresome jobs,and to MISS MAUREEN NACHENIUS, who patiently endured my nonsensical monologues,participated in many brainstorms and took care of much preparatory work.I wish to thank MISS GISELE BAKKER for the critical reading of the English text andMRSJULISKA VAN DER HOEVEN-HUBATKA for accurately typing the manuscript, meanwhilesolving many problems.
Finally I acknowledge my gratitude to my wife MADELEINE, who, in spite of me, man-aged to create the 'environmental conditions' under which my work could prosper.
118
REFERENCES
ADAMS, J.E., D.KIRKHAM & D.R.NIELSEN, (1957). A portable rainfall simulator-infUtiometer andphysical measurements of soil in place. Soil Sc.Soc.Proc. 1957, p.474 - 477.
AUBREVILLE, A., (1949). Climats, forêts et desertification de l'Afrique tropicale, Paris.AUER, V., (1958). The pleistocene of Fuego-Patagonia. Paît II. Ann.Acad.Sci.fenn. A (III) 50 : 7 - 240.BARBOSA, O., (1959). Geomorfologia do Território do Rio Branco. Notîcia Geomorfológica 1.BEARD, J.S., (1953). The savanna vegetation of northern tropical America. Ecol.Monogr.23. p.149 - 215.BEEK, K.J. & D.L.BRAMAO, (1968). Nature and geography of South American sous. In: E.J.FITTKAU
et al. (Ed.). Biogeography and ecology in South America. Vol.1, p.82 -112. The Hague.BEINROTH, F.H., G.UEHARA & H.IKAWA. Geomorphic relationships of Oxisols and Ultisols on Kauai,
Hawaii. Proc.Soil Sc.Soc.Am.vol.38, 1974. p.128 - 131.BIGARELLA, J.J. & G.O.DE ANDRADE, (1965). Contribution to the study of the Brazilian Quaternary.
Spec.Pap.Geol.Soc.Am. 84. p.433 - 451. 1965.BIROT, P., (1960). Le cycle d'érosion sous les différents climats. University of Brazil.BOSMA, W. & W.GR0ENEWEG, (1970). Review of the stratigraphy of Surinam. Proc.8th Guiana Geol.
Conf. Georgetown Guyana, Aug. 1969.BOSMA, W. & W.E.OOSTERBAAN, (1973). 30 Years Geological and Mining Service of Suriname. Geol.
Mijnb.Dienst. pp.31. Paramaribo.BOUYER, S. & M.DAMOUR, (1964). Les formes du phosphore dans quelques types de sols tropicaux.
Trans.8th Int.Cong.Soil Sc.4. p.551 - 561.BREWER, R., (1964). Fabric and mineral analysis of soils. Wiley, New York, pp.470.BROOK, R.H., (1968). Bodemkundig rapport over een oriëntatiebezoek aan de Sipaliwinisavanne in maart-
1968. Dienst Bodemkartering. Paramaribo. Rapport no.20.BRYAN, R.B., (1976). Considerations on soil erodibility indices and sheetwash. Catena. Vol.3, no.l.BUBBERMAN, F.C., (1973). Rotstekeningen in de Sipaliwini savanne. De Nieuwe West-Indische Gids, 49.3.BUDEL, J., (1957). Die 'doppelten Einebnungsflächen' in den feuchten Tropen. Z.Geomorph. N.F.l.CHANG, S.C. & M.L.JACKSON, (1958). Soil phosphorus fractions in some representative soils. J.Soil Sc.9.
p.109- 119.CHORLEY, R.J. & P.HAGGETT, (1965). Trend-surface mapping in geographical research. Trans.Inst.Brit.
Geogr.no.37, p.47 - 67.CHOUBERT, B., (1957). Essai sur la morphologie de la Guyane. Mém.Carte Géol.dét.de la France : Dép.de
la Guyane française. Paris.CHRISTIAN, C.S. & G.A.STEWART, (1952). Summary of general report on survey of Katherine-Darwin
Region. Land Research Series 1, pp.24.CHROSTOWSKI, M.S. & W.M.DENEVAN, (1970). The Biogeography of a Savanna Landscape. The Gran
Pajonal of Eastern Peru. McGill University savanna research project, Savanna Res.Series no.16.COLE, M.M., (1960). Cerrado, caatinga and pantanal : the distribution and origin of the savanna vegetation
of Brazil. Geogr.Journal. p.168 - 179.COLE, M.M., (1963). Vegetation Nomenclature and Classification with Particular Reference to the Savannas.
The South-African Geogr.J. 45. p. 3 - 15.COLE, M.M., (1968). In: T.L.HILLS & R.E.RANDALL (Eds). The ecology of the Forest/Savanna Boundary.
McGill Univ. Savanna Res.Series no.13.COOKE, R.U. & J.C.DOORNKAMP, (1974). Geomorphology in Environmental Management. An Introduc-
tion. Clarendon Press, Oxford, pp.413.DANSEREAU, P., (1957). Biogeography, an Ecological Perspective. Ronald Press New York.DAVIS, J.C. Statistics and Data Analysis in Geology 1973. Wiley & Sons, New York, pp.550.DE BOER, M.W.H., (1972). Landforms and soils in eastern Surinam. Thesis Wageningen 1972. pp.176.DE GOEJE, C.H., (1908). Verslag der Toemakhoemak-expeditie. Tijdschr.Kon.Ned.Aardr.Gen.25.5. p.l - 225.DE SAMPAIO, A.J., (1933). A Flora do Rio Cumina. Arch.Mus.Nac.35. p.9 - 206.
119
D1XEY, F., (1942). Erosion cycles in Central and Southern Africa. Geol.Soc.S.Afr.45. p.151 - 181.DOST, H., (1962). Verslag van een bodemverkenning op de Sipaliwini savanne. Mim.Rep.Dienst Bodemkar-
tering. Paramaribo.DU RIETZ, (1962). Fundamental units of vegetation. Proc.Int.Cong.Pl.Sci.l. p.623 - 627.E1TEN, G., (1972). The Cerrado Vegetation of Brazil. The Botanical Review, Vol.38 no.2. p.201 - 341.EYRE, S.R., (1968). Vegetation and Soils. Edward Arnold Ltd. London, pp.328.FAO, (1966). Guidelines for soil description, Rome.FAO/UNESCO, (1971). Soil map of the World. Vol.IV. South America.FEODOROFF, A., (1965). Mécanismes de l'érosion par la pluie. Rev.Géogr.Phys.et de Géol.Dyn.VII. p. 149 -
163.FOURNIER, F., (1962). Carte du danger d'érosion en Afrique au Sud du Sahara. Presses Univ.Paris.GAUSSEN, H., (1963). Les cartes bioclimatiques et de la végétation. Sci.Sol.l. p.117- 131.GERLACH, T., (1967). Evolutions actuelles des versants dans les Carpathes, d'après l'example d'observations
fixes. Slopes Comm.Rep.5. p. 129 - 138.GODDARD, J. & A.KIRBY. An introduction to Factor Analysis. Catmog 7. Geo Abstracts, Norwich.GOODLAND, R., (1970). The savanna controversy. McGill Univ. Savanna Res.Proj. Publ.no.15. Montreal.
pp.66.GR1SEBACH, A.H.R., (1872). Die Vegetation der Erde nach Ihrer Klimatischen Anordnung. Leipzig.HERWEUER, J.P., (1979). Slope Form Analysis in Pleistocene Landforms (Leeward islands of the Netherlands
Antilles). Thesis Utrecht, pp.134.HESTER, J.J., (1966). Late Pleistocene environments and early man in South America. Am.Naturalist 914.
p.377-388.HEYLIGERS, P.C., (1963). Vegetation and soil of a white-sand savanna in Suriname. In: J.LANJOUW & VER-
STUGH (Eds) The vegetation of Suriname. Vol.111, p.l - 148.HILLS, R.C., (1970). The determination of the infiltration capacity of field soils using the cylinder infiltro-
meter. Techn.Bull.Brit.Geom.Res.Group.HILLS, T.L., (1965). Savannas : a review of a major research problem in tropical geography. Canadian Geo-
grapher IX. 4. p.216 - 228.HILLS, T.L., (1969). The savanna landscapes of the Amazon Basin. McGill Univ. Savanna Research Series
no.14. pp.38.HILLS, T.L. & R.E.RANDALL, (1968). The Ecology of the Forest/Savanna Boundary. McGill Univ.Savanna
Res.Series no.13. (Proc.IGU Humid Tropics Comm.Symposium, Venezuela 1964). pp.128.HOOGMOED, M.S., (1973). Notes on the Herpeto fauna of Surinam IV. Thesis, W.Junk, Den Haag.HUDSON, (1971). Soil conservation. Cornell univ.press, London.HUECK, K., (1957). Die Ursprünglichkeit der brasilianischen 'campos cerrados' und neuer beobachtungen an
ihren Südgrenze. Erdkunde 11. p. 193 - 203.JAEGER, F., (1945). Zur Gliederung und Benennung des tropischen Graslandgürtels. Verh.Naturf.Ges.Basel,
56 : p.509-520.JAE-ON KIM, (1975). Factor Analysis. In: NIE et al. (Eds.). Statistical Package for the Social Sciences, 2nd ed.
1975 p.468-514.JESSEN, O., (1938). Reisen und Forschungen in Angola. Berlin.JONGERIUS, A & G.HEINTZBERGER, (1964). The preparation of mammoth-sized thin sections. Soil
Survey Papers 1., Wageningen.KELLOGG, C.E., (1949). Preliminary suggestions for the classification and nomenclature of great soil groups
in tropical and equatorial regions. Commonw.Bur.SoilSc.Tech.Commun.46. p.76 - 85.KING, L.C., (1953). Canons of landscape evolution. Geol.Soc.Am. Bull.64. p.721 - 752.KING, L.C., (1957). A geomorphological comparison between Eastern Brazil and Africa (Central and Southern).
QuarU.Geol.Soc.Lond.Vol.il2. p.445 - 474.KING, L.C., (1958). Correspondence: 'the problem of tors'. Geogr.J. 124. p.289 - 291.KING, L.C., (1962). The morphology of the earth: a study and synthesis of world scenery. Edinburgh.
Oliver & Boyd. pp.699.KING, L.C., D.K.HOBDAY & M.MELLODY, (1964). Cyclic denudation in Surinam. Geol.Mining Serv.Surinam.
Internal report. Paramaribo.
120
KOPPEN, W., (1918). Klassifikation der Klimate nach Temperatur, Niederschlag und Jahreslauf. Pet.Geog.Mitt. p.193-203, 243-248.
KOPPEN, W., (1931). Grundriss der Klimakunde. Berlin. Walter de Gruyter.KOPPEN, W., (1936). Die Klimatc der Erde. In: W.KOPPEN & GEIGER Handbuch der Klimatologie Bnd I,
Teil C.KROOK, L., (1970). Climate and sedimentation in the Guianas during the Last Glacial and Holocene.
8th Guiana Geol.Conf.1969. Georgetown.KROOK, L., (1975). In: R.W.FAIRBRIDGE (Ed.). The Encyclopedia of World Regional Geology, Part 1:
Western Hemisphere. Surinam, p.480 - 492. Dowden Hutchinson & Ross.LANGBEIN, W.B. & S.A.SCHUMM, (1958). Yield of sediment in relation to mean annual precipitation.
Trans.Am.Geophys.Union 39. p.1076 - 1084.LANJOUW, J., (1936). Studies of the vegetation of the Surinam savannahs and swamps. Ned.Kruidk.Arch.46.
pp.823-851.LAUER, W., (1952). Humide und aride Jahreszeiten in Afrika und Südamerika und ihre Beziehungen zu den
Vegetationsgürteln. Bonner Geog.Abh.9 : 15 - 98.LEPSCH, I.F. & S.W.BUOL, (1974). Investigations in an Oxisol-Ultisol toposequence in S.Paolo State,
Brazil. Proc.Soil Sc.Soc.Am. Vol.38, p.491 - 496.LINDEMAN, J.C. & S.P.MOLENAAR, (1959). Preliminary survey of the vegetation types of northern
Surinam 1. part 2. p.l - 45.LINTON, D.L., (1955). The problem of tors. Geogr.J.121. p.470-487.LOUIS, H., (1964). Ueber Rumpfflächen und Talbildung in den wechselfeuchten Tropen, besonders nach
Studien in Tanganyika. Z.Geomorph. Bd 8. Sonderheft Mortensen, p.43 - 70.MABBUTT, J.A., (1961). A stripped landsurface in western Australia. Trans.Inst.Brit.Geogr.29. p.lOl - 114.MATHER, P.M., Computational Methods of Multivariate Analysis in Physical Geography. 1976. Wiley & Sons
London, pp.532.MAXWELL, A.E., (1977). Multivariate Analysis in Behavioural Research. Chapman and Hall, London, pp.164.McCONNELL, R.B., (1966). Notes on the erosion bevels and geomorphology of British Guiana. Trans. 3rd
Caribbean Geol.Conf. Jamaica. April 1962. p.115 - 159.MEYER, L.D., G.R.FOSTER & M.J.M.ROMKENS, (1975). Source of soil eroded by water from upland
slopes. USDA Report ARS-5-40.MOHR, E.C.J., F.A.VAN BAREN & J.VAN SCHUYLENBORGH, (1972). Tropical Soils. Van Hoeve,
The Hague, pp.481.MEYERS, J.A., (1936). Savannah and Forest Vegetation of the Interior Guiana Plateau. J.Ecology 24.
p.162- 184.NOTA, D.J.G., (1958). Sediments of the western Guiana shelf. Thesis, Wageningen.NOTA, D.J.G., (1967). Geomorphology and sediments of the western Surinam shelf. A preliminary note.
Geol.Mijnb.48. p. 185- 188.NOTA, D.J.G., (1971). Morphology and sediments off the Marowijne River, eastern Surinam shelf. Hydro-
graphic Newsletter. Spec.Publ. 6 : p.31 - 36.0DUM, E.P., (1971). Fundamentals of ecology. Saunders Company, Philadelphia, pp.574.O'HERNE, L., (1966). Geological Map of the Sipaliwini Region. Not published. Geol.and Mining Serv.Surinam.O'HERNE, L., (1969). Presentation of the photogeological map of Surinam, 1 : 1.000.000. (Proc.7th Guiana
Geol.Conf. 1966). Verh.Kon.Ned.geol.mijnb.Gen.27. p.49 - 52.OLDENBURGER, F.H.F., (1973). Het savanneprobleem en de Sipaliwini-Savanne in Suriname in het licht
van de algemene Biostasie-Rexistasie theorie. Berichten Fys.Geogr.Afd.no.7.OLDENBURGER, F.H.F. & R.NORDE. The vegetation of the Sipaliwini Savanna in Southern Suriname
(in prep.).OLDENBURGER, F.H.F., R.NORDE & H.T.RIEZEBOS, (1973). Ecological investigations on the vegetation
of the Sipaliwini-savanna area. (Southern Surinam). Univ.Utrecht. Lab.Phys.Geography, pp.59.0LIVEIRA, A.I. et al., (1956). Brasil. In: W.F.JENKS, Handbook of South American Geology; an explanation
of the geologic map of South America. Geol.Soc.Am.Mem.65.OLLIER, CD., (1960). The inselbergs of Uganda. Z.Geomorph. NF.4. p.43 - 52.
121
PANNEKOEK, A.J., (1967). Generalised contour maps, summit level maps and streamline surface maps asgeomorphological tools. Z.Geomorph. NF. 11. p. 169 - 182.
PENCK, A., (1919). Die Gipfelflur der Alpen. Sitz.Ber.Pr.Akad.Wiss.XVIII. p.256.PRIEM, H.N.A., N.A.1.M.BOELR1JK, E.H.HEBEDA, E.A.T.VERDURMEN & R.H.VERSCHURE. Isotopic
ages of the trans-Amazonian acidic magmatism and the Nickeric metamorphic episode in thePrccambrian basement of Suriname, South America. Bull.Geol.Soc.Am.82. p.1667 - 1680.
PUTZER, H., (1968). Ueberblick über die geologische Entwicklung Südamerikas. In: E.J.FITTKAU et al. (Ed.)Biogeography and ecology in South America, Vol.I. p.l - 24. The Hague.
RIEZEBOS, H.T., (1974). Vcrweringskommen in graniet. Sipaliwini-savanne, Zuid Suriname. Berichten Fys.Geogr.Afd. no.8.
RIEZEBOS, H.T. & J.P.HERWEIJER, Morphometrical properties of Sipaliwini Landscapes, (in prep.).RIVIERE, P., (1969). Marriage among the Trio, Clarendon, Oxford.ROELEVELD, W., (1969). Pollen analysis of two sections in the Young Coastal Plain of Surinam. Geol. en
Mijnbouw 48. p.215 - 224.ROUGERIE, G., (1956). Etudes des modes d'érosion et du façonnement des versants en Côte d'Ivoire
equatoriale. Slopes Comm.Rep.I, p.136 - 141.RUXTON, B.P., (1967). Slopewash under primary rainforest in northern Papua. In: JENNINGS J.M. & J.A.
MABUTT. Landform studies from Australia and New Guinea. Cambridge Univ.Pres.RUXTON, B.P. & L.BERRY, (1961). Weathering profiles and geomorphic position on granite in two tropical
regions. Rev.Géomorph.Dyrî.12. p.16 - 31.SAKAMOTO, T., (1960). Rock weathering on 'terras firmes' and deposition on 'varzeas' in the Amazon. J.Fac.
Sc.Univ.Tokyo, Sec.II 12 (2), p.155 - 216, quoted by SOMBROEK 1966.SARMIENTO, G. & M.MONASTERIO, (1975). A critical consideration of the environmental conditions
associated with the occurrence of savanna ecosystems in tropical America. In: F.B.GOLLEY &E.MEDINA (Eds). Tropical ecological systems. Ecological Studies Vol. 11, pp.223 - 250. SpringerVerlag.
SCHIMPER, A.F.W., (1903). Plant geography upon a physiological basis. Oxford.SCHMIDT, L., (1942). Verslag van drie Reizen naar de Bovenlandsche Indianen. Dep.Landbouwproefstation,
Suriname. Bull.58, p.l - 63.SCHOLTEN, J.J., (1971). In: FAO-UNESCO. Soil map of the World. Vol.IV, South America. Paris. Unesco
pp.193.SCHUMM, S.A., (1956). Evolution of drainage systems and slopes in badlands at Perth Amboy New Yersey.
BuU.Geol.Soc.Am.67. p.597 - 646.SCHUMM, S.A., (1964). Seasonal variations of erosion rates and processes on hillslopes in western Colorado.
Slopes Comm.Rep.4. p.215 - 238.SCHWERTMANN, U. & R.M.TAYLOR, (1977). Iron oxides. In: J.B.DIXON et al. (Eds). Minerals in Soil
Environments, SSSA, Madison USA, p.145 - 180.SEYHAN, E., (1976). Calculation of Runoff from Basin Physiography (CRBP). Thesis, Utrecht..SHRODER, J.F., (1976). Mass movement on Nyika Plateau, Malawi. Z.Geomorph. NF.20. p.56 - 77.SNOW, J.W., (1976). The Climate of Northern South America. (In: SCHERDTFEGER (Ed.): Climates of
Central and South America). Elsevier Amsterdam-New York.SOMBROEK, W.G., (1966). Amazon Soils. Thesis, Wageningen.THOMAS, M.F., (1965). Some aspects of the geomorphology of tors and domes in Nigeria. Z.Geomorph.NF.9.
p.63-81.THOMAS, M.F., (1966). Some geomorphological implications of deep weathering patterns in crystalline
rocks in Nigeria. Trans.Inst.Br.Geogr.40. p.173 - 193.THOMAS, M., (1974). Tropical Geomorphology. MacMillan Press, London, pp.332.TRICART, J., (1965). Le modelé des régions chaudes. Forêts et Savanes. Traité de Géomorphologie V. SEDES,
Paris, pp.322.TROLL, C-, (1956). Das Wasser als pflanzengeographischer Faktor. In: Handbuch der Pflanzenphysiologie Bd.3
p.750 - 786. Ruhland, Berlin.UNESCO/FAO, (1963). Bioclimatic map of the mediterranean zone. Explanatory notes. Arid Zone Res.XXI,
122
pp.58.U.S.D.A., (1975). Soil Taxonomy. Agricultural Handbook no.436. Soil Survey Staff U.S.Department of
Agriculture, pp.754.VAN ASCH, Th.W.J., (1979). Surface wash and mass movement in a mediterranean landscape. Thesis, Utrecht
(in prep.).VAN BOECKEL, J., (1968). Gravitational and geomagnetic investigations in Surinam and their structural
implications. Thesis, Amsterdam, pp.287.VAN DER HAMMEN, T., (1963). A palynological study on the Quaternary of British Guiana. Leidse Geol.
Med. V.29. p.125-180.VAN DER HAMMEN, T. & T.A.WIJMSTRA, (1964). A palynological study on the Tertiary and Upper
Cretaceous of British Guiana. Leidse Geol.Med.V.30. 1964. p.183 - 241.VAN DER L1NGEN, G.J., (1964). Geological Map of the Sipaliwini Region, S.Surinam. Not published.
Geol. and Mining Serv. Surinam.VAN DONSELAAR, J., (1965). An ecological and phytogeographic study of northern Surinam savannas.
Wentia 14. p.l - 164.VAN DONSELAAR, J., (1968). Phytogeographic notes on the savanna flora of southern Surinam (S.America).
Acta Bot.Neerl.17,5. p.393 - 404.VAN DONSELAAR, J. (1969). Observations on Savanna Vegetation-types in the Guianas. Vegetatio 17.
p.271-312.VAN LYNDEN, A.J.H., (1939). Op zoek naar Suriname's Zuidgrens. Tijdschr.Kon.Ned.Aardr.Gen.56.6.
p . l -90.VAN SCHERPENZEEL, C.W., (1977). In: C.F.A.BRUUNING & J.VOORHOEVE (Ed.). Encyclopédie van
Suriname. Amsterdam - Elsevier, pp.716.VAN STEUN, H., (1974). Geomorphological Questions about the Northern Cantal-Artense Region (France).
Thesis, Utrecht, pp.161.VARGAS, L.F.C., (1958). Contribution to the study and correlation of Tertiary and Pleistocene terraces and
planation surfaces in the Lower and Middle Amazon, the Estuarine Delta and the estuaries of thetributaries of the Guajara bay, in the Amazon Region. Mim.Rep.FAO/SPVEA Mission Belém,Brasil. Quoted by SOMBROEK 1966.
WAIBEL, L., (1948). Vegetation and land use in the Planalto Central of Brazil. Geog.Rev.38. p.529 - 554.WALTER, H., (1971). Ecology of Tropical and Subtropical Vegetation Oliver & Boyd, Edinburgh.WAYLAND, E.J., (1933). Peneplains and some erosional platforms. Geol.Survey Dept.Uganda. Ann.Rep.and
Bull.Notes 1, 74.WILHELMY, H., (1952). Die eiszeitliche und nacheiszeitliche Verschiebung der Klima- und Vegetationszonen
in Südamerika. Tag.Ber.Wiss.Abh.Dt.Geogr.Tage 1951. p.121 - 128.WIJMSTRA, T.A., (1969). Palynology of the Alliance well. Geol. & Mijnbouw 48. p.125 - 133.YOUNG, A., (1972). Slopes. Oliver & Boyd, Edinburgh, pp.288.YOUNG, A., (1976). Tropical soils and soil survey. Cambridge Univ-Press Cambridge, pp.468ZONNEVELD, I.S., (1972). Land evaluation and landscape science. I.T.C.textbook of photo-interpretation
Vol.VIICh.4. I.T.C.Enschede, The Netherlands, pp.106.ZONNEVELD, J.I.S., (1967). Enkele luchtfotos van de Sipaliwini-Savanne in Zuid Suriname. K.N.A.G.
Geografisch Tijdschrift I. no.4.ZONNEVELD, J.I.S., (1969). Preliminary remarks on summit levels and the evolution of the relief in Surinam.
Proc.7th.Guiana Geol.Conf.1966. Paramaribo. Verh.Kon.Ned.Geol.Mijnb.Gen.27. p.53 - 59.ZONNEVELD, J.I.S., Geomorfologische analyse van Surinaamse topografische kaarten. Berichten Fys.Geogr.
Afd. (in prep.).
123
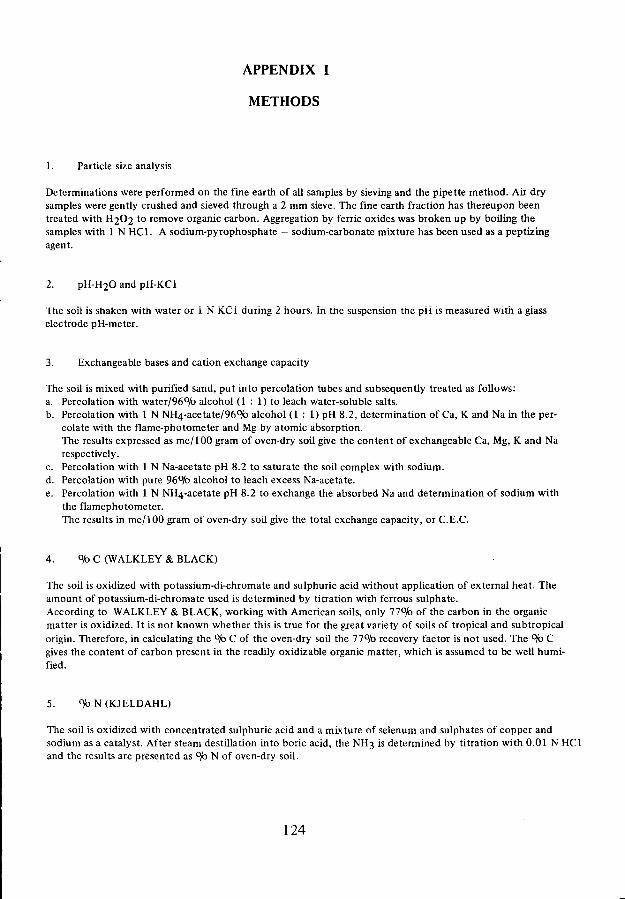
APPENDIX I
METHODS
1. Particle size analysis
Determinations were performed on the fine earth of all samples by sieving and the pipette method. Air drysamples were gently crushed and sieved through a 2 mm sieve. The fine earth fraction has thereupon beentreated with H2O2 to remove organic carbon. Aggregation by ferric oxides was broken up by boiling thesamples with 1 N HC1. A sodium-pyrophosphate - sodium-carbonate mixture has been used as a peptizingagent.
2. pH-H2O and pH-KCl
The soil is shaken with water or 1 N KC1 during 2 hours. In the suspension the pH is measured with a glasselectrode pH-meter.
3. Exchangeable bases and cation exchange capacity
The soil is mixed with purified sand, put into percolation tubes and subsequently treated as follows:a. Percolation with water/96°A) alcohol (1 : 1) to leach water-soluble salts.b. Percolation with 1 N NH4-acetate/96°/b alcohol (1 : 1) pH 8.2, determination of Ca, K and Na in the per-
colate with the flame-photometer and Mg by atomic absorption.The results expressed as me/100 gram of oven-dry soil give the content of exchangeable Ca, Mg, K and Narespectively.
c. Percolation with 1 N Na-acetate pH 8.2 to saturate the soil complex with sodium.d. Percolation with pure 96°A> alcohol to leach excess Na-acetate.e. Percolation with 1 N NH4-acetate pH 8.2 to exchange the absorbed Na and determination of sodium with
the flamephotometer.The results in me/100 gram of oven-dry soil give the total exchange capacity, or C.E.C.
4. %> C (WALKLEY & BLACK)
The soil is oxidized with potassium-di-chromate and sulphuric acid without application of external heat. Theamount of potassium-di-chromate used is determined by titration with ferrous sulphate.According to WALKLEY & BLACK, working with American soils, only 77°/fa of the carbon in the organicmatter is oxidized. It is not known whether this is true for the great variety of soils of tropical and subtropicalorigin. Therefore, in calculating the °/o C of the oven-dry soil the 77°A> recovery factor is not used. The °/o Cgives the content of carbon present in the readily oxidizable organic matter, which is assumed to be well humi-fied.
5. °/bN(KJELDAHL)
The soil is oxidized with concentrated sulphuric acid and a mixture of selenum and sulphates of copper andsodium as a catalyst. After steam destination into boric acid, the NH3 is determined by titration with 0.01 N HC1and the results arc presented as °/o N of oven-dry soil.
124

6. P-Truog
The soil is shaken during 30 minutes (soil/solution ratio 1 : 200) with 0,002 N sulphuric acid solutionbuffered at pH 3 with ammoniumsulphate. In the extracts phosphate is determined with the colorimetricmolybdenumblue/stannochloride method. Conventionally the results are presented as mg P2C<5/kg ofoven-dry soil.
7. Nutrients; cold 25°jo HC1 extraction
The soil is shaken during 6 hours with cold 25°jo HC1 (1 : 2,5 ratio). After destruction of organic matterand separation of silica and sesquioxides, Ca and Mg are determined complexometrically or by atomicabsorption. P with the molybdenumblue/methol method, Mn and Al with the colorimetric method andNa and K with the flamephotometer. Ferric Fe was determined gravimetrically.
8. Elemental analysis
The concentration of nine elements was determined with X-ray spectrometic analyses by means of a Philips1410 X-ray spectrometer with chrome tube. The results were recorded on paper tapes for computer analysesby means of a Tape Punch Control (PW 4206/01).To prepare the sample for analysis 4-6 g of the air dry sample was heated at 900°C for two hours and the losson ignition calculated. From this sample 400 mg was taken to which was added LiOH and B2O3. The fusionreaction was made at 1300°C in a furnace in which the crucible made of platinum +3°A> gold was placed.The thus homogenized soil material was retrieved as a solid button on cooling. The sample flux ratio is 1 : 10.The experimental conditions are summarized below.
element 20 position crystal collimator pre-set time (seconds)
Na backgroundNa peakMg backgroundMg peakP backgroundPpeakSi peakAlpeakK peakCa peakTi peakFe peak
54.0053.1044.5043.5090.5089.30
108.95144.75136.70113.15
86.1857.52
KAPKAPKAPKAPPEPEPEPELIFLIFLIFLIF
coarsecoarsecoarsecoarsecoarsecoarsecoarsecoarsefinefinefinefine
202020201010101010101010
The complete procedure to obtain the concentrations of the various elements by means of a computer programwas developed at the Soil Science Institute, Utrecht.
9. Clay mineralogy
Material from the not pre-treated clay fraction was dried either in a stove at 40°C or freezedried, and if necces-sary, ground. Random powder specimen of all samples were analysed using Philips X-ray diffraction equipmentconsisting of: a generator control cabinet (PW 1320/00), a stabilized generator (PW 1310/00) with wide rangegoniometer (PW 1050/25), a basic recording unit (PW 1352/10) with sealer-time combination (PW 1353/100)and a pulse height analyses combination (PW 1355/10).
125

The experimental conditions to obtain the pen-recorded X-ray diffractograms are:
raditionHigh voltagecurrentfilterdivergence slitreceiving slitscatter slitdetectorscanning speedfull scaletime constantsample holders
CoKCL35 kV30 mAFe1°0.3 mm1°proportional detector probe1° (20) per minute400 counts per second2 secondsflat aluminium holder or glass slides
126
APPENDIX II
SOIL DESCRIPTIONS AND ANALYTICAL DATA
The following descriptions, generally in accordance with FAO (1966), and analytical data of soil profiles aregrouped per landscape (Morro Grande Landscape, Sipaliwini Landscape and Valley Floor Landscape, respect-ively). General information on the different sample sites is given in tabels
The field observations are supplemented with some results of laboratory analysis (particle size distribution, pH).Colour indications are for moist conditions, unless otherwise indicated.
The succession of profile field characteristics, described on the following pages is: horizon symbol; depth;colour; texture; size and colour of mottling; structure (grade, class and type); consistence; ped surface; pores;rock fragments; roots; boundary. Whenever a characteristic is absent, it is not indicated, except in cases wherethe absence forms a contrast with the superimposed horizon.
It is noted that CEC has been determined at pH 8.2 (see Appendix I), giving rise to values which are higher thanwith determinations at pH 7.0. For this reason CEC-values of the clay may seem too high in cases where anoxic horizon was identified, such as in profile 9.
In the tables with the analytical data the depth of the horizon is indicated by the depth of its lower boundary.
Under the mineralogy of the clay and silt fractions the number of X's is an indication for the relative intensityof reflections in the diffractometer pattern.
For general information on the profile sites, the reader is referred to tables 4.1.2, 4.1.3 and 4.1.4.
127

Description of profile 9
Classification : typic haplorthox
Al 0—20 cm 7.5YR5/4 (dry) clay loam: strong, fine subangular blocky:dry, slightly hard: shiny ped surfaces: fine pores, common:30% quartz gravel, 2—30 mm 0, angular: fine roots,frequent: clear, smooth boundary: pH 5.3
A2 20—44 2.5YR5/6 (dry) silty clay: weak, fine subangular blocky:dry, slightly hard: shiny ped surfaces: 10% quartz gravel,as above: few, fine roots: diffuse, smooth boundary:pH5.3
B2 44-200 2.5YR3/6 (dry) silty clay: weak, medium subangularblocky: dry, very hard: shiny ped surfaces: very few, finepores: weathered parent material up to 10 cm 0 : pH 5.6 :From the horizon two samples were taken: one at 60 cmand one at 110 cm depth.
128

PROFILE MO. = 9
PARTICLE SIZE DISTRIBUTION ( IN MICRONS»IN PCT BY HEIGHT PM
SAMPLE GRAVEL SANO SUT CLATNO. DEPTH > znn 2000 500 200 100 SO 20 *2O <CL
IN Cd -500 -200 -100 -50 -20 -2 <2
155 20 15.S 17 * <• 5 29 7 35 f.3 1..9156 «.<» 1 . 1 <» 3 3 * 1 9 22 -5 5.3 5.215? SO .6 6 3 <» 6 1 8 ?<• 39 F.6 5.6158 200 .2 k 3 <t 7 23 26 32 Ç.7 5.'
SAMPLENO. EXCHANGEABLE CATIONS I N MCQ/1O0GR BASE ORGANIC HATTER P2O5
CA KG K NA SUM CEC S A T . ( P C T ) C H C/N HG/KG
155 1.02 .51. .10 .001 1.7 12.1. 13.1. 1.35 .10 13.50 5156 1.01 . 2 6 .05 . 001 1.3 a.w 1 5 . « . 75 . 0 5 I F . 0 0 3157 .56 .57 .05 .001 1.2 6.9 1".2 .17 .03 5.67 3158 . S I . 5 7 . 00 . 0 0 1 1.1. T.I 1 9 . 5 J . 0 0 ' . 0 1 O.0J 3
ELEMENTAL COMPOSITION OF THE FINE EARM (PCT 3Y HEIGHT)SAMPLE LOSS ONNO. SIO2 AL2O3 FE2O3 TIO2 CAO NGO K?O NA2O P205 IGNITION (PCT>
155 6*.79 21.60 10.72 1.20 .2 .» .0 .63 .OS 11.79156 6*.? 8 26.61 6.31 1.1(3 . 1 .5 .0 C.30 .0 t 12.33157 62.t<» 27.93 7.17 1.35 .1 .5 .1 .21 .06 12.<>2156 61.S3 29.59 5.62 1.27 .1 .<• .1 1.03 .OF 12.06
ELEMENTAL COMPOSITION OF CLSY FRACTION f PCT BT HEIGHT)SAMPLE LOSS ONNO. SIO2 AL2O3 FE2O3 TIO2 CAO Mr.O <?<1 N»2O P2O5 IGNITION (PCT)
155 <(9.tS ".1.55 %.81 1.S1 .1 0.0 .0 1.51. .59 16.21156 51.13 * 1 . »3 3.09 1.77 . 1 0.0 .0 1.1.1 ,6b 16.*>i.157 52.36 1.1.85 2.17 1.71 .1 .k .1 .87 .1.3 16.4.9158 53.08 1.1.36 1.79 1.71 .1 .2 .1 1.0<> .60 16.1.0
NUTRIENTS(25 PCT COLO HCL-CXTPACTION)SAMPLENO. CAO MGO K2O NA20 FE2O3 1L2OJ nHO P2O5
PPM PPM PPN PPM PCT PCT PPM PPM
155 210. 720. 70. 70. 8.7» 1.77 1610. 100.156 110. 300. 30. 70. 8.21 1.72 3<>0. 70 .157 • • • • • • • • • » • • • • • • • • • • • • • . . . . .15S »«•«« . . . . . . . . . . . . . . . . . . . . . . . . . . . . . . . . . . .
MOLAR RATIOS (FINE EARTH) MOLAR RATIOS (CLAY)SAMPLENO. SIO2/ SIO2/ AL203/ SIO2/ SIO?/ SIO2/ AL2O3/ SIO2/
AL2O3 FE2O3 FE2O3 R203 «L2O3 FE2O3 FE2O3 RZ03
155 1.8 2.3 1.3 l.C .7 3.8 5.4 .6156 1.» 3.5 2.5 1.0 .7 6.2 8.6 .6157 1.3 3.2 2.1. .9 .7 9.0 12.3 .715S 1.2 4.1 3.1. .9 .8 11.1 Ik.7 .7
MINERALOGY OF <50 MU I HINER4LOSY OF < 2 NUSAMPLE INO. K I CHL GOE GIB F O I K I CHI GOE GIB F Q
155 T XX I I I I X T X I XXX T JUi._l X I I I I X I I156 I XX I I I I L I XXXI~XX I~ I I I I I I157 I XX I I I i I I XXXI XX I I I I T I T15S I XXXI I I 1 I X I XXXI XX.X I I t t T L I
129

Description of profile 41
Classification : typic haplorthox
Al 0-20 cm 7.5YR5/6(dry) clay with few, fine mottling (2.5YR5/8,dry): weak, medium to coarse subangular blocky: dry,soft: very few, very fine pores: very few, fine roots: apartfrom quartz gravel, within the horizon perdigon is present,indicating the former occurrence of a latérite cap: abrupt,broken boundary: pH 3.9
B12 20-50 2.5YR5/8(dry) clay with fine mottling, common (7.5YR7/8, dry): weak, medium to coarse subangular blocky: drysoft: shiny ped surfaces, very few, very fine pores: veryfew fine roots: quartz gravel common as above, but perdi-gon is absent: clear, smooth boundary: pH 4.3
B21 50-74 2.5YR5/8 (dry) clay with fine mottling abundant (7.5YR7/8, dry); very weak, coarse subangular blocky: dry,slightly hard: very few fine pores: roots absent: quartzgravel up to 3 mm common, perdigon (15 mm) few: clearsmooth boundary: pH 4.7
B22 74-120 2.5YR5/8 (dry) clay with medium mottling, common(7.5YR8/8 and 7.5YR8/1, dry) weak, coarse subangularblocky; dry, slightly hard: very few fine poresquartz gravelcommon, perdigon few: clear, smooth boundary: pH 4.8
B23 120-250+ 2.5YR4/6 (dry) clay loam without mottling: weak, coarsesubangular blocky, dry, slightly hard: shiny ped surfaces:few, medium pores: no quartz, no perdigon: pH 4.6
130
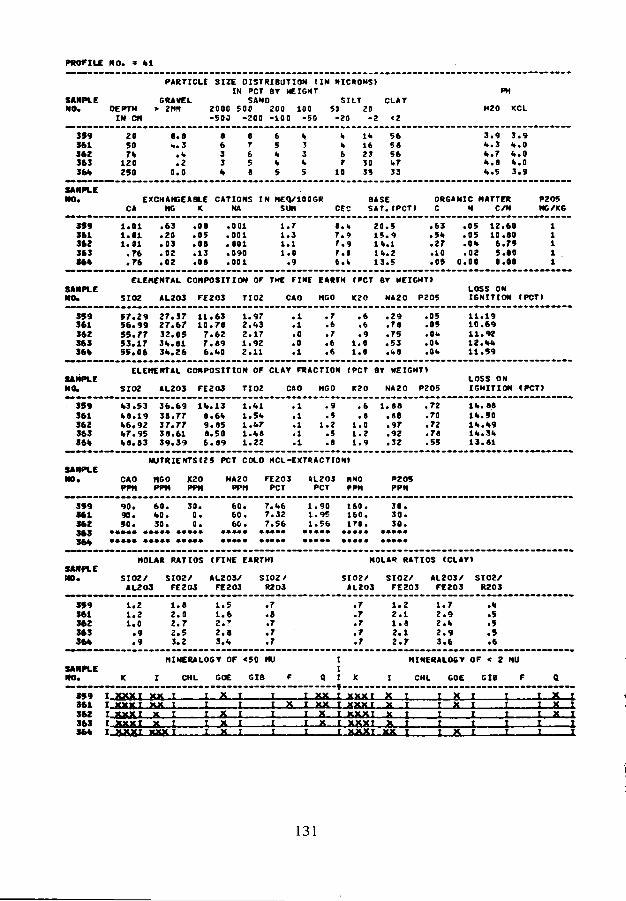
PROFILE NO. 3 %i
PARTICLE SIZE DISTRIBUTION (IN NICHONS)IN PCT BY HEIGHT
SAMPLE GRAVEL SAND SILT CLAYNO. DEPTH > Znn 2000 500 200 100 58 20
IN CM -500 -200 -100 -50 -20 -2 <2
PH
H20 KCL
359361362363
SAMPLENO.
359361362363
20507«.120250
a. sH.Z.1..2
0.0
k Ikk 166 23r 30
10 35
565856k733
3.9 3.9<>.3 b.Ok.7 fc.O*.a 4.0I».S 3.9
EXCHANGEABLE CATIONS IN HE4/100GRCA MG K NA SUM CEC
BASESAT.»PCT»
ORGANIC HATTERC N C/N
P2O5HG/KG
1.01 . 6 3 . 08 .001 1 .71 .11 . 20 . 0 5 . 001 1.31.S1 . 0 3 . 0 8 . 0 0 1 1.1
. 7 6 . 0 2 .13 .090 1 .0
. 7 6 .02 .08 .001 .9
«.7.
r.T.6.
it0
99k
20.15.1*.14.13.
54125
.63
.5*
.27
.10
.05
.05
.05
.0«.
.020.00
12106St
.60
.80
.7*
.10
.00
11111
ELENENTAL COMPOSITION OF THe FINE EARTH (PCT BY HEIGHT)
SIO2 AL2O3 FE2O3 TIO2 CAO ttGO K2O NA20 P2O5LOSS ONIGNITION (PCT)
57.2956.9955.7753.1755.06
27.3727.6732.053«.. 813*.Z6
11.6310.78
7.627.896.1.0
1.972.1.32.171.922.11
. 1
.1
.0
.0
.1
.7.6.7.6.6
.29
.7a
.75
.53
.1.8
.05
.05
.0«.
.0U
.Ok
111«111211
.19
.69
.92
.«.«.
.59
SAMPLENO.
ELEHENTAL COMPOSITION OF CLAY FRACTION (PCT BY HEIGHT!
SIO2 ALZO3 FE2O3 TIO2 CAO NGO K2O NA20 P2O5LOSS ONIGNITION (PCT)
35936136236336k
SAMPLE
1.3.53<>a.i91.6.921.7.95*8.83
36.6938.7737.7738.6139.39
IW.13a . 6 %9.85a.so6.89
1.1.11.51.
1.4«1.22
. 6 1 .8»
. 8 .801.0 .971.2 .921 . 9 . 3 2
.72.70.72.78.55
II». 88lfc.50I* . 49H..3I.13.81
NUTRIENTS(25 PCT COLD HCL-EXTRACTION!
CAOPPM
NGO K2O NA2OPPH
FE2O3PCT
AL2O3 NNOPCT PPH
P205PPH
9 0 .90.5 0 .
60.t o .30.
30.0.0.
60.60.60.
7.1.67.327.56
1.901.951 . 5 6
160 .160.170.
3 0 .3 0 .3 0 .
SAMPLE
35936136236336*
SAMPLENO.
MOLAR RATIOS (FINE EARTH) MOLAR RATIOS (CLAY!
SIO2/AL2O3
SIO2/ AL203/FE2O3 FE2O3
S102/R2O3
1.21.21.0
.9
.9
l . a2.02.72.53.2
1.51.62.72.83.1.
.7
.8.7.7.7
SIO2/AL2O3
.7
.7
.7
.7
.7
SIO2/FE2O3
1.22.11.82.12.7
AL2O3/FE203
1.72.92.1.2.93.6
SIO2/R2O3
• <t.5.5.5.6
MINERALOGY OF <50 MU
I CHL GOC GIB F
159 I XXXI XX361 I xxx T xx362 I xxx T x36336«
MINERALOGY OF < 2 NU
CHL GOE GIB F
I X
T XXX TMil.I XXXt XXX I JOL.
131
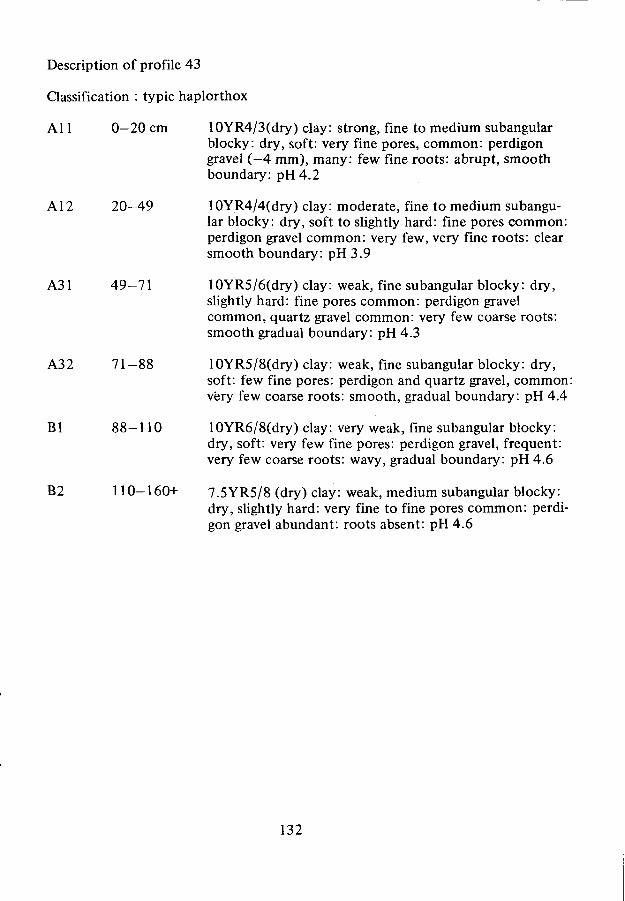
Description of profile 43
Classification : typic haplorthox
Al 1 0—20 cm 10YR4/3(dry) clay: strong, fine to medium subangularblocky: dry, soft: very fine pores, common: perdigongravel (—4 mm), many: few fine roots: abrupt, smoothboundary: pH 4.2
Al 2 20—49 10YR4/4(dry) clay: moderate, fine to medium subangu-lar blocky: dry, soft to slightly hard: fine pores common:perdigon gravel common: very few, very fine roots: clearsmooth boundary: pH 3.9
A31 49-71 10YR5/6(dry) clay: weak, fine subangular blocky: dry,slightly hard: fine pores common: perdigon gravelcommon, quartz gravel common: very few coarse roots:smooth gradual boundary: pH 4.3
A32 71-88 10YR5/8(dry) clay: weak, fine subangular blocky: dry,soft: few fine pores: perdigon and quartz gravel, common:very few coarse roots: smooth, gradual boundary: pH 4.4
Bl 88-110 10YR6/8(dry) clay: very weak, fine subangular blocky:dry, soft: very few fine pores: perdigon gravel, frequent:very few coarse roots: wavy, gradual boundary: pH 4.6
B2 110-160+ 7.5YR5/8 (dry) clay: weak, medium subangular blocky:dry, slightly hard: very fine to fine pores common: perdi-gon gravel abundant: roots absent: pH 4.6
132
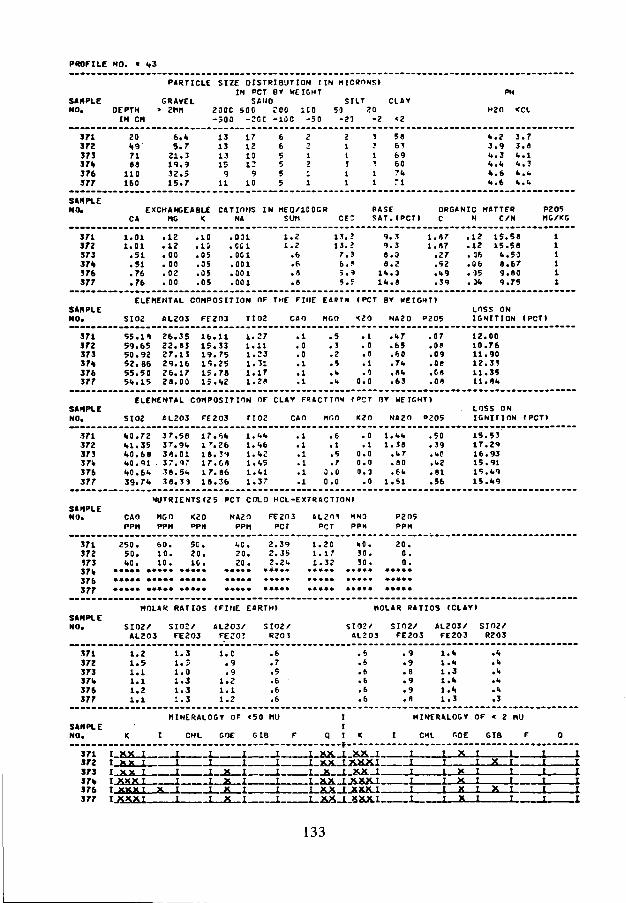
PROFILE NO. k3
P A R T I C L E S I Z E D I S T R I B U T I O N ( I N B I C R f l N S »IN PCT BY HEIGHT P»
SAMPLE GRAVEL SANO SILT CLATNO. DEPTH > 2WM 200C 50C TOO 1E0 53 30 H2O <CL
IN CM - 3 0 0 -20C - 1 0 0 -50 -23 -2 <2
37t37237337*376377
20<t97188
1 1 0160
6.'t5.7
21.319.332.515.7
13131315
911
17121012
910
5 8
11J11
1*11
b !6 9607fcM
«t.?3.9•t.3U.I,lt.6<4 .6
3.73.9U.Ik.3k.kit.it
SIMPLENO. EXCHANGEABLE CATIONS I N
CA MG < NA SUM C E :RASESAT. IPCTI
ORGANIC HATTFRC N C/N
P2OSMG/KG
37137237337»376377
11
. 0 1
. 0 1
. 5 1
. 5 1• 76. 7 6
. 1 2. 1 2. 0 0. 0 0. 0 2. 0 0
. 1 0
.10.05.05. 0 5. 0 5
. 031
.CCI
. 0 0 1.001.001.001
1.21.2
.6
.6
. 8
.8
1 3 .1 3 .
7 .6 .5 .5 .
220•9C
9 .9 .8 .8 .
I k .I k .
333238
11
. 8 7
. 8 7. 2 7. 5 2. k 9. 3 9
. 1 2
. 1 2. 36. 0 6. 3 5. Jk
1 51 5
k899
. 5 8. 5 8. 5 0. 6 7. 8 0.75
SAMPLENO.
ELEMENTAL COMPOSITION OF THE FINE EARTH (PCT BY WEIGHT!
SIO2 AL2O3 FE2D3 TIO2 CAO MGO <2O NA2O P20SLOSS ONIGNITION (PCT)
37137237337»376377
55.1»59.6550.9252.8655.5 05k.15
26.3522.8327.1329.1626.1728.00
1 6 .1 5 .1 9 .1 5 .1 5 .1 5 .
1 133752578i«2
1 .1 .1 .1 .1 .1 .
271 12 311172«
. 1
. 0.0. 1. 1. 1
. 5
. 5. 2. 5. I t. I t
. 1
. 0. 0. 1. 0
0 . 0
.1.7
. 6 5. 6 0.71..Kit. 6 3
. 0 7
. 0 8
. 0 9
. 0 8
. 0 8
. 0 8
121011121 111
. 0 0
. 7 6
. 9 0
. 3 3
. 3 5
.Hk
SAMPLENO.
ELEMENTAL COMPOSITION OF CLAV F<!«CTrn>l (»CT O» HEIGHT»
SIO2 «L2O3 FE2O3 TIO2 CAO HGO K2O NA2O »205LOSS ONIGNITION (PCT)
37137237337»376377
k0.72kl.35k0.68k0.91kO.6k
37.5837.9k30.0137.9738.5k
17.6k
18.5917.0817.86
l.kk1.1.61.1.2I.k5l .k l
39.7k 38.33 18.36 1.37
111111
00
. 6
. 1. 5. 7. 0.0
000
. 0
. 1. 0. 0. 3. 0
11
1
. k k
. 1 8. k 7. 8 0. 6 k. 5 1
. 5 0
. 3 9.kO• k2. 8 1. 5 6
15.5317.2916.9315.911 5 . fc91 5 . k9
NUTRIENTS(25 PCT COLO HCL-EXTRACTION)SAMPLENO. CAO MGO <2O NA2O FE2O3 «L2O3 UNO P2OS
PPM PPM »Pit PPM PCT PCT PPH PPM
371 250. 60. 50. i,C. 2.39 1.20 t0. 20.372 50. 10. 20. 20. 2.35 1.17 50. 0.373 kC. 10. IC. 20. 2.21 1.32 30. 0.37» •••»• •••• ••••• •*• • ••••• •••••376 ••••• ••••• »••.. ..... ..... ..... ..... .....
377 ..».» .«•»• ..... ..... ..... ..... ..... .....
MOLAR RATIOS (FIIIE EARTH) MOLAR RATIOS (CLAY)SAMPLENO. SIO2/ S i o r / AL2O3/ SIO2/ SIO2/ SIO2/ AL2O3/ SIO2/
AL2O3 FE2O3 FE20J R2OJ AL2O3 FE2O3 FE2O3 R?O3
37137Z37337»376377
1 .1 .1 .1 .1 .1 .
2
1121
1 .1 .1 .1 .1 .^ m
3
0333
1 .
.1 .1 .1 .
C99212
. 6
. 7
.5
. 6
. 6
. 6
l . kl . k1.3l . k1.1.1.3
.k,k.k.It
. k
. 3
SAMPLEN O .
MINERALOGY OF < 5 0 Ml)
I CHL C.OE G I B F
MINERALOGY OF < 2 n i l
CML GOE G I B F
3 7 1 I XX ISTZ I XX I I37337» I XXXI376 T XKXI X377
133
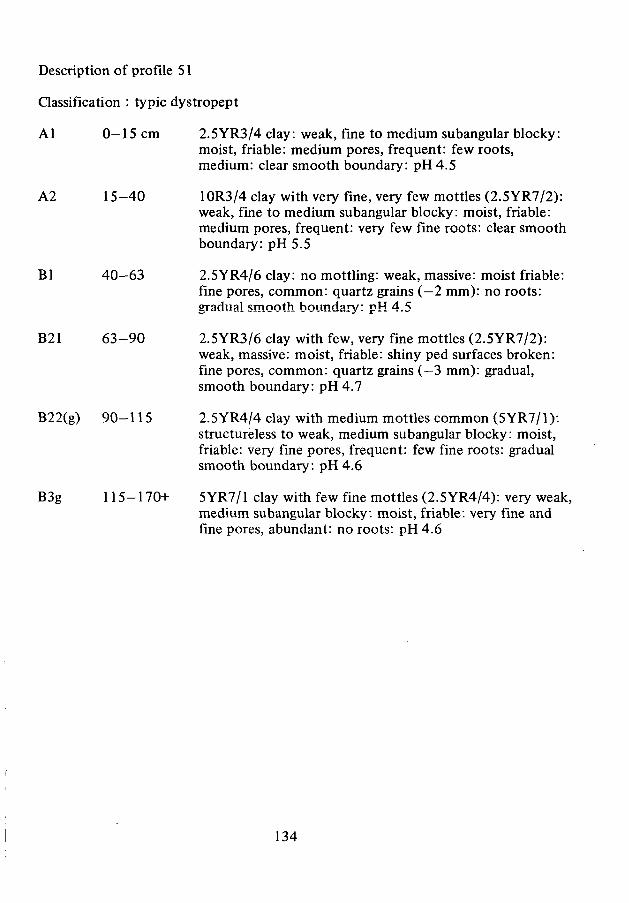
Description of profile 51
Classification : typic dystropept
Al 0—15 cm 2.5YR3/4 clay: weak, fine to medium subangular blocky:moist, friable: medium pores, frequent: few roots,medium: clear smooth boundary: pH 4.5
A2 15-40 10R3/4 clay with very fine, very few mottles (2.5YR7/2):weak, fine to medium subangular blocky: moist, friable:medium pores, frequent: very few fine roots: clear smoothboundary: pH 5.5
Bl 40—63 2.5YR4/6 clay: no mottling: weak, massive: moist friable:fine pores, common: quartz grains (—2 mm): no roots:gradual smooth boundary: pH 4.5
B21 63-90 2.5YR3/6 clay with few, very fine mottles (2.5YR7/2):weak, massive: moist, friable: shiny ped surfaces broken:fine pores, common: quartz grains (—3 mm): gradual,smooth boundary: pH 4.7
B22(g) 90-115 2.5YR4/4 clay with medium mottles common (5YR7/1):structureless to weak, medium subangular blocky: moist,friable: very fine pores, frequent: few fine roots: gradualsmooth boundary: pH 4.6
B3g 115-170+ 5YR7/1 clay with few fine mottles (2.5YR4/4): very weak,medium subangular blocky: moist, friable: very fine andfine pores, abundant: no roots: pH 4.6
134
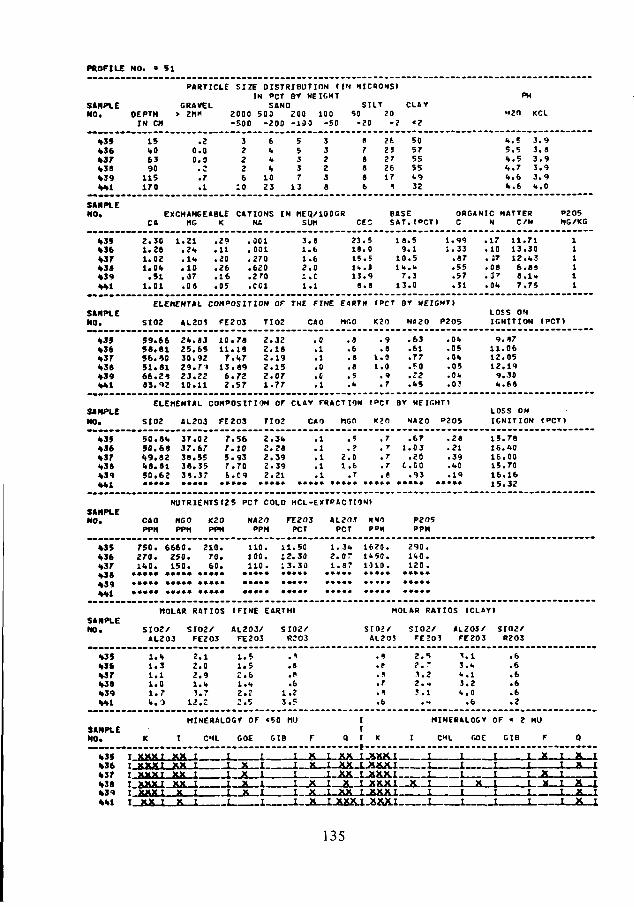
PROPILE NO. = 51
PARTICLE SIZE DISTRIBUTION (IN XICRONS)IN PCT BT HEIGHT
SAMPLE GRAVEL SANO SILT CLAYNO. DEPTH > 2HK 2000 503 200 100 50 20
IN CM -500 -200 -100 -50 -20 -2 <2
PM
H2O KCL
«3S1,36«37«58«39««1
151.06390115170
.20.00.0.:.7.1
1023
55337
13
2J272617
505755551.932
fc.55.5't.5<t.7I.. 6I».6
3.93.83.93.93.9
SAMPLENO. EXCHANGEABLE CATIONS IN MEQ/100GR
CA MG K Ht sunBASESAT.(PCT>
ORGANIC HATTERC N C/N
P2O5NG/KG
•»35«56«37«38«39««1
2 .1 .1.1 .
•1.
302»0201.5101
1.21.2".. l i .. 1 0. 0 7. 0 8
. 2 9. 1 1. 2 0. 2 6. 1 6.05
.001
. ooi
.270
.620
.270
.001
3112;1
. 8
. 6. 6. 0,C. 1
23.1 8 .1 5 .Ik.1 3 .
8 .
50599S
1 89
10l u
71 3
.5
. 1.5,u. 3. 0
1.991.33
. 8 7.55.57. 3 1
. 1 7
. 1 0. 37. 0 8
.i-'
.01.
11.7113.3012.1.36.838.1»7.75
111111
SAMPLENO.
ELEMENTAL COMPOSITION OF THE FINE EARTH «PCT 8» HEIGHT)
SIO2 AL201 FE203 TIO2 CAO HfiO KJO NA2O P205LOSS ONIGNITION (PCT)
«35«3»•37«36«39««1
5 9 .5 8 .5 6 .5 1 .6 6 .83.
66e i40812<l92
2lt.25 .30 .2 9 .2 3 .1 0 .
8 365927 12211
1 0 .1 1 .
7 .1 3 .
6 .2 .
7»18«78972S7
222221
. 3 2
. 1 8
. 1 9
. 1 5
. 0 7
. 7 7
. 0, 1. 1.0.0. 1
868851*
11
. 9. 8. 0. 0, 9, 7
. 6 3
.61
.77
.50
.22
.1.5
.0i<
.05
. 0".
.05
.0U
. 0 3
9 .1 1 .1 2 .12 .
9 .l t .
870 60519.106 «
SAMPLENO.
ELEMENTAL COMPOSITION OF CLAV FRACTION <PCT BT HEIGHT)
SIO2 AL203 FE2O3 TIO2 CAO UGO K2O NA2O P2O5LOSS ONIGNITION (PCT)
«35«36« 3 7«38«39««1
5 0 .50 .1.9.«8 .50 .
8«6«828162
37 .37 .38 .38 .3 8 .
0267553537
77576
. 5 6. 1 0. 9 3. 7 0. 0 9
2 .2 .2 .2 .2 .
2 83 93921
. 1
. 1
. 1
. 1
. 1
21
. 5
. ?.0.6.7
, 7, T
. 7
. 7
. 8
1
C
• 67. 0 3.20.CO. 9 3
. 2 8
. 2 1. 3 9. » 0. 1 9
1 5 .1 6 .1 6 .1 5 .1 6 .
1 5.
78<>000701 6
32
SAMPLENO. CAO
PPN
NUTRIENTS(25
HGO K2OPPM PPM
PCT COLO
NA2OPPN
HCL-EXTPSCTION)
FE2O3PCT
AL2OSPCT
UNOPPK
P2O5PPM
«35«36«37
750. 6660. 210.270. 250. 70.l«0. 150. 60.
110. 11.50 1 .3b 1620. 290 .100. 12 .30 2 . 0 7 1U50. 11.0.110 . 13 .33 1 .87 1 ) 1 0 . 1 2 0 .
SAMPLENO.
MOLAR RATIOS (FINE EARTH)
SIO2/ SIO2/ AL203/ S102/AL203 FE2O3 FE2O3 R2O3
MOLAR RATIOS (CLAY)
SIO2/FE 201
AL2O3/ SIO2/FE2O3 R2O3
«35«36«37«38«39««1
1.«1.31.11.01.7
2.12.02.9l . < t1.7
1.51.52.6l.H2.r
.61.23.5
2."5
3.22.-.J.l
u.l3.2•4.0
.6
.6
.6
.6
.6
.6
.2
SAMPLENO.
HINERALOGr OF <50 Ml)
I CHL GOE GIB F
MINERALOGY OF < 2 NU
CML GOE GIB F
«35«36«37
« 3 9««1
""xxxtT X X X IT X X X ^T X.XX IT XXX IT XX f
xx,X XXXXXXX
l . I_1
I[ I[ I[ I
XX.X.K
I
III
ITIIfI
x i xx r xxx i iX
XX 1X
XX LXXXI [XA I XXXI IX i x x x i . X. i
XXX, i xx> i i
I X
IJJIII
IIIIïI
xxX
IIIIIJ
xX
IJ11T
J
135

Description of profile 14
Classification : oxic dystropept
Al 0—10 cm 10YR4/1 (dry) sandy loam: weak, medium subangularblocky: dry, soft: fine pores, common: abrupt, smoothboundary: pH 4.8
A3 10—38 10YR4/3 (dry) sandy loam: weak, medium subangularblocky, dry, soft consistence: fine pores common: finequartz grains, common: fine roots, common: clearsmooth boundary: pH 4.9
Bl 38—73 10YR6/4 (dry) sandy loam: weak, subangular blocky,madium: dry, soft: fine pores, common: quartz grains asabove: very few, fine roots: clear, smooth boundary:pH 4.9
C 73—150 10YR7/8 sandy loam: structureless, single grains: moist,very friable: few, fine pores: fine quartz grains, common:pH5.1
136

PROFILE NO. = 1«.
PARTICLE SIZE DISTRIBUTION ( IN MISRONS»IN PCT BY HEIGHT
SAMPLE GRAVEL SANO SUT CL A INO. DEPTH > 2HM 2000 500 200 100 50 20
IN CM -500 -200 -100 -50 -20 -2 <2H2O KCL
i a i1 6 21 8 316%
103 87 3
1 5 0
1 . 0. 9.<>. 5
232 93 326
121 21 1
9
1 61 72020
171 51 211
1198
12
S5it5
1 51 31217
«..8 «..0<4.9 It. 2' t .9 <t.<t5 . 1 <t.b
SAMPLENO. EXCHANGEABLE CATIONS I N MEQ/100GR
CA HG K NA SUM CECBASESAT.(PCT!
ORGANIC MATTERC N C/N
P2O5HG/KG
18118218118%
.50
.50
.501 .01
. 1 0. 3 5. 0 5. 2 3
. 1 0
.05
.05. 0 5
. 0 0 1
. 0 0 1. 0 0 1. 0 0 1
. 7
. 9
. 61 . 3
tit
S2
. 6
. 8
. 5. 2
1 0 .1 8 .1 7 .5 8 .
7729
1.13. 6 6. 3 2. 1 1
. 0 7. 05. 0 3
0 . 0 0
161 310
0
. l i t. 2 0. 6 7. 0 0
1 1653
SAMPLENO.
ELEMENTAL COMPOSITION OF THE FINE EARTH (PCT BY HEIGHT)
SIO2 AL2O3 FE2O3 TIO2 C»O «GO K2O NA2O P2O5
LOSS ONIGNITION (PCT»
1 6 11 8 21 6 316%
8 8 .8 9 .9 0 .9 0 .
179 3756 7
9 .7.6 .7 .
I S0 73 112
. 5 6
.1.3
.1.7. 5 1
. 1 9. 1 6. l i t. 1 6
. 1
. 1
. 0
. 0
. 5
. 3
. 3
. 3
. 7
. 6
. 6
. 5
11
. 6 9
. 5 9
. 3 7
. 7 3
. 0 2
.0" .
.02
. 0 2
2322
. 9 6
. 1 7
. 0 6
. 7 1
SAMPLENO.
ELEMENTAL COMPOSITION OF CLAY FR4CTIOM (PCT BY WEIGHT)
SIO2 AL2O3 FE2O3 TIO2 CAO MG O K2O . NA2O P2O5LOSS ONIGNITION (PCT»
161 52.37 %3.73 2.21. .1.6 .1 0.0162 50.73 1.2.85 3.2% .%% . 1 . 3163 51.73 1.3.60 2.52 . <|6 .1 0.016% 51.82 1.3.91 2.01 .<t<t . 1 .2
. 3 . 3 5 .50
. 2 1.69 .42. 3 . 8 1 .1.6. 2 . 9 8 .35
15.9815.91.15.6%11.00
SAMPLENO. CAO
PPM
N U T R I E N T S ( 2 5 PCT COLD H C L - E X T R A C T I O N I
MG OPPM
K2O NA2OPPM
FE203PCT
AL2O3 MNOPCT PPH
P2O5PPM
161 5 0 . 5 0 . 6 0 . 1 0 . . 5 5162 60 . 3 0 . 3 0 . 10 . . 5 1183 9 0 . 2 0 . 2 0 . 1 0 . . 5 016% 5 0 . 2 0 . 2 0 . 10 . .53
.1.9 10. WO.
.1.9 2 0 . 0 ..1.7 1 0 . 0 ..1.2 1 0 . 0 .
SAMPLENO.
MOLAR
SIO2 /AL2O3
RATIOS
SIO2/FE2O3
(FINE
AL2O3/FE2O3
EARTH»
SI02/R2O3
MOLAR RATIOS (CLAVt
SIO2/ 5102 /AL2O3 FE2O3
AL2O3/FE2O3
SIO2/R203
16116 t16316%
5 .7 .8 .7 .
7SSS
S9.7 8 .7 2 .6 6 .
0%%T
1 0 .1 0 .
s.6 .
l .C69
5676
. 2
. 8
. 6
. 7
.7,r.7.7
8.85.97.79.7
12.ltS.I.
11.013.9
. 7
. 6
. 6
. 6
SAMPLENO.
MINERALOGY OF <50 MU
I CHL GOE GIB
MINERALOGY OF « 2 MIJ
CHL GOE GIB F
I XX T1S1182IA] I_XJ18% I_Ä/
1JULL I X t XX)JUULL.
î g î Ji&Ä-i.
I , x ii x i
J IQ II i X \
137

Description of profile 16
Classification :. typic paleudult
Al 0—15 cm 10YR6/2 (dry) sandy clay loam: structureless, granualar:dry, loose: very fine pores, frequent: coarse quartz gravel,abundant: all sizes of roots common: clear, wavy boundary:pH5.0
A2 15—35 7.5YR7/8 (dry) sandy clay loam: moderate, medium sub-angular blocky: dry, soft: fine pores, frequent: rock frag-ments as above: fine roots, common: clear, wavy boundary:pH5.1
Bl 35—57 7.5YR7/6 (dry) (sa) clay loam with few, coarse mottling(2.5YR4/6, dry): weak, medium subangular blocky: dry,slightly hard: fine pores, common: quartz gravel abundant:few, fine roots: clear, wavy boundary: pH 5.1
B21t 57-88 5YR6/6 (dry) clay loam with few fine mottles (2.5YR4/6dry): weak, medium subangular blocky:.dry, slightly hard:shiny ped surfaces: few fine pores: roots absent: quartzgravel common: clear, wavy boundary: pH 5.2
B22t 88—150 2.5YR4/6 (dry) loam: no mottling: weak, coarse subangu-lar blocky: dry, hard: shiny ped surfaces: very few, finepores: quartz gravel, few: pH 5.1
138
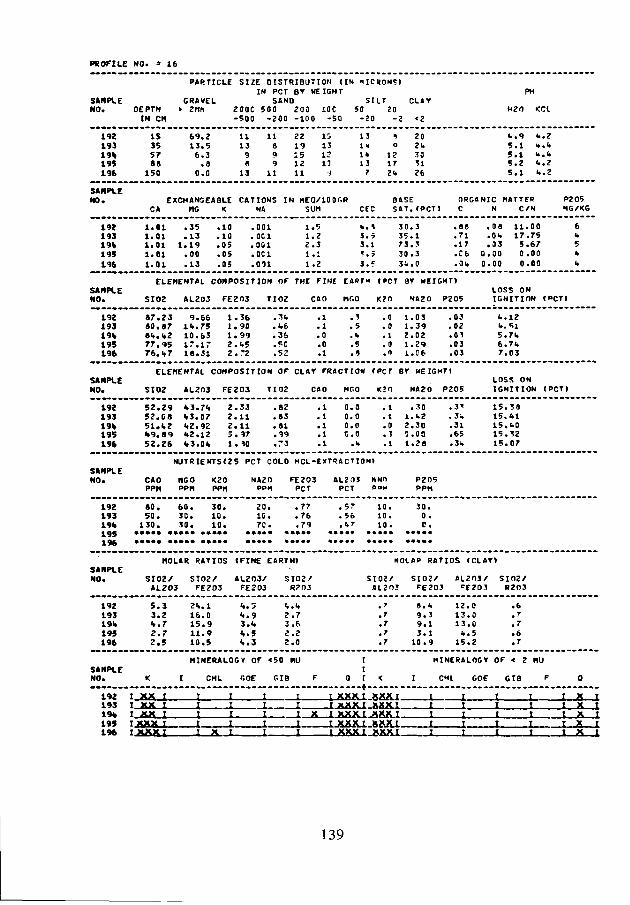
PROFILE NO. a 1 6
PARTICLE SIZE DISTRIBUTION ( IN MORONS!IN PCT BY HEIGHT
SAMPLE GRAVEL SANO SILT CLAYNO. DEPTH > Znti 200C 500 ZOO IOC 50 20
IN CM - 5 0 0 - 2 0 0 - 1 0 0 - 5 0 - 2 0 - 2 <2
PH
M2O KCL
1 9 21 9 31 9 *1 9 51 9 6
I S355 799
1 5 0
69.213.5
6 . 3. 3
0 . 0
111 3
9«
1 3
11
a99
11
221 915121 1
1513121 :
131«I k13
7
Q
12172k
202k30
26
k.9 k.25.1 k.k5.1 k.k5.2 k.25.1 k.2
SAMPLENO. EXCHANSEA8LE C A T I O N S I N MEQ/ IOOGR
CA MG K NA SUM CECBASESAT.(PCT)
ORGANIC MATTERC N C/N
P2O5NG/KG
192L93
1 9 51 9 6
1 .1 .1 .1 .1 .
0 10 101010 1
. 3 5. 1 3
1 .19. 0 0. 1 3
. 1 0. 1 0.05.05
.o;
.001. 0 0 1.001. o e i. 001
iï211
. 5
. 2. 3. 1. 2
k .3 .3 .? .3 .
I 3 0 .3 5 .7 3 .
; 3 0 .= 3 k .
31330
.se
. 7 1
. 1 7
.C6
.Ok00
. 0 8. O k. 3 3. 0 0. 0 0
1 117
500
. 0 0. 7 5. 6 7. 0 0. 0 0
6k
5k
k
SAMPLENO.
ELEMENTAL COHPOSITION OF THE FINE EART« (PCT BY HEIGHT»
SIO2 AL203 FE2O3 TIO2 CAO UGO K2O NA2O P205LOSS ONIGNITION (PCTI
19219319%195196
»7.2380.878 k. 1,277.9576.%7
9 .I k .1 0 .1 7 .1 8 .
6675631 731
11122
. 3 6
. 9 0
. 9 9.1.5.72
. I k
.1.6
. 3 6• FO. 5 2
. 1
. 1
. 0. 0. 1
. 1. 5. k. 5
. 0. 0. 1. 0. 0
1 .1 .2 .1 .1 .
0 33 9022 9
ce.
. 0 3
. 0 2. 0 1. 0 3. 0 3
k .k .
5 .6 .7 .
12«!l7k7k0 3
SAMPLENO.
ELEMENTAL COMPOSITION OF CLAY FRACTION (PCT BY HEIGHT!
SIO2 AL2O3 FE203 TIO2 CAO MCO K2O NA2O P2O5LOSS ONIGNITION (PCT)
1 9 21 9 319%1 9 51 9 6
52.2952.0851.k2%9. 8952.26
%3.k 3 .k 2 .k 2 .% 3 .
7%0 79212Ok
22251
.3.1. 1 1. 1 1. 9 7. 1 0
. 8 2. 8 3. 8 1. 9 9. 7 3
. 1. 1. 1. 1. 1
000t
. 3
. 0
. 0. 0. k
. 1
. 1
. 0
. 1
. 1
1201
. 3 0
.1.2
. 3 0
. 0 0
. 2 8
. 3 '
. 3 ». 3 1. 6 5. 3 *
1 5 .15.1 5 .15 .15 .
3 8k l
kO1207
SAMPLENO. CAO
PPM
NUTRIENTS(2S
HGO K20PPM PPM
PCT COLO
NA2OP O M
HCL-EJ
FE2O3PCT
(TRACTIO
AL2OSPCT
NI
UNIO O K
P2O5PPM
19219319%
so.5 0 .130 .
6 0 .3 0 .3 0 .
3 0 .1 0 .1 0 .
2 0 .I C .7 0 .
. 7 7
. 7 6. 7 9
. S 7
. 56• k7
1 0 .1 0 .1 0 .
3 0 .0 .G.
196
SAMPLENO.
MOLAR
SIO2/AL2O3
RATIOS
SIO2/FE2O3
«FINE
AL2O3/FE 2 03
EARTH!
SIO2/R2O3
«OLAP RATIOS (CLAYI
SIOJ/ SIO2/AL2O3 FE2O3
AL203/CE2O3
SIO2/R2O3
19219319%195196
5.3 .%.2 .2 .
32775
2k..1 6 .I S .1 1 .1 0 .
10945
i .•i
3%<t
. 3
. 9
.it
. 5
. 3
t,2322
. k. 7. 6. 2. 0
. f
. 7
. 7
.7
.7
8 .9 .9 .3 .
1 0 .
k3119
12131 3
k15
. 0
. 0
. 0
. 5
. 2
. 6,7
. 7
. 6
. 7
SAMPLENO.
MINERALOGY OF «50 MU
I CHL r.OE GIB F
II
Q I
MINERALOGY OF < 2
CHI GOF GIB
19219319V195196
I XX TT XX II XX I
I I 1I XXX I XXX.I
XX I XXX IIT XXX I XXX I
XT X X X I XXX I
IT
TXXX TT XXXI
T XXX I XXX. IXXX XXI XXX I XXX 1 T X
139
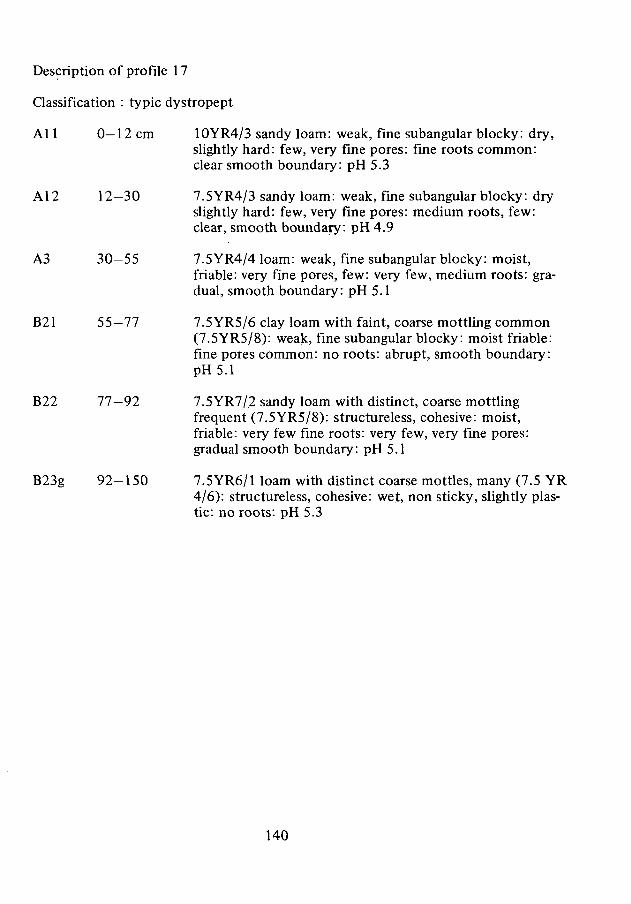
Description of profile 17
Classification : typic dystropept
Al 1 0—12 cm 10YR4/3 sandy loam: weak, fine subangular blocky: dry,slightly hard: few, very fine pores: fine roots common:clear smooth boundary: pH 5.3
A12 12—30 7.5YR4/3 sandy loam: weak, fine subangular blocky: dryslightly hard: few, very fine pores: medium roots, few:clear, smooth boundary: pH 4.9
A3 30—55 7.5YR4/4 loam: weak, fine subangular blocky: moist,friable: very fine pores, few: very few, medium roots: gra-dual, smooth boundary: pH 5.1
B21 55—77 7.5YR5/6 clay loam with faint, coarse mottling common(7.5YR5/8): weak, fine subangular blocky: moist friable:fine pores common: no roots: abrupt, smooth boundary:pHS.l
B22 77-92 7.5YR7/2 sandy loam with distinct, coarse mottlingfrequent (7.5YR5/8): structureless, cohesive: moist,friable: very few fine roots: very few, very fine pores:gradual smooth boundary: pH 5.1
B23g 92-150 7.5YR6/1 loam with distinct coarse mottles, many (7.5 YR4/6): structureless, cohesive: wet, non sticky, slightly plas-tic: no roots: pH 5.3
140
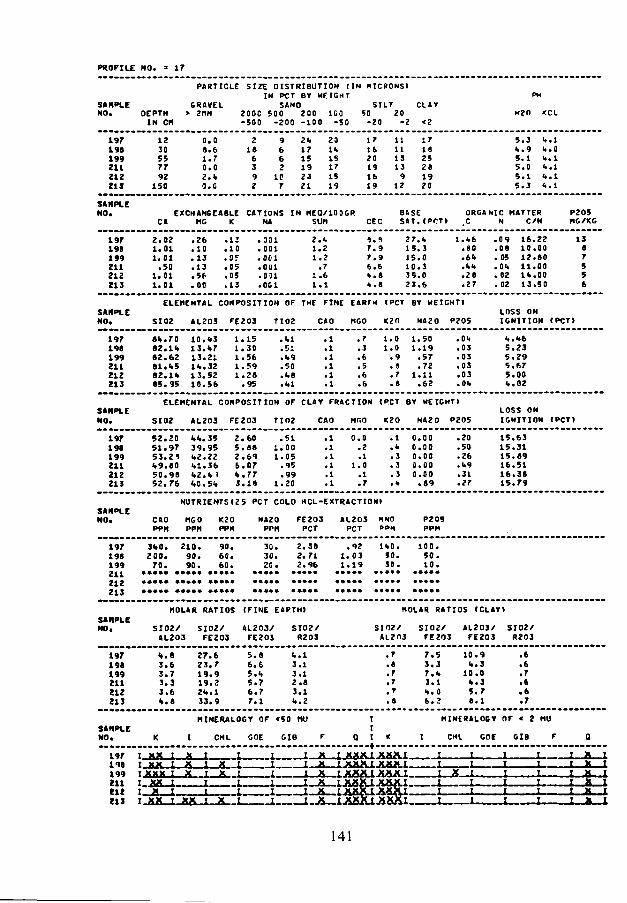
PROFILE NO. = 17
PARTICLE SIZE DISTRIBUTION (IN MICRONS»IN PCT BY HEIGHT
SAMPLENO.
1971 9 61 9 92112 1 22 1 3
OEPTHIN CM
1 230557 792
1 5 0
GRAVEL> 2HM
0 . 08 . 61 . 70 . 02.1»
o.c
200C- 5 0 0
2I S
6392
SANO5 0 0
- 2 0 (
9662
1C7
2 0 01 - 1 0 0
2«.1 7151 92 32 1
1C0- 5 0
20I t1517151 9
SILT50
- 2 0
1716201 91 61 9
20-2
11111 313
912
CLA
<2
171 )252 81 920
H2O KCL
5.3<t.9
5.1S.OS.I5.3
k.l
u.o• . . 1
SAMPLENO. EXCHANGEABLE CATIONS IN MEQ/100GR
CA MG K NA SUM CECBASESAT.(PCT»
ORGANIC HATTERC N C/N
P2O5MG/KG
1 9 71 9 )1 9 92 1 12 1 22 1 3
2 .1 .1 .
•1 .1 .
02010 1500101
. 2 6
. 1 0. 1 3. 1 3. 5 6. 0 0
. 1 3. 1 0.Of. 0 5. 0 5. 1 3
.301
.001
.001.001.1 )1• 001
211
11
.<•
. 2. 2. 7. 6. 1
S7T6kk
. 1
. 9
. 9
. 6
. 8
. 8
27.kIS. 31S.010.335.023 .6
1.1.6. 8 0. 6 k.!.<•. 2 8. 2 7
. 0 9. 0 8. 05. 0".. 0 2. 0 2
16101211I k1 3
. 2 2. 0 0. 8 0. 0 0. 0 0
.so
1 387556
SAMPLENO.
ELEMENTAL COMPOSITION OF THE FINE EARTH (PCT BY WEIGHT»
SIO2 AL2O3 FEZ03 TIO2 CAO NGO K2O NA2O P2OSLOSS ONIGNITION «PCT)
1 9 71981 9 92112 1 22 1 3
SAMPLENO.
1 9 71981 9 92 1 12 1 22 1 3
•«.7082.1«.82.6281.1.5S2.ll»«5.95
10. »313. «.713.21Id.3213.5210.56
ELEMENTAL
SI02
52.2051.97S3.241.9.8050.9852.76
AL2O3
<.".. 3539.951.2.22".1.361.2.1. )1.0.5".
1.151.301.561.591.28
. 9 5
.1.1. 5 1.1.9.SO.<•«.1.1
COMPOSITION OF
FE203
2.605.882.696.07*.773.1«
TIO2
. 5 11 . 0 01 . 0 5
. 9 5• 99
1 . 2 0
. 1
. 1
. 1
. 1
. 1
. 1
,?. 3. 6. 5. 6. 6
CLAY FRACTION
CAO
. 1
. 1
. 1
. 1
. 1
. 1
Mf.n
0 . 0. 2. 1
1 . 0. 1. 7
1 . 01 . 0
. 9
. 8
. 7
. 8
«PCT
K2O
. 1
. *
. 3
. 3
. 3
. ">
1 . 5 01 . 1 9
. 5 7
. 7 21 . 1 1
. 6 2
.Ok. 0 3. 0 3. 0 3. 0 3.Ok
BY HEIGHT»
NA2O
0 . 0 00 . 0 0O.OO0 . 0 00 . 0 0
. 8 9
P2O5
. 2 0
. 5 0
. 2 6
.1.9
. 3 1
. 2 7
1..1.65.23S.295.675.001..02
LOSS ONIGNITION «PCT)
15.6315.3115.8916.5116.36IS.79
SAMPLENO. CAO
PPM
NUTRIENTS(25
MGO K2OPPM PPM
PCT COLO
NA2OPPM
HCL-EXTRACTION!
FE2O3PCT
AL2O3PCT
KNO» » h
P20SPPM
197 31.0. 210. 90.198 200. 90. 60.199 70. 90. 60.211 ••••• ••••• •••••212 ••••• ••••• •••••213 ••••• ••••» .«»»•
3 0 .3 0 .2 0 .
2 .2 .2 .
387196
1 .1 .
920 31 9
l k O .5 0 .3 0 .
1 0 0SO10
MOLAR RATIOS (FINE EARTH)SAMPLENO. SIO2/ SIO2/
AL203 FEZ03AL203/
FE2O3SIO2/R2O3
MOLAR RATIOS (CLAY)
SI12/ SIO2/ AL2O3/ SIO2/»12(13 FE2O3 FE2O3 R2O3
197198199211212213
27.623.719.919.221.. 133.9
5.86.65.1.5.76.77.1
k.l3.13.12.83.1•».2
. 7
. 8
. 7
. 7
. ?
. 8
7 .3 .7 .3 .k .6 .
53l»10
10.9k . 3
10.0k . 35 . 78 . 1
. 6
. 6
. 7
.6
. 6
.7
SAMPLENO.
MINERALOGY OF <50 MU
I CHL GOE GIB F
MINERALOGY OF < 2 Ml
CHI COE SIB F
19S199211(12
T XX t 1I Xjt I X IT XXX I X
i xx il " X l 'i xx i xx i x i i l_
11 I
(I ;
X IIIJ
IIII
IIIT
II
rHXxx
IIT
141
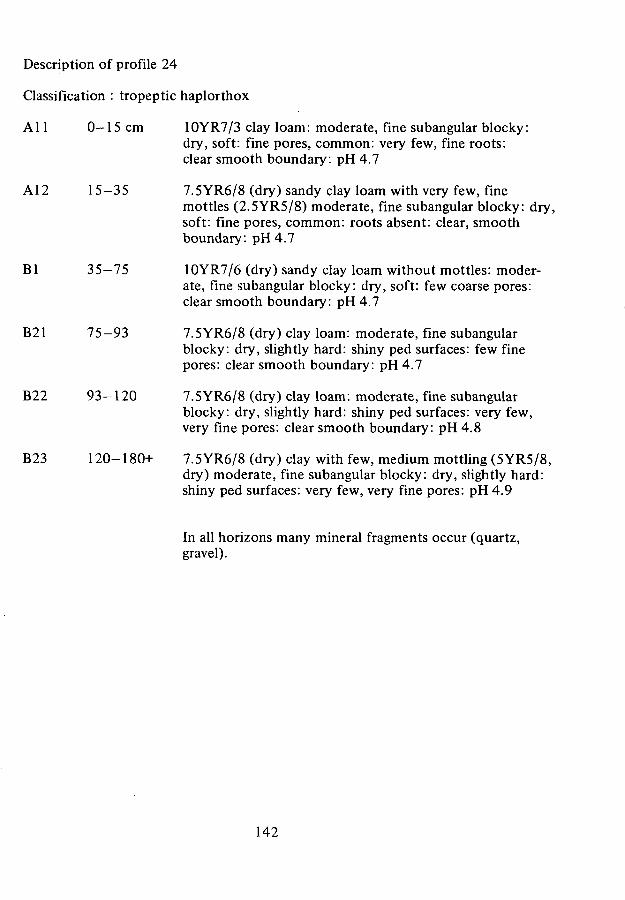
Description of profile 24
Classification : tropeptic haplorthox
Al 1 0-15 cm 10YR7/3 clay loam: moderate, fine subangular blocky:dry, soft: fine pores, common: very few, fine roots:clear smooth boundary: pH 4.7
Al2 15—35 7.5YR6/8 (dry) sandy clay loam with very few, finemottles (2.5YR5/8) moderate, fine subangular blocky: dry,soft: fine pores, common: roots absent: clear, smoothboundary: pH 4.7
Bl 35—75 10YR7/6 (dry) sandy clay loam without mottles: moder-ate, fine subangular blocky: dry, soft: few coarse pores:clear smooth boundary: pH 4.7
B21 75-93 7.5YR6/8 (dry) clay loam: moderate, fine subangularblocky: dry, slightly hard: shiny ped surfaces: few finepores: clear smooth boundary: pH 4.7
B22 93-120 7.5YR6/8 (dry) clay loam: moderate, fine subangularblocky: dry, slightly hard: shiny ped surfaces: very few,very fine pores: clear smooth boundary: pH 4.8
B23 120-180+ 7.5YR6/8 (dry) clay with few, medium mottling (5YR5/8,dry) moderate, fine subangular blocky: dry, slightly hard:shiny ped surfaces: very few, very fine pores: pH 4.9
In all horizons many mineral fragments occur (quartz,gravel).
142
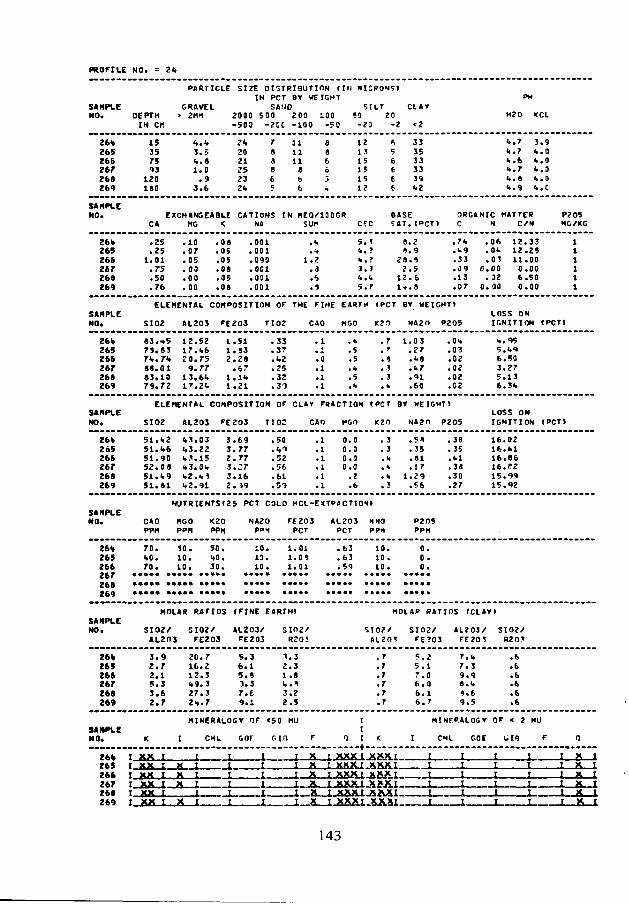
PROFILE NO. = 2ft
SAMPLENO.
PARTICLE SIZE DISTRIBUTION ( I I IIN PCT BY HEIGHT
GRAVEL SAUD SILT CLAYDEPTH > 2M1 2000 500 200 100 59 20
IM CK -503 -2CC -100 -F0 -20 -2 «2M20 <CL
26%265266267268269
15357513
120180
3 . 5",.81 . 0
. 93 . 6
2«.20212 5232<>
78
as6c;
1 11111
866
88663
121315151512
»,566II
3 33S333 3391.2
«..7fc.7i..e>•».7k.8I..9
3 .9It.Ok.Ou.o•..0k.C
SAMPLENO. EXCHANSEA8I.F CATIONS I N H E Q / 1 0 0 G R
CA MG < NA SUPBASES A T . C » C T >
ORGANIC HATTERC N C/N
P2O5HG/KG
261.265266267268269
.25
.251.01
. 7 3. 5 0. 7 6
. 1 0
. 0 7
. 0 5
. 0 0
. 0 0. 0 0
. 0 8
. 0 5. 0 5. 0 8. 0 5. 0 8
.001.001.090.001.001.001
. 1 .
. 1.
1.2• a
k. ?k.?3.SU.I.5 . f
8.24 .9
2 8 . 42 .5
1 2 . 61-..8
. 7 k
.1.9
. 3 3
. 0 9
. 1 3• 07
0
0
. 0 6
.Ok
. 0 1
. 0 0
. 12
. 0 0
12.3312.2511.000.006.500.00
SAMPLENO.
ELEMENTAL COMPOSITION OF THE TINE EARTH (PCT BY HEIGHT*
SIO2 AL2OS FE203 TIO2 CAO «GO K2O NA2O P2O5LOSS ONIGNITION (PCTt
26k2652662672 6 82 6 9
83. -.579.637V.7«.88.0183.1079.72
1 2 .1 7 .2 0 .
9 .1 3 .1 7 .
521.675776".2«.
112
11
. 5 1
. 8 3
. 2 8
. 6 7
. 1".
. 2 1
. 3 3
. 3 7
.1.2
. 2 5
. 3 2
. 3 1
. 1# ^.0. 1. 1. 1
.»
.5.5.1». 5, k
. 7a ?
. 8. 3.3• k
1.03• 27."•8.1.7. 0 1.60
.Ok. 0 3.02.02.02.02
k.9S5.«.«»6.SO3.275.136.3k
SAMPLENO.
ELEMENTAL COMPOSITION OF CLAY FRACTION »PCT BY WEIGHT»
SIO2 AL2O3 FE203 T IO I CAD UGO K2O NA2O P2O5LOSS ONIGNITION «PCT»
26k265266267268269
5 1 . k251.1.651.9052.0851.1.951.81
1.3.k J .k 3 .k 2 .<<2.
0322150kk»91
332332
. 6 9
. 7 7
. 7 7
.:T
. 1 6
. 19
. 5 0
. ' . ' '
. 5 2
. 5 b
. 6 1
. 5 9
. 1
. 1
. 1
. 1
. 1
. 1
0000
. 0
. 0.1. 0. ?. 6
. 3
. 3, k. k. k
. 5 8
. 3 5
. 8 1
. 1 71.29
. 5 6
. 3 8
. 3 5. U l
. 3 8
. 3 0
. 2 7
16.0216.1.116.0616.0215.9915.92
NUTRIENTS(25 PCT COLO HCL-EXTPACTIOMISAMPLEHO. CAO «GO K2O NA2O FE2O3 AL203 HMO P2O5
PPM PPM PPM P"1 PCT PCT PPH PPM
26% 70. 10. 50. 10. 1.01 .63 10. 0.265 1.0. 10. 40. 13. 1.04 .63 10. 0.266 70. 10. 30. 10. 1.01 .59 10. 0.267 • • • • • • • • • • • • • • • • • • • • • • • • • • • • •
268 ••••• ••» •• •• ••
2 6 9 ..... ..... ..... .....
MOLAR RATIOS (FINE EARTH) nOLAP RATIOS (CLAY)SAMPLENO. SIO2/ SIO2/ AL2O3/ SIO2/ SIO?/ SIO2/ AL20S/ SIO2/
AL2O3 FE203 FE203 R2O3 »L2O1 FE?O3 FE203 R2O^
26%26$266267268269
»AMPLENO.
26%26»266267266269
3 . 92 .2 . :5 . !3 . e2.1
K
XX,XJiXX ]
r XX
r xxr xx
I
XXX
[ X
2 0 .1 6 .1 2 .1.9.27 .2 * .
723337
5.6 .5 .1 .7 .9 .
MINERALOGY
!
Ij
1I
CHL
JTTfjI
3193
ei
or
G or
ITIj
II
121k32
<5Q
r.m
. 3
. 3.8. *.2.5
HU
ITfjT
F
X.X.
x.x.X
JTITfy
. 7
.7
.7
.7
. 7
.7
II
n i <
XXX I XXX IJ&&2U-X.&X.1—x x x i xxj< iXXX t X Xj< lXXXI XXXIXXXI XXXI
5 .? B
6 .6 .6 .
I
210017
I
fT
f
7 .7 .9 .8 .4 .9 .
k39k
65
HINFPAIOGV
CHL
II
xIII
GOE
O F
l
IJJxII
.6
.6
. 6
. 6
. 6
. 6
< 2
. 1 9
HU
F
IITIII
Q
XXX
Xt X[ X
IIItII
143

Description of profile 57
Classification : typic paleudult
Al 0—8 cm 10YR4/2 silt loam: structureless (massive): moist, friable:very few, very fine pores: quartz gravel, few: fine rootscommon: clear, smooth boundary: pH 4.6
A3 8—17 10YR7/6 silt loam with frequent, very fine mottling(10YR8/1): weak, fine subangular blocky: moist, friable:very few, very fine pores: no rock-fragments: very few,very fine roots: clear, smooth boundary: pH 4.5
Bl 17—35 5YR7/8 silty clay loam with frequent fine mottling(5YR8/1): weak, fine to medium subangular blocky: moist,friable: fine pores common: quartz gravel common: veryfew, very fine roots: gradual, wavy boundary: pH 4.5
B21t 35-85 2.5YR4/8 silty clay loam with frequent, medium mottling(7.5YR8/1 and 7.5YR8/4): weak, fine to medium sub-angular blocky: moist, slightly hard: shiny ped surfaces:few, fine pores: no rock fragments or roots: gradual,smooth boundary: pH 4.6
B22t 85-117 2.5YR5/8 silty clay loam with few, medium mottling(7.5YR8/1): weak, fine to medium subangular blocky:moist, slightly hard: shiny ped surfaces: very fine pores,common: clear smooth boundary: pH 4.7
B3 117-150 2.5YR6/8 (dry) silt loam without mottling: structure andconsistence as above: very fine pores, common: pH 4.7
144

PROFILE NO. = 57
PARTICLE SITE DISTRIBUTION ( IN KICRONS»IN PCT BY HEIGHT
SAMPLE GRAVEL SANO SILT CLAYNO. OEPTH > 2HH 200C 500 200 100 SO 20
IN CM -£00 -200 -100 -50 -20 - 2 <2M2O KCL
» 7 6» 7 7«7a»79» 8 1» 6 2
a1735a;
1 1 71 » 5
. 6
. 31 .2
. 10 . 00 . 0
s2
aiil
10a322
533111
55311:
?o19
l »15
3338J 71.1
505 3
1 «2«.3239302 6
I. .E
«..7"..6
fc.Ok.C».03.83.93. «
SAMPLENO. EXCHANGEABLE CATIONS I N HEQ/1C0GR
CA no K NA SI« CECBASESAT.(»CT>
ORGANIC HATTEPC N C/N
P2O5
MG/<G
»76»77»7a» 7 9»ai»az
. 7 6
. 5 0
. 7 6
. 7 6
. 7 6
. 5 0
. 0 5
. 0 0
. 0 5
. 0 0
. 0 0
. 0 0
. 1 0. 0 5. 0 5. 0 5. 0 5. 0 5
.001.001.0C1.001.001. 0C1
. 9
. 6. 9. «. 8. 6
6.uJ . 5Î . 9b.h5 . 55 . 5
1"..1 5 .2 1 .1 2 .1"..1 0 .
3788
a0
. 8 6
. 3 1. 2 9. 1 " .. 0 0. C l
0I)
.oa.0«.. 0 3. 0 1. 10. 0 0
10.757.759.67
lfc.000.000.00
111111
SAMPLENO.
ELEMENTAL COMPOSITION OF THE FINE EAOTH tPCT BY WEIGHT»
SI02 AL2O3 FEZO3 TIO2 MGO K2O NA2O P2O5LOSS ONIGNITION «PCT»
»76»77»7t»79»at»az
90.5748.18ft*. 1571,.277». 9571.. »7
7 .
a.1 2 .2 0 .2 0 .2 0 .
I ?765 '352 101«
1212
. 7 7
.8«.. < • < «. 0 2. 9 1. 7 0
. 3 9
. 3 7
.i,it
• J»?.1.3.1.1
. 1. 0. 0. 1. 1. 0
, 1.
a It^ T
. 5
. 5
. 6
. 2
. 1
. 5, 4. 9
1 .0
1
11
.1*1.
.C8• ?3.1-5. 0 5. 9 0
. 0 2
. 0 3
. 0 2
. 0 3
. 0 2
. 0 1
2.953.695.087.(117.K.fc.82
SAMPLENO.
ELEMENTAL COMPOSITION OF CLAY FPacTION IPCT BY WEIGHT)
SIO2 AL2O3 FE2O3 TIO2 C4O «r,0 K2O NA2O P2O5LOSS ONIGNITION »PCT1
»76»77»7a»79»at»az
52,7252.7»53.1952.5752.1552.69
1.0»0»0» 1» 1» 1
. 6 8
.71.. 5 1. 0 5. 3 6. 2 0
232222
. 9 4
. 2 3
. 9 3
. 6 8
. 5 3
. 6 0
. 7 8. 7 7. 7 9. 6 9.b?. 6 2
. 1. 1. 1. 1. 1. 1
1
11
.3 I
. T 1• r 1.0 1.0 1.6 1
. J
. 3
. • !
. '
. 1
. 0
0.00. 2 7.11.. 0 1. 9 5. 9 6
. 2 2
. 2 1
. 1 «
. 2 6
. 1 7
. 2 1
1 5 .1 5 .1"».11..1 4 .I1*.
321.3355 3••2
NUTRIENTSJ25 PCT COLO HCL-EXTRACTION»SAMPLENO. CAO MGO K2O NA2O FE2O3 AL2O3 «NO P2O5
PPM PPM °PH PPM »CT °CT »»« PP1
»76 50. 60. 30. 10. 1.1.0 .36 10. 0.»77 20. fcO. 30. 20. 1.33 .56 0. 0.»7a 50. »0. 1.0. 30. 2.35 .62 0. 0.»79 1.0. 30. 30. H C . 3.17 .63 10. 0.»at • • • • • • • » • • • • • • • «...» . . . . . . . . . . . . . . . . . . . .»az »••»• . . . . . . . . . . . . . . . . . . . . . . . . . . . . . . . . . . .
HOLAR RATIOS (FINE EARTH» HOLAR RATIOS (CLAY»SAMPLENO. SIO2/ SIO2/ AL2O7/ SIO2/ StO»/ S I 0 2 / AL2O3/ SIO2/
AL2O3 FE2O3 «T203 R2O3 AL2O? PE2OT FE2O3 R2O3
»76»77»7a» 7 9»at»az
SAMPLENO.
»76»77»7a»79»at»az
TTITTT
753222
K
. 5
.1
. 1. 1. 2. 2
XXX tX.
X XX,
X X
fffT
X X X T
I
X
X,XX
< * .3 9 ,2 1 .1 3 .1 4 .1 0 .
j ,
i .
9S
3
B.6.5 .6 .6.! . .
MINERALOGY
-X-l;I;
CHL
_
966l .
77
OF
GOE
|ITJ»I
653Ii1
«50
GIB
. 1 .
. 1
. 3
. J
. 9
. 8
«U
J
IITI
F
X
xXX
x
I1fI1]
Q
XXX.JKXJU.XXX
xxxXXX
. 8. 8. 8. 7,T
.aiti «
i.ÄÄÜLl_
J.Ä5Ä.1-
J.Ä.4A.I-
6 .6 .6 .7.7 .7 .
I
XXXXX
714l .
76
ttt
IGIG
.a. 0. 8
1.9. 1 .
. 1
HINFRALOGY
l_I
xi .I_
CML GOE
OF
I|JIIJ
. 7
. 7
. 7
. 7. 7. 7
« 2
r.ie
HU
x_
1_T
F
X
wX
IfIIJ
Q
X
X
y
IIf
145
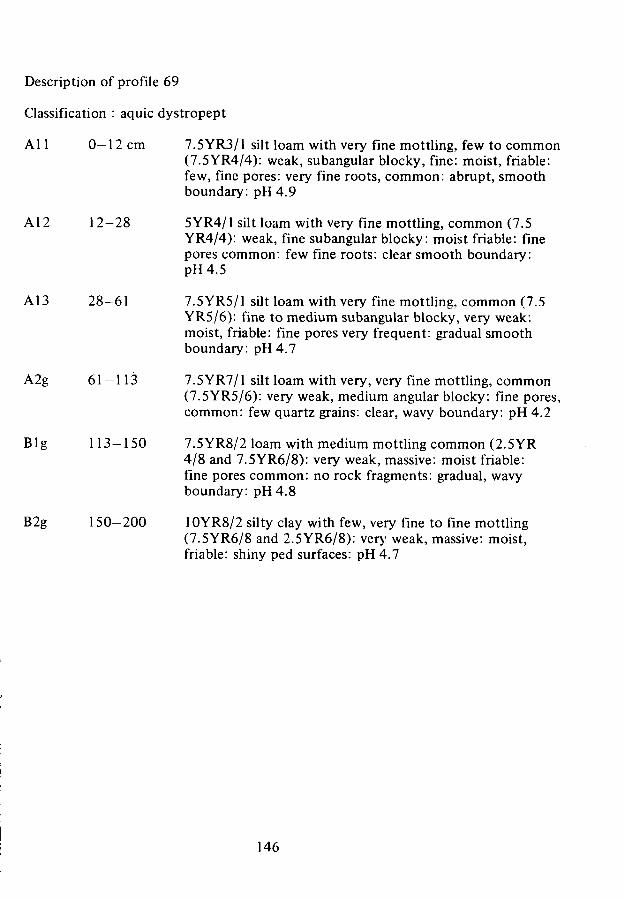
Description of profile 69
Classification : aquic dystropept
Al 1 0—12 cm 7.5YR3/1 silt loam with very fine mottling, few to common(7.5YR4/4): weak, subangular blocky, fine: moist, friable:few, fine pores: very fine roots, common: abrupt, smoothboundary: pH 4.9
A12 12-28 5YR4/1 silt loam with very fine mottling, common (7.5YR4/4): weak, fine subangular blocky: moist friable: finepores common: few fine roots: clear smooth boundary:pH4.5
A13 28-61 7.5YR5/1 silt loam with very fine mottling, common (7.5YR5/6): fine to medium subangular blocky, very weak:moist, friable: fine pores very frequent: gradual smoothboundary: pH 4.7
A2g 61 — 113 7.5YR7/1 silt loam with very, very fine mottling, common(7.5YR5/6): very weak, medium angular blocky: fine pores,common: few quartz grains: clear, wavy boundary: pH 4.2
Big 113-150 7.5YR8/2 loam with medium mottling common (2.5YR4/8 and 7.5YR6/8): very weak, massive: moist friable:fine pores common: no rock fragments: gradual, wavyboundary: pH 4.8
B2g 150-200 10YR8/2 silty clay with few, very fine to fine mottling(7.5YR6/8 and 2.5YR6/8): very weak, massive: moist,friable: shiny ped surfaces: pH 4.7
146
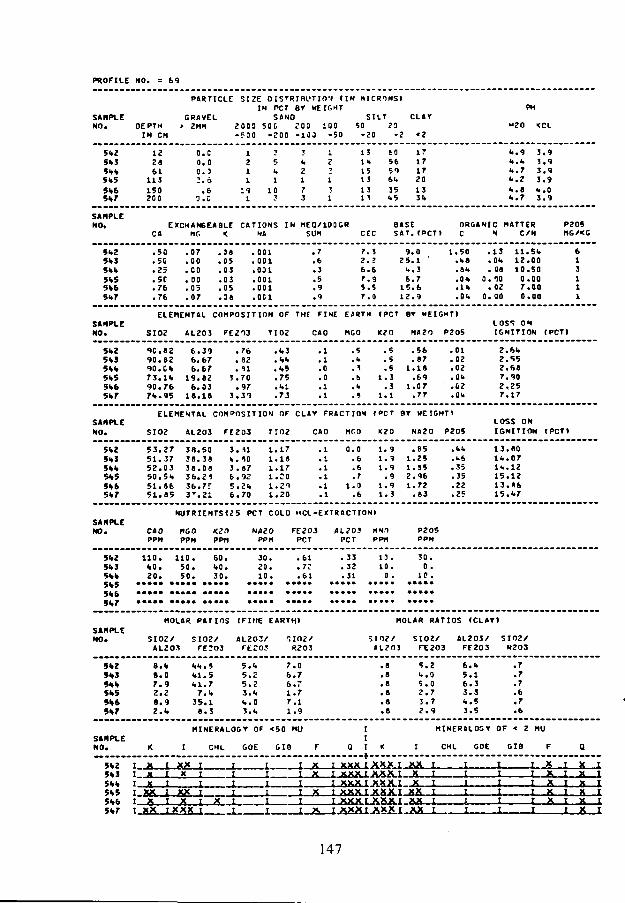
PROFILE NO. = 69
PARTICLE SIZE O ISTRIBL'TION ( IN «ICRONS»IN PCT BY HEIGHT
SAMPLE GRAVEL SANO SILT CLAYNO. OEPTH > ZMN 2003 50C 200 100 SO 29
IN CM - ? 0 0 -TOO - 1 0 0 - 5 0 - 2 0 - 2 <2
PM
" 2 0 <CL
51.25*35**5*55*65*7
12286 1
1131 5 0200
0 . 00 . 00 . 32.o
. 6O.C
1211
191
f
5i .
110
T
1.
(\i
173
1221?
1
1 5Ik15I J131 3
EO565 961.351.5
17171720133 *
k.9 3 .9*.fc 3 .9» .7 3 .9"..2 3 .9fc.e u.O•..7 3 .9
SAMPLENO. EXCMAN6EABLE CATIONS I N MEQ/1O0GR
C« MC < NA SUMBASESAT.(PCT)
ORGANIC MATTERC N C/N
P2O5KG/KG
5*25*35**1*55*65*.7
. 5 0
. 5 0
. 2 5
. 5C
. 7 6
. 7 6
. 0 7
. 0 0
. 0 0
. 0 0
. 0 5
. 0 7
. 0 8
. 0 5
. 0 3
. 0 3
. 0 5
. 3 8
. 0 0 1
. 001.001. 0 0 1. 0 0 1. 0 0 1
. 7. 6. 3. 5. 9. 9
7.2 .6 .7 .5 .7 .
37
i950
9 . 02 5 . 1 '
U . 36 . 7
1 5 . 61 2 . 9
1.50.1.8.81.. 0 *. 1 *.01.
0
0
1 301.08
. 0 0
. 0 2
. 0 0
1 1 . 5 *1 2 . 0 01 0 . 5 0
O.OO7.000.00
613111
SAMPLEELEMENTAL COMPOSITION OF THE FINE EARTH (PCT BY HEIGHT)
SIO2 AL2O3 FEZ13 TIO2 CAO «20 NA2O P2O5LOS«! ONIGNITION (PCT)
51.251.3
5*55*65*7
9 C .9 0 .9 0 .7 3 .9 0 .7 * .
8 28 20 *1 *7695
6 .6 .6 .
1 9 .6 .
1 8 .
396767820318
3
3
• 76. 8 2. t l. 7 0. 9 7. 3 1
.1.3• * *
.1.5.75.1.1. 7 3
. 1
. 1
. 0
. 0
. 1
. 1
. 5
. k
. 3
.b
.ua Q
1
1
. 5
. 5. 5. 3. 3. 1
1
1
. 5 6
. 8 7
. 1 8
. 6 9
. 0 7
. 7 7
. 0 1
. 0 2. 0 2.OU. 0 2.OU
Z.M.Z.S5Z.687.902.257.17
SAMPLENO.
ELEMENTAL COMPOSITION OF CLAY FRACTION ( <*C T BY MEIGMT1
SIO2 ALZO3 FEZ03 TIOZ CAO MGO K2O NA2O PZOSLOSS ONIGNITION (PCT»
51.251.35*1.5%S51.651.7
53.2751.3752.0350.51.51.8651.85
38.5038.3838.0836.2436. J-.3'.21
3. n! . . 403 . 8 76.925.2«.6.70
1.171.181.171.C01 .211.20
0.0.6.6.7
1.0.6
1.91.91.9
. 91.91.3
.951.Z51.S52 .961.7Z
.83
.1.6
.35
.35
.22
.25
13.8011.. 07K..1Z15.1213 .«615.1.7
SAMPLENO.
NUTRIENTSt iS PCT COLO HCL-EXTRACTION!
CAOPPM
nGOPPM
K2O NA2OPPM
FE2O3PCT
AL20S HMDPCT PPM
P2O5PPM
51.251.351.1»5*55<»6
1 1 0 . 1 1 0 .1.0. 5 0 .2 0 . 5 0 .
60.1.0.3 0 .
3 0 .2 0 .1 0 .
. 6 1
. 7 2
. 6 1
. 3 3
. 3 2. 3 1
1 0 .1 0 .
0 .
30.0.
10.
SAMPLENO. SIO2/
ALZO3
MOLAR PATIOS (FINE EARTH)
AL2O3/SIO2/FEÎOJ RZO3
MOLAR RATIOS (CLAYI
5102/«L2O3
SIO2/FE2O3
ALZ03/FE203
SIO2/R203
5*25*35 ".I.51.5
5*7
8.1.8.07.92.2S.92.1.
<•<>.»" . 1 . 51.1.7
7 . 1 ,35.1
8.3
5.1.5 .Ï5.23.<.•..03.1.
7.06.76.71.77.11.9
5 .2I..05 .0Z.73.72 . 9
6.1.5 .16.33 .31..53.5
.7
.7
.7
.6
.7
.6
SAMPLENO. K
MINERALOGY OF <50 MU
I CHL GOE GIB
MINERALOGY OF « Z MU
CHL GOE GIB F O
X I5*Z T X I XX T I
I .
I X I XXX I X X X I X X I
5*5 T XX I XX T5*65,65*7 t XX IXXX I
I XXX I XXX I X Iixxx i x
T X T X X X I X X X I XXI ~m i_ i xxx i x x x i xx i
I_il i x. i xxxt xxx i xx i
iI X
147

Description of profile 83
Classification : typic paleudult
Al 0—20 cm 10YR2/1 silt loam: structure is moderate, subangularblocky (medium): consistence is moist, slightly firm:pores are common, up to fine: rock fragments absent: fineto medium roots are frequent: gradual, smooth boundary:pH4.9
A3 20-52 10YR5/8 silty clay loam: weak, fine to medium subangu-lar blocky: consistence as above: frequent very fine pores:fragments of rotten rock, few: few fine roots: gradual,smooth boundary: pH 4.5
B21t 52—75 5YR5/8 (dry) mottling few, medium (7.5YR5/4): fineclayey: weak, medium subangular blocky: dry, slightlyhard: shiny ped surfaces: very fine pores frequent: veryfine iron concretions and mineral fragments of quartz:roots absent, clear, smooth boundary: pH 4.3
B22t 75-180 5YR5/8 (dry): no mottling: fine clayey: weak, fine tomedium subangular blocky: dry, hard: shiny ped surfaces:very fine pores, common: small iron concretions and veryfine mineral fragments (quartz): pH 4.6
148
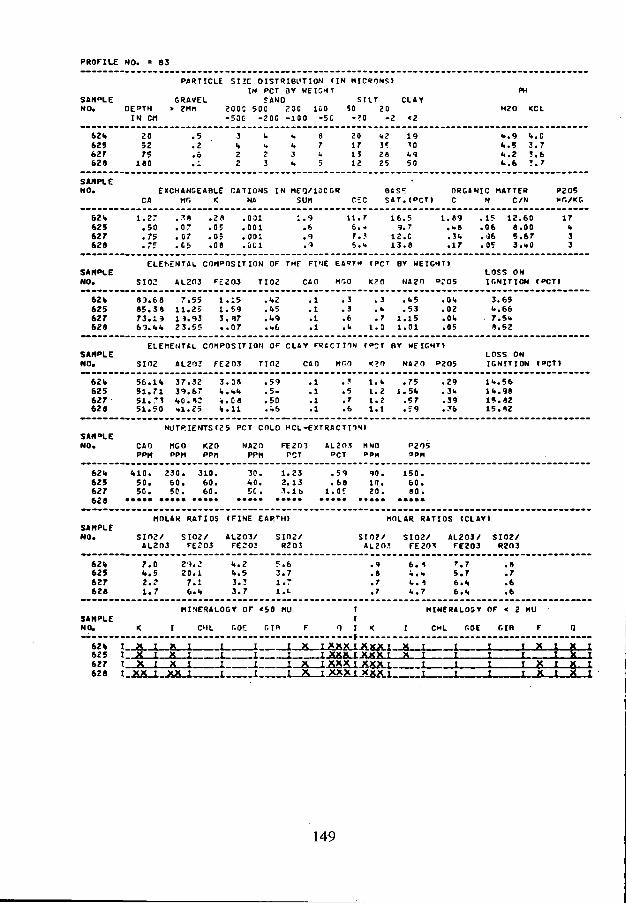
PROFILE NO. = S3
PARTICLE SIZC 0 ISTRIBl'TION ( I N HICRONS»IN PCT BY HEIGHT PH
SAH°LE GRAI/EL SANO SILT CLAYNO. DE°TH > 2MI1 200C 500 200 ICO 50 20 M2O <CL
IN CM -500 -200 - 100 -5C -?0 - 2 <2
521. 20 . 5 3 U •• 9 JO 1.2 1 9 te.9 k.C625 52 . 2 V •. k 7 17 3« ' 0 «..5 3 . 762T 75 . 6 2 2 3 u IS 26 1.9 «..2 3 .6626 180 . 1 2 3 ». 5 12 25 50 <>,6 ? . 7
SAMPLENO. EXCHANGEABLE CATIONS IN MEQ/10CGR BIS? O R G ' N I C MATTER P2O5
CA MG K NA SUM CEC S A T . ( P C T I C N C/N >T,/KG
621» 1 .2T . J S . 2 8 . 0 0 1 1 . 9 1 1 . 7 1 6 . 5 1 . 8 9 . 1 5 1 2 . 6 0 17625 . 5 0 . 0 7 .05 . 0 0 1 . 6 6 .« 9.7 .1.8 . 0 6 8.00 k627 .75 . 0 7 .05 . 0 0 1 . 9 7.5 1 2 . C .31. . 0 6 5 .67 3626 .7? .C5 .08 . J C l . 9 6.1. 1 3 . 8 .17 .05 3.1.0 3
ELEf.ENTAL COH»OSITION OF THF FINE EAST» (PCT BY HEIGHT»SAMPLE LOSS ONNO. S I O ; AL2O3 F£2O3 T I02 CAO MtiO K2O HA2O i»2O5 IGNITION IPCT»
62V 8 3 . 6 8 7 .S5 1 . 1 5 .<»2 . 1 . 3 . 3 .1.5 .0U 3 . 6 5625 8 5 . 3 4 1 1 . 2 5 1 . 5 9 .US . 1 . 3 . k . 5 3 . 0 2 k . 6 6627 7 3 . 1 3 U . 9 3 3 . 8 7 .1.9 .1 . 6 . 7 1 . 1 5 .01. . 7 .5k626 61.VV 2 3 . 5 ? « . 0 7 .1.6 . 1 .k 1 .0 1 .01 .05 8 .52
ELEMENTAL COMPOSITION OF CLAY FRACTION (»CT BY HEIGHT»SAMPLE LOSS ONNO. SIO2 AL2O3 FE2O3 TIO2 CAO MCO <?O NA2O P2O5 IGNITION (»CT»
62V 56.1V 37.32 3.38 .59 .1 . ' l .k .75 .29 Ik.56625 51.71 39.67 k.kk . 5 . .1 .5 1.2 1.5k ,3k Ik.98627 5 1 . - 3 VO.n: 4.C8 .50 .1 . ' 1.2 .57 .39 15.8262» 51.50 *1.25 V . l l . -S .1 .6 1.1 .59 .76 15.82
NJTRIENTS(25 PCT COLO HCL-EXTRACTION»SAMPLENO. CAO MGO K2O NA2O FE201 AL2O3 MNO P2O5
PPH PPM PP» PPM PCT t>CT »PM BPM
62k (»10. 230 . 310. 30 . 1.23 . 5 9 90 . 1 5 0 .625 5 0 . 6 0 . 60 . J.0. 2 .13 . 6 8 II). 6 0 .627 50 . 50 . 60 . 50 . 1 .1b LOT ?0 . 8 0 .628 . . » » • . . . . . . . . . . . . . . . . . . . . . . . . . . . . . . . . . . .
MOLAK RATIOS (FINE EARTH) MOLAR RATIOS (CLAVISAMPLENO. S I O 2 / S I O 2 / AL2O3/ S I O 2 / StO?/ S I O 2 / AL2O3/ S I 0 2 /
AL203 FE2O3 FE2O3 R2OÎ AL2OÎ FE2O3 FE2O3 RZO3
62V 7 .0 21 .2 k .2 P.6 . 9 6 . 1 ' . 7 . 8625 V.5 2 0 . 1 k.5 3.7 .6 k.« 5.7 .7627 2.2 7.1 3.3 1.7 .7 k.4 è.k .6628 1.7 6.V 3.7 1.1- .7 k.7 6.k .6
MINERALOGY OF <50 MU I MINERALOSV OF < 2 MUSAMPLE INO. K I C>IL r.Ot Gin F O I < I CHL GOf GtH F Q- i 1
62 V I X I X I 1 L625 I" X I X I I 1 I I XXX62f t X I X I 1 1 1_JS LJ4SÄ.i.JtJJX.L„626 I XX I XX I
X TX I
II
IItI
IIII
IrIi
XXX
IIfI
X
XsJI1J
149
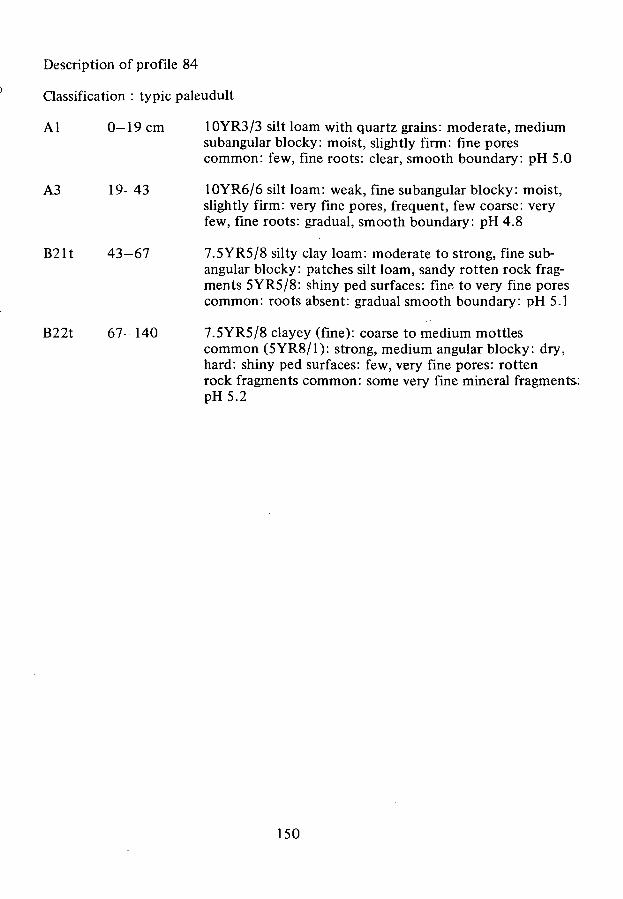
Description of profile 84
Classification : typic paleudult
Al 0—19 cm 10YR3/3 silt loam with quartz grains: moderate, mediumsubangular blocky: moist, slightly firm: fine porescommon: few, fine roots: clear, smooth boundary: pH 5.0
A3 19—43 10YR6/6 silt loam: weak, fine subangular blocky: moist,slightly firm: very fine pores, frequent, few coarse: veryfew, fine roots: gradual, smooth boundary: pH 4.8
B21t 43-67 7.5YR5/8 silty clay loam: moderate to strong, fine sub-angular blocky: patches silt loam, sandy rotten rock frag-ments 5YR5/8: shiny ped surfaces: fine to very fine porescommon: roots absent: gradual smooth boundary: pH 5.1
B22t 67-140 7.5YR5/8 clayey (fine): coarse to medium mottlescommon (5YR8/1): strong, medium angular blocky: dry,hard: shiny ped surfaces: few, very fine pores: rottenrock fragments common: some very fine mineral fragments:pH5.2
150
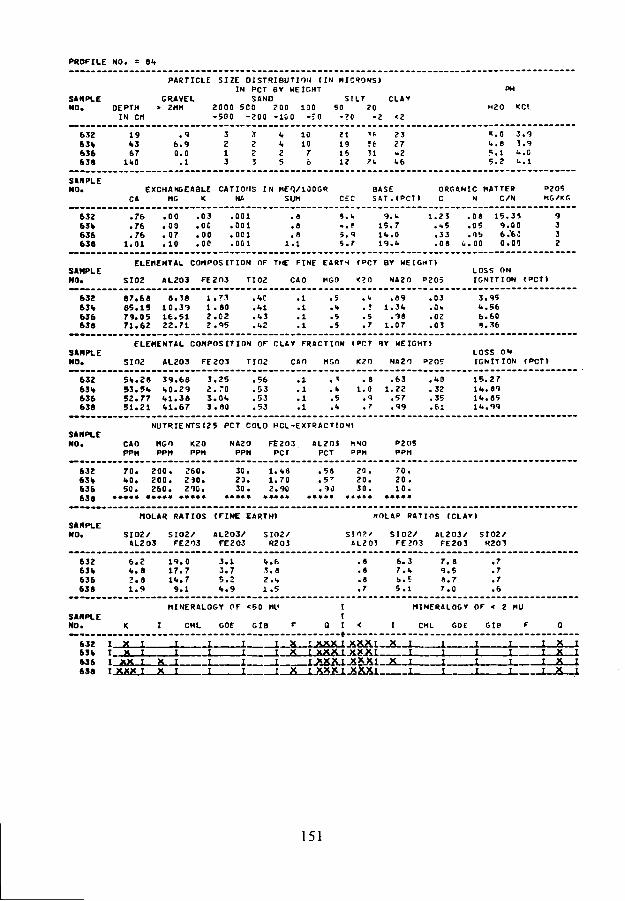
PROFILE NO. : 81.
PARTICLE SIZE DISTRIBUTION ( I N MICRONS»IN PCT BY WEIGHT
SIMPLE GRAVEL SAND SILT CLAYNO. DEPTH > 2HM 2000 500 200 100 50 20
IN Crt - 5 0 0 - 2 0 0 - 1 0 0 - : 0 - 2 0 - 2 «2
63263%636638
1 9
67
.96.90.0.1
3213
32c3
I«
1.
25
10107ó
21191612
*&Î63121.
2327»21.6
•i.O"4.S
3 . 93 . 9
5 . 1 b.O5 .2 "-.I
SAMPLEN O . EXCHANGEABLE C A T I O I I S I N M E Q / 1 0 0 G R
CA MG < NA SUM CECBASESAT.(PCT)
ORGANIC HATTERC N C/N
•»205HO/KG
63263%63663«
.76
.76
.761.01
.00
.00
.07
.10
.03
.00
.00
.00
.001
.001
.001
.001
.a
.8
1.1
9.U
5.9i.T
9.U 1.23 .0» 15.3» 915.7 .«5 .05 9.00 3lb.O .33 .05 6.'fcC 319.1. .08 Ù.00 0.00 2
SAMPLENO.
63263%636638
ELEMENTAL COMPOSITION OF THE FINE EARTH (PCT BY HEIGHT)
SIO2 AL203 FE2O3 TIO2 CAO MGO <?O NA2O P2O5LOSS ONIGNITION (PCT)
87.68 8.3S 1.73 .(.C .1 .5 . t. .89 .03 3.9585.15 10.39 1.80 .41 .1 .% . ! 1.31. .O* U.5679.05 16.51 2.02 .1.3 .1 .5 .5 .98 .02 6.6071.62 22.71 2 .95 .1,2 .1 .5 .7 1.07 .03 1.36
SAMPLENO.
FLEMENTAL COMPOSITION OF CLAY FRACTION (PCT 9Y HEIGHT)
SIO2 AL203 FE2O3 TIO2 CAn MGO K2O NA2O P20ELOSS ONIGNITION (PCT)
632 51..28 39.68 3.25631» 53.51. 1.0.29 2.70636 52.77 1,1.38 S.0«.638 51.21 «,1.67 3.80
.56
.53
.53
.53
.1
.1
.1
.1
, i
. l>
.5
.<•
. 81.0.9.7
.631.22.57.99
.1.0
.32
.35
.61
15.1"..lfc.!<•.
27698599
NUTRIENTS(25 PCT COLO HCL-EXTRACTION)SAMPLENO. CAO MGO K20 NA2O FE2O3 AL2OJ KNO P2O5
PPN PPM PPM PPM PCT PCT »PM P P H
632 7 0 . 2 0 0 . 260. 30. 1.1.8 . 5 8 2 0 . 7 0 .63% 1.0. 2 0 0 . 2 3 0 . 2 0 . 1.70 . 5 ' 20 . 2 0 .636 5 0 . 260 . 290 . 3 0 . 2.90 . 9 0 3 0 . 1 0 .638 • • • • • • • • » • » » • » . . . . . . . . . . . . . . . .
MOLAR RATIOS (FINE EARTH) HOLAR RATIOS (CLAY)SAMPLENO. S IO2 / S IO2 / AL2O3/ S IO2/ SIO?/ S IO2 / AL2O3/ S IO2/
AL2O3 FE213 FE2O3 R2O3 «L2O3 FF.JO3 FE2O3 «203
63263%636638
6.l».
2,1.
288q
19.17.11..9.
0771
335
.1
.7
.Z
.9
<t.
S.2.1 .
6at.
5
6 .37.K6.55 . 1
7 .89 .58 . 77 .0
.7
.7
.7
. 6
SAMPLENO.
MINERALOGY OF <50 MU
I CHL GOE GIB F
MINERALOGY OF « 2 MU
CML GOE GIB F
632 I X63% T X636 I XX I X I638 I XXX I x i
xX
TIII
IIII
IIII
IIII
IIII
xXX
IIII
151
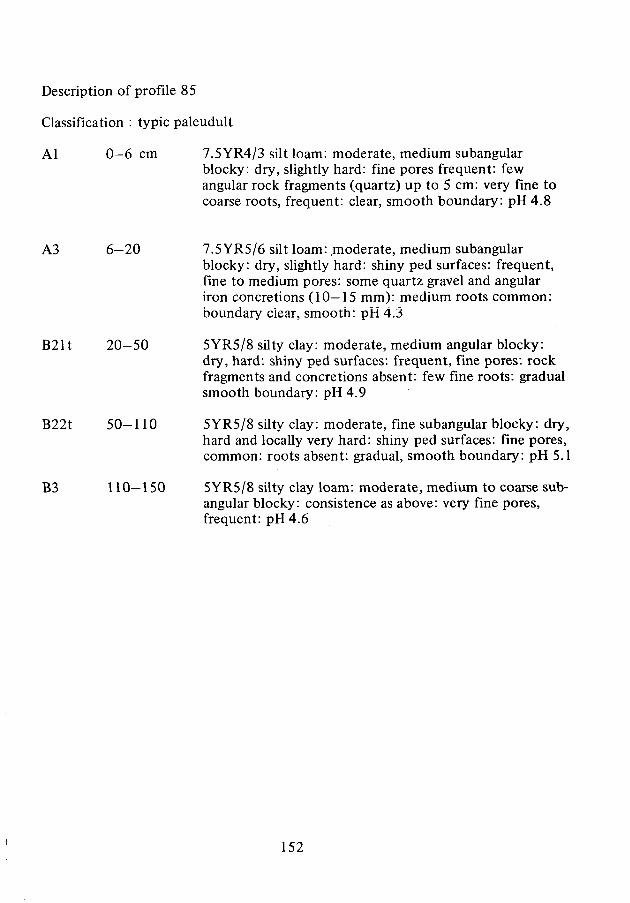
Description of profile 85
Classification : typic paleudult
Al 0-6 cm 7.5YR4/3 silt loam: moderate, medium subangularblocky: dry, slightly hard: fine pores frequent: fewangular rock fragments (quartz) up to 5 cm: very fine tocoarse roots, frequent: clear, smooth boundary: pH 4.8
A3 6—20 7.5YR5/6 silt loam: moderate, medium subangularblocky: dry, slightly hard: shiny ped surfaces: frequent,fine to medium pores: some quartz gravel and angulariron concretions (10—15 mm): medium roots common:boundary clear, smooth: pH 4.3
B21t 20-50 5YR5/8 silty clay: moderate, medium angular blocky:dry, hard: shiny ped surfaces: frequent, fine pores: rockfragments and concretions absent: few fine roots: gradualsmooth boundary: pH 4.9
B22t 50-110 5YR5/8 silty clay: moderate, fine subangular blocky: dry,hard and locally very hard: shiny ped surfaces: fine pores,common: roots absent: gradual, smooth boundary: pH 5.1
B3 110-150 5YR5/8 silty clay loam: moderate, medium to coarse sub-angular blocky: consistence as above: very fine pores,frequent: pH 4.6
152
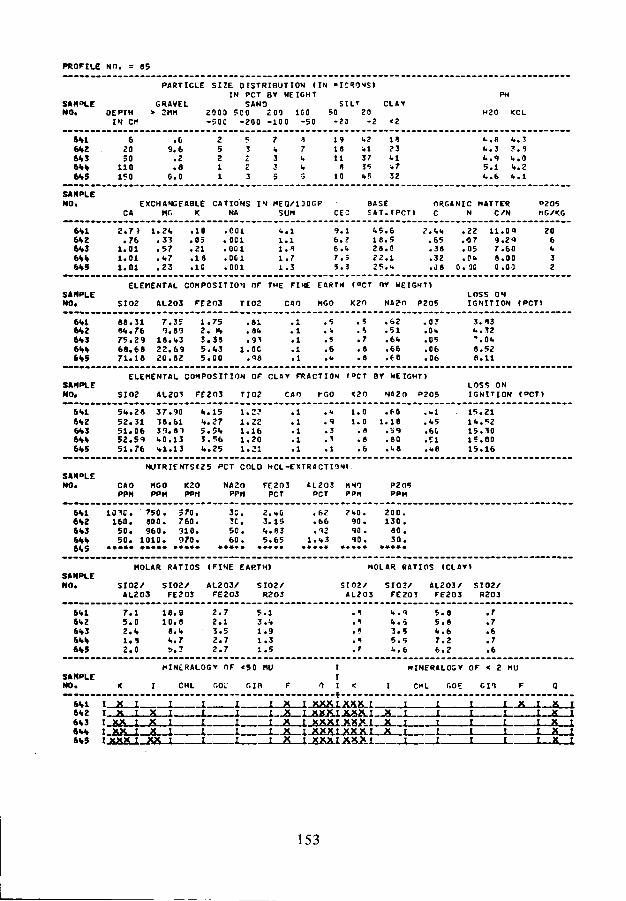
PROFILE NO. = 85
S»11 »LENO.
GRAVELOEPTH > 2MM
IM CM
PARTICLE SIZE DISTRIBUTION ( I N «ICSONS»IN PCT BY HEIGHT
SAND SILT C U T2003 500 £00 ICO SO 20-50C -200 -100 -50 - Î 3 -2 <2
H20 KCL
6H16«,Z6«, 3
6*5
62050
110
.69.6
.2
.a0.0
7>«335
71.<•
5
191811
610
•-2413735us
i »? 3Ul* 732
•-.8«..31..95.11.6
•..3Î . 5fc.OI».2U.I
SAMPLENO. EXCHANGEABLE CATIONS IU MEQ/1D0GP
CA HI", K NA SUM CECBASECAT.(PCT)
ORGANIC MATTERC N C/N
P2O5MG/KG
6*16 * 26*36 * *6 * 5
Z.#
1 .1 .1 .
7»76010101
1 . 2 *. 3 3. 5 7. * 7. 2 3
. 1 0. 0 5. 2 1. 1 8.1C
. 001.001.001.001. o o i
1111
. 1
. 1
. 8
. 7
. 3
9 .6 .6 .7 .5 .
12\53
1.5.1 8 .2 8 .2 2 .2 5 .
6501u
. 6 5. 3 8. 3 2. 0 8
. 2 2. 0 7. 0 5. 0 b
0 . 00
119780
. 0 9
. 2 9
. 6 0
. 0 0
. 0 0
206k
3Z
SAMPLENO.
ELEMENTAL COMPOSITION nr THE FINE EARTH ("CT HY WEIGHT)
SIO2 AL2O3 FE2O3 TIO2 CAO MGO K20 NA2-D P2O5LOSS ONIGNITION (PCT)
6*16*26*36**6*5
8 8 .S * .7 5 .6 8 .7 1 .
31762 96 81 8
7 .9 .
1 6 .2 2 .2 0 .
3589* 36 982
1 .2 .3 .5 .5 .
75K»
38* 300
. 8 1
.81.
. 93l .OC
. 9 8
. 1. 1. 1. 1. 1
5(.56
,(,
eS7
. 8
. 8
. 6 2
. 5 1
. 6 *
. 6 6
. 6 0
. O ï.Ok. 0 5. 0 6. 0 6
3 .1*.*»,
8 .8 .
8332Ok5211
SAMPLENO.
ELEMENTAL COMPOSITION OF CLAr FRACTION »»CT BY HEIGHT)
SIO2 AL2OT FE2O3 TIO2 CAO hGO KZO NA2O "205LOSS ONIGNITION <OCT>
6-.1 5<».2852.3151.0652.5951.76
37.9038.6139.81••0.13•»1.13 •..25
1.ÎÎ1.221.161.201.21
.1
.1
.1
.1
.1
, 14
.1
.3
1.01.0. 8.8.6
. f.01.10.59.80.1.8
.1.5
.61
15.21Ik.5215.3015.0015.16
SAM°LENO.
NUTRIENTS(25 PCT COLO MCL-EXTRACTION)
MGOPPH
K2OPPM
NA2OPP«
FE2O3PCT
1L20S «NTPCT PPM
P2(15PPM
6<»1 10 3 C .6S2 1 6 0 .6V3 5 0 .6",V 5 0 .61.5 • • • • •
750.800.960.
1010.
3 7 0 .7 6 0 .
-no.970 .
3C.3C.5 0 .6 0 .
Z.HÙ3.15<>.835.65
.62
.66
.921.1.3
?i.0. 200 .90 . 1 3 0 .90 . 8 0 .90 . 3 0 .
SAMPLENO.
MOLAR RATIOS (FINE EARTH) MOLAR RATIOS (CLAY)
SIO2/ SIO2/AL2O3 FE2O3
AL203/FE2O3
SIO2/R2O3
SIO2/AL2O3
SIO»/ AL2O3/ SIO2/FE2O3 FE2O3 R2O3
61,16<,Z6«,36VI.6VJ
7.15.02.1.1.52.0
18.910.8
8.1,1..7
2.72.13.52.72.7
5.13.1,1.91.31.5
1..63 . 55 . 5
5.85.8I..67.26.2
. 7
. 7
. 6
. 7
. 6
SAMPLENO.
MINERALOGY OF <50 nil
I CML r.Oc GIB F
MINERALOGY OF < 2 Ml)
CWL GOE G i l F
X I XXXI XXX I II XXXI XXX T , I
61,5 I XXX I XX I
r x 1 xxxi xxxi xX t XXXT X X X I X
I T X T XXX I XXX I
III
xx.X.
JIf
153
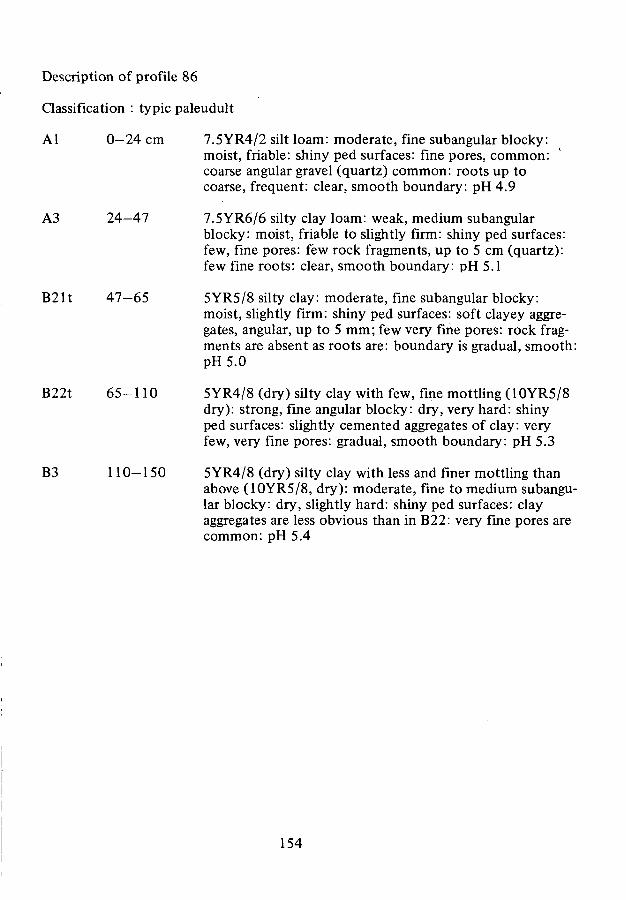
Description of profile 86
Classification : typic paleudult
Al 0—24 cm 7.5YR4/2 silt loam: moderate, fine subangular blocky:moist, friable: shiny ped surfaces: fine pores, common:coarse angular gravel (quartz) common: roots up tocoarse, frequent: clear, smooth boundary: pH 4.9
A3 24—47 7.5YR6/6 silty clay loam: weak, medium subangularblocky: moist, friable to slightly firm: shiny ped surfaces:few, fine pores: few rock fragments, up to 5 cm (quartz):few fine roots: clear, smooth boundary: pH 5.1
B21t 47—65 5YR5/8 silty clay: moderate, fine subangular blocky:moist, slightly firm: shiny ped surfaces: soft clayey aggre-gates, angular, up to 5 mm; few very fine pores: rock frag-ments are absent as roots are: boundary is gradual, smooth:pH5.0
B22t 65-110 5YR4/8 (dry) silty clay with few, fine mottling (10YR5/8dry): strong, fine angular blocky: dry, very hard: shinyped surfaces: slightly cemented aggregates of clay: veryfew, very fine pores: gradual, smooth boundary: pH 5.3
B3 110-150 5YR4/8 (dry) silty clay with less and finer mottling thanabove (1OYR5/8, dry): moderate, fine to medium subangu-lar blocky: dry, slightly hard: shiny ped surfaces: clayaggregates are less obvious than in B22: very fine pores arecommon: pH 5.4
154

PROFILE NO. 86
SAMPLEMO.
I N CN
PARTICLE SIZE DISTRIBUTION ( I N MCRONS»IN PCT BT HEIGHT
GRAVEL SANO SILT CLAT> 2MN 200C 50C 203 10G 50 20
-500 -200 -100 -50 -20 -2 «2
PH
H2O KCL
6«»76»»6<» 9651652
21».
ST65
110150
0 . 01.«.
. 3
. 3
. 3
1»333i.
756I.
6
19161011110
<<9•»33b1537
1 «2 8
»u1.21.0
• t . 9 I , .35 . 1 <».l5 . 0 <-.l5 . 3 l>.25.1 . « . .3
SAHPLEN O . EXCHANGEABLE CATIONS I N M E V 1 3 0 G R
CA HG K NA SUM CECBASES A T . ( P C T »
ORGANIC HATTERC N C/N
PZOSM G/KG
6". 76V86%9651652
1.781 .261.011.021.01
1.00. 3 0. J7. 6 0. 7 0
. 1 3
. 0 0
. 0 0
. 0 3
.OC
.001
.001
.001
.001
.001
21111
. 1
. 6
.1»
• 7. 7
10.lt5 . 7T.T6.1.%•>
2 8 .2 7 .1 7 .2 5 .2 7 .
03q77
1.83. ? 6. 3 1. 2 7. 1 9
. 1 7
. 0 7
. 0 5
. 0 3
. 0 2
108699
. 7 6
. 0 0
. 2 0
. 0 0
. 5 0
12333
1 3
SAMPLENO.
ELEMENTAL COMPOSITION Or THE FINE EARTH (PCT B» HEIGHT!
SIO2 AL2O3 FE203 TIO2 CAO MGO K2O NA2O P2O5LOSS ONIGNITION (PCT)
6*76<>86»»9651652
87.1,1,»2.6271.0 067.0 769.1,1
8 .1 2 .2 1 .21,.2<>.
21»177 7955 ?
12iti>3
. 9 9
. 6 2
. 3 1
. 3 1
. ' 9
. 8 3
. 3 5
. 9 5. 9 7.9<»
. 1
. 1. 1. 1. 1
255
. 6
. 5
. 5
. 5
. 6. 5. 5
. 6 6
. 7 7
.77
.i>2
.15
. 0 3
.05.07.Ok. 0 3
3.1.25.118.1.29.239.lu
ELEMENTAL COMPOSITION OF CLAf FRACTION (PCT e r HEIGHT)SAMPLE LOSS ONNO. SIO2 AL2O3 FE2O3 TIO2 CAO MGO K2O W 2 O P2O5 IGNITION «PCT»
&*7 51,.20 37 .02 I». 1«. 1 .22 . 1 . 5 1.3 1 .19 . 68 13 .9761» S 5 3 . 3 8 39.91, 3 . 7 6 1 .15 . 1 . 2 . 9 . 2 b . 3 9 l b . 9 06V9 5 2 . 6 1 i»1.26 3 . 0 5 1.0F . 1 .3 .T . 15 . 59 14 .68 '651 51 .20 3 9 . 6 * 5.1,6 . 85 .1 0 .0 1.5 .85 .35 15 .06652 50.01» U0.76 5 .30 1 • 01 . 1 CO . 5 1.60 .67 16 .03
NUTRIENTS(25 PCT COLO HCL-EXTRAC TIONISAMPLENO. CAO HGO K2O NA2O FE2O3 AL2O3 HMO PZ15
PPM PPM PPH PPM PCT PCT PPM PPH
61.7 580. 580. .3 i.e. 20. 1.91 .6' 140. 10.61»» 50. 580. 320. 30. 3.35 .78 %G. 20.6V9 30. 5<»0. 21,0. 5C. 5.55 1.12 50. 50.651 ••••• ••••• ••••• ..... ..... ..... ..... .....
652 ••••• ••••• ••••• ••••• ••••• •••• .....
NOLAR RATIOS (FINE EARTH» MOLAR RATIOS (CLAVISAMPLENO. SIO2/ SI02/ AL203/ SIO2/ SIO2/ SIO2/ AL2O3/ SIO2/
AL2O3 FE2O3 FE203 R20J AL2O3 FE2O3 FE203 R2O3
61,7 6.2 16.5 2.6 <».5 .9 "..9 Î.7 .76I»S (».0 11.8 3.9 3.0 .• 5.3 6.» .761,9 1.0 l.Z 3.2 1.5 .8 6.5 8.6 .7651 1.6 5.6 3.5 1.2 .8 3.5 i>.6 .6652 1.7 6.3 <•.! 1.3 .7 3.5 ».9 .6
SAHPLENO.
MINERALOGY OF <5 0 HÜ
I CHL COE GIB F
MINERALOGY OF < 2 Ml)
CHL GOE GIB F
6*7
6*9651652
rrTr
xX X
X
IIj
XXXX
XX
IIIII
I: r
iii
TIIII
xxX,XX
[IjTf
X X X
xxxX X XX X XXXX
IIfff
ASiLX&x_A/&X.
T XI XI X
r xI
IIItI
IIIII
IItII
ITTII
xXx
IIIII .
xxxX-X
tJIfI
155

Description of profile 87
Classification : typic peleudult
Al 0—6 cm 10YR5/3 silt loam: weak very fine subangular blocky:moist, friable: few pores, medium: very fine roots, fewto common: clear, smooth boundary: pH 4.9
A3 6—37 10YR5/6 silt loam with very fine to fine mottling, common(10YR6/1): weak, very fine subangular blocky: moist,friable: very fine pores, common: few quartz grains: few,very fine roots: gradual, smooth boundary: pH 5.0
B21t 37-86 5YR5/6 silty clay with very fine mottling, common (10YR6/1): strong, fine to medium subangular blocky: moist,firm: shiny ped surfaces: angular clay pebbles: very finepores, common: roots and rock fragments absent: gradual,irregular boundary: pH 5.0
B22t 86-160 5YR5/8 silty clay without mottling: strong, medium (sub)angular blocky: dry, very hard: shiny ped surfaces: angularclay pebbles (aggregates) common, up to 10 mm (as above):pH5.0
156

PROFILE NO. =
PARTICLE S t ' E DISTRIBUTION ( I M "1 i;»r>M^IIM per FT wfir.tr °w
SAMPLE GRAVEL SANO SILT CLAYMO. OEPTH > ZHn 2303 '. C G ."CC 10C 53 20 «20 <rL
I N CM - ? < n - : o o - l o o - 5 c - > J - r < 2
651. 6 0 .0 2 k 6 10 .'1 J* ?0 k . 9 J . 8655 77 . 4 Î 3 <t • H !<» 2S ? . 0 w.O656 86 0 . 0 1 ? <. - 11 31. Ik *.O k.O65? 160 . 1 1 1 1 5 r H. 5k f .O fc."
N O . EXCHANGEABLE CATIONS I N M E 1 / 1 0 1 G e BASE ORGANIC MATTES P2O5CA Mr; K NA SUM C - " ?AT. («>CT> c N C/N NG/KG
65k . 7 6 . 1 3 . 0 0 . 0 3 1 . o 5 . - 1 3 . 5 1 . 1 1 . 0 7 1 5 . 8 b S6 5 5 . 7 6 . 0 0 . 0 0 . 0 0 1 . « k . . 17.) .38 .03 12.67 3656 . 7 6 .CC . 0 3 . 0 : i . « 6 . ? 1 2 . 3 . 3 1 . 0 3 1 0 . 3 3 3657 1 . 0 1 . 0 3 . 0 0 . 0 0 1 1 .0 t.t 1 5 . 7 . 1 6 J . 1 0 0 . 0 0 3
ELEMENTAL COMPOSITION Of 'HE FINE E«»TH (Per BY HEIGHT!SAMPLE LOSS ONNO. SIO2 AL2OJ FEZ^S TIO? CAO MCO K»n NA2O P2O5 IGNITION <PCT>
65* 88. !7 8 .27 1 . 5 1 . 6 » . 1 . «. . 5 .32 .03 3.28655 45.51 10.07 1. f. .72 .1 . • . k .08 .03 3.<«0656 74.23 17.31 1.83 .75 .1 .•> .T .1.8 .02 5.91657 67.71, 25.62 S.k3 . T .1 .7 l.C .ki .Ofc «.«<»
ELEMENTAL COMPOSITION OF CL£T FRACTION IPCT BY HEIGHT)S»NPLE LOSS ONNO. SIO2 AL3O.' FE2O3 Tln2 CAO nr.1 K?O HA2O P?O5 IGNITION «PCT»
65k 52 .76 38 .9? b.kO .1? .1 0.0 1 . ' 1.12 .52 Ik .74655 51 .88 .19. bî « .Cl . H . 1 . ' 1.5 .96 .38 Ik.71656 50.70 kO.5f W.31 .91- .1 .5 . f. 1.75 ,kS 16.1?657 50.17 kO.b- 3.61 .40 .1 .5 l.k ..2 .kl Ik.97
NUTRIENTSC2S PCT COLP HCL-tXTOACTIINlSAfiPLENO. CAO MGO <2O NA2O FC2O3 «L2O1 n*n P2TÎ
PPM PP« PPli PPM PCT PCT PPM PPM
65» kO. Î C . 3 0 . 1C. 1 . 7 2 . 6 ? 1 0 . 1 4 0 .655 2 3 . 2C . 2 0 . 2C. 1 . 1 ' . 6 ' 1 0 . 2 0 .656 2 0 . 3 0 . 2 0 . k 0 . 2 . 3 ) . » * 1 9 . 5 0 .657 • • • • • • • • • • . . « . . • • . . . . . . . . . . . . . . . . . . . . . . .
MOLAR RATIOS (FINE EARTH» HOLAR RATIOS (CLArlS»H»LENO. S I O 2 / 3 1 0 2 / AL2O3/ " 1 0 2 / SIO?/ S IO2 / A12O3/ S IO2/
AL2O3 FE2M FE2O3 R.?O3 «L?nt FE2D3 FE2O3 R2O3
65 k 6 .3 21.0 3.T • . .« . 8 - . • ; 5 .6 .7655 5.0 20 .S -.i w.c . " k . ) t.3 . '656 2 . 6 1 6 . : D.I 2.3 .' k.w (..0 . t657 1.5 7.k k.« 1.3 .t 5 . . 1..6 .6
MIN^RALOG» OF «5C Ml) I 1INCRALOIV OF « 2 Ml'SAH»LE INO. K I CHL r.OE Gin r O t < I CML GOF. GIB F O
»5» I X I I I l I 1JUUU AÜÄ.1 _ÄÄ_I I I I X 1 X I655 I X I is l L X I X I XXXI XXX I XX I l l 1 X r x 1656 I XXX t XX I I 1 I X I XX,X I XXX I i 1 I J I X I657 I XXX I XX X L 1 I X, 1 XXX I XXX I X__i__ __j 1 I X I X I
157
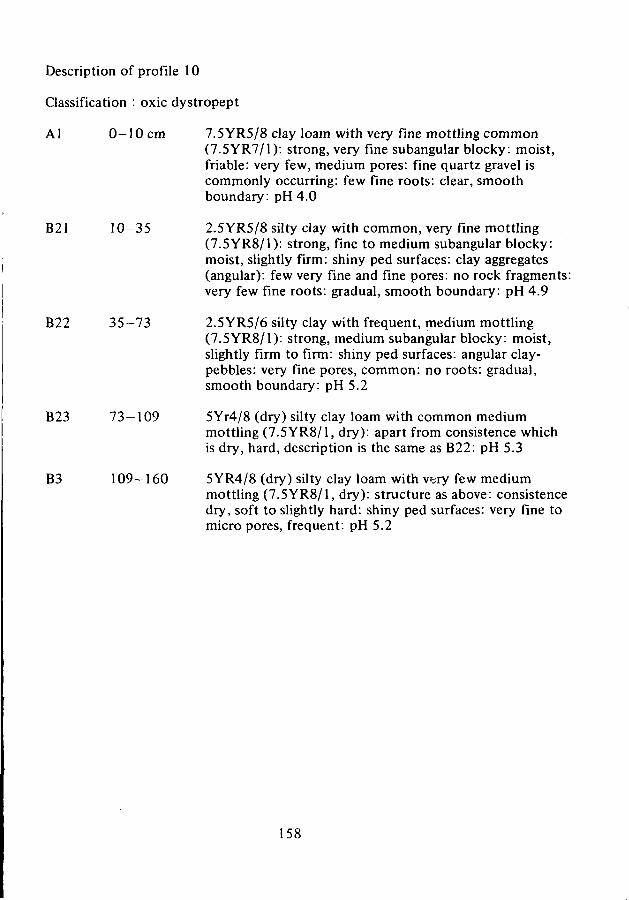
Description of profile 10
Classification : oxic dystropept
Al 0 -10 cm 7.5YR5/8 clay loam with very fine mottling common(7.5YR7/1): strong, very fine subangular blocky: moist,friable: very few, medium pores: fine quartz gravel iscommonly occurring: few fine roots: clear, smoothboundary: pH 4.0
B21 10-35 2.5YR5/8 silty clay with common, very fine mottling(7.5YR8/1): strong, fine to medium subangular blocky:moist, slightly firm: shiny ped surfaces: clay aggregates(angular): few very fine and fine pores: no rock fragments:very few fine roots: gradual, smooth boundary: pH 4.9
B22 35-73 2.5YR5/6 silty clay with frequent, medium mottling(7.5YR8/1): strong, medium subangular blocky: moist,slightly firm to firm: shiny ped surfaces: angular clay-pebbles: very fine pores, common: no roots: gradual,smooth boundary: pH 5.2
B23 73—109 5Yr4/8 (dry) silty clay loam with common mediummottling (7.5YR8/1, dry): apart from consistence whichis dry, hard, description is the same as B22: pH 5.3
B3 109-160 5YR4/8 (dry) silty clay loam with very few mediummottling (7.5YR8/1, dry): structure as above: consistencedry, soft to slightly hard: shiny ped surfaces: very fine tomicro pores, frequent: pH 5.2
158
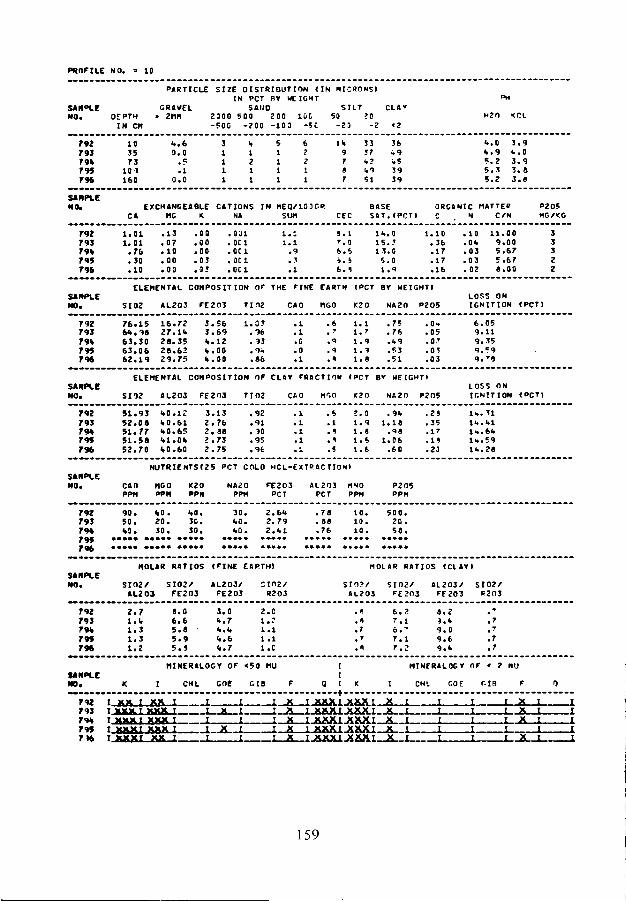
PROFILE NO. = 10
PARTICLE SIZE OISTRIOUTION «IN MICRONS)IN PCT BY WEIGHT
GRAVEL SANO SILT> 2M« 2300 500 200 10C SO ?0
CIA»
IN CH -F00 -200 -103 -5C -23 -2 <2
79279J79%795796
103573
104160
<..60.0
.5
.10.0
31111
it
1211
S1111
6?211
11197S7
3337w?1.051
361.94 53939
•..o"..95.25.35.2
3.9fc.O3.93.«3.6
SAMPLENO» EXCHANGEABLE CATIONS I N MEQ/103GR
CA MG K NA SUMBASES « T .
O R G A N I C M A T T E »C N C/N
P2O5HG/<G
7927 9 379%7 9 57 9 6
1 .1 .
0101763010
. 1 3. 0 7. 1 0. 0 0. 0 0
. 0 0. 0 0. 0 0. 0 3. 0 3
. 0 3 1. 0C1. 0 C 1. CCI. 0 0 1
1.11.1
9 . 1' . 06 . 63 . 3b.1
1"..1 5 .1 3 .
5 .1 .
0j
00q
1.10. 3 6. 1 7. 1 7. 1 6
. 1 0. 0«.. 0 3. 0 3. 02
11.009.005.675.67
e.oo
SAMPLENO.
ELEMENTAL COMPOSITION Of THE FINE EARTH (PCT BY HEIGHT)
S I 0 2 AL2O3 FE2O3 T l n 2 CAO UGO IC2O NA2O P2O5LOSS ONIGNITION «PCT)
79279J79%795796
SANPLENO.
79279379%795796
SANPLEN O .
79279S79%
SANPLEN O .
79279J79%795796
76.156%. 9863.3063.0662.19
16.7227.1«.28.3528.6229.75
3.563.69%.12V .00k.00
1 . 0 3. 9 6. 9 3. 9 4. 86
ELEMENTAL COMPOSITION OF CLAY
SI92
51.9352.0851.7751.5«52.70
AL2O3 FE2O3
%o.iz1.0.61«.0.6?1 .1 .0 *1,0.60
3.132.762 . 38î . 7 32.75
NUTRIENTS«25 PCT
CAOPPM
9 0 .5 0 .%9.
NGO K2OPPM PPH
<>0. <>0.2 0 . 3 0 .3 0 . 3 0 .
MOLAR RATIOS
SIO2/ SIO2/AL203 FE2O3
2 . 7l . V1.31.31.2
8 . 06 . 65 . 65 . 95 . J
11001
. 6y
. q
. 4
. 9
1 . 11 . '1 . 91 . 11 . 8
FRACTIOM (PCT
TIO2 CAO
. 9 2
. 9 1
. n
. 95
. 9 6
1111
Mr.O
. 6
. 1
. 9
. 9
.5
K2O
>.O1 . 91 . 81 . 61 . 6
COLO HCL-EXTBACTION)
NA20 FE2O3PPM PCT
30
1.0
(FINE
AL2O3/FE2O3
3.0«•.7<•.<.<•.6<<.7
2.6<t2.792.1.1
EAP.TH)
SIO2/
R2O3
2.C1 . 2î . i
i .1l .C
AL2O3PCT
. 7 8
. 88. 7 6
nioPPM
1 0 .1 0 .1 0 .
. 7 5
. 7 6
. U 9
. 53
. 5 1
. 0-
. 05. 0 . '. 0 1.03
BY HEIGHT)
NA2O P2O5
. 9 1 .1 . 1 8
. 4 81 .06
. 6 0
P2OSPPM
5 0 0 .2 0 .5 0 .
. 2 9
.35
. 1 7
. 1 9
.23
MOLAR RATIOS
sm?/AL2O3
. 9, 9
.r
. 7
. 9
SIO2/FEÎOJ
6 . 27 . 16 . '7 . 17 . 2
6 . 0 59 . 1 19.359.«99.M
LOSS ONIGNIT ION «PCT)
1 » . 31Ifc. fcl1*.6<»l u . 5 9H..28
«CLAY)
AL2O3/FE2O3
99999
. 2
.k
. 0
. 6
.<•
SI02/R2O3
. 7, 7
.7
.7
MINERALOGY OF «50 MU t HINfRALOGY OF < ? HUU N P L C tNO. K I CHL GOE GIB F Q I K I CHI GOE M B F O
792 I XX I XX I L I I X I XXX I XXX I X I 1 L I X I79J T xxK r XXX T I x I r x i x x x i XXX i79% i m m i x x x i i i i x i xxxi xxxi795 T XXXI XXX I 1__£_ i T X T XXXI XXX I7 M> T XXXr XX I I I I X I XXX XXX, T
XX
xX
III
r
iiii
iiii
iiii
KX,
iXII
1III
159
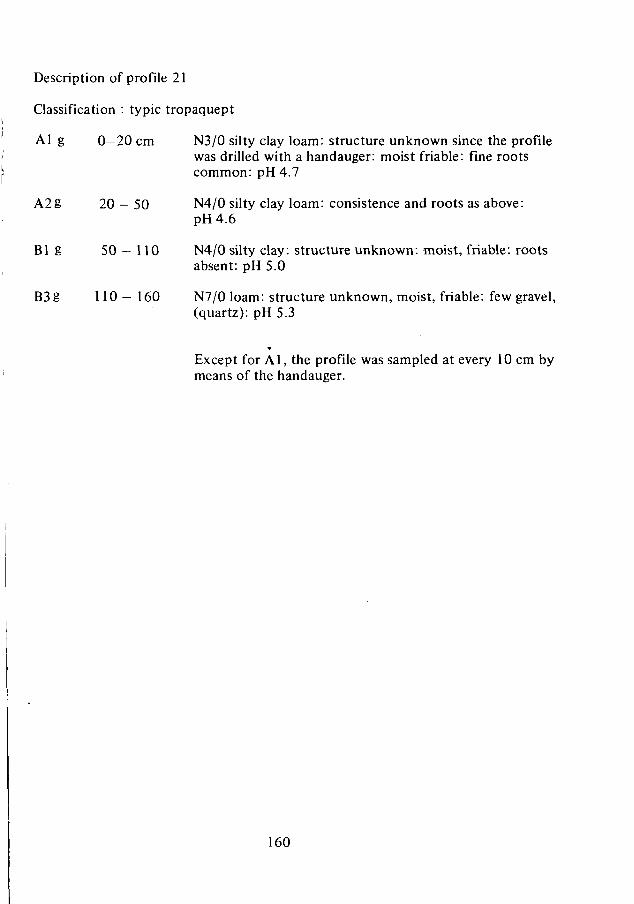
Description of profile 21
Classification : typic tropaquept
Al g 0—20 cm N3/0 silty clay loam: structure unknown since the profilewas drilled with a handauger: moist friable: fine rootscommon: pH 4.7
A2g 20 — 50 N4/0 silty clay loam: consistence and roots as above:pH4.6
B i g 50 — 110 N4/0 silty clay: structure unknown: moist, friable: rootsabsent: pH 5.0
B3g 110 — 160 N7/0 loam: structure unknown, moist, friable: few gravel,(quartz): pH 5.3
Except for Al, the profile was sampled at every 10 cm bymeans of the handauger.
160
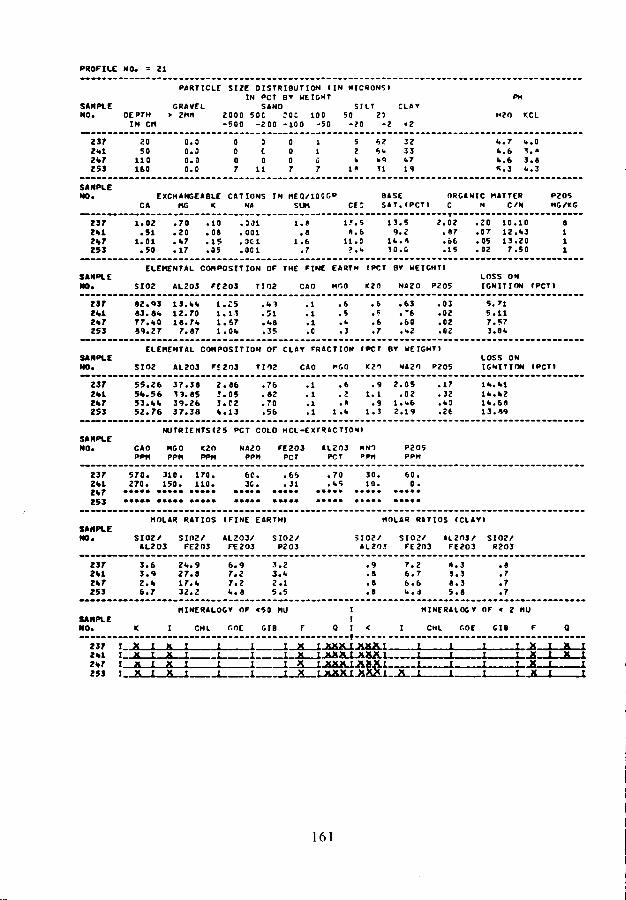
PROFILE NO. - 21
SAMPLENO. DEPTH
I N CM
PARTICLE SIZE DISTRIBUTION (IN MICRONS!IN PCT BY HEIGHT
GRAVEL SAND SILT CLAY> 2Mn 2000 50C ?0C 1O0 50 21
-500 -200 -100 -50 -20 -2 «2M2O KCL
2372*12k7253
2050110160
0.00.30.00.0
0007
0
c0
11
0007
1107
S2it
1 «
62S k
k 911
323 3k 71 9
It.7 b.Ok.6 3.«k.6 3.a*.3 k.3
SAMPLEEXCHANGEABLE CATIONS IN HEQ/1OGGD
CA BG K NA SUMBASESAT.(PCT)
ORGANIC MATTERC N C/N
P2O5MG/KG
237 1.0Z . 7 0 . 1 0 . 3 0 1 1 .«2 k l . 5 1 . 2 0 . 0 8 . 0 0 1 . 82%7 1 . 0 1 . k7 . 1 5 . 3 0 1 1 . 6253 . 5 0 . 1 7 . 0 5 . 0 0 1 .7
1 Ï8
11
. 5
. 6
. 0
1 3 .9 .
I k .1 0 .
5280
2 . 0 2. 8 7. 0 6. 1 5
. 2 0
. 0 7
. 0 5
. 0 2
101213
7
. 1 0. k 3. 2 0. 5 0
SAMPLENO.
ELEMENTAL COMPOSITION OF THE FINE EARTM (PCT BT HEIGHT)
SIOZ AL2O3 FE2O3 TIO2 CAO MGO PC20 NA2O P2O5LOSS ONIGNITION <PCT)
237 «2.93 13.kk 1.C5 .412kl 83.4k 1Z.70 1.13 .512% 7 77.<t0 IS.7k 1.67 .ks253 «9.27 7.87 1.0k .35
1110
. 6
. 5
. k
. 3
. 6. ?
. 6
. 7
. 6 3• T6. 6 0. k 2
. 0 3
. 0 2
. 0 2
. 0 2
5. »15.117 .573.0k
SAMPLENO.
ELEMENTAL COMPOSITION OF CLAY FRACTIOM CPCT BT HEIGHT)
SIOZ AL2OS FJ203 TIO2 K21 NA2O P2O5LOSS ONtGNIT ION «PCTI
237 55.26 37.36 2.86 .76 .12kl 5k.56 13.85 7.05 .82 .12k7 53.kk 39.26 J.C2 .70 .1253 52.76 37.38 k.13 .56 .1
. 6 . 9 2 . 0 5 . 1 7 lk.kl
. 2 1.1 . 0 2 .32 Ik . 1.2
.A .9 I .k6 .k0 Ik.68l .k 1.3 2.19 .26 13.49
SAMPLENO.
NUTRIENTS<25 PCT COLO HCL-EXTRACTIONI
CAOPPM
NGOPPM
K2OPPM
NA2OPPM
FE2O3PCT
AL2O3 UNOPCT PP>n
P2O5PPM
2372 k l
253
570.270.
3 1 0 . 1 7 0 .1 5 0 . 1 1 0 .
6C.3 0 .
.66
. i l.70.k5
30.10.
6 0 .0 .
MOLAR RATIOS ( F I N E EARTH) MOLAR RATIOS (CLAVISAMPLENO.
2372kl2k7253
SIO2/AL2O3
3 . 63 . 92 . k6 . 7
SIO2/FE2O3
2k. 927.817.k32.2
AL2O3/FE2O3
6 . 9T.27 . 2k . S
SIO2/P2O3
3 . 2J . k2 . 15 . 5
SIO2/AL2O3
. 9
. 8
. 6
. 6
SIO2/FE2O3
7 . 26 . 76 . 6k . &
AL2O3/FEZO3
8 . 38 .38 . 35 . 6
SIO2/R2O3
. 8
.7
.7
.7
SAMPLENO.
MINERALOGY OF <50 MU
I CHL r.OC GIB
I!I <
MINERALOGY OF < 2 MU
CHL r.OC GIB F
ZiT I2*1 I2<»r t2»J '
I 1 I XXX I _x xXxK
jf[
iti
ii
i
T xi . i x X,
i
XI
III
IIt
III
xX
I(J
X iij
161
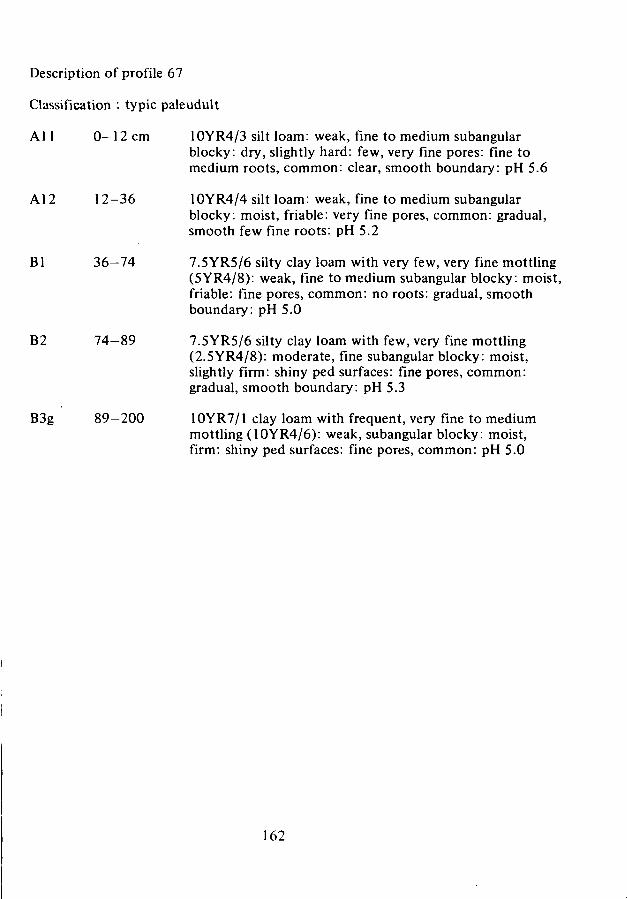
Description of profile 67
Classification : typic paleudult
Ai l 0-12 cm 10YR4/3 silt loam: weak, fine to medium subangularblocky: dry, slightly hard: few, very fine pores: fine tomedium roots, common: clear, smooth boundary: pH 5.6
Al 2 12—36 10YR4/4 silt loam: weak, fine to medium subangularblocky: moist, friable: very fine pores, common: gradual,smooth few fine roots: pH 5.2
Bl 36-74 7.5YR5/6 silty clay loam with very few, very fine mottling(5YR4/8): weak, fine to medium subangular blocky: moist,friable: fine pores, common: no roots: gradual, smoothboundary: pH 5.0
B2 74-89 7.5YR5/6 silty clay loam with few, very fine mottling(2.5YR4/8): moderate, fine subangular blocky: moist,slightly firm: shiny ped surfaces: fine pores, common:gradual, smooth boundary: pH 5.3
B3g 89-200 10YR7/1 clay loam with frequent, very fine to mediummottling (10YR4/6): weak, subangular blocky: moist,firm: shiny ped surfaces: fine pores, common: pH 5.0
162

PROFILE NO. = 67
PARTICLE SIZE DISTRIBUTION ( I N «ICHONSIIN PCT OT HEIGHT PM
SAMPLE GRAVEL SAND SILT CLAYNO. OEPTH > 2M1 2000 500 200 100 50 20 "20 <CL
IN CH -530 -cCO -100 -50 -20 -2 <2
529531532533531»
12367<t89
200
o.c0.0o.c0.00.0
0000<t
?1115
6ç117
1<.11
555
30532 92 92 3
2521.2S272 6
222b3 8Î 731
5.65.25.05.35.0
<4.3it.2
(•.0
SAMPLENO. EXCHANGEABLE CATIONS IN MEQ/100GR
CA BG < NA SUM cecBASES A T . ( P C T »
O R G t N I C HATTERC N C/N
P205MG/KG
5 2 95 3 15 3 25 3 35 3 b
1 .1 .1 .1 .1 .
2 601272777
. 2 0
. 0 7
. 1 0
. 2 8
. 6 3
. 1 0
. 0 8.OS. 0 8. 0 8
.0 11.0C1.301.001.001
1.61.21.51 .62 . 5
7.06.U6.6T.t6.?
22.218.221.922.1.1.0.3
. 9 8
. 6 0
. 3 3
. 1 5
. 0 2
. 1 1
. 0 7
. 0 5
. 0 30. JO
88650
. 9 1
. 5 *
. 6 0
. 0 0
.OC
SAMPLENO.
ELEMENTAL COMPOSITION OF THE FINE Ef tTH «PCT BY HEIGHT»
SIO2 AL2O3 FE203 TIO2 CAO HGO K2O NA2O P205LOSS ONIGNITION «PCT»
5295 3 153253153V
6 5 .8%.7 8 .7 8 .8 1 .
6 05 12 55 30 0
9 .1 1 .1 5 .1 5 .1 3 .
71.0981
m6 7
1.681.1.12.602.782.17
. 6 0
.61.
. 7 5
. 7 5. 8 2
. 1
. 1. 1. 1. 1
. 5
. 5. 6.<.. 5
1 .1 .1 .1 .1 .
11122
.61.
. 6 0. 7 k.77.«.9
. 0 2
. 0 2.OS. 0 5. 0 2
•..035.016.656.«36.00
SAMPLENO.
ELEMENTAL COMPOSITION OF CLAY FRBCTION (PCT BY HEIGHT»
SIO2 AL2O3 FE2O3 TIO2 CAO MGO <2O NA2O P2O5
LOSS ONIGNITION (PCT»
52953153253353fr
52.0251.9051.3650.5551.17
3 8 .3 8 .VS.3 7 .3 7 .
01322 ?910 1
5Si67
. 7 0
. 10
. 6 9. 8 9.1.8
1 .1 .1 .1 .1 .
2"26181520
. 1
. 1. 1. 1. 1
. 9
. 9. 7. 6. 9
. 6
. 6. 5. k. 5
. 9 0
. 6 0• 7 7
1.71. 8 2
.»ft
.1.8
. 5 3
. 7 2
. 7 6
1 5 .1 6 .1 6 .1 5 .1 5 .
8030119 86 8
NUTRIENTS(25 PCT COLO HCL-EXTRACTION»SAMPLENO. CAO NGO K2O NA20 FE2O3 AL2O3 MIO O205
PPM PPM PPM PP1 PCT PCT PP« PPH
529 27J. 1*0. 100 . 30. 1.37 . 6 2 730. 0 .531 180 . 220 . 70 . 20. 1.66 .90 13U0. 0 .532 160 . 320 . 90. 30. 2 .06 1 . 1 - MO. 0 .533 • • • • • • • • • • • • • • • • • • • • • • • • • • • • • • • • •53* • • • • » • • • • • • • • • • • • • • • » • • • • • • • • • » •
MOLAR RATIOS (FINF EAPTH) MOLAR RATIOS «CLAVtSAMPLENO. SIO2/ SIO2/ AL203/ SIO2/ SIO?/ SIO2/ AL2O3/ SIO2/
AL213 FE2O3 FE20Î R.2O3 AL2O3 FE2O3 FE2O3 R2O3
5 2 95 3 153253353V
5.u.2 .3 .3 .
2s905
1 9 .2 2 .1 1 .1 0 .!<•.
15360
3 .
^ ,3 .4 .
70950
f.T
222
. 1
. 7. 3. 3
3.1.J. 32.32.82.6
1.3
k.l3.63.53.2
.7
.6
.6
.6
.6
SAMPLEMO.
MINERALOGY OF «50 MU
I CML GOE GIB F
MINEPALOGV OF < 2 MU
CHL GOE GIB F
529531532533531»
XXXX
fII
I
XXXXX
II
[ I[ I[ I
IIIII
IItII
XXXXX
XJJX.
[ XXX[ XXX[ XXX
.IJSÄÄ.1I X>X i
L_X,XAT
IIIII
IIIII
IIIII
IIIII
X
X
IIIII
nX.XX
a.
IIII
-I
163

Description of profile 71
Classification : aquic paleudult
Al 0—13 cm 10YR6/2 silt loam: structureless (single grain) to veryweak, fine subangular blocky: loose to very friable, moist:few, very fine pores: very fine roots, common: clear,smooth boundary: pH 4.8
A2 13-32 10YR7/4 loam with fine mottling, common (10YR7/1):weak, medium subangular blocky: moist, friable: very finepores common: very fine roots common: clear, smoothboundary: pH 4.5
B21t 32-57 10YR7/4 silty clay loam with medium mottling frequentand fine mottling common (resp.5YR5/8 and 7.5YR8/1):moderate, fine to medium subangular blocky: moist,slightly firm: shiny ped surfaces, continuous: few finepores: no roots: gradual, smooth boundary: pH 5.3
B22tg 57—160 2.5Y8/1 silty clay loam with coarse to medium mottling,common (7.5YR5/8 and 2.5YR4/8): structure and con-sistence as above: shiny ped surfaces: very fine to finepores: pH 6.0
164
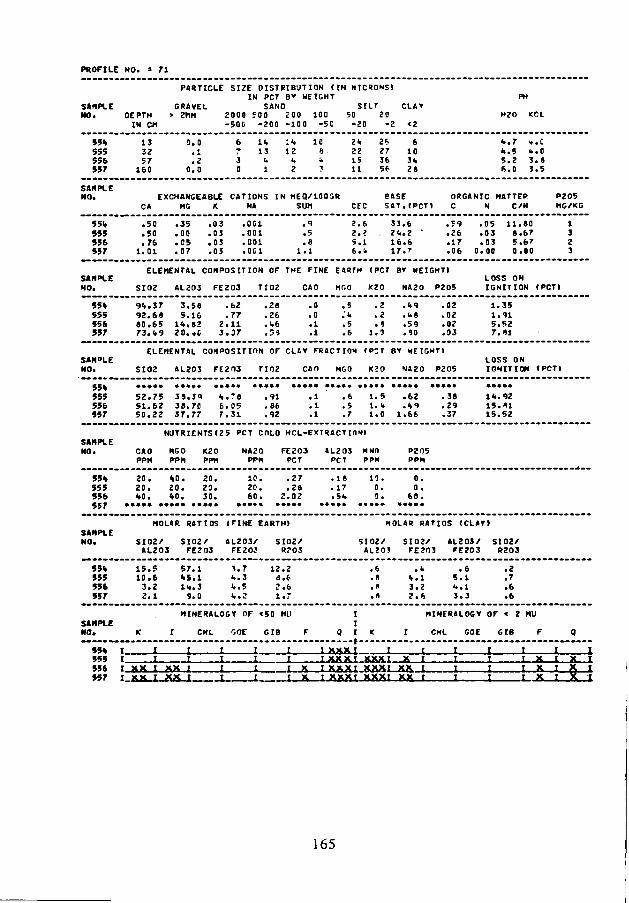
PROFILE HO. - 71
PARTICLE SIZE DISTRIBUTION (IN «ICRONS»IN PCT B» WEICHT PH
SAMPLE GRAVEL SANO SILT CLAYNO. OEPTH > 2HM 2000 fOO 200 100 50 20 H2O KCl
IN CM -50C -200 -100 -50 -20 -2 <2
fc.7 *.Ch.5 U.O5.2 3 .8ft.O 3.5
55%555556557
1 3325 7
1 6 0
0 . 0. 1. 2
0 . 0
6730
1%1 3
u1
i« .12
<«2
108
u
2 k221511
2627365*
61031.2 8
SAMPLENO.
5 5 t555556557
SAMPLENO.
EXCHANSEABLE CATIONS INCA
. 5 0
. 5 0
. 7 61 .01
MC
. 3 5. 0 0. 0 5. 0 7
K
. 0 3
. 0 3
. 0 3.o;
N«
.001
. 0 0 1
. 0 0 1
. o e i
HEQ/IOOGRSUM
.<). 5. 8
1 . 1
CEC
?.2 .5 .6 .
ELEMENTAL COMPOSITION OF THE FINE E41TH
SIO2 AL2O3 FE2O3 TIO2 CAO NGO
67
1It
BASESAT.
3 3 .. 2«..
1 6 .1 7 .
I PCT BY
(PCT1
62 '67
ORGANIC HATTEPC
. 5 9
. 2 6
. 1 7
. 0 6
HEIGHT)
K2O NA2O 1»205
N
. 0 5
. 0 3
. 0 30.00
C/N
11.606.675.6'0.00
LOSS ONIGNITION
P2O5MG/KG
1323
CPCT»
55%555556557
9<r.9 2 .6 0 .7 3 .
3 76 86 5%9
3 .5.
1«. .2 0 .
581662*G
23
. 6 2
. 7 7
. 1 1
. 0 7
. 2 6
. 2 6
.1.6
. 5 *
. 0
. 0. 1. 1
.5 . 2 .fc9 .02 1.35
.'<• . 2 .1.8 .02 1.91
.5 .» .59 .02 5.52
.6 1.0 .40 .93 7.41
SAMPLENO.
ELEMENTAL COMPOSITION OF CLAY FRACTION «PÎT 8Y HEIGHT»
SIO2 AL2O3 FE2O3 TIO2 CAO NGO K'O NA2O P2O5LOSS ONIGNITION «PCT»
55«555556557
52.7551.6250.22
38. J»36.7037.77
%.78t . 0 57.31
. 9 1
. 8 6
.92
.1
.1
.1
.6
.5
.7
1.5
1.0
. 6 2
.1(91.66
. 3 8
. 2 9.37
1<|. 9215.M15.52
SAMPLENO. CAO
PPM
NUTRIENTS»25 PCT COLO HCL-EXTRACTIOXI
MGOPPM
K2OPPM
NA20PPfi
FE2O3PCT
«L2O3 HMDPCT PPH
P205PPM
55% 20.S55 20.956 %0.557 •••••
2 0 .20 .2 0 .30 .
10.20.60.
.27
.282.02
. 1«
.17
.54.
11 .0.0.
0.0 .
6 0 .
SAMPLENO.
MOLSR RATIOS (FINE EARTH»
S I O 2 / S I O 2 / AL203/ S IO2 /AL2O3 FE2O3 FE2OÎ R?O3
NOLAR RATIOS (CLAYI
S IO2 / S I O 2 / AL2O3/ S IO2 /AL?o; FE2O3 FE2O3 R2O3
55%555556
«r
15.510.63.22.1
57.11.S.1
9.0
i,.31..5
12.2a.t2.61 . 7
V . I3 . 22 . 6
. 65 .1•..13 . 3
. 2
.7
. 6
. 6
SAMPLENO.
MINERALOGY OF <50 Ml'
I CHL OOE GIB F
MINERALOGY OF « 2 MU
CHL GOE GIB F
55%555556557
I.I.r xx i xx i
A. - 1 . iT XX I _i_x__iI XXXI XXXI XX I
X I
165
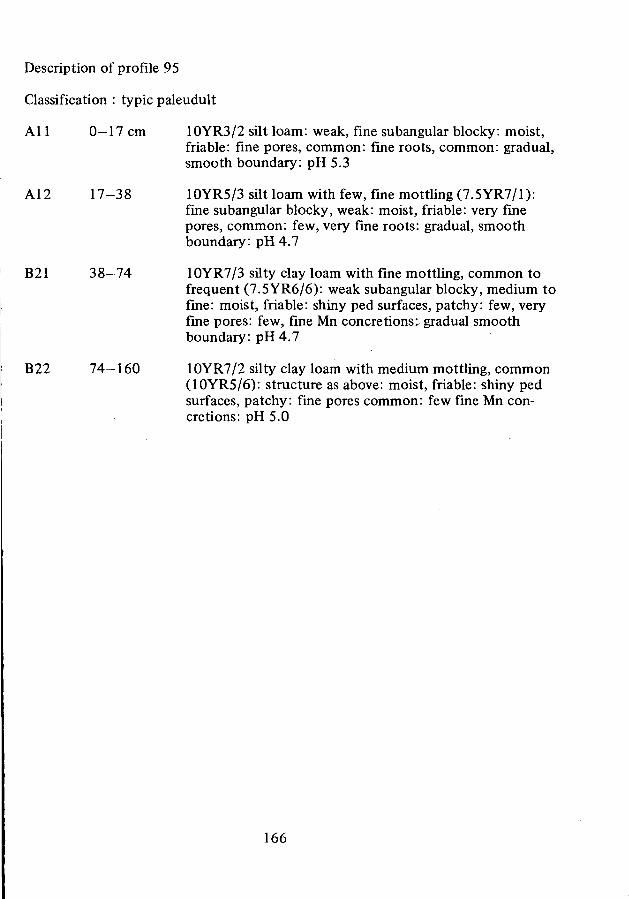
Description of profile 95
Classification : typic paleudult
Al 1 0—17 cm 10YR3/2 silt loam: weak, fine subangular blocky: moist,friable: fine pores, common: fine roots, common: gradual,smooth boundary: pH 5.3
A12 17-38 1OYR5/3 silt loam with few, fine mottling (7.5YR7/1):fine subangular blocky, weak: moist, friable: very finepores, common: few, very fine roots: gradual, smoothboundary: pH 4.7
B21 38-74 10YR7/3 silty clay loam with fine mottling, common tofrequent (7.5YR6/6): weak subangular blocky, medium tofine: moist, friable: shiny ped surfaces, patchy: few, veryfine pores: few, fine Mn concretions: gradual smoothboundary: pH 4.7
B22 74—160 10YR7/2 silty clay loam with medium mottling, common(10YR5/6): structure as above: moist, friable: shiny pedsurfaces, patchy: fine pores common: few fine Mn con-cretions: pH 5.0
166
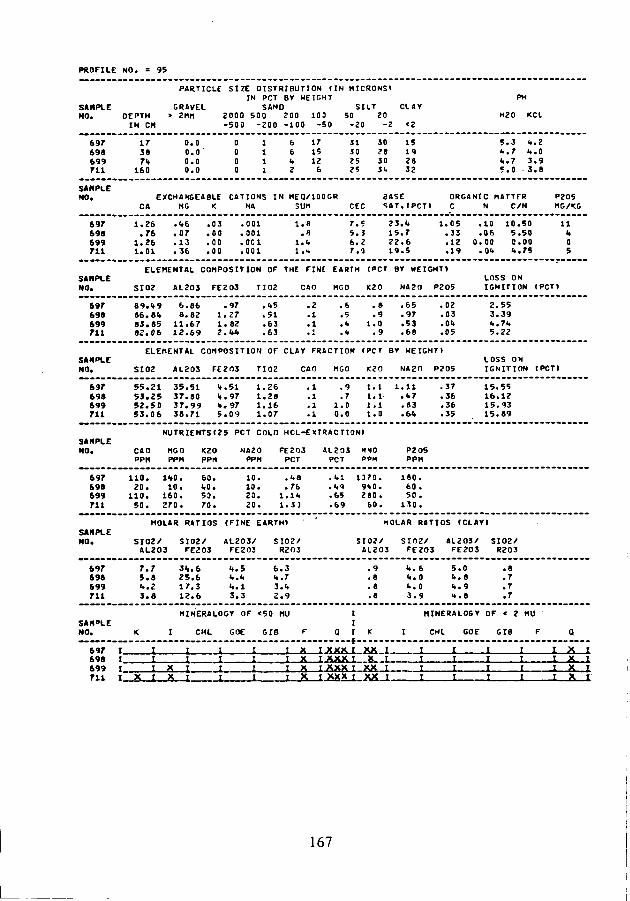
PROFILE NO. = 95
SAMPLENO. DEPTH
IN CM
PARTICLE SIZE DISTRIBUTION (IN HICRONS1IN PCT BY WEIGHT
GRAVEL SAND SILT CLAY> 2MM 2000 500 200 100 50 20
-500 -200 -100 -50 -20 -2 <2
PH
H20 KCL
697 1769« 38699 7W711 160
O.O0.00.00.0
0 10 10 10 1
1715126
31102525
302830
15192832
5.3 •>. 2
b.7
S.O
3.93.8
SAMPLENO. EXCHANGEABLE
CA MG KCATIONS IN MEQ/100GR
NA SUM CECBASESAT.«PCT)
ORGANIC MATTFRC N C/N
P2O5MG/KG
697698699711
1.•
1.1.
26762601
.1.6
.07
.13
.36
.03
.oo
.00
.00
.001
.001
. oct
.001
i.e
l.b
7.5.6.7.
eJ20
23.15.22.19.
ü76S
1.05.33.12.19
.10
.060.00.Ob
1050It
.so
.50
.00
.75
11b05
SAMPLENO.
ELEMENTAL COMPOSITION OF THE FINE EARTH (PCT BY WEIGHT)
SIO2 AL2O3 FE203 TIO2 CAO MGO K2O NA2O P2O5LOSS ONIGNITION (PCT)
697 89.1.9 6.86 .97698 86. Sit 8.82 1.27699 83.85 11.67 1.82711 82.06 12.69 2.lt<t
.It5
.51
.63
.63
.2
.1
.1
.1
.6
.5
.It
.It
. 8
.91.0.9
.65
.97
.53
.68
.02
.03
.01.
.05
23b5
.55
.39
.7b
.22
SAMPLENO.
SAMPLENO.
ELEMENTAL COMPOSITION OF CLAY FRACTION (PCT BY WEIGHT)
SIO2 AL203 FE203 TIO2 CAO MGO K2O NA2d P2O5LOSS ONIGNITION (PCT)
697 55.21 35.51 <t.5i 1.26 .1 .9 1.1 1.11 .37 15.55698 53.25 37.80 b.97 1.28 .1 .7 1.1 .b7 .36 16.12699 52.50 37.99 <t. 97 1.16 .1 1.0 1.1 .83 .36 15.93711 53.06 38.71 5.09 1.07 .1 0.0 1.0 .6b .35 15.89
NUTRIENTS(25 PCT COLD HCL-EXTRACTION)
CAOPPM
MGOPPM
K20PPM
NA2OPPM
FE203PCT
AL2O3 «NOPCT OPM
P2O5PPM
697 110. l bO . 60 . 10. . b 8698 20. 10. 1.0. 10. .76699 110. 160. 53 . 20. 1.1b711 50 . 270. 70. 20. 1.3]
.bi i : ro . lao ..1.9 9*0. 6 0 ..65 280. 5 0 ..69 60. 130.
SAMPLENO.
MOLAR RATIOS (FINE EARTH)
SIO2/ SIO2/ AL2O3/ SIO2/AL203 FE203 FE203 R2O3
HOLAR RATIOS (CLAY)
SI02/ SIO2/ AL2O3/ SIO2/AL2O3 FE2O3 FE2O3 R2O3
697698699711
7.75.8<t.23.8
3I..625.617.312.6
b.5
b. l3.3
6.3b.73.1.2.9
b.6b.Ob.O3.9
5.0b.8b.9b.8
.8
.7
.7
.7
SAMPLENO.
MINERALOGY OF <S0 MU
I CHL GOE GIB F
MINERALOGY OF < 2 MU
CHL GOE GIB F
697 I698 I699 I711 I_X_
I I IJL-H.KK I-A&-I-
I XXX. I JÇI X T
X I XXX I XX II X
T X I XXX 1 XX Ix 1
167
CURRICULUM VITAE
De schrijver van dit proefschrift werd geboren op 5 januari 1943 te Amsterdam.In 1959 behaalde hij het diploma H.B.S. -B aan het Christelijk Lyceum te Arnhem.In hetzelfde jaar werd de studie in de Fysische Geografie aangevangen aan de Rijks-universiteit te Utrecht. Het kandidaatsexamen werd afgelegd in 1963. Het docto-raaldiploma Fysische Geografie met hoofdrichtingen geomorfologie en bodemkundewerd behaald in 1967. Sinds zijn afstuderen is de auteur als wetenschappelijk mede-werker verbonden aan het Geografisch Instituut der Rijksuniversiteit te Utrecht.
168


Map 1 Land systems of Sipaliwini savanna (Suriname) 56°
state boundary
boundary of land unit
airstrip
MorBGrande
Valley Floor landscape (landsystem
Sipaliwini landscape (landsystem
Morro Grande landscape (landsystem I)
Inselberg and inselberg complexes (landsystem IV)
Rainforest scale 1:100.000
Map1, Riezebos (1979) 56° WL Cartography by the Geographical Institute of the State University of Utrecht 1979
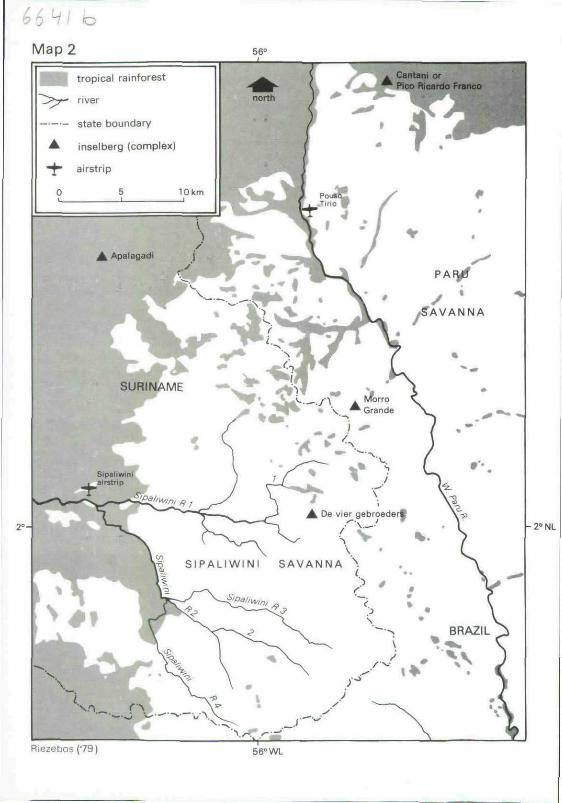
state boundary
inselberg (complex)
airstrip
0 5 10km
SIPALIWINI SAVANNA N.
-2°NL
Riezebos(79| 56-WL