geometric integration of aerial and high-resolution
TRANSCRIPT

Marine Geodesy, 31: 143–159, 2008Copyright © Taylor & Francis Group, LLCISSN: 0149-0419 print / 1521-060X onlineDOI: 10.1080/01490410802265310
Geometric Integration of Aerial andHigh-Resolution Satellite Imagery and Application
in Shoreline Mapping
RONGXING LI,1 SAGAR DESHPANDE,1 XUTONG NIU,2
FENG ZHOU,1 KAICHANG DI,1 AND BO WU1
1Mapping and GIS Laboratory, Department of Civil and EnvironmentalEngineering and Geodetic Science, The Ohio State University, Columbus, Ohio,USA2Department of Math, Physics, Computer Science and Geomatics, TroyUniversity, Troy, Alabama, USA
This paper investigates the geopositioning accuracy achievable from integratingIKONOS and QuickBird satellite stereo image pairs with aerial images acquired over aregion at Tampa Bay, Florida. The results showed that the accuracy is related to a fewfactors of imaging geometry. For example, the geopositioning accuracy of a stereo pairof IKONOS or QuickBird images can be improved by integrating a set of aerial images,even just a single aerial image or a stereo pair of aerial images. Shorelines derivedfrom the IKONOS and QuickBird stereo images, particularly the vertical positions, arecompared with the corresponding observations of water-penetrating LiDAR and watergauge stations and proved that differences are within the limit of the geopositioninguncertainty of the satellite images.
Keywords High-resolution satellite images, aerial images, geometric integration,geopositioning accuracy, shoreline
Introduction
The launch of civilian high-resolution imaging satellites, such as IKONOS and QuickBird,has initiated a new era of Earth observation and digital mapping (Li 1998). During thepast several years, high-resolution satellite imagery (HRSI) has been widely used in digitaltopographic mapping and surveying. HRSI is very attractive, having the advantages ofsub-meter to meter level of resolution, short revisit time, and adaptable stereo imagingcapabilities. These advantages have made HRSI popular for mapping tasks, as well as forcoastal applications (Li 1998; Li et al. 2007; Fraser 1999; Tao et al. 2004). On the otherhand, aerial images have been widely used in high accuracy topographic mapping becauseof their centimeter level of resolution and maturity of the technology. As more imagedata from a variety of sources has become easily available, it is highly desirable to studythe geopositioning accuracy that could be obtained by different combinations of imagery.
Received 19 May 2008; accepted 9 June 2008.Address correspondence to Rongxing Li, Mapping and GIS Laboratory, Department of Civil
and Environmental Engineering and Geodetic Science, The Ohio State University, 470 HitchcockHall, 2070 Neil Avenue, Columbus, OH 43210-1275. E-mail: [email protected]
143
Downloaded By: [Ohio State University Libraries] At: 15:04 26 August 2008

144 R. Li et al.
Combining less costly satellite imagery with traditional aerial images could provide bothpractical and theoretical solutions for selecting image sources for accurate 3-D mapping.
This paper investigates accuracy from the integration of IKONOS, QuickBird, andaerial images using the data collected at Tampa Bay, Florida. The 3-D geopositioningaccuracies for various integration schemes were obtained and analyzed. The integrationresults were used to produce 3-D shorelines from the satellite images, and the results werecompared with the corresponding observations of water-penetrating LiDAR and watergauge stations. Based on the results obtained, discussions and conclusions are presented.
Brief Review of Related Previous Work
For HRSI, many sensor models have been presented to describe the geometricalrelationships between the object space and the image space, including the Rigorous PhysicalModel (RPM) and Rational Function Model (RFM) (Fraser 1999; Tao and Hu 2001; Di et al.2003a; Wang et al. 2005). The RPM for various satellite image products may be unavailable.Instead, vendors may just provide RFMs in the form of rational polynomial coefficients(RPCs). These RFMs describe the orientation information of the high-resolution imagingsystems in an implicit way (Di et al. 2003a; Tao and Hu 2001). Advantages of the RFMinclude computational simplicity, implicitness of physical setting of the imaging system,and independence from sensor types.
The RFM performs a transformation between an image point (i, j) and its correspondingground space point (X, Y, Z) through the ratio of two polynomials
i = P1(X, Y,Z)/P2(X, Y,Z)j = P3(X, Y,Z)/P4(X, Y,Z)
(1)
where the Pi (i = 1, 2, 3, and 4) is a third-order, 20-term polynomial.As a generalized sensor model, the RFM uses the above ratios of polynomials to
represent the relationship between the image coordinates and the object coordinates, whichhave been traditionally represented by the collinearity equations in photogrammetry (Wolfand Dewitt 2000; Di et al. 2003a). Usually, the RPCs in Eq. (1) are not computed usingground control points (GCPs). Instead, virtual control points (VCPs) are created basedon the full extent of the image and the range of elevation variation. The entire rangeof elevation variation is sliced into several layers. Then, the RPCs are calculated by aleast-squares adjustment with these VCPs (Di et al. 2003a; Tao and Hu 2001). Some ofthe bias inherent in the RPCs may not be correctable and will be reflected in the achievedgeopositioning accuracy. A systematic error of 6 m was reported by Li et al. (2003) betweenthe RPC-derived coordinates and the ground truth. A similar result was reported by Fraserand Hanley (2003).
Many researchers have focused on improving the accuracy of HRSI using GCPs. Dial(2000) estimated the stereo mapping accuracy of IKONOS products with GCPs as 1.32m (RMSE) in the horizontal direction and 1.82 m (RMSE) in the vertical direction. Diet al. (2003b) used a 3-D affine transformation model to refine the RPC-derived groundcoordinates for IKONOS images and achieved accuracies of better than 1.5 m in planimetryand 1.6 m in height. Wang et al. (2005) compared the results of different methods withcorrections in both image space and object space to improve IKONOS stereo geopositioningaccuracy. They looked at different transformation models with different GCP distributions,and found that the affine transformation can produce better accuracies when used with
Downloaded By: [Ohio State University Libraries] At: 15:04 26 August 2008

Integration of Aerial and Satellite Images and Application in Shoreline Mapping 145
Table 1Parameters of IKONOS and QuickBird stereo satellite imagery
QuickBird IKONOS
Forward Rear Forward Rear
Acquisition date 2003-09-12 2003-09-12 2004-07-08 2004-07-08Acquisition time
(GMT)15:58:08 15:59:17 16:17:17 16:18:08
Image resolution 0.767 m 0.751 m 1 m 1 mImage size (row ×
column)25776 ×
2755224620 ×
275528484 ×12160
8484 ×12160
Collection azimuth (θ ) 17.7◦ 184.5◦ 40.8◦ 120.1◦
Collection elevation (α) 58.7◦ 59.2◦ 60.8◦ 74.1◦
four to six evenly distributed GCPs. Similar results were found by Niu et al. (2004) inresearch on geopositioning accuracy using QuickBird stereo images where 0.6–1 m levelof accuracy was obtained. Accuracy better than 3 m (RMSE) in the X and Y directions forQuickBird Basic images using limited ground control was reported by Robertson (2003).Noguchi et al. (2004) obtained an accuracy of 0.6 m in planimetry and 0.5 m in heightwhile investigating the geopositioning accuracy of QuickBird stereo images.
In Li et al. (2007), satellite images from different satellite sensors (IKONOS andQuickBird satellite stereo images) were integrated to study the attainable geopositioningaccuracy. The relationship between the satellite-borne pointing geometry and the attainableground accuracy was examined. This research demonstrated that the integration of IKONOSand QuickBird images is feasible and can improve the 3-D geopositioning accuracy usinga proper combination of images. Based on their work, this paper further investigates theattainable 3-D geopositioning accuracy by incorporating aerial images with IKONOS andQuickBird imagery. The methodology adopted and the results obtained are discussed in thefollowing sections.
The IKONOS and QuickBird Images and Ground Control Data
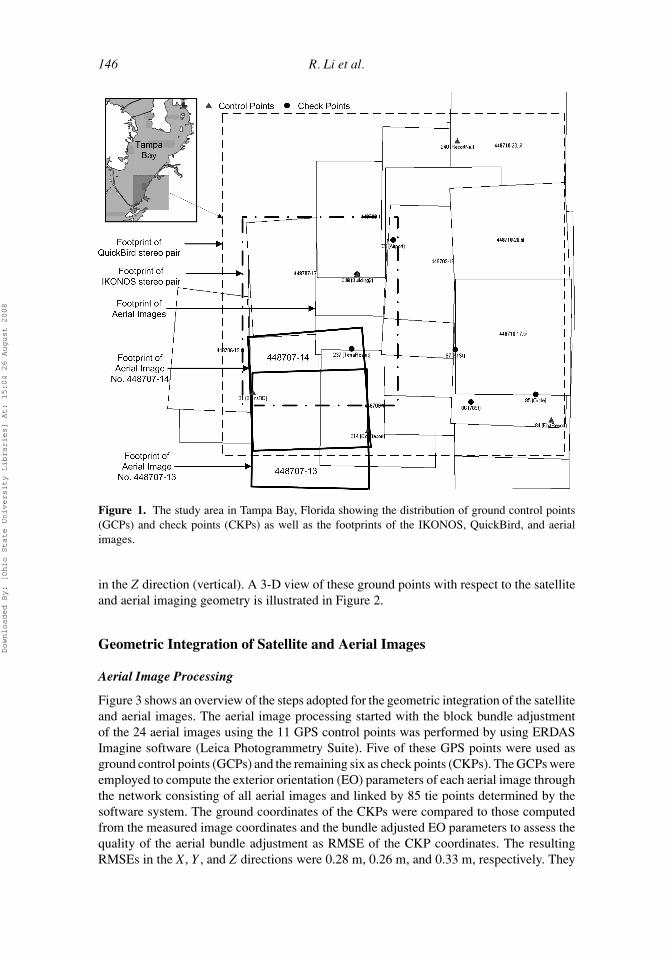
This research examines a block of 24 aerial images, a pair of IKONOS stereo referenceproduct images, and a pair of QuickBird stereo basic product images of the southern part ofTampa Bay, Florida (Figure 1). Aerial images having a ground resolution of 0.25 m wereacquired in February 1998. The QuickBird stereo pair was acquired in September 2003;the IKONOS stereo pair was acquired in July 2004. The QuickBird and aerial images covera larger common area, in which the IKONOS stereo pair covers only half of the area. Theparameters of the images are listed in Table 1. A 3-D illustration of the satellite positions,aerial image exposure centers, and their footprints are given in Figure 2.
Eleven GPS points from a GPS campaign conducted in September 2005 were used inthe present study (triangles and circles in Figure 1). Most of these GPS points were locatedat corners of concrete pavements such that they can be clearly identified and measured inthe images. The points are evenly distributed in the study area in Figure 1. Referenced tothe State Plane Coordinate System (Florida West), the maximum errors of these GPS pointsare 0.014 m in the X direction (easting), 0.017 m in the Y direction (northing), and 0.028 m
Downloaded By: [Ohio State University Libraries] At: 15:04 26 August 2008
146 R. Li et al.
Figure 1. The study area in Tampa Bay, Florida showing the distribution of ground control points(GCPs) and check points (CKPs) as well as the footprints of the IKONOS, QuickBird, and aerialimages.
in the Z direction (vertical). A 3-D view of these ground points with respect to the satelliteand aerial imaging geometry is illustrated in Figure 2.
Geometric Integration of Satellite and Aerial Images
Aerial Image Processing
Figure 3 shows an overview of the steps adopted for the geometric integration of the satelliteand aerial images. The aerial image processing started with the block bundle adjustmentof the 24 aerial images using the 11 GPS control points was performed by using ERDASImagine software (Leica Photogrammetry Suite). Five of these GPS points were used asground control points (GCPs) and the remaining six as check points (CKPs). The GCPs wereemployed to compute the exterior orientation (EO) parameters of each aerial image throughthe network consisting of all aerial images and linked by 85 tie points determined by thesoftware system. The ground coordinates of the CKPs were compared to those computedfrom the measured image coordinates and the bundle adjusted EO parameters to assess thequality of the aerial bundle adjustment as RMSE of the CKP coordinates. The resultingRMSEs in the X, Y , and Z directions were 0.28 m, 0.26 m, and 0.33 m, respectively. They
Downloaded By: [Ohio State University Libraries] At: 15:04 26 August 2008

Integration of Aerial and Satellite Images and Application in Shoreline Mapping 147
Figure 2. Three-dimensional illustration of the aerial image exposure centers and footprints, thesatellite imaging positions, and the positions of the ground control points.
represent a high level of ground accuracy for the points that can be identified and measuredin the aerial images. Their ground coordinate can be precisely computed using the bundleadjusted EO parameters. In fact, some tie points used in the bundle adjustment of the aerialimages were then utilized as CKPs in the subsequent integration process.
In the next step of aerial image processing, RPCs for the aerial images were computedwhich can then be employed in the integration of the aerial images and the satellite images.The RPCs of the aerial images were calculated using the coordinates of the virtual controlpoints (VCPs) that were defined on several planes constructed in the Z direction where aset of 3-D grid points are defined. The image coordinates of the VCPs were determined byusing the interior orientation (IO) and exterior orientation (EO) parameters (Di et al. 2003a).The EO parameters of the aerial images were obtained from the bundle block adjustmentdescribed previously. The end results of aerial image processing were the computed RPCs.
Downloaded By: [Ohio State University Libraries] At: 15:04 26 August 2008

148 R. Li et al.
Figure 3. Workflow of the geometric integration of satellite and aerial images.
Satellite Image Processing
In satellite image processing, the vendor-provided RPCs for the satellite images are usuallycomputed without using GCPs. Therefore, there is a need to use local GCPs to correct theground error (predominantly a shift) that exists in either IKONOS and/or QuickBird data.This is performed by using an affine transformation correction model (Wang et al. 2005) inthe image space and four GCPs:
i ′ = a0 + a1i + a2j
j ′ = b0 + b1i + b2j(2)
where (i, j) and (i′, j′) represent the measured and corrected image coordinates of a GCP.Measured image coordinates of GCPs can be obtained by manually identifying the locationof GCPs on the image. Given 3-D coordinates of a GCP, the corrected image coordinates (i′,j′) can be computed from the vendor-provided RPCs. The affine transformation parametersare represented by a0, a1, a2, b0, b1, and b2 and can thus be estimated by the four GCPs. Thismakes sure that for any point, if its measured image coordinates in a stereo pair are correctedby this affine transformation model, the refined image coordinates of the conjugate imagepoints can be employed to triangulate the ground point with an improved ground accuracy.Consequently, the measured image coordinates of the CKPs in the satellite images wererefined using the computed affine transformation parameters.
Since the CKPs are utilized in assessment of the geometric integration study, theirimage coordinates in the aerial images and refined image coordinates in IKONOS andQuickBird satellite images, as well as the RPCs of these images, were made available forfurther analysis.
Geometric Integration of Satellite and Aerial Images
We studied two types of configurations of geometric integration of satellite and aerialimages. Type I includes one stereo pair of IKONOS images, one stereo pair of QuickBird
Downloaded By: [Ohio State University Libraries] At: 15:04 26 August 2008

Integration of Aerial and Satellite Images and Application in Shoreline Mapping 149
Figure 4. Distribution of GCPs and CKPs used in the integration of satellite and aerial images. Thebackground is the forward-looking QuickBird image.
images, and all 24 aerial images. Type II handles the same satellite images and one singleaerial image (or one stereo pair of aerial images).
Type I Integration. Four evenly distributed GPS control points (marked as a star and threesquares in Figure 4) were used as GCPs for the QuickBird stereo pair. Similarly, fourevenly distributed GPS control points (marked as a star and three triangles in Figure 4)were used as GCPs for the IKONOS stereo pair. Only one common GCP (marked as astar in Figure 4) was found between the IKONOS and QuickBird images due to the evendistribution of control points over the different extent of IKONOS and QuickBird imagepairs. Twenty-seven CKPs were found in the area common to all of the satellite and aerialimages, and they were among the tie points used for an aerial bundle block adjustment. Theirhigh accuracy ground coordinates can be applied to check the geopositioning accuracy ofdifferent integration combinations.
Downloaded By: [Ohio State University Libraries] At: 15:04 26 August 2008

150 R. Li et al.
Table 2Geopositioning accuracy: integration of IKONOS and QuickBird satellite images
with all aerial images
3-D Geopositioning Accuracy(RMSE: meters)
ID Combination σ x σ y σ z
1 IKONOS (S) 0.770 1.241 1.0582 QuickBird (S) 0.919 0.538 0.7533 IKONOS (S) + QuickBird (S) 0.825 0.674 0.6114 Aerial images + IKONOS (S) 0.132 0.172 0.3855 Aerial images + QuickBird (S) 0.248 0.125 0.3466 Aerial images + IKONOS (S) +
QuickBird (S)0.272 0.191 0.359
7 Aerial images 0.108 0.100 0.330
Note: S–stereo.
With all the available images, satellite and aerial, either a stereo pair or a block ofimages (same or different kind) can be formed to determine ground positions of objectsin the object space through RPCs and refined image point measurements. Seven differentcombinations of satellite and aerial images were considered to study the effect of thegeometric integration (Table 2). The CKPs served as the points where the differencesbetween the known coordinates and those computed from each combination were calculatedand the RMSEs were derived. The RMSEs are compared to assess the integration qualityin Table 2 and Figure 5.
From the above experimental result, the following should be noted:
1. The geopositioning accuracy calculated for the QuickBird stereo images is better thanthat for the IKONOS pair; the magnitude of the differences seems to be in accordancewith their resolutions.
2. There is a significant improvement in geopositioning accuracy when all the aerialimages are combined with a single pair of IKONOS or QuickBird images, or both pairs,compared to the cases involving satellite images only.
3. The geopositioning accuracy of all aerial images is the highest. This may be attributedto the high-resolution (0.25 m) and a strong image network. That means that adding anylower resolute satellite images in this case does not help enhance the geopositioningcapability.
Type II Integration. In the Type II integration, only one aerial image (Image ID 448707-13in Figure 1), or one pair of aerial images (Image IDs 448707-13 and 448707-14 in Figure1) was integrated with two pairs of satellite images (IKONOS and/or QuickBird) instead ofall the aerial images. The footprints of the two aerial images are also illustrated in Figure 2.
Based on the results of the Type I integration, one of the objectives is to examineif the geopositioning accuracy can be improved by adding one single aerial image or astereo pair of aerial images to the satellite images. Furthermore, an analysis of the impactof the imaging geometry of a stereo pair of the satellite images should be conducted interms of its convergence angle formed by the two optical rays from the object point to
Downloaded By: [Ohio State University Libraries] At: 15:04 26 August 2008

Integration of Aerial and Satellite Images and Application in Shoreline Mapping 151
Figure 5. RMSE values obtained from seven configurations of IKONOS and QuickBird satelliteimages and all the aerial images.
its corresponding image points. According to our previous research results using only onestereo pair, a weak imaging geometry may be established by a small convergence angle(Li et al. 2007; Niu et al. 2005). Ten CKPs in the area common to the aerial stereo pairand the satellite images were used for this analysis. The RMSEs for each combinationwere calculated by comparing the computed ground coordinates of the CKPs with thoseobtained from the bundle block adjustment. The results obtained are tabulated in Table 3and graphically represented in Figure 6.
Observing the above geometric integration results in Table 3 and Figure 6, the followingshould be noted:
1. The geopositioning accuracy of the satellite images, particularly in the cases of theIKONOS stereo pair and QuickBird stereo pair, is improved by adding one single aerialimage or one pair of stereo aerial images.
2. In most cases, the accuracies of the X and Y coordinates are better than that of the Zcoordinate, even when one single aerial image or one stereo pair of aerial images areadded. This is consistent with the results published previously for cases dealing withsatellite stereo images only (Li et al. 2007).
3. Compared with the integration with one single aerial image, the accuracy obtained fromadding a stereo pair of aerial images to the satellite images is further increased in the Yand Z directions, especially the Y direction (Table 3 and Figure 6b). This improvementis due mainly to the formation of the stereo pair along the Y direction.
4. Small convergence angles of the stereo satellite image pairs appeared to create weakerimaging geometry and result in lower disparities and, subsequently, lower accuracies inthe Z coordinate, particularly for Combination 1 in Table 3 (rear-looking IKONOS andQuickBird images). An exception is for Combination 2 where the minimum convergenceangle of the two satellite images corresponds to the best overall accuracy. This shouldbe interpreted as strengthening the imaging geometry by adding a single or a pair
Downloaded By: [Ohio State University Libraries] At: 15:04 26 August 2008

152 R. Li et al.
Table 3Geopositioning accuracy: integration of IKONOS and QuickBird satellite images with a
single aerial image and a pair of stereo aerial images
3-D Accuracy Addition ofsingle AI (RMSE: meters)
3-D Accuracy Addition ofstereo pair of AI (RMSE:
meters)
IDCombination and
Convergence Angle σ x σ y σ z σ x σ y σ z
1 IKONOS(R)—QuickBird(R) (27.5◦)
0.692 0.819 1.588 0.645 0.192 1.032
2 IKONOS(F)—QuickBird(F) (11.8◦)
0.382 0.364 0.537 0.356 0.265 0.517
3 IKONOS (S)(30.2◦)
0.327 0.763 1.014 0.341 0.423 0.708
4 IKONOS(R)—QuickBird(F) (37.7◦)
0.491 0.443 0.782 0.476 0.276 0.724
5 IKONOS(F)—QuickBird(R) (56.8◦)
0.450 0.622 0.885 0.478 0.348 0.761
6 QuickBird (S)(61.6◦)
0.532 0.425 0.800 0.528 0.259 0.748
Note: S—stereo, F—forward-looking, R—rear-looking, AI—aerial images
of aerial images and their relative positions. In this configuration, the impact of theconvergence angle formed by the two satellite images is decreased by the aerial imagesthat significantly influenced the geometry.
Applications in 3-D Shoreline Extraction and Evaluation
To support coastal applications, the QuickBird and IKONOS stereo image pairs that coverthe shoreline in the study area were employed to extract two 3-D shorelines (one fromeach pair) manually. To evaluate the vertical accuracy of the derived shoreline, bathymetrydata collected by a water-penetrating LiDAR system (NASA’s Experimental AdvancedAirborne Research LiDAR system) and water gauge observations at Port Manatee, Port St.Petersburg, and Port of Tampa along the Tampa Bay area were used for comparison. Thevertical datum for the shoreline is NAVD88. Figure 7 shows the coverage of the IKONOSand QuickBird images and the LiDAR data.
The availability of the LiDAR bathymetry data and gauge data provides a uniqueopportunity to check the quality of the derived shoreline. Figure 8 shows one of the regionswith derived shorelines from the QuickBird and IKONOS images overlaid on the LiDARbathymetry. The legend of the LiDAR bathymetry is also shown in the figure. It can be seenthat, horizontally, the shoreline is well overlaid around the same bathymetry interval (−0.3
Downloaded By: [Ohio State University Libraries] At: 15:04 26 August 2008

Integration of Aerial and Satellite Images and Application in Shoreline Mapping 153
Figure 6. RMSE values obtained from the integration of the satellite images with (a) one aerialimage and (b) a stereo pair of aerial images.
m and −0.2 m). Considering the vertical geopositioning accuracy of QuickBird images of0.75 m and that of IKONOS images of 1.06 m (see Table 2), this is well within the potentialof the satellite images. This consistency was shown along the whole stretch of the derivedshoreline.
Figure 9 shows the comparison between the elevations of the derived shorelines andthe water levels observed at the closest gauge stations at the time when the images weretaken. Observations of three gauge stations were compared to the elevations of the IKONOSshoreline. At the closest gauge station, Port Manatee, only extrapolated water level data areavailable at the imaging time. Therefore, real observations from the two other nearest gauge
Downloaded By: [Ohio State University Libraries] At: 15:04 26 August 2008

154 R. Li et al.
Figure 7. Coverage of LiDAR bathymetry within IKONOS and QuickBird images.
Figure 8. Comparison between derived shorelines and LiDAR bathymetry.
Downloaded By: [Ohio State University Libraries] At: 15:04 26 August 2008

Fig
ure
9.C
ompa
riso
nsbe
twee
nth
eel
evat
ions
ofw
ater
leve
lsat
the
clos
est
gaug
est
atio
nan
dth
esh
orel
ines
deri
ved
from
(a)
Qui
ckB
ird
and
(b)
IKO
NO
Sim
ager
y.(C
onti
nued
)
155
Downloaded By: [Ohio State University Libraries] At: 15:04 26 August 2008

Fig
ure
9.(C
ontin
ued)
156
Downloaded By: [Ohio State University Libraries] At: 15:04 26 August 2008

Tabl
e4
Com
pari
sons
betw
een
shor
elin
eel
evat
ions
and
wat
erle
vels
from
gaug
est
atio
ns
Dat
aSh
orel
ine
Ele
vatio
nA
vera
geSh
orel
ine
Ele
vatio
nSt
.Dev
.W
ater
Lev
elfr
omN
eare
stG
auge
Stat
ion
Dif
fere
nce
inE
leva
tion
Qui
ckB
ird
shor
elin
e−0
.217
m0.
439
mPo
rtM
anat
ee:−
0.01
7m
−0.2
00m
IKO
NO
Ssh
orel
ine
0.28
5m
0.61
5m
Port
Man
atee
:−0.
187
m(e
xtra
pola
ted)
0.47
2m
St.P
eter
sbur
g:−0
.155
m0.
440
mPo
rtof
Tam
pa:−
0.17
3m
0.45
8m
157
Downloaded By: [Ohio State University Libraries] At: 15:04 26 August 2008

158 R. Li et al.
stations, Port St. Petersburg and Port of Tampa, also were used in this comparison to ensurethe quality of the comparison. Table 4 lists some of the statistic values of the comparison.Compared to the corresponding water levels, the IKONOS shoreline is on average 0.5 mhigher and the QuickBird shoreline is on average 0.2 m lower. Both resulting differencesare within the vertical geopositioning accuracies of the IKONOS and QuickBird stereoimages (see Table 2).
Discussion and Conclusions
In this study, stereo pairs of QuickBird and IKONOS satellite images along with 24 aerialimages of the same region were used to examine the geopositioning accuracy for variousgeometric configurations of satellite and aerial images, including an experiment to testwhether a single aerial image and/or a stereo pair of aerial images would help increasethe geometric potential of the satellite images. Based on the results achieved, it can beobserved that the geopositioning accuracy of the integrated IKONOS and QuickBird stereopairs lies between those of the IKONOS and QuickBird stereo pairs, being better than thatof the IKONOS pair, but not better than that of the QuickBird pair. Further, it was foundthat the geopositioning accuracy obtained by integrating four satellite images with all theaerial images is better than that of the satellite images (both single pairs and the integratedpairs) but not better than that of all aerial images alone. Therefore, it can be concluded thatfor the investigated circumstances, the accuracy of stereo images can be improved by theaddition of images acquired by higher resolution sensors (either satellite or aerial). Whatis more interesting is that, instead of all the aerial images, only one single aerial image or asingle stereo pair of aerial images is needed to integrate with the satellite images to achievean improved accuracy.
The imaging geometry and geopositioning potential are affected by many factorsincluding resolution (centimeters to 1 m), orbit elevation (450 km for QuickBird and680 km for IKONOS) or flying height (3.6 km), and convergence angle. The results alsodemonstrated that there is not a clear relationship between the convergence angle of a stereopair and the geopositioning accuracy in this study because of the additional aerial imagesinvolved.
The shorelines derived from the high-resolution satellite images were compared withwater-penetrating LiDAR data and data from the water gauge stations. The results showedthat the derived shorelines, particularly the vertical positions, matched with the coastal datafrom the two types of sensors, within the vertical uncertainty of the high-resolution satelliteimages.
Acknowledgements
The aerial images were provided by the Florida Department of Transportation. The watergauge station observations were provided by the National Oceanic and AtmosphericAdministration. This research has been supported by the National Science Foundationand the National Geospatial-Intelligence Agency.
References
Di, K., R. Ma, and R. Li. 2003a. Rational functions and potential for rigorous sensor model recovery.Photogrammetric Engineering & Remote Sensing 69(1):33–41.
Downloaded By: [Ohio State University Libraries] At: 15:04 26 August 2008
Integration of Aerial and Satellite Images and Application in Shoreline Mapping 159
Di, K., R. Ma, and R. Li. 2003b. Geometric processing of IKONOS Geo stereo imagery for coastalmapping Applications. Photogrammetric Engineering & Remote Sensing 69(8):873–879.
Dial, G. 2000. IKONOS satellite mapping accuracy. Proceedings of ASPRS Annual Convention 2000,May 22–26, Washington, DC, CD-ROM.
Fraser, C. 1999. Status of high-resolution satellite imaging. Photogrammetric Week ‘99, D. Fritschand D. Hobbie (eds), pp. 117–123. Heidelberg: Wichmann Verlag.
Fraser, C. S. and H. B. Hanley. 2003. Bias compensation in rational functions for IKONOS satelliteimagery. Photogrammetric Engineering & Remote Sensing 69(1):53–57.
Li, R. 1998. Potential of high-resolution satellite imagery for national mapping products.Photogrammetric Engineering & Remote Sensing 64(2):1165–1169.
Li, R., F. Zhou, X. Niu, and K. Di. 2007. Integration of IKONOS and QuickBird imageryfor geopositioning accuracy analysis. Photogrammetric Engineering & Remote Sensing73(9):1067–1074.
Li, R., K. Di, and R. Ma. 2003. 3-D shoreline extraction from IKONOS satellite imagery. The 4thSpecial Issue on Marine & Coastal GIS, Journal of Marine Geodesy 26(1/2):107–115.
Niu, X., F. Zhou, K. Di, and R. Li. 2005. 3-D Geopositioning accuracy analysis based on integrationof QuickBird and IKONOS imagery. Proceedings of the ISPRS Workshop for High ResolutionEarth Imaging for Geospatial Information, May 17–20, Hannover, Germany.
Niu, X., K. Di, J. Wang, J. Lee, and R. Li. 2004. Geometric modelling and photogrammetric processingof high-resolution satellite imagery. Proceedings of the XXth Congress of the InternationalSociety for Photogrammetry and Remote Sensing (ISPRS 2004), July 12–23, Istanbul, Turkey,unpaginated CD-ROM.
Noguchi, M., C. S. Fraser, T. Nakamura, T. Shimono, and S. Oki. 2004. Accuracy assessment ofQuickBird stereo imagery. The Photogrammetric Record 19(106):128–137.
Robertson, B. 2003. Rigorous geometric modeling and correction of QuickBird imagery. Proceedingsof the International Geoscience and Remote Sensing IGARSS 2003, July 21–25, Toulouse,France, (Toulouse: CNES), unpaginated CD-ROM.
Tao, C. V. and Y. Hu. 2001. A comprehensive study of the rational function model for photogrammetricprocessing. Photogrammetric Engineering & Remote Sensing 67(12):1347–1357.
Tao, C. V., Y. Hu, and W. Jiang. 2004. Photogrammetric exploitation of IKONOS imagery for mappingapplications. International Journal of Remote Sensing 25(14):2833–2853.
Wang, J., K. Di, and R. Li. 2005. Evaluation and improvement of geopositioning accuracy of IKONOSstereo imagery. ASCE Journal of Surveying Engineering 131(2):35–42.
Wolf, P. R. and B. A. Dewitt. 2000. Elements of photogrammetry with applications in GIS (3rdedition). McGraw-Hill Science Engineering, 608 p.
Downloaded By: [Ohio State University Libraries] At: 15:04 26 August 2008