geometric data analysis introduction to data sciencemat6480w.guywolf.org/slides/t01 -...
TRANSCRIPT

Geometric Data Analysis
Introduction to Data Science
MAT 6480W / STT 6705V
Universite de MontrealFall 2019
MAT 6480W (Guy Wolf) Introduction UdeM - Fall 2019 1 / 19

Outline
1 What is Data Science?From data to informationPredictive vs. descriptive informationSupervised vs. unsupervised learning
2 Data Analysis TasksClassification & regressionClustering & anomaly detectionAssociation rules & sequential patternsVisualization & dimensionality reduction
3 Data Analysis Process
4 Software for Data Analysis
MAT 6480W (Guy Wolf) Introduction UdeM - Fall 2019 2 / 19

Optional textbooks on data mining
MAT 6480W (Guy Wolf) Introduction UdeM - Fall 2019 3 / 19

What is data science?Data MiningNon-trivial extraction of useful,new, hidden, and/or implicit infor-mation from data.
Deep LearningA set of algorithms that attemptto model high-level data abstrac-tions in data by using multiple pro-cessing layers, composed of multi-ple linear and non-linear transfor-mations.
Machine LearningField of study that gives computersthe ability to learn without beingexplicitly programmed.
Big DataExtremely large data sets that maybe analyzed computationally to re-veal patterns, trends, and associa-tions, especially relating to humanbehavior and interactions.
Related terms: knowledge discovery in databases (KDD), patternrecognition, data warehousing, OLAP, ETL, IT, etc.
MAT 6480W (Guy Wolf) Introduction UdeM - Fall 2019 4 / 19

What is data science?
MAT 6480W (Guy Wolf) Introduction UdeM - Fall 2019 4 / 19

What is data science?
MAT 6480W (Guy Wolf) Introduction UdeM - Fall 2019 4 / 19

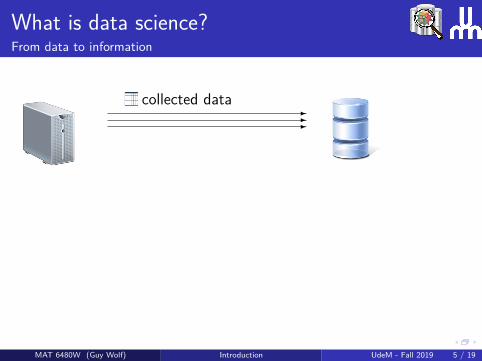
What is data science?From data to information
collected data----
��
��
⊆ RO(100+)
MAT 6480W (Guy Wolf) Introduction UdeM - Fall 2019 5 / 19

What is data science?From data to information
collected data-
---
��
��
⊆ RO(100+)
MAT 6480W (Guy Wolf) Introduction UdeM - Fall 2019 5 / 19

What is data science?From data to information
collected data-
---
��
��
⊆ RO(100+)
MAT 6480W (Guy Wolf) Introduction UdeM - Fall 2019 5 / 19

What is data science?From data to information
collected data--
--
��
��
⊆ RO(100+)
MAT 6480W (Guy Wolf) Introduction UdeM - Fall 2019 5 / 19
What is data science?From data to information
collected data---
-
��
��
⊆ RO(100+)
MAT 6480W (Guy Wolf) Introduction UdeM - Fall 2019 5 / 19

What is data science?From data to information
collected data----
��
��
⊆ RO(100+)
MAT 6480W (Guy Wolf) Introduction UdeM - Fall 2019 5 / 19

What is data science?From data to information
collected data----
��
��
⊆ RO(100+)
MAT 6480W (Guy Wolf) Introduction UdeM - Fall 2019 5 / 19

What is data science?From data to information
collected data----
��
��
⊆ RO(100+)
MAT 6480W (Guy Wolf) Introduction UdeM - Fall 2019 5 / 19

What is data science?From data to information
collected data----
��
��
⊆ RO(100+)
MAT 6480W (Guy Wolf) Introduction UdeM - Fall 2019 5 / 19

What is data science?From data to information
Examples of data mining / analysis tasks:Recommend movies on Netflix or books on Amazon.Object recognition in images and automatic image taggingCommunity detection in social networks (e.g., Facebook)Automatic medical diagnosis and treatment recommendation
Examples of data processing tasks that do not require data mining:Signature-based anti-virusRetrieving details from a contact listText-based search in a document or on the webQuicksort, balanced trees, heaps, etc.
MAT 6480W (Guy Wolf) Introduction UdeM - Fall 2019 6 / 19

What is data science?Predictive vs. descriptive methods
Predictive methodsPredict unknown information from known data.
How much would my house sell for, based on sales stats?Will Bob like Ghostbusters, based on his Netflix history?
Descriptive methodsInfer or extract interpretable patterns to describe data.
What consumer profiles should my ads target?If Jim’s card is trying to charge $300 in a Disney store today, isit reasonable or a fraud?
MAT 6480W (Guy Wolf) Introduction UdeM - Fall 2019 7 / 19

What is data science?Supervised vs. unsupervised learning
Machine learning data analysis tasks are roughly divided into:
Supervised learningInferring information from labeled training data.
Unsupervised learningFinding hidden patterns in unlabeled data.
Semi-supervised learningCombine information from labeled and unlabeled data to model anddeduce information.
MAT 6480W (Guy Wolf) Introduction UdeM - Fall 2019 8 / 19

Data analysis tasksClassification
ClassificationClassify “items” into a finite set of classes, or “categories”.
Training phaseLabeled data:︷ ︸︸ ︷
{(x1, `1), . . . , (xn, `n)} ⊂ X × L Z⇒
Classification model:︷ ︸︸ ︷F : X → L, F (xi) = `i |L| <∞
Testing phaseNew data:︷ ︸︸ ︷
y1, y2, . . . ∈ X 7→ classification model Z⇒Classification result:︷ ︸︸ ︷
F (y1), . . . , F (yn) ∈ L
MAT 6480W (Guy Wolf) Introduction UdeM - Fall 2019 9 / 19

Data analysis tasksClassification - examples
Example (MNIST digit classification)
MAT 6480W (Guy Wolf) Introduction UdeM - Fall 2019 10 / 19

Data analysis tasksClassification - examples
Example (CalTech 101 image classification)
Anchor Joshua-Tree Beaver Lotus Water-Lily
MAT 6480W (Guy Wolf) Introduction UdeM - Fall 2019 10 / 19

Data analysis tasksRegression
RegressionCompute (or infer) the value of a (piecewise) continuous functionfrom a finite number of sampled “items” & values.
This task is similar to classification, but here the model F can havean infinite range (e.g., R or [0, 1]).
ExamplesMarket pricing of a house/apartment/car based on its features.Trend line & model fitting from collected experimental data.Weather predictions, such as temperature and probability ofrain/snow.Confidence rating in diagnostics (or binary classifier).
MAT 6480W (Guy Wolf) Introduction UdeM - Fall 2019 11 / 19
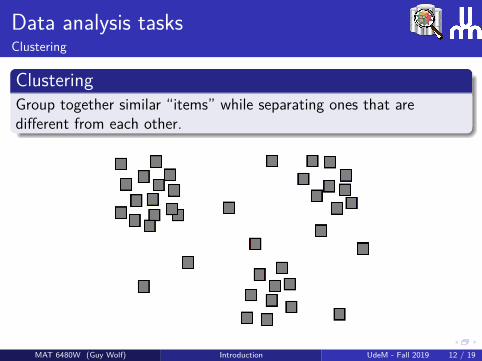
Data analysis tasksClustering
ClusteringGroup together similar “items” while separating ones that aredifferent from each other.
MAT 6480W (Guy Wolf) Introduction UdeM - Fall 2019 12 / 19

Data analysis tasksClustering
ClusteringGroup together similar “items” while separating ones that aredifferent from each other.
MAT 6480W (Guy Wolf) Introduction UdeM - Fall 2019 12 / 19

Data analysis tasksClustering
ClusteringGroup together similar “items” while separating ones that aredifferent from each other.
The quality of obtained clusters stems from their interpretability.Variations include known or unknown number of cluster number, aswell as multiscale hierarchical clustering structures.
ExamplesClustering stocks to diversify stock market investmentCommunity detection in social networks by clustering profilesClustering genes and cells to uncover activities, reactions, andinteractions.Network activity profiling by clustering packets/sessions.
MAT 6480W (Guy Wolf) Introduction UdeM - Fall 2019 12 / 19

Data analysis tasksAnomaly detection
Anomaly/outlier detectionDetect significant deviations from normal behavior expressed byinferred data patterns.
The notion of “normal behavior” can be defined in several ways, suchas clustering or model fitting.
ExamplesFraud detection in credit cardsIntrusion detection in cybersecurityDetecting bot traffic in online advertisingMalfunction detection in process monitoring
MAT 6480W (Guy Wolf) Introduction UdeM - Fall 2019 13 / 19

Data analysis tasksAssociation rules
Association rule discoveryProduce dependency rules that model input coocurrences of “items”to predict, given a partial “transaction”, the remaining “items” in it.
Training phaseObserved transactions:︷ ︸︸ ︷T1, . . . , Tn ⊆ X Z⇒
Association rules:︷ ︸︸ ︷F : 2X → 2X , T ⊆ Ti 7→ F (T ) ≈ Ti \ T
Testing phasePartial transactions:︷ ︸︸ ︷S1, S2, . . . ⊆ X 7→ association rules Z⇒
Predicted information:︷ ︸︸ ︷∀i , Si 7→ F (Si) ⊆ X \ Si
MAT 6480W (Guy Wolf) Introduction UdeM - Fall 2019 14 / 19

Data analysis tasksAssociation rules
Association rule discoveryProduce dependency rules that model input coocurrences of “items”to predict, given a partial “transaction”, the remaining “items” in it.
ExamplesActive advertisements & recommendations (e.g., “Users wholiked/bought this product also liked/bought that product”)Support decision making on shelve organization stores &supermarketsName completions in emails, social networks, etc.
Unlike classification, the actual testing phase is often less importantthan the discovered rules in this case.
MAT 6480W (Guy Wolf) Introduction UdeM - Fall 2019 14 / 19

Data analysis tasksSequential patterns
Sequential pattern discoveryGiven a set of ordered event sequences, produce rules to predictunknown/missing/future events from prior and/or subsequent events.
Similar in some sense to association rule discovery, but with an orderor timeline aspect to each transaction.
ExamplesString mining:
Natural language processingGene sequencing in DNA and RNA
Frequent item purchase sequencesPredicting outcomes of medical treatment
MAT 6480W (Guy Wolf) Introduction UdeM - Fall 2019 15 / 19

Data anlysis tasksDimensionality reduction & visualization
Dimensionality reductionFind low dimensional coordinates (e.g., in Rd with d < 10) torepresent “items”.
Used as a helpful, sometimes critical, preprocessing step to alleviatedata analysis challenges arising from the curse of dimensionality.
VisualizationFind human interpretable 2D or 3D representations of the data viaelements, patterns, trends, structures, etc., in it.
Used to enable manual data processing and enable a human user todraw conclusions, support decision making, or guide further dataexploration, from the data.
A combination of these techniques can help create interactive dataprocessing algorithms that utilize unsupervised descriptive elementsto request and enable human input, and then use semi-supervisedpredictive approaches to produce stronger results.
MAT 6480W (Guy Wolf) Introduction UdeM - Fall 2019 16 / 19

Data anlysis tasksDimensionality reduction & visualization
Dimensionality reductionFind low dimensional coordinates (e.g., in Rd with d < 10) torepresent “items”.
VisualizationFind human interpretable 2D or 3D representations of the data viaelements, patterns, trends, structures, etc., in it.
A combination of these techniques can help create interactive dataprocessing algorithms that utilize unsupervised descriptive elementsto request and enable human input, and then use semi-supervisedpredictive approaches to produce stronger results.
MAT 6480W (Guy Wolf) Introduction UdeM - Fall 2019 16 / 19

Data anlysis tasksDimensionality reduction & visualization - example
Modeling lip motions in speech:
MAT 6480W (Guy Wolf) Introduction UdeM - Fall 2019 17 / 19

Data anlysis tasksDimensionality reduction & visualization - example
Modeling lip motions in speech:
Dominating parameters: lips opening and teeth showing
MAT 6480W (Guy Wolf) Introduction UdeM - Fall 2019 17 / 19

Data anlysis tasksDimensionality reduction & visualization - example
Modeling lip motions in speech:
MAT 6480W (Guy Wolf) Introduction UdeM - Fall 2019 17 / 19

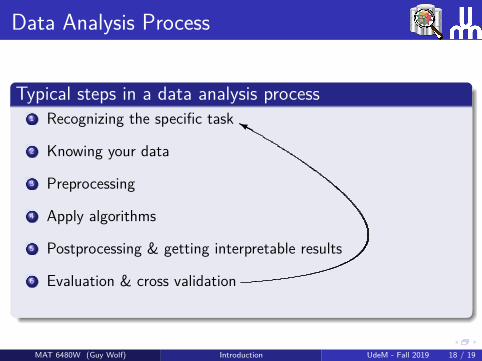
Data Analysis Process
Typical steps in a data analysis process1 Recognizing the specific task
2 Knowing your data
3 Preprocessing
4 Apply algorithms
5 Postprocessing & getting interpretable results
6 Evaluation & cross validation
MAT 6480W (Guy Wolf) Introduction UdeM - Fall 2019 18 / 19

Data Analysis Process
Typical steps in a data analysis process1 Recognizing the specific task
2 Knowing your data
3 Preprocessing
4 Apply algorithms
5 Postprocessing & getting interpretable results
6 Evaluation & cross validation
Pi
MAT 6480W (Guy Wolf) Introduction UdeM - Fall 2019 18 / 19
Data Analysis Process
Typical steps in a data analysis process1 Recognizing the specific task
2 Knowing your data
3 Preprocessing
4 Apply algorithms
5 Postprocessing & getting interpretable results
6 Evaluation & cross validation
HY
MAT 6480W (Guy Wolf) Introduction UdeM - Fall 2019 18 / 19

Software for Data Analysis
Software recommended in this course:MatlabPython (with numpy, scipy, scikit-learn)
Other software:R (especially popular in statistics)Scilab & Octave (can be used in lieau of Matlab)C/C++, Java, & C# (.Net)WekaFortran (sometimes still used in numerical analysis)Many other scripting and programming platforms
MAT 6480W (Guy Wolf) Introduction UdeM - Fall 2019 19 / 19