geometric control of tissue growth and …
TRANSCRIPT
Max-Planck-Institut für Kolloid- und Grenzflächenforschung
Biomaterialien
***
Potsdam Universität
GEOMETRIC CONTROL OF TISSUE GROWTH AND ORGANISATION
von
Cécile Bidan
Dissertation
zur Erlangung des akademischen Grades
"doctor rerum naturalium"
(Dr. rer. nat.)
in der Wissenschaftsdisziplin “Physik”
eingereicht an der
Mathematisch-Naturwissenschaftlichen Fakultät
der Universität Potsdam
Potsdam, Oktober 2012

1
Abstract
Tissue formation is a key process for the genesis and the maintenance of our organs. As in
morphogenesis, wound healing and bone remodelling, the various tissues of our body are
continuously modelled, remodelled and repaired by the cells. Even if these biological processes are
encoded in genetics, the biochemical composition and the physical cues of the surroundings also play
a major role in tissue formation and enable cells to adapt their activity in response to external stimuli.
For example, muscle and bone formation is enhanced in individuals practicing physical activities. On
the other hand, a failure in the balance of bone remodelling can impair the mechanical function of the
organ like in osteoporosis. Understanding how tissue formation is controlled is thus determining to
clarify many biological processes and their associated pathologies.
The geometrical features of organs like bones are generally conserved despite a continuous
remodelling. As geometry also sets the boundary conditions for the mechanical environment that cells
respond to, geometry has been proposed as a potential cue controlling tissue formation. This physical
parameter has been shown to influence biological mechanisms at the sub-cellular, cellular and multi-
cellular levels, but only a little is known about the tissue scale. This thesis aims therefore at
understanding how the geometry of a substrate influences the deposition and organisation of tissue.
Osteoblasts were cultured to grow bone tissue in three-dimensional hydroxyapatite scaffolds in-vitro.
In parallel, the hypothesis that geometry locally influences tissue deposition on a surface was
implemented into a computational model of curvature-driven growth. Comparing the experimental
and simulated growth patterns not only confirmed the relevance of the geometrical model to describe
quantitatively tissue growth on complex surfaces, but also proved that faster tissue formation can be
obtained by optimising the geometry of the substrate.
Moreover, a simple construction assembling tensile elements that represent elongated contractile cells
– the chord model – was demonstrated to be equivalent to the curvature-driven growth simulation. A
qualitative analysis of cells organisation in the tissue supported the biological relevance of this
geometrical model. Extending the structural investigations to the extracellular matrix further clarified
the mechanisms involved in tissue patterning and organisation. For example, the tension built by the
cells was shown to be essential for organising the fibronectin and collagens fibres and more generally
for the mechanical stability of the tissue.
Finally, a computational model of growth driven by the mean curvature of the three-dimensional
surface was proposed to better describe the current experimental system and inspire future
investigations to evaluate the effects of the third dimension.
Understanding how geometry is involved in tissue formation will not only benefit to biomedical
research but will also profit to tissue engineering.
2
Zusammenfassung
Gewebsbildung ist ein wichtiger Prozess für die Entstehung und Aufrechterhaltung unserer Organe.
Die verschiedenen Gewebe unseres Körpers werden kontinuierlich von Zellen aufgebaut, umgebaut
und repariert, beispielsweise während Morphogenese, Wundheilung oder Knochenumbau. Obwohl
diese biologischen Prozesse genetisch codiert sind, spielen auch die biochemische Zusammensetzung
und die physikalischen Eigenschaften der Umgebung eine wichtige Rolle bei der Gewebebildung und
ermöglichen den Zellen, ihre Aktivität den externen Anforderungen anzupassen. Beispielsweise
werden Muskel- und Knochenaufbau durch sportliche Aktivitäten verstärkt. Andererseits können
Fehler im Gleichgewicht des Knochenumbaus die mechanische Funktion des Organs beschädigen,
etwa bei Osteoporose. Indem wir verstehen, wie Gewebewachstum gesteuert wird, können wir viele
biologische Prozesse und damit verbundene Krankheiten besser erklären.
Trotz des kontinuierlichen Umbaus bleiben die geometrischen Eigenschaften von Organen wie etwa
Knochen grundsätzlich erhalten. Geometrie wurde deswegen als ein mögliches Signal für die
Kontrolle der Gewebsbildung vorgeschlagen. Es wurde bereits gezeigt, dass dieser physikalische
Parameter biologischen Mechanismen auf subzellulärer, zellulärer und mehrzelliger Ebene
beeinflussen kann. Über die Rolle von Geometrie auf der Gewebeskala ist jedoch bis jetzt nur ein
wenig bekannt. Diese Arbeit zielt daher darauf ab zu verstehen, wie die Geometrie eines Substrats die
Bildung und Organisation von Knochengewebe beeinflusst.
Osteoblasten wurden kultiviert, um Knochengewebe im dreidimensionalen Gerüsten aus
Hydroxyapatit in-vitro wachsen zu lassen. Parallel dazu wurde die Hypothese „die Geometrie einer
Oberfläche beeinflusst die lokale Gewebsbildung“ in ein Rechenmodell für krümmungsabhängiges
Wachstum umgesetzt. Ein Vergleich der experimentellen und simulierten Wachstumsmuster zeigt
nicht nur die Relevanz des geometrischen Modells für die quantitative Beschreibung des
Gewebewachstums auf komplexen Oberflächen, sondern auch, dass durch Optimierung der
Geometrie des Substrats eine schnellere Gewebebildung erzielt werden kann.
Außerdem wurde mathematisch bewiesen, dass ein einfaches Anlagern linearer dehnbarer Elemente,
die für längliche kontraktile Zellen stehen - das sogenannte Sehnenmodell - äquivalent zu
krümmungsabhängigem Wachstum ist. Eine qualitative Analyse der Zellorganisation im Gewebe
unterstützt die biologische Relevanz dieses geometrischen Modells. Eine Ausweitung der
strukturellen Untersuchungen auf die extrazelluläre Matrix hat zusätzliche Erkenntnisse zu den
Mechanismen geliefert, die an der Gewebestrukturierung und -organisation beteiligt sind.
Beispielsweise wurde gezeigt, dass die mechanische Spannung, die durch die Zellen aufgebaut wird,
essentiell für die Organisation der Fibronektin und Kollagenfasern und ganz allgemein für die
mechanische Stabilität des Gewebes ist.
Schließlich wurde ein Computermodell des Wachstums in Abhängigkeit von der mittleren Krümmung
der dreidimensionalen Oberfläche vorgeschlagen, um das aktuelle experimentelle System besser zu
beschreiben und um zukünftige Untersuchungen über den Einfluss der dritten Dimension zu
motivieren.
Ein besseres Verständnis, wie Geometrie an der Gewebsbildung beteiligt ist, ist nicht nur interessant
für die biomedizinische Forschung, sondern ist auch eine wichtige Inspirationsquelle für Tissue
Engineering.

3
Table of Contents
Abstract ................................................................................................................................... 1
Zusammenfassung ........................................................................................................................... 2
Table of Contents ............................................................................................................................ 3
Introduction ................................................................................................................................... 7
Motivation ..................................................................................................................................... 7
Objectives ..................................................................................................................................... 8
Outline .......................................................................................................................................... 9
Chapter 1.
The physics of tissue patterning and extracellular matrix organisation: How cells join forces .. 11
Abstract ....................................................................................................................................... 11
Introduction ................................................................................................................................. 12
Single cell behaviour ................................................................................................................... 12
Multicellular behaviour................................................................................................................ 15
Theoretical Modelling ................................................................................................................. 19
Conclusions / Outlook ................................................................................................................. 27
Transition to Chapter 2................................................................................................................... 30
Chapter 2.
How linear tension converts to curvature: Geometric control of bone tissue growth ................. 31
Abstract ....................................................................................................................................... 31
Introduction ................................................................................................................................. 32
Material and methods .................................................................................................................. 34
Results ........................................................................................................................................ 38
A “chord model” to explain curvature-controlled tissue growth .................................................... 40
Discussion ................................................................................................................................... 45
Transition to Chapter 3................................................................................................................... 50

Table of Contents
4
Chapter 3.
Geometry as a factor for tissue growth: Towards shape optimization of tissue engineering
scaffolds ................................................................................................................................. 51
Abstract ....................................................................................................................................... 51
Introduction ................................................................................................................................. 52
Experimental Section ................................................................................................................... 53
Results ........................................................................................................................................ 56
Discussion ................................................................................................................................... 61
Conclusion .................................................................................................................................. 67
Transition to Chapter 4................................................................................................................... 68
Chapter 4.
Bone tissue organisation: cells, fibronectin, collagen, who’s first? .............................................. 69
Abstract ....................................................................................................................................... 69
Introduction ................................................................................................................................. 70
Materials and methods ................................................................................................................. 72
Results ........................................................................................................................................ 74
Discussion ................................................................................................................................... 82
Chapter 5.
General discussion ......................................................................................................................... 89
Back to the objectives .................................................................................................................. 89
Exploration in the third dimension ............................................................................................... 89
Directions of research .................................................................................................................. 94
Implications of the study .............................................................................................................. 97
Conclusions ............................................................................................................................... 100
Outlooks ............................................................................................................................... 101
Appendices ............................................................................................................................... 103
Table of Contents
5
Appendix A. A three-dimensional model for tissue deposition on complex surfaces ............... 105
Abstract ..................................................................................................................................... 105
Introduction ............................................................................................................................... 106
Methods .................................................................................................................................... 108
Results ...................................................................................................................................... 111
Discussion ................................................................................................................................. 118
Conclusions ............................................................................................................................... 124
Supplementary Material ............................................................................................................. 126
Appendix B. Supplementary Material – Chapter 2 .................................................................. 129
1. Precision of curvature measurements on digital images .......................................................... 129
2. The computational implementation of curvature-controlled tissue growth and the chord model are
equivalent .................................................................................................................................. 129
Appendix C. Supplementary Material – Chapter 3 .................................................................. 134
1. Definition of the geometrical descriptors ................................................................................ 134
2. Three types of geometries ...................................................................................................... 135
Appendix D. Confocal Laser Scanning Microscopy and Multiphoton and
Autofluorescence/SHG Microscopy .................................................................................... 141
1. Confocal Laser Scanning Microscope .................................................................................... 141
2. Fluorescence .......................................................................................................................... 142
3. Multiphoton microscopy ........................................................................................................ 143
4. Second Harmonic Generation (SHG) ..................................................................................... 144
Appendix E. Preliminary results from the three-dimensional analysis of the tissue................ 145
1. Optical sectioning by confocal micrscopy .............................................................................. 145
2. A Computational tool for fibre analysis .................................................................................. 147
3. Sectioning soft scaffolds ........................................................................................................ 148
4. A potential chord model in three dimensions .......................................................................... 151
Appendix F. Tissue culture on hydroxyapatite scaffolds with other types of cells .................. 152
1. Fibroblast cell line: NIH3T3 .................................................................................................. 152
2. hMSCs .................................................................................................................................. 153
References ............................................................................................................................... 155
List of Figures .............................................................................................................................. 178
Acknowledgments ........................................................................................................................ 180
Curriculum Vitae ........................................................................................................................ 182
Erklärung ............................................................................................................................... 185


7
Introduction
Motivation
Interestingly, a healthy bone that has been continuously remodelled and a fractured bone that has been
healed look alike. Indeed, apart from local differences and despite the various genetic and external
factors that may influence the development and adaptation of the skeleton, the form and the
organisation of the bones are surprisingly conserved. In general, it is fascinating to consider how
controlled the shapes of tissues forming different organs are over a lifetime and throughout a
population (Thompson and Bonner 1992).
During morphogenesis, the embryo is pretty much isolated from the surroundings. The control of the
initial tissue development and organ patterning is therefore largely attributed to genetics (Metzger
1999; Lohmann and Weigel 2002). As a result, most of organ malformations occurring at that stage of
growth are due to genetic defects either inherited or coming from mutation (Basson et al. 1994;
Guerrini and Marini 2006; Niziolek et al. 2011).
After completing growth, some tissues of the human body are continuously renewed and/or have the
ability to regenerate after loss or damage. In contrast to morphogenesis, these regenerative processes
occur in organisms that live in and adapt to diverse open environments (Fratzl and Weinkamer 2007).
Even if the causes and the characteristics of tissue loss are variable, the biological mechanisms
triggered for regeneration are highly controlled and lead to reproducible tissue patterns.
Skin, liver and bone are three types of tissues that are naturally renewed. Bone is certainly the most
striking one since it continuously undergoes a remodelling process (Riggs and Parfitt 2005) that
progressively renews the whole skeleton within 5 to 10 years on average and enables total fracture
healing without scar (Parfitt 1994; Stroncek and Reichert 2008). In such cases, the initial shapes of the
substrates where tissue is deposited are rather arbitrary but the geometrical features of the final bone
are still conserved up to the organ level (Jinnai et al. 2002a). In addition, bone can adapt itself to its
mechanical environment through mechanosensing of cells embedded within the mineralized tissue
(Bonewald and Johnson 2008). Well-known examples of such adaptation can be seen in the bone loss
caused by low gravity (Carmeliet et al. 2001) and a gain in bone mass resulting from physical exercise
(Shapiro 2008). In pathologies like osteoporosis or osteopetrosis, an imbalance in the remodelling
process leads to the loss or the gain of bone material respectively, and affects both the mechanical and
the functional properties of the organ (Jämsä et al. 2002; Misof et al. 2012).
Organs are made of tissues containing cells and extracellular components embedded in a gel of
proteoglycans. Fibronectin and collagen are the two main fibrous proteins synthesised by the cells and
ensure the mechanical properties of the extracellular matrix (ECM) (Frantz et al. 2010). In bone, the
orientation of the collagen fibres together with the incorporation of hydroxyapatite particles, give

Introduction
8
outstanding properties to this biological material (Weiner and Wagner 1998; Wagermaier et al. 2006;
Seto et al. 2008). How cells produce and organise the ECM before tissue mineralisation thus
influences the final properties of the hard tissue.
Even if extensive studies have shown that many cascades of biological signals initiate and regulate
tissue synthesis by the cells (Schlessinger 2000; Ben-Shlomo et al. 2003; Schmierer and Hill 2007),
the control of cell organisation on large distances by biochemical factors alone is unlikely. However,
surrounding physical cues such as stiffness, are now recognised to determine biological responses of
single cells (Vogel and Sheetz 2006) as well as cell organisation and tissue patterning
(Kollmannsberger et al. 2011). As mechanics is often involved in such signalling it is necessary to
consider the boundary conditions. Otherwise stated, the shape and arrangement of the physical
environment also need to be taken into account when investigating the impact of mechanical cues on
cell and tissue behaviour. This is of course fundamental for understanding the formation of biological
materials, which would add knowledge to the field of biomedical research, but also profit to tissue
engineering applications. Surprisingly, the influence of topography and patterning has been studied on
single cells (Théry et al. 2006; Kulangara and Leong 2009) but not much at the multicellular level
(Nelson et al. 2005; Ruiz and Chen 2008) and hardly at the tissue scale. The present thesis focuses
therefore on this particular physical parameter and investigates how the geometry of a substrate
controls tissue growth and organisation.
Objectives
The geometric control of tissue growth is a major topic, which has been recently addressed by Monika
Rumpler, John Dunlop and co-workers (2008). Hydroxyapatite scaffolds containing straight sided
pores of controlled geometries in the millimetre range were produced by rapid prototyping (Woesz et
al. 2005) and incubated with tissue producing cells (MC3T3-E1 pre-osteoblasts). For the first time,
tissue growth could be monitored and quantified in individual pores. The results revealed that cells
deposited more tissue in the corners, while the total amount of tissue produced in the pores was
independent of the geometry. Moreover, they highlighted that this behaviour qualitatively compares to
a simple model of curvature-driven growth.
This doctoral thesis extends the first experiments of Rumpler et al. (2008) by developing further the
in-vitro tissue culture system as well as the curvature-driven growth model they proposed, with the
aim to explore three major questions:
- Can the kinetics and patterning of tissue growth be quantitatively predicted using the model
of curvature-driven growth?
- What is an optimal pore shape for promoting tissue growth?
- Which mechanisms justify that such a simple geometric model describes such a complex
biological process?

Introduction
9
The work accomplished to address these questions consists of tightly coupled tissue culture
experiments and computational modelling. Because the experimental system involves MC3T3-E1 pre-
osteoblasts, most of the discussions focus on bone tissue. Nevertheless, the models provided
throughout the study may also be useful in other fields of medical research.
Outline
The bulk of the thesis is made up of four papers: two published, one accepted and one in preparation.
The first paper is a literature review of experimental and computational studies clarifying the role of
physics in tissue patterning and extracellular matrix organisation (Chapter 1, Kollmannsberger et al.
2011). This article provides the reader with a detailed background helpful for approaching the
following three papers. In addition, this review highlights the lack of systematic investigations of the
role of geometry on tissue formation, which is a major aim of the project.
The second article presents a computational method to compare quantitatively the model of curvature-
controlled tissue growth suggested previously (Rumpler et al. 2008) with in-vitro experimental
results. In addition, a biological interpretation based on the shape of a contractile cell – the chord
model – supports the relevance of this purely geometrical model (Chapter 2, Bidan et al. 2012b). The
model also postulates on the role of geometry in the process of bone-remodelling.
The third paper demonstrates that the curvature-driven growth model, and thus the chord model, can
predict tissue growth kinetics and tissue patterning in pores of more complex geometries. The
curvature-driven growth model is also used to propose optimal pore shapes of scaffolds for tissue
engineering (Chapter 3, Bidan et al. 2012c).
The final manuscript concentrates more on the internal structure and the mechanical stability of the
tissue produced in-vitro. The set of experiments proposed not only extends the understanding of the
role of cells on extracellular matrix organisation, but also justifies the hypothesis of the chord model,
developed in the previous two papers (Chapter 4).
The last section of the thesis (Chapter 5) discusses the main conclusions of the individual articles and
puts them in a more general context. Although the importance of the third dimension on growth is
discussed in all papers, the work published was based on two-dimensional models rather than three-
dimensional. Therefore, this final chapter highlights in particular the need of experimental data to
verify the model of curvature-driven growth recently implemented in three dimensions (Appendix A).
Collecting such data in-vitro is challenging and the development of the experimental system is still
under progress. This section finishes by describing possible future directions of research based on
preliminary results and highlights potential implications for the biomedical community.


11
Chapter 1. The physics of tissue patterning and extracellular matrix
organisation: How cells join forces
Kollmannsberger, P.1, Bidan, C. M.
1, Dunlop, J. W. C., Fratzl, P.*
1 Both authors contributed equally to this publication
* Corresponding Author
Department of Biomaterials, Max Planck Institute of Colloids and Interfaces, Science Park Golm, Potsdam 14424, Germany
This review is published in Soft Matter: Soft Matter, 2011, 7 (20), 9549 – 9560.
DOI: 10.1039/C1SM05588G
Text and figures reproduced with permission of The Royal Society of Chemistry
Abstract
This paper reviews recent literature about the physical processes involved in cell interactions and
tissue development. Rather than being exhaustive, we intend to provide illustrative examples of
experiments and theoretical approaches into how cells interact with other cells and with substrates to
form complex tissues and organs. Forces and geometry efficiently coordinate cell behaviour through
feedback and mechanical homeostasis, leading to emergent properties not directly evident from the
behaviour of individual cells. Two important examples for such emergent properties are the patterning
of growth and differentiation within tissues, and the long-range organisation of the extracellular
matrix. Despite the complexity of the biological, chemical and mechanical processes involved,
theoretical studies have shown that many of these phenomena can be described quantitatively by
simple physical processes, such as surface tension controlled growth. In addition to improving
knowledge about the biology of tissues, a thorough theoretical understanding of the self-organising
mechanisms used by Nature may provide inspiration for the design of self-assembling biomimetic soft
materials.
My contribution
I participated in the elaboration of the structure of the review, contributed to the literature research,
made 3 summary figures and co-wrote the manuscript with the other authors.
Chapter 1. The physics of tissue patterning and extracellular matrix organisation: How cells join forces
12
Introduction
It is striking to see the coordinated manner in which cells interact to form complex tissues and
organisms. Cells communicate by secreting and detecting biochemical signals – this “sense of smell”
has been studied and reviewed extensively (see e.g. Schlessinger 2000; Ben-Shlomo et al. 2003;
Schmierer and Hill 2007). But cells also possess a “sense of touch”: they sense and respond to
mechanical stimuli (Vogel and Sheetz 2006). The present work highlights from the point of view of
physical modelling, how cells communicate via their sense of touch to cooperatively form complex
structures and tissues.
Developmental biologists have long recognized the importance of mechanical phenomena at the
cellular scale, such as the role of adhesion and cortical tension, on multicellular coordination in
morphogenesis (Thompson 1917; Steinberg 1962). This has inspired a rich field of theoretical studies
on the interplay between cells and tissues. The interaction between tissue-forming cells depends on
physical properties of their environment. Recent advances in controlling substrates for in-vitro cell
and tissue growth in 2D and 3D have improved our understanding of how single cells and
multicellular tissues interact with their environment. More specifically the role of substrate stiffness
(Discher et al. 2005) and geometry (Nelson et al. 2005) on cell patterning and matrix organisation has
recently gained attention especially in the context of regenerative therapies, artificial organs, and
tissue engineering (Hutmacher 2001). In addition, theoretical models inspired by physics have been
adapted to elucidate the organising principles and mechanisms at work in tissues. These models can
be compared to experiments at different length scales leading to new insights of how cell interactions
determine macroscopic tissue behaviour.
This review is organised as follows: the first part summarises recent experimental findings on single
cell behaviour that are relevant to understanding cooperative cell behaviour. The second part
highlights how cell patterning and extracellular matrix organisation in multicellular systems are
controlled by mechanics and geometry. We then give an overview of theoretical approaches starting
from the cellular level up to continuum and geometrical descriptions. By comparing different
theoretical studies, evidence arises that surface tension is a prevailing macroscopic organising
principle from which many aspects of collective multicellular behaviour can be understood.
Single cell behaviour
Force generation and sensing
In order to “feel”, a cell first needs to “touch” by contacting a substrate. Cells adhere to the
extracellular matrix (ECM) via integrin receptors (Giancotti and Ruoslahti 1999), which bind to ECM
proteins such as fibronectin, laminin, vitronectin or collagen, and they adhere to other cells via

Chapter 1. The physics of tissue patterning and extracellular matrix organisation: How cells join forces
13
cadherin (Geiger and Ayalon 1992). Successful adhesion triggers the formation and maturation of
focal adhesions (FAs) on the intracellular side, linking the cell-ECM or cell-cell contact to the
cytoskeleton. The characteristics of this initial interaction are generic across different cell and tissue
types (Bokel and Brown 2002), and follow universal dynamics (Cuvelier et al. 2007). Integrins,
cadherins and their associated focal adhesion complexes are crucial in sensing and transmitting
mechanical forces (Zamir and Geiger 2001; Brakebusch and Fassler 2003; Schwartz and DeSimone
2008). The maturation and stabilization of FAs generates a mechanical support for the cell. The FAs
bind the ECM to the actin cytoskeleton, a filamentous network spanning the entire cell. Myosin
motors that cross-link the actin network generate persistent cytoskeletal tension counterbalanced by
cell-matrix or cell-cell contacts. The force produced by this micro-muscle can be as high as 100 nN on
a single focal adhesion (Tan et al. 2003; Maruthamuthu et al. 2011). The cytoskeleton continually
remodels by polymerisation and depolymerisation of filaments. FAs and the actin-myosin network are
resorbed when unloaded and are reinforced under tensile load (Riveline et al. 2001; Liu et al. 2010b),
giving rise to thick actin-myosin bundles called stress fibres. The interplay of remodelling and
tensional pre-stress stabilizes the cytoskeleton, which can be readily visualised by disturbing
mechanical equilibrium: cutting actin fibres in living cells triggers a spontaneous retraction of the two
pieces and redistribution of mechanical tension (Kumar et al. 2006). Likewise inhibiting the
contractility of the cytoskeleton results in strong changes in cell shape (Théry et al. 2006).
The amount of force needed for a cell to deform a substrate defines the rigidity of the environment.
With increasing cytoskeletal tension, the internal spring constant of the cell eventually matches that of
the environment, leading to mechanical homeostasis (Schwarz et al. 2006; Mitrossilis et al. 2009;
Zemel et al. 2010). Using this simple physical mechanism, cells can sense and adapt to a wide range
of substrate rigidities (Discher et al. 2005; Solon et al. 2007).
The organisation of the actin network, and thus cell shape and polarity, adapt to the geometry of the
environment. If adhesion is spatially confined by the distribution of the ECM, the contractile
cytoskeleton reorganises in a way that the cell adopts an energy-minimising shape and polarity (Théry
et al. 2006; Bischofs et al. 2009; Desai et al. 2009; Fujita et al. 2009; Vianay et al. 2010; Ding et al.
2011). Cell polarity is fundamental for mitosis as it determines the cell division axis, the location of
the daughter cells (Théry et al. 2007), and the direction of cell migration (Jiang et al. 2005; Mahmud
et al. 2009). Orientation and adaptation of cell shape to the adhesive and mechanical properties of the
environment can lead to cell migration along gradients of ligand density (haptotaxis) or rigidity
(durotaxis) solely due to continuous cytoskeletal remodelling (Gunawan et al. 2006; Harland et al.
2011).
Cell behaviour is influenced by the substrate topography at subcellular or nanometer length scales.
For instance, cells are sensitive to ligand spacing, which seems to be optimal for adhesion if between
58 nm and 73 nm (Cavalcanti-Adam et al. 2007; Selhuber-Unkel et al. 2010), with slightly disordered
Chapter 1. The physics of tissue patterning and extracellular matrix organisation: How cells join forces
14
arrangements being superior to perfectly periodic spacing (Huang et al. 2009). Other examples are the
effects of surface roughness (Gentile et al. 2010) and curvature (Park et al. 2009) on cell adhesion.
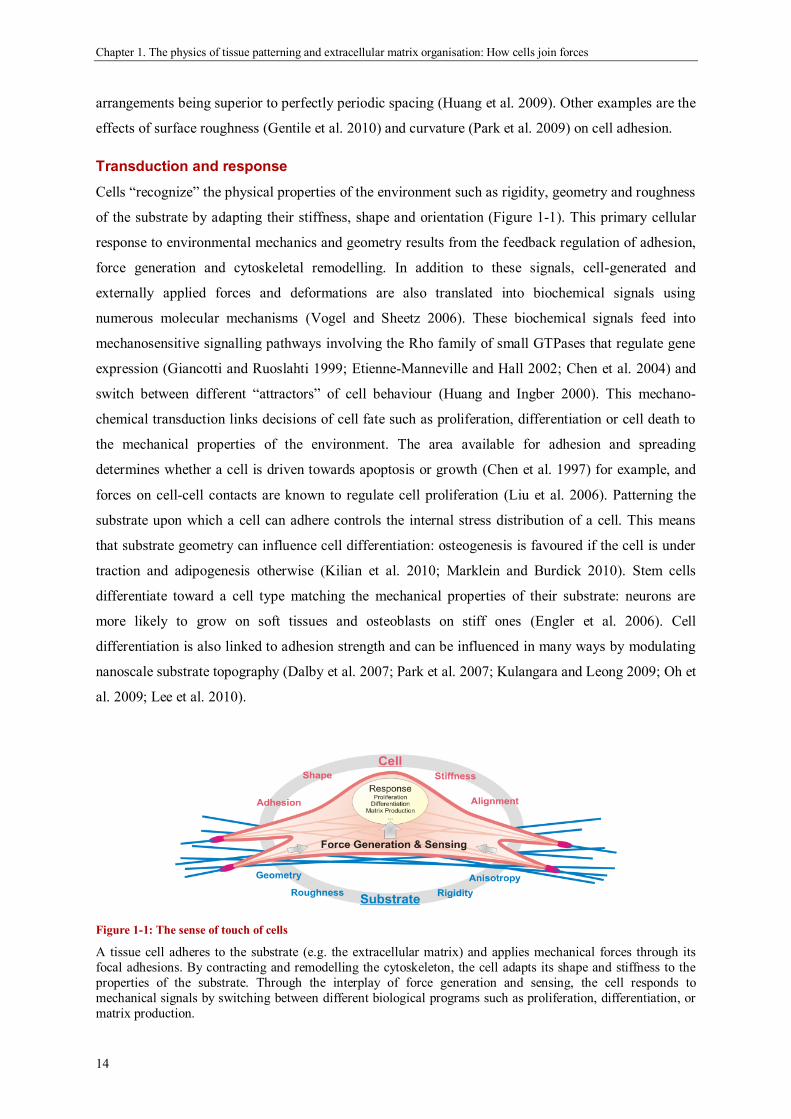
Transduction and response
Cells “recognize” the physical properties of the environment such as rigidity, geometry and roughness
of the substrate by adapting their stiffness, shape and orientation (Figure 1-1). This primary cellular
response to environmental mechanics and geometry results from the feedback regulation of adhesion,
force generation and cytoskeletal remodelling. In addition to these signals, cell-generated and
externally applied forces and deformations are also translated into biochemical signals using
numerous molecular mechanisms (Vogel and Sheetz 2006). These biochemical signals feed into
mechanosensitive signalling pathways involving the Rho family of small GTPases that regulate gene
expression (Giancotti and Ruoslahti 1999; Etienne-Manneville and Hall 2002; Chen et al. 2004) and
switch between different “attractors” of cell behaviour (Huang and Ingber 2000). This mechano-
chemical transduction links decisions of cell fate such as proliferation, differentiation or cell death to
the mechanical properties of the environment. The area available for adhesion and spreading
determines whether a cell is driven towards apoptosis or growth (Chen et al. 1997) for example, and
forces on cell-cell contacts are known to regulate cell proliferation (Liu et al. 2006). Patterning the
substrate upon which a cell can adhere controls the internal stress distribution of a cell. This means
that substrate geometry can influence cell differentiation: osteogenesis is favoured if the cell is under
traction and adipogenesis otherwise (Kilian et al. 2010; Marklein and Burdick 2010). Stem cells
differentiate toward a cell type matching the mechanical properties of their substrate: neurons are
more likely to grow on soft tissues and osteoblasts on stiff ones (Engler et al. 2006). Cell
differentiation is also linked to adhesion strength and can be influenced in many ways by modulating
nanoscale substrate topography (Dalby et al. 2007; Park et al. 2007; Kulangara and Leong 2009; Oh et
al. 2009; Lee et al. 2010).
Figure 1-1: The sense of touch of cells
A tissue cell adheres to the substrate (e.g. the extracellular matrix) and applies mechanical forces through its
focal adhesions. By contracting and remodelling the cytoskeleton, the cell adapts its shape and stiffness to the
properties of the substrate. Through the interplay of force generation and sensing, the cell responds to
mechanical signals by switching between different biological programs such as proliferation, differentiation, or
matrix production.

Chapter 1. The physics of tissue patterning and extracellular matrix organisation: How cells join forces
15
Interaction and transmission
Recognition of the physical environment by force generation and sensing would at first glance seem
to be limited to the immediate cellular neighbourhood. The depth of force sensing by cells was shown
to extend from several microns to no more than 50 µm (Maloney et al. 2008; Sen et al. 2009).
However by making contact to other cells or to the extracellular matrix, forces can be transmitted over
broader distances allowing for long range mechanical communication between cells. A cell responds
to forces generated by other cells in the tissue by changes in shape, contraction, and proliferation. The
resulting forces are again transmitted to other cells, generating a mechanical feedback that
synchronises cell behaviour (Figure 1-2). New properties emerge on length scales larger than the
single cell, such as cell patterns, ECM organisation, or effective tissue surface tension.
Figure 1-2: Mechanical interaction between cells
In a multicellular tissue, cells are linked by cell-cell contacts or via the ECM. Forces generated by individual
cells are transmitted across the matrix and modify the mechanical properties of the whole tissue, increasing the
interaction range beyond that of a single cell. Other cells sense these changes and respond accordingly, leading
to a mechanical feedback loop and collective behaviour.
Multicellular behaviour
Patterning cells
In order to build complex tissues and organisms, cells need to diversify and fulfil different roles
corresponding to their position. The secretion and diffusion of soluble factors (morphogens) are
important for spatial patterning of cell behaviour (Nelson et al. 2006). In addition, mechanical
interactions play a simple, yet powerful, role in translating positional information into local stimuli for
the cell. Forces generated by individual cells together with global geometrical constraints create
patterns of mechanical stress in the tissue that are sensed by cells and result in patterns of growth and
Chapter 1. The physics of tissue patterning and extracellular matrix organisation: How cells join forces
16
differentiation. The architecture of the growing tissue not only influences the stress distribution, but
also controls the distribution of growth factors and inhibitors close to the surface (Nelson 2009). This
way, mechanical and biochemical signals cooperatively shape and structure tissues during
development.
Cell sheets on adhesive islands are an excellent system to study mechanically guided cell patterning
and differentiation in-vitro, and to learn about the in-vivo mechanisms controlling morphogenesis and
regeneration. For example, islands of adhesive extracellular matrix for multiple cells have been
generated by the same micro-patterning technique as used for single-cell geometry studies (Chen et al.
1997; Nelson et al. 2005). The shape of the island determines the stress distribution in the cell layer as
confirmed by numerical calculations, by measurements of traction stresses and by inhibiting
contraction and mechanosensitive pathways. As a result, the proliferation rate of endothelial cells
turns out to be highest in regions of largest mechanical stress (Nelson et al. 2005) (Figure 1-3-A3).
Not only does mechanical stress affect growth, but it also plays a role in stem cell differentiation into
different tissue types. In two-dimensional sheets of mesenchymal stem cells, osteogenic
differentiation is observed in regions of high stress, whereas low stress favours adipogenic
differentiation (Luo et al. 2008; Ruiz and Chen 2008). Endothelial cells cultured on stripes of
fibronectin differentiate and form capillary-like tubes on 10µm-wide, but not on 30µm-wide stripes,
showing the importance of mechanically or geometrically guided cell program switching in
angiogenesis (Dike et al. 1999; Nelson and Bissell 2006). In bone healing, the mechanosensitive
differentiation into different tissue types is guided by the geometry of the fracture gap (Figure 1-3-
A2), leading to a characteristic temporal healing pattern and full recovery of the undamaged bone
structure (Epari et al. 2006; Vetter et al. 2010).
Tissue patterning due to force-dependent proliferation and differentiation relies on
mechanotransduction to control cell fate. However, even simpler physical mechanisms of cell
patterning also exist. During morphogenesis, cells sort into clusters of the same cell type as precursors
to the formation of organs (Figure 1-3-A1). In some cases, cell sorting requires no active biological
response or directed migration of the cells, but is simply a result of the different adhesivity between
different cell types (Steinberg 1962; Foty and Steinberg 2005; Steinberg 2007; Krieg et al. 2008).
Highly sophisticated patterns, such as the epithelial cell arrangement in Drosophila eyes (Figure 1-3-
C1) or wing discs, can be generated in a robust manner simply by minimisation of interfacial energy
(Hayashi and Carthew 2004; Farhadifar et al. 2007; Hilgenfeldt et al. 2008).
Chapter 1. The physics of tissue patterning and extracellular matrix organisation: How cells join forces
17
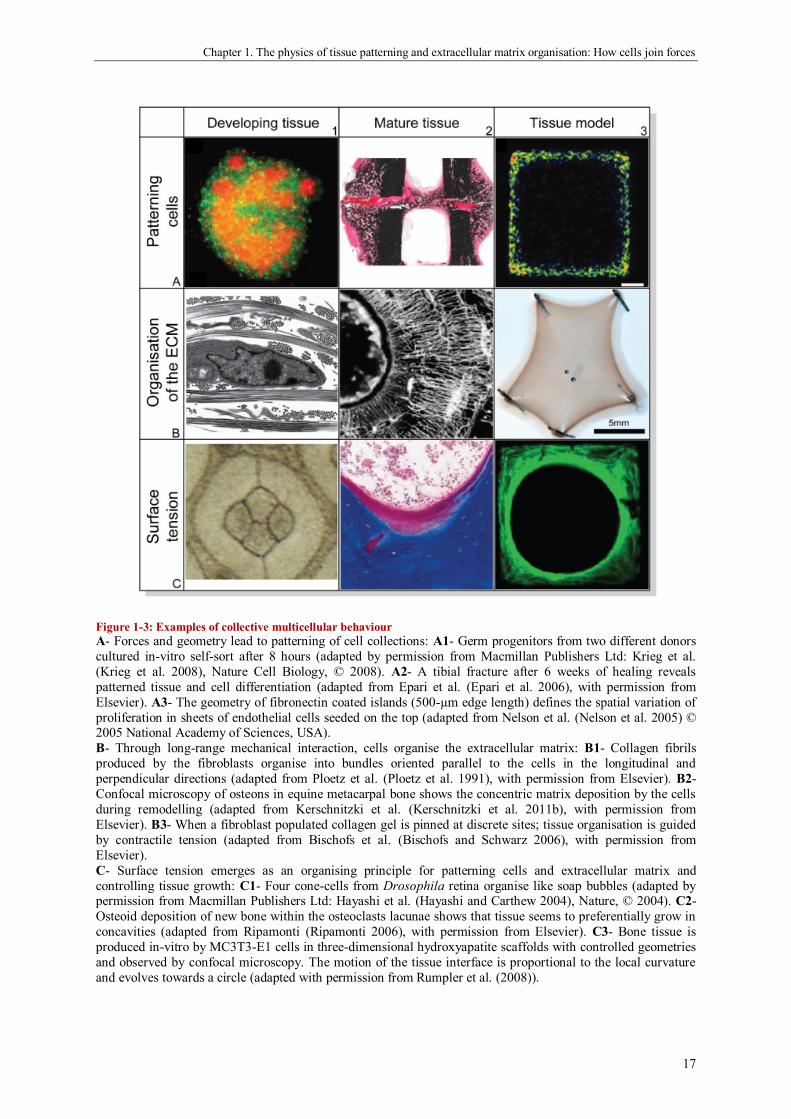
Figure 1-3: Examples of collective multicellular behaviour
A- Forces and geometry lead to patterning of cell collections: A1- Germ progenitors from two different donors
cultured in-vitro self-sort after 8 hours (adapted by permission from Macmillan Publishers Ltd: Krieg et al.
(Krieg et al. 2008), Nature Cell Biology, © 2008). A2- A tibial fracture after 6 weeks of healing reveals
patterned tissue and cell differentiation (adapted from Epari et al. (Epari et al. 2006), with permission from
Elsevier). A3- The geometry of fibronectin coated islands (500-µm edge length) defines the spatial variation of
proliferation in sheets of endothelial cells seeded on the top (adapted from Nelson et al. (Nelson et al. 2005) © 2005 National Academy of Sciences, USA).
B- Through long-range mechanical interaction, cells organise the extracellular matrix: B1- Collagen fibrils
produced by the fibroblasts organise into bundles oriented parallel to the cells in the longitudinal and
perpendicular directions (adapted from Ploetz et al. (Ploetz et al. 1991), with permission from Elsevier). B2-
Confocal microscopy of osteons in equine metacarpal bone shows the concentric matrix deposition by the cells
during remodelling (adapted from Kerschnitzki et al. (Kerschnitzki et al. 2011b), with permission from
Elsevier). B3- When a fibroblast populated collagen gel is pinned at discrete sites; tissue organisation is guided
by contractile tension (adapted from Bischofs et al. (Bischofs and Schwarz 2006), with permission from
Elsevier).
C- Surface tension emerges as an organising principle for patterning cells and extracellular matrix and
controlling tissue growth: C1- Four cone-cells from Drosophila retina organise like soap bubbles (adapted by permission from Macmillan Publishers Ltd: Hayashi et al. (Hayashi and Carthew 2004), Nature, © 2004). C2-
Osteoid deposition of new bone within the osteoclasts lacunae shows that tissue seems to preferentially grow in
concavities (adapted from Ripamonti (Ripamonti 2006), with permission from Elsevier). C3- Bone tissue is
produced in-vitro by MC3T3-E1 cells in three-dimensional hydroxyapatite scaffolds with controlled geometries
and observed by confocal microscopy. The motion of the tissue interface is proportional to the local curvature
and evolves towards a circle (adapted with permission from Rumpler et al. (2008)).
Chapter 1. The physics of tissue patterning and extracellular matrix organisation: How cells join forces
18
Organising the extracellular matrix
An important component of most tissues and organs is the extracellular matrix (ECM). It serves as a
scaffold for coordinating cell behaviour and organisation, and is responsible for the extraordinary
mechanical properties of many tissue types such as skin and bone. The mechanical function of the
ECM requires a spatial organisation and alignment over length scales orders of magnitude larger than
that of a single cell. Nevertheless, ECM is produced and organised by individual cells. For structural
organisation beyond the cellular length scale to emerge, there must be efficient coordination and
cooperation between cells. Again, mechanical forces are crucial for this to take place.
Fibroblasts are cells that synthesise and organise ECM (Figure 1-3-B1) and are important in wound
healing. They rearrange the ECM in parallel to the direction of highest contractile stress, which plays
an important role in morphogenesis (Harris et al. 1981). When such cells are seeded into reconstituted
collagen gels that mimic the ECM, they contract the gel (Grinnell and Lamke 1984). If the collagen
gel is geometrically constrained, mechanical crosstalk between cells leads to alignment and structure
formation in the network (Thomopoulos et al. 2005; Fernandez and Bausch 2009). External forces
also contribute to the remodelling of the matrix (Sander et al. 2009). When matrix-producing cells
such as osteoblasts are seeded into 3D scaffolds, the organisation of the matrix generated by the cells
is influenced by the geometrical properties of the scaffold and by externally applied forces
(Hutmacher et al. 2001; Engelmayr and others 2006; Wang and van Blitterswijk 2010). The
cytoskeleton and the ECM fibres are typically aligned in parallel (Figure 1-3-C3), linking cell polarity
and matrix alignment (Wang et al. 2003; Rumpler et al. 2008).
Bone is a classic example of how the highly organized arrangement of collagen on different
hierarchical levels (Fratzl and Weinkamer 2007) determines mechanical properties (Weiner and
Wagner 1998; Fratzl et al. 2004). How exactly this organisation is achieved is not well known, but in-
vitro studies in scaffolds provide important hints that the geometry of the substrate onto which the
matrix is deposited is a key factor. In bone remodelling, the cells in the bone matrix (osteocytes) act
as mechanosensors (Burger and Klein-Nulend 1999) and generate signals that activate other cells
which either produce or resorb bone (Robling et al. 2006). Bone-resorbing cells (osteoclasts) dig tube-
like holes into cortical bone or shallow channels in trabecular bone which are subsequently filled by
matrix deposited by osteoblasts (Parfitt 1994). This way, unordered primary bone is remodelled into
mechanically more efficient secondary osteonal bone during bone formation and healing (Liu et al.
2010a). The alignment of the deposited collagen spirals along the osteon surface (Wagermaier et al.
2006) and is closely related to the orientation of the cells in the bone matrix (Figure 1-3-B2),
revealing how cells are coordinated by geometry to create emergent long-range order (Kerschnitzki et
al. 2011b).
Bone is only one example where the extracellular matrix arrangement controls tissue function.
Collagen alignment is also crucial for the function of the aortic valve (Hinton 2006) and follows the
Chapter 1. The physics of tissue patterning and extracellular matrix organisation: How cells join forces
19
lines of tension in the dermis, which has been known to surgeons for centuries (Wilhelmi 1999).
During wound healing, the initially unordered fibrin matrix that forms the scar tissue is contracted and
aligned by platelets, forming a scaffold for the later deposition and remodelling of collagen (Martin
1997).
Surface Tension
It turns out that many aspects of single cell and multicellular behaviour can be traced back to well-
known physical and mechanical principles. One recurring concept that appears on all length scales
from single cells to tissues is that of surface tension. While spreading, cells evolve their shape by
contracting and remodelling their actomyosin cytoskeleton, resulting in a configuration that minimises
mechanical energy in a force balance of surface and bulk tension (Théry et al. 2006; Bischofs et al.
2008). On a multicellular scale, the shape and arrangement of cell aggregates (Figure 1-3-C1) arising
from minimisation of surface energy is similar to that of soap-bubble clusters (Hayashi and Carthew
2004; Hilgenfeldt et al. 2008). In addition, the difference in interfacial energies between different cell
types leads to sorting of cells into clusters, much akin to interface-driven phase separations occurring
in binary metallic alloys (Tanaka and Araki 2000). The shape of contractile tissues under geometrical
constraints (Figure 1-3-B3) exhibits a similar surface-tension-like phenomenology as observed in
individual cells. Although the physical mechanisms are slightly different from those of surface tension
in liquid drops, analogous interface-based theoretical descriptions can be applied (Bischofs et al.
2008). Surface tension due to cell contractility can also account for the geometry-dependent growth
patterns of bone tissue in artificial scaffolds (Rumpler et al. 2008) (Figure 1-3-C3) and in trabecular
bone (Ripamonti 2006) (Figure 1-3-C2). The long-time dynamics due to rearrangements and growth
give rise to an effective viscosity of the entire tissue (Ranft et al. 2010). Treating multicellular tissue
as an active viscous fluid with an apparent surface tension can in fact explain many of its emergent
physical properties.
Theoretical Modelling
The previous section highlighted experimental evidence on how the mechanical response of cells
controls the spatial organisation of tissues at macroscopic scales. This section briefly reviews existing
theoretical approaches towards tissue growth and organisation. Modelling of tissue behaviour is
discussed at three different scales (Figure 1-4) ranging from single-cell agent-based models to
continuum descriptions and finally to interfacial models, motivated by established theoretical
concepts coming from materials science. Figure 1-5 gives some examples of the theoretical models
discussed in the following, of which some correspond directly to their counterparts in Figure 1-3.

Chapter 1. The physics of tissue patterning and extracellular matrix organisation: How cells join forces
20
Figure 1-4: Theoretical approaches to describe multicellular systems
Models for tissue growth can be classified into three main categories: agent-based models, continuum mechanic models, and interface-based models. The choice of the approach depends on the type of input data available and
on the scale of the phenomenon to be described. All three approaches apply the principle of energy minimisation
at different scales to describe the emergence of patterns and order in multicellular systems.
Sub-cellular models
Adhesion, force generation, and mechano-sensing of single cells form the basis of multicellular
behaviour. Mechanistic models can help to trace back these phenomena to surprisingly simple
physical principles even at the sub-cellular scale. Modelling cytoskeletal changes in response to
external geometrical cues demonstrates why focal adhesions concentrate around the periphery of a
cell (Deshpande et al. 2008; Pathak et al. 2008) and in regions of high curvature (Novak et al. 2004).
In a discrete two-spring model of focal adhesions, a mechanism of force sensing was proposed
through the cooperative force-regulated binding and unbinding of individual bonds in a FA (Schwarz
et al. 2006). The polarisation of cells by the formation of aligned stress fibres during adhesion can
Chapter 1. The physics of tissue patterning and extracellular matrix organisation: How cells join forces
21
depend on the substrate rigidity (Zemel et al. 2010). Although such sub-cellular models can
sometimes also be applied to multicellular phenomena (Jamal et al. 2010), they are typically too
detailed to be efficient in explaining emergent phenomena of large numbers of cells. On this level, the
internal structure of cells can be neglected, and cellular behaviour is summarised by rules derived
from lower-level descriptions.
Cell-level, agent-based models
The approach to explain emergent phenomena in large systems through the effect of physical laws
acting on the level of the individual constituents is analogous to that of statistical physics. Such
systems are often difficult to grasp analytically, therefore computer simulations are frequently used.
Several proven and tested techniques for modelling and simulation of such systems can be extended
and applied to multicellular phenomena in biology.
Agent-based models of patterning and growth
At first order, cells can be approximated as point-like objects with coordinates denoting the centre of
mass, and a spherical interaction potential which incorporates cell properties such as elasticity and
volume as well as interactions such as adhesion, repulsion, or drag. A cell exhibits various behaviours
such as migration, proliferation, or death in response to physical parameters of the environment, e.g.
the forces imposed by neighbouring cells. Despite this very simplistic approach, such models account
well for many patterning and growth phenomena in multi-cellular systems ranging from cell
monolayer growth to tumour spheroids, embryonal development, or wound healing (Forgacs et al.
1994; Drasdo et al. 2007; Byrne and Drasdo 2008; Cox 2010) (See e.g. Figure 1-5-A2). These cell-
centre based models have been combined with continuum descriptions of the spatio-temporal
distribution of nutrients, oxygen, signalling factors or extracellular matrix to make them more
biologically realistic. Invasive tumour growth and morphology for example can be shown to depend
on cell-cell adhesion and stiffness sensing (Jeon et al. 2010). The interaction range of cells is extended
by propagating force fields throughout the extracellular matrix, allowing the collective alignment of
cells in tissues to be explained (Bischofs and Schwarz 2003).
Cellular Potts Model: cell sorting and beyond
In contrast to centroid-based models, lattice-based models allow for different cell shapes and sizes by
describing cells as connected regions that extend over several lattice sites. This approach is adapted
from the q-Potts model used to describe phase separation phenomena, and was thus termed the
“Cellular Potts Model” (CPM) (Graner and Glazier 1992; Glazier and Graner 1993). An effective
energy is assigned to the system which depends on the types of interfaces between cells as well as on
cellular properties such as volume or surface area. The evolution of the system is derived by energy
minimisation using Monte-Carlo approaches. The original application of the Potts model in biology
was to describe cell sorting (Figures 1-3-A1 and 1-5-A1) due to differential adhesion (Steinberg

Chapter 1. The physics of tissue patterning and extracellular matrix organisation: How cells join forces
22
2007). Since then, several extensions have been proposed to add biological complexity to the model
(Ouchi et al. 2003). By combining chemo-attractant and nutrient diffusion with the CPM a diverse
range of biological phenomena has been modelled. Examples range from the entire life cycle of the
slime mould Dictyostelium (Maree and Hogeweg 2001) to the influence of the collagen network on
tumour growth and invasion (Rubenstein and Kaufman 2008) and to the alignment of osteons with
load during bone remodelling (van Oers et al. 2008). A particularly successful application of CPM is
in morphogenesis, where differential adhesion and interfacial tension play an important role (Kafer
2007; Glazier et al. 2008; Krieg et al. 2008).
Vertex models in morphogenesis
Many systems studied in morphogenesis are essentially two-dimensional, such as the wing discs in
drosophila. Here, the evolution of the structure can efficiently be described using a vertex
representation of the cells, describing cell borders as lines between vertices (Honda et al. 2004), as
done in simulations of soap foams and grain growth (Glazier and Weaire 1992; Barrales Mora et al.
2008). By defining an energy function in a similar manner as in the CPM, the structural evolution of a
cell collection can be studied. This model has been used to derive stable and stationary network
configurations and explain the packing geometry in the wing disc (Figure 1-5-A3) as a consequence
of mechanical cellular properties and proliferation (Farhadifar et al. 2007). Vertex-based modelling
coupled with laser nano-dissection experiments have highlighted that the elongation of Drosophila
embryos is guided by cortical tension at cell junctions that drives polarised cell neighbour exchanges
(Rauzi et al. 2008). A mathematical model of non-uniform growth in a layer of tissue demonstrates
that a stress dependence of cell proliferation can provide a robust and purely mechanical integral-
feedback control of growth (Shraiman 2005). Although the principles of cell-packing are likely to be
generic for three-dimensions, the vertex representation must include more complicated topological
transitions of vertices found in 3D (Barrales Mora et al. 2008; Syha and Weygand 2010).
Averaging over cells
Fortunately, it is often not necessary to go down to the level of individual cells to theoretically
describe and understand a certain process. For example, results from vertex descriptions of individual
cell packing can be integrated into cell domains to describe flow fields on a more coarse-grained scale
(Butler et al. 2009). Using a combination of centroid-based cell simulations for division and
apoptosis, and a continuum description of stress distributions and flow, it was shown that a growing
tissue exhibits viscoelastic behaviour with relaxation times set by the rates of division and apoptosis
(Ranft et al. 2010). For the CPM, a continuous limit describing cell movements and interactions in the
form of probability density functions was derived and applied to trabecular bone formation (Alber et
al. 2007).
Chapter 1. The physics of tissue patterning and extracellular matrix organisation: How cells join forces
23
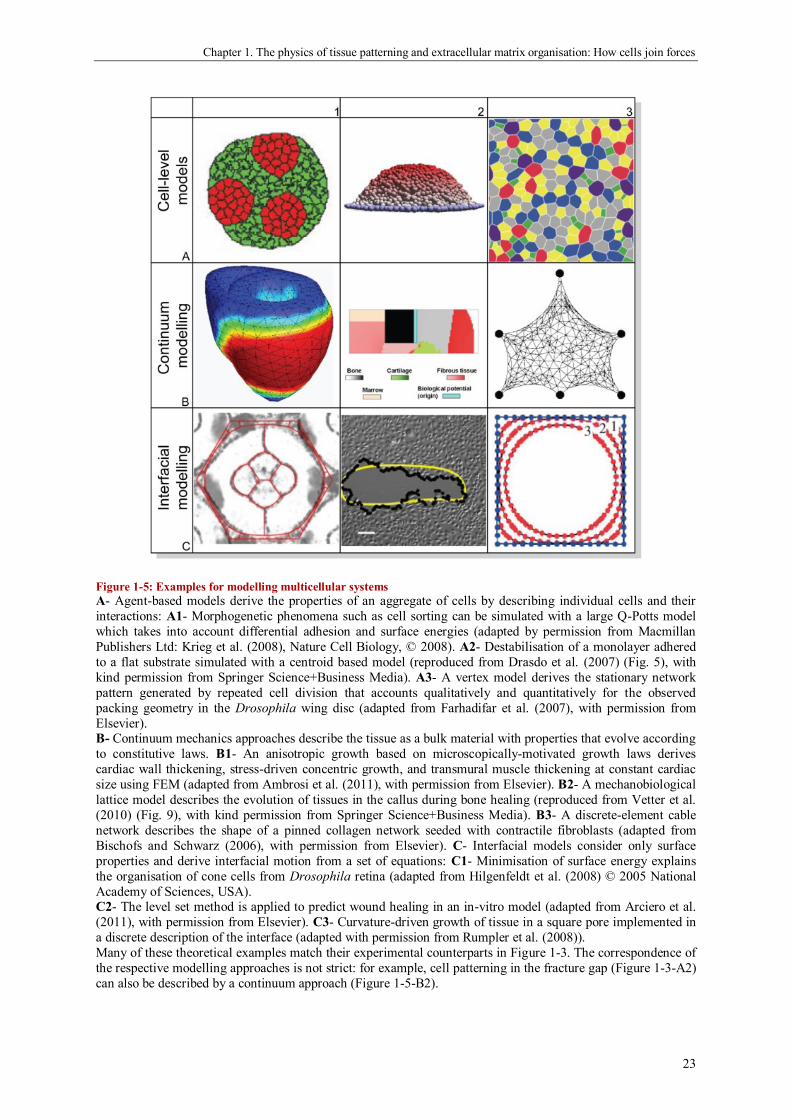
Figure 1-5: Examples for modelling multicellular systems
A- Agent-based models derive the properties of an aggregate of cells by describing individual cells and their
interactions: A1- Morphogenetic phenomena such as cell sorting can be simulated with a large Q-Potts model
which takes into account differential adhesion and surface energies (adapted by permission from Macmillan
Publishers Ltd: Krieg et al. (2008), Nature Cell Biology, © 2008). A2- Destabilisation of a monolayer adhered
to a flat substrate simulated with a centroid based model (reproduced from Drasdo et al. (2007) (Fig. 5), with
kind permission from Springer Science+Business Media). A3- A vertex model derives the stationary network
pattern generated by repeated cell division that accounts qualitatively and quantitatively for the observed
packing geometry in the Drosophila wing disc (adapted from Farhadifar et al. (2007), with permission from
Elsevier). B- Continuum mechanics approaches describe the tissue as a bulk material with properties that evolve according
to constitutive laws. B1- An anisotropic growth based on microscopically-motivated growth laws derives
cardiac wall thickening, stress-driven concentric growth, and transmural muscle thickening at constant cardiac
size using FEM (adapted from Ambrosi et al. (2011), with permission from Elsevier). B2- A mechanobiological
lattice model describes the evolution of tissues in the callus during bone healing (reproduced from Vetter et al.
(2010) (Fig. 9), with kind permission from Springer Science+Business Media). B3- A discrete-element cable
network describes the shape of a pinned collagen network seeded with contractile fibroblasts (adapted from
Bischofs and Schwarz (2006), with permission from Elsevier). C- Interfacial models consider only surface
properties and derive interfacial motion from a set of equations: C1- Minimisation of surface energy explains
the organisation of cone cells from Drosophila retina (adapted from Hilgenfeldt et al. (2008) © 2005 National
Academy of Sciences, USA). C2- The level set method is applied to predict wound healing in an in-vitro model (adapted from Arciero et al.
(2011), with permission from Elsevier). C3- Curvature-driven growth of tissue in a square pore implemented in
a discrete description of the interface (adapted with permission from Rumpler et al. (2008)).
Many of these theoretical examples match their experimental counterparts in Figure 1-3. The correspondence of
the respective modelling approaches is not strict: for example, cell patterning in the fracture gap (Figure 1-3-A2)
can also be described by a continuum approach (Figure 1-5-B2).

Chapter 1. The physics of tissue patterning and extracellular matrix organisation: How cells join forces
24
Continuum modelling of tissues
Cell patterning and extracellular matrix organisation on a macroscopic tissue scale can be described
efficiently using homogenised cellular and ECM properties. Continuum mechanics provides a
framework in which the average tissue response in a volume element is given by a set of constitutive
equations. These equations describe growth, mechanical response, diffusion and tissue evolution as a
function of the local mechanical, chemical and biological environment (Cowin 2004). Once
appropriate constitutive laws have been derived, the equations are either solved exactly for simple
tissue geometries, or are implemented into finite element calculations. Such approaches have been
successful in modelling bone healing, tissue remodelling (e.g. Figure 1-5-B1) and tumour growth,
amongst many other examples. For a recent review of continuum approaches to tissue growth
remodelling and morphogenesis see Ambrosi et al. (2011).
Growth
Tissue growth is strongly coupled to the local availability of nutrients and growth factors as well as
the local mechanical environment. Two main approaches have been used to model the growth rates of
tissues as a function of mechanics and chemistry. On the one hand, there are phenomenological
models, inspired from experimental observations, describing local tissue growth rates as a function of
local loading (Frost 1987). On the other hand, growth laws can be derived from more fundamental
considerations, such as mass and energy balances (Garikipati 2009). Growth itself is either treated as a
surface phenomenon by apposition of new material on the tissue surface, lending itself to lattice based
models, or as a local volume change or “eigenstrain” within the material requiring equations for
mechanical equilibrium to be solved for the final tissue state. Some of the earliest work on tissue
growth appeared in the field of bone, with the phenomenological observations that bone responds to
its mechanical environment by depositing new bone when stressed and removing bone when unloaded
(Roux 1881; Wolff 1892). These ideas have been successfully implemented into finite element
calculations and used to investigate trabecular bone remodelling which couples local tissue changes to
the local stress/strain state (Frost 1987; Huiskes et al. 2000; Weinkamer et al. 2004; Adachi et al.
2010). These models, although not describing individual cellular responses, are still capable of
explaining the emergence and maintenance of trabecular architectures and its adaptation to changing
external loading.
Bulk or interstitial growth is treated mathematically as a local deformation. Commonly the
deformation tensor is decomposed into an eigenstrain (or stress-free strain) arising from local growth,
and an elastic strain coming from the confinement of growing tissue by the surrounding tissue and
substrate (See Ambrosi et al. (2011) for more detailed discussions). In addition to a phenomenological
approach, some attempts have been made to derive growth laws based on thermodynamic
considerations (Epstein and Maugin 2000; Ambrosi and Guana 2007; Ambrosi and Guillou 2007;
Garikipati 2009; Dunlop et al. 2010). This gives growth laws consistent with the laws of
Chapter 1. The physics of tissue patterning and extracellular matrix organisation: How cells join forces
25
thermodynamics but still requires a certain phenomenological input in the descriptions of the energy
and mass balances. Such methods describing energy dissipation in tissues have been used to model
the mechanics of tumour growth (Ambrosi and Preziosi 2009) and to extract free energy rates from
experimental observations of tumour spheroids (Narayanan et al. 2010).
Tissue evolution
In addition to volumetric growth, tissues also evolve via cell patterning and differentiation, and
through the deposition, ageing and remodelling of the surrounding ECM. One example for the
importance of patterning of growth and differentiation is bone regeneration. The local mechanical
response of tissue around bone implants combined with histological examinations has been used to
develop a model for tissue types change as a function of local shear strain and fluid flow rate
(Prendergast et al. 1997). This model for tissue differentiation has been applied to describe
angiogenesis in the gap between the bone and the implant (Checa and Prendergast 2009). A similar
approach has been used to describe the temporal tissue patterns in bone fracture healing (Figure 1-5-
B2), taking experimental data from tissue cultures in a bio-reactor (Matziolis et al. 2006) as a basis for
phenomenological laws of tissue differentiation (Vetter et al. 2011).
The mechanical response of tissue in such models is often simplified as a linear elastic isotropic
material, as a poroelastic medium (Cowin 1999), or as a swellable gel (Wu and Kirchner 2010). The
respective constitutive laws are then solved numerically using finite element methods (FEM). That
way, global boundary conditions such as forces, deformations or geometrical constraints can be
translated into local mechanical stimuli that determine cell response and matrix organisation. This
approach works very well under defined mechanical and geometrical conditions, such as in contractile
cell sheets in-vitro. The distribution of tensional stresses derived from FEM calculations compares
well with patterns of cell proliferation (Nelson et al. 2005) and differentiation (Ruiz and Chen 2008).
Various continuum-based approaches have been proposed to model the reorganization of the
extracellular matrix in response to cell-generated or externally imposed forces (Barocas and
Tranquillo 1997; Driessen et al. 2004; Garikipati et al. 2006; Kuhl and Holzapfel 2007; Kroon 2010).
The anisotropy of the matrix due to fiber alignment is usually treated as a continuum property and can
be related to a microscopic description based on discrete elements that represent collagen fibres (Kuhl
and Holzapfel 2007).
Models based on discrete elements can be efficient in describing structural properties without the need
to explicitly model individual fibres on the microscopic scale. For example, discrete structures made
out of struts and tensed cables can predict relationships between different parameters of the system,
such as internal pre-stress and stiffness (Stamenović and Ingber 2009). Geometrically constrained
collagen gels seeded with contractile cells are well described by a cable model (Figure 1-3-B3 and 1-
5-B3) with elements that resist elongation but not compression (Bischofs et al. 2008). The same

Chapter 1. The physics of tissue patterning and extracellular matrix organisation: How cells join forces
26
approach works on the length scale of individual cells and predicts the radius of arcs between
adhesion points.
The internal contractility and fibrous structure of the cytoskeleton or ECM leads to an apparent
surface tension. Hence, the macroscopic shape of a contractile cell or tissue under geometrical
constraints can be described by an even simpler approach based on a modified Young-Laplace law
(Bischofs et al. 2009). This leads to another class of models that describe the emergent behaviour of
multicellular tissue entirely in terms of interfacial properties.
Interfacial modelling
As tissues can be viewed as viscous fluids, their behaviour can be greatly simplified by reducing the
tissue description to that of its internal and external interfaces whose motion is controlled by
interfacial energies. For this, models originally developed to study phase transformations can be
adapted. While in most cases surface tension dictates the patterning, additional features such as the
effect of chemical gradients can also be taken into account (Nelson 2009). The description of the
interface between a tissue and its surroundings can either be completely sharp or change continuously,
with the actual tissue boundary being defined by a threshold (Thornton et al. 2003).
Sharp interfaces
Sharp interface models can accurately reproduce cell sorting and tissue patterning by using surface
tension as the driving force of interfacial motion, neglecting any further biological or mechanical
details of the system. The evolution of cell clusters towards spheroids for example is well described
by models that use cell-cell and cell-medium interfacial energies calculated from experiments
(Manning et al. 2010). A similar approach was used to predict the soap-bubble-like patterning of cone
cell assemblies in Drosophila eyes (Hayashi and Carthew 2004), in which interfacial motion is driven
by adhesion and membrane elasticity (Figures 1-3-C1 and 1-5-C1) (Hilgenfeldt et al. 2008). Steinberg
(1962) and his successors showed the determining role of surface tension in cell sorting (Foty et al.
1996) and motion of sheets of cells (Forgacs et al. 1994). These phenomena are essential during
gastrulation and early stages of embryo development when sheets of different types of cells and
different tissues with different properties self-organise to form complex organs. A minimisation of
surface tension gives rise to a link between surface curvature and growth. Another more direct way to
model the effect of interfacial energy on pattern formation is therefore to quantify the geometry of the
interface and make it evolve toward a more stable configuration. In the context of tissue production by
cells, it was shown that the local motion of the tissue interface is proportional to the local curvature
(Rumpler et al. 2008) (Figures 1-3-C3 and 1-5-C3). A simple model in which local interfacial motion
is proportional to the local curvature gave good predictions of both the kinetics of growth and the
evolution of the shape of the tissue interface.
Chapter 1. The physics of tissue patterning and extracellular matrix organisation: How cells join forces
27
Diffuse interfaces / Phase field methods
Rather than defining exactly the location of the interface, it is possible to allow the interface to extend
smoothly over a region of finite width on either side of the interface. This has the advantage of
avoiding the explicit treatment of the boundary conditions at the interface making the method
adaptable to mechanical, physical or chemical problems. These level-set methods (Osher 2001) are
common in materials science for modelling complex non-linear problems dealing with moving
boundaries like nucleation and growth phenomena in solidification or phase separation processes
(Thornton et al. 2003; Moelans et al. 2007). Such models have been used to study critical size defects
in wound healing (Javierre et al. 2008) and underline the impact of the geometry of the wound on the
healing process (Arciero et al. 2011) (Figure 1-5-C2). Level set methods are also used to model
tumour growth and invasion. Complex arrangements of proliferating and apoptotic cells embedded in
a matrix of healthy cells are reduced to simple systems with boundaries (Travasso et al. 2011). During
tumour growth, modelling the interfacial motion between different tissue types (healthy/cancerous or
cancerous/necrotic) helps to understand their separation and organisation in different phases. The
model predicts the evolution of tumour morphology and the critical curvature of the interface leading
to invasive growth, and estimates the impact of the distribution of biochemicals. The model has also
been applied to angiogenesis by coupling chemotaxis and cell proliferation to describe the formation
of ramified capillary networks (Travasso et al. 2011).
Conclusions / Outlook
Despite the complexity of the biological, chemical and mechanical processes behind multicellular
tissue organisation, the previous examples have shown that tissues can be modelled as active materials
obeying physical laws. This paper has briefly reviewed recent literature on the physics of how
individual cells interact with each other through mechanical forces, giving rise to emergent tissue
behaviour at macroscopic length scales (Figure 1-6). The theoretical concepts and modelling tools
discussed in this paper are also applied successfully in a wider range of biological fields than
mentioned here, such as plant development (Dumais et al. 2006), bacterial (Petroff et al. 2010), and
insect colonies (Camazine et al. 2001). Both experiments and theoretical studies on cell and tissue
behaviour have been discussed, since the combination of both is fundamental to gain new
understanding in such complex biological systems.
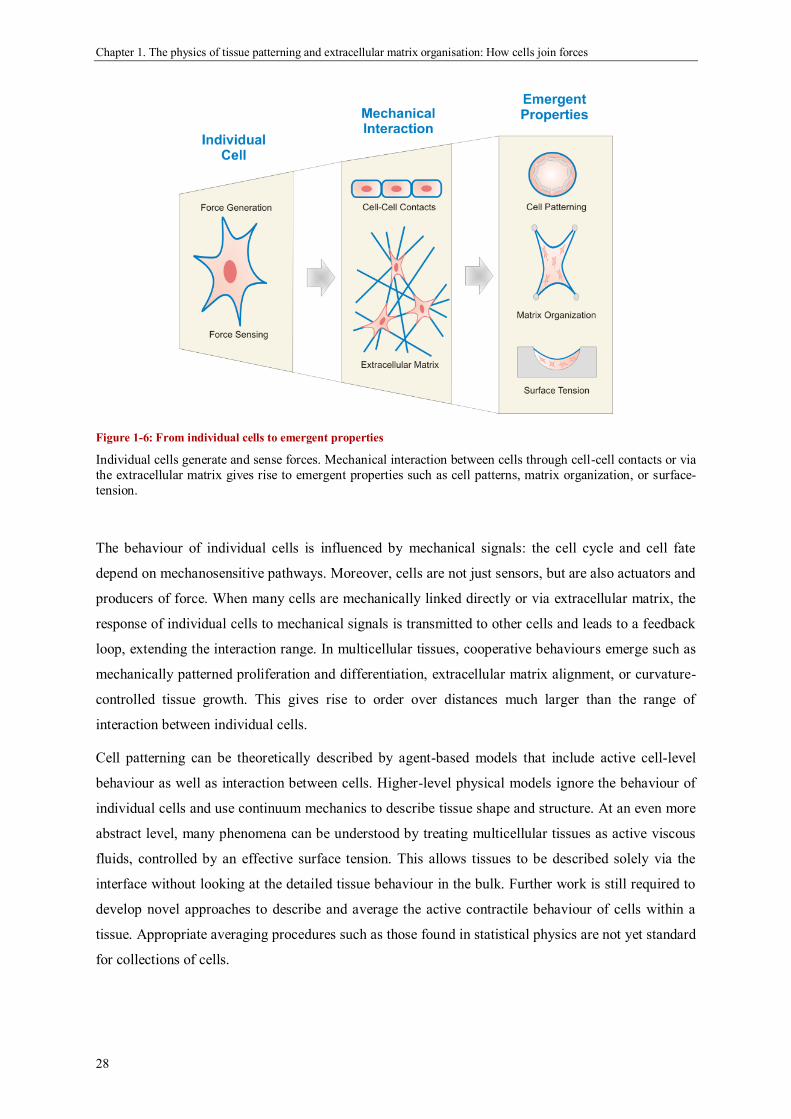
Chapter 1. The physics of tissue patterning and extracellular matrix organisation: How cells join forces
28
Figure 1-6: From individual cells to emergent properties
Individual cells generate and sense forces. Mechanical interaction between cells through cell-cell contacts or via
the extracellular matrix gives rise to emergent properties such as cell patterns, matrix organization, or surface-
tension.
The behaviour of individual cells is influenced by mechanical signals: the cell cycle and cell fate
depend on mechanosensitive pathways. Moreover, cells are not just sensors, but are also actuators and
producers of force. When many cells are mechanically linked directly or via extracellular matrix, the
response of individual cells to mechanical signals is transmitted to other cells and leads to a feedback
loop, extending the interaction range. In multicellular tissues, cooperative behaviours emerge such as
mechanically patterned proliferation and differentiation, extracellular matrix alignment, or curvature-
controlled tissue growth. This gives rise to order over distances much larger than the range of
interaction between individual cells.
Cell patterning can be theoretically described by agent-based models that include active cell-level
behaviour as well as interaction between cells. Higher-level physical models ignore the behaviour of
individual cells and use continuum mechanics to describe tissue shape and structure. At an even more
abstract level, many phenomena can be understood by treating multicellular tissues as active viscous
fluids, controlled by an effective surface tension. This allows tissues to be described solely via the
interface without looking at the detailed tissue behaviour in the bulk. Further work is still required to
develop novel approaches to describe and average the active contractile behaviour of cells within a
tissue. Appropriate averaging procedures such as those found in statistical physics are not yet standard
for collections of cells.
Chapter 1. The physics of tissue patterning and extracellular matrix organisation: How cells join forces
29
The emergence of collective behaviour due to cell-cell interactions based on “smell” and “touch” is an
area where modelling based on statistical physics and materials science seems to be a promising
approach. In particular, the cross-talk between biochemical and mechanical cell signalling and how
this leads to the emergence of tissue structure is far from being fully understood. The elucidation of
the intracellular processes clearly requires detailed analysis based on molecular biology coupled with
theoretical approaches. As was shown in this short review, reductionist treatments where cells are
described as automats, with predictable responses to chemical and mechanical stimuli, give
reasonable accounts for collective behaviour found in morphogenesis or regeneration. Comparing
such models to experimental studies will in turn allow us to infer what the cell responses need to be in
order to lead to the emergence of collective behaviour. More generally, the concepts presented have
many applications ranging from developmental biology (Mammoto and Ingber 2010), to regenerative
medicine (Hutmacher 2001), biomimetic materials science (Fratzl 2007) and diagnostic tools for
disease (Suresh et al. 2005).
Acknowledgements
The authors are grateful to numerous collaborators and colleagues and wish to especially
acknowledge: Monika Rumpler for a critical reading of the manuscript, and Krishna Kommareddy,
Manjubala Inderchand, Dieter Fischer, and Ernst Gamsjäger for detailed and deep discussions. PF is
grateful for support from the Alexander von Humboldt Foundation and the Max Planck Society in the
framework of the Max Planck Research Award. This work was supported in part by the Deutsche
Forschungsgemeinschaft within project FR2190/4-1 (Leibniz award to PF). CB thanks the Berlin-
Brandenburg School for Regenerative Therapies (BSRT) for support.
30
Transition to Chapter 2
The preceding review about “the physics of tissue patterning and extracellular matrix organisation”
showed that many experimental works and computational studies have been performed to understand
the influence of mechanical and geometrical cues on cellular responses at the sub-cellular, cellular and
multicellular scales. On the tissue level, quantitative evaluations of these observations are still
missing, although in-vivo and in-vitro experiments revealed some influence from the physical
properties of a substrate on the organisation of the cells and the extracellular matrix. Alternatively,
modelling methods based either on the behaviour of individual cells or on the global properties of the
tissue, were used to derive the changes in the living material. It was highlighted that understanding
quantitatively the influence of the physical cues at the tissue level, which still constitutes a gap in this
field of research, could then be possible by combining experimental and modelling works.
The in-vitro cell culture system proposed by Rumpler et al. (2008) is particularly interesting to
investigate and quantify the influence of geometry on tissue growth. Moreover, the curvature-driven
growth model they proposed, describes qualitatively the deposition of bone tissue by pre-osteoblasts
on three-dimensional surfaces. Based on these promising results, the initial goal of the present thesis
was to develop a computational tool to simulate curvature-driven growth on digital images. In that
way, tissue patterning derived from the model could be compared quantitatively to the evolution of
the tissue-medium interfaces extracted from the experimental images. In order to explain this purely
geometrical model on a biological basis, we suggested comparing curvature-driven growth to a simple
geometrical construction based on the elongated shape of the contractile cells. Moreover, bone like
geometries, namely cylinders and semi-cylinders to mimic osteons and hemi-osteons respectively,
were proposed to be used in the computational and the experimental models. Tissue shapes predicted
and obtained in-vitro were then compared to in-vivo patterns known from bone remodelling
examples.
The article presented in the next chapter reports and discusses the experimental and computational
results obtained when addressing these first objectives.
31
Chapter 2. How linear tension converts to curvature: Geometric
control of bone tissue growth
Cécile M. Bidan1, Krishna P. Kommareddy
1, Monika Rumpler
2, Philip Kollmannsberger
1,
Yves J.M. Bréchet3, Peter Fratzl
1, John W.C. Dunlop
1*
* Corresponding author
1 Department of Biomaterials, Max Planck Institute of Colloids and Interfaces, 14424 Potsdam,
Germany
2 Ludwig Boltzmann Institute of Osteology at the Hanusch Hospital of WGKK and AUVA Trauma
Centre Meidling, 1th Medical Department, Hanusch Hospital, Vienna, Austria
3 Materials and Processes Science and Engineering Laboratory (SIMaP), 38402 St Martin d’Hères,
France
This paper is published in PloS ONE: PLoS ONE 7(5): e36336.
DOI: 10.1371/journal.pone.0036336
Abstract
This study investigates how substrate geometry influences in-vitro tissue formation at length scales
much larger than a single cell.
Two-millimetre thick hydroxyapatite plates containing circular pores and semi-circular channels of
0.5 mm radius, mimicking osteons and hemi-osteons respectively, were incubated with MC3T3-E1
cells for 4 weeks. The amount and shape of the tissue formed in the pores, as measured using phase
contrast microscopy, depended on the substrate geometry. It was further demonstrated, using a simple
geometric model, that the observed curvature-controlled growth can be derived from the assembly of
tensile elements on a curved substrate. These tensile elements are cells anchored on distant points of
the curved surface, thus creating an actin “chord” by generating tension between the adhesion sites.
Such a chord model was used to link the shape of the substrate to cell organisation and tissue
patterning. In a pore with a circular cross-section, tissue growth increases the average curvature of the
surface, whereas a semi-circular channel tends to be flattened out.
Thereby, a single mechanism could describe new tissue growth in both cortical and trabecular bone
after resorption due to remodelling. These similarities between in-vitro and in-vivo patterns suggest
geometry as an important signal for bone remodelling.
My contribution
I performed the cell culture experiments, analysed data, implemented the computational tools to
measure curvature and simulate curvature-driven growth, proposed the chord model, did the
mathematical demonstration, contributed to the structure of the ideas and wrote the manuscript.
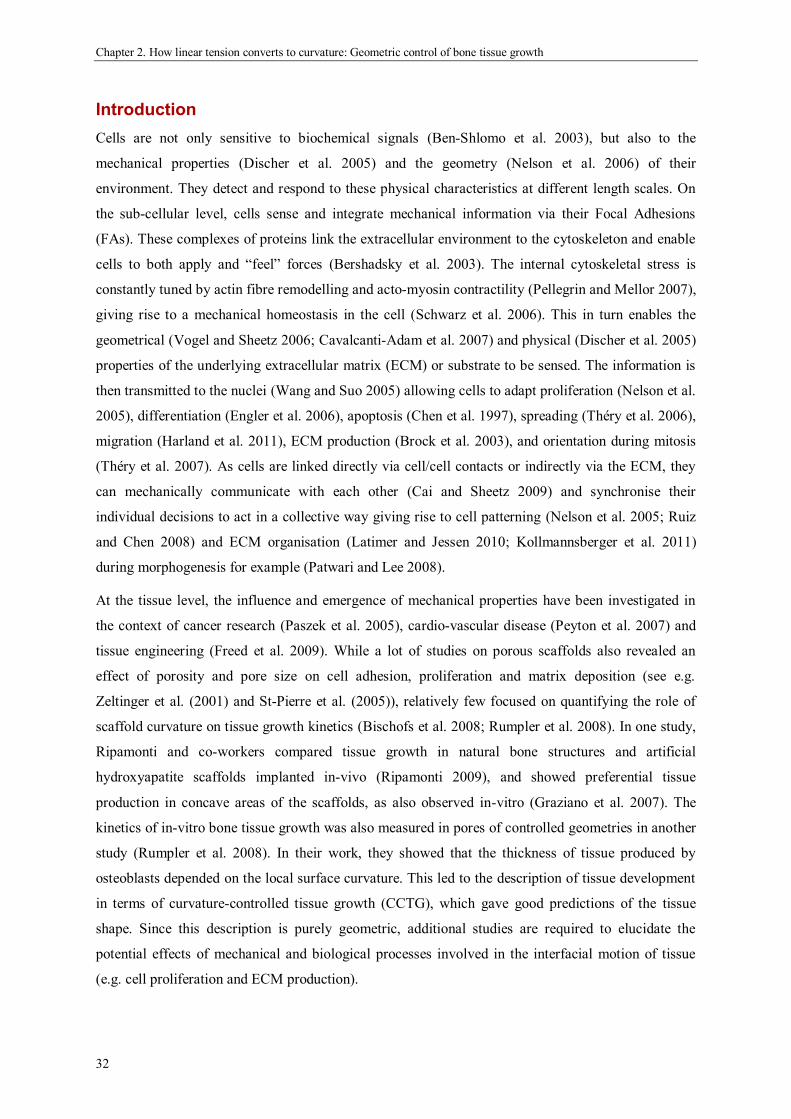
Chapter 2. How linear tension converts to curvature: Geometric control of bone tissue growth
32
Introduction
Cells are not only sensitive to biochemical signals (Ben-Shlomo et al. 2003), but also to the
mechanical properties (Discher et al. 2005) and the geometry (Nelson et al. 2006) of their
environment. They detect and respond to these physical characteristics at different length scales. On
the sub-cellular level, cells sense and integrate mechanical information via their Focal Adhesions
(FAs). These complexes of proteins link the extracellular environment to the cytoskeleton and enable
cells to both apply and “feel” forces (Bershadsky et al. 2003). The internal cytoskeletal stress is
constantly tuned by actin fibre remodelling and acto-myosin contractility (Pellegrin and Mellor 2007),
giving rise to a mechanical homeostasis in the cell (Schwarz et al. 2006). This in turn enables the
geometrical (Vogel and Sheetz 2006; Cavalcanti-Adam et al. 2007) and physical (Discher et al. 2005)
properties of the underlying extracellular matrix (ECM) or substrate to be sensed. The information is
then transmitted to the nuclei (Wang and Suo 2005) allowing cells to adapt proliferation (Nelson et al.
2005), differentiation (Engler et al. 2006), apoptosis (Chen et al. 1997), spreading (Théry et al. 2006),
migration (Harland et al. 2011), ECM production (Brock et al. 2003), and orientation during mitosis
(Théry et al. 2007). As cells are linked directly via cell/cell contacts or indirectly via the ECM, they
can mechanically communicate with each other (Cai and Sheetz 2009) and synchronise their
individual decisions to act in a collective way giving rise to cell patterning (Nelson et al. 2005; Ruiz
and Chen 2008) and ECM organisation (Latimer and Jessen 2010; Kollmannsberger et al. 2011)
during morphogenesis for example (Patwari and Lee 2008).
At the tissue level, the influence and emergence of mechanical properties have been investigated in
the context of cancer research (Paszek et al. 2005), cardio-vascular disease (Peyton et al. 2007) and
tissue engineering (Freed et al. 2009). While a lot of studies on porous scaffolds also revealed an
effect of porosity and pore size on cell adhesion, proliferation and matrix deposition (see e.g.
Zeltinger et al. (2001) and St-Pierre et al. (2005)), relatively few focused on quantifying the role of
scaffold curvature on tissue growth kinetics (Bischofs et al. 2008; Rumpler et al. 2008). In one study,
Ripamonti and co-workers compared tissue growth in natural bone structures and artificial
hydroxyapatite scaffolds implanted in-vivo (Ripamonti 2009), and showed preferential tissue
production in concave areas of the scaffolds, as also observed in-vitro (Graziano et al. 2007). The
kinetics of in-vitro bone tissue growth was also measured in pores of controlled geometries in another
study (Rumpler et al. 2008). In their work, they showed that the thickness of tissue produced by
osteoblasts depended on the local surface curvature. This led to the description of tissue development
in terms of curvature-controlled tissue growth (CCTG), which gave good predictions of the tissue
shape. Since this description is purely geometric, additional studies are required to elucidate the
potential effects of mechanical and biological processes involved in the interfacial motion of tissue
(e.g. cell proliferation and ECM production).

Chapter 2. How linear tension converts to curvature: Geometric control of bone tissue growth
33
A classic example of the interaction between geometry and tissue growth can be found in the process
of bone remodelling (Robling et al. 2006) which allows bone to renew and to adapt to slowly
changing mechanical environments. During bone remodelling, three cell types are involved:
osteocytes sense mechanical loads in existing bone (Owan et al. 1997; Nicolella et al. 2006; Bonewald
and Johnson 2008) and forward the signal to osteoclasts which resorb old or damaged bone, and to
osteoblasts which produce new collagenous tissue called osteoid. By definition, resorption and
deposition are two processes that locally change the surface geometry of the bone tissue. In cortical
bone remodelling, osteoclasts resorb bone, leaving cylindrical pores called osteons (Parfitt 1994).
These are then refilled by osteoidal tissue with a central blood vessel, the Haversian canal
(Kerschnitzki et al. 2011b). During the remodelling of trabecular bone however, osteoclasts dig out
small semi-circular channels or grooves called resorption pits or trails which can be seen as hemi-
osteons, that are later refilled with osteoid by the osteoblasts (Parfitt 1994). Despite the continually
changing local geometry, the mean curvature of the trabecular bone surface is tightly controlled
(Jinnai et al. 2002b). Indeed, the signals responsible for such a precise spatial orchestration of the cells
on the millimetre scale are still unclear. For instance, it is not clear why osteoblasts stop tissue
production once a hemi-osteonal lacuna is filled. This provides a strong motivation to understand the
influence of geometry on tissue deposition during bone remodelling – the goal of this paper.
Besides the quantitative description of tissue deposition on bone-like substrates, the present study
proposes a new physical explanation of how the organisation of contractile cells leads to CCTG, as
observed by Rumpler et al. (2008). Circular pores and semi-circular surfaces were designed in
hydroxyapatite scaffolds to mimic osteons and osteoclastic resorption pits (hemi-osteons),
respectively, and the scaffolds were incubated with MC3T3-E1 pre-osteoblast cells. In order to
quantify geometry evolution on experimental images, a computational tool based on the approach of
Frette et al. (2009) was used to measure the curvature profiles and integrated into an algorithm for
CCTG. In this paper, CCTG is shown to be equivalent to a simple geometrical construction
representing the organisation of individual tensile elements and called the chord model. This new
approach enables curvature-controlled tissue growth to be interpreted as the result of the superposition
of linear elements such as stretched cells and collagen fibres. By comparing a simple geometrical
model to experiments, this paper also highlights that the sum of mechanical and biological processes
responsible for tissue growth responds to simple geometrical rules giving rise to the patterns observed
in-vitro. This suggests geometry as a key regulatory element for the tight control of tissue deposition
during bone remodelling.

Chapter 2. How linear tension converts to curvature: Geometric control of bone tissue growth
34
Material and methods
Production of the hydroxyapatite (HA) plates
HA plates (2mm thick) containing circular pores and semi-circular vertical channels (nominal
diameter 1mm) were made by slurry casting. The moulds were designed using the computer-aided
design (CAD) software Alibre Design (Alibre Inc., Richardson, TX) and produced with a three-
dimensional (3D) wax printer, Model Maker II (Solidscape Inc., Merrimack, NH) as described in
(Manjubala et al. 2005) (Figure 2-1A). The moulds were filled with a HA slurry made of 15g of
methacrylamide monomers (MAM), 5g of N-N’-Methylenebisacrylamide (BMAM), 75g of water and
12.5g of Dextran for 300g of HA powder, and crosslinked with ammonium persulfate and N,N,N’,N’-
Tetramethylethylenediamine (TEMED). The structures were slowly air dried, pre-sintered and finally
sintered as done in (Woesz et al. 2005) (Figure 2-1B).
Cell culture
Murine pre-osteoblastic cells MC3T3-E1 (provided by the Ludwig Boltzmann Institute of Osteology,
Vienna, Austria) were seeded with a density of 105 cells/cm² on the surface of the HA scaffolds and
cultured for 28 days in α-MEM (Sigma-Aldrich, St. Louis, MO) supplemented with 10% foetal calf
serum (PAA laboratories, Linz, Austria), 0,1% ascorbic acid (Sigma-Aldrich, St. Louis, MO) and
0,1% gentamicin (Sigma-Aldrich, Steinheim, Germany) in a humidified atmosphere with 5% CO2 at
37°C (Figure 2-1C).
Imaging and analysis
Each pore was imaged every 3 to 4 days using a phase contrast microscope (Nikon Eclipse TS100,
Japan) equipped with a digital camera (Nikon Digital sight DS 2Mv) (Figure 2-1D). All pictures were
taken with a 4x objective, yielding the final image resolution pxlmm 2051 .
The digital images were semi-automatically binarised using ImageJ (National Institutes of Health,
Bethesda (Rasband 2008)). The contrast in the images enabled scaffold and tissue (black in the
binarised images) to be distinguished from the medium (white).
Measurement of the tissue production
Tissue production in the pores was quantified by determining the projected tissue area (PTA) formed
in the pores (Figure 2-1D). As this measurement is two-dimensional, it is only a proxy for quantifying
the volume of growth into the depth of the pore. The free section of a pore, corresponding to the white
regions in the binarised images, decreases with time. The PTA was then calculated by subtracting the
binarised image at an initial time point from the image at the time of interest. As cells needed time to
settle and start tissue deposition, the initial pore section was taken on the fourth day after seeding
(D4).
Chapter 2. How linear tension converts to curvature: Geometric control of bone tissue growth
35
The experiments presented here included 6 pores for each shape: circular pores (CIR) and semi-
circular channels (SC). Two other sets of experiments repeated in the same conditions showed similar
results (data not shown).
Figure 2-1: Experimental protocol
A - Moulds were produced by rapid prototyping. A build wax (blue) was used to print the mould in 3D. A
support wax (red) was added to reinforce the object while printing, and then removed by dissolution. B -
Hydroxyapatite slurry was cast into the moulds, slowly dried and sintered. C - Pre-osteoblast cells were seeded
(105 cells/cm²) on the scaffolds and cultured for 28 days. D - Tissue growth was quantified by phase contrast
microscopy twice a week by measuring the projected tissue area (PTA) in each pore.
Immunofluorescence staining
Some scaffolds were washed with phosphate buffered saline (PBS), fixed with 4% paraformaldehyde
and permeabilized with 0.1% Triton-X100 (Sigma-Aldrich, Steinheim, Germany). After 15min
blocking in 10% blocking reagent (Roche, Germany), the samples were incubated for 1h in a 1:200
solution of myosin IIb antibody (Cell Signaling Technology, Beverly, MA) and 1h in a 1:200 solution
of anti-Rabbit IgG AF 488 (Cell Signaling Technology, Beverly, MA). Once washed in PBS, the
Chapter 2. How linear tension converts to curvature: Geometric control of bone tissue growth
36
tissue was stained for actin stress fibers by incubating with TRITC-Phalloidin 4 x 10⁻⁸
M (Sigma-
Aldrich, Steinheim, Germany) for 40min. After fixation, some of the samples were permeabilized as
mentioned above and stained for nuclei with a 1:300 solution of TO-PRO3 (Invitrogen, Oregon, USA)
for 5min. Images of stress fibres, myosin and nuclei were obtained using a confocal laser scanning
microscope (Leica, Germany).
Curvature measurement
The curvature profile of the interface between the tissue and the medium on each binarised image was
calculated using Frette’s algorithm (Bullard et al. 1995; Frette et al. 2009) implemented in a custom
made Matlab code (Matlab 7.8.0 R2009a, MathWorks, Natick, MA). This method has an advantage
over other curvature measurements based on spline fitting (Worring and Smeulders 1993), in that it
can be applied directly to digital images coming from the phase contrast measurements. The algorithm
first located the pixels on the tissue-medium interface in the binarised image. The local curvature
R
1 associated with an interface pixel was then estimated from the ratio of the number of black to
white pixels lying within a given radius from the interface:
2
13
totA
A
r
(Eq.1)
where A is the number of pixels in the mask and on the outer side of the interface, totA is the number
of pixels in the mask and r is the mask radius (Figure 2-2A and B). The calculation was made for all
pixels on the interface on each side of the border. The local curvature in one position of the interface
was taken as the mean value of the curvatures measured on the outer pixel and the inner pixel. In the
limit of a perfectly smooth interface and an infinitely small radius, this ratio corresponds to the local
curvature. In this paper, a positive curvature is defined as a concave surface (Figure 2-3). Average
curvatures ave were determined along the perimeter of the pore for circles, and along a portion of the
interface in semi-circles. The precision of the measurements are discussed in the Supporting Material.
Curvature-controlled tissue growth
An equivalent of the CCTG model presented by Rumpler et al. (2008) was implemented by
incorporating the curvature estimation of Frette et al. (2009). The technique to estimate interfacial
curvature on a binary image was extended towards a description of growth by scanning the mask over
the entire image, giving “effective curvature” values for all pixels (Figure 2-2C). Assuming that
growth occurs only in concave regions, each white pixel where the effective curvature is positive was
changed to black, representing tissue deposition. The process was then iterated to describe CCTG.
This method has the advantage that growth can be directly compared with the experimental pore
geometries.
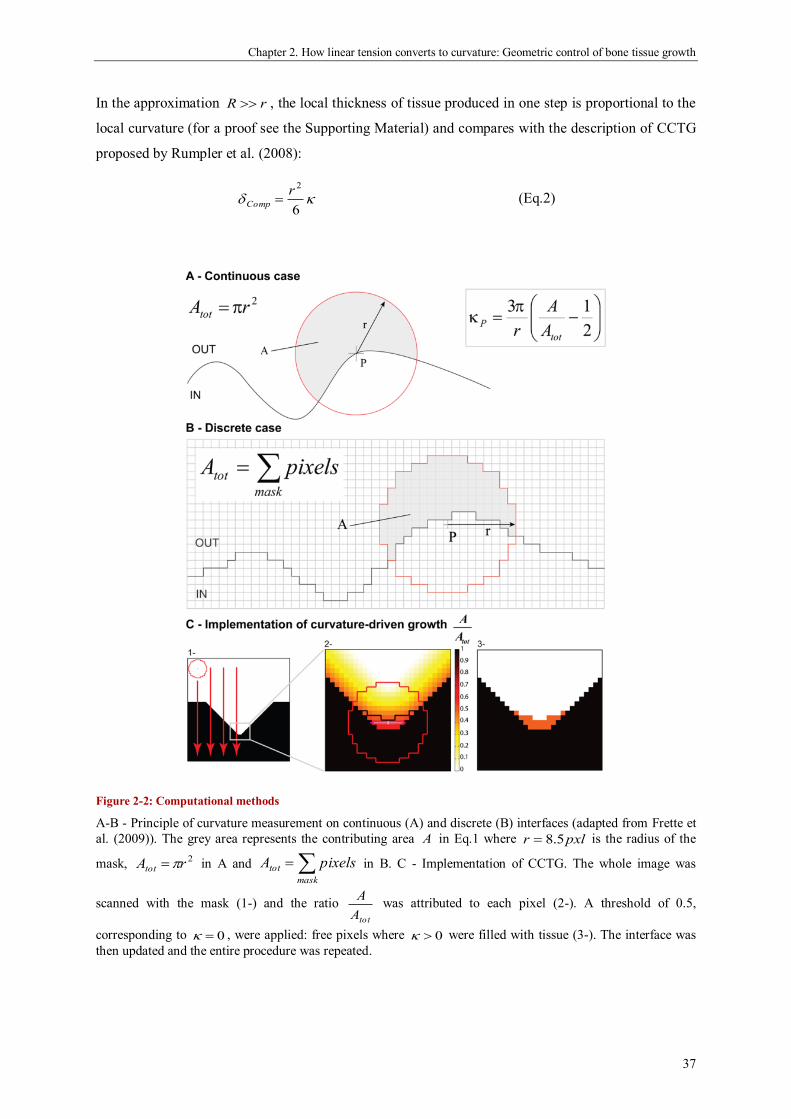
Chapter 2. How linear tension converts to curvature: Geometric control of bone tissue growth
37
In the approximation rR , the local thickness of tissue produced in one step is proportional to the
local curvature (for a proof see the Supporting Material) and compares with the description of CCTG
proposed by Rumpler et al. (2008):
6
2rComp (Eq.2)
Figure 2-2: Computational methods
A-B - Principle of curvature measurement on continuous (A) and discrete (B) interfaces (adapted from Frette et
al. (2009)). The grey area represents the contributing area A in Eq.1 where pxlr 5.8 is the radius of the
mask, 2rAtot in A and
mask
tot pixelsA in B. C - Implementation of CCTG. The whole image was
scanned with the mask (1-) and the ratio totA
A was attributed to each pixel (2-). A threshold of 0.5,
corresponding to 0 , were applied: free pixels where 0 were filled with tissue (3-). The interface was
then updated and the entire procedure was repeated.
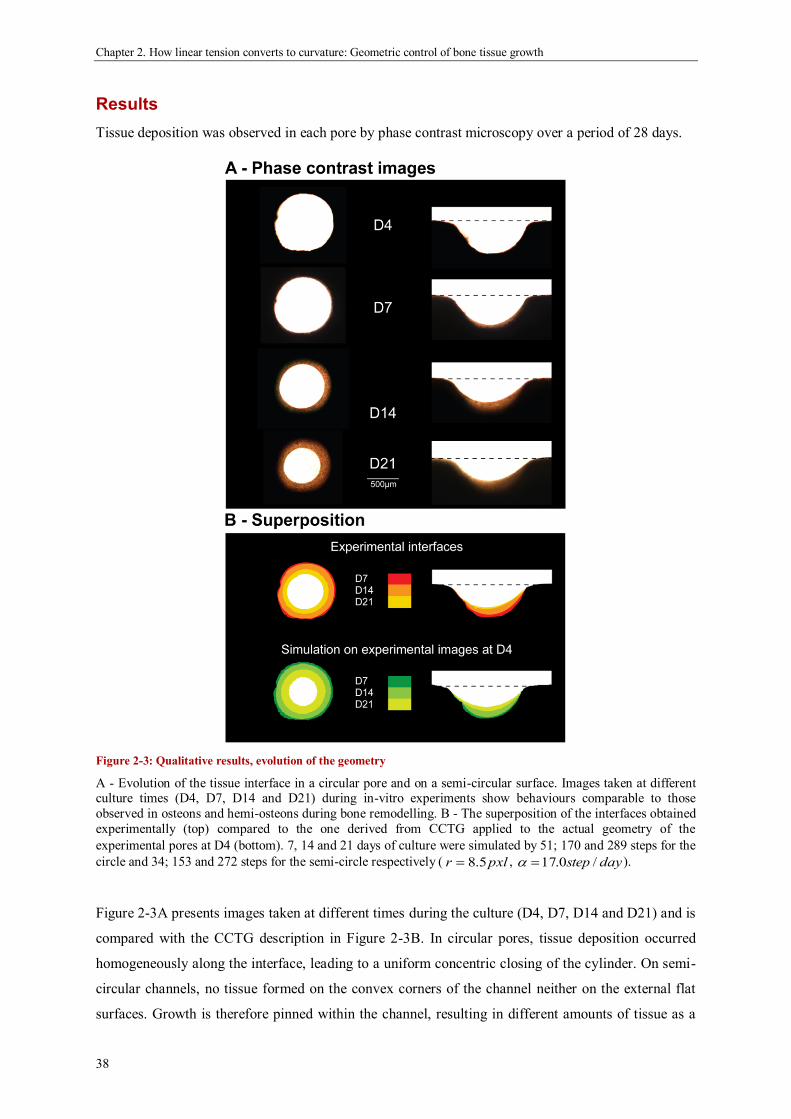
Chapter 2. How linear tension converts to curvature: Geometric control of bone tissue growth
38
Results
Tissue deposition was observed in each pore by phase contrast microscopy over a period of 28 days.
Figure 2-3: Qualitative results, evolution of the geometry
A - Evolution of the tissue interface in a circular pore and on a semi-circular surface. Images taken at different culture times (D4, D7, D14 and D21) during in-vitro experiments show behaviours comparable to those
observed in osteons and hemi-osteons during bone remodelling. B - The superposition of the interfaces obtained
experimentally (top) compared to the one derived from CCTG applied to the actual geometry of the
experimental pores at D4 (bottom).7, 14 and 21 days of culture were simulated by 51; 170 and 289 steps for the
circle and 34; 153 and 272 steps for the semi-circle respectively pxlr 5.8 , daystep /0.17 ).
Figure 2-3A presents images taken at different times during the culture (D4, D7, D14 and D21) and is
compared with the CCTG description in Figure 2-3B. In circular pores, tissue deposition occurred
homogeneously along the interface, leading to a uniform concentric closing of the cylinder. On semi-
circular channels, no tissue formed on the convex corners of the channel neither on the external flat
surfaces. Growth is therefore pinned within the channel, resulting in different amounts of tissue as a
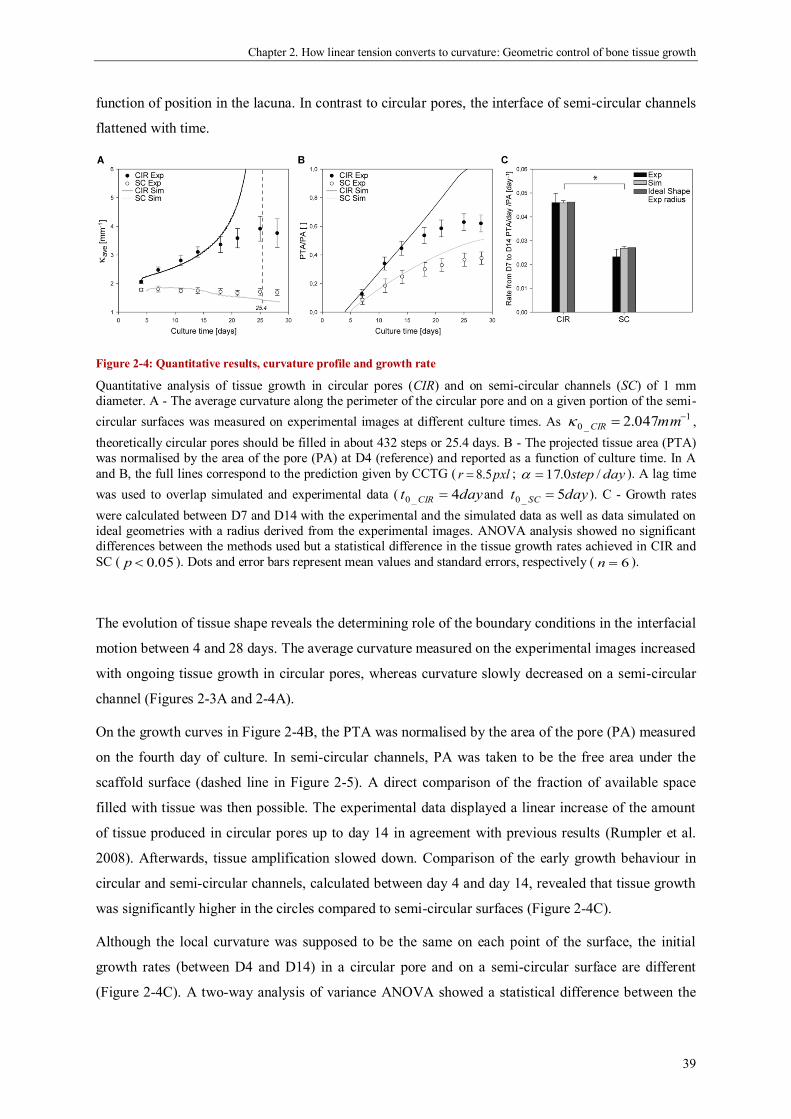
Chapter 2. How linear tension converts to curvature: Geometric control of bone tissue growth
39
function of position in the lacuna. In contrast to circular pores, the interface of semi-circular channels
flattened with time.
Figure 2-4: Quantitative results, curvature profile and growth rate
Quantitative analysis of tissue growth in circular pores (CIR) and on semi-circular channels (SC) of 1 mm
diameter. A - The average curvature along the perimeter of the circular pore and on a given portion of the semi-
circular surfaces was measured on experimental images at different culture times. As 1
_0 047.2 mmCIR ,
theoretically circular pores should be filled in about 432 steps or 25.4 days. B - The projected tissue area (PTA)
was normalised by the area of the pore (PA) at D4 (reference) and reported as a function of culture time. In A
and B, the full lines correspond to the prediction given by CCTG ( pxlr 5.8 ; daystep /0.17 ). A lag time
was used to overlap simulated and experimental data ( dayt CIR 4_0 and dayt SC 5_0 ). C - Growth rates
were calculated between D7 and D14 with the experimental and the simulated data as well as data simulated on
ideal geometries with a radius derived from the experimental images. ANOVA analysis showed no significant
differences between the methods used but a statistical difference in the tissue growth rates achieved in CIR and
SC ( 05.0p ). Dots and error bars represent mean values and standard errors, respectively ( 6n ).
The evolution of tissue shape reveals the determining role of the boundary conditions in the interfacial
motion between 4 and 28 days. The average curvature measured on the experimental images increased
with ongoing tissue growth in circular pores, whereas curvature slowly decreased on a semi-circular
channel (Figures 2-3A and 2-4A).
On the growth curves in Figure 2-4B, the PTA was normalised by the area of the pore (PA) measured
on the fourth day of culture. In semi-circular channels, PA was taken to be the free area under the
scaffold surface (dashed line in Figure 2-5). A direct comparison of the fraction of available space
filled with tissue was then possible. The experimental data displayed a linear increase of the amount
of tissue produced in circular pores up to day 14 in agreement with previous results (Rumpler et al.
2008). Afterwards, tissue amplification slowed down. Comparison of the early growth behaviour in
circular and semi-circular channels, calculated between day 4 and day 14, revealed that tissue growth
was significantly higher in the circles compared to semi-circular surfaces (Figure 2-4C).
Although the local curvature was supposed to be the same on each point of the surface, the initial
growth rates (between D4 and D14) in a circular pore and on a semi-circular surface are different
(Figure 2-4C). A two-way analysis of variance ANOVA showed a statistical difference between the
Chapter 2. How linear tension converts to curvature: Geometric control of bone tissue growth
40
shapes (CIR vs SC) and no significant influence of the methods used (Experiment vs Simulation on
experimental shapes vs Simulation on ideal shape). All pair-wise multiple comparisons were done
following the Holm-Sidak method and p values of less than 0.05 were considered significant. The
geometry of the substrate influenced the speed of tissue production by the cells. The CCTG
description correctly predicted that the average curvature diverges as the circular pore filled whereas
it should converge toward zero (flat surface) in semi-circular channels (Figure 2-4A).
In order to compare predictions and in-vitro results, a time scale parameter in 1. daystep was
derived from the ratio between simulated and experimental growth rates measured in circular pores in
12 . stepmm and 12 . daymm respectively. The tissue growth rate was derived from the simulations
performed on experimental images with pxlr 5.8 , 12 .00167.0
stepmm
PTA
sim and
experimentally measured on the early stage (D7 to D14) and is considered constant:
12
exp
.0284.0 daymmdt
dPTA . The time scale used in the following is thus 1.0.17 daystep .
Quantitative results predicted by application of CCTG on experimental images at D4 are reported in
Figure 2-4B. The simulated projected tissue areas (PTA) were normalised by the area of the
respective pores at D4 (PA) and averaged ( 6n ). An additional lag time was used to overlap
simulated and experimental data: dayt CIR 4_0 and dayt SC 5_0 . 0t represents the time cells need
to spread and colonize the scaffold before starting growth and is known to depend on the geometry of
the pore (Kommareddy et al. 2010). Once the single free parameter of the calculations is fitted on the
experimental growth in circular pores ( 1.0.17 daystep ), CCTG also correctly described the initial
growth behaviour on semi-circular channels (Figure 2-4A, B and C). However, it did not explain the
notable slowdown observed experimentally in both geometries from D14.
A “chord model” to explain curvature-controlled tissue growth
Although CCTG can predict both the geometry and the linear kinetics of tissue formation, it contains
no intrinsic time scale and provides no mechanistic explanation of the curvature sensing of cells and
tissue.
In the following, tissue is considered as a collection of stretched cells and fibrous ECM, and growth is
described as occurring via the assembly of such tensile elements (chords) on a surface. In this section,
it is demonstrated that CCTG is a direct consequence of this simple geometric construction. Besides
giving a mechanistic interpretation of the CCTG on the cellular level, the chord model also motivates
the interaction range (mask size) chosen for measuring curvature and thereby justifies the time scale
of the computational implementation.
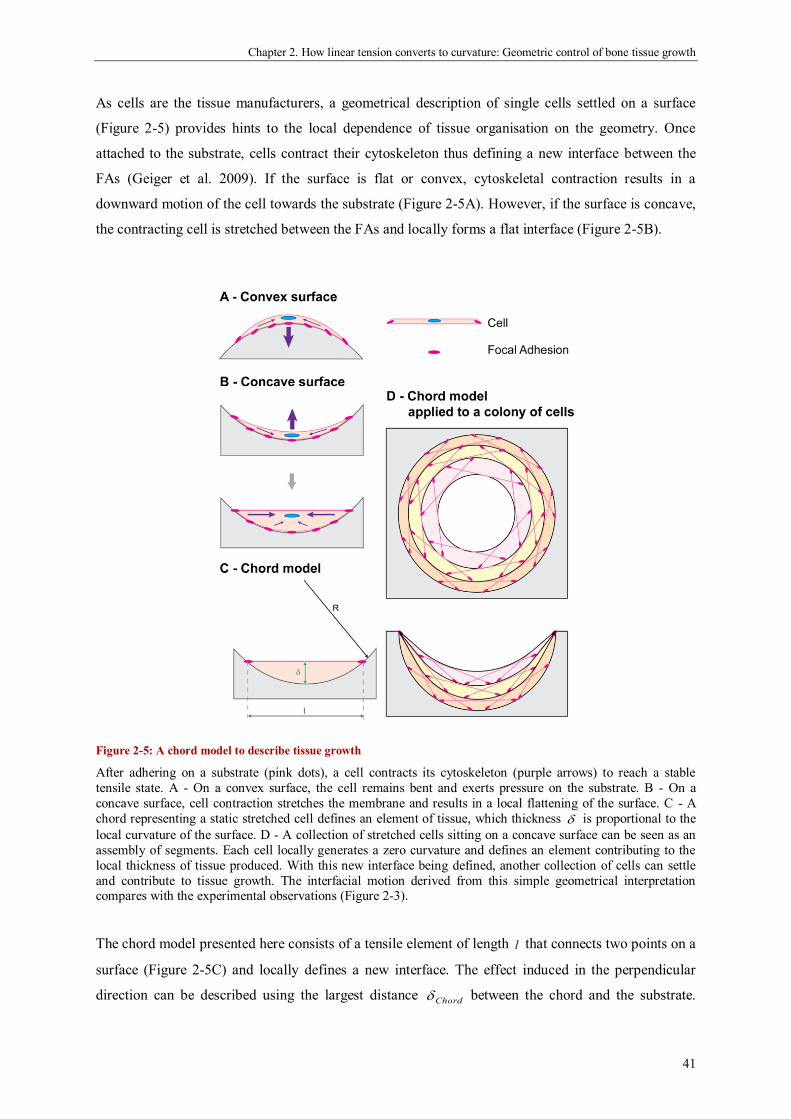
Chapter 2. How linear tension converts to curvature: Geometric control of bone tissue growth
41
As cells are the tissue manufacturers, a geometrical description of single cells settled on a surface
(Figure 2-5) provides hints to the local dependence of tissue organisation on the geometry. Once
attached to the substrate, cells contract their cytoskeleton thus defining a new interface between the
FAs (Geiger et al. 2009). If the surface is flat or convex, cytoskeletal contraction results in a
downward motion of the cell towards the substrate (Figure 2-5A). However, if the surface is concave,
the contracting cell is stretched between the FAs and locally forms a flat interface (Figure 2-5B).
Figure 2-5: A chord model to describe tissue growth
After adhering on a substrate (pink dots), a cell contracts its cytoskeleton (purple arrows) to reach a stable
tensile state. A - On a convex surface, the cell remains bent and exerts pressure on the substrate. B - On a
concave surface, cell contraction stretches the membrane and results in a local flattening of the surface. C - A
chord representing a static stretched cell defines an element of tissue, which thickness is proportional to the
local curvature of the surface. D - A collection of stretched cells sitting on a concave surface can be seen as an
assembly of segments. Each cell locally generates a zero curvature and defines an element contributing to the
local thickness of tissue produced. With this new interface being defined, another collection of cells can settle
and contribute to tissue growth. The interfacial motion derived from this simple geometrical interpretation compares with the experimental observations (Figure 2-3).
The chord model presented here consists of a tensile element of length l that connects two points on a
surface (Figure 2-5C) and locally defines a new interface. The effect induced in the perpendicular
direction can be described using the largest distance Chord between the chord and the substrate.
Chapter 2. How linear tension converts to curvature: Geometric control of bone tissue growth
42
Simple geometrical relations (detailed in the Supporting Material) demonstrate that the local
interfacial motion induced by the deposition of a single chord Chord is proportional to the local
curvature R
1 with the hypothesis lR :
8
2lChord (Eq.3)
Combining this effect for all possible positions of the chord on the substrate predicts the location of
the interface once a collection of tensile elements has been laid down (Figure 2-5D). Additional layers
can then settle iteratively on the surface.
Equations 2 and 3 demonstrate that the superposition of tensile elements on a curved surface generates
an interfacial motion equivalent to the CCTG evolution presented earlier (Figure 2-2 and Rumpler et
al. (2008)). Using lr2
3 as the radius of the mask in the computational method leads to full
quantitative consistency between the chord model and the CCTG description:
8
2lCompChord . Mathematical details are provided in the Supporting Material. Moreover,
Figure 2-5D reveals that geometries derived from the chord model also compared well with the
experimental observations (Figure 2-3).
Considering cells as tensile elements, the chord model can describe tissue growth and its curvature-
driven behaviour. Additional support comes from the observation of actin fibres that indicate stresses
produced by interacting cells. These stress fibres formed rings inside circular channels (Figure 2-6B),
as previously observed (Rumpler et al. 2008), which are reminiscent of contractile actin –myosin
rings found in wound healing for other cell types (Bement 2002; Martin and Parkhurst 2004; Salbreux
et al. 2009). Actin fibres co-localizing with myosin are shown in concave regions on Figure 2-6A.
These fibres have an arrangement very similar to the chords in Figure 2-5B, supporting the idea that
cells in the tissue collectively exert tensile stress as they adhere to matrix and substrate. On convex
surfaces however, Figure 2-6A clearly shows a much lower density of contractile chords, also in
agreement with the model in Figure 2-5. A convex surface (Figure 2-6D) was also tested, and,
interestingly, only a mono-layer of tissue was observed even up to late growth stages.
Staining tissue for cell nuclei reveals a homogeneous cell density all over the projected tissue area
(Figure 2-6C). This shows that cell density is independent of curvature. Note that the global geometry
of the new interface is independent of the number of chords, i.e. cell density, in one layer. Moreover,
the geometry of a substrate is known to influence cell proliferation by determining the stress
distribution in the contractile cell layer (Nelson et al. 2005). Although no proliferation study was
performed here, the constant cell density suggests that cell proliferation adapts as the curvature
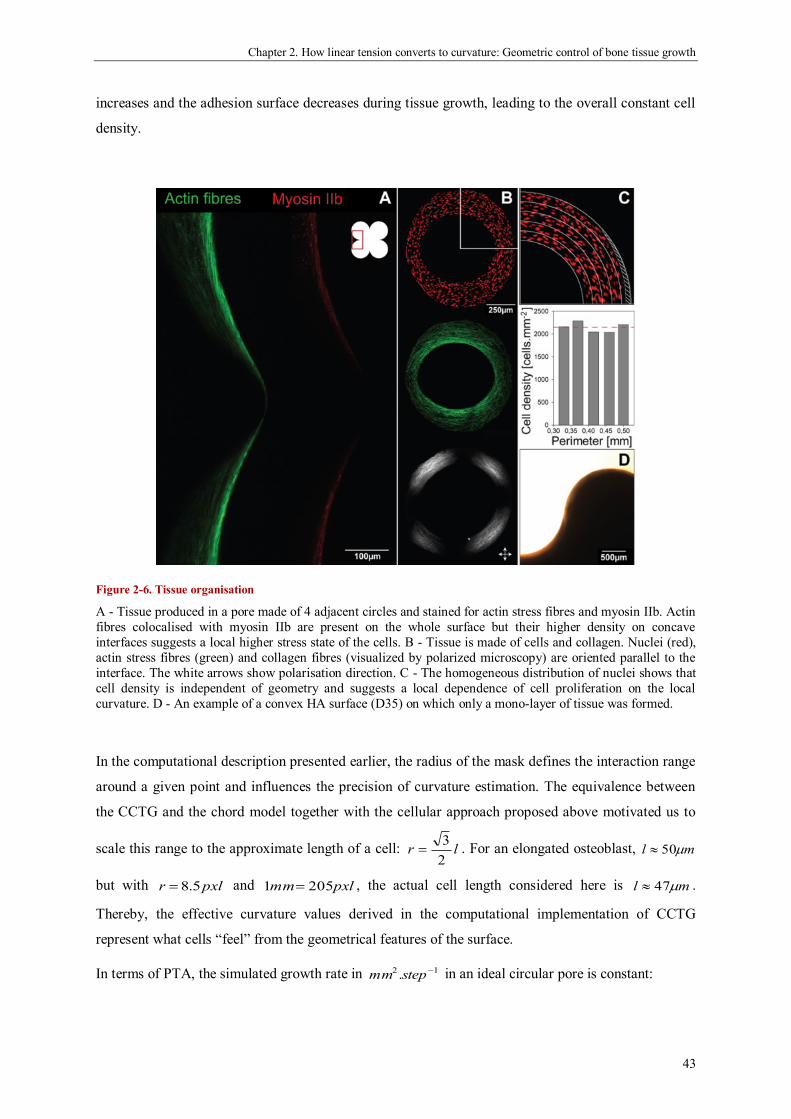
Chapter 2. How linear tension converts to curvature: Geometric control of bone tissue growth
43
increases and the adhesion surface decreases during tissue growth, leading to the overall constant cell
density.
Figure 2-6. Tissue organisation
A - Tissue produced in a pore made of 4 adjacent circles and stained for actin stress fibres and myosin IIb. Actin
fibres colocalised with myosin IIb are present on the whole surface but their higher density on concave
interfaces suggests a local higher stress state of the cells. B - Tissue is made of cells and collagen. Nuclei (red),
actin stress fibres (green) and collagen fibres (visualized by polarized microscopy) are oriented parallel to the
interface. The white arrows show polarisation direction. C - The homogeneous distribution of nuclei shows that
cell density is independent of geometry and suggests a local dependence of cell proliferation on the local
curvature. D - An example of a convex HA surface (D35) on which only a mono-layer of tissue was formed.
In the computational description presented earlier, the radius of the mask defines the interaction range
around a given point and influences the precision of curvature estimation. The equivalence between
the CCTG and the chord model together with the cellular approach proposed above motivated us to
scale this range to the approximate length of a cell: lr2
3 . For an elongated osteoblast, ml 50
but with pxlr 5.8 and pxlmm 2051 , the actual cell length considered here is ml 47 .
Thereby, the effective curvature values derived in the computational implementation of CCTG
represent what cells “feel” from the geometrical features of the surface.
In terms of PTA, the simulated growth rate in 12 . stepmm in an ideal circular pore is constant:
Chapter 2. How linear tension converts to curvature: Geometric control of bone tissue growth
44
34)()(2)(
22 rlR
PTA
id
(Eq.4)
This constant rate derived in closed convex shapes (circles) confirms the equivalence between the
chord model and the CCTG description proposed by Rumpler et al. (2008).
According to equation 4, the simulated growth rate and thus the time scale of the model depend on the
interaction range chosen. The simplest approach to determine this time scale is to assume that the
experimental growth rate is also proportional to curvature. This requires the definition of one
parameter )(l that fits the time of simulated growth in steps to the time t of experimental tissue
growth in days, which leads to:
3)(
4)(
22
exp
rr
ll
d
dPTA
(Eq.5)
Equations 4 and 5 show that )(l scales with the inverse of the square of the interaction range chosen
in the model and can always be derived by comparing simulated and measured tissue growth rates in
the experimental pores. The interaction range being fixed to ml 47 , is a constant accounting
for the kinetics of all the biological phenomena contributing to tissue deposition (cell migration,
proliferation, ECM synthesis, etc.).
and t being proportional, the interfacial motion derived from the model can be described as a
continuous function of time
t . To quantify kinetics, the evolution of the distance between tissue
interface and the substrate (in 12 . stepmm ) was derived in an ideal pore by integrating equation 3:
dt
tdR
tR
lt
)(
)(8)(
2
(Eq.6)
This gives a solution in terms of curvature:
tltR
t
41
)(
1)(
2
02
0
(Eq.7)
The time needed for an ideal circle to be filled was determined for a radius equal to zero and an
infinite curvature:
20
2
4
lt fill (Eq.8)
Chapter 2. How linear tension converts to curvature: Geometric control of bone tissue growth
45
Discussion
The amount and the shape of the tissue produced by MC3T3-E1 cells cultured in pores of controlled
geometries were quantified in terms of PTA and curvature on phase contrast images taken over a
period of 28 days. The chord model not only agrees with the computational implementation of CCTG
as described in Figure 2-2, but it also provides a relevant interpretation on the cellular scale of the
equivalent behaviour observed during tissue growth (Figure 2-3). Moreover, the works of Théry et al.
(Théry et al. 2006) about the shape and the stress state of a cell after spreading and contraction,
support the approach sketched on Figure 2-5.
As described earlier, one step of the computational implementation of CCTG represents roughly the
contribution of one layer of cells to the tissue thickness. In agreement with the hypothesis of CCTG,
the simulation predicts a constant tissue growth rate (in 12 . stepmm ) in an ideal circle (Rumpler et al.
2008). This rate only depends on the cell size, arbitrarily set to µm47 (Eq.7). Measuring the initial
experimental rate (in 12 . daymm ) in circular pores enabled us to fit the model of growth with a
unique parameter that introduces a linear time scale by giving the number of steps needed to represent
one day of experiment: 1.0.17 daystep . Although this parameter should theoretically represent
the number of cell layers deposited in one day of culture, the high value suggests that some
assumptions are too simple. For example, stretched osteoblasts in culture are probably not
homogeneous in size l and are likely to be larger than µm47 . Moreover, a chord model only based on
cells implies that the contribution of the ECM is neglected although Figure 2-6B reveals the presence
of collagen fibres aligned with the interface, just as actin fibres in stretched cells. Considering larger
cells and/or adding collagen fibres in the definition of the tensile elements would increase the
simulated growth rate and decrease toward more realistic values. Importantly, does not interfere
with the geometrical behaviour of the interface but just rescales the evolution in time.
The circular pores and semi-circular surfaces produced in the experiments were chosen with the same
radius, i.e. the same local curvature, along the interface. Although CCTG supposes a local growth rate
proportional to the local curvature, Figure 2-4C shows a significant difference in the normalised
global growth rates ( PAPTA/ ) on circular pores and semi-circular surfaces. The qualitative results
(Figure 2-3) as well as the evolution of the average curvature (Figure 2-4A) suggest the importance of
the boundary conditions for the pattern of tissue deposition. As no growth occurs on the convexities
(Figure 2-6D), the tissue laid down within concavities flattens the surface in semi-circular channels,
i.e. decreases the average curvature. In circular pores however, the concentric growth increases
curvature.
To underline the determining role of the convex corners as seen in Figure 2-6, CCTG was simulated
on artificial images (Figure 2-7A-F). All geometries were based on a semi-circle ( mmR 5.0 ) that is
differently linked to the surrounding flat surfaces. Figure 2-7 shows that although the local curvature

Chapter 2. How linear tension converts to curvature: Geometric control of bone tissue growth
46
is the same on a given portion, tissue deposition (in time and space) depends strongly on the geometry
of the surroundings. As the tissue grows, changes in the curvature profile of the interface affect both
local and global growth rates. Although the phenomenon is slightly exaggerated due to the discrete
character of the computational method (Figure 2-7A and B), it is interesting to note the slowdown of
growth when tissue reaches the convex corners. This suggests geometry as a potential signal for
osteoblasts to decrease and eventually stop tissue production when a hemi-osteonal lacuna is filled.
Figure 2-7: Importance of the boundary conditions
Tissue growth (orange) was simulated on different artificial images using the CCTG description (A to F). The
predicted PTA is reported as a function of iteration steps. Each initial interface (black) contains a semi-circle
with a radius of 0.5 mm. The different boundary conditions show the influence expected on tissue growth rate
and organisation. On A, B and C, the model predicts that the sharper the convex corners, the slower the growth.
Tissue is eventually deposited on convex surfaces after the surroundings have been filled and the interface has
locally become concave (red arrows). Comparing A, D and E reveals that shifting the convex corners upward prolongs the duration of a constant growth rate which is half of the one obtained in a full circle (F). Tissue
deposition can expand on the walls until it reaches the convex corners. From this time point (inset), the surface
joining the pinning points is minimised, which decreases the curvature and slows the growth.
Figure 2-4B reveals a slowdown of the experimental tissue growth after 18 days of cell culture that is
not predicted by the chord model fitted with a linear time scale. However, more complex scaling laws
could be used to depict the non-linearities induced as cells slow down proliferation and ECM
synthesis when they differentiate and mature (Stein and Lian 1993). For example, pre-osteoblasts
differentiate towards osteoblasts during culture and begin to synthesise alkaline phosphatase (ALP).
As the plateau often appears after 14 days of culture or later, which approximately corresponds to the
beginning of ALP synthesis by such cells (Quarles et al. 1992), the influence of the differentiation
could be a possible explanation for the decrease in tissue production. In parallel, the ECM synthesized
by the osteoblasts also undergoes maturation, whereby cross-link formation in the collagen matrix

Chapter 2. How linear tension converts to curvature: Geometric control of bone tissue growth
47
increases with culture time (Gerstenfeld et al. 1993; Saito et al. 2004). This could implement a denser
packing of the tissue and explain the plateau in PTA. As the CCTG description is intrinsically a
geometrical description, adapting the time scale would be a simple way to take the effects of cell and
matrix maturation into account. For a given interaction range, the number of steps representing one
day of culture )(t would then decrease with time, and the scaling law would require an additional
time characteristic representing the slowdown of cell activity with ageing.
Alternatively, the plateau in tissue production observed after two weeks of culture may have a
geometrical origin. In the experiments, tissue is grown in 2mm thick scaffolds with straight sided
pores, and only the projected tissue area is measured on phase contrast images. Using PTA as a proxy
to quantify the amount of tissue produced in the pore implies that the local tissue thickness is
homogeneous along the third axis, which is unlikely. Indeed, cells need time to migrate and therefore
can not build the same thickness of tissue simultaneously throughout the depth of the channel.
Moreover, the extremities of the pore present convex corners in 3D and such boundary conditions are
expected to affect the growth pattern along the z-axis. As a consequence, pores are unlikely to remain
straight during growth, and a second principal curvature (different from zero) should then complete
the geometrical characterisation of the interface in 3D. Although this second principal curvature is
expected to play a role, the approaches proposed in this study assume that only one principal
curvature (in the image plane) changes during growth whereas the other remains constant and zero
(straight sided pores). The slowdown of tissue growth observed in terms of PTA could then be
explained by the emergence of a convexity (negative second principal curvature) in the z-direction
that is not taken into account in the previous calculations. Extending the CCTG description to 3D
would be of great interest to understand which combination of the two principal curvatures is relevant
for tissue growth: mean curvature, Gaussian curvature, maximal curvature, etc. As such models
predict interface evolution toward surfaces of minimal energy, this 3D mean curvature would then
decrease and tend towards zero, much akin to what is observed in trabecular bone (Jinnai et al.
2002b).
Interestingly, curvature-controlled growth is well known in physics and material sciences and has
been used to describe electrochemical coating (Sethian and Shan 2008) (Wheeler et al. 2003),
solidification (Zhu et al. 2001), and grain growth (Radhakrishnan and Zacharia 1995), for example.
Such processes come about in systems with high surface tensions, in which surface energy is linked to
curvature through the Laplace equation, as commonly seen in wetting problems (Quere 2008). Surface
tension has also been shown to be a determining factor in biology, mainly in the context of the
Differential Adhesion Hypothesis (Foty and Steinberg 2005). This interfacial characteristic is not only
responsible for self-sorting on the cell level during gastrulation (Schötz et al. 2008) and tumour
invasion (Travasso et al. 2011) but also for tissue organisation (Bischofs et al. 2008).
Chapter 2. How linear tension converts to curvature: Geometric control of bone tissue growth
48
While it was known that tissue-producing cells respond to geometry (Ripamonti 2009) following a
principle of CCTG on a millimetre scale (Rumpler et al. 2008), the present study shows that the
patterns of growth obtained in circular pores and on semi-circular channels are analytically equivalent
to those derived from a simple construction based on tensile elements representing stretched cells. No
direct geometry sensing is necessary to explain the resulting curvature-controlled growth. The shape
of the surface affects the spatial distribution of FAs and thereby the shape of the contractile cells
(Théry et al. 2006) as well as the forces they sense (Vogel and Sheetz 2006) and produce (Nelson et
al. 2005). Adding a time scale enables the model to predict the kinetics of tissue deposition: faster
growth occurs in circular pores compared to semi-circular surfaces.
The chord model is able to explain the shape-dependence of growth solely in terms of tension and
curvature, without any biological mechanisms such as stress-dependent proliferation or migration.
Although such mechanisms are involved on the cellular level and need to be taken into account in a
physiological context, our results show that the interplay of contractility and geometry alone can
coordinate growth in scaffolds. This reveals a generic physical control mechanism for biological
growth processes in bone, independent of specific functional aspects and signalling pathways, that
may also be relevant to other tissue types.
The interfacial motion predicted by the model and supported by the experiments is similar to the one
occurring in osteons and osteoclastic resorption lacunae during bone remodelling: while circular pores
are filled in a concentric way, semi-circular channels are filled layer by layer until the interface
becomes flat i.e. the curvature of the surface becomes zero. This implies that osteoblasts do not need a
specific signal to stop matrix production when the resorption pit is filled, but the gradual flattening of
the bone surface during the filling process are sufficient as a cue. Interestingly, the observation that
semi-circular pores fill at a slower rate than circular ones was also made in trabecular and cortical
bone, with the filling of hemi-osteons being slower than for osteons (see e.g. (Parfitt 1984; Agerbaek
et al. 1991; Eriksen 2010)). These results strongly suggest that surface geometry is an important signal
for controlling bone remodelling. In this respect, the model may also have implications for tissue
engineering and it may be interesting to use it in the design of scaffold shapes for implants
(Hutmacher 2001; Hollister 2005; Stevens and George 2005). One major difficulty in testing the
model in-vivo is the limited amount of kinetics data available in which local growth rates within a
scaffold have been measured. It is possible that recent developments in in-vivo CT may provide
suitable data that enables a comparison with the model (Schulte et al. 2011b).
The chord model presented in this paper makes the link between the macroscopic curvature-controlled
tissue growth observed in-vitro and in-vivo, and the assembly of stretched cells and other fibrous
elements making up the tissue.

Chapter 2. How linear tension converts to curvature: Geometric control of bone tissue growth
49
Acknowledgements
We thank Fred Vermolen for instructive discussions and we acknowledge financial support by the
Leibniz prize of PF running under DFG contract number FR2190/4-1. CB is a member of the Berlin-
Brandenburg School for Regenerative Therapies (GSC 203).
50
Transition to Chapter 3
The previous paper considers the model of curvature-driven growth suggested by Rumpler et al.
(2008) to characterise bone tissue growth in in-vitro cell culture experiments. A computational
method was proposed to implement this model on discrete interfaces and enabled a direct comparison
of the simulations with the experimental phase contrast images. The curvature-driven growth model
was not only shown to describe quantitatively in-vitro bone tissue growth in straight sided pores of
controlled geometries, but was also demonstrated to be equivalent to a simple geometrical
construction based on the elongated shape of the contractile cells: the chord model. Moreover, the
patterns of growth observed experimentally were shown to compare with those known from
investigations of bone remodelling.
Now that a biological explanation has been proposed to justify the control of geometry on tissue
deposition and support has been found in comparison with natural biological processes, it is
reasonable to consider the geometry of a substrate as a determining factor controlling tissue
patterning. Therefore, the computational tool developed to simulate curvature-controlled bone tissue
growth can be used to predict growth rates obtained in pores of more complex geometries, and help to
derive design principles of scaffolds to tune tissue growth rate and patterning.
This prospect motivates the objective of the following paper, which aims at understanding how to use
the model of curvature-driven growth to design substrates expected to promote tissue deposition and
at verifying the predictions experimentally.
51
Chapter 3. Geometry as a factor for tissue growth: Towards shape
optimization of tissue engineering scaffolds
Cécile M. Bidan1, Krishna P. Kommareddy
1, Monika Rumpler
2, Philip Kollmannsberger
1,3,
Peter Fratzl1*, John W.C. Dunlop
1
1 Department of Biomaterials, Max Planck Institute of Colloids and Interfaces, 14424 Potsdam,
Germany
2 Ludwig Boltzmann Institute of Osteology at the Hanusch Hospital of WGKK and AUVA Trauma
Centre Meidling, 1th Medical Department, Hanusch Hospital, Vienna, Austria
3 Department of Health Sciences and Technology (D-HEST), ETH Zurich, Switzerland
* Corresponding author
This review is in press for Advanced Healthcare Materials
DOI: 10.1002/adhm.201200159
Text and figures reproduced with permission of Wiley
Keywords
Curvature-driven growth – Geometries – Osteoblasts – Tissue engineering
Abstract
Scaffolds for tissue engineering are usually designed to support cell viability with large adhesion
surfaces and high permeability to nutrients and oxygen. Recent experiments support the idea that – in
addition to surface roughness, elasticity and chemistry, the macroscopic geometry of the substrate also
contributes to control the kinetics of tissue deposition. In this study, a previously proposed model for
the behavior of osteoblasts on curved surfaces is used to predict the growth of bone matrix tissue in
pores of different shapes. These predictions are compared to in-vitro experiments with MC3T3-E1
pre-osteoblast cells cultivated in two-millimeter thick hydroxyapatite plates containing prismatic
pores with square- or cross-shaped sections. The amount and shape of the tissue formed in the pores
measured by phase contrast microscopy confirms the predictions of the model. In cross-shaped pores,
the initial overall tissue deposition is two times faster than in square-shaped pores. These results
suggest that the optimization of pore shapes may improve the speed of ingrowth of bone tissue into
porous scaffolds.
My contribution
I performed the cell culture experiments, analysed data, applied the computational tools to measure
curvature and simulate tissue growth, derived the design principles based on geometry and wrote the
manuscript.
Chapter 3. Geometry as a factor for tissue growth: Towards shape optimization of tissue engineering scaffolds
52
Introduction
Three-dimensional scaffolds are needed for tissue engineering applications and may also help to study
the effect of the environment on tissue growth in-vitro. The material used, (Temenoff and Mikos
2000) the fabrication process (Mikos et al. 1994) and the architecture of the scaffold (Hutmacher
2000; Chen et al. 2006) are known to influence the biological interactions with the host organism.
Although all these parameters are difficult to decouple, quantifying their effects in-vitro is necessary
to understand the nature of cell and tissue responses and to design optimal scaffolds for in-vivo
experiments and applications.
Cells are known to adapt to the physical properties of their surroundings by integrating the mechanical
equilibrium established at their adhesion sites (Kollmannsberger et al. 2011). The resulting
mechanical cue is translated into a biochemical signal that triggers biological decisions of the cells
(Vogel and Sheetz 2009). As cells are mechanically attached to each other, either directly or via their
extracellular matrix, they are also able to synchronize their response on a larger scale. For example,
patterning in cell differentiation arises as a response to stiffness (Engler et al. 2006) or strain
(Marklein and Burdick 2010) patterns, and the distribution of proliferation activity also correlates
with the stress distribution in a layer of cells (Nelson et al. 2005).
Cell fate has also been investigated in three-dimensional artificial scaffolds. Adhesion, proliferation,
differentiation and mineralization of cells and tissues have been compared in several scaffolds with
varying structures (Zeltinger et al. 2001; St-Pierre et al. 2005). Recently, Kumar et al. (2011) showed
that gene expression, and thus cell differentiation, is more affected by the structural properties of the
substrate than by its composition. Furthermore, pore size and porosity need to satisfy the compromise
between a high permeability that enables cell migration and nutrient diffusion within the scaffold, and
a large surface area for cell adhesion and extracellular matrix production (Chen et al. 2006). Many
fabrication processes produce structures with random pores in a large range of sizes and
interconnectivities difficult to control. Rapid prototyping techniques are much more accurate in that
respect (Hutmacher et al. 2004). The direct printing of the scaffold enables to control the architecture
and thus many mechanical properties of the structure.
Rumpler et al. (2008) used rapid prototyping to build artificial macro-pores of different controlled
geometries and showed that cells locally respond to high curvature by producing tissue. Their
hypothesis of local tissue growth proportional to curvature has been confirmed experimentally, not
only in pores but also on open surfaces (Bidan et al. 2012b), however with the additional observation
that tissue does not grow on convexities. The interfacial evolution derived from a curvature-driven
tissue growth model matched the experimental observations as well as the in-vivo expectations when
comparing with the typical geometries involved in bone remodeling (osteon and hemi-osteon) (Parfitt
1994). An interesting consequence of curvature-driven growth was also observed by Rumpler et al.
Chapter 3. Geometry as a factor for tissue growth: Towards shape optimization of tissue engineering scaffolds
53
(2008). Despite seeing local differences in growth rates in prismatic pores with different convex
sections (circle, square and triangle) but identical surface areas, the total tissue growth was found to
be independent of the shape. This could be understood using Fenchel’s law (Aeppli 1965), which
states that the average curvature in a convex shape, is inversely proportional to the perimeter. This
would imply that the average growth rate, if curvature-controlled, would also be the same.
This paper aims at understanding how tissue production can be enhanced simply by controlling the
geometry of the surface by exploring non-convex pore geometries. The model of curvature-driven
growth as implemented in a previous work (Bidan et al. 2012b) was first used to predict growth in
pores with cross-, star- (non-convex) and square- (convex) shaped sections. The simulations predict
higher initial growth rates in non-convex shapes and even a two fold increase by growing cells in a
cross-shaped pore compared with a square-shaped pore. To verify these predictions, straight sided
pores with cross- and square-shaped sections are designed in hydroxyapatite scaffolds and incubated
with MC3T3-E1 pre-osteoblast cells for in-vitro tissue culture. Not only the motion of the tissue-
medium interfaces and the evolution of their curvature profiles compare well to the model, but also
the quantitative analysis of tissue production matches the outcomes from the curvature-controlled
growth model. Understanding the mechanisms involved in such a phenomenon is of high interest for
developing tools to design scaffolds with the optimal geometry and meeting the numerous criteria for
tissue engineering and clinical applications.
Experimental Section
Curvature-driven growth simulation
A model for curvature-driven tissue growth was proposed by Rumpler et al. (2008) and implemented
by Bidan et al. (2012b) in a Matlab (Matlab 7.8.0 R2009a, MathWorks, Natick, MA) code based on a
method for measuring curvature on digital images (Frette et al. 2009).
This computational simulation is run on binarized images of the pores in which the scaffold is black
and the medium is white. Each iteration consists in a) attributing a value of effective curvature to each
pixel representing what cells sense from the geometry of the surface, b) transforming the white pixels
having a positive effective curvature to black and represent tissue deposition in concave regions. The
process is then repeated to simulate curvature-controlled growth. To make a quantitative comparison
with the experimental results, this simple model only requires the input of a single parameter
accounting for the number of iterations needed to simulate one day of culture. This value is calculated
using the experimental growth rate measured in a convex shape, the square in this study.

Chapter 3. Geometry as a factor for tissue growth: Towards shape optimization of tissue engineering scaffolds
54
In order to be equivalent to the geometrical interpretation described previously (Bidan et al. 2012b),
when the computational tool is used for modeling purposes, the mask radius is set to pxlr 5.8 , i.e.
2/3 times of the size of a cell (about µm50 for an elongated osteoblast).
Production of the hydroxyapatite (HA) scaffolds
2mm thick HA scaffolds containing straight sided pores are produced by slurry casting as mentioned
in previous studies (Rumpler et al. 2008; Bidan et al. 2012b). Pore sections represent squares or
crosses and are normalized with respect to their perimeter (Pmedium = 4.71 mm, Plarge = 6.28 mm).
Molds are designed using the computer-aided design (CAD) software Alibre Design (Alibre Inc.,
Richardson, TX) and produced with a three-dimensional wax printer, Model Maker II (Solidscape
Inc., Merrimack, NH) as described by Manjubala et al. (Manjubala et al. 2005) The molds are then
filled with a HA slurry made of methacrylamide (MAM) monomers (15 g), N-N’-
Methylenebisacrylamide (BMAM) (5 g), water (75 g), Dextran (12.5 g) and HA powder (300 g), and
cross-linked with ammonium persulfate and N,N,N’,N’-Tetramethylethylenediamine (TEMED). The
structures are slowly air dried by heating the samples to 50 °C at a rate of 5 °C per day and then are
held at this temperature for one day. The dried samples are then pre-sintered at 600 °C for 48 h to
remove the wax molds and are finally sintered at 1100 °C for 24 h (Woesz et al. 2005).
Cell culture
Murine pre-osteoblastic cells MC3T3-E1 (provided by the Ludwig Boltzmann Institute of Osteology,
Vienna, Austria) are seeded with a density of 105 cells.cm
-2 on the surface of the HA scaffolds and
cultured for 28 days in α-MEM (Sigma-Aldrich, St. Louis, MO) supplemented with fetal calf serum
(PAA laboratories, Linz, Austria) (10 %), ascorbic acid (Sigma-Aldrich, St. Louis, MO) (0.1 %) and
gentamicin (Sigma-Aldrich, Steinheim, Germany) (0.1 %) in a humidified atmosphere with CO2 (5
%) at 37 °C.
Imaging
Each pore is imaged every 3 to 4 days using a phase contrast microscope (Nikon Eclipse TS100,
Japan) equipped with a digital camera (Nikon Digital sight DS 2Mv). All pictures are taken with a 4x
objective, yielding a final image resolution of 205 pixels per mm.
Image analysis
The digital phase contrast images are semi-automatically binarized using ImageJ (National Institutes
of Health, Bethesda (Rasband 2008)). The contrast in the images is sufficient to enable scaffold and
tissue (represented in black in the binarized images) to be distinguished from the medium (represented
in white).

Chapter 3. Geometry as a factor for tissue growth: Towards shape optimization of tissue engineering scaffolds
55
Measurement of tissue growth
Tissue growth in the pores is quantified by determining the projected tissue area (PTA) formed in the
pores. As this measurement is two-dimensional, it is only a proxy for quantifying the volume of
growth into the depth of the pore. The free section of a pore, corresponding to the white regions in the
binarized images, decreases with time. The PTA is then calculated by subtracting the binarized image
at an initial time point from the image at the time of interest, and then calculating the remaining area.
As cells need time to settle on the scaffold and start tissue deposition, the initial pore section is taken
on the second day after seeding (D2).
Curvature measurement
The curvature profile of the interface between the tissue and the medium on each binarized image is
calculated using Frette’s algorithm (Bullard et al. 1995; Frette et al. 2009) implemented in a custom
made Matlab code (Matlab 7.8.0 R2009a, MathWorks, Natick, MA) as described in Bidan et al.
(2012b). Briefly, the algorithm first locates the pixels on the tissue-medium interface in the binarized
image and the local curvature associated with an interface pixel is then estimated from the ratio of
the number of black to white pixels lying within a given radius from the interface with the formula:
2
13
totA
A
r
(Eq.1)
where A is the number of pixels in the mask and on the outer side of the interface, totA is the number
of pixels in the mask and r is the mask radius. The calculation is made for all pixels on the interface
on each side of the border. The local curvature in one position of the interface is taken as the mean
value of the curvatures measured on the outer pixel and the inner pixel. In the limit of a perfectly
smooth interface and an infinitely small radius, this ratio corresponds to the local curvature. In the
context of this paper, concave surfaces have a positive curvature.
To quantify interfacial geometry at different time points, the local curvature is given as a function of
the position along the interface normalized with respect to its perimeter. In order to reduce the noise
induced on the curvature profiles by both the roughness of the experimental interfaces and the
digitalization, the mask radius r of the computational tool is set to pxlr 5.14 and the resulting
profile is then smoothed using a running average algorithm with a sampling proportion of 5 % of the
total length of the perimeter.
Immunofluorescence staining
Scaffolds are washed with phosphate buffered saline (PBS), fixed with 4 % paraformaldehyde for 5
min and permeabilized overnight with 1 % Triton-X100 (Sigma-Aldrich, Steinheim, Germany) at
room temperature. Once washed in PBS, the tissue is stained for actin stress fibers by incubating with
Alexa-Fluor 488–phalloidin (Invitrogen, Molecular Probes) (3 x 10⁻⁷
M) for 90 min. Nuclei are then

Chapter 3. Geometry as a factor for tissue growth: Towards shape optimization of tissue engineering scaffolds
56
stained with TO-PRO 3 692-661 (Invitrogen, Molecular Probes) (3 x 10⁻⁶
M) for 5 min. Fluorescent
images of the stress fibers are obtained using a confocal laser scanning microscope (Leica TCS SP5).
Results
Predictions of the theoretical model
The model of curvature-controlled growth proposed in previous studies was applied to non-convex
geometries to predict potential changes of growth behavior in comparison to the simple shapes used
up to now (Rumpler et al. 2008; Bidan et al. 2012b). Figure 3-1 shows the growth behavior expected
in square-, star- and cross-shaped pores normalized with respect to the perimeter of their section
(Pmedium = 4.71 mm). Although the interface between tissue and medium tends to adopt a circular shape
in all cases (Figure 3-1(a)), the initial kinetics of growth is expected to be significantly affected by the
geometry of the straight sided pore (Figure 3-1(b)). For example, tissue is predicted to grow twice as
fast in a cross-shaped pore as in a square-shaped pore or any other convex shape (Figure 3-1(c)).
Figure 3-1: Simulated growth
The computational simulation of curvature-driven growth was run on artificial images representing square-, star-
and cross- shaped pores of medium size (Pmedium = 4.71 mm). (a) The tissue-medium interface evolves toward a
circular shape (b) Initial kinetics of growth are significantly affected by the geometry of the pore section before
reaching a circular interface (c) Initial growth rates calculated on the 40 first steps of the simulation suggest that
a two fold increase in tissue deposition can be expected in cross-shaped pores compared to square-shaped pores.
(Adapted from Bidan et al. (2012a))
Evolution of the shape in the in-vitro system
In order to verify the predictions obtained with the model of curvature-driven growth, tissue was
cultured in 2 mm thick hydroxyapatite (HA) plates containing straight sided pores of square- (convex)
and cross- (non-convex) shaped sections normalized with respect to their perimeter. Once seeded on
the scaffolds, the MC3T3-E1 pre-osteoblasts proliferate and start to produce collagenous extracellular

Chapter 3. Geometry as a factor for tissue growth: Towards shape optimization of tissue engineering scaffolds
57
matrix (ECM). Tissue deposition was followed in each pore by phase contrast microscopy over 28
days and quantified in terms of projected tissue area (PTA).
Three sets of 5 pores of each size (Pmedium = 4.71 mm, Plarge = 6.28 mm) and each shape (Sq stands for
square and Cr for cross) have been independently seeded and showed similar results. The paper
presents the data from one representative set.
Figure 3-2(a) shows phase contrast images taken at 4 different time points during culture (D2, D7,
D14 and D21). As already observed by Rumpler et al. in convex shapes (2008), tissue deposition
starts in the corners whereas no growth occurs on flat surfaces until the surrounding tissue deposition
modifies the local geometry. In cross-shaped pores, the concave regions of the branches are also
quickly filled with tissue. However, the 4 convex points (indicated by red circles on the figure) seem
to act as ‘flat surfaces’ since no growth occurs until local curvature becomes positive through the
global interfacial evolution. This effect of the sign of curvature has already been pointed out in
previous studies (Bidan et al. 2012b). In both cases, the tissue-medium interface evolves toward a
circle, as predicted by the model of curvature-driven growth applied to the actual geometry of the
pore, derived from the experimental images (Figure 3-2(b)).
Figure 3-2: Tissue growth in square- and cross-shaped pores
(a) Phase contrast images of the pore taken 2, 7, 14 and 21 days after seeding the MC3T3-E1 on the scaffolds.
(b) The superposition of the interfaces obtained experimentally is compared with the predictions of the
curvature-driven growth simulation applied to the actual geometry of the experimental pore at D2. 7, 14 and 21
days of experiments are obtained with 36, 120 and 204 steps of simulation with pxlr 5.8 , steps12 ,
dt 40 . (c) Curvature profiles of the tissue-medium interface measured at D2, D7, D14 and D21 in a square-
(i) and a cross-shaped pore (ii). (d) Curvature profiles are measured on the interfaces predicted by the curvature-
driven growth model after 7, 14 and 21 days of culture in ideal square- (iii) and cross-shaped pores (iv). The
curvature measurements were smoothed using a mask size of pxlr 5.14 .

Chapter 3. Geometry as a factor for tissue growth: Towards shape optimization of tissue engineering scaffolds
58
The evolution of the geometry was quantified in terms of curvature. Figure 3-2(c) presents the
curvature profiles measured on experimental images taken at different time points. The behavior
compares well with the interfacial curvature profiles measured on images obtained with the curvature-
driven growth model applied to ideal square and cross shapes (Figure 3-2(d)). The 4 peaks of
curvature characterizing the corners of a square-shaped pore vanish as the tissue grows; the curvature
profile of the interface flattens and becomes characteristic of a circle. In a cross-shaped pore, 8 peaks
correspond to the 8 concave corners and 4 regions of highly negative curvature are related to the 4
convex corners. As in the square, all the peaks – whatever their sign – tend to vanish and curvature
profiles become smooth as tissue is deposited. Note that differences in curvature values are due to the
imperfections of the HA scaffolds, and that the final profiles are not totally smooth due to the discrete
character of the binarized images.
Structure
The organization of the cells and collagen fibers within the newly formed tissue was investigated
qualitatively using immunofluorescence methods. On Figure 3-3(a), nuclei staining (red) reveals the
homogeneous distribution of cells within the tissue whereas actin fibers (green) are mostly
concentrated and highly oriented along the tissue-medium interface.
In larger pores, polarized microscopy enables to image the preferential orientation of the fibrous
extracellular matrix deposited by the cells. As shown on Figure 3-3(b), collagen fibers deep in the
tissue are oriented parallel to the substrate, whereas those at the interface have a direction similar to
the cells.

Chapter 3. Geometry as a factor for tissue growth: Towards shape optimization of tissue engineering scaffolds
59
Figure 3-3: Investigation of tissue structure
(a) Whatever the geometry of the pore, cells
are homogeneously distributed in the tissue
(nuclei in red) but actin concentration is much higher at the interface which tends to
be circular. (b) Polarized microscopy reveals
collagen fibers having the same orientation as
the cells, i.e. parallel to the tissue-medium
interface. (c) The geometrical construction
that considers tissue as an assembly of tensile
elements representing contractile cells (Bidan
et al. 2012b) applies to convex and non-
convex geometries. (d) Tissue stained for
actin fibers reveals stretched cells organized
along the interface as predicted by the chord model.

Chapter 3. Geometry as a factor for tissue growth: Towards shape optimization of tissue engineering scaffolds
60
Kinetics of bone-like tissue growth
Kinetics of new tissue formation within the pores of the scaffolds was followed in the in-vitro system
by measuring the projected tissue area (PTA) on phase contrast images taken twice a week. As
predicted by the model of curvature-driven growth in ideal shapes (Figure 3-1), Figure 3- 4(a) and 3-
4(b) reveal that after any time of culture, more tissue has been produced in the cross- than in the
square-shaped pores, and this for two different pore sizes (Plarge = 6.28 mm and Pmedium = 4.71 mm
respectively). Reporting tissue growth rates calculated between D4 and D14 also confirms that initial
growth rates are almost two times faster in cross- than in square-shaped pores, independent of the size
(Figure 3-4(c) and 3-4(d)).
Figure 3-4: Tissue growth kinetics
Growth kinetics measured in square- and cross-shaped pores of large (a) and medium (b) size. Experimental and
simulated growths are reported in terms of projected tissue area (PTA) ( steps12 , dt 40 ). Growth rates
are calculated between D4 and D14 with experimental and simulated data in large (c) and medium (d) pores.
ANOVA analysis shows no significant differences between the methods used (Exp, Sim) but a significant
difference in the tissue growth rates achieved in square and cross ( 05.0p ). Dots and error bars represent
mean values and standard errors respectively ( 5n ).
Chapter 3. Geometry as a factor for tissue growth: Towards shape optimization of tissue engineering scaffolds
61
Additionally, Figure 3-4 shows that the model of curvature-driven growth applied to the actual
geometry of the pores, also predicts quantitatively the growth behavior for the first two weeks of cell
culture. The model is fitted with a single parameter which sets the time scale of the simulation and is
calculated with the experimental tissue growth rate in a square-shaped pore. For this set of
experiments, 12 steps of simulation represent 1 day of culture ( steps12 ). A lag time dt 40
accounting for the time that cells need to settle was incorporated to overlap the curves.
Discussion
In this study, a curvature-driven growth model (Rumpler et al. 2008; Bidan et al. 2012b) was applied
to different (non-convex) geometries. The growth behaviors obtained by computational simulations
were verified experimentally using an in-vitro tissue culture system that offers the possibility to vary
the geometry of a substrate in a controlled way, independently of the chemistry. Not only the
qualitative and quantitative geometrical evolution of the tissue-medium interface, but also the faster
tissue generation by MC3T3-E1 cells in non-convex-shaped pores (cross) could be derived from the
simple hypothesis that the local growth rate is locally proportional to the curvature (if it is positive).
Despite a well-defined experimental protocol, some limitations remain. The hydroxyapatite scaffolds
produced by casting and sintering present the expected geometry on the millimeter scale, but the
roughness of the surfaces is difficult to control, especially in non-convex shapes. This drawback also
justifies the necessity of a computational tool able to quantify the geometry in terms of curvature
profile and apply the curvature-controlled growth model directly on experimental images, and
therefore take into account the interfacial defects.
Convex versus partially non-convex pores
To get a simple analytical estimate of the growth rate based on local curvature, we use the following
considerations. In non-convex-shaped pores, the growth law can be written as:
0,
0,
0
dt
ds (Eq.2)
Or in terms of projected area:
*22
)(2)(...
PPPP
dt
dsP
dt
dPTAave
ave
pore (Eq.3)
with )(Pave being the positive curvature averaged over the perimeter P of the section.
Chapter 3. Geometry as a factor for tissue growth: Towards shape optimization of tissue engineering scaffolds
62
The calculation of )(Pave is based on the demonstration of Fenchel’s law (see Supporting
Information). As dt
dPTApore is proportional to )(. PP ave
, which turns to be constant and characteristic
of the shape but not the size neither the proportions,
2
)(. PP ave
is defined as a constant
dimensionless value characteristic of the “non-convexity” of the shape. 1* for convex shapes
and 1* for non-convex shapes (Figure 3-6(a)).
In cross-shaped pores, the curvature is negative in 4 points, positive in the 8 right angle corners and
null elsewhere. In squares, the curvature is positive in the 4 right angle corners and null elsewhere. If
the negative curvature plays no role in the growth rate, then the positive curvature averaged on the
perimeter in the cross is twice the one of a square and growth should be twice faster. Both simulation
and experiments meet this prediction.
Gradual slowdown of growth rates
The patterns obtained with the curvature-controlled growth model and the ones observed in the
experiments can also be derived from the simple geometrical construction using tensile elements
(Bidan et al. 2012b). In essence, this model represents a cell by its internal actin filaments (stress
fibers) connecting adhesion sites of the cell. This “chord model” explains intrinsically not only the
absence of growth on convexities but also the faster tissue growth and the higher tissue organization
in non-convex shapes (Figure 3-3(a)). This approach is further supported by actin stained tissues
showing cells locally oriented parallel to the tissue-medium interface (Figure 3-3(a) and 3-3(d)).
Considering that this preferential organization is also followed by the collagen fibers synthesized by
the cells during tissue growth (Figure 3-3(b)), one could transfer the geometrical construction to the
tissue level in a similar way to the cable model of Bischof et al. (2008).
The curvature-driven growth model predicts a decrease in tissue growth rate in cross-shaped pores as
soon as the tissue-medium interface becomes convex. However, as already observed in similar
experiments, the tissue growth slows down after 18 days of culture, independently of the shape of the
pore. Three main hypotheses have been proposed to explain this phenomenon (Bidan et al. 2012b).
i) Ageing and differentiation affect the proliferative activity of the cells and thus their ability to
produce tissue. ii) Not only cells mature, but also the ECM they produce. With maturing collagen
cross-links the matrix could become locally denser, which may be implemented into the model as a
gradual reduction of the growth rate. iii) Considering the projected tissue area to quantify growth
supposes that tissue grows homogeneously all along the height of the three-dimensional pore, which is
unlikely. Therefore, one needs two principal curvatures to describe the geometry of the interface
along the vertical axis, and they are likely to be of opposite sign.

Chapter 3. Geometry as a factor for tissue growth: Towards shape optimization of tissue engineering scaffolds
63
To discuss this last point further, one can analytically estimate the impact of the convexity appearing
in the third dimension in a cylinder of radius 0R . As depicted on Figure 3-5(a), if the inward
curvature is approximated by a circle (red), the two principal curvatures at the point M are:
0
4
2
01
22
0
02
1
LRR
RRR
(Eq.4)
where R is the radius of the pore at time t and L is the depth of tissue deposition. Mean curvatures
2
21 in each point of the interface in the middle plane are lower than the one measured on the
projection ( 1 ) and, therefore,
4
21.2)(..2
22
0
02
LRR
RRRRR
dt
dR
dt
dPTApore (Eq.5)
Figure 3-5: The impact of the third dimension
The effect of the curvature in the third dimension may be partly responsible for the slowdown of growth
observed experimentally on the projected plane. (a) Schematic representation of tissue repartition in the pore
with the associated geometrical descriptors in the middle plane. (b) A numerical derivation was done with 12 .01.0 timeunitmm , mmL 2 in pores of medium and large sizes. The dashed line indicates a linear
growth.

Chapter 3. Geometry as a factor for tissue growth: Towards shape optimization of tissue engineering scaffolds
64
)(tPTA can be derived numerically from Eq.5 and some results presented in Figure 3-5(b) show,
indeed, a slowing down of the growth that is not predicted by the two-dimensional model but appears
in experiments.
Although the observations and calculations proposed in this paper are simple, they have important
consequences for the design of tissue engineering scaffolds. For example, the results suggest that for
purely convex channels, the rate of new tissue growth in a single pore is independent of size and
geometry. This implies that pore shape can be modified to satisfy other criteria (e.g. strength, fatigue
resistance, permeability, etc.) (Gibson 2005) without changing the rate of tissue ingress. Moreover,
introducing non-convexities into the pore shapes can greatly increase the growth rate (by a factor of 2
in the case of cross-like pores) giving a new opportunity to optimize the architecture of scaffolds for
tissue repair.
Towards optimizing pore geometry in a scaffold
Integrating a scaffold in a host organism often implies to produce as much tissue as possible in a short
time. In that respect, a lot of highly non-convex pores would be useful. However, having small pores
filling fast and completely with agglomerates of cells is also not desired. Indeed, diffusion of nutrients
would be impaired and cell viability affected. Moreover, cells also need space to migrate and lay
down extracellular matrix. Pores should then be large enough to guarantee a good permeability and
leave room for the formation of new tissue and angiogenesis (Melchels et al. 2011).
As shown in this study, the geometry of individual pores not only influences density, permeability and
the amount of tissue produced in the scaffold, but also the speed and repartition of tissue deposition.
In the cross-shaped pore, for example, tissue is generated with a high rate in the branches in a first
stage, which could help anchoring the scaffold faster in the host organism. As the interface smoothens
and becomes circular (convex), the growth rate slows down, leaving time and space for exchanges
through the pore. Experimentally, the slowdown occurs a bit earlier for the reasons discussed above.
These principles apply to single pores and, when up-scaling them to scaffolds with multiple pores, one
has to consider that geometry also determines the number of pores poresn which geometrically fit in a
scaffold with defined size scaffA and porosity :
scaff
pore
poresA
An (Eq.6)
Therefore, the global tissue growth rate in a scaffold can be estimated as (based on Eq.3):
2pores
scaffpore
porestot
A
A
dt
dPTAn
dt
dPTA (Eq.7)

Chapter 3. Geometry as a factor for tissue growth: Towards shape optimization of tissue engineering scaffolds
65
This can be rewritten in terms of the circularity C , which is a dimensionless shape factor that can be
used to describe the pores. This value depends on the geometry but not on the size:
24
P
AC (Eq.8)
where P is the pore perimeter. Figure 3-6(a) classifies pore shapes with respect to their “non-
convexity” and their “circularity”, two geometrical parameters that influence respectively tissue
growth rate in an individual pore and the global porosity of a scaffold made of those pores. The global
tissue growth rate can then be expressed as a function of the scaffold and the pores characteristics:
CPA
dt
dPTAscaff
tot
2
2 18 (Eq.9)
Eq.9 shows that the global tissue growth rate in the scaffold is a product of independent terms
characterizing i) cell activity, ii) scaffold properties, iii) pore size and iv) pore geometry.
Figure 3-6(b) shows how the total tissue growth rate depends on the size and the geometry of the
pores. The initial tissue growth rate is considered, i.e. the growth rate achieved until the interface
becomes convex. In a plate-like scaffold of a given area (20 mm²) and given porosity (0.9), small and
non-convex pores give rise to higher growth rates (white areas on the bottom right).
However, a common concern in tissue engineering is the permeability of the scaffold to guarantee cell
migration as well as nutrient and waste diffusion necessary for cells to survive. Tissue engineering
literature suggests that pores should be at least 300 µm large to ensure a good permeability of the
scaffold (Hutmacher et al. 2007). For each shape, the size of the inner circle is taken as a limitation
for pore size. An inner radius of 150 µm leads to the minimum relevant perimeter. Maximum realistic
initial growth rates are estimated for each shape (small shapes on Figure 3-6(b)). Considering this
aspect, the fastest initial growth rate can be obtained using regular crosses with thick branches. The
circular interface being quickly reached, the amount of tissue produced at that high rate is however
low. The remaining space and the slower growth from this time point could be profitable for
angiogenesis and facilitate diffusion as the pore is closing.
All these calculations assume that the totality of the scaffold area can be covered by assembling pores
of the same shape. This statement is true for squares, triangles and regular crosses with 33.0k .

Chapter 3. Geometry as a factor for tissue growth: Towards shape optimization of tissue engineering scaffolds
66
Figure 3-6: Classifying geometries
(a) Pore shapes can be classified using the “non-convexity” which determines tissue growth rate in the pore and
the “circularity” which influences the number of pores fitting in a scaffold. (b) Contour plot representing the
influence of pore geometry and pore size on the total tissue growth rate in a 20 mm² scaffold with a porosity of
0.9. Grey level decreases with the growth rate. For each shape, the dot shows the perimeter corresponding to an
inner radius of 150 µm (considered as the limit for good permeability properties). In that respect, smaller
perimeters are not relevant for tissue engineering purposes.
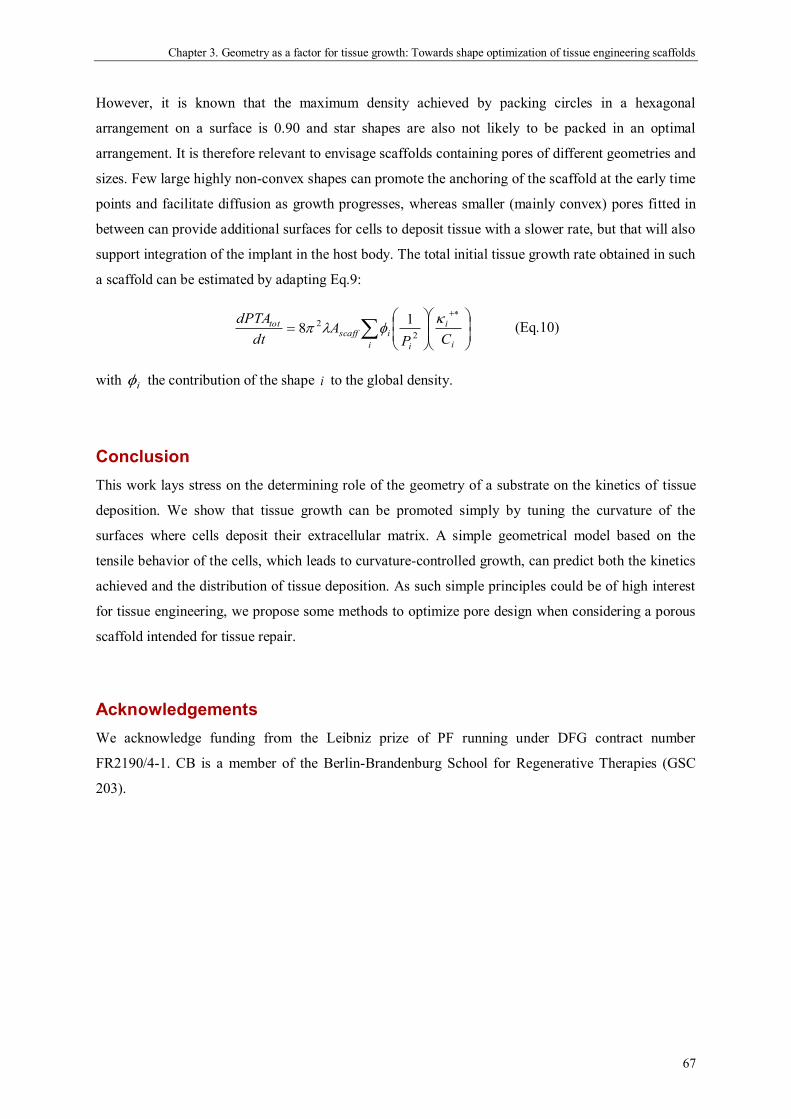
Chapter 3. Geometry as a factor for tissue growth: Towards shape optimization of tissue engineering scaffolds
67
However, it is known that the maximum density achieved by packing circles in a hexagonal
arrangement on a surface is 0.90 and star shapes are also not likely to be packed in an optimal
arrangement. It is therefore relevant to envisage scaffolds containing pores of different geometries and
sizes. Few large highly non-convex shapes can promote the anchoring of the scaffold at the early time
points and facilitate diffusion as growth progresses, whereas smaller (mainly convex) pores fitted in
between can provide additional surfaces for cells to deposit tissue with a slower rate, but that will also
support integration of the implant in the host body. The total initial tissue growth rate obtained in such
a scaffold can be estimated by adapting Eq.9:
i i
i
i
iscafftot
CPA
dt
dPTA
2
2 18 (Eq.10)
with i the contribution of the shape i to the global density.
Conclusion
This work lays stress on the determining role of the geometry of a substrate on the kinetics of tissue
deposition. We show that tissue growth can be promoted simply by tuning the curvature of the
surfaces where cells deposit their extracellular matrix. A simple geometrical model based on the
tensile behavior of the cells, which leads to curvature-controlled growth, can predict both the kinetics
achieved and the distribution of tissue deposition. As such simple principles could be of high interest
for tissue engineering, we propose some methods to optimize pore design when considering a porous
scaffold intended for tissue repair.
Acknowledgements
We acknowledge funding from the Leibniz prize of PF running under DFG contract number
FR2190/4-1. CB is a member of the Berlin-Brandenburg School for Regenerative Therapies (GSC
203).

68
Transition to Chapter 4
So far, it was shown that tissue formation in three-dimensional pores can be quantitatively predicted
by a computational model of curvature-driven growth. A simple geometrical construction made of
elongated contractile cells was demonstrated to be quantitatively equivalent to curvature-driven
growth, which goes towards giving a biological explanation of this physical law. Moreover, this
description could explain the patterns observed in osteons and hemi-osteons during bone remodelling
(Chapter 2). Applying the model to more complex geometries revealed that tissue is expected to grow
faster in cross- than in square-shaped pores. In-vitro experiments confirmed that tissue growth can be
enhanced simply by tuning the shape of the pores and design principles were suggested to optimise
scaffolds geometry for tissue regeneration (Chapter 3). Together, these studies have shown the
interesting implications of the present research both for basic understanding of bone remodelling and
for tissue engineering.
A further step in the understanding of how the geometry of the substrate controls tissue growth
consists in understanding the biological mechanisms that lead to such a simple geometric model of
tissue formation. Preliminary structural investigations of the tissue indicated that the cytoskeletal
pattern corresponds to the expectations given by the chord model and that the collagenous
extracellular matrix tends to follow this organisation (Chapter 2 and 3).
The next manuscript focuses on the understanding of tissue organisation by detailing the structural
analyses of the tissue during growth. As forces are powerful signals for cells to communicate over
large distances (Chapter 1) and cell contractility is the main hypothesis of the chord model (Chapter
2), the role of mechanics in tissue organisation was also investigated by disturbing the internal
mechanical state of the cytoskeletal network.
The data reported in this fourth chapter result from preliminary experiments and are exclusively
qualitative. However the effects appeared to be clear enough to draw some initial conclusions, which
are therefore reported in the following chapter in the form of a paper. Further work is under way to
quantify the tissue organisation before submitting this manuscript for publication in a scientific
journal.

69
Chapter 4. Bone tissue organisation: cells, fibronectin, collagen,
who’s first?
Cécile M. Bidan1,2
, Pascal Joly2,3
, Krishna P. Kommareddy1, Monika Rumpler
4, Philip
Kollmannsberger5, Ansgar Petersen
3, Peter Fratzl
1, John W.C. Dunlop
1*
1 Department of Biomaterials, Max Planck Institute of Colloids and Interfaces, 14424 Potsdam,
Germany
2 Berlin-Brandenburg School for Regenerative Therapies, Charité, Germany
3 Julius Wolff Institute, Charité - Universitätsmedizin Berlin, Germany
4 Ludwig Boltzmann Institute of Osteology at the Hanusch Hospital of WGKK and AUVA Trauma
Centre Meidling, 1th Medical Department, Hanusch Hospital, Vienna, Austria
5 Laboratory of Applied Mechanobiology, Department of Health Sciences and Technology (D-HEST),
ETH Zürich, Switzerland
* Corresponding author
Abstract
Bone is a complex tissue that contains cells, collagenous matrix and mineral particles and the
organisation of these elements helps determine the mechanical properties of the living material.
Understanding the mechanisms controlling tissue organisation would therefore add to the general
knowledge about various biological processes involving bone (re)modelling. In this study, we
investigated the organisation of a non-mineralised bone tissue produced in-vitro. MC3T3-E1 pre-
osteoblasts were cultured on hydroxyapatite scaffolds containing millimetre-sized pores in which
three-dimensional tissue was produced. After different times of growth, samples were fixed, stained
for actin and observed by confocal laser scanning microscopy. In some experiments, fluorescent
labelled fibronectin was added to the medium in order to follow its incorporation in the fibrous
matrix. Collagen fibrils were imaged by second harmonic generation (SHG) microscopy. The
apparition of the cytoskeletal network prior to the fibronectin and collagen fibres as well as their co-
alignment, suggest that the internal structure of the tissue depends on the organisation of the cells. As
forces are known to be an effective signal for cell communication at larger scales, the mechanics of
the actin network was disturbed by different methods (blebbistatin, pronase and collagenase
treatments and micro-sectioning) in order to estimate the role of the cytoskeletal stress state in tissue
organisation. It appears that tension developed by contractile cells is required for tissue organisation.
My contribution
I was involved in experimental design, performed the cell culture and tissue treatments, analysed data
and wrote the manuscript.

Chapter 4. Bone tissue organisation: cells, fibronectin, collagen, who’s first?
70
Introduction
Bone is a complex tissue consisting of cells, collagen and other extracellular proteins like fibronectin,
which is reinforced by nanosized carbonated hydroxyapatite mineral particles (Weiner and Wagner
1998; Fratzl and Weinkamer 2007; Frantz et al. 2010). As in all composite materials, the arrangement
of these components, especially the orientation of collagen (and mineral), determines the shape, the
mechanical properties and thus the function of the bone tissue (Seto et al. 2008; Dunlop and Fratzl
2010). Because bone tissue is organised during morphogenesis and growth and because bone healing
and remodelling processes are the only truly regenerative processes in the human body, the
understanding of these biological phenomena both inspires and profits from the research on the
fundamentals of tissue formation (Parfitt 1994; Liu et al. 2010a). Tissue engineering also benefits
from this knowledge since tissue growth prior to mineralisation is responsible for implant integration
into the living organism and thereby supports the recovery of the original functions of the organ
(Hutmacher et al. 2007). It is thus of high interest to understand the mechanisms controlling the
synthesis of bone tissue and particularly the organisation of the extracellular matrix (ECM) and its
evolution during growth.
Despite this interest in tissue formation, the mechanisms organising the extracellular components of
bone on scales much larger than a cell are still under discussion. Two main hypotheses have been
proposed in the literature and essentially differ in their interpretation of the role that cells play in the
active organisation of collagen. The in-vitro experiments from Bouligand, Giraud-Guille and co-
workers hint that spontaneous self-organisation of collagen, much akin to that observed in liquid
crystals, can lead to the complex structures observed in bone (Bouligand.Y 1972). Other ex-vivo and
in-vitro experiments, which investigate how cells arrange themselves with respect to the extracellular
matrix suggest that cells actively control ECM formation (Trelstad and Hayashi 1979; Sivakumar et
al. 2006; Pazzaglia et al. 2010; Pazzaglia et al. 2011; Petersen et al. 2012; Yamamoto et al. 2012).
In 1972, Bouligand et al. observed biological structures (in arthropod cuticle, ascidian tunica and
dinoflagellate chromosomes) that are remarkably similar to cholesteric meso-phases observed in
liquid crystals (Bouligand.Y 1972). Further work by Giraud-Guille and co-workers showed that
collagen behaves as liquid crystal (see e.g. Giraud-Guille et al. (2008)) and thus can also
spontaneously arrange itself in structures similar to those found in bone without the existence of cells
(Giraud-Guille 1998). In bone matrix, longitudinal sections often reveal arc structures corresponding
to a “twisted plywood” architecture of the collagen fibrils (Giraud-Guille 1988). Based on these
observations, the internal organisation of bone tissue was proposed to result from the self-organisation
of a collagen network acting as a scaffold that controls in turn later cell patterning in the tissue.
On the other hand, as cells synthesise and assemble the extracellular components, they are also
expected to control the arrangement of the ECM (Sivakumar et al. 2006). However, this proposition
Chapter 4. Bone tissue organisation: cells, fibronectin, collagen, who’s first?
71
assumes that cells can first organise themselves on the tissue scale, before producing and mineralising
the ECM. As forces are recognised to be powerful signals enabling cells to communicate and
synchronise over large distances (Kollmannsberger et al. 2011), it is important to understand cell
mechanics (Fletcher and Mullins 2010) when investigating bone tissue organisation. The shape of a
cell is determined by its actin cytoskeleton, the organisation of which depends on the spatial
distribution of the adhesion sites and on the internal cytoskeletal stress (Théry et al. 2006; Bischofs et
al. 2008). Cells experiencing mechanical stimuli can adapt their shape and recover their mechanical
equilibrium (Schwarz et al. 2006) by regulation through actin fibre remodelling and acto-myosin
contractility (Pellegrin and Mellor 2007). Many studies showed that cytoskeletal organisation depends
on mechanics at the single cell level but only a few extended their models to a multicellular level and
hardly any included the ECM. Although the mechanisms are still unclear, it is often assumed that cells
actively organise or remodel fibronectin and collagen fibres on the tissue level (Sivakumar et al. 2006;
Yamamoto et al. 2012).
So far, none of these two theories have been clearly proved or rejected by experiments due to the
difficulties in observing live cells inside bone. Indeed, in-vivo investigations of bone tissue are not
adapted to separate clearly the components and especially to conclude which of the components has
been ordered first. The collagen self-organisation experiments were performed in-vitro and without
cells (Bouligand et al. 1985), which is not representative of the physiological conditions encountered
in bone. Likewise, no in-vitro system clearly showed the active synthesis and large-scale organisation
of collagen by bone cells. One reason could be that cells cultured in-vitro usually only grow a
monolayer on two-dimensional surfaces and show no real organisation, on three-dimensional surfaces
however, cells and tissue behave differently (Cordonnier et al. 2010).
The in-vitro protocol proposed by Rumpler et al. (2008) is ideally suited for such investigations.
Indeed, three-dimensional non-mineralised bone tissue can be grown by pre-osteoblasts seeded on
scaffolds containing pores of controlled geometries. With this system, tissue growth was shown to be
controlled by the curvature of the substrate. It was then demonstrated that representing a contractile
cell by a tensile element and tissue by an assembly of chords is sufficient to explain the curvature-
driven growth behaviour of these three-dimensional tissues (Bidan et al. 2012b). Interestingly, basic
structural investigations of the tissue produced in various pores revealed a co-alignment of the
cytoskeletal and collagen networks (Bidan et al. 2012c).
The aim of this paper is to explore further the internal structure of the tissue produced with such a
system. The sequence of events taking place during bone tissue growth before mineralisation will be
particularly in focus in order to find out how cells and extracellular components arrange with respect
to each other. The role of mechanics in the organisation process is assessed by impairing the
contractility of the cells and the stability of the tissue via biochemical and mechanical treatments and
analysing the subsequent structural changes.

Chapter 4. Bone tissue organisation: cells, fibronectin, collagen, who’s first?
72
Materials and methods
Tissue production
The tissue investigated in this study was deposited by bone cells seeded on 2mm thick hydroxyapatite
(HA) scaffolds containing straight-sided pores of different controlled geometries. These substrates
were produced by casting HA slurry in wax moulds designed by rapid prototyping. More details about
scaffold fabrication can be found in previous works (Woesz et al. 2005; Rumpler et al. 2008; Bidan et
al. 2012b). Murine pre-osteoblastic cells MC3T3-E1 (provided by the Ludwig Boltzmann Institute of
Osteology, Vienna, Austria) were seeded with a density of 105 cells.cm
-2 on the top of the HA
scaffolds and cultured in alpha-MEM (Sigma-Aldrich) supplemented with 10% foetal calf serum
(PAA laboratories), 0.1% ascorbic acid (Sigma-Aldrich) and 0.1% gentamicin (Sigma-Aldrich). Cells
in culture were incubated at 37°C in a humidified atmosphere with 5% CO2 and the culture medium
was changed every 3 to 4 days over a period depending on the experiment.
Cell organisation
After the culture time of interest, the scaffolds were washed in phosphate buffered saline (PBS). The
tissue was then fixed in 4% paraformaldehyde for 10min at room temperature, permeabilised in 1%
Triton X100 (Sigma-Aldrich) at 4°C overnight and washed again in PBS. The cytoskeletal actin stress
fibres were stained in a solution of Alexa-phalloidin fluorescein isothiocyanate (488nm) (Invitrogen,
Molecular Probes) at 3 x 10⁻⁷M concentration for 90min. The samples were then incubated for 5 min
in TO-PRO 3 692-661 (Invitrogen, Molecular Probes) at 3 x 10⁻⁶M for staining cell nuclei. After a last
wash in PBS, the tissue was imaged with a fluorescent confocal microscope (Leica TCS SP5), using
488nm and 633nm lasers to visualize actin and nuclei respectively.
Visualisation of fibronectin organisation
Because of the difficulty for certain staining molecules to diffuse homogeneously throughout fixed
thick tissues, no protocol was applicable to stain for fibronectin in the tissues investigated in this
paper. To overcome this limitation, cells were provided fluorescent labelled fibronectin in the culture
medium to be incorporated into the fibronectin fibres they synthesise and assemble (Smith et al.
2007). The fibronectin used in this experiment was isolated from human plasma (Swiss Red Cross)
using gelatin-sepharose chromatography. For fluorescent labelling on free amines, fibronectin was
incubated with a 60-fold molar excess of Alexa 488 succinimidyl ester (Molecular Probes) for 1h, and
dialyzed overnight in PBS to remove free dye, following published protocols (Smith et al. 2007). The
final protein concentration and labelling ratio were quantified in a Nanodrop UV-Vis
spectrophotometer (Thermo Scientific).
In the regular supplemented medium described above, fibronectin (labelled and unlabelled) was added
to reach a concentration of 50µg.mL-1
with 90% excess of unlabelled fibronectin. Different scaffolds
received this particular medium for 3 days after various times of culture (day 3, 10 and 16).
Chapter 4. Bone tissue organisation: cells, fibronectin, collagen, who’s first?
73
In those particular samples, overlapping of fluorescent signals was avoided by staining actin with
phalloidin tetramethylrhodamine (560nm) (Sigma-Aldrich) at a concentration 2 x 10⁻⁴
M for 90min.
Images were taken using a LEICA SP5 confocal microscope equipped with a Mai Tai HP multiphoton
laser and a 25x water immersion objective. Emitted light from the samples was detected using a Non
Descanned Detector (NDD) for actin signal as well as an internal photomultiplier detector (PMT) for
fibronectin signal. Laser power and NDD parameters were optimized for three-dimensional image
stack recording by z-value dependent linear compensation for imaging each of the different pores.
Collagen organisation
Due to the non-linear optical properties resulting from their non-centrosymmetric structure, collagen
fibrils can be imaged by Second Harmonic Generation (SHG) microscopy, which does not require any
staining (Zoumi et al. 2002; Friedl et al. 2007). Images were taken using the same equipment set at
890nm. The specific SHG signal scattered by the collagen fibres was collected around 445nm (two
times the energy of excitation) with a NDD detector.
Treatments to test mechanics
In order to investigate the role of mechanics in the stability of the tissue, the following treatments
were performed on living tissues cultured for 35 days.
To estimate the effects of contractility, some samples were incubated 24h in supplemented culture
medium containing the myosin II inhibitor blebbistatin at 20µM. At that point, some of them were
fixed whereas others were put back in regular supplemented medium for additional 24h before
fixation. As cells need to adhere and pull to develop forces and shape their cytoskeleton, it was
interesting to impair the stability of their surroundings and observe their response. Some samples were
therefore incubated for 30 min either in 0.1% pronase (Roche) or 0.1% collagenase (Sigma-Aldrich)
diluted in PBS to disrupt cell-cell contacts or extracellular matrix network respectively. Some of them
were then fixed, whereas the others were put back in regular culture conditions for 24h before
fixation. Additional samples were incubated in pure PBS as a control. After each treatment, actin and
nuclei were stained following the protocol described above.
Tissue organisation was also impaired mechanically by micro-sectioning of living tissue performed
under a bright field microscope equipped with a laser (P.A.L.M. Microbeam, Zeiss). Linear sections
were done perpendicular to the tissue-medium interface. The length of the section was not
standardized but chosen depending on the local tissue thickness. The changes in tissue shape were
simultaneously imaged under the microscope (Hitachi HV D30). After being cut, some samples were
put back in regular culture conditions and the healing process was followed by phase contrast
microscopy (Nikon Digital sight DS 2Mv) over 3 days.
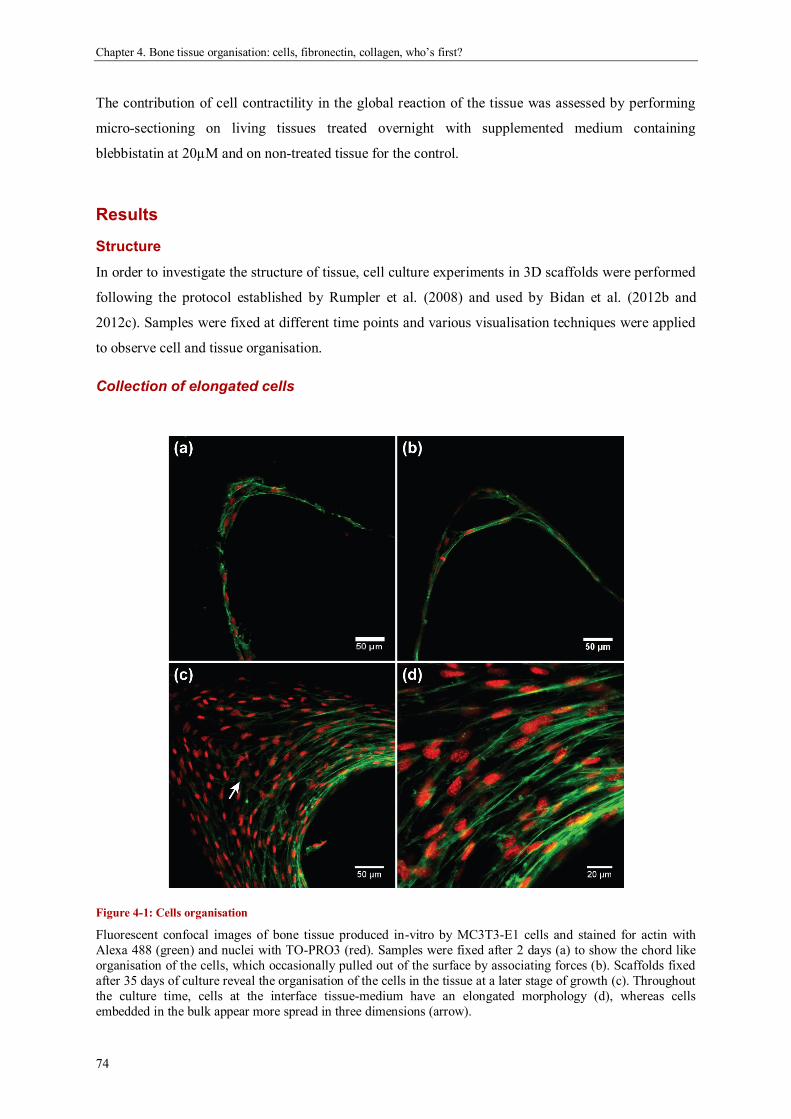
Chapter 4. Bone tissue organisation: cells, fibronectin, collagen, who’s first?
74
The contribution of cell contractility in the global reaction of the tissue was assessed by performing
micro-sectioning on living tissues treated overnight with supplemented medium containing
blebbistatin at 20µM and on non-treated tissue for the control.
Results
Structure
In order to investigate the structure of tissue, cell culture experiments in 3D scaffolds were performed
following the protocol established by Rumpler et al. (2008) and used by Bidan et al. (2012b and
2012c). Samples were fixed at different time points and various visualisation techniques were applied
to observe cell and tissue organisation.
Collection of elongated cells
Figure 4-1: Cells organisation
Fluorescent confocal images of bone tissue produced in-vitro by MC3T3-E1 cells and stained for actin with
Alexa 488 (green) and nuclei with TO-PRO3 (red). Samples were fixed after 2 days (a) to show the chord like
organisation of the cells, which occasionally pulled out of the surface by associating forces (b). Scaffolds fixed
after 35 days of culture reveal the organisation of the cells in the tissue at a later stage of growth (c). Throughout
the culture time, cells at the interface tissue-medium have an elongated morphology (d), whereas cells
embedded in the bulk appear more spread in three dimensions (arrow).

Chapter 4. Bone tissue organisation: cells, fibronectin, collagen, who’s first?
75
Scaffolds containing triangular pores were fixed after 2 days and 35 days of cell culture, stained for
actin (green) and nuclei (red), and imaged with a fluorescent confocal microscope (Figure 4-1). After
the first days of culture, a few cells have settled on the surface and adopted an elongated morphology
giving rise to a characteristic organisation that tends to smooth the interface in the corners (Figure 4-
1(a) and (b)). At later stages of growth, cells close to the substrate are still aligned along the scaffold-
tissue interface whereas cells on the surface align along the tissue-medium interface and form an actin
ring (Figure 4-1(c)). As highlighted on Figure 4-1(d), the actin pattern in this region is highly
oriented, which suggests that the forces created and experienced by the cells are highly anisotropic. In
contrast, cells embedded in the tissue deep toward the corner do not show this chord like shape
anymore (Figure 4-1(c)) and rather adopt more complex shapes in this three-dimensional
environment.
Fibronectin organisation
As fibronectin staining protocols are difficult to optimize for fluorescent imaging in thick tissues, the
organisation of fibronectin fibres by the cells was assessed using labelled fibronectin incorporated in
the medium after different time of culture. After fixation and staining of the samples for actin fibres,
fluorescent confocal imaging enabled the visualisation of the actin (green), the labelled fibronectin
(red) and collagen fibres (white) simultaneously (Figure 4-2).
Some samples received labelled fibronectin after 3 days of culture in regular medium. One was fixed
and stained one day after (Figure 4-2(a)). Cells use the fibronectin molecules from the medium to
synthesize fibronectin fibres. Although the fibronectin fibres are not as highly organised as the actin
pattern, one can still notice a general coalignment but not co-localization (as evidenced by the small
amount of yellow pixels) of the two networks: the fibres close to the scaffold are parallel to the
interface substrate-tissue whereas those produced by the cells on the surface align with the curved
tissue-medium interface. When the sample was fixed and stained one week after incorporation (Figure
4-2(b)), no labelled fibronectin was left for cells to produce labelled ECM since very little signal can
be observed close to the interface. However, it is important to mention that regular culture medium
also contains fibronectin and that cells synthesise their own fibronectin as well. Indeed, fibronectin
staining performed after regular culture revealed some signal close to the interface, but a lack of
diffusion of the stain inside the tissue limits the use of these data (data not shown).
Other samples received labelled fibronectin after 10 days of regular culture. In the scaffold fixed one
day later (on day 11), although the weak fluorescent signal is slightly higher along the tissue-medium
interface, the labelled fibronectin has been incorporated in fibre formation throughout the tissue
(Figure 4-2(c)). Again, the overall pattern of the fibronectin network appears to follow actin
organisation: aligned along the interfaces and slighly more disorganised in the bulk. A last scaffold
was fixed on day 17, i.e. one week after incorporation of labelled fibronectin (Figure 4-2(d)). Like in
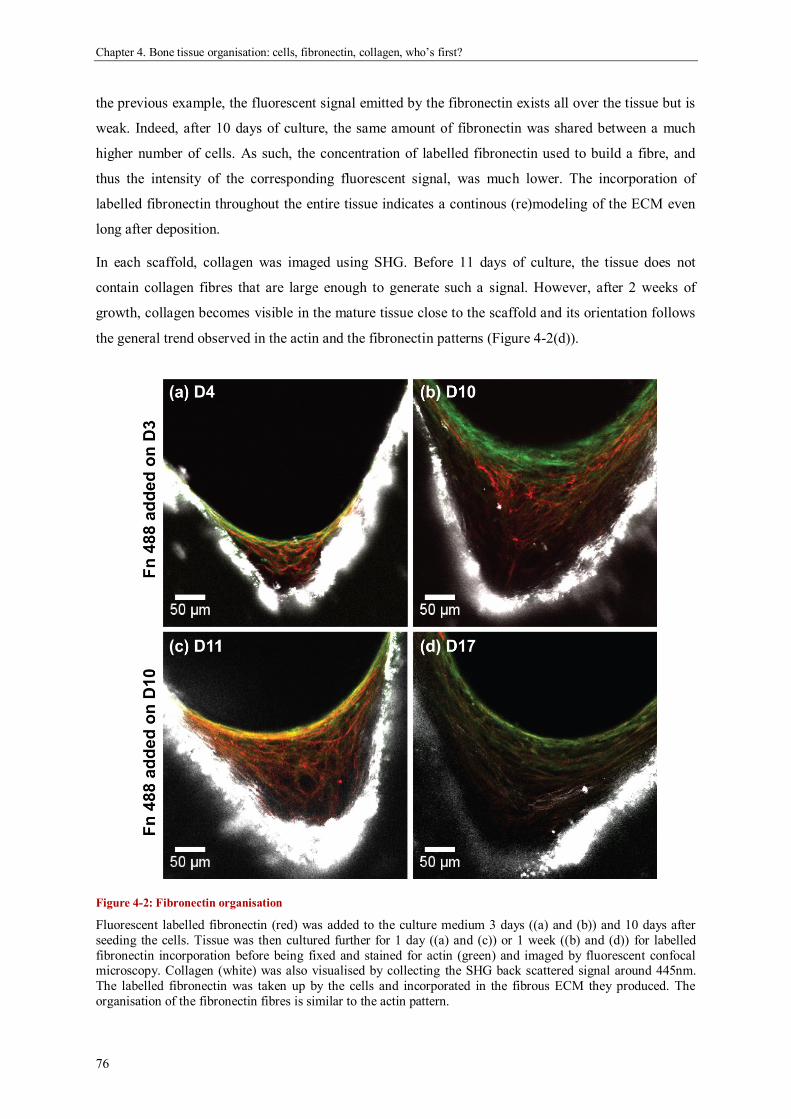
Chapter 4. Bone tissue organisation: cells, fibronectin, collagen, who’s first?
76
the previous example, the fluorescent signal emitted by the fibronectin exists all over the tissue but is
weak. Indeed, after 10 days of culture, the same amount of fibronectin was shared between a much
higher number of cells. As such, the concentration of labelled fibronectin used to build a fibre, and
thus the intensity of the corresponding fluorescent signal, was much lower. The incorporation of
labelled fibronectin throughout the entire tissue indicates a continous (re)modeling of the ECM even
long after deposition.
In each scaffold, collagen was imaged using SHG. Before 11 days of culture, the tissue does not
contain collagen fibres that are large enough to generate such a signal. However, after 2 weeks of
growth, collagen becomes visible in the mature tissue close to the scaffold and its orientation follows
the general trend observed in the actin and the fibronectin patterns (Figure 4-2(d)).
Figure 4-2: Fibronectin organisation
Fluorescent labelled fibronectin (red) was added to the culture medium 3 days ((a) and (b)) and 10 days after
seeding the cells. Tissue was then cultured further for 1 day ((a) and (c)) or 1 week ((b) and (d)) for labelled
fibronectin incorporation before being fixed and stained for actin (green) and imaged by fluorescent confocal microscopy. Collagen (white) was also visualised by collecting the SHG back scattered signal around 445nm.
The labelled fibronectin was taken up by the cells and incorporated in the fibrous ECM they produced. The
organisation of the fibronectin fibres is similar to the actin pattern.
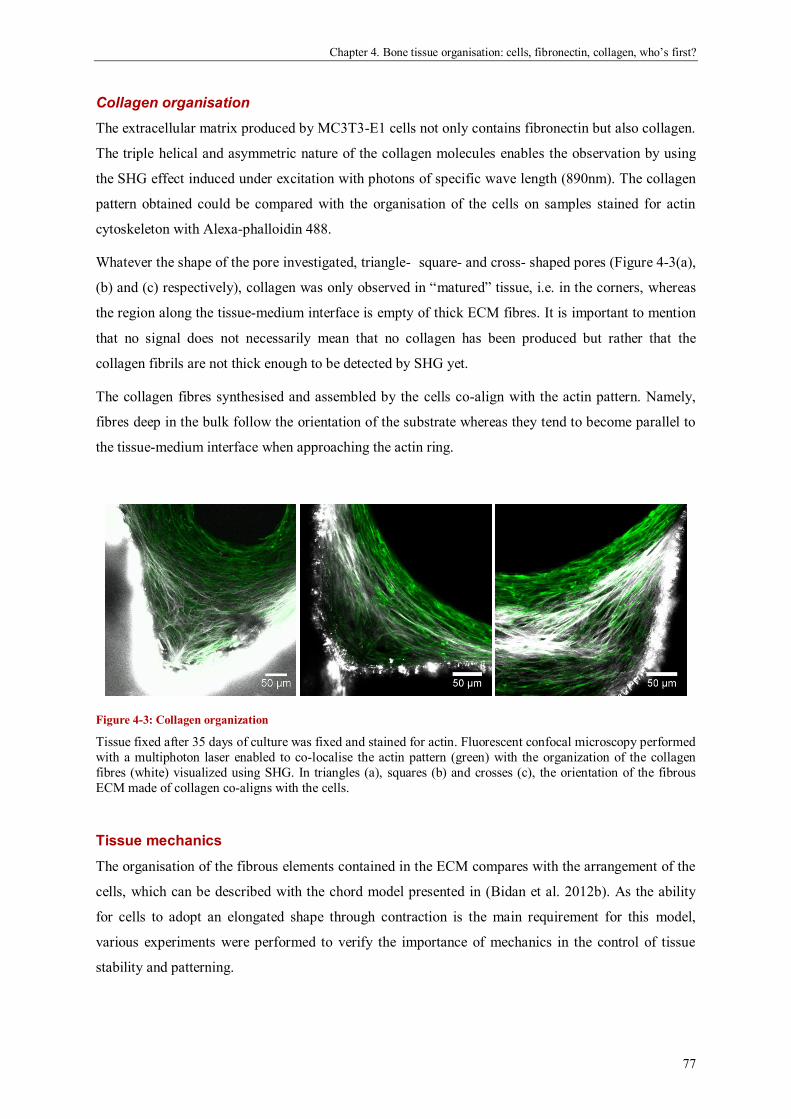
Chapter 4. Bone tissue organisation: cells, fibronectin, collagen, who’s first?
77
Collagen organisation
The extracellular matrix produced by MC3T3-E1 cells not only contains fibronectin but also collagen.
The triple helical and asymmetric nature of the collagen molecules enables the observation by using
the SHG effect induced under excitation with photons of specific wave length (890nm). The collagen
pattern obtained could be compared with the organisation of the cells on samples stained for actin
cytoskeleton with Alexa-phalloidin 488.
Whatever the shape of the pore investigated, triangle- square- and cross- shaped pores (Figure 4-3(a),
(b) and (c) respectively), collagen was only observed in “matured” tissue, i.e. in the corners, whereas
the region along the tissue-medium interface is empty of thick ECM fibres. It is important to mention
that no signal does not necessarily mean that no collagen has been produced but rather that the
collagen fibrils are not thick enough to be detected by SHG yet.
The collagen fibres synthesised and assembled by the cells co-align with the actin pattern. Namely,
fibres deep in the bulk follow the orientation of the substrate whereas they tend to become parallel to
the tissue-medium interface when approaching the actin ring.
Figure 4-3: Collagen organization
Tissue fixed after 35 days of culture was fixed and stained for actin. Fluorescent confocal microscopy performed
with a multiphoton laser enabled to co-localise the actin pattern (green) with the organization of the collagen
fibres (white) visualized using SHG. In triangles (a), squares (b) and crosses (c), the orientation of the fibrous
ECM made of collagen co-aligns with the cells.
Tissue mechanics
The organisation of the fibrous elements contained in the ECM compares with the arrangement of the
cells, which can be described with the chord model presented in (Bidan et al. 2012b). As the ability
for cells to adopt an elongated shape through contraction is the main requirement for this model,
various experiments were performed to verify the importance of mechanics in the control of tissue
stability and patterning.
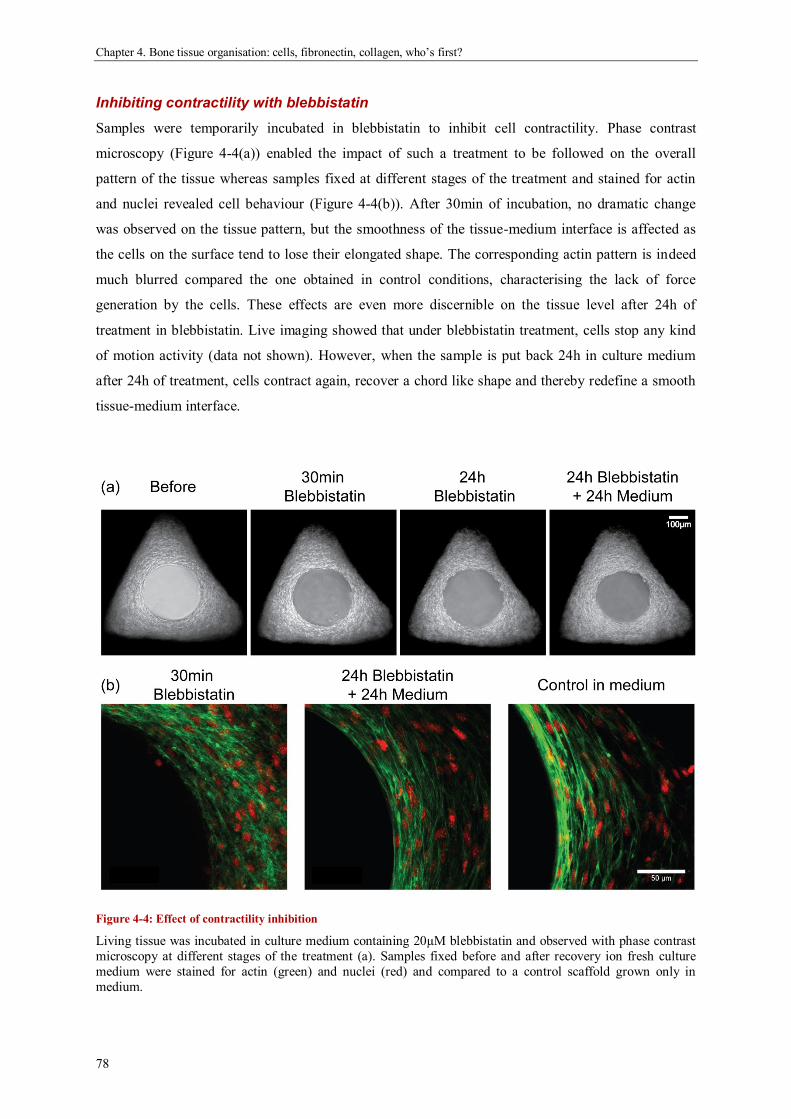
Chapter 4. Bone tissue organisation: cells, fibronectin, collagen, who’s first?
78
Inhibiting contractility with blebbistatin
Samples were temporarily incubated in blebbistatin to inhibit cell contractility. Phase contrast
microscopy (Figure 4-4(a)) enabled the impact of such a treatment to be followed on the overall
pattern of the tissue whereas samples fixed at different stages of the treatment and stained for actin
and nuclei revealed cell behaviour (Figure 4-4(b)). After 30min of incubation, no dramatic change
was observed on the tissue pattern, but the smoothness of the tissue-medium interface is affected as
the cells on the surface tend to lose their elongated shape. The corresponding actin pattern is indeed
much blurred compared the one obtained in control conditions, characterising the lack of force
generation by the cells. These effects are even more discernible on the tissue level after 24h of
treatment in blebbistatin. Live imaging showed that under blebbistatin treatment, cells stop any kind
of motion activity (data not shown). However, when the sample is put back 24h in culture medium
after 24h of treatment, cells contract again, recover a chord like shape and thereby redefine a smooth
tissue-medium interface.
Figure 4-4: Effect of contractility inhibition
Living tissue was incubated in culture medium containing 20µM blebbistatin and observed with phase contrast
microscopy at different stages of the treatment (a). Samples fixed before and after recovery ion fresh culture
medium were stained for actin (green) and nuclei (red) and compared to a control scaffold grown only in
medium.
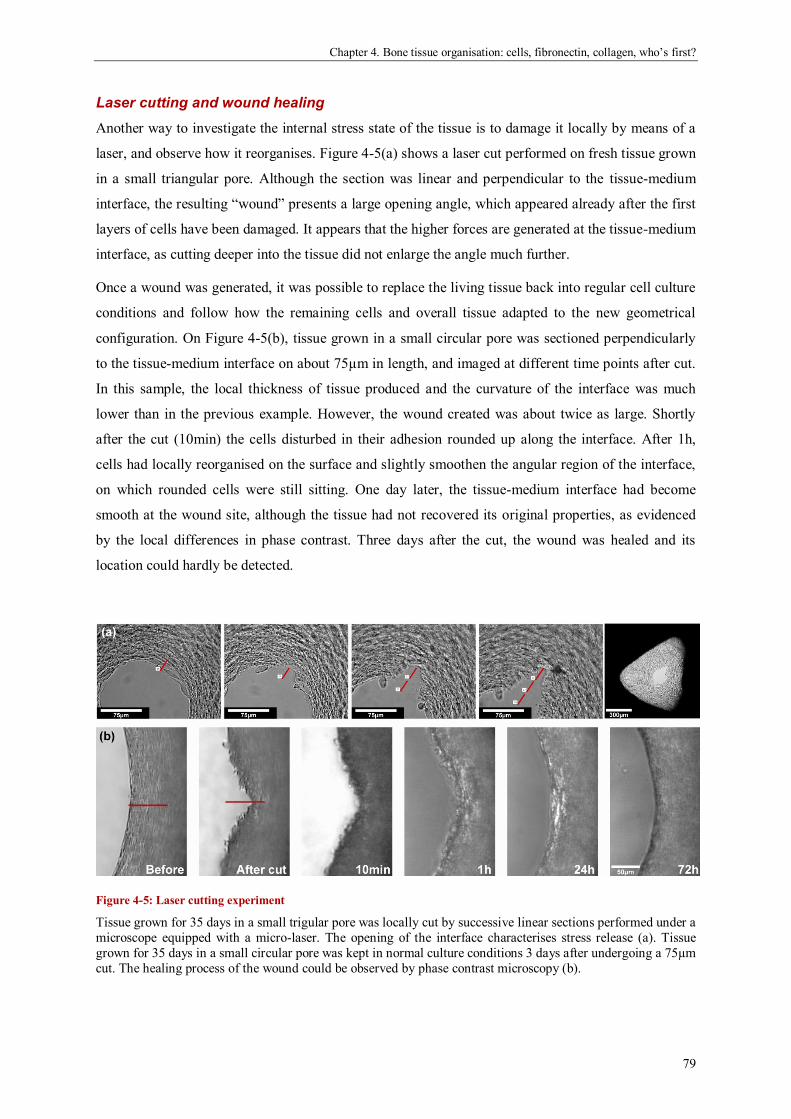
Chapter 4. Bone tissue organisation: cells, fibronectin, collagen, who’s first?
79
Laser cutting and wound healing
Another way to investigate the internal stress state of the tissue is to damage it locally by means of a
laser, and observe how it reorganises. Figure 4-5(a) shows a laser cut performed on fresh tissue grown
in a small triangular pore. Although the section was linear and perpendicular to the tissue-medium
interface, the resulting “wound” presents a large opening angle, which appeared already after the first
layers of cells have been damaged. It appears that the higher forces are generated at the tissue-medium
interface, as cutting deeper into the tissue did not enlarge the angle much further.
Once a wound was generated, it was possible to replace the living tissue back into regular cell culture
conditions and follow how the remaining cells and overall tissue adapted to the new geometrical
configuration. On Figure 4-5(b), tissue grown in a small circular pore was sectioned perpendicularly
to the tissue-medium interface on about 75µm in length, and imaged at different time points after cut.
In this sample, the local thickness of tissue produced and the curvature of the interface was much
lower than in the previous example. However, the wound created was about twice as large. Shortly
after the cut (10min) the cells disturbed in their adhesion rounded up along the interface. After 1h,
cells had locally reorganised on the surface and slightly smoothen the angular region of the interface,
on which rounded cells were still sitting. One day later, the tissue-medium interface had become
smooth at the wound site, although the tissue had not recovered its original properties, as evidenced
by the local differences in phase contrast. Three days after the cut, the wound was healed and its
location could hardly be detected.
Figure 4-5: Laser cutting experiment
Tissue grown for 35 days in a small trigular pore was locally cut by successive linear sections performed under a
microscope equipped with a micro-laser. The opening of the interface characterises stress release (a). Tissue
grown for 35 days in a small circular pore was kept in normal culture conditions 3 days after undergoing a 75µm
cut. The healing process of the wound could be observed by phase contrast microscopy (b).

Chapter 4. Bone tissue organisation: cells, fibronectin, collagen, who’s first?
80
Laser cutting under blebbistatin VS control
As tissue is not only composed of cells that are actively exerting forces, but also ECM elements that
provide an intrinsic elasticity to the tissue, combining blebbistatin treatment and laser cutting
experiments enabled to estimate the relative contribution from the active and the passive components.
A linear cut was performed in a small circular pore containing tissue grown for 35 days and treated
for 20h with 20µM blebbistatin. The shape of the wound site was compared to the one created in a
control sample grown for 36 days in regular culture medium (Figure 4-6 (a) and (b)). In both cases,
the tissue-medium interface adopted a V-shape, but the opening angle was much smaller in the treated
tissue, i.e. when cell contractility was impaired. This comparison suggests that the stress state of the
tissue grown by the cells is the result of the stretched state of the cells and their elastic extracellular
matrix plus the active pulling of the cells themselves (Figure 4-6(c)).
Figure 4-6: Inhibit contractility and cut
After 35 days of growth in small circular pores, tissue was incubated in 20µM blebbistatin diluted in 10%
medium overnight (~20h) and cut perpendicularly to the tissue-medium interface perpendicularly (a). The
wound created did not open as large as in the control kept in medium (b). This experiment enabled to visualise
the relative contribution of the active contraction of the cells and the passive elasticity of the ECM to the internal stress stored in the tissue (c).
Biochemical treatments to impair mechanics
Since cells are known to be contractile, another way to disturb the mechanics of the tissue they build
was to impair cell-cell contacts or to disrupt the ECM network they adhere on. Therefore, biochemical
treatments were performed on living tissues grown for 28 days in regular cell culture conditions as
described earlier. Changes in tissue patterning and cell shape were observed by mean of phase
contrast microscopy and immuno-fluorescent staining respectively (Figure 4-7).
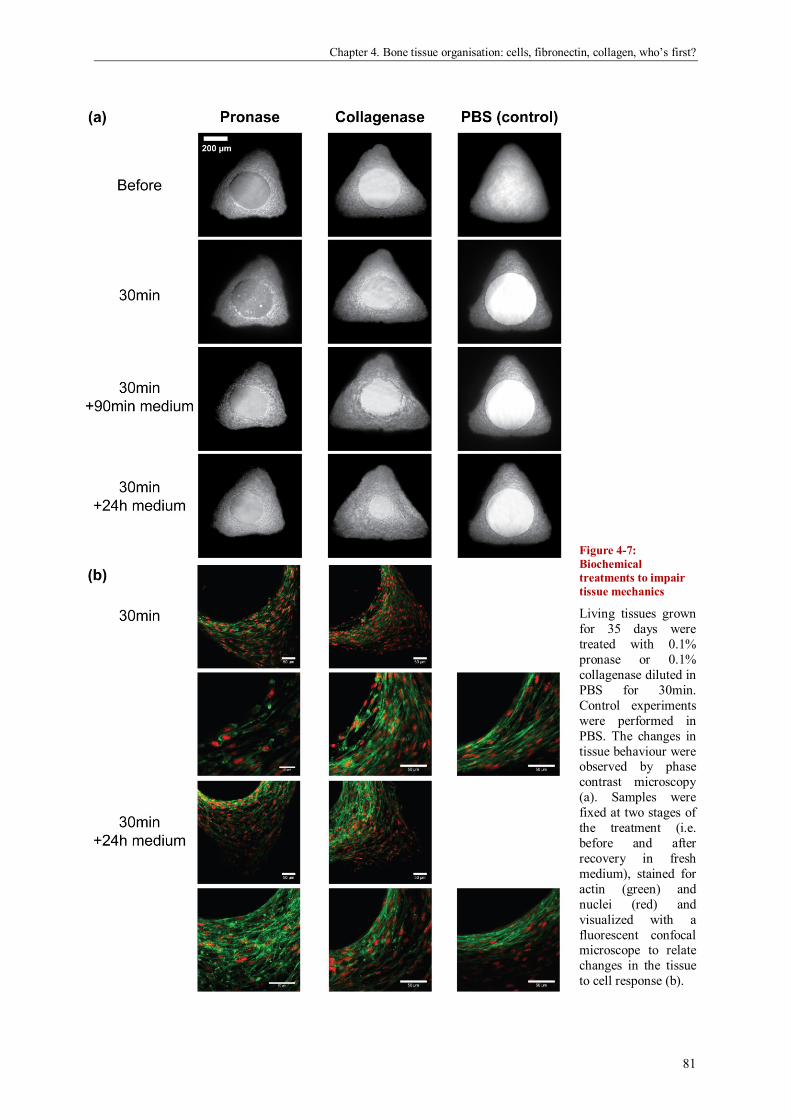
Chapter 4. Bone tissue organisation: cells, fibronectin, collagen, who’s first?
81
Figure 4-7:
Biochemical
treatments to impair
tissue mechanics
Living tissues grown
for 35 days were
treated with 0.1%
pronase or 0.1%
collagenase diluted in
PBS for 30min.
Control experiments
were performed in
PBS. The changes in
tissue behaviour were observed by phase
contrast microscopy
(a). Samples were
fixed at two stages of
the treatment (i.e.
before and after
recovery in fresh
medium), stained for
actin (green) and
nuclei (red) and
visualized with a
fluorescent confocal microscope to relate
changes in the tissue
to cell response (b).

Chapter 4. Bone tissue organisation: cells, fibronectin, collagen, who’s first?
82
In contrast to samples kept in PBS (control), the tissue-medium interface of the scaffolds incubated
for 30min in pronase got rougher as the cells adopted a more globular shape. When put back into
regular medium though, the smoothness was recovered as the cells reformed the contacts digested by
the pronase, and the tissue kept on growing.
In a similar way, a sample treated with collagenase revealed slight changes in tissue properties as
characterised by the local changes in contrast after 30min of incubation. Although cells kept an
elongated shape, some cell-ECM contacts were destroyed and the cells did not remain flattened on the
interface while they contracted. As seen on the phase contrast images, this effect was even clearer
when tissue was put back into culture medium for a short time after treatment, since cells could
contract in a regular way again but no new ECM had been produced yet. After 24h of recovering in
medium, the differences in phase contrast showed that the fast increase observed in projected tissue
area was due to tissue deformation rather than growth. The cells sitting on the surface recovered
similar shape and organisation as in the control experiment.
A control experiment in PBS insured that the changes in tissue and cell behaviour were not an effect
of culture medium deprivation during the treatment.
Discussion
In this study, three-dimensional bone tissue was built by MC3T3-E1 cells seeded on scaffolds
containing pores of controlled geometries. The internal structure of this tissue was investigated with
immunofluorescent staining and multiphoton confocal microscopy. Cells are the first elements
appearing in the tissue and turn out to have an elongated shape. Later on, actin, fibronectin and
collagen fibres show a similar organisation: parallel to the surface of the substrate close to the scaffold
and parallel to the tissue-medium interface when approaching the centre of the pore. As cells are
responsible for synthesising the ECM, it is important to understand how they organise their actin
cytoskeleton over large distances in order to clarify the mechanisms involved in the assembly and
alignment of fibronectin and collagen fibres throughout the tissue. For this, biochemical and
mechanical treatments are performed on the tissue obtained.
Structure
The analysis focuses on the three main structural components of non-mineralized bone tissue: cells,
which are characterised via their actin cytoskeleton, fibronectin and collagen fibres.
When a cell adheres on a substrate, which can be the stiff scaffold or a previous layer of tissue, the
actin cytoskeleton contracts via myosin motors and adopts a shape determined by the spatial
repartition of the adhesion sites (Théry et al. 2006). On curved surfaces as in the three-dimensional
pores, the actin fibres span over the long distances (up to 75-100µm) that separate the adhesion sites

Chapter 4. Bone tissue organisation: cells, fibronectin, collagen, who’s first?
83
and get an elongated shape when observed in the projection of the pore (Figure 4-1(a)). The adhesion
between several cells can even lead to spanning of gaps over much larger distances (Figure 4-1(b)),
which would induce tissue detachment later on, as additional layers of cells adhere. Such behaviour
justifies the hypothesis of the chord model proposed in Bidan et al. (2012b), which can describe the
patterning and the kinetics of tissue growth exclusively based on the contractile character of the cells
(Figure 4-8(a)). The elongated shape of the cells parallel to the tissue-medium interface after 35 days
of culture (Figure 4-1(d)), confirms that the cytoskeletal structure follows the predictions of the chord
model all along the growth process of the tissue (Figure 4-8(b) and (c)). However, when cells get
embedded in the mature tissue, they adopt a different morphology characteristic of a three-
dimensional adhesion pattern (Cukierman et al. 2001) (Figure 4-1(c) arrow).
Cell culture experiments performed with labelled fibronectin incorporated in the medium show the
presence of fibronectin all over the tissue. In the samples fixed one day after incorporation, the
integration of labelled fibronectin in the fibres along the tissue-medium interface (Figure 4-2(a) and
(b)) suggests that cells rapidly start to assemble fibronectin into fibres as they settle and adhere on the
tissue surface. Indeed, this fibrous protein is known to be essential for cells to generate traction forces
via stabilization of the focal adhesion (Hocking et al. 2000). In general, a co-alignment between the
actin and the fibronectin patterns can be observed. As fibronectin fibres are very extensible (Klotzsch
et al. 2009), they are likely to be highly deformed by the contractile actin network (Tan et al. 2003;
Corin and Gibson 2010). With such a spinning process, the cells can shape a fibronectin web similar
to the actin network but not as ordered (Figures 4-2(c) and 4-8(c)) (Sivakumar et al. 2006).
When collagen is assembled into fibrils, it produces SHG signals under multiphoton excitation at
about 840nm (Zoumi et al. 2002). SHG images taken at different culture stages (10, 17 and 35 days on
Figure 4-2(b), (d) and 4-3 respectively) reveal a progressive apparition of collagen fibres in the tissue.
Their formation starts in the corners and toward the scaffold after 2 weeks of growth. Interestingly,
this time point corresponds approximately to the secretion of alkaline phosphatase by the cells, which
indicates their differentiation into mature osteoblasts (Quarles et al. 1992). Although additional
staining for collagen would be needed to detect the formation of fibres of size below the detection
threshold of the SHG imaging, it seems that the assembly and maturation of collagen into thick fibres
does not occur instantaneously together with the other extracellular proteins but rather takes place
progressively after cell proliferation, adhesion, contraction and differentiation (Owen et al. 1990; Shea
et al. 2000) (Figure 4-8(c)). Their orientation follows the actin pattern, regardless of the initial
geometry of the substrate (Figure 4-3). It is important to mention that the absence of SHG signal close
to the tissue-medium interface shows the absence of collagen fibrils, but collagen can be still be
present in a non-assembled state (Velling et al. 2002).
Collagen fibres are recognized to contribute to the mechanical stability of the tissue not only because
of their relatively high stiffness compared to the other passive ECM fibres (Guthold et al. 2007), but
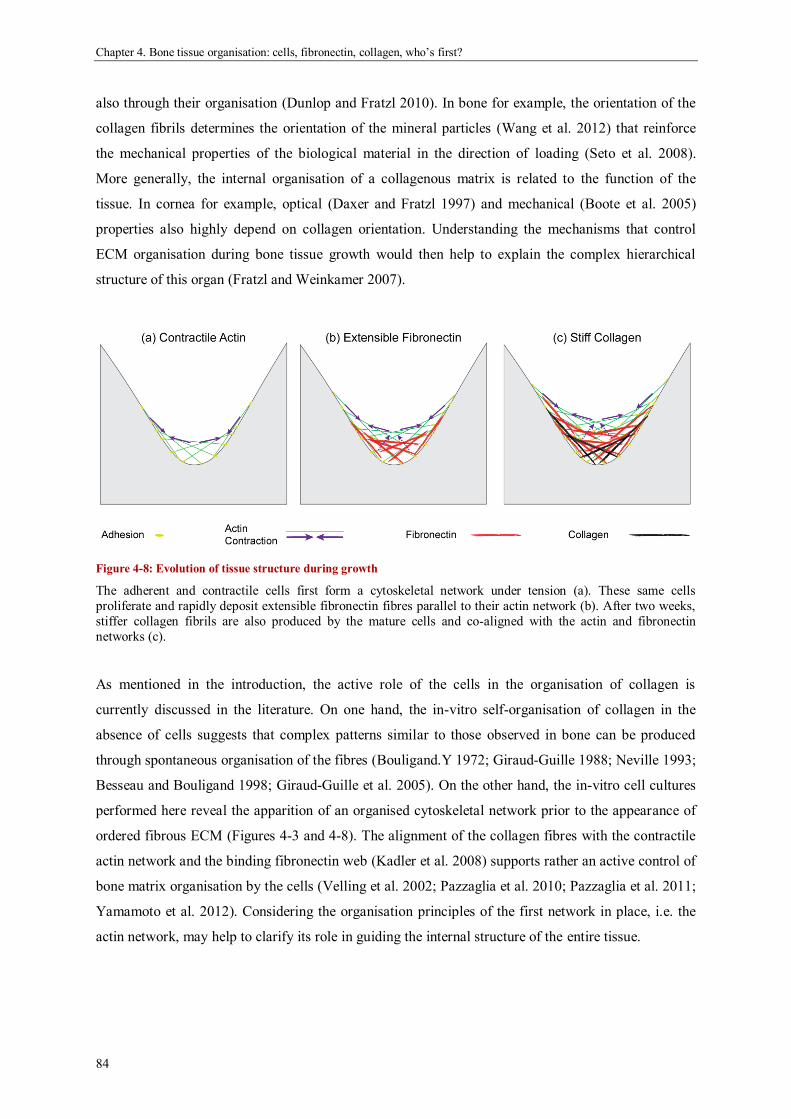
Chapter 4. Bone tissue organisation: cells, fibronectin, collagen, who’s first?
84
also through their organisation (Dunlop and Fratzl 2010). In bone for example, the orientation of the
collagen fibrils determines the orientation of the mineral particles (Wang et al. 2012) that reinforce
the mechanical properties of the biological material in the direction of loading (Seto et al. 2008).
More generally, the internal organisation of a collagenous matrix is related to the function of the
tissue. In cornea for example, optical (Daxer and Fratzl 1997) and mechanical (Boote et al. 2005)
properties also highly depend on collagen orientation. Understanding the mechanisms that control
ECM organisation during bone tissue growth would then help to explain the complex hierarchical
structure of this organ (Fratzl and Weinkamer 2007).
Figure 4-8: Evolution of tissue structure during growth
The adherent and contractile cells first form a cytoskeletal network under tension (a). These same cells
proliferate and rapidly deposit extensible fibronectin fibres parallel to their actin network (b). After two weeks,
stiffer collagen fibrils are also produced by the mature cells and co-aligned with the actin and fibronectin
networks (c).
As mentioned in the introduction, the active role of the cells in the organisation of collagen is
currently discussed in the literature. On one hand, the in-vitro self-organisation of collagen in the
absence of cells suggests that complex patterns similar to those observed in bone can be produced
through spontaneous organisation of the fibres (Bouligand.Y 1972; Giraud-Guille 1988; Neville 1993;
Besseau and Bouligand 1998; Giraud-Guille et al. 2005). On the other hand, the in-vitro cell cultures
performed here reveal the apparition of an organised cytoskeletal network prior to the appearance of
ordered fibrous ECM (Figures 4-3 and 4-8). The alignment of the collagen fibres with the contractile
actin network and the binding fibronectin web (Kadler et al. 2008) supports rather an active control of
bone matrix organisation by the cells (Velling et al. 2002; Pazzaglia et al. 2010; Pazzaglia et al. 2011;
Yamamoto et al. 2012). Considering the organisation principles of the first network in place, i.e. the
actin network, may help to clarify its role in guiding the internal structure of the entire tissue.

Chapter 4. Bone tissue organisation: cells, fibronectin, collagen, who’s first?
85
Active organisation of the cytoskeletal network
Although many studies present evidences for organisation via mechanics principles at the single cell
level, only a few extended their investigations to a multicellular level (Nelson et al. 2005) and hardly
any tackled in detail the tissue level. On a two-dimensional substrate, a single cell actively spans its
actin cytoskeleton between the adhesion sites (Théry et al. 2006), the radius of curvature of an actin
bundle between two anchorage points being proportional to their spacing (Bischofs et al. 2008).
Following this principle of “adhesion-contraction”, a cell sitting on stiff curved substrates is expected
to adopt a chord-like shape (Bidan et al. 2012b). To explore the hypothesis that mechanics plays an
important role in integrity and organisation during bone tissue growth, cell contractility, cell-cell
adhesion and collagen stability were chemically impaired, in order to disturb the internal stress of the
actin network and observe tissue response.
The use of blebbistatin to inhibit the myosin IIb molecular motors and thus cytoskeletal contractility
triggered the loss of the elongated shape of the actin fibres, especially along the tissue-medium
interface. However, the recovery of the original actin arrangement after 24h incubation in fresh
medium (Figure 4-4(b)) proves that the contractility of the actin cytoskeleton is essential for cells to
actively insure the proper internal organisation of the network they form (Bar-Ziv et al. 1999; Théry et
al. 2006) (Figure 4-9(a)). Although no quantitative measurements have been performed, live imaging
experiments revealed that blebbistatin also stops cell motion along the tissue-medium interface (data
not shown). Likewise, impairing cell adhesion or disrupting the ECM with pronase or collagenase
respectively, modifies the shape of the tissue-medium interface as well as the actin pattern (Figure 4-
7(b) and 4-9(b-c)). Because the cytoskeleton is an active scaffold responsible for cell shape (Bar-Ziv
et al. 1999; Théry et al. 2006; Pollard and Cooper 2009); the cytoskeletal network can be considered
as an active scaffold responsible for tissue shape (Bischofs et al. 2008). Altogether, the experiments
involving the impairment of the internal stress state of the cytoskeletal network showed that the shape
and the structure of the tissue depend on the mechanical tension build by the actin fibres. Defects in
tissue mechanics, artificially induced in our experiments, are also known to be involved in many
diseases (Ingber 2003). This suggests that cells need cell-cell contacts as well as a stable underlying
substrate to adhere on, in order to develop the mechanical tension essential to organise a healthy
tissue.
Consequences at the tissue scale
Once the cells adhere and organise a cytoskeletal network through contraction, they produce or recruit
from the plasma ECM proteins like collagen and fibronectin, and assemble them into a dense network
which constitutes the non-mineralised bone tissue (Sivakumar et al. 2006; Moretti et al. 2007;
Bentmann et al. 2010). Although cells are known to interact individually with these ECM proteins
(Danen and Yamada 2001; Hynes 2009; Grinnell and Petroll 2010), how the contractile activity of the
actin network influences the organisation of the ECM fibres at the tissue scale is still not clear.

Chapter 4. Bone tissue organisation: cells, fibronectin, collagen, who’s first?
86
Fibronectin retains important biological functions (Singh et al. 2010) through the mediation of cell-
matrix contact via integrins (Danen and Yamada 2001). For example, Vogel and co-workers showed
this extracellular component acts as a mechanotransducer that converts mechanical stimuli into
biochemical cues (Vogel 2006). Indeed, unfolding mechanisms of fibronectin fibres affects cell
behaviour not only via changes in the local mechanical properties of the ECM (Halliday and Tomasek
1995; Vogel and Sheetz 2009) but also directly through exposure of domains that are biologically
active (Baneyx et al. 2002). By such mechanisms, binding domains for collagen precursors can also
be exposed and facilitate the formation of fibrous ECM (Kadler et al. 2008; Singh et al. 2010). In
general, fibronectin and collagen production and polymerisation were shown to be tightly
interdependent (Velling et al. 2002; Shi et al. 2010) and to have an important feedback on cell
behaviour (Sottile et al. 2007).
Once in place, the collagen network behaves like a passive scaffold on which cells and fibronectin can
adhere (Gelse 2003), and serves a mechanical function. Indeed, tissue deformation resulting from the
collagenase treatment showed that the ability of the ECM to resist the cytoskeletal tension is also
essential to guarantee the integrity of the tissue (Figure 4-7(a)). The shrinkage of the circular interface
can be interpreted as a consequence of the tension generated by the contractile actin bundles along the
tissue-medium interface (Figure 4-7(b)) as less resistance is applied by the disrupted collagen network
(Figure 4-9(c)). Repeating this experiment with different concentrations of collagenase or impairing
collagen synthesis by depriving the cells in ascorbic acid during growth (Chan et al. 1990), would
help to estimate the role of the passive ECM fibres (mainly collagen) in the stability of the tissue.
Inspired by experiments performed on the fibre and cell levels (Kumar et al. 2006; Tamada et al.
2007), tissue was micro-sectioned after 35 days of culture. Again, the opening of the wound generated
by a linear cut was characteristic of the release of internal stress (Figures 4-5(a) and 4-9(d)). Although
such experiments need to be repeated and quantified, comparing a micro-sectioning experiment
performed on a living tissue treated with blebbistatin and a non-treated living tissue, shows that not
only the actin network but also the passive ECM matrix are under stress (Figure 4-6) (Kraning-Rush
et al. 2011). One can then speculate that when the organisation of the actin fibres has been adapted to
optimise stress distribution with respect to the local boundary conditions, the cells under tension
substitute the active cytoskeletal network by an intermediate fibronectin web followed by a passive
stiff collagen scaffold. The ECM would have the same optimal organisation as the cytoskeletal
network and carry in its intrinsic elasticity the stress released by the cells during their formation.
As tissue is a tight assembly of contractile cells, biologically active fibronectin fibres and stiff
collagen fibrils, diverse representations are proposed to model tissue behaviour under different
stimuli. For example, because the fibronectin and collagen fibres co-align with the actin network, the
chord model used to describe cell organisation in the tissue (Bidan et al. 2012b), can be extended to
the fibrous components of the ECM. This idea was already suggested in previous works (Bidan et al.

Chapter 4. Bone tissue organisation: cells, fibronectin, collagen, who’s first?
87
2012c) after visualising the global collagen orientation with polarised microscopy. Comparable
behaviour between the cell level and the tissue level were already pointed out by Bischofs et al.
(Bischofs et al. 2008) and described with a cable model. In contrast to the chord model, which
superimposes tensile elements under equilibrium, the cable model considers their interaction as a
network. The tension, generated by an actin bundle (cable), contributes therefore to the final shape of
the whole system, and disturbing single cells or their contacts would lead to the reorganisation of the
whole network of actin, fibronectin and collagen fibres. As such, like cells, tissues may also be
viewed as tensegrity structures (Stamenović and Ingber 2009).
Figure 4-9: How the organised tissue reacts to mechanics?
The mechanical treatments performed on the living tissue are represented schematically. Blebbistatin (a) and
pronase (b) treatments mainly affect the cells close to the tissue-medium interface, whereas collagenase disrupts
the stiff collagen network, which releases the cytoskeletal tension by a rapid change of the tissue pattern (c). The
opening of a wound created by micro-sectioning also characterise the internal stress state of the cellular and
extracellular networks (d).
One limitation of such models remains in their two-dimensional character. Although geometrical
constrains give the actin network a particular shape and direct their mechanical tension, cells are
known to pull in three dimensions (Legant et al. 2009; Trepat et al. 2010). The optimal tissue
organisation and following growth would then be driven by the geometry of the 3D surface. In that
respect, the computational model of curvature-driven growth derived from the chord model, was
recently extended to three dimensions (Appendix A).
Chapter 4. Bone tissue organisation: cells, fibronectin, collagen, who’s first?
88
Interests of the work and outlook
This work relates multicellular cytoskeletal alignment and final tissue structure by showing that
cytoskeletal and early as well as later matrix structure (fibronectin and collagen respectively) are
following each other. As such, the chord model extended to the fibrous ECM can be applied to
different situations involving tissue deposition. For example, the simple geometrical construction
justifies the presence of an actin ring along the tissue-medium interface in the context of wound
healing (Bement 2002; Salbreux et al. 2009). Although wound healing in 2D has been explained by
cell crawling (Anon et al. 2012), in a wound or a fracture created on a three-dimensional surface, cells
don’t have a substrate to migrate directly in the gap, but need to develop other mechanisms. The
healing experiment performed with micro-sectioning on living tissue (Figure 4-5(b)) suggests that
cells close the wound via the “adhesion-contraction” principle and layers of ECM are subsequently
deposited to recover the original structure of the tissue. The modification of the mechanical properties
of the tissue with maturation was observed in other in-vitro systems (Cao et al. 2006; Petersen et al.
2012) but also during the early stages of bone healing in-vivo (Vetter et al. 2010).
In this paper, structural investigations of a three-dimensional non-mineralised bone tissue produced
in-vitro coupled with biochemical and mechanical treatments demonstrated that during tissue growth,
cells first order themselves by building up mechanical stress in their cytoskeletal network and then
assemble the fibronectin and the collagen fibres with a similar organisation. Such observations
strongly support the active participation of the cells in the organisation of the extracellular matrix.
Moreover, the simple representation of the tissue proposed in the present work can explain in-vitro
and in-vivo observations and constitutes therefore a step forward in the understanding of tissue
organisation (Figure 4-8) and mechanics (Figure 4-9). Although the experimental model used in this
work only accounts for “early” growth stages before mineralization, it still makes sense to infer that
the collagen structure “frozen” by mineralization determines (or at least contributes to) the structural
order in bone, and other types of collagenous/mineralized tissues (Wang et al. 2012). The geometrical
principle presented as the chord-model could therefore be helpful to explain the particular orientation
of collagen in bone tissue (Wagermaier et al. 2006) and also inspire tissue engineers to design
scaffolds that would guide tissue orientation toward the optimal arrangement adopted in natural
growth (Cipitria et al. 2012).
Acknowledgements
We acknowledge funding from the Leibniz prize of PF running under DFG contract number
FR2190/4-1. CB and PJ are members of the Berlin-Brandenburg School for Regenerative Therapies
(GSC 203).

89
Chapter 5. General discussion
The main goal of the thesis was to understand how the geometry of a substrate controls tissue growth
and its organisation. The previous chapters have presented some of the results from the last three
years in the form of four papers (Chapters 1 to 4).
Back to the objectives
The scope of the thesis was highlighted by a literature survey, which showed the importance of
physics in cells and tissue patterning (Chapter 1). This review demonstrated that the impact of
geometry has been investigated at sub-cellular, cellular and multi-cellular levels, but only a small
amount of research has been done at the tissue scale. Although clinicians could observe some effects
in-vivo (Ripamonti 2009; Schuckert and Osadnik 2011), the influence of millimetre sized geometrical
features of the substrate had never been quantified before. In this thesis, in-vitro tissue culture
experiments coupled with computational simulations confirmed that a model of curvature-driven
growth is not only relevant to describe quantitatively tissue growth on complex surfaces (Chapter 2),
but can also be applied to optimize the geometry of scaffolds that promote tissue formation (Chapter
3). Moreover, a simple geometrical construction inspired by the elongated shape of the contractile
cells – the chord model – was proposed as an alternative method to describe tissue deposition and was
demonstrated to be mathematically equivalent to the curvature-driven growth model (Chapter 2). This
step towards understanding the cellular mechanisms involved in tissue patterning and organisation
was first supported by preliminary structural investigations of the tissue (Chapter 3), and then
confirmed by a deeper (but qualitative) analysis of cells and ECM organisation and by highlighting
the role of the internal mechanical stress in tissue stability (Chapter 4).
As the papers presented in this cumulative thesis already discussed individually the results, this
general discussion section rather focuses on i) possible improvements of the system to access three-
dimensional information about tissue growth, ii) new directions for research inspired by the outcomes
of the thesis, and iii) potential implications of the work.
Exploration in the third dimension
Although the experimental setup proposed by Rumpler et al. (2008) combined with the computational
methods developed in this work constitute a powerful approach, limitations remain. The following
paragraphs discuss the restrictions imposed by the system and propose potential solutions.
Chapter 5. General discussion
90
Confocal microscopy: Analysis of tissue structure in three dimensions
During the cell culture experiments, monitoring tissue growth by phase contrast microscopy gives
access to the evolution of the tissue-medium interface in projection only, meaning that growth along
the vertical direction cannot be assessed. Therefore, the effect of the geometry in the third dimension
has been limited by using straight sided pores. Although the chord model and the implementation of
curvature-driven growth are two-dimensional, they describe both qualitatively and quantitatively the
kinetics and patterning of tissue formation observed on the phase contrast images. Indeed, as the cells
are initially seeded on the upper surface of the scaffold, the tissue is not expected to grow
homogeneously all along the pore as it was assumed but rather faster on the top. Observing the
evolution of the tissue-medium interface in the third direction would be useful to refine the models
and may explain some remaining differences with the experimental data. An example discussed in the
papers is the slowdown of tissue growth occurring after two weeks of culture (Chapters 2 and 3).
Among the different methods tested to analyse the tissue produced in HA scaffolds in three
dimensions, the most instructive results came from a combination of actin staining and confocal laser
scanning microscopy (Appendix D1 and D2). This technique enables the optical sectioning of a three-
dimensional fluorescent object. Unfortunately, the depth of measurement is limited by the loss of
signal in the dense tissue and a maximum depth of 200µm, i.e. one tenth of the total height of the
pore, could be reached using multiphoton microscopy (Appendix D3). Despite this limitation, imaging
at different heights within a pore gives a better representation of at least the top part of the three-
dimensional tissue (Figure E-1(a)).
The image resulting from the maximum projection of the entire stack represents the pattern of actin as
one would see if looking through the pore. With this method, pores containing a reasonable amount of
tissue often revealed a twisting pattern of the cytoskeletal network as the actin fibres appear to be
arranged in a spiral way (Figure E-1(b)). Interestingly, a spontaneous chiral organisation by cells was
already observed during in-vitro experiments performed on two-dimensional toroidal fibronectin
patterns (Wan et al. 2011) and the twisting direction was cell type dependant. In order to quantify the
orientation of the actin fibres on the maximal projection fluorescent images, a computational tool was
implemented in Matlab (Mathworks) (Appendix E2). Further quantifications are required to be
statistically relevant but the actin spiralling in the three-dimensional bone tissues produced in this
work is mostly directed clock-wise (Figure E-3).
A three-dimensional reconstruction of the actin pattern can also be derived from the set of images
obtained by optical sectioning. This representation reveals that the straight actin fibres at the tissue-
medium interface are not totally perpendicular to the vertical direction, which explains the chiral
pattern observed on the maximum projection (Figure E-1(c)). Cells seem to prefer an oblique
orientation in the third dimension, which differs from the hypothesis of the chord model but can still
be represented as a tensile element in the projection plane. Interestingly, the right-handed spiralling of

Chapter 5. General discussion
91
the actin fibres in three-dimensional bone tissue produced in-vitro resembles the collagen and mineral
orientation measured in osteonal bone (Wagermaier et al. 2006). In principle, second harmonic
generation microscopy (SHG, Appendix D3) could be used to determine whether collagen fibrils
follow the same patterns. Unfortunately, SHG signal is only emitted by thick fibrils present in mature
tissue and quickly decreases as one penetrates in the tissue. Therefore no conclusion on collagen
chirality in this in-vitro system has been drawn so far.
It is also possible to get orthogonal slices from such a reconstruction, i.e. vertical optical sections of
the tissue. Although the loss of signal limits the depth of measurement within the pore, a typical
asymmetric pattern is regularly observed on tissues imaged by multiphoton microscopy (Figure E-2).
Tissue thickness is higher towards the top of the scaffold and the tissue-medium interface is convex
along the z-axis. Such results meet the speculations made in Chapter 2 and 3 when discussing the two-
dimensional models.
Altogether, these observations motivate the development of the computational tools and experimental
methods for further investigations in three dimensions.
Material development: Adaptation of the substrate to microtome sectioning
The influence of the local curvature of the surface on cell fate and gene expressions is also a recurrent
topic of discussion (Levina et al. 1996; Vogel and Sheetz 2006). Indeed, many studies showed that the
geometry of a substrate determines the stress distribution in a cell sheet as well as the concentration
profiles of the surrounding biochemical factors, and thereby influences local proliferation (Nelson et
al. 2005), differentiation (Ruiz and Chen 2008) and protein synthesis (Nelson and Bissell 2006).
However, the biological responses of the pre-osteoblasts in the three-dimensional tissue could not be
addressed with this experimental system for different reasons. The limited amount of tissue produced
in one pore prevents the measurement of gene expression by mRNA analysis. Moreover, relevant
information would rather come from comparing gene expressions between different regions within a
single pore, for example by looking on curved and flat surfaces of the scaffold, on the tissue-medium
interface and in mature tissue in the bulk. An alternative to local mRNA analysis would then be to
map the presence of characteristic proteins in the tissue. For example, the distribution of alkaline
phosphatase and osteocalcin would reveal the differentiation stage of the pre-osteoblasts in different
regions of the tissue (Quarles et al. 1992; Attawia et al. 1995). Unfortunately, the high number of cells
embedded in the dense ECM prevents most fluorescent molecules to diffuse properly throughout the
thick tissue. Many staining techniques are therefore not adapted to such studies yet and none can be
used for quantitative measurements. The difficulty to assess cell proliferation constitutes therefore a
major weakness of the system since counting the cells or incorporating BrdU (Inkson et al. 2009) for
labelling divided cells are methods that are not applicable to the three-dimensional tissues formed in
the scaffolds. The limited diffusion of staining molecules in thick tissues also justifies the alternative
Chapter 5. General discussion
92
protocol used in Chapter 4. The fluorescent labelled fibronectin added to the culture medium was
indeed directly incorporated in the ECM by the cells during synthesis, which enabled structural
investigations of the thick tissue.
Sectioning the scaffold would be an efficient solution to overcome the problem of diffusion, as the
access of the staining molecules to the proteins targeted would be largely facilitated on a slice of
tissue. However, hydroxyapatite scaffolds are too stiff and brittle to be cut without damaging the
tissue in the pores. Decreasing the mechanical mismatch with embedding techniques was also
ineffective and softer materials were thus considered to replace hydroxyapatite. Beyond being
biocompatible, this material should be adapted to the scaffold production process, withstand a
sterilization protocol as well as the cell culture conditions and be suitable for a final sectioning.
Among the various polymers used as substrates for cell culture experiments, a few were considered to
produce the three-dimensional scaffolds. Three attempts are presented in the following.
Polyurethane (PU) was shown in a previous study by Kommareddy et al. (2010) to be a suitable
substrate to investigate the effect of material stiffness on three-dimensional tissue growth. This work
concluded that the elasticity of the substrate influences the lag time before cells start to deposit tissue
but does not affect the subsequent tissue growth rate. As such, no extensive changes in growth
behaviour are expected from changing hydroxyapatite to a softer scaffold material. Unfortunately the
complex fabrication process of PU scaffolds would limit the variety of pore geometries to be
designed. Other alternatives were therefore explored.
Polyacrylamide (PAAm) is a particularly attractive hydrogel due to i) the simple chemistry of its
polymerisation, ii) its biocompatibility and iii) its high water content leading to similar mechanical
properties as the tissue. PAAm is thus a good candidate for scaffold fabrication, cell culture and
sectioning by cryo-microtomy. As detailed in the protocol of Wang and Pelham (1998), mixing
solutions of acrylamide and bis-acrylamide with an initiator (ammonium peroxodisulphate, APS) and
a cross-linker (N,N,N,N-tetramethylethylenediamine, TEMED) leads to spontaneous polymerisation
at room temperature. Compression tests showed that the elasticity of the gels produced was under
100kPa. This is rather soft but still appropriate for growing collagenous tissues (Engler et al. 2006).
The mixture was poured in wax moulds produced by rapid prototyping, which were removed by
dissolution in tetrahydrofuran (THF) after polymerisation of the gel. The resulting PAAm scaffolds
were extensively washed in water and PBS before being sterilised under UV light and incubated with
MC3T3-E1 cells. In general, an inhomogeneous adhesion pattern was observed on the flat top surface
of the scaffold and the tissue produced in the pores was often detached from the substrate after a
couple of days, i.e. once the resulting forces generated by the cells became too strong for the weak
adhesion (Legant et al. 2009). The regular coating techniques used to functionalise the substrate were
not adapted to the confined surfaces in the pores such as fibronectin or collagen covalent coating by
photo-activation of Sulfo-SANPAH (sulfosuccinimidyl-6(49-azido-29-nitrophenyl-amino) hexanoate)
Chapter 5. General discussion
93
(Wang and Pelham 1998) or did not improve the adhesion of the tissue in the pores like coating with
PDDA (poly(diallyldimethylammonium chloride)) (Nichols et al. 2009). The weak adhesion of cells
on soft substrates often limits the use of such material for tissue culture experiments (Engler et al.
2004; Schwarz 2007). However, a few samples endured the fixation step after 20 days of growth and
could be further analysed. Cryo-sectioning at -20°C was a successful technique to slice PAAm
scaffolds horizontally or trim them vertically to expose tissue pattern in the longitudinal direction. A
histological staining for alkaline phosphatase (ALP) on a single slice revealed the presence of
differentiated cells all over the tissue except along the tissue-medium interface (Figure E-4), where
the cells seem to be still in a proliferation phase (Stein et al. 2004). Interestingly, the structural
analyses performed in Chapter 4 showed a lack of SHG signal from collagen along the tissue-medium
interface. A reason could thus be the limited ability and amount of time given to those “young” cells
to assemble thick collagen fibres in contrast to the mature osteoblasts present in the bulk of the tissue
(Figure 4-3). Finally, immunofluorescent staining for actin on the longitudinal section of the pore
confirmed the asymmetric pattern of the tissue and a maximum projection showed the preferred
oblique orientation of the cells hinted by previous optical sectioning (Figure E-5).
Polydimethylsiloxane (PDMS) is another soft material often applied to biological studies (Sia and
Whitesides 2003). PDMS scaffolds have been produced using metallic moulds and covalently coated
with fibronectin (Pompe et al. 2003) by the group of Prof. Carsten Werner at the Leibniz-Institut für
Polymerforschung in Dresden. Identical cell culture experiments were performed on these substrates
and although some pieces of tissue were still partially detached from the surface, an improvement was
observed compared to the other soft materials. Moreover, the tissue formed in the pores appeared to
be stable during sectioning by cryo-microtomy and further staining could be performed (Figure E-6).
Despite the ideal distribution of stain all over the slice of tissue, a concentration of the actin signal
along the tissue-medium interface was still remarkable. These first results suggest that the actin ring
previously observed on confocal images of the three-dimensional tissue can indeed be attributed to the
higher concentration of actin stress fibres along the interface, and not only to a higher concentration of
staining agent. As discussed in the previous chapters, such a contractile ring was already observed in
the different contexts of wound healing (Abreu-Blanco et al. 2012), dorsal closure during drosophila
morphogenesis (Kiehart et al. 2000) or in in-vitro actin/myosin gels (Backouche et al. 2006), and is
explained by an enhanced concentration of myosin along the interfaces (Figure 2-6). It is also
important to note the presence of fibronectin all over the cross section of tissue: in the bulk as well as
on the tissue-medium interface. Indeed, this staining method supports the results obtained by
incorporating labelled fibronectin during tissue culture experiments as reported in Chapter 4, and
confirms thereby the early production of fibronectin in the tissue growth process (Hocking et al.
2000).
Chapter 5. General discussion
94
The replacement of hydroxyapatite by a soft gel appears to be a promising solution to overcome the
two limitations of the experimental system mentioned above: the difficulty to observe tissue patterns
in three dimensions and the restricted structural investigations due to the lack of diffusion of staining
molecules within the tissue. The preliminary results obtained by optical and microtome sectioning
strongly encourage further efforts to develop the system in that direction.
Directions of research
Although the methods presented in the last section are still in development to produce reproducible
and relevant outcomes, the few results harvested so far gave important hints about the three-
dimensional structure of the tissue and opened some doors for further investigations.
Geometry: Extension of the chord model into 3D
The first interesting observation in three dimensions is the organisation of the cells. Indeed, the chiral
actin pattern appearing on most of the maximal projections generated by confocal microscopy
corresponds to the alignment of the elongated cells in a particular direction, which is not along the
vertical axis of the pore nor in the horizontal plane (Figures E-1 and E-5). Although no extension of
the chord model has been proposed to describe tissue growth in three dimensions yet, it is important
to mention that the actin pattern of the tissue-medium interface strikingly resembles a hyperboloid
surface, which is generated by the rotation around a vertical axis of a segment directed in three
dimensions (ruled surface) (Appendix E-4). Interestingly, this simple geometrical construction based
on the arrangement of chord-like objects in three dimensions accounts not only for the chiral pattern
observed on projections but also for the convexity that appears along the z-axis (Figure E-7).
In order to develop this idea, it is necessary to understand what triggers the cells to spiral in a
preferred direction while migrating on the scaffold. Although this symmetry breaking has already
been observed on two-dimensional substrates, its origin is still unclear (Huang et al. 2005; Wan et al.
2011). Therefore, traditional techniques used to track collective cell migration on two-dimensional
substrates (Angelini et al. 2011) need to be adapted to the three-dimensional system in order to assess
the individual and collective behaviour of the cells at the early stages of growth both on the top of the
scaffold and on the curved surface within the pore. According to the theoretical model of Biton and
Safran (2009) the evolution of cell orientation, and thus the direction of migration, is expected to
correlate with particular lines of the tissue-medium interface. Analysing the three-dimensional
curvature of these lines would suggest optimal boundary conditions for the cells to achieve their
mechanical equilibrium and may provide hints to develop a three-dimensional chord model for tissue
growth.
Chapter 5. General discussion
95
Comparing cell organisation with similar patterns observed in Nature, e.g. in bone (Wagermaier et al.
2006) and in wood (Lichtenegger et al. 1999), would also add to the understanding of the general
mechanisms involved in tissue formation.
Computer simulation: Extension of the curvature-driven growth model into 3D
In Chapter 2, it was demonstrated that the pattern of growth derived from the chord model in two
dimensions is equivalent to the predictions of a computational model of curvature-driven growth. It
was discussed and detailed with an analytical model proposed in Chapter 3, that a model of growth
driven by the mean curvature in three dimensions (the average of the two principle curvatures) is
expected to account for the apparition of the convexity along the vertical axis of the pore. In contrast
to the chord model the computational method used to simulate curvature-driven growth on a two-
dimensional surface has already been adapted to three dimensions. The details of this three-
dimensional model as well as the first results are presented in the paper attached in Appendix A.
Briefly, the mean curvature of the surface described in a three-dimensional digital array was estimated
using the discrete method of Bullard et al. (1995), and similar laws as in the two-dimensional model
presented in Chapter 2 were applied for the interfacial motion. If the positive mean curvature of the
three-dimensional surface is taken as the driving force for tissue deposition, growth is described by
the Laplace law and the shape of the tissue-medium interface evolves toward a surface that minimises
the interfacial energy (Plateau 1894). The resulting catenoid (a minimal surface) presents a negative
second principal curvature, which indeed appears along the vertical axis in the computational
simulation (Figure A-6). Such an effect explains the slowdown of growth observed in the
experiments. Additionally, the asymmetry of the patterns obtained by optical and microtome
sectioning in the longitudinal direction (Figure E-5) can be derived when implementing cell migration
from the top surface of the scaffold toward the bottom of the pore (Figure A-7).
Whether a three-dimensional chord model based on the formation of hyberboloids can be equivalent
to a curvature-driven growth that generates catenoids, still needs to be demonstrated.
Tissue mechanics: Estimation of the internal stress state and mechanical properties
As discussed in Appendix A, the observed curvature-driven growth behaviour suggests that the
interfacial motion is driven by an effective surface tension (Plateau 1894) resulting from the
combination of adhesion and cytoskeletal tension generated by the contractile cells (Manning et al.
2010). Measuring surface tension would then provide additional information to make the link between
the geometry of the substrate to the local cell activity and tissue growth. Unfortunately, most of the
techniques available, like tissue surface tensiometry (TST) developed to quantify the role of surface
tension in self-sorting in embryonic tissues (Foty et al. 1994; Foty and Steinberg 2005), are not
applicable to tissues confined in small pores (Janmey and Schmidt 2006).
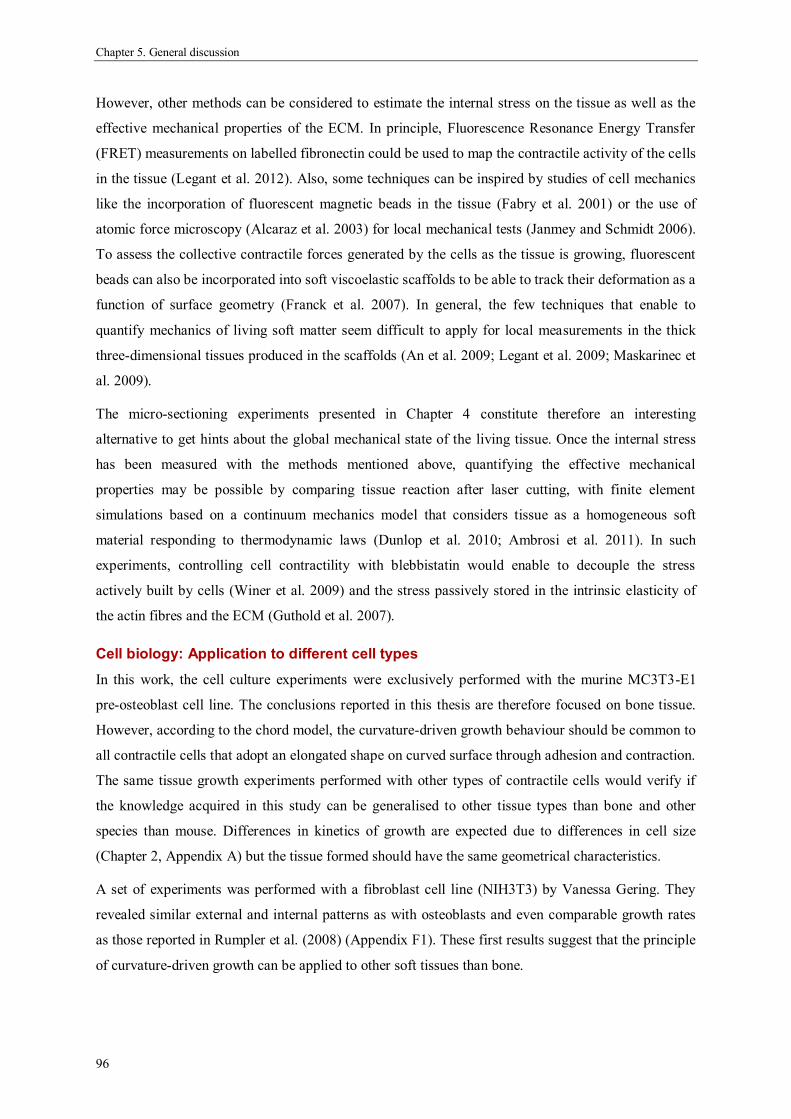
Chapter 5. General discussion
96
However, other methods can be considered to estimate the internal stress on the tissue as well as the
effective mechanical properties of the ECM. In principle, Fluorescence Resonance Energy Transfer
(FRET) measurements on labelled fibronectin could be used to map the contractile activity of the cells
in the tissue (Legant et al. 2012). Also, some techniques can be inspired by studies of cell mechanics
like the incorporation of fluorescent magnetic beads in the tissue (Fabry et al. 2001) or the use of
atomic force microscopy (Alcaraz et al. 2003) for local mechanical tests (Janmey and Schmidt 2006).
To assess the collective contractile forces generated by the cells as the tissue is growing, fluorescent
beads can also be incorporated into soft viscoelastic scaffolds to be able to track their deformation as a
function of surface geometry (Franck et al. 2007). In general, the few techniques that enable to
quantify mechanics of living soft matter seem difficult to apply for local measurements in the thick
three-dimensional tissues produced in the scaffolds (An et al. 2009; Legant et al. 2009; Maskarinec et
al. 2009).
The micro-sectioning experiments presented in Chapter 4 constitute therefore an interesting
alternative to get hints about the global mechanical state of the living tissue. Once the internal stress
has been measured with the methods mentioned above, quantifying the effective mechanical
properties may be possible by comparing tissue reaction after laser cutting, with finite element
simulations based on a continuum mechanics model that considers tissue as a homogeneous soft
material responding to thermodynamic laws (Dunlop et al. 2010; Ambrosi et al. 2011). In such
experiments, controlling cell contractility with blebbistatin would enable to decouple the stress
actively built by cells (Winer et al. 2009) and the stress passively stored in the intrinsic elasticity of
the actin fibres and the ECM (Guthold et al. 2007).
Cell biology: Application to different cell types
In this work, the cell culture experiments were exclusively performed with the murine MC3T3-E1
pre-osteoblast cell line. The conclusions reported in this thesis are therefore focused on bone tissue.
However, according to the chord model, the curvature-driven growth behaviour should be common to
all contractile cells that adopt an elongated shape on curved surface through adhesion and contraction.
The same tissue growth experiments performed with other types of contractile cells would verify if
the knowledge acquired in this study can be generalised to other tissue types than bone and other
species than mouse. Differences in kinetics of growth are expected due to differences in cell size
(Chapter 2, Appendix A) but the tissue formed should have the same geometrical characteristics.
A set of experiments was performed with a fibroblast cell line (NIH3T3) by Vanessa Gering. They
revealed similar external and internal patterns as with osteoblasts and even comparable growth rates
as those reported in Rumpler et al. (2008) (Appendix F1). These first results suggest that the principle
of curvature-driven growth can be applied to other soft tissues than bone.

Chapter 5. General discussion
97
Also, smooth muscle cells being much longer than fibroblasts and osteoblasts, they would enable to
verify the relation between tissue growth rate and cell size expected from the derivation of the chord
model (Chapter 2). Moreover, playing with the ratio between the size of the cell and the size of the
geometrical features would help to estimate the limit of curvature sensing expected from the
computational methods presented in Chapter 2 and further discussed in Appendix A.
In order to look for further applications of this research, Prof. Carsten Werner and his group offered to
perform identical tissue culture experiments with human mesenchymal stem cells (hMSCs).
Interestingly, the use of hMSCs differentiated towards an osteogenic lineage showed similar
behaviour as with the osteoblasts and fibroblasts cell lines, whereas hMCSs differentiated toward an
adipogenic lineage only formed a monolayer on the surface of the hydroxyapatite scaffolds (Appendix
F2). Considering that adipocytes contractility is limited (Kilian et al. 2010), these results significantly
support the hypothesis of the chord model, which can only describe tissue grown by contractile cells.
The growth behaviour of the undifferentiated hMSCs being unclear (Figure F-2), extra experiments
are needed to draw conclusions on the ability for the hMSCs to build tissue through adhesion and
contraction as described by the chord model. Nevertheless, it would be interesting to verify if the
geometrical features of a three-dimensional surface can locally influence natural cell differentiation
similarly to what Engler et al. showed on substrates of different stiffnesses (Discher et al. 2005) and
Ruiz et al. showed on two-dimensional fibronectin patterns of different geometries (Ruiz and Chen
2008).
Implications of the study
Estimating the influence of geometry on tissue formation and clarifying the physical and biological
mechanisms involved, adds to the understanding of biological processes and may even be applied to
better control tissue regeneration in the future. This work is therefore of high interest for both
fundamental medical research and tissue engineering.
Basic understanding of biological processes
Indeed, as it was already discussed in the individual papers, the conclusions of our studies can explain
observations made in-vivo in various contexts and clarify some aspects of biological phenomena
(Ripamonti 2009; Schuckert and Osadnik 2011).
During bone remodelling for example, it is known that the osteoclasts, which removed old and
damaged bone, use biochemical signalling pathways to activate the osteoblasts, which lay down new
bone tissue (osteoid) in the lacunae (Parfitt 1994; Eriksen 2010). However, such a mechanism does
not explain the end of bone synthesis by the osteoblasts and their conversion to lining cells once the
geometry of the surface has been recovered. In cortical bone, the cylindrical osteons have a central
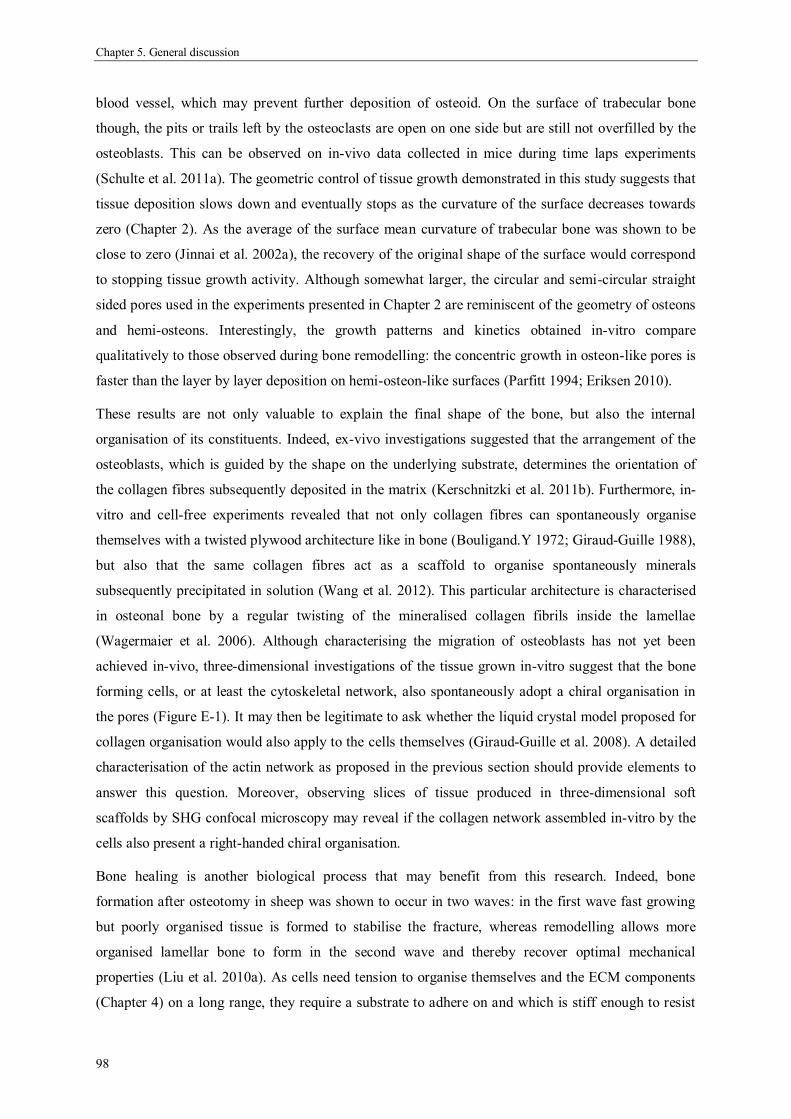
Chapter 5. General discussion
98
blood vessel, which may prevent further deposition of osteoid. On the surface of trabecular bone
though, the pits or trails left by the osteoclasts are open on one side but are still not overfilled by the
osteoblasts. This can be observed on in-vivo data collected in mice during time laps experiments
(Schulte et al. 2011a). The geometric control of tissue growth demonstrated in this study suggests that
tissue deposition slows down and eventually stops as the curvature of the surface decreases towards
zero (Chapter 2). As the average of the surface mean curvature of trabecular bone was shown to be
close to zero (Jinnai et al. 2002a), the recovery of the original shape of the surface would correspond
to stopping tissue growth activity. Although somewhat larger, the circular and semi-circular straight
sided pores used in the experiments presented in Chapter 2 are reminiscent of the geometry of osteons
and hemi-osteons. Interestingly, the growth patterns and kinetics obtained in-vitro compare
qualitatively to those observed during bone remodelling: the concentric growth in osteon-like pores is
faster than the layer by layer deposition on hemi-osteon-like surfaces (Parfitt 1994; Eriksen 2010).
These results are not only valuable to explain the final shape of the bone, but also the internal
organisation of its constituents. Indeed, ex-vivo investigations suggested that the arrangement of the
osteoblasts, which is guided by the shape on the underlying substrate, determines the orientation of
the collagen fibres subsequently deposited in the matrix (Kerschnitzki et al. 2011b). Furthermore, in-
vitro and cell-free experiments revealed that not only collagen fibres can spontaneously organise
themselves with a twisted plywood architecture like in bone (Bouligand.Y 1972; Giraud-Guille 1988),
but also that the same collagen fibres act as a scaffold to organise spontaneously minerals
subsequently precipitated in solution (Wang et al. 2012). This particular architecture is characterised
in osteonal bone by a regular twisting of the mineralised collagen fibrils inside the lamellae
(Wagermaier et al. 2006). Although characterising the migration of osteoblasts has not yet been
achieved in-vivo, three-dimensional investigations of the tissue grown in-vitro suggest that the bone
forming cells, or at least the cytoskeletal network, also spontaneously adopt a chiral organisation in
the pores (Figure E-1). It may then be legitimate to ask whether the liquid crystal model proposed for
collagen organisation would also apply to the cells themselves (Giraud-Guille et al. 2008). A detailed
characterisation of the actin network as proposed in the previous section should provide elements to
answer this question. Moreover, observing slices of tissue produced in three-dimensional soft
scaffolds by SHG confocal microscopy may reveal if the collagen network assembled in-vitro by the
cells also present a right-handed chiral organisation.
Bone healing is another biological process that may benefit from this research. Indeed, bone
formation after osteotomy in sheep was shown to occur in two waves: in the first wave fast growing
but poorly organised tissue is formed to stabilise the fracture, whereas remodelling allows more
organised lamellar bone to form in the second wave and thereby recover optimal mechanical
properties (Liu et al. 2010a). As cells need tension to organise themselves and the ECM components
(Chapter 4) on a long range, they require a substrate to adhere on and which is stiff enough to resist

Chapter 5. General discussion
99
the cytoskeletal contractile forces (Bischofs and Schwarz 2003). This condition justifies the formation
of this primary endogenous scaffold on the cellular level. The stabilisation phase occurring during
bone healing was also observed in other contexts of fast bone growth (Kerschnitzki et al. 2011a;
Krauss et al. 2011).
Tissue engineering
By improving the understanding of biological processes that involve tissue formation, this research
can lead to interesting applications for tissue engineering. For example, it was demonstrated in
Chapter 3 that tissue growth in a pore can be promoted by optimising the geometry of the surface. The
model of curvature-driven growth describing this phenomenon was used to derive design principles
for scaffolds intended for regeneration purposes. Interestingly, this geometrical model contests the
idea of using implant structures similar to trabecular bone, which average surface mean curvature is
zero (Jinnai et al. 2002a). According to the ideas developed in this thesis, such geometries would not
be adapted to a fast integration of the substrate. For example, in-vitro experiments performed on
minimal surfaces (gyroid structures) showed cells adhering but no tissue formation in the pores
(Melchels et al. 2010). More generally, the geometrical principles derived from the present work may
help to select the optimal technique used for scaffold production, the geometry of the surface as well
as the size and the homogeneity of the pores being highly dependent on the fabrication process
(Hutmacher 2001).
In-vivo investigations already suggested that the shape of the scaffold dictates the organisation of the
mineralised tissue deposited by the cells (Cipitria et al. 2012). The structural analyses reported in
Chapter 3 and 4 showed that this control occurs on the cellular level by constraining the long range
organisation of the cytoskeletal network. Another interest to consider geometry in scaffold design
would be to target an optimal internal organisation of the primary tissue. The mechanical properties
being close to the original ones (Fratzl and Weinkamer 2007), this should promote a faster recovery of
tissue functions.
Finally, it is interesting to note that although the new generations of biomaterials for medical devices
are developed based on complex associations of biocompatible materials with biologically active
components (Huebsch and Mooney 2009), this thesis suggests coming back to a rather simple design
parameter: geometry.
100
Conclusions
The present thesis focuses on understanding how the geometry of a substrate controls tissue growth
and tissue organisation. The experimental and computational works accomplished along this doctoral
period led to the following conclusions.
- Physics, and especially mechanics determines cells and tissue patterning. This was
supported by a literature survey of the topic and provided the background motivation of the present
study. (Chapter 1)
- Tissue growth on complex surfaces is described quantitatively by a model of curvature-
driven growth. This was confirmed by coupling in-vitro tissue culture experiments with
computational simulations. (Chapter 2)
- The physical principal of curvature-driven growth is relevant to describe the biological
process of tissue deposition. Indeed, curvature-driven growth was demonstrated to be equivalent to a
simple geometrical construction inspired by the elongated shape of the contractile cells: the chord
model. (Chapter 2)
- The curvature of bone surface potentially regulates bone remodelling. The geometrical
model was shown to describe the different growth patterns and kinetics observed in osteons and hemi-
osteons. (Chapter 2)
- Geometry is a factor promoting tissue formation in-vitro. The faster growth predicted by
the models in non-convex shaped-pores was confirmed experimentally. Design principles were
proposed to optimize the geometry of tissue engineering scaffolds. (Chapter 3)
- Substrate geometry dictates the internal organisation of the tissue. A qualitative co-
alignment of the extracellular matrix with the cytoskeletal network suggests that the chord model can
be extended to the tissue level. Although the images are convincing, quantitative evaluations are still
required. (Chapters 3 and 4)
- Cells actively organise their extracellular matrix. The contractile cells build an actin
network, which acts as an active scaffold for subsequent collagen deposition. Impairing the
mechanical state of the cytoskeletal network led to the loss of tissue organisation and stability. These
effects are also qualitative and still need to be quantified. (Chapter 4)
- The mean curvature of a three-dimensional surface controls tissue growth in three
dimensions. An extension of the computational model to three dimensions predicted growth patterns
that were observed in preliminary three-dimensional analyses of the tissue (Appendix A, Chapter 5).
101
Outlooks
The work reported in this thesis led to interesting conclusions about how geometry controls tissue
growth and organisation and generated additional questions. Potential directions of the future research
could be the following.
- Adapt the in-vitro experimental system to three-dimensional analyses of the tissue.
Although the in-vitro tissue culture in HA scaffold was three-dimensional, most of the analyses were
done on two-dimensional images of the projection of tissue formed in the pores. Optical sectioning
performed by confocal microscopy gave interesting preliminary results about the three-dimensional
structure but limitations in the depth of focus prevent further investigations. An optimal alternative
would be to section the scaffold with a microtome in order to access tissue pattern in the vertical
direction. For this, HA needs to be replaced by a softer material that fulfils many criteria imposed by
scaffold fabrication, in-vitro culture and sample analysis.
- Quantify the evolution of cell and extracellular matrix organisation in three
dimensions. As discussed in the last chapter, confocal analyses of the tissue suggest a possible
extension of the chord model in which cells have a preferential orientation in three dimensions. A
thorough investigation of the chiral organisation of the actin network is necessary to detail the model
and potentially show an arrangement comparable to the collagen fibres, like in bone. The evolution of
the tissue-medium interface in three dimensions could then be compared to the computational model
of curvature-driven growth in three dimensions. (Appendix A)
- Evaluate the mechanical properties of the tissue. Because mechanics was shown to play a
major role in cell and ECM organisation, it is important to evaluate the internal stress state as well as
the effective mechanical properties of the tissue. This can be achieved for example by impairing the
mechanical stability of the tissue and quantifying the resulting deformations of the ECM or of the soft
substrate with live or time lapse imaging.
- Compare different cell and tissue types. Finally, the impact of this research can be
broadened by using other cell types than MC3T3-E1 pre-osteoblasts. As such, growth kinetics and
mechanical properties of different tissue types, including stem cells, can be investigated to verify the
general character or refine the parameters of the geometrical models proposed in this thesis.
According to Francesco Pampaloni, “The third dimension bridges the gap between cell culture and
live tissue” (Pampaloni et al. 2007). Hence, these further efforts to improve the in-vitro tissue culture
system are essential to improve the relevance of the findings for both fundamental research and tissue
engineering.


103
Appendices


105
Appendix A. A three-dimensional model for tissue deposition on
complex surfaces
Cécile M. Bidan*, Frances M. Wang, John W.C. Dunlop*
* Corresponding authors
Department of Biomaterials, Max Planck Institute of Colloids and Interfaces, 14424 Potsdam,
Germany
This paper was submitted in the Special Issue of Computer Methods in Biomechanics and Biomedical Engineering (CMBBE) on "Computational Cellular and Biomolecular Mechanics and
Mechanobiology"
Keywords
Curvature-driven growth – Biological tissue growth – 3D – Image based modelling
Abstract
Biological processes are controlled by the biochemical composition and the physical properties of the
environment. For example, geometrical features have been shown to influence cellular, multicellular
and tissue behaviour. Moreover, the properties of these soft living materials affect their surface
tension and thus, their shape. Two-dimensional models of geometry-driven growth suggest this
interplay as responsible for the excellent control of tissue patterning throughout life. In this study, a
digital 2D model of curvature-driven growth applicable to images from tissue culture experiments is
extended to 3D. Artificial geometries were used to test the relevance and the precision of the
simulations. The implementation of cell migration was also explored to better simulate the in-vitro 3D
system. By using CT data as initial conditions, this model could help in understanding to what degree
surface curvature controls many biological processes such as morphogenesis, growth, bone healing,
bone remodelling and implant integration.
Abbreviations
2D Two-dimensional
3D Three-dimensional
PTA Projected Tissue Area
My contribution
I implemented computational model in 3D and the description of cell migration, analysed the results,
structured the ideas and wrote the manuscript.

Appendix A. A three-dimensional model for tissue deposition on complex surfaces
106
Introduction
The development of tissues and organs is well known to be controlled by chemical gradients, which
direct migration, proliferation and differentiation of the cells (Wartlick et al. 2011; Kuchen et al.
2012), but it is also well recognized that mechanical control plays an important role in this process
(Mammoto and Ingber 2010). The main biological event showing this tight control is morphogenesis.
In healthy embryos, stem cells are systematically arranged in space and differentiated towards
functions required to give rise to the future organisms. Besides being genetically controlled, cells are
recognised to integrate the mechanical stimuli of their environment and adapt their chemical and
mechanical responses accordingly (Thompson and Bonner 1992). For example, the differential
adhesion hypothesis is a powerful physical model that explains cell sorting in the initial stages of
morphogenesis based on the differences in the surface energy of the different types of cells (Steinberg
1962; Foty and Steinberg 2005).
Bone remodelling is another biological process that involves tissue production on substrates with
different geometries. Bone forming cells – the osteoblasts – refill the cylindrical and hemispherical
lacunae left by the bone resorbing cells – the osteoclasts – in cortical and trabecular bone respectively
(Parfitt 1994). Despite the continuous remodelling process throughout life, some geometrical features
of the surface of trabecular bones are conserved, for example the average mean curvature is close to
zero (Jinnai et al. 2002b). Such surfaces are known to minimise surface energy and therefore suggest
physical principals to be involved in the geometric control of cell organisation and tissue production.
Healing processes are also typical examples of the coordination of cells to build an organised tissue
from a random geometry. In wound healing, the combination of proliferation, migration, matrix
synthesis, and the contraction of epithelial cells enables the hole to be closed and the epidermis to be
reconstituted (Martin 1997). During bone healing, cells are closing the gap in several phases of tissue
formation and remodelling in order to recover the original shape as well as the original mechanical
properties of the bone (Liu et al. 2010a). In-vivo bone healing in the presence of a scaffold shows a
control of cells and matrix organisation due to the geometry of the underlying substrate (Cipitria et al.
2012).
Many in-vitro studies have been performed to identify the signals responsible for the geometric
control observed in various biological processes. Mechanotransduction pathways enable cells to
trigger biological responses from physical stimuli (Vogel and Sheetz 2009). For example, the
elasticity of a substrate drives cell differentiation toward specific types that match this stiffness
(Discher et al. 2005; Engler et al. 2006). Similarly, cell proliferation increases with the strain state of
the underlying material (Nelson et al. 2005). In terms of patterning, the spatial distribution of the
adhesion sites defines cell shape (Théry et al. 2006) and determines whether a cell grows or undergoes
apoptosis (Chen et al. 1997). The curvature of the substrate, but not the sign, also determines cell
Appendix A. A three-dimensional model for tissue deposition on complex surfaces
107
orientation (Kemkemer et al. 1999; Biton and Safran 2009). Moreover, cell migration is not only
affected by the stiffness of a substrate (Harland et al. 2011) but also by its geometrical features
(Kaiser et al. 2006). Through contact guidance, cells progress faster on curved surfaces, independent
of the sign of the curvature, and in the direction of minimum curvature (Rolli et al. 2010). On a larger
scale, geometry controls tissue growth rate and patterning in pores of controlled shapes (Rumpler et
al. 2008; Kommareddy et al. 2010; Bidan et al. 2012c). Kollmannsberger et al. provide a review of the
experimental systems used to investigate the physical principles involved in cell and tissue patterning
(Kollmannsberger et al. 2011).
This article also presents simple models capable of explaining the patterns observed in in-vitro and in
in-vivo experiments. From cellular automata to continuum modelling to interfacial motion, different
modelling methods have been used by a variety of groups to estimate the impact of physical cues on
the macroscopic behaviour of living tissues. Mechanics can efficiently explain the long range
synchronisation of the cells as well as the tight control of the physical properties of the biological
material generated (Schwarz et al. 2006).
Cellular automata consider physical laws acting at the cell level. Agent-based models (Drasdo et al.
2007), cellular Potts models (Krieg et al. 2008) and vertex models (Farhadifar et al. 2007) have been
used to describe different biological processes such as tumour growth, embryonic development,
wound healing, cell sorting and morphogenesis.
Since tissues are made of cells and extra cellular matrix proteins that are mechanically connected by
focal adhesion complexes (Schwarz and Bischofs 2005), it has been proposed to treat them as a
continuous material (Ambrosi et al. 2011). Continuum modelling can be used to determine the global
behaviour of a tissue responding to local changes. Because the mechanical equilibrium is locally
disturbed, forces propagate throughout the material to reach a new stable state. This method has been
applied to tissue growth (Frost 1987; Dunlop et al. 2010; Gamsjäger et al. 2012) and evolution of the
callus during fracture healing (Vetter et al. 2012).
The recurrent role of surface tension in biological phenomena gives rise to even simpler models in
which tissues are considered as viscous fluids. Although interfacial modelling can be extended to
more complex systems (Travasso et al. 2011), it aims to reduce complex biological processes to
simple interfacial problems. For example, Rumpler et al. (2008) hypothesised that tissue growth on a
surface is driven by the minimisation of surface tension and proposed a model of curvature-controlled
tissue growth. In order to implement such a model on experimental images, computational techniques
based on previous papers (Bullard et al. 1995; Frette et al. 2009) have been applied to measure
curvature on 2D digital images and to perform the interfacial motion accordingly (Bidan et al. 2012b).
Our goal is to broaden the understanding of the influence of geometry on patterning and kinetics of
tissue deposition in biological organisms. In this paper, we extend the computational implementation
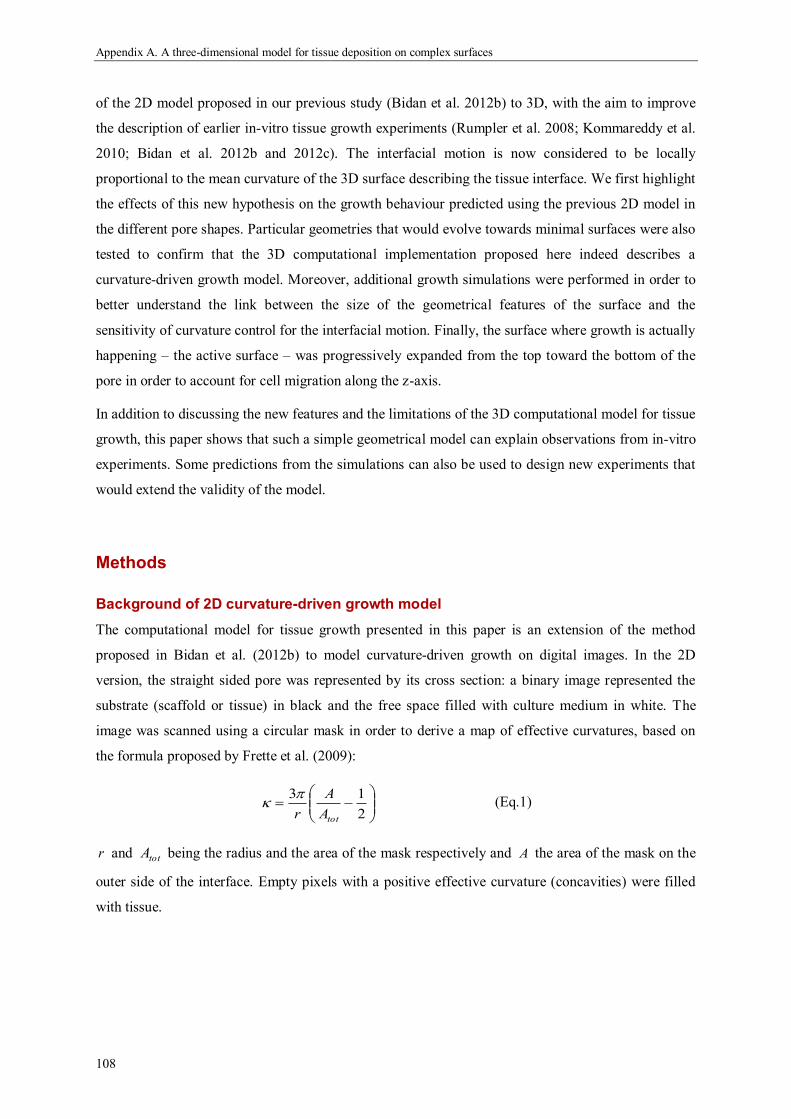
Appendix A. A three-dimensional model for tissue deposition on complex surfaces
108
of the 2D model proposed in our previous study (Bidan et al. 2012b) to 3D, with the aim to improve
the description of earlier in-vitro tissue growth experiments (Rumpler et al. 2008; Kommareddy et al.
2010; Bidan et al. 2012b and 2012c). The interfacial motion is now considered to be locally
proportional to the mean curvature of the 3D surface describing the tissue interface. We first highlight
the effects of this new hypothesis on the growth behaviour predicted using the previous 2D model in
the different pore shapes. Particular geometries that would evolve towards minimal surfaces were also
tested to confirm that the 3D computational implementation proposed here indeed describes a
curvature-driven growth model. Moreover, additional growth simulations were performed in order to
better understand the link between the size of the geometrical features of the surface and the
sensitivity of curvature control for the interfacial motion. Finally, the surface where growth is actually
happening – the active surface – was progressively expanded from the top toward the bottom of the
pore in order to account for cell migration along the z-axis.
In addition to discussing the new features and the limitations of the 3D computational model for tissue
growth, this paper shows that such a simple geometrical model can explain observations from in-vitro
experiments. Some predictions from the simulations can also be used to design new experiments that
would extend the validity of the model.
Methods
Background of 2D curvature-driven growth model
The computational model for tissue growth presented in this paper is an extension of the method
proposed in Bidan et al. (2012b) to model curvature-driven growth on digital images. In the 2D
version, the straight sided pore was represented by its cross section: a binary image represented the
substrate (scaffold or tissue) in black and the free space filled with culture medium in white. The
image was scanned using a circular mask in order to derive a map of effective curvatures, based on
the formula proposed by Frette et al. (2009):
2
13
totA
A
r
(Eq.1)
r and totA being the radius and the area of the mask respectively and A the area of the mask on the
outer side of the interface. Empty pixels with a positive effective curvature (concavities) were filled
with tissue.
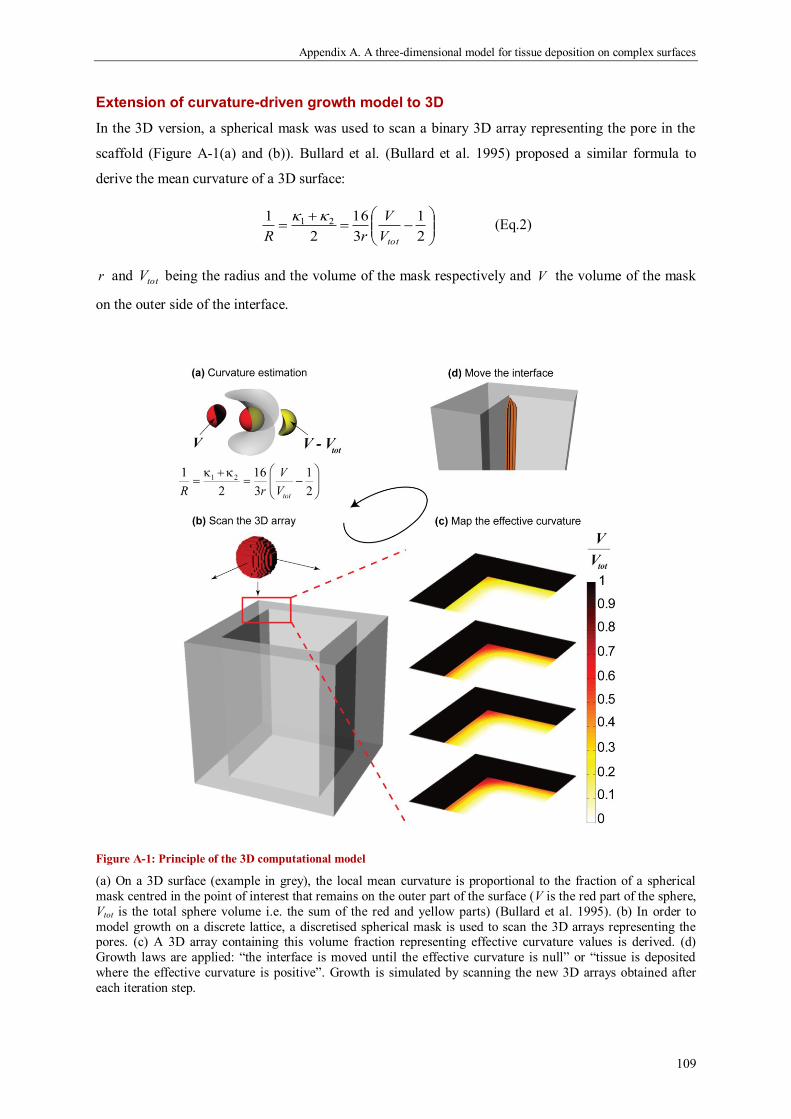
Appendix A. A three-dimensional model for tissue deposition on complex surfaces
109
Extension of curvature-driven growth model to 3D
In the 3D version, a spherical mask was used to scan a binary 3D array representing the pore in the
scaffold (Figure A-1(a) and (b)). Bullard et al. (Bullard et al. 1995) proposed a similar formula to
derive the mean curvature of a 3D surface:
2
1
3
16
2
1 21
totV
V
rR
(Eq.2)
r and totV being the radius and the volume of the mask respectively and V the volume of the mask
on the outer side of the interface.
Figure A-1: Principle of the 3D computational model
(a) On a 3D surface (example in grey), the local mean curvature is proportional to the fraction of a spherical
mask centred in the point of interest that remains on the outer part of the surface (V is the red part of the sphere,
Vtot is the total sphere volume i.e. the sum of the red and yellow parts) (Bullard et al. 1995). (b) In order to
model growth on a discrete lattice, a discretised spherical mask is used to scan the 3D arrays representing the pores. (c) A 3D array containing this volume fraction representing effective curvature values is derived. (d)
Growth laws are applied: “the interface is moved until the effective curvature is null” or “tissue is deposited
where the effective curvature is positive”. Growth is simulated by scanning the new 3D arrays obtained after
each iteration step.
Appendix A. A three-dimensional model for tissue deposition on complex surfaces
110
Due to the similarity in the equations for estimating curvature in 2D and 3D, the computational
implementation demonstrated to model curvature-driven growth in 2D could be readily adapted to 3D
(Figure A-1). The main hypothesis in the implementation was that the mean curvature (the average of
the two principle curvatures) controls interfacial motion in the 3D, much akin to the way the Laplace
law describes membrane pressure as a function of its curvature (Plateau 1894). Empty voxels with a
positive effective mean curvature (concavities) were filled with tissue (Figure A-1(c) and (d)). As
demonstrated on spherical surfaces (see supplementary materials), the local interfacial motion
obtained was proportional to curvature. The projected tissue area (PTA), which was measured
experimentally in previous studies, was taken to be the number of pixels filled with tissue in the
projection plane (Figure A-1(d)).
In both 2D and 3D, the size of the mask was scaled to the size of a cell and the dimensions of the
initial geometries were based on the experimental systems (Rumpler et al. 2008; Bidan et al. 2012b
and 2012c). In this work, 205 pxl represented 1 mm, as given by the typical resolution of the pictures
taken by phase contrast microscopy. The diameter of the mask was set to 17 pxl, which account for
the interaction range of cells being about 50 µm long such as osteoblasts spread on a surface.
Additional studies with various mask sizes were done to test how the sensitivity of curvature sensing
influences growth rate and the patterning predicted by the model. Masks with 11, 15, 17 and 27 pxl in
diameter were used, which correspond to elongated cells of about 30, 40, 50 and 75 µm in length
respectively.
Implementation of a changing scanning volume
In the in-vitro experimental system we aimed to describe, cells were seeded on the top of the scaffold.
Due to migration, the active surface – i.e. the surface where cells were present and could build tissue –
progressively increased as the cells crawled towards to bottom of the pores. In this 3D model for
tissue growth, a time dependent scanning volume was implemented to investigate the impact of cell
migration and the resulting inhomogeneity in cell and tissue distribution along the vertical direction.
The growth law was initially applied in a limited volume at the top of the pore. This volume was then
enlarged towards the bottom of the pore with increments of 0.5, 1 or 2 vxl/step of simulation (Figure
A-2). An infinite migration speed corresponds to the assumption that cells cover the whole scaffold
from the beginning of the growth process.
As cell migration breaks the symmetry of the initial conditions, tissue area was measured on each
plane of the scaffold and the maximum value was taken to be the PTA. Note that changing the height
of the pore is not sufficient to account for the right boundary conditions in the pore: the convex
corners at the bottom front of the scanning volume would not have the same effect as the flat vertical
surfaces in the real pore.
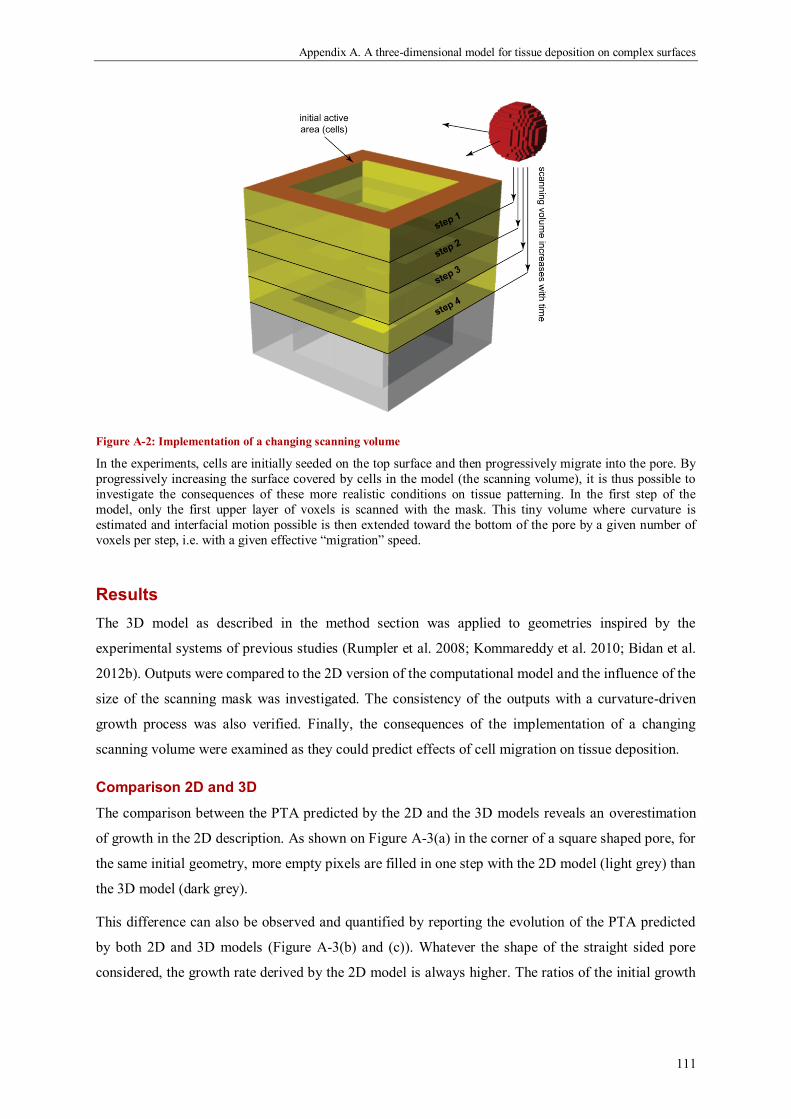
Appendix A. A three-dimensional model for tissue deposition on complex surfaces
111
Figure A-2: Implementation of a changing scanning volume
In the experiments, cells are initially seeded on the top surface and then progressively migrate into the pore. By
progressively increasing the surface covered by cells in the model (the scanning volume), it is thus possible to
investigate the consequences of these more realistic conditions on tissue patterning. In the first step of the
model, only the first upper layer of voxels is scanned with the mask. This tiny volume where curvature is
estimated and interfacial motion possible is then extended toward the bottom of the pore by a given number of
voxels per step, i.e. with a given effective “migration” speed.
Results
The 3D model as described in the method section was applied to geometries inspired by the
experimental systems of previous studies (Rumpler et al. 2008; Kommareddy et al. 2010; Bidan et al.
2012b). Outputs were compared to the 2D version of the computational model and the influence of the
size of the scanning mask was investigated. The consistency of the outputs with a curvature-driven
growth process was also verified. Finally, the consequences of the implementation of a changing
scanning volume were examined as they could predict effects of cell migration on tissue deposition.
Comparison 2D and 3D
The comparison between the PTA predicted by the 2D and the 3D models reveals an overestimation
of growth in the 2D description. As shown on Figure A-3(a) in the corner of a square shaped pore, for
the same initial geometry, more empty pixels are filled in one step with the 2D model (light grey) than
the 3D model (dark grey).
This difference can also be observed and quantified by reporting the evolution of the PTA predicted
by both 2D and 3D models (Figure A-3(b) and (c)). Whatever the shape of the straight sided pore
considered, the growth rate derived by the 2D model is always higher. The ratios of the initial growth
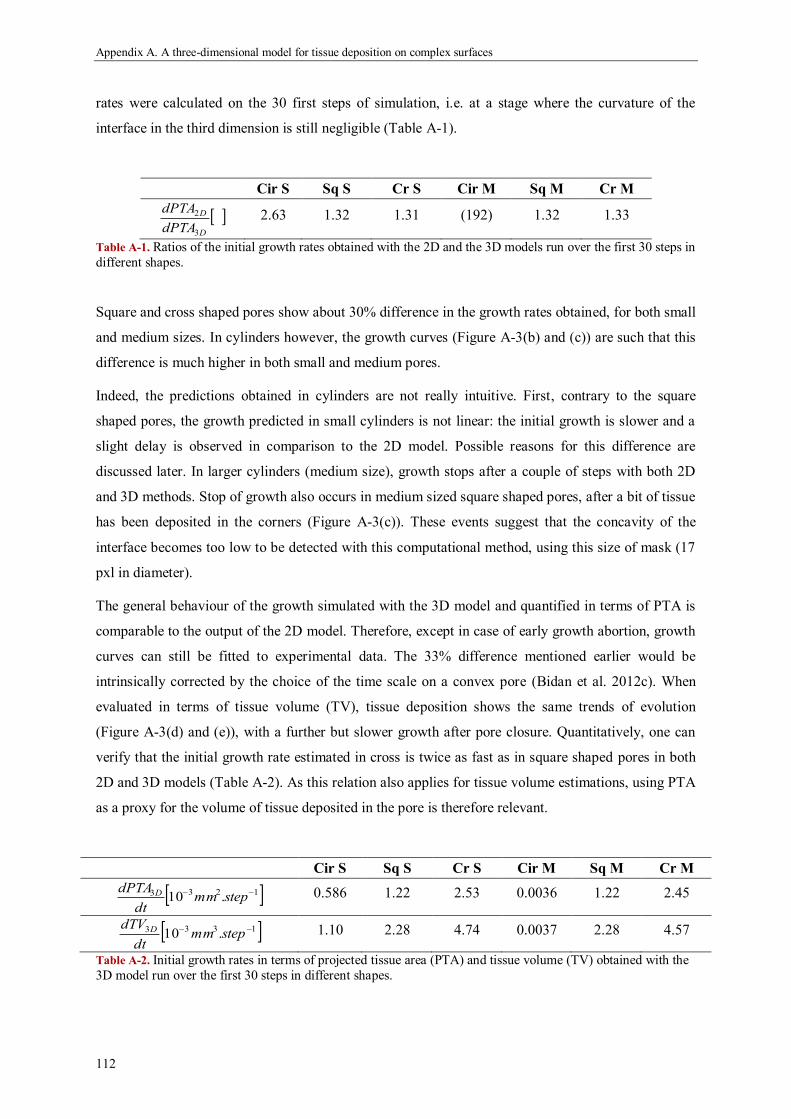
Appendix A. A three-dimensional model for tissue deposition on complex surfaces
112
rates were calculated on the 30 first steps of simulation, i.e. at a stage where the curvature of the
interface in the third dimension is still negligible (Table A-1).
Cir S Sq S Cr S Cir M Sq M Cr M
D
D
dPTA
dPTA
3
2 2.63 1.32 1.31 (192) 1.32 1.33
Table A-1. Ratios of the initial growth rates obtained with the 2D and the 3D models run over the first 30 steps in
different shapes.
Square and cross shaped pores show about 30% difference in the growth rates obtained, for both small
and medium sizes. In cylinders however, the growth curves (Figure A-3(b) and (c)) are such that this
difference is much higher in both small and medium pores.
Indeed, the predictions obtained in cylinders are not really intuitive. First, contrary to the square
shaped pores, the growth predicted in small cylinders is not linear: the initial growth is slower and a
slight delay is observed in comparison to the 2D model. Possible reasons for this difference are
discussed later. In larger cylinders (medium size), growth stops after a couple of steps with both 2D
and 3D methods. Stop of growth also occurs in medium sized square shaped pores, after a bit of tissue
has been deposited in the corners (Figure A-3(c)). These events suggest that the concavity of the
interface becomes too low to be detected with this computational method, using this size of mask (17
pxl in diameter).
The general behaviour of the growth simulated with the 3D model and quantified in terms of PTA is
comparable to the output of the 2D model. Therefore, except in case of early growth abortion, growth
curves can still be fitted to experimental data. The 33% difference mentioned earlier would be
intrinsically corrected by the choice of the time scale on a convex pore (Bidan et al. 2012c). When
evaluated in terms of tissue volume (TV), tissue deposition shows the same trends of evolution
(Figure A-3(d) and (e)), with a further but slower growth after pore closure. Quantitatively, one can
verify that the initial growth rate estimated in cross is twice as fast as in square shaped pores in both
2D and 3D models (Table A-2). As this relation also applies for tissue volume estimations, using PTA
as a proxy for the volume of tissue deposited in the pore is therefore relevant.
Cir S Sq S Cr S Cir M Sq M Cr M
1233 .10 stepmmdt
dPTA D 0.586 1.22 2.53 0.0036 1.22 2.45
1333 .10 stepmmdt
dTV D 1.10 2.28 4.74 0.0037 2.28 4.57
Table A-2. Initial growth rates in terms of projected tissue area (PTA) and tissue volume (TV) obtained with the
3D model run over the first 30 steps in different shapes.

Appendix A. A three-dimensional model for tissue deposition on complex surfaces
113
Figure A-3: Comparison of the PTA evolution predicted by the 2D and the 3D models
(a) For the same initial conditions (corner of a square shaped pore), a difference in the local interfacial motion can be observed. The effects on the evolution of the PTA were investigated in small (b) and medium (c) pores.
With the 3D model, the evolution of tissue volume is predicted in small (d) and medium (e) pores.
Influence of the size of the mask
As the radical differences in behaviour predicted between cylindrical and square shaped pores of
small size and medium size can not be explained by the laws of curvature-driven growth, they are
probably consequences of the approximations induced by the digital character of the models. It is
therefore essential to understand the influence of the size of the digital masks used to scan the
pixelated surfaces and derive curvature.
Figure A-4 shows growth curves predicted by the 2D model performed with two mask sizes (11 pxl
and 27 pxl in diameter), both different from the one used up to now in the context of tissue growth
studies (17 pxl in diameter) (Bidan et al. 2012b and 2012c). Larger mask diameter yield higher
growth rates. It is also interesting to note that the linear behaviour of tissue growth expected in
cylindrical pores can be properly simulated with a 27 pxl mask, but not with smaller ones. In small
square and small and medium cross shaped pores, growth curves show an early arrest of interfacial
motion, before pore closure (insets Figure A-4). As this phenomena only happens with small masks
(Figure A-4) and/or a large pores (Figure A-3(c)), the factor of size between the geometrical features
of the surface and the mask seems to be the determining quantity. If the radius of curvature is too
large compared to the mask, the surface is considered flat and no evolution is performed. Moreover,
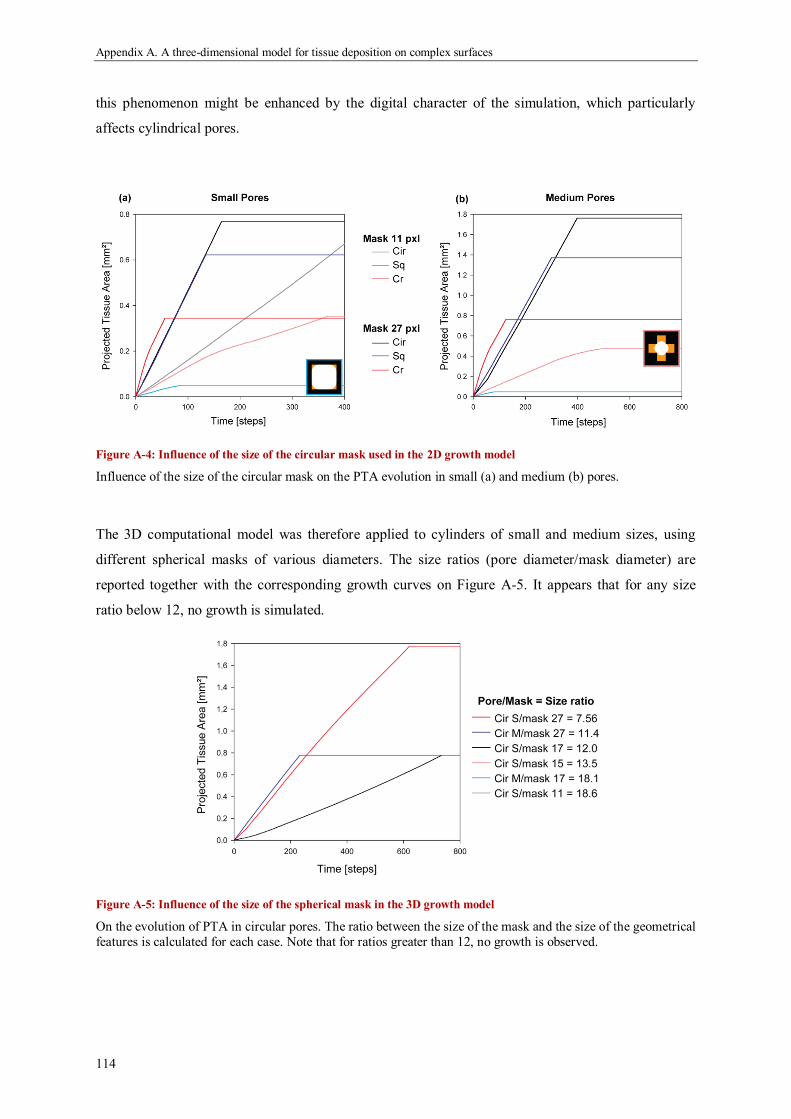
Appendix A. A three-dimensional model for tissue deposition on complex surfaces
114
this phenomenon might be enhanced by the digital character of the simulation, which particularly
affects cylindrical pores.
Figure A-4: Influence of the size of the circular mask used in the 2D growth model
Influence of the size of the circular mask on the PTA evolution in small (a) and medium (b) pores.
The 3D computational model was therefore applied to cylinders of small and medium sizes, using
different spherical masks of various diameters. The size ratios (pore diameter/mask diameter) are
reported together with the corresponding growth curves on Figure A-5. It appears that for any size
ratio below 12, no growth is simulated.
Figure A-5: Influence of the size of the spherical mask in the 3D growth model
On the evolution of PTA in circular pores. The ratio between the size of the mask and the size of the geometrical
features is calculated for each case. Note that for ratios greater than 12, no growth is observed.
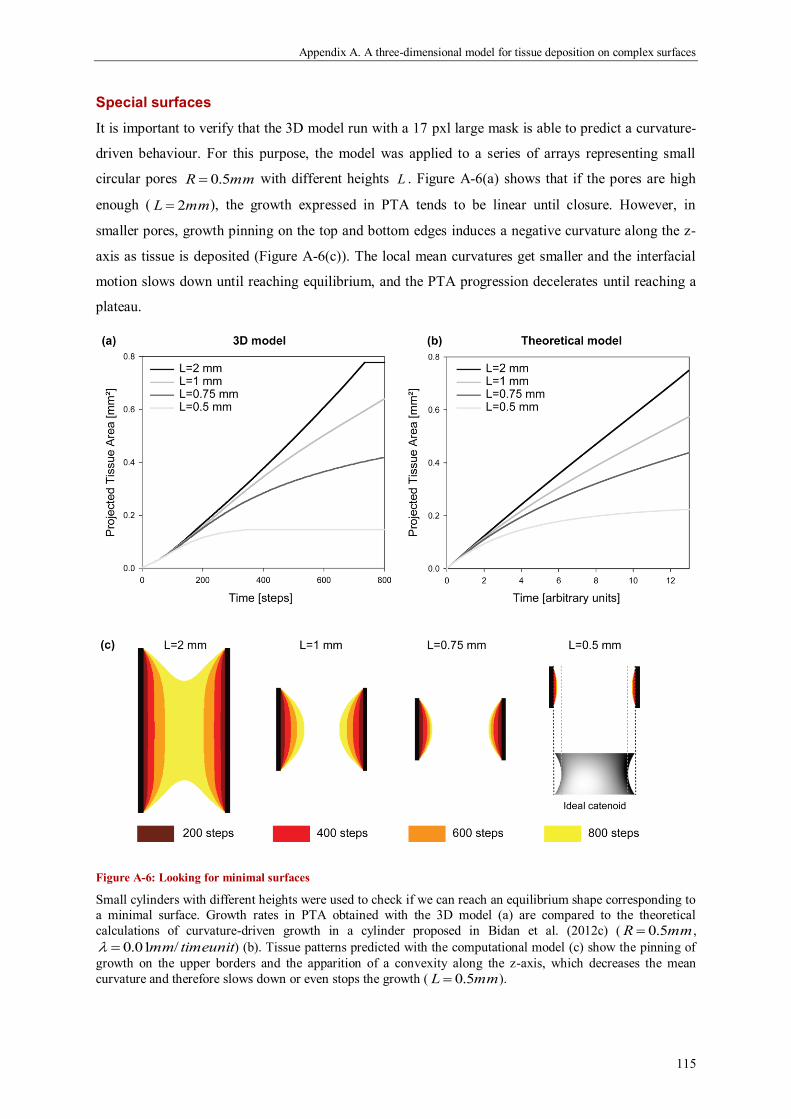
Appendix A. A three-dimensional model for tissue deposition on complex surfaces
115
Special surfaces
It is important to verify that the 3D model run with a 17 pxl large mask is able to predict a curvature-
driven behaviour. For this purpose, the model was applied to a series of arrays representing small
circular pores mmR 5.0 with different heights L . Figure A-6(a) shows that if the pores are high
enough ( mmL 2 ), the growth expressed in PTA tends to be linear until closure. However, in
smaller pores, growth pinning on the top and bottom edges induces a negative curvature along the z-
axis as tissue is deposited (Figure A-6(c)). The local mean curvatures get smaller and the interfacial
motion slows down until reaching equilibrium, and the PTA progression decelerates until reaching a
plateau.
Figure A-6: Looking for minimal surfaces
Small cylinders with different heights were used to check if we can reach an equilibrium shape corresponding to
a minimal surface. Growth rates in PTA obtained with the 3D model (a) are compared to the theoretical
calculations of curvature-driven growth in a cylinder proposed in Bidan et al. (2012c) ( mmR 5.0 ,
timeunitmm/01.0 ) (b). Tissue patterns predicted with the computational model (c) show the pinning of
growth on the upper borders and the apparition of a convexity along the z-axis, which decreases the mean
curvature and therefore slows down or even stops the growth ( mmL 5.0 ).

Appendix A. A three-dimensional model for tissue deposition on complex surfaces
116
In Bidan et al. (2012c), a simple theoretical approach of 3D curvature-driven growth was proposed
and gave rise to the following law:
4
21.2.2
22
0
02
LRR
RRRRR
dt
dR
dt
dPTApore (Eq.3)
A numerical derivation of )(tPTA has been performed in the same cylinders and results are reported
on Figure A-6(b). Deceleration - and eventually the end - of growth occurs in pores of small aspect
ratio. According to the theory of curvature-driven growth, in case of non-closure of a cylindrical pore,
the final shape is a catenoid. Due the digital character of the model however, growth may be stopped
as soon as the surface becomes “flat enough”, or curvatures no longer become measurable with the
mask used. For example, in the smallest pore ( mmL 5.0 ), the two principal curvatures of the final
surface are not equal with opposite signs Figure A-6(c).
Implementation of a changing scanning volume
Figure A-7 shows growth behaviour predicted by the 3D computational model of curvature-driven
growth, in which a changing scanning volume of the 3D surface has been implemented. The extension
of this volume represents cell motility toward the bottom of the pore where the speed of migration is
varied between 0.5 and 2 voxels per step (vxl/step). An infinite speed corresponds to the static case
when cells are assumed to cover the whole surface from the beginning of the growth (no changing
scanning volume).
In order to understand the changes of growth behaviour observed during the evolution of the PTA
(Figure A-7(a)) and tissue volume (Figure A-7(b)), snapshots of the 3D surfaces were taken at
different time steps (100, 200, 300, 400, 600 and 800) and combined to yield the representations of
growth pattern along the vertical axis in a circular pore (Figure A-7(c)) and in a cross shaped pore
(Figure A-7(d)), both along the vertical axis (i) and in projection (ii).
The implementation of this dynamic feature has a strong influence on the kinetics of interfacial
motion. A lower speed of progression of the scanning mask decreases the initial growth rate, both in
terms of PTA (Figure A-7(a)) and tissue volume (Figure A-7(b)). However, once the scanning volume
covers the entire surface of the pore, the volume of tissue deposited per step of the simulation is
comparable to the static case (Figure A-7(b)). The experimental pores modelled in this study are 2mm
i.e. 410 pxl high. In circular and square shaped pores, one can observe a linear behaviour similar to
that of the static case from steps 205 and 410 for progression speed of 2 and 1 vxl/step respectively.
With a progression speed of 0.5 vxl/step however, 820 steps are needed to reach the scanning of the
whole surface and the linear part does not appear in our time frame of simulation. Once the pores are
closed (Figure A-7(c)), i.e. the PTA is maximal; the increase of tissue volume becomes much slower.

Appendix A. A three-dimensional model for tissue deposition on complex surfaces
117
Figure A-7: Accounting for cell migration
Growth was simulated in circular, square and cross shaped pores, by using the 3D model supplemented by the
implementation of a changing scanning volume. The growth was quantified in terms of PTA (a) and tissue
volume (b). The evolution of the interface along the vertical axis of circular pores reveals a break of symmetry
in the patterning (c). In cross shaped pores, symmetry breaking is enhanced and pore closure (d(i)) can happen
in the section plane before the scanning volume covers the entire vertical surface (d(ii)). Colour bar indicates the
simulation time in steps.

Appendix A. A three-dimensional model for tissue deposition on complex surfaces
118
In the cross shaped pores, the initial growth rate in terms of PTA decreases with the progression speed
of the scanning volume, which yields to the loss of linearity without radically changing the behaviour
of the growth curve (Figure A-7(a)). This contrasts with the evolution of the volume of tissue in a
cross shaped pore (Figure A-7(b)), which takes on a sigmoid shape under dynamic scanning. Thus,
the time point when the projection of the interface becomes a circle is just visible in the static case.
When performed with a slow progression speed of the scanning volume (0.5 vxl/step), the simulation
predicts a linear growth after the two-dimensional closure of the pore (Figure A-7(d)).
According to the patterns of growth obtained (Figure A-7(c) and (d)), the model predicts that
migration would be responsible for the asymmetry of the pattern along the vertical direction of the
pore. The interfacial motion in the radial direction starts earlier on the top of the pore (where the
initial scanning volume is acting) and then spread toward the bottom as a wave. In that particular case,
tissue thickness is no longer homogeneous along the vertical axis of the pore and the PTA is no longer
proportional to the volume of tissue deposited (Figure A-7(c) and (d))
Discussion
In this paper, we propose an extension of the computational model of curvature-driven growth
presented in a previous study (Bidan et al. 2012b) to 3D. The predictions derived with this discrete 3D
model were first compared to the 2D version on simple geometries. Keeping in mind that this tool was
designed to predict and describe tissue culture experiments (Rumpler et al. 2008; Kommareddy et al.
2010; Bidan et al. 2012b), additional simulations were performed in order to understand the
importance of scaling (size of the mask and of the geometrical features), and eventually to relate it to
the in-vitro system (cell and pore sizes). Working in 3D also enabled us to implement a progressive
scanning region to account for cell migration into the pore. In this section, the relevance, the validity
and the potential applications of such a tool are discussed.
Energy minimum surfaces
The role of surface tension is omnipresent in biology and at different length scales (Thompson and
Bonner 1992; Kollmannsberger et al. 2011). Soft biological tissues are even occasionally considered
as viscous fluids responding to the same physical laws (Ranft et al. 2010). Surface tension (N/m), or
surface energy density (J/m²), reflects the tendency of the surface of a material (liquid) to contract
through the cohesion of the molecules present close to the interface. Alternatively, it represents the
energetic cost of a surface. In a homogeneous and isotropic material in a given medium, the surface
tension is constant and the total interfacial energy depends on the amount of interface and therefore,
on the curvature. Any homogeneous material tends to adopt a shape that minimizes the energy of its
interface with the surrounding matter. Interfacial motion is therefore favoured in the direction which
decreases surface area, and thus energy, which is the same as the direction that decreases local
Appendix A. A three-dimensional model for tissue deposition on complex surfaces
119
curvature. As such, in systems with a large surface energy, interfacial motion is often described by
curvature-driven growth models. Such models have been successfully applied in 2D to biological
processes in order to highlight the role of geometry in tissue growth and patterning (Bischofs et al.
2008; Rumpler et al. 2008; Bidan et al. 2012b). Considering the 2D sets of data available (projection
of prismatic pores), there was no ambiguity on the choice of the curvature: it was defined as the
inverse of the radius of a circle locally fitted to the moving interface (Worring and Smeulders 1993).
However, 3D interfaces, as those moving in 3D tissue growth, have two principle curvatures: the
maximal and the minimal curvatures 1 and 2 , which are orthogonally directed. In principle, the
maximal curvature, the minimal curvature, the Gaussian curvature 21 or the mean
curvature 2
21 could all be used in an implementation of a curvature-driven growth model.
However, the Laplace equation for membranes states that surface tension induces a pressure
discontinuity, which is proportional to the mean curvature of the interface between the two media:
221p (Eq.4)
If one considers this pressure difference as a description of one of the driving forces for interfacial
motion, the local growth rate can be assumed to be proportional to the local mean curvature .
Each system governed by such a law evolves toward a minimal surface (with zero mean curvature) to
minimise the interfacial energy. In that respect, it is interesting to remind the reader that trabecular
bone has been shown to be a complex structure, whose interface presents close to zero mean surface
curvature everywhere (Jinnai et al. 2002b). Such observations suggest that a 3D curvature-driven
growth model could provide a more realistic description of the formation of biological materials. It
would not only help in understanding biological processes further, but also provide new realistic tools
and principles to use in the context of tissue engineering.
30% difference between 2D and 3D
Similar to the 2D implementation of the discrete curvature-driven growth model, the motion of the
interface in the 3D version is based on the calculation of effective curvatures, estimated from discrete
(pixelated) images. It was demonstrated in a previous paper (Bidan et al. 2012b), supplementary
materials) that the interfacial motion in the 2D computational model is proportional to the local
curvature:
6
2
2
rDComp (Eq.5)
r being the radius of the scanning disk, and the local curvature.
Likewise, one can also demonstrate that the interfacial motion predicted by the discrete method
extended to 3D is:
Appendix A. A three-dimensional model for tissue deposition on complex surfaces
120
244
2122
3
rrDComp (Eq.6)
r being the radius of the scanning sphere, 1 and 2 the local principal curvatures and the mean
curvature. The details of the demonstration are available in the supplementary materials. Note that the
use of a spherical mask enables the derivation of the mean curvature (Bullard et al. 1995) and gives
rise to a growth law comparable to the Laplace equation (4).
As the geometries used in the simulations represent pores, which are normalized with respect to their
perimeter, the ratio of growth rates in PTA in a given shape is obtained with the ratio of interfacial
motions derived with the two methods:
6
4
3
2
DComp
DComp (Eq.7)
At the beginning of the growth, when 1 and 02 ,
2
, one can predict the difference
observed between the two models:
33.13
4
3
2
3
2 DComp
DComp
D
D
dPTA
dPTA
(Eq.8)
As this 33% difference could be measured from the initial growth rates predicted in prismatic pores
with the computational models (Table A-1), this discrete method can be considered relevant to
describe curvature-driven growth in terms of PTA on 3D digital surfaces. Moreover, the results are
comparable to the predictions obtained with the 2D model, as long as the curvature in the third
direction is low enough to play a minimal role, i.e. at the original stage of growth (Figure A-3).
Therefore, except in the case of early growth arrest in the simulation, which is due to our limitation in
resolving curvature (see below and Figure A-3(c)), the predictions in PTA established with the 3D
model can also be fitted to experimental data. The 33% difference mentioned above would be
intrinsically corrected by the choice of the time scale on a convex pore (Bidan et al. 2012b and
2012c).
Minimal surfaces
The two models of curvature-driven growth show comparable results when quantified in PTA, but it
is necessary to verify whether or not the 3D version generates the expected patterns along the vertical
direction. Indeed, the evolution toward minimal surfaces should induce the appearance of a convexity
along the vertical axis of the prismatic geometries. Although only the horizontal principal curvature
was available in the 2D computational model, the second principal curvature could be estimated. This
was done using an arc of a circle joining the upper surface, the interface in the middle plane (read on
the projected image) and the lower surface. The analytical relation (3) couples the deceleration of
Appendix A. A three-dimensional model for tissue deposition on complex surfaces
121
interfacial motion in the middle plane of the pore with the decrease of the mean curvature (Bidan et al.
2012c).
In the 3D computational model however, no deceleration was observed on the growth curves derived
from the simulations performed in 2mm high pores (Figure A-3). As the appearance of the negative
curvature highly depends on the boundary conditions of the surface, the simulation was run on a series
of cylinders with different aspect ratios (Figure A-6) and revealed that plateaus of growth appear for
smaller pores (Figure A-6(a)), similar to the predictions of the analytical model (Figure A-6(b)).
The interfacial motion in the cylinders leads to complete filling of the channels, except in the smallest
pore ( mmR 5.0 , mmL 5.0 ), where the interface ceases to move after a certain time. In this case,
the boundary conditions imposed enable the interface to reach a configuration of minimal energy
without evolving toward the complete flattening of the upper and lower faces of the pore. This surface
would have a zero mean curvature at every point on the interface and be called a catenoid. Although
such geometry would be predicted from theoretical grounds, the pattern simulated with the discrete
3D computational model only approximates a catenoid in shape (Figure A-6(c)). It is likely that this
arises due to the discrete nature of surface curvature estimation, as discussed in the following section.
Compromise between sensitivity and resolution
To quantify the role of geometry on tissue growth, it is necessary to tightly couple simulations and
experiments. The curvature-driven growth model established in our works was therefore implemented
directly on experimental images. As pointed out by Worring and Smeulders, although several
techniques are available to measure curvature, all imply considerable approximations when it comes
to use them on discrete (pixelated) geometries (Worring and Smeulders 1993). Although the methods
of Frette et al. (2009) and Bullard et al. (1995) used in the present work are well adapted to measure
curvature on 2D images and mean curvature in 3D arrays respectively, difficulties remain. Low
curved surfaces (large circle) are locally drawn as flat and curvature estimation would need a large
scanning mask (Figure A-8(a)), whereas the measurement of high curvatures (roughness) is more
precise with a smaller scanning mask (Figure A-8(b)).
It is clear that both the resolution of the image and the size of the mask used to estimate the curvature
of the interface influence the predictions of this computational model of curvature-driven growth. For
a given resolution ( pxlmm 2051 in this study), a compromise has to be made when choosing the
size of the scanning mask. A large mask detects much lower curvatures but the local curvatures are
estimated on larger portions of the interface, increasing thereby the approximation. On the contrary, a
smaller mask enables to resolve more accurately the curvature profile of the interface, but is also more
sensible to the artefacts induced by digitalisation (Figure A-8(d)).

Appendix A. A three-dimensional model for tissue deposition on complex surfaces
122
Figure A-8: A compromise between sensitivity and resolution
(a) A small circular pore drawn on a digital image ( pxlR 102 ) shows flat parts of its interface. (b) On digital
images, the curvature can only be detected and the interface moved, if the mask is large enough. (c) In regions
of high curvature (roughness), a smaller mask will be more accurate to resolve the curvature profile. If growth is
simulated with a large mask, curvature is estimated on a larger interaction range, the roughness of the initial
interface is quickly filled with tissue during the first steps and the surface becomes smooth. The difference
between digital and smooth circle and thus the approximations on curvature measurements, increase as the
diameter of the mask gets smaller.
The size of the mask
Although the size of the scanning mask was kept constant and equal to 17 pxl in the core of the study,
some additional simulations where performed with different sizes of scanning masks in order to
understand the consequences of these effects on the prediction of growth.
As expected from the 2D growth law 6
2
2
rDComp , Figure A-4 shows that besides influencing the
precision of curvature measurements, the size of the mask also affects the prediction of the growth
rate: more tissue is deposited per step of simulation when using a larger scanning mask.
As mentioned above, smaller masks lead to an early arrest of simulated growth when the curvature of
the interface is or becomes too low to be measured as positive and triggers interfacial motion on the
digital image.
Since the 3D growth law is also dependant on the radius of the spherical scanning mask,
4
2
3
rDComp , the same artefacts are expected with the 3D version of the discrete computational
Appendix A. A three-dimensional model for tissue deposition on complex surfaces
123
model of curvature-driven growth. In Figure A-5, different combinations of circular pore size and
spherical mask size have been tested. No growth could be simulated if the radius of the pore was more
than 12 time bigger than the radius of the mask. This ratio seems sufficient to satisfy the hypothesis
rR necessary to get curvature-driven growth behaviour. In previous 2D simulations (Bidan et al.
2012b and 2012c), the radius of the circular scanning mask was set to pxllr 5.82
3 , with l
representing the length of an elongated osteoblast and scaled using the resolution of the experimental
image ( pxlmm 2051 , ml 47 ). Indeed, in the tissue growth process we want to describe, cells are
the sensing and decision units. The resolution of local curvature estimation should not go below the
size of a single cell; all smaller geometrical features would be smoothed. On the other hand, the
interaction range they have to estimate local curvature, and deposit tissue in consequence, does not
exceed their length: a single cell can’t deposit tissue in regions it doesn’t cover. A better
understanding of the phenomena may be provided by the chord model described in Bidan et al.
(2012b).
These predictions suggest that the same experiment performed with contractile cells of different
average sizes would lead to different tissue growth rates. The arrest or absence of tissue growth
(Figure A-3) considered as artefacts arising from the digital character of the model could in fact
characterise some threshold of minimum curvature that cells, as discrete units, would need to deposit
tissue. One can expect that small cells won’t sense small curvatures (high radius of curvature) as they
adhere and contract. The concept of critical gap size in bone healing could be an example of such a
phenomenon but also the plateau of growth observed in large and medium squares in 3D tissue
experiments once the corners are filled (Bidan et al. 2012c)
Better approximations of the experiments with a changing scanning volume
In order to be more realistic when describing in-vitro experiments of tissue growth, one has to
consider that the cells are initially seeded on the top of the scaffold. The region where cells are present
and tissue can be deposited spreads progressively toward the bottom of the pores, and the speed of
progression depends on cell motility. In the 3D computational model, we could account for this
phenomenon by gradually increasing the volume scanned by the spherical mask in the pore (Figure A-
2). For a given geometry, although the deceleration of growth induced by the progressive scanning
volume is more visible in terms of tissue volume (Figure A-7(b)), it is still considerable on the PTA
measurements (Figure A-7(a)). This supports the idea that some of the time lags experimentally
observed before the actual start of tissue growth can be associated to the time needed for cells to cover
the whole surface of the pores and thus, to their migration speed in a particular system. This result is
in agreement with the conclusion drawn by Kommareddy et al. (2010) as they observed a dependence
of this time delay on the concentration of cell seeding and on the nature of the substrate, which turns
out to influence cell motility (Pelham and Wang 1997).

Appendix A. A three-dimensional model for tissue deposition on complex surfaces
124
The implementation of the progressive migration of cells from their seeding region not only affects
the kinetics of growth, but also leads to asymmetric patterns in the axial direction. Although no
difference could be noticed in the evolution of the interfacial geometry on the projection of the
volume (Figure A-7(d(i))), vertical sections of the pores reveal that position of pore closure is shifted
upwards toward the seeding region as migration speed is decreased, even as growth keeps on going
underneath this plane (Figure A-7(d(ii))).
Tissue Volume vs Projected Tissue Area
When no cell migration is considered, the same trends of growth behaviour as a function of pore
geometry are predicted when measured in tissue volume (TV) (Figure A-3(d) and (e)) and in projected
tissue area. The relative speeds of initial growth rates are also conserved (Table A-2). For example,
the evolution of tissue volume in cross shaped pores is twice as fast as in square shaped pores. These
predictions derived with a 3D model, which better represents the geometries of the experimental
systems described, support the use of PTA as a proxy for the volume of tissue deposited in the pore.
When cell motility is taken into account however, the PTA measured on the experimental images is
not directly proportional to the volume of tissue produced in the pore (Figure A-7). Nevertheless, the
main conclusions drawn from the analysis of the PTA curves are still valid in terms of tissue volume:
for a given migration speed and until closure, initial tissue growth is always faster in a cross shaped
pore than in square shaped pores.
The final phase of growth observed on the tissue volume curves characterises the filling of the
remaining space in the pores after they were closed in the centre (Figure A-7(c) and (d)). As soon as
the pore is closed, the growth rate slows down quickly as the amount of concave surfaces available for
cells to deposit tissue is decreasing.
Conclusions
The 3D discrete computational model of curvature-driven growth developed in this work predicts
similar patterns and kinetics of tissue deposition, as the ones observed during in-vitro cell culture
experiments performed in simple 3D pores. This tool could also estimate growth behaviour on a
variety of more complex geometries, and its combination with micro-computer tomography
techniques would be of high interest for diverse purposes. For example, this technique could be
helpful to assess the role of geometry in the differences of bone growth rates observed in different
species. The complex shape of the osteons in antlers could be responsible for the growing property of
this fast-growing bone (Krauss et al. 2011). A comparison of this model to in-vivo studies on tissue
integration in scaffolds (Lan Levengood et al. 2010; Cipitria et al. 2012) and on bone remodelling
(Schulte et al. 2011a) would support the relevance of this tool to design implants for clinical
applications.

Appendix A. A three-dimensional model for tissue deposition on complex surfaces
125
Acknowledgments
We thank Peter Fratzl for fruitful discussions and advice. We also acknowledge funding from the
Leibniz prize of Peter Fratzl running under DFG contract number FR2190/4-1. CB is part of the
Berlin Brandenburg School for Regenerative Therapies (GSC 203).

Appendix A. A three-dimensional model for tissue deposition on complex surfaces
126
Supplementary Material
The computational implementation of curvature-driven tissue growth based on the
methods of Bullard et al.
The effective mean curvature R
1 in the centre of the scanning mask (radius r ) is given by:
2
1
3
16
2
1 21
totV
V
rR
(Eq.A1)
The position of the interface where the effective curvature is zero is then given by Rr, when
2
1
totV
V.
Figure A-9: Geometry of the computational implementation in 3D (continuous case)
Descriptive scheme of the local geometrical configuration in a continuous case
The large circle portion represents the local interface ( R , 1h ) and the small circle represents the mask
( r , 2h ).

Appendix A. A three-dimensional model for tissue deposition on complex surfaces
127
213
3
4VVrV (Eq.A2)
2134
31 VV
rV
V
tot
(Eq.A3)
3
1 12
11
R
hRhV (Eq.A4)
3
1 22
22
r
hrhV (Eq.A5)
Writing b in the small circle ( r , 2h ) and the large circle ( R , 1h ) gives the relation:
2
22
2
11 22 hrhhRhb (Eq.A6)
r
hrh
R
hRh
rV
V
tot 31
31
4
31 22
212
13 (Eq.A7)
1h and 2h can be written as a function of ( r , R and ) using Pythagoras relation in the triangles
OMN and CMN:
2
21
2
2)(
bhr (Eq.A8)
2
21
2
2)(
bhRR (Eq.A9)
Subtracting the two expressions gives:
R
rh
2
22
1 (Eq.A10)
Moreover, as
rhh 12 (Eq.A11)
then
R
rrh
2
22
2 (Eq.A12)
The expression of the ratio totV
V can be then derived as a function of ( r , R and ).
A series expansion at the first order of ,,RrV
V
tot
in when 2
1,, Rr
V
V
tot
is done:

Appendix A. A three-dimensional model for tissue deposition on complex surfaces
128
2216
3
4
3
16
3,, O
R
r
rR
rRr
V
V
tot
(Eq.A13)
and Rr, is determined for 2
1
totV
V:
22
2
4,
Rr
RrRr
(Eq.A14)
Assuming rR , a series expansion at the first order of Rr, when R gives a simple
expression:
R
rComp
4
2
(Eq.A15)
24
212
r
Comp (Eq.A16)
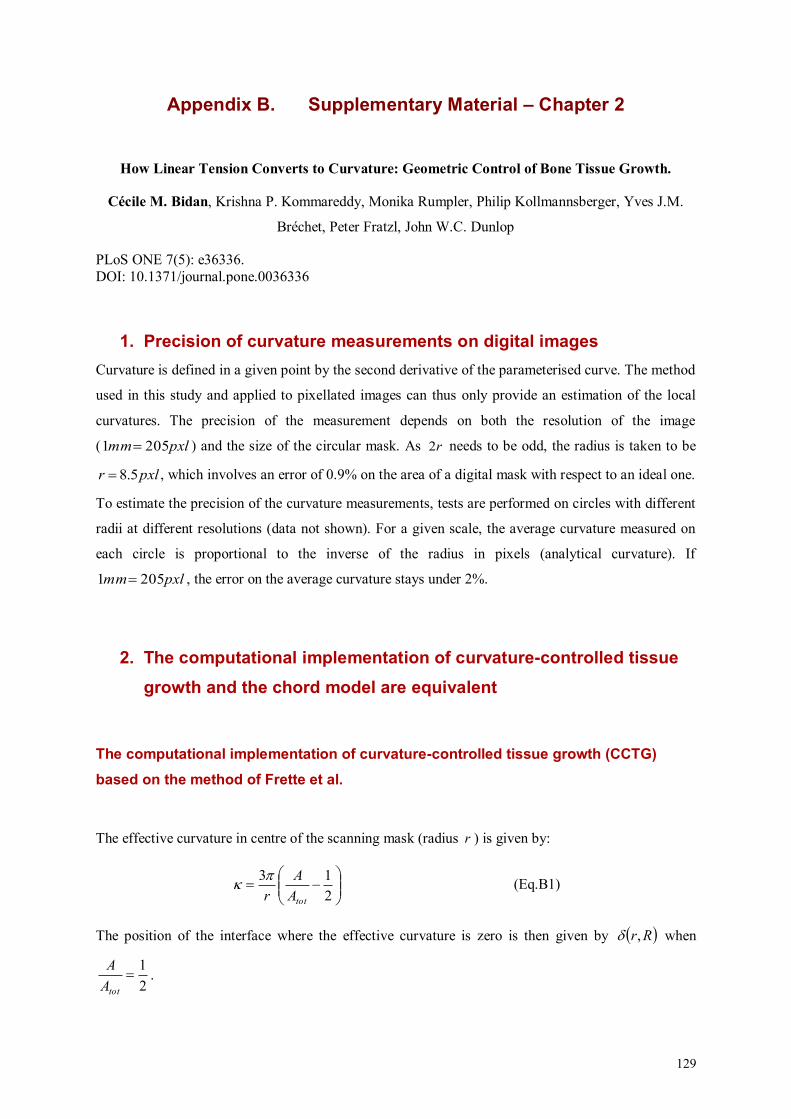
129
Appendix B. Supplementary Material – Chapter 2
How Linear Tension Converts to Curvature: Geometric Control of Bone Tissue Growth.
Cécile M. Bidan, Krishna P. Kommareddy, Monika Rumpler, Philip Kollmannsberger, Yves J.M.
Bréchet, Peter Fratzl, John W.C. Dunlop
PLoS ONE 7(5): e36336.
DOI: 10.1371/journal.pone.0036336
1. Precision of curvature measurements on digital images
Curvature is defined in a given point by the second derivative of the parameterised curve. The method
used in this study and applied to pixellated images can thus only provide an estimation of the local
curvatures. The precision of the measurement depends on both the resolution of the image
( pxlmm 2051 ) and the size of the circular mask. As r2 needs to be odd, the radius is taken to be
pxlr 5.8 , which involves an error of 0.9% on the area of a digital mask with respect to an ideal one.
To estimate the precision of the curvature measurements, tests are performed on circles with different
radii at different resolutions (data not shown). For a given scale, the average curvature measured on
each circle is proportional to the inverse of the radius in pixels (analytical curvature). If
pxlmm 2051 , the error on the average curvature stays under 2%.
2. The computational implementation of curvature-controlled tissue
growth and the chord model are equivalent
The computational implementation of curvature-controlled tissue growth (CCTG)
based on the method of Frette et al.
The effective curvature in centre of the scanning mask (radius r ) is given by:
2
13
totA
A
r
(Eq.B1)
The position of the interface where the effective curvature is zero is then given by Rr, when
2
1
totA
A.
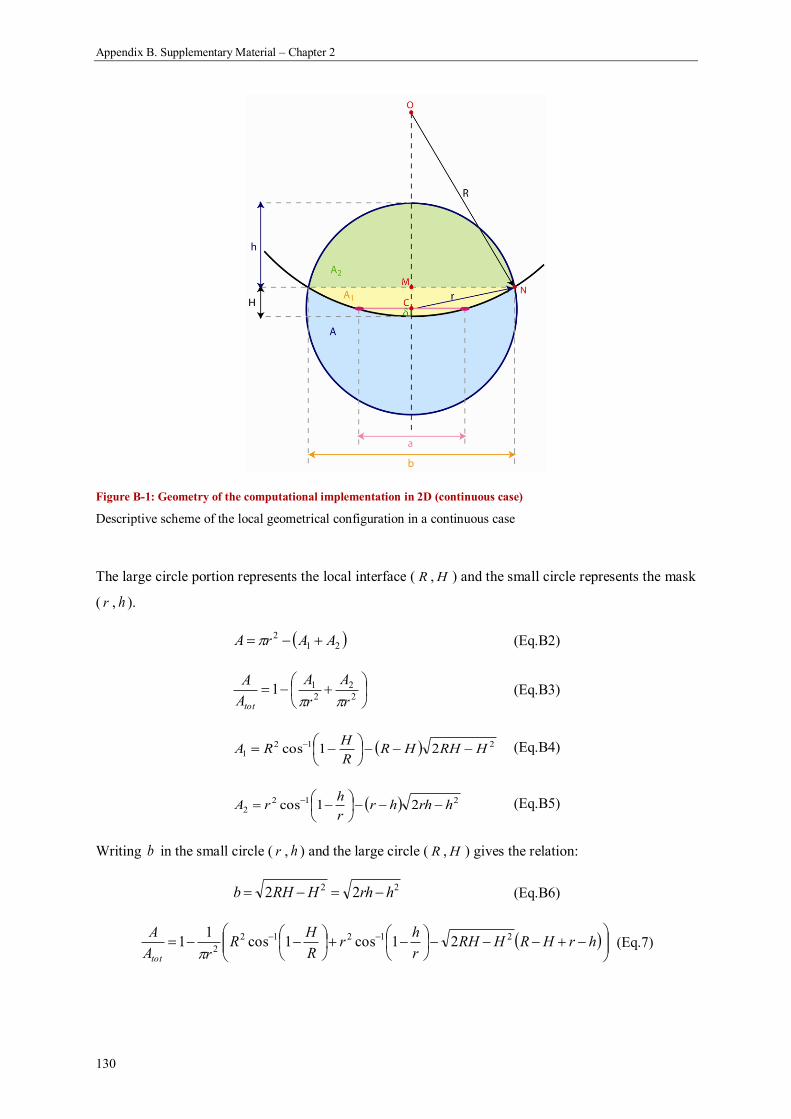
Appendix B. Supplementary Material – Chapter 2
130
Figure B-1: Geometry of the computational implementation in 2D (continuous case)
Descriptive scheme of the local geometrical configuration in a continuous case
The large circle portion represents the local interface ( R , H ) and the small circle represents the mask
( r , h ).
212 AArA (Eq.B2)
2
2
2
11r
A
r
A
A
A
tot (Eq.B3)
2121 21cos HRHHR
R
HRA
(Eq.B4)
2122 21cos hrhhr
r
hrA
(Eq.B5)
Writing b in the small circle ( r , h ) and the large circle ( R , H ) gives the relation:
22 22 hrhHRHb (Eq.B6)
hrHRHRH
r
hr
R
HR
rA
A
tot
21212
221cos1cos
11
(Eq.7)

Appendix B. Supplementary Material – Chapter 2
131
h and H can be written as a function of ( r , R and ) using Pythagoras relation in the triangles
OMN and CMN:
2
22
2)(
bHr (Eq.B8)
2
22
2)(
bHRR (Eq.B9)
Subtracting the two expressions gives:
R
rH
2
22
(Eq.B10)
Moreover, as
rHh (Eq.B11)
then
R
rrh
2
22
(Eq.B12)
The expression of the ratio totA
A can be then derived as a function of ( r , R , ).
A series expansion at the first order of ,, RrA
A
tot
in when 2
1,, Rr
A
A
tot
is done:
2
2
3222
4222224235
2
12
2
2124222
4
44286
2
2cos2
21cos24
,,
O
rRRr
rRrrRRrRRrr
r
R
rr
R
rRrRrr
RrA
A
tot
(Eq.B13)
And Rr, is determined for 2
1
totA
A:
4222224235
422212
2
212
2
322
442862
42
cos22
1cos24
,rRrrRRrRRrr
rRrrR
rr
R
rRrRR
Rr
(Eq.B14)
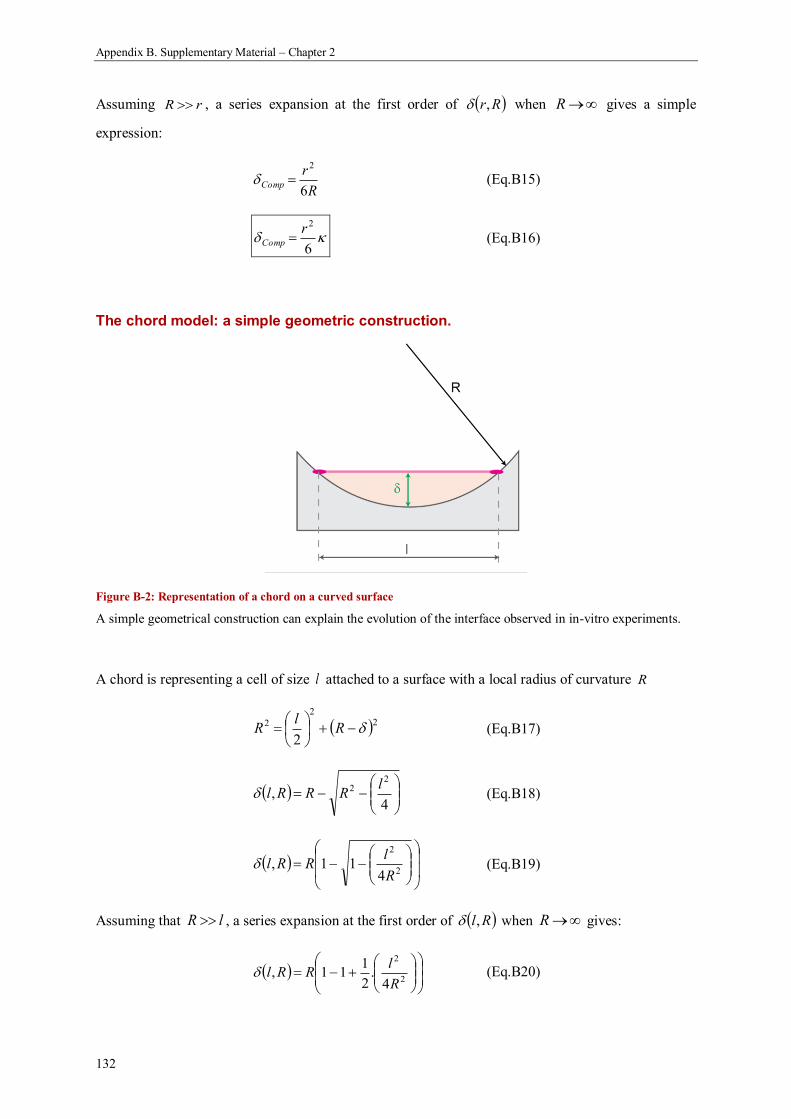
Appendix B. Supplementary Material – Chapter 2
132
Assuming rR , a series expansion at the first order of Rr, when R gives a simple
expression:
R
rComp
6
2
(Eq.B15)
6
2rComp (Eq.B16)
The chord model: a simple geometric construction.
Figure B-2: Representation of a chord on a curved surface
A simple geometrical construction can explain the evolution of the interface observed in in-vitro experiments.
A chord is representing a cell of size l attached to a surface with a local radius of curvature R
22
2
2
R
lR (Eq.B17)
4,
22 l
RRRl (Eq.B18)
2
2
411,
R
lRRl (Eq.B19)
Assuming that lR , a series expansion at the first order of Rl, when R gives:
2
2
4.
2
111,
R
lRRl (Eq.B20)

Appendix B. Supplementary Material – Chapter 2
133
R
lRl
8,
2
(Eq.B21)
8
2lChord (Eq.B22)
The equivalence.
Equations B16 and B22 show that CCTG is a direct consequence of a simple geometric assembly of
tensile elements or chords. The quantitative equivalence is highlighted in Figure.B3 by comparing the
interfacial motion predicted by the two methods.
Figure B-3: Comparison of the computational model of CCTG with the chord model
The CCTG description is equivalent to the chord model if the radius of the mask is lr2
3 . The interfaces
derived from both models after 100, 200 and 300 iterations are shown as coloured lines for CCTG and grey lines
delimiting coloured regions for the chord model (the radius )(R
being calculated analytically with
pxlr 5.8 , mml 047.0 ).

134
Appendix C. Supplementary Material – Chapter 3
Geometry as a factor for tissue growth:
Towards shape optimization of tissue engineering scaffolds
Cécile M. Bidan, Krishna P. Kommareddy, Monika Rumpler, Philip Kollmannsberger, Peter Fratzl,
John W.C. Dunlop
The supporting information detail the calculations of some geometrical descriptors used in our
demonstrations: the non-convexity, the circularity and the inner radius. The demonstrations are done
for three different types of geometries: regular convex shapes, regular star shapes and cross shapes.
1. Definition of the geometrical descriptors
The positive average curvature is the average of the positive curvatures added along the perimeter
and divided by the perimeter length:
P
curvaturepositivewithlengthPave
___)( (Eq.C1)
In order to demonstrate this, sharp corners are represented as rounded corners with an arc length
function of the radius of curvature chosen and the rounded angle.
We define the “non-convexity” as a dimensionless geometrical parameter equal to the positive
average curvature normalized by the positive average curvature of a convex shape, which was
demonstrated by Fenchel to be P
2.
The circularity is a dimensionless shape factor between 0 and 1:
24
P
AC (Eq.C2)
A circle has a circularity of 1 whereas highly rough shapes have a circularity close to 0.
In our study, the ratio of perimeter to area is fundamental for the design of a scaffold made of multiple
pores, since it determines the porosity, i.e. the number of pores that can fit in a given volume (area in
our case).

Appendix C. Supplementary Material – Chapter 3
135
The inner radius iR is defined as the radius of the biggest circle included in the shape. This length is
chosen to determine the minimum relevant pore size. Indeed, if the pores are too small, diffusion of
nutrients is prevented and cell and tissue growths are impaired.
We can associate an inner area iA
which corresponds to the surface of this circle:
2
ii RA (Eq.C3)
In tissue engineering literature, it was shown that scaffolds presenting pore size below 300µm were
not favorable for supporting cell and tissue integration. In this study, we set mmRi 15.0min and we
can estimate the minimum perimeter minP and the minimum area
minA that pores can have.
In non-convex shapes, tissue growth is faster than in convex shapes as long as the tissue-medium
interface has not reached the inner circle. One can then calculate the ratio of fast growth representing
the ratio of projected tissue area produced at a faster rate in the pore:
pore
i
pore
ipore
fastA
A
A
AAA
1% (Eq.C4)
2. Three types of geometries
Figure C-1: Definition of the parameters used to describe regular geometries
(a) Convex shapes,(b) regular star shapes and (c) cross shapes.
Regular convex shapes (Figure C1(a)) are regular polygons with n edges of length a ( 3n ). Here
we consider triangles 3n , squares 4n and circles n .

Appendix C. Supplementary Material – Chapter 3
136
Perimeter:
anP (Eq.C5)
Area:
nn
P
nanA
cot
4cot
4
1 22 (Eq.C6)
Positive average curvature (Demonstration of Fenchel’s law):
Prnrn
PPave
2121)( (Eq.C7)
Non-convexity:
1 (Eq.C8)
Circularity:
nnP
AC
cot4
2 (Eq.C9)
Circularity does not depend on the size but just on the shape.
Inner radius:
nn
P
naRi
cot
2
1cot
2
1 (Eq.C10)
Minimum perimeter:
nRn
n
RnP i
i
tan2
cot
2min
minmin
(Eq.C11)
Minimum area:
nRnA i
tan
2
minmin (Eq.C12)
Ratio of fast growth:
nnA fast
cot1% (Eq.C13)
Note that in convex shapes, the growth is not faster before reaching the circular interface.
Regular star shapes (Figure C1(b)) are stars with n branches of angle ( 0 ) and edges of
length a
Perimeter:
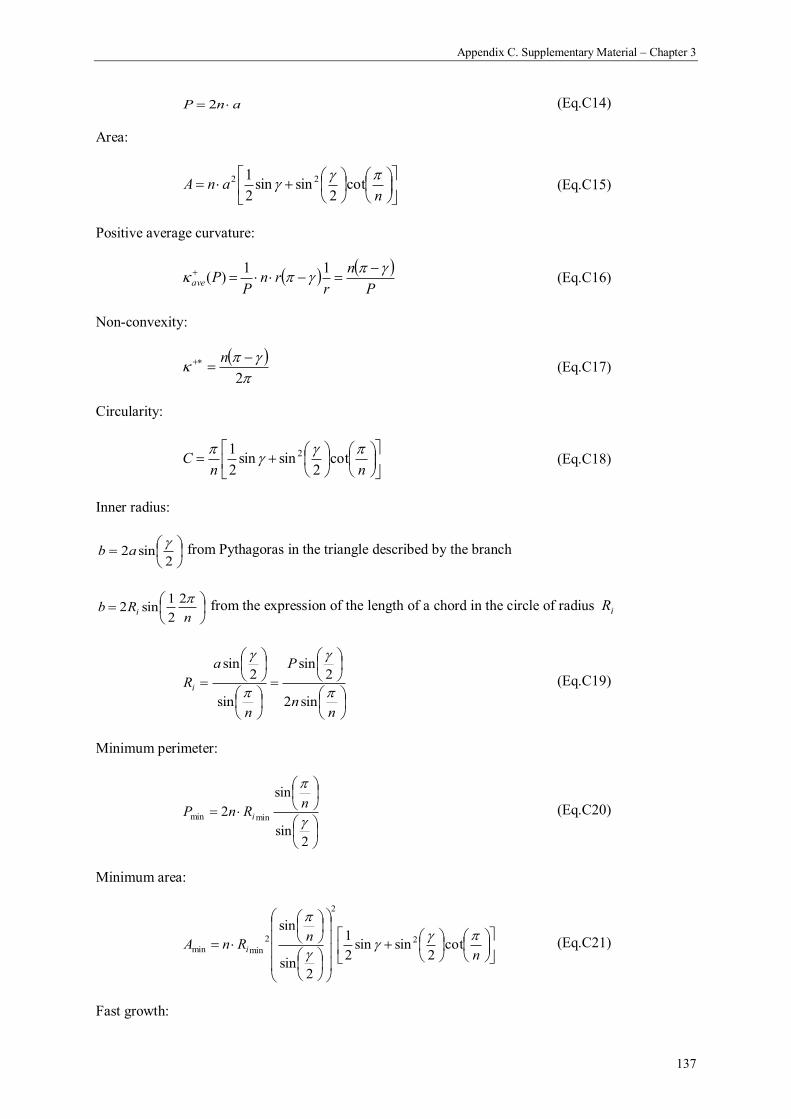
Appendix C. Supplementary Material – Chapter 3
137
anP 2 (Eq.C14)
Area:
nanA
cot
2sinsin
2
1 22 (Eq.C15)
Positive average curvature:
P
n
rrn
PPave
11
)( (Eq.C16)
Non-convexity:
2
n
(Eq.C17)
Circularity:
nnC
cot
2sinsin
2
1 2 (Eq.C18)
Inner radius:
2sin2
ab from Pythagoras in the triangle described by the branch
nRb i
2
2
1sin2 from the expression of the length of a chord in the circle of radius iR
nn
P
n
a
Ri
sin2
2sin
sin
2sin
(Eq.C19)
Minimum perimeter:
2sin
sin
2minmin
nRnP i
(Eq.C20)
Minimum area:
n
nRnA i
cot2
sinsin2
1
2sin
sin2
2
2
minmin (Eq.C21)
Fast growth:
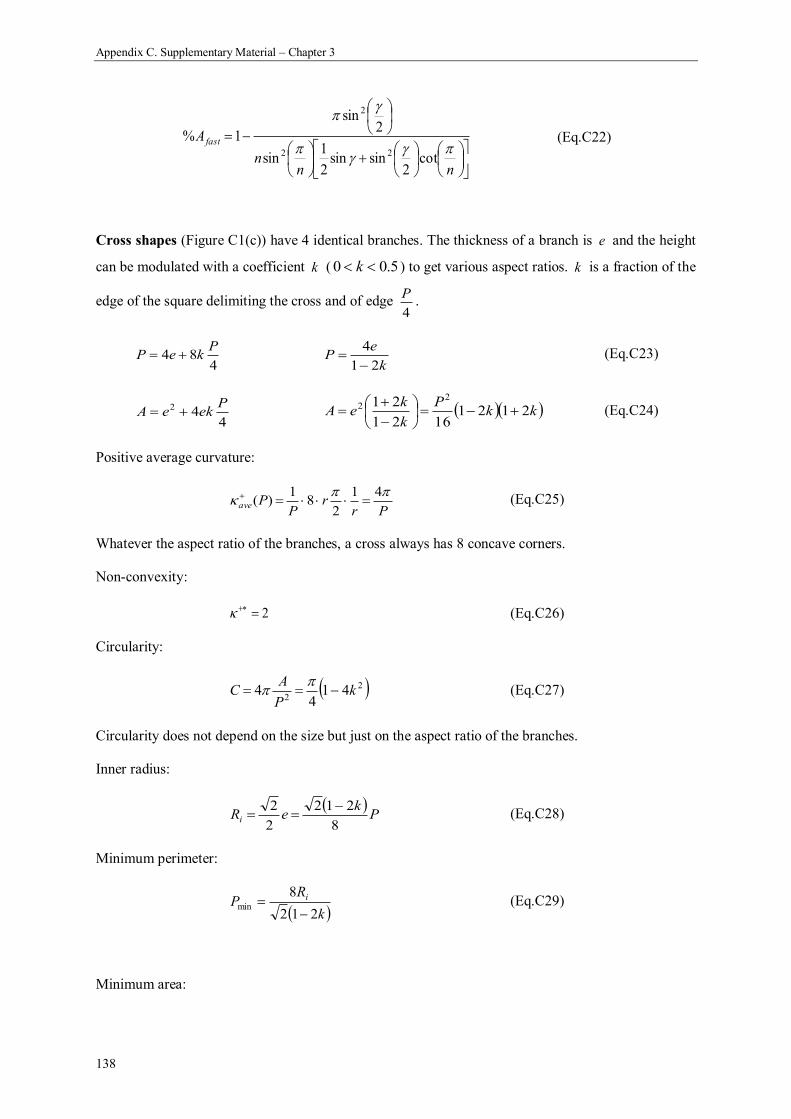
Appendix C. Supplementary Material – Chapter 3
138
nnn
A fast
cot2
sinsin2
1sin
2sin
1%22
2
(Eq.C22)
Cross shapes (Figure C1(c)) have 4 identical branches. The thickness of a branch is e and the height
can be modulated with a coefficient k ( 5.00 k ) to get various aspect ratios. k is a fraction of the
edge of the square delimiting the cross and of edge 4
P.
484
PkeP
k
eP
21
4
(Eq.C23)
442 PekeA kk
P
k
keA 2121
1621
21 22
(Eq.C24)
Positive average curvature:
Prr
PPave
41
28
1)( (Eq.C25)
Whatever the aspect ratio of the branches, a cross always has 8 concave corners.
Non-convexity:
2 (Eq.C26)
Circularity:
2
241
44 k
P
AC
(Eq.C27)
Circularity does not depend on the size but just on the aspect ratio of the branches.
Inner radius:
P
keRi
8
212
2
2 (Eq.C28)
Minimum perimeter:
k
RP i
212
8min
(Eq.C29)
Minimum area:

Appendix C. Supplementary Material – Chapter 3
139
k
kRA i
21
212
2
min (Eq.C30)
Fast growth:
k
kA fast
212
211%
(Eq.C31)

Appendix C. Supplementary Material – Chapter 3
140
Circularity
24
P
AC
Non-Convexity
2
)(. PP ave
Pore
Geometry
C
Minimum Perimeter
minP
mmRi 15.0min
Max Total Tissue Growth
9.0 220mmAscaff
123 .10.2.3 dmm
CPA
dt
dPTAscaff
tot
2
2 18
Fast Area, before
reaching the limit
minmin ifast AAA
Regular Convex Shape
Triangle 3n 0.60 1 1.66 1.56 3.10 0.0462
Square 4n 0.78 1 1.28 1.20 4.04 0.0193
Circle n 1 1 1 0.942 5.12 0
Regular Star Shape
Star
4n
4
0.49 1.5 3.06 2.22 2.82 0.0830
Cross shape
Medium 3.0k 0.43 2 4.65 2.12 4.71 0.109
Thin 4.0k 0.28 2 7.14 4.24 1.81 0.334
Thick 2.0k 0.66 2 3.03 1.41 6.93 0.0343
Table S1. Summary of numerical values describing different geometries

141
Appendix D. Confocal Laser Scanning Microscopy and
Multiphoton and Autofluorescence/SHG Microscopy
1. Confocal Laser Scanning Microscope
In contrast to wide field microscopy, a confocal set up illuminates a single spot of the sample using a
laser passing through an appropriate optical system. A pinhole located in the image focal plane also
enables the out-of-focus signal emitted by the material to be removed (Figure D-1). This spot is
scanned over a region of interest in the focus plane by use of mobile mirrors, and the image is
reconstituted by the computer. In thick samples, the vertical motion of the objective enables to image
different focal planes. This technique called optical sectioning reproduces serial sectioning performed
on microtomes with the advantages of being non-invasive and having a much higher resolution.
Maximum projections and three-dimensional reconstructions made from these series of images
provide detailed structural and organisational information about the specimen. Illustrations of these
processing methods are given in Appendix E1 in the context of tissue investigation.
Figure D-1: Principle of confocal microscopy
The optical system focuses the laser light on a single spot of the sample and directs the signal emitted toward the
detector. A confocal pinhole eliminates the signal emitted by the material out of focus before detection.
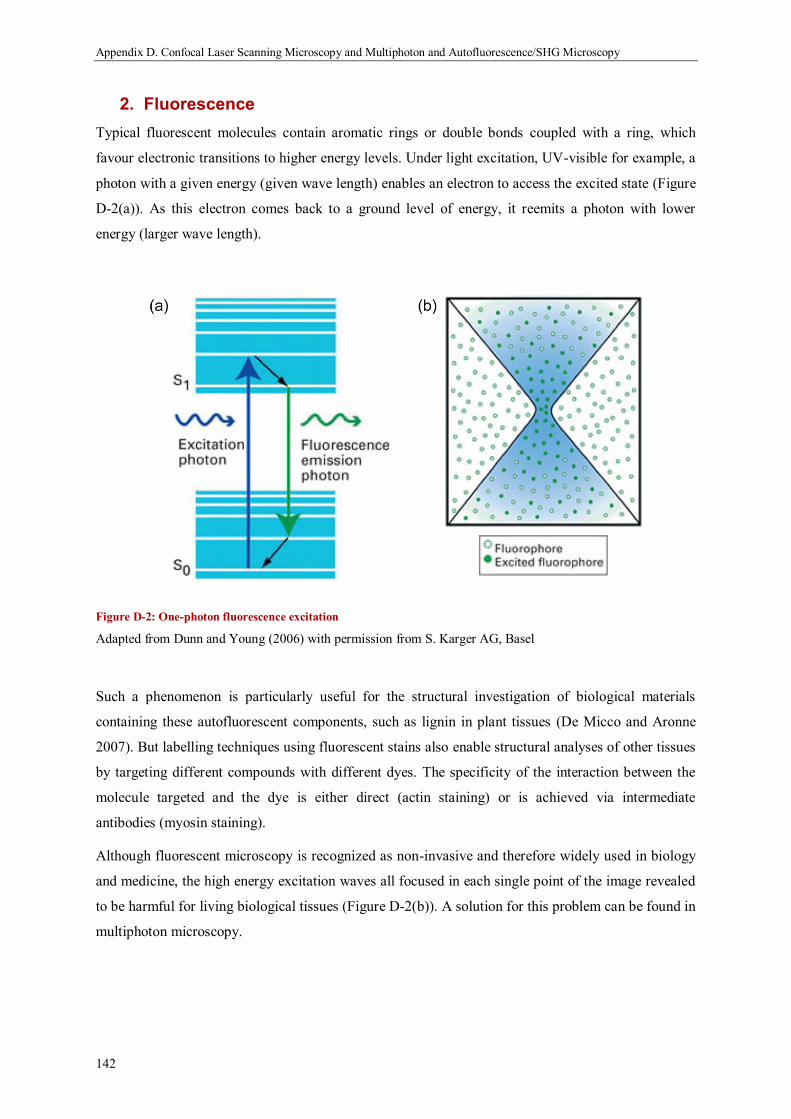
Appendix D. Confocal Laser Scanning Microscopy and Multiphoton and Autofluorescence/SHG Microscopy
142
2. Fluorescence
Typical fluorescent molecules contain aromatic rings or double bonds coupled with a ring, which
favour electronic transitions to higher energy levels. Under light excitation, UV-visible for example, a
photon with a given energy (given wave length) enables an electron to access the excited state (Figure
D-2(a)). As this electron comes back to a ground level of energy, it reemits a photon with lower
energy (larger wave length).
Figure D-2: One-photon fluorescence excitation
Adapted from Dunn and Young (2006) with permission from S. Karger AG, Basel
Such a phenomenon is particularly useful for the structural investigation of biological materials
containing these autofluorescent components, such as lignin in plant tissues (De Micco and Aronne
2007). But labelling techniques using fluorescent stains also enable structural analyses of other tissues
by targeting different compounds with different dyes. The specificity of the interaction between the
molecule targeted and the dye is either direct (actin staining) or is achieved via intermediate
antibodies (myosin staining).
Although fluorescent microscopy is recognized as non-invasive and therefore widely used in biology
and medicine, the high energy excitation waves all focused in each single point of the image revealed
to be harmful for living biological tissues (Figure D-2(b)). A solution for this problem can be found in
multiphoton microscopy.
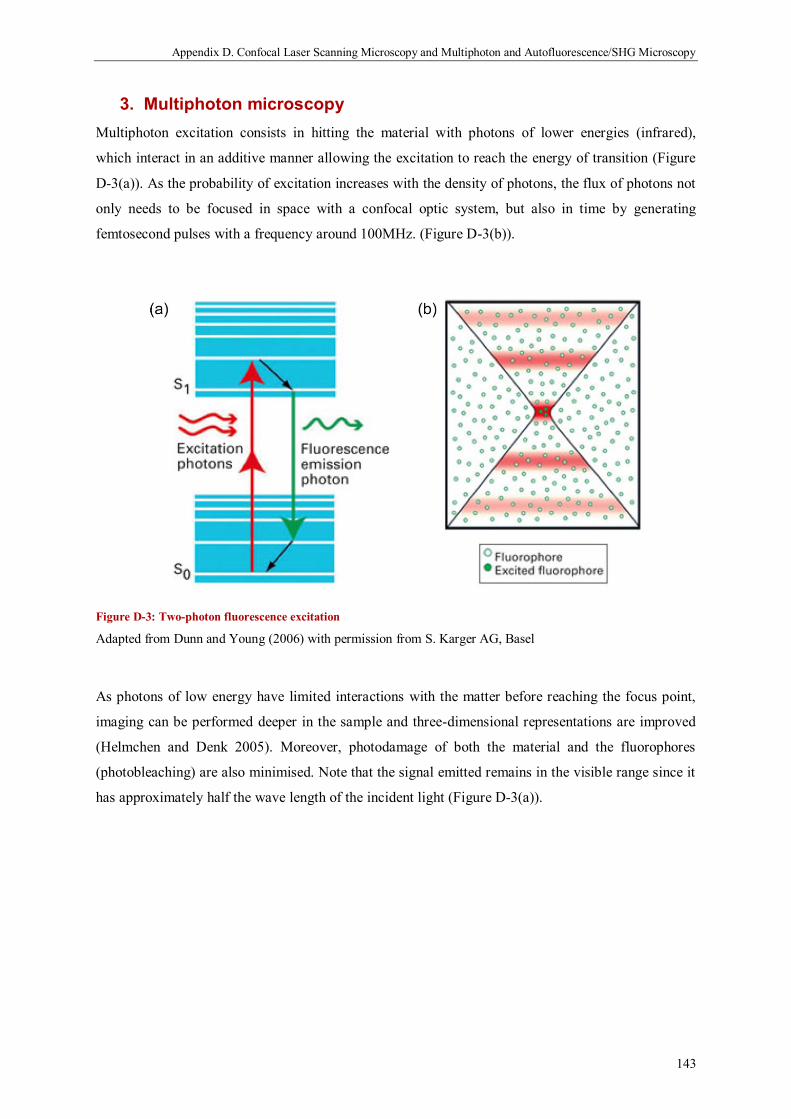
Appendix D. Confocal Laser Scanning Microscopy and Multiphoton and Autofluorescence/SHG Microscopy
143
3. Multiphoton microscopy
Multiphoton excitation consists in hitting the material with photons of lower energies (infrared),
which interact in an additive manner allowing the excitation to reach the energy of transition (Figure
D-3(a)). As the probability of excitation increases with the density of photons, the flux of photons not
only needs to be focused in space with a confocal optic system, but also in time by generating
femtosecond pulses with a frequency around 100MHz. (Figure D-3(b)).
Figure D-3: Two-photon fluorescence excitation
Adapted from Dunn and Young (2006) with permission from S. Karger AG, Basel
As photons of low energy have limited interactions with the matter before reaching the focus point,
imaging can be performed deeper in the sample and three-dimensional representations are improved
(Helmchen and Denk 2005). Moreover, photodamage of both the material and the fluorophores
(photobleaching) are also minimised. Note that the signal emitted remains in the visible range since it
has approximately half the wave length of the incident light (Figure D-3(a)).

Appendix D. Confocal Laser Scanning Microscopy and Multiphoton and Autofluorescence/SHG Microscopy
144
4. Second Harmonic Generation (SHG)
Exciting a non-linear material with a multiphoton source can induce a non-linear effect called Second
Harmonic Generation (SHG) or frequency doubling. Indeed, some molecules are able to scatter
simultaneously two photons, which result in the emission of new photons with exactly half of the
initial wave length (elastic interaction) (Figure D-4). The emitted light is coherent and its direction
provides information about the structure and the orientation of the scattering molecules (polarisation
effect). Therefore, SHG is structure based and specific to asymmetric molecules that are spatially
ordered. Because collagen has an alpha helix configuration and is assembled into fibrils, it is ideally
suited for imaging with SHG microscopy (Friedl et al. 2007).
Figure D-4: Second Harmonic Generation
Contrary to fluorescence emission (a), second harmonic generation resulting from a multiphoton excitation is a
consequence of elastic scattering (b) and the wave length of the emitted photons is exactly the half of the
excitation (c). This enables to distinguish autofluorescence from SHG signals.
Inspired from http://www.svi.nl/SecondHarmonicGeneration

145
Appendix E. Preliminary results from the three-dimensional
analysis of the tissue
As discussed in Chapter 5, a three-dimensional analysis of the tissue would present many interests and
some attempts were carried out to address this new challenge. This appendix reports the preliminary
data acquired by using confocal microscopy as an optical sectioning technique as well as the first
results obtained by sectioning tissue grown on soft materials. Finally, illustrations of hyperboloid
surfaces are provided in order to visualise their potential to bring the chord model into three
dimensions.
1. Optical sectioning by confocal micrscopy
As explained in Appendix D, fluorescent confocal microscopy is a non-desctructive technique that
enables three-dimensional investigations by optical sectioning. Tissue grown in the pores of
hydroxyapatite scaffolds and stained for actin was observed with this method. In one pore, a series of
pictures is taken with regular intervals over a defined height generally limited by the loss of
fluorescent signal when going deep into the tissue (Figure E-1(a)). The stacks of images obtained are
then processed (with ImageJ for example) to derive information about the three-dimensional structure
of the tissue. The maximum projection, the three-dimensional reconstruction and the orthogonal
projection are three methods that were applied on the data obtained.
The maximum projection is an image on which each pixel contains the maximum value of the stack
for this particular pixel. It corresponds approximately to what one would see by looking through the
pore if the tissue was transparent. This visualisation method applied to the tissue grown in a triangular
pore reveals a particular organisation of the actin pattern (Figure E-1(b)). Indeed, the actin fibres form
a spiral oriented in the right-handed direction. Such a chiral pattern was often observed in pores of
different shapes containing a lot of tissue.
Specifying the distance between the imaged focal planes enables the software to reconstruct the three-
dimensional picture of the tissue observed. With this technique, the twisting pattern observed on the
maximum projection appears to result from the preferential orientation of the cells in three dimensions
(Figure E-1(c)). Indeed, the actin fibres visible on the tissue-medium interface are inclined when
joining the top of the scaffold and the surface of the tissue deeper in the pore. Moreover, such a
representation suggests that the tissue thickness is not constant along the height of the pore.
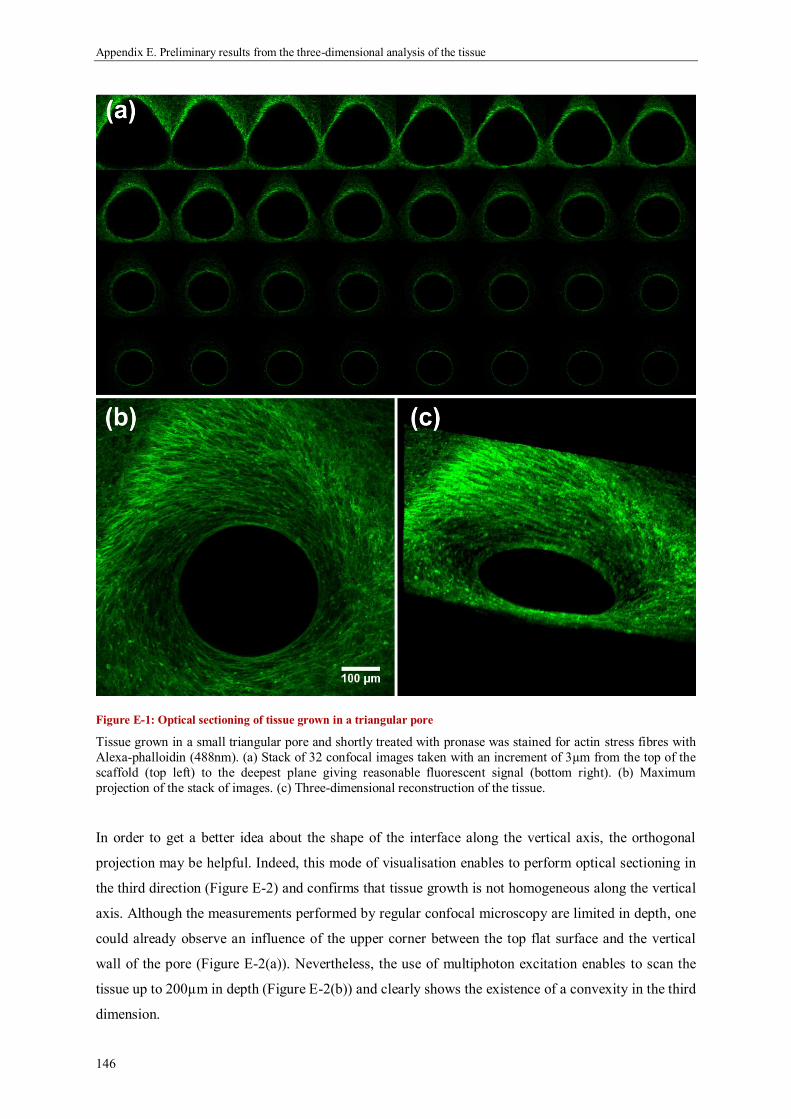
Appendix E. Preliminary results from the three-dimensional analysis of the tissue
146
Figure E-1: Optical sectioning of tissue grown in a triangular pore
Tissue grown in a small triangular pore and shortly treated with pronase was stained for actin stress fibres with
Alexa-phalloidin (488nm). (a) Stack of 32 confocal images taken with an increment of 3µm from the top of the
scaffold (top left) to the deepest plane giving reasonable fluorescent signal (bottom right). (b) Maximum
projection of the stack of images. (c) Three-dimensional reconstruction of the tissue.
In order to get a better idea about the shape of the interface along the vertical axis, the orthogonal
projection may be helpful. Indeed, this mode of visualisation enables to perform optical sectioning in
the third direction (Figure E-2) and confirms that tissue growth is not homogeneous along the vertical
axis. Although the measurements performed by regular confocal microscopy are limited in depth, one
could already observe an influence of the upper corner between the top flat surface and the vertical
wall of the pore (Figure E-2(a)). Nevertheless, the use of multiphoton excitation enables to scan the
tissue up to 200µm in depth (Figure E-2(b)) and clearly shows the existence of a convexity in the third
dimension.
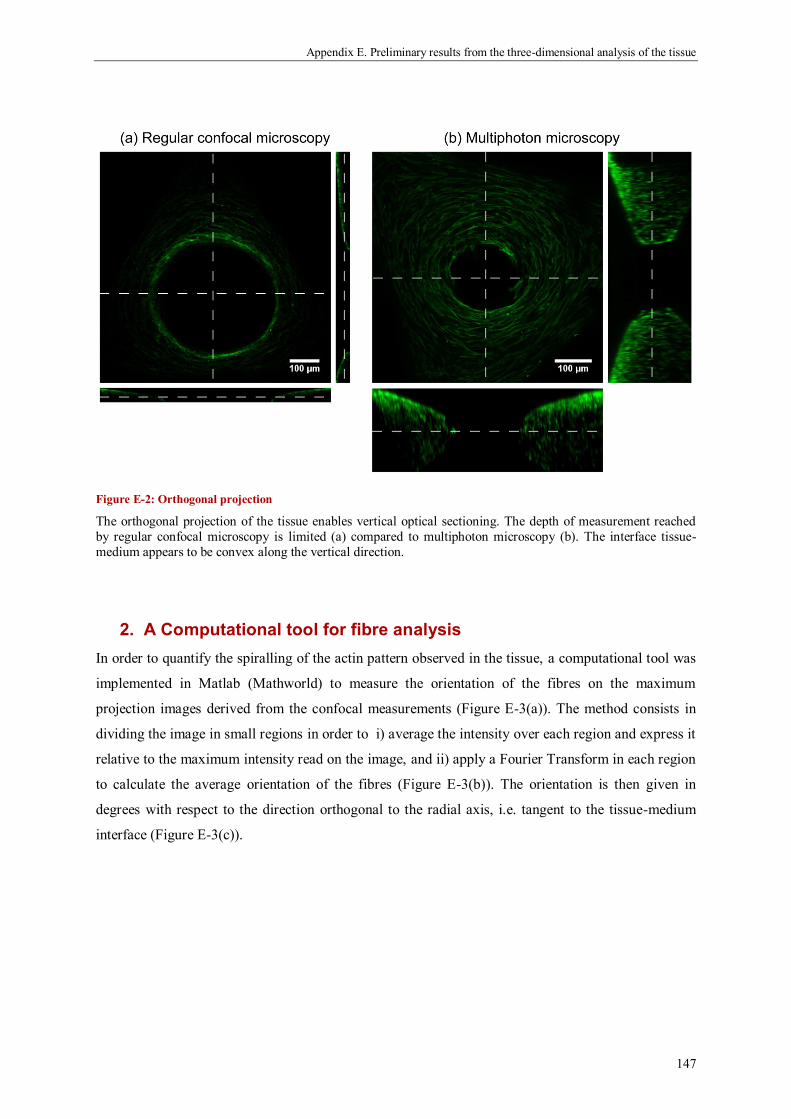
Appendix E. Preliminary results from the three-dimensional analysis of the tissue
147
Figure E-2: Orthogonal projection
The orthogonal projection of the tissue enables vertical optical sectioning. The depth of measurement reached
by regular confocal microscopy is limited (a) compared to multiphoton microscopy (b). The interface tissue-
medium appears to be convex along the vertical direction.
2. A Computational tool for fibre analysis
In order to quantify the spiralling of the actin pattern observed in the tissue, a computational tool was
implemented in Matlab (Mathworld) to measure the orientation of the fibres on the maximum
projection images derived from the confocal measurements (Figure E-3(a)). The method consists in
dividing the image in small regions in order to i) average the intensity over each region and express it
relative to the maximum intensity read on the image, and ii) apply a Fourier Transform in each region
to calculate the average orientation of the fibres (Figure E-3(b)). The orientation is then given in
degrees with respect to the direction orthogonal to the radial axis, i.e. tangent to the tissue-medium
interface (Figure E-3(c)).

Appendix E. Preliminary results from the three-dimensional analysis of the tissue
148
Figure E-3: Quantification of fibre orientation
The twisting of the actin network observed on maximum projection obtained by confocal microscopy (a) can be
quantified with a custom made computational tool which divides the original picture into regions where the
average intensity (colour map) and the average orientation (rods) are calculated (b). The degree of alignment of
the fibres in the region is characterised by the length of the rod. The orientation of the fibres is measured in degrees with respect to the direction orthogonal to the radial axis, and reported on a rose diagram (c). The red
line is the mean angle and pink stars represent the standard derivation.
3. Sectioning soft scaffolds
As optical sectioning by confocal microscopy appeared to be limited, it was necessary to consider a
physical sectioning with a microtome to reach information inaccessible via optical techniques. For
this, softer materials had to be considered to substitute the brittle hydroxyapatite in the fabrication of
the scaffolds.
Polyacrylamide scaffolds
Polyacrylamide (PAAm) hydrogels were prepared by mixing solutions of acrylamide and bis-
acrylamide with ammonium peroxodisulphate (APS) and N,N,N,N-tetramethylethylenediamine
(TEMED) as described by Wang and Pelham (Pelham and Wang 1997; Wang and Pelham 1998).
Before polymerisation, which is spontaneous at room temperature, the mixture was cast into wax
moulds produced by rapid prototyping. Once the gel got its final mechanical properties, i.e. softer than
100kPa and dependant on the initial composition of the mixture, the moulds were dissolved in
tetrahydrofuran (THF). The PAAm scaffolds were then extensively washed in water and PBS before
being used for tissue culture experiments with MC3T3-E1 cells.
After a couple of weeks of growth, many samples revealed a detachment of the tissue from the
substrate but some were still stable enough for further investigations. Indeed, cryo-sectioning could be
performed on a PAAm scaffold containing triangular pores where tissue was grown for 20 days. As
both the hydrogel scaffold and tissue are mostly composed of water, the mechanical mismatch at the
substrate-tissue interface was reduced and freezing the sample at -20°C was sufficient to section it
into 70µm-thick slices.

Appendix E. Preliminary results from the three-dimensional analysis of the tissue
149
Staining these slices for alkaline phosphatase (ALP) not only showed that tissue withstands the slicing
process, but also that the MC3T3-E1 cells forming the tissue are differentiated all over the tissue
except on the very border of the tissue-medium interface (Figure E-4).
Figure E-4: ALP staining on a tissue slice
Tissue was grown by MC3T3-E1 cells in the triangular pores of a polyacrylamide scaffold for 20 days, cut into
70µm thick slices with a cryo-microtome at -20°C, and stained for alkaline phosphatase (ALP). The pre-
osteoblasts are differentiated all over the tissue except on the interface tissue-medium.
In order to observe tissue organisation in the vertical direction of the pore, cryo-sectioning was
performed on a circular pore to trim the material until reaching a longitudinal section (Figure E-5(a))
and stained for actin. Confocal microscopy performed on the section confirms the convexity of the
tissue-medium interface along the third direction (Figure E-5(b)), which was expected from
computational simulations (Appendix A) and previous confocal measurements (Figure E-2(b)).
Although the tissue might have been slightly deformed during the sectioning, a maximum projection
of actin images taken between the surface of the section and the scaffold-tissue interface shows the
preferential direction of the cells to migrate from the top surface of the scaffolds towards the bottom
of the pore (Figure E-5(c)). With this technique, the right-handed spiralling of the actin pattern can
also be characterised in the vertical direction.
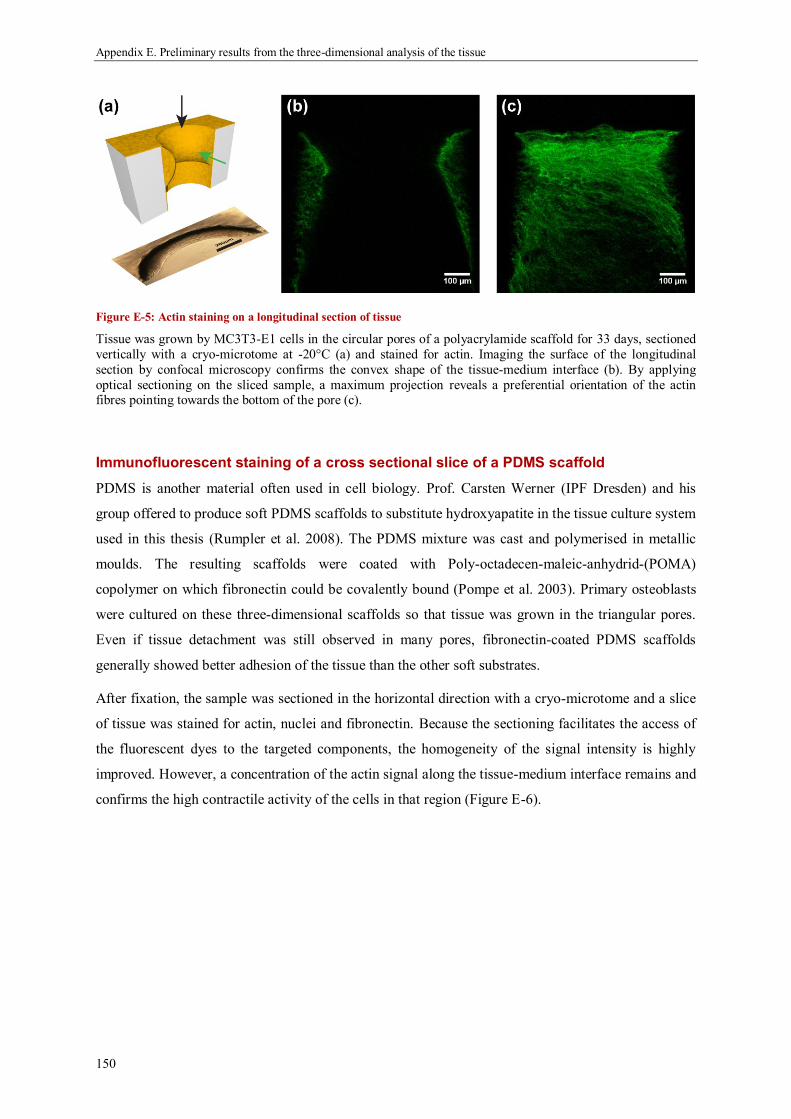
Appendix E. Preliminary results from the three-dimensional analysis of the tissue
150
Figure E-5: Actin staining on a longitudinal section of tissue
Tissue was grown by MC3T3-E1 cells in the circular pores of a polyacrylamide scaffold for 33 days, sectioned
vertically with a cryo-microtome at -20°C (a) and stained for actin. Imaging the surface of the longitudinal
section by confocal microscopy confirms the convex shape of the tissue-medium interface (b). By applying
optical sectioning on the sliced sample, a maximum projection reveals a preferential orientation of the actin fibres pointing towards the bottom of the pore (c).
Immunofluorescent staining of a cross sectional slice of a PDMS scaffold
PDMS is another material often used in cell biology. Prof. Carsten Werner (IPF Dresden) and his
group offered to produce soft PDMS scaffolds to substitute hydroxyapatite in the tissue culture system
used in this thesis (Rumpler et al. 2008). The PDMS mixture was cast and polymerised in metallic
moulds. The resulting scaffolds were coated with Poly-octadecen-maleic-anhydrid-(POMA)
copolymer on which fibronectin could be covalently bound (Pompe et al. 2003). Primary osteoblasts
were cultured on these three-dimensional scaffolds so that tissue was grown in the triangular pores.
Even if tissue detachment was still observed in many pores, fibronectin-coated PDMS scaffolds
generally showed better adhesion of the tissue than the other soft substrates.
After fixation, the sample was sectioned in the horizontal direction with a cryo-microtome and a slice
of tissue was stained for actin, nuclei and fibronectin. Because the sectioning facilitates the access of
the fluorescent dyes to the targeted components, the homogeneity of the signal intensity is highly
improved. However, a concentration of the actin signal along the tissue-medium interface remains and
confirms the high contractile activity of the cells in that region (Figure E-6).

Appendix E. Preliminary results from the three-dimensional analysis of the tissue
151
Figure E-6: Slice of tissue grown in PDMS scaffolds
Tissue was grown by primary osteoblasts cultured on PDMS scaffolds, sliced in the horizontal direction with
respect to the pore and stained for actin (green), nuclei (blue) and fibronectin (red). The limited diffusion of the
stains being improved by the sectioning method, the concentration of actin signal along the tissue-medium
interface can be now attributed to the higher contractile activity of the cells in that region.
4. A potential chord model in three dimensions
The particular orientation of the straight actin fibres in three dimensions suggests extending the chord
model proposed in Chapter 2. Interestingly, the orientation of the cells and the pattern of growth
observed during tissue culture experiments are similar to a hyperboloid, which is a ruled surface
generated by the rotation of a line oriented in three dimensions around an axis (Figure E-6). This
geometry constitutes therefore a potential basis for a chord model in three dimensions. The basic idea
here is that tensile elements will tend to lie oriented on lines of zero curvature.
Figure E-7: The hyperboloid: a potential extension of the chord model to 3D
http://demonstrations.wolfram.com/BarsOfAHyperboloid/
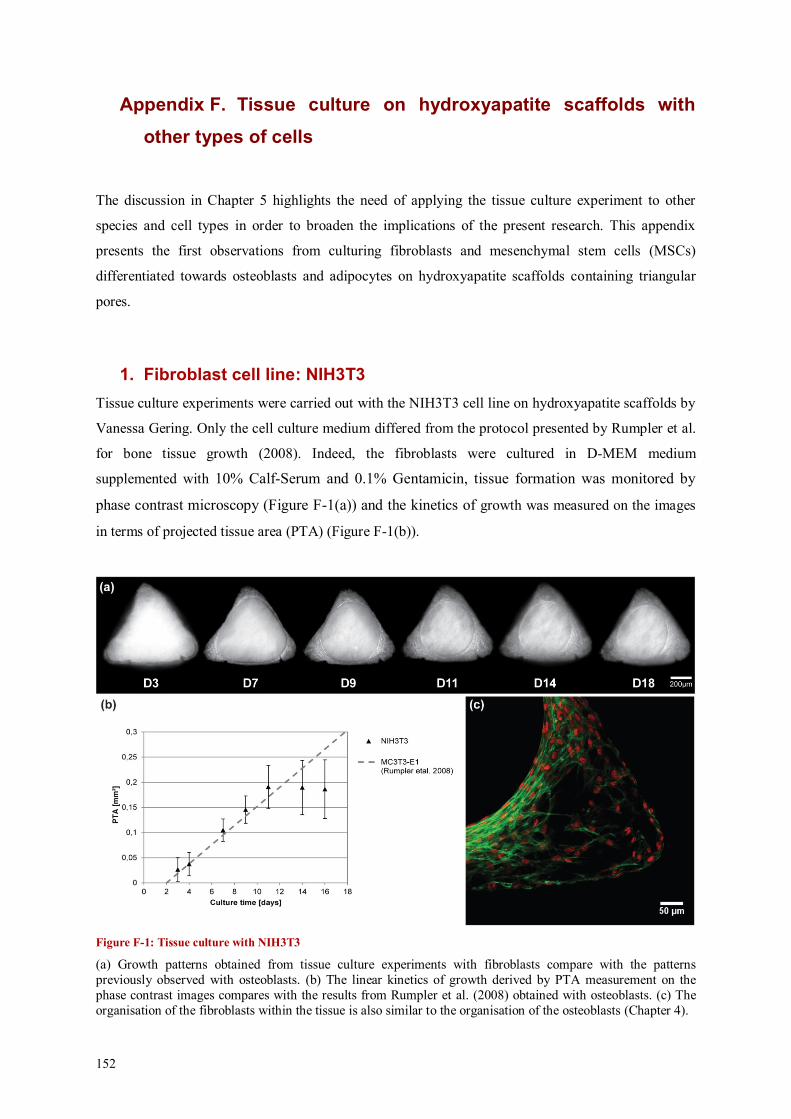
152
Appendix F. Tissue culture on hydroxyapatite scaffolds with
other types of cells
The discussion in Chapter 5 highlights the need of applying the tissue culture experiment to other
species and cell types in order to broaden the implications of the present research. This appendix
presents the first observations from culturing fibroblasts and mesenchymal stem cells (MSCs)
differentiated towards osteoblasts and adipocytes on hydroxyapatite scaffolds containing triangular
pores.
1. Fibroblast cell line: NIH3T3
Tissue culture experiments were carried out with the NIH3T3 cell line on hydroxyapatite scaffolds by
Vanessa Gering. Only the cell culture medium differed from the protocol presented by Rumpler et al.
for bone tissue growth (2008). Indeed, the fibroblasts were cultured in D-MEM medium
supplemented with 10% Calf-Serum and 0.1% Gentamicin, tissue formation was monitored by
phase contrast microscopy (Figure F-1(a)) and the kinetics of growth was measured on the images
in terms of projected tissue area (PTA) (Figure F-1(b)).
Figure F-1: Tissue culture with NIH3T3
(a) Growth patterns obtained from tissue culture experiments with fibroblasts compare with the patterns
previously observed with osteoblasts. (b) The linear kinetics of growth derived by PTA measurement on the
phase contrast images compares with the results from Rumpler et al. (2008) obtained with osteoblasts. (c) The
organisation of the fibroblasts within the tissue is also similar to the organisation of the osteoblasts (Chapter 4).
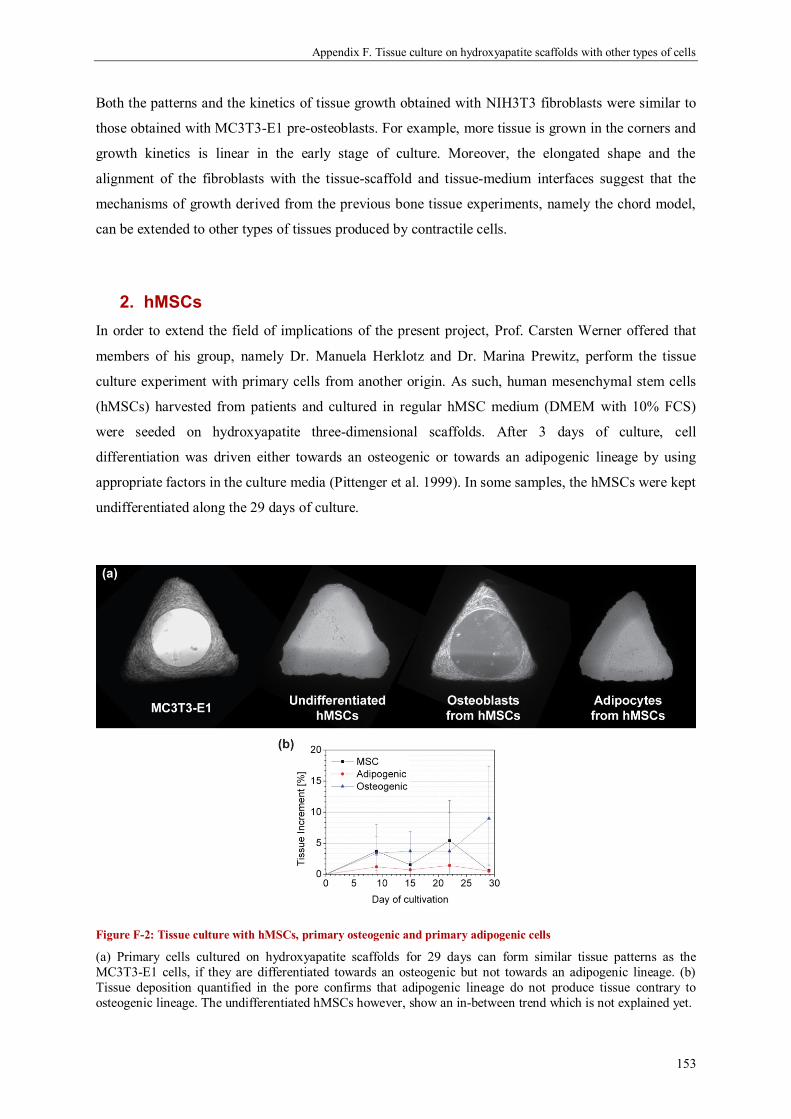
Appendix F. Tissue culture on hydroxyapatite scaffolds with other types of cells
153
Both the patterns and the kinetics of tissue growth obtained with NIH3T3 fibroblasts were similar to
those obtained with MC3T3-E1 pre-osteoblasts. For example, more tissue is grown in the corners and
growth kinetics is linear in the early stage of culture. Moreover, the elongated shape and the
alignment of the fibroblasts with the tissue-scaffold and tissue-medium interfaces suggest that the
mechanisms of growth derived from the previous bone tissue experiments, namely the chord model,
can be extended to other types of tissues produced by contractile cells.
2. hMSCs
In order to extend the field of implications of the present project, Prof. Carsten Werner offered that
members of his group, namely Dr. Manuela Herklotz and Dr. Marina Prewitz, perform the tissue
culture experiment with primary cells from another origin. As such, human mesenchymal stem cells
(hMSCs) harvested from patients and cultured in regular hMSC medium (DMEM with 10% FCS)
were seeded on hydroxyapatite three-dimensional scaffolds. After 3 days of culture, cell
differentiation was driven either towards an osteogenic or towards an adipogenic lineage by using
appropriate factors in the culture media (Pittenger et al. 1999). In some samples, the hMSCs were kept
undifferentiated along the 29 days of culture.
Figure F-2: Tissue culture with hMSCs, primary osteogenic and primary adipogenic cells
(a) Primary cells cultured on hydroxyapatite scaffolds for 29 days can form similar tissue patterns as the
MC3T3-E1 cells, if they are differentiated towards an osteogenic but not towards an adipogenic lineage. (b)
Tissue deposition quantified in the pore confirms that adipogenic lineage do not produce tissue contrary to
osteogenic lineage. The undifferentiated hMSCs however, show an in-between trend which is not explained yet.

Appendix F. Tissue culture on hydroxyapatite scaffolds with other types of cells
154
The first attempts showed that primary human osteoblasts are able to grow tissue with similar patterns
as the MC3T3-E1 cell line, whereas primary human adipocytes clearly do not form tissue and remain
as a monolayer on the surface (Figure F-2(a)). These trends were quantified by measuring the
percentages of the cross section area covered by the tissue along the culture (Figure F-2(b)). However,
the aptitude for undifferentiated hMSCs to produce tissue appears to be variable and needs to be
understood.
155
References
Abreu-Blanco, M., J. Watts, J. Verboon and S. Parkhurst (2012). "Cytoskeleton responses in wound
repair." Cellular and Molecular Life Sciences 69(15): 2469-2483.
Adachi, T., Y. Kameo and M. Hojo (2010). "Trabecular bone remodelling simulation considering
osteocytic response to fluid-induced shear stress." Philosophical Transactions of the Royal Society a-Mathematical Physical and Engineering Sciences 368(1920): 2669-2682.
Aeppli, A. (1965). "Fenchel's theorem as a consequence of Schur's." The American Mathematical
Monthly 72(3): 283-285.
Agerbaek, M. O., E. F. Eriksen, J. Kragstrup, L. Mosekilde and F. Melsen (1991). "A reconstruction
of the remodelling cycle in normal human cortical iliac bone." Bone and Mineral 12(2): 101-
112.
Alber, M., N. Chen, P. Lushnikov and S. Newman (2007). "Continuous Macroscopic Limit of a
Discrete Stochastic Model for Interaction of Living Cells." Physical Review Letters 99(16).
Alcaraz, J., L. Buscemi, M. Grabulosa, X. Trepat, B. Fabry, R. Farre and D. Navajas (2003).
"Microrheology of human lung epithelial cells measured by atomic force microscopy." Biophysical Journal 84(3): 2071-2079.
Ambrosi, D., G. A. Ateshian, E. M. Arruda, S. C. Cowin, J. Dumais, A. Goriely, G. A. Holzapfel, J.
D. Humphrey, R. Kemkemer, E. Kuhl, J. E. Olberding, L. A. Taber and K. Garikipati (2011). "Perspectives on biological growth and remodeling." Journal of the Mechanics and Physics of
Solids 59(4): 863-883.
Ambrosi, D. and A. Guana (2007). "Stress-modulated growth." Mathematics and Mechanics of Solids
12(3): 319-342.
Ambrosi, D. and A. Guillou (2007). "Growth and dissipation in biological tissues." Continuum
Mechanics and Thermodynamics 19(5): 245-251.
Ambrosi, D. and L. Preziosi (2009). "Cell adhesion mechanisms and stress relaxation in the mechanics of tumours." Biomechanics and Modeling in Mechanobiology 8(5): 397-413.
An, S. S., J. Kim, K. Ahn, X. Trepat, K. J. Drake, S. Kumar, G. Ling, C. Purington, T. Rangasamy, T.
W. Kensler, W. Mitzner, J. J. Fredberg and S. Biswal (2009). "Cell stiffness, contractile stress and the role of extracellular matrix." Biochemical and Biophysical Research Communications
382(4): 697-703.
Angelini, T. E., E. Hannezo, X. Trepat, M. Marquez, J. J. Fredberg and D. A. Weitz (2011). "Glass-
like dynamics of collective cell migration." Proceedings of the National Academy of Sciences.
Anon, E., X. Serra-Picamal, P. Hersen, N. C. Gauthier, M. P. Sheetz, X. Trepat and B. Ladoux (2012).
"Cell crawling mediates collective cell migration to close undamaged epithelial gaps." Proceedings of the National Academy of Sciences 109(27): 10891-10896.
Arciero, J. C., Q. Mi, M. F. Branca, D. J. Hackam and D. Swigon (2011). "Continuum Model of
Collective Cell Migration in Wound Healing and Colony Expansion." Biophysical Journal 100(3): 535-543.
References
156
Attawia, M. A., J. E. Devin and C. T. Laurencin (1995). "Immunofluorescence and Confocal Laser-
Scanning Microscopy Studies of Osteoblast Growth and Phenotypic-Expression in 3-Dimensional Degradable Synthetic Matrices." Journal of Biomedical Materials Research
29(7): 843-848.
Backouche, F., L. Haviv, D. Groswasser and A. Bernheim-Groswasser (2006). "Active gels: dynamics
of patterning and self-organization." Physical Biology 3(4): 264-273.
Baneyx, G., L. Baugh and V. Vogel (2002). "Fibronectin extension and unfolding within cell matrix
fibrils controlled by cytoskeletal tension." Proceedings of the National Academy of Sciences
of the United States of America 99(8): 5139-5139.
Bar-Ziv, R., T. Tlusty, E. Moses, S. Safran and A. Bershadsky (1999). "Pearling in cells: A clue to
understanding cell shape." Proceedings of the National Academy of Sciences 96(18): 10140-
10145.
Barocas, V. H. and R. T. Tranquillo (1997). "An anisotropic biphasic theory of tissue-equivalent
mechanics: The interplay among cell traction, fibrillar network deformation, fibril alignment,
and cell contact guidance." Journal of Biomechanical Engineering-Transactions of the Asme
119(2): 137-145.
Barrales Mora, L. A., G. Gottstein and L. S. Shvindlerman (2008). "Three-dimensional grain growth:
Analytical approaches and computer simulations." Acta Materialia 56(20): 5915-5926.
Basson, C. T., G. S. Cowley, S. D. Solomon, B. Weissman, A. K. Poznanski, T. A. Traill, J. G. Seidman and C. E. Seidman (1994). "The clinical and genetic spectrum of the Holt-Oram
syndrome (Heart-Hand syndrome)." The New England Journal of Medicine 330(13): 885-
891.
Bement, W. M. (2002). "Actomyosin rings: The riddle of the sphincter." Current Biology 12(1): R12-
R14.
Ben-Shlomo, I., S. Yu Hsu, R. Rauch, H. W. Kowalski and A. J. W. Hsueh (2003). "Signaling
Receptome: A Genomic and Evolutionary Perspective of Plasma Membrane Receptors Involved in Signal Transduction." Science's STKE 2003(187): 1-9.
Bentmann, A., N. Kawelke, D. Moss, H. Zentgraf, Y. Bala, I. Berger, J. A. Gasser and I. A.
Nakchbandi (2010). "Circulating Fibronectin Affects Bone Matrix, Whereas Osteoblast Fibronectin Modulates Osteoblast Function." Journal of Bone and Mineral Research 25(4):
706-715.
Bershadsky, A. D., N. Q. Balaban and B. Geiger (2003). "Adhesion-dependent cell
mechanosensitivity." Annual review of cell and developmental biology 19: 677-695.
Besseau, L. and Y. Bouligand (1998). "The twisted collagen network of the box-fish scutes." Tissue
& Cell 30(2): 251-260.
Bidan, C. M., P. Kollmannsberger, K. P. Kommareddy, M. Rumpler, Y. J. M. Bréchet, P. Fratzl and J. W. C. Dunlop (2012a). From cell contractility to curvature-controlled tissue growth. CMBBE.
Berlin.
Bidan, C. M., K. P. Kommareddy, M. Rumpler, P. Kollmannsberger, Y. J. M. Brechet, P. Fratzl and J. W. C. Dunlop (2012b). "How Linear Tension Converts to Curvature: Geometric Control of
Bone Tissue Growth." PLoS ONE 7(5): e36336.

References
157
Bidan, C. M., K. P. Kommareddy, M. Rumpler, P. Kollmannsberger, P. Fratzl and J. W. C. Dunlop
(2012c). "Geometry as a factor for tissue growth: Towards shape optimization of tissue engineering scaffolds." Advanced Healthcare Materials in press.
Bischofs, I., S. Schmidt and U. Schwarz (2009). "Effect of Adhesion Geometry and Rigidity on
Cellular Force Distributions." Physical Review Letters 103(4): 048101.048101-048104.
Bischofs, I. and U. Schwarz (2006). "Collective effects in cellular structure formation mediated by compliant environments: A Monte Carlo study." Acta Biomaterialia 2(3): 253-265.
Bischofs, I. B., F. Klein, D. Lehnert, M. Bastmeyer and U. S. Schwarz (2008). "Filamentous network
mechanics and active contractility determine cell and tissue shape." Biophysical Journal 95(7): 3488-3496.
Bischofs, I. B. and U. S. Schwarz (2003). "Cell organization in soft media due to active
mechanosensing." Proceedings of the National Academy of Sciences 100(16): 9274–9279-9274–9279.
Biton, Y. Y. and S. A. Safran (2009). "The cellular response to curvature-induced stress." Physical
Biology 6(4): 046010.046011-046018.
Bokel, C. and N. H. Brown (2002). "Integrins in development: Moving on, responding to, and sticking to the extracellular matrix." Developmental Cell 3(3): 311-321.
Bonewald, L. F. and M. L. Johnson (2008). "Osteocytes, mechanosensing and Wnt signaling." Bone
42(4): 606-615.
Boote, C., S. Dennis, Y. Huang, A. J. Quantock and K. M. Meek (2005). "Lamellar orientation in
human cornea in relation to mechanical properties." Journal of Structural Biology 149(1): 1-6.
Bouligand, Y., J. P. Denefle, J. P. Lechaire and M. Maillard (1985). "Twisted Architectures in Cell-Free Assembled Collagen Gels - Study of Collagen Substrates Used for Cultures." Biology of
the Cell 54(2): 143-161.
Bouligand.Y (1972). "Twisted Fibrous Arrangements in Biological-Materials and Cholesteric
Mesophases." Tissue & Cell 4(2): 189-217.
Brakebusch, C. and R. Fassler (2003). "The integrin-actin connection, an eternal love affair." Embo
Journal 22(10): 2324-2333.
Brock, A., E. Chang, C. C. Ho, P. LeDuc, X. Y. Jiang, G. M. Whitesides and D. E. Ingber (2003). "Geometric determinants of directional cell motility revealed using microcontact printing."
Langmuir 19(5): 1611-1617.
Bullard, J. W., E. J. Garboczi, W. C. Carter and E. R. Fuller Jr (1995). "Numerical methods for
computing interfacial mean curvature." Computational Materials Science 4(2): 103-116.
Burger, E. H. and J. Klein-Nulend (1999). "Mechanotransduction in bone - role of the lacuno-
canalicular network." FASEB Journal 13(9001): S101-S112.
Butler, L. C., G. B. Blanchard, A. J. Kabla, N. J. Lawrence, D. P. Welchman, L. Mahadevan, R. J. Adams and B. Sanson (2009). "Cell shape changes indicate a role for extrinsic tensile forces
in Drosophila germ-band extension." Nature Cell Biology 11(7): 859-864.

References
158
Byrne, H. and D. Drasdo (2008). "Individual-based and continuum models of growing cell
populations: a comparison." Journal of Mathematical Biology 58(4-5): 657-687.
Cai, Y. F. and M. P. Sheetz (2009). "Force propagation across cells: mechanical coherence of
dynamic cytoskeletons." Current Opinion in Cell Biology 21(1): 47-50.
Camazine, S., J.-L. Deneubourg, N. R. Franks, J. Sneyd, G. Theraulaz and E. Bonabeau (2001). Self-
Organization in Biological Systems. Princeton, Princeton University Press.
Cao, D., W. Liu, X. Wei, F. Xu, L. Cui and Y. Cao (2006). "In vitro tendon engineering with avian
tenocytes and polyglycolic acids: a preliminary report." Tissue Engineering 12(5): 1369-1377.
Carmeliet, G., L. Vico and R. Bouillon (2001). "Space flight: A challenge for normal bone homeostasis." Critical Reviews in Eukaryotic Gene Expression 11(1-3): 131-144.
Cavalcanti-Adam, E., T. Volberg, A. Micoulet, H. Kessler, B. Geiger and J. Spatz (2007). "Cell
Spreading and Focal Adhesion Dynamics Are Regulated by Spacing of Integrin Ligands." Biophysical Journal 92(8): 2964-2974.
Chan, D., S. R. Lamande, W. G. Cole and J. F. Bateman (1990). "Regulation of Procollagen Synthesis
and Processing during Ascorbate-Induced Extracellular-Matrix Accumulation Invitro."
Biochemical Journal 269(1): 175-181.
Checa, S. and P. J. Prendergast (2009). "A Mechanobiological Model for Tissue Differentiation that
Includes Angiogenesis: A Lattice-Based Modeling Approach." Annals of Biomedical
Engineering 37(1): 129-145.
Chen, C. S., M. Mrksich, S. Huang, G. M. Whitesides and D. E. Ingber (1997). "Geometric control of
cell life and death." Science 276(5317): 1425-1428.
Chen, C. S., J. Tan and J. Tien (2004). "Mechanotransduction at cell-matrix and cell-cell contacts." Annual Review of Biomedical Engineering 6(1): 275-302.
Chen, V. J., L. A. Smith and P. X. Ma (2006). "Bone regeneration on computer-designed nano-fibrous
scaffolds." Biomaterials 27(21): 3973-3979.
Cipitria, A., C. Lange, H. Schell, W. Wagermaier, J. C. Reichert, D. W. Hutmacher, P. Fratzl and G. N. Duda (2012). "Porous scaffold architecture guides tissue formation." Journal of Bone and
Mineral Research 27(6): 1275-1288.
Cordonnier, T., P. Layrolle, J. Gaillard, A. Langonné, L. Sensebé, P. Rosset and J. Sohier (2010). "3D environment on human mesenchymal stem cells differentiation for bone tissue engineering."
Journal of Materials Science: Materials in Medicine 21(3): 981-987.
Corin, K. A. and L. J. Gibson (2010). "Cell contraction forces in scaffolds with varying pore size and
cell density." Biomaterials 31(18): 4835–4845.
Cowin, S. (1999). "Bone poroelasticity." Journal of Biomechanics 32(3): 217-238.
Cowin, S. C. (2004). "Tissue growth and remodeling." Annual Review of Biomedical Engineering
6(1): 77-107.
Cox, B. (2010). "A multi-scale, discrete-cell simulation of organogenesis: Application to the effects of
strain stimulus on collective cell behavior during ameloblast migration." Journal of theoretical
biology 262(1): 58-72.
References
159
Cukierman, E., R. Pankov, D. R. Stevens and K. M. Yamada (2001). "Taking cell-matrix adhesions to
the third dimension." Science 294(5547): 1708-1708.
Cuvelier, D., M. Thery, Y. S. Chu, S. Dufour, J. P. Thiery, M. Bornens, P. Nassoy and L. Mahadevan
(2007). "The universal dynamics of cell spreading." Current Biology 17(8): 694-699.
Dalby, M. J., N. Gadegaard, R. Tare, A. Andar, M. O. Riehle, P. Herzyk, C. D. W. Wilkinson and R.
O. C. Oreffo (2007). "The control of human mesenchymal cell differentiation using nanoscale symmetry and disorder." Nature Materials 6(12): 997-1003.
Danen, E. H. J. and K. M. Yamada (2001). "Fibronectin, integrins, and growth control." Journal of
Cellular Physiology 189(1): 1-13.
Daxer, A. and P. Fratzl (1997). "Collagen fibril orientation in the human corneal stroma and its
implication in keratoconus." Investigative Ophthalmology & Visual Science 38(1): 121-129.
De Micco, V. and G. Aronne (2007). "Combined histochemistry and autofluorescence for identifying lignin distribution in cell walls." Biotechnic & Histochemistry 82(4/5): 209-216.
Desai, R. A., L. Gao, S. Raghavan, W. F. Liu and C. S. Chen (2009). "Cell polarity triggered by cell-
cell adhesion via E-cadherin." Journal of Cell Science 122(7): 905-911.
Deshpande, V. S., M. Mrksich, R. M. McMeeking and A. G. Evans (2008). "A bio-mechanical model for coupling cell contractility with focal adhesion formation." Journal of the Mechanics and
Physics of Solids 56(4): 1484–1510.
Dike, L. E., C. S. Chen, M. Mrksich, J. Tien, G. M. Whitesides and D. E. Ingber (1999). "Geometric control of switching between growth, apoptosis, and differentiation during angiogenesis using
micropatterned substrates." In Vitro Cellular & Developmental Biology-Animal 35(8): 441-
448.
Ding, Y. F., J. R. Sun, H. W. Ro, Z. Wang, J. Zhou, N. J. Lin, M. T. Cicerone, C. L. Soles and S. Lin-
Gibson (2011). "Thermodynamic Underpinnings of Cell Alignment on Controlled
Topographies." Advanced Materials 23(3): 421-425.
Discher, D. E., P. Janmey and Y. Wang (2005). "Tissue cells feel and respond to the stiffness of their substrate." Science 310(5751): 1139-1139.
Drasdo, D., S. Hoehme and M. Block (2007). "On the Role of Physics in the Growth and Pattern
Formation of Multi-Cellular Systems: What can we Learn from Individual-Cell Based Models?" Journal of Statistical Physics 128(1-2): 287-345.
Driessen, N. J. B., W. Wilson, C. V. C. Bouten and F. P. T. Baaijens (2004). "A computational model
for collagen fibre remodelling in the arterial wall." Journal of Theoretical Biology 226(1): 53-
64.
Dumais, J., S. L. Shaw, C. R. Steele, S. R. Long and P. M. Ray (2006). "An anisotropic-viscoplastic
model of plant cell morphogenesis by tip growth." The International Journal of
Developmental Biology 50(2-3): 209-222.
Dunlop, J. W. C., F. D. Fischer, E. Gamsjager and P. Fratzl (2010). "A theoretical model for tissue
growth in confined geometries." Journal of the Mechanics and Physics of Solids 58(8): 1073-
1087.
References
160
Dunlop, J. W. C. and P. Fratzl (2010). "Biological Composites." Annual Review of Materials
Research 40(1): 1-24.
Dunn, K. W. and P. A. Young (2006). "Principles of Multiphoton Microscopy." Nephron
Experimental Nephrology 103(2): e33-e40-e33-e40.
Engelmayr, G. C. and others (2006). "Guidance of engineered tissue collagen orientation by large-
scale scaffold microstructures." Journal of Biomechanics 39(10): 1819-1831.
Engler, A. J., L. Richert, J. Y. Wong, C. Picart and D. E. Discher (2004). "Surface probe
measurements of the elasticity of sectioned tissue, thin gels and polyelectrolyte multilayer
films: correlations between substrate stiffness and cell adhesion." Surface Science 570(1-2): 142-154.
Engler, A. J., S. Sen, H. L. Sweeney and D. E. Discher (2006). "Matrix elasticity directs stem cell
lineage specification." Cell 126(4): 677-689.
Epari, D. R., H. Schell, H. J. Bail and G. N. Duda (2006). "Instability prolongs the chondral phase
during bone healing in sheep." Bone 38(6): 864-870.
Epstein, M. and G. A. Maugin (2000). "Thermomechanics of volumetric growth in uniform bodies."
International Journal of Plasticity 16: 951-978.
Eriksen, E. F. (2010). "Cellular mechanisms of bone remodeling." Reviews in Endocrine and
Metabolic Disorders 11(4): 219-227.
Etienne-Manneville, S. and A. Hall (2002). "Rho GTPases in cell biology." Nature 420(6916): 629-635.
Fabry, B., G. N. Maksym, J. P. Butler, M. Glogauer, D. Navajas and J. J. Fredberg (2001). "Scaling
the Microrheology of Living Cells." Physical Review Letters 87(14): 148102.
Farhadifar, R., J. C. Röper, B. Aigouy, S. Eaton and F. Jülicher (2007). "The influence of cell
mechanics, cell-cell interactions, and proliferation on epithelial packing." Current Biology
17(24): 2095-2104.
Fernandez, P. and A. R. Bausch (2009). "The compaction of gels by cells: a case of collective mechanical activity." Integrative Biology 1(3): 252–259.
Fletcher, D. A. and R. D. Mullins (2010). "Cell mechanics and the cytoskeleton." Nature 463(7280):
485-492.
Forgacs, G., S. A. Newman, Z. Polikova and A. W. Neumann (1994). "Critical phenomena in model
biological tissues." Colloids and Surfaces B: Biointerfaces 3(3): 139-146.
Foty, R. A., G. Forgacs, C. M. Pfleger and M. S. Steinberg (1994). "Liquid properties of embryonic
tissues: Measurement of interfacial tensions." Physical Review Letters 72(14): 2298-2301.
Foty, R. A., C. M. Pfleger, G. Forgacs and M. S. Steinberg (1996). "Surface tensions of embryonic
tissues predict their mutual envelopment behavior." Development 122(5): 1611-1611.
Foty, R. A. and M. S. Steinberg (2005). "The differential adhesion hypothesis: a direct evaluation." Developmental Biology 278(1): 255-263.
References
161
Franck, C., S. Hong, S. Maskarinec, D. Tirrell and G. Ravichandran (2007). "Three-dimensional Full-
field Measurements of Large Deformations in Soft Materials Using Confocal Microscopy and Digital Volume Correlation." Experimental Mechanics 47(3): 427-438.
Frantz, C., K. M. Stewart and V. M. Weaver (2010). "The extracellular matrix at a glance." Journal of
Cell Science 123(24): 4195-4200.
Fratzl, P. (2007). "Biomimetic materials research: what can we really learn from nature’s structural materials?" Journal of the Royal Society Interface 4(15): 637-642.
Fratzl, P., H. S. Gupta, E. P. Paschalis and P. Roschger (2004). "Structure and mechanical quality of
the collagen-mineral nano-composite in bone." Journal of Materials Chemistry 14(14): 2115-2123.
Fratzl, P. and R. Weinkamer (2007). "Nature’s hierarchical materials." Progress in Materials Science
52(8): 1263-1334.
Freed, L. E., G. C. Engelmayr, J. T. Borenstein, F. T. Moutos and F. Guilak (2009). "Advanced
Material Strategies for Tissue Engineering Scaffolds." Advanced Materials 21(32-33): 3410-
3418.
Frette, O. I., G. Virnovsky and D. Silin (2009). "Estimation of the curvature of an interface from a digital 2D image." Computational Materials Science 44(3): 867-875.
Friedl, P., K. Wolf, G. Harms and U. H. Andrian (2007). "Biological second and third harmonic
generation microscopy." Current Protocols in Cell Biology.
Frost, H. M. (1987). "Bone Mass and the Mechanostat - a Proposal." Anatomical Record 219(1): 1-9.
Fujita, S., M. Ohshima and H. Iwata (2009). "Time-lapse observation of cell alignment on
nanogrooved patterns." Journal of the Royal Society Interface 6: S269-S277.
Gamsjäger, E., C. M. Bidan, F. D. Fischer, P. Fratzl and J. W. C. Dunlop (2012). "Modelling the role
of surface stress on the kinetics of tissue growth in confined geometries." Acta Biomaterialia
in press.
Garikipati, K. (2009). "The Kinematics of Biological Growth." Applied Mechanics Reviews 62(3): 030801.030801-030807.
Garikipati, K., J. E. Olberding, H. Narayanan, E. M. Arruda, K. Grosh and S. Calve (2006).
"Biological remodelling: Stationary energy, configurational change, internal variables and dissipation." Journal of the Mechanics and Physics of Solids 54(7): 1493-1515.
Geiger, B. and O. Ayalon (1992). "Cadherins." Annual Review of Cell Biology 8: 307-332.
Geiger, B., J. P. Spatz and A. D. Bershadsky (2009). "Environmental sensing through focal
adhesions." Nature Reviews Molecular Cell Biology 10(1): 21–33.
Gelse, K. (2003). "Collagens-structure, function, and biosynthesis." Advanced Drug Delivery
Reviews 55(12): 1531-1546.
Gentile, F., L. Tirinato, E. Battista, F. Causa, C. Liberale, E. M. di Fabrizio and P. Decuzzi (2010). "Cells preferentially grow on rough substrates." Biomaterials 31(28): 7205-7212.

References
162
Gerstenfeld, L. C., A. Riva, K. Hodgens, D. R. Eyre and W. J. Landis (1993). "Post-translational
control of collagen fibrillogenesis in mineralizing cultures of chick osteoblasts." Journal of Bone and Mineral Research 8(9): 1031-1043.
Giancotti, F. G. and E. Ruoslahti (1999). "Transduction - Integrin signaling." Science 285(5430):
1028-1032.
Gibson, L. J. (2005). "Biomechanics of cellular solids." Journal of Biomechanics 38(3): 377-399.
Giraud-Guille, M.-M., E. Belamie, G. Mosser, C. Helary, F. Gobeaux and S. Vigier (2008). "Liquid
crystalline properties of type I collagen: Perspectives in tissue morphogenesis." Comptes
Rendus Chimie 11(3): 245-252.
Giraud-Guille, M. M. (1988). "Twisted plywood architecture of collagen fibrils in human compact
bone osteons." Calcified Tissue International 42(3): 167-180.
Giraud-Guille, M. M. (1998). "Plywood structures in nature." Current Opinion in Solid State and Materials Science 3(3): 221-227.
Giraud-Guille, M. M., G. Mosser, C. Helary and D. Eglin (2005). "Bone matrix like assemblies of
collagen: From liquid crystals to gels and biomimetic materials." Micron 36(7-8): 602-608.
Glazier, J. A. and F. Graner (1993). "Simulation of the Differential Adhesion Driven Rearrangement of Biological Cells." Physical Review E 47(3): 2128-2154.
Glazier, J. A. and D. Weaire (1992). "The Kinetics of Cellular-Patterns." Journal of Physics-
Condensed Matter 4(8): 1867-1894.
Glazier, J. A., Y. Zhang, M. Swat, B. Zaitlen and S. Schnell (2008). "Coordinated action of N-CAM,
N-cadherin, EphA4, and ephrinB2 translates genetic prepatterns into structure during
somitogenesis in chick." Current Topics in Developmental Biology 81: 205-247.
Graner, F. and J. A. Glazier (1992). "Simulation of Biological Cell Sorting Using a 2-Dimensional
Extended Potts-Model." Physical Review Letters 69(13): 2013-2016.
Graziano, A., R. d'Aquino, M. G. Cusella-De Angelis, G. Laino, A. Piattelli, M. Pacifici, A. De Rosa
and G. Papaccio (2007). "Concave Pit-Containing Scaffold Surfaces Improve Stem Cell-Derived Osteoblast Performance and Lead to Significant Bone Tissue Formation." PLoS ONE
2(6): e496.
Grinnell, F. and C. R. Lamke (1984). "Reorganization of hydrated collagen lattices by human-skin fibroblasts." Journal of Cell Science 66(MAR): 51-63.
Grinnell, F. and W. M. Petroll (2010). "Cell Motility and Mechanics in Three-Dimensional Collagen
Matrices." Annual review of cell and developmental biology 26: 335-361.
Guerrini, R. and C. Marini (2006). "Genetic malformations of cortical development." Experimental Brain Research 173(2): 322-333.
Gunawan, R. C., J. Silvestre, H. R. Gaskins, P. J. A. Kenis and D. E. Leckband (2006). "Cell
migration and polarity on microfabricated gradients of extracellular matrix proteins." Langmuir 22(9): 4250-4258.

References
163
Guthold, M., W. Liu, E. A. Sparks, L. M. Jawerth, L. Peng, M. Falvo, R. Superfine, R. R. Hantgan
and S. T. Lord (2007). "A Comparison of the Mechanical and Structural Properties of Fibrin Fibers with Other Protein Fibers." Cell Biochemistry and Biophysics 49(3): 165-181.
Halliday, N. L. and J. J. Tomasek (1995). "Mechanical-Properties of the Extracellular-Matrix
Influence Fibronectin Fibril Assembly in-Vitro." Experimental cell research 217(1): 109-117.
Harland, B., S. Walcott and S. X. Sun (2011). "Adhesion dynamics and durotaxis in migrating cells." Physical Biology 8: 015011-015011.
Harris, A. K., D. Stopak and P. Wild (1981). "Fibroblast Traction as a Mechanism for Collagen
Morphogenesis." Nature 290(5803): 249-251.
Hayashi, T. and R. W. Carthew (2004). "Surface mechanics mediate pattern formation in the
developing retina." Nature 431(7009): 647-652.
Helmchen, F. and W. Denk (2005). "Deep tissue two-photon microscopy." Nature Methods 2(12): 932-940.
Hilgenfeldt, S., S. Erisken and R. W. Carthew (2008). "Physical modeling of cell geometric order in
an epithelial tissue." Proceedings of the National Academy of Sciences 105(3): 907-911.
Hinton, R. B. (2006). "Extracellular Matrix Remodeling and Organization in Developing and Diseased Aortic Valves." Circulation Research 98(11): 1431-1438.
Hocking, D. C., J. Sottile and K. J. Langenbach (2000). "Stimulation of integrin-mediated cell
contractility by fibronectin polymerization." Journal of Biological Chemistry 275(14): 10673-10682.
Hollister, S. J. (2005). "Porous scaffold design for tissue engineering." Nature Materials 4(7): 518-
524.
Honda, H., M. Tanemura and T. Nagai (2004). "A three-dimensional vertex dynamics cell model of
space-filling polyhedra simulating cell behavior in a cell aggregate." Journal of Theoretical
Biology 226(4): 439-453.
Huang, J. H., S. V. Grater, F. Corbellinl, S. Rinck, E. Bock, R. Kemkemer, H. Kessler, J. D. Ding and J. P. Spatz (2009). "Impact of Order and Disorder in RGD Nanopatterns on Cell Adhesion."
Nano Letters 9(3): 1111-1116.
Huang, S., C. P. Brangwynne, K. K. Parker and D. E. Ingber (2005). "Symmetry-breaking in mammalian cell cohort migration during tissue pattern formation: Role of random-walk
persistence." Cell Motility and the Cytoskeleton 61(4): 201-213.
Huang, S. and D. E. Ingber (2000). "Shape-dependent control of cell growth, differentiation, and
apoptosis: Switching between attractors in cell regulatory networks." Experimental Cell Research 261(1): 91-103.
Huebsch, N. and D. J. Mooney (2009). "Inspiration and application in the evolution of biomaterials."
Nature 462(7272): 426-432.
Huiskes, R., R. Ruimerman, G. H. Van Lenthe and J. D. Janssen (2000). "Effects of mechanical forces
on maintenance and adaptation of form in trabecular bone." Nature 405: 704-706.
References
164
Hutmacher, D. W. (2000). "Scaffolds in tissue engineering bone and cartilage." Biomaterials 21(24):
2529-2543.
Hutmacher, D. W. (2001). "Scaffold design and fabrication technologies for engineering tissues - state
of the art and future perspectives." Journal of Biomaterials Science-Polymer Edition 12(1):
107-124.
Hutmacher, D. W., J. T. Schantz, C. X. F. Lam, K. C. Tan and T. C. Lim (2007). "State of the art and future directions of scaffold-based bone engineering from a biomaterials perspective." Journal
of Tissue Engineering and Regenerative Medicine 1(4): 245-260.
Hutmacher, D. W., T. Schantz, I. Zein, K. W. Ng, S. H. Teoh and K. C. Tan (2001). "Mechanical properties and cell cultural response of polycaprolactone scaffolds designed and fabricated via
fused deposition modeling." Journal of Biomedical Materials Research 55(2): 203-216.
Hutmacher, D. W., M. Sittinger and M. V. Risbud (2004). "Scaffold-based tissue engineering: rationale for computer-aided design and solid free-form fabrication systems." Trends in
Biotechnology 22(7): 354-362.
Hynes, R. O. (2009). "The Extracellular Matrix: Not Just Pretty Fibrils." Science 326(5957): 1216-
1219.
Ingber, D. (2003). "Mechanobiology and diseases of mechanotransduction." Annals of Medicine
35(8): 564-577.
Inkson, C. A., M. Ono, Y. Bi, S. A. Kuznetsov, L. W. Fisher and M. F. Young (2009). "The Potential Functional Interaction of Biglycan and WISP-1 in Controlling Differentiation and
Proliferation of Osteogenic Cells." Cells Tissues Organs 189(1-4): 153-157.
Jamal, M., N. Bassik, J.-H. Cho, C. L. Randall and D. H. Gracias (2010). "Directed growth of fibroblasts into three dimensional micropatterned geometries via self-assembling scaffolds."
Biomaterials 31(7): 1683-1690.
Jämsä, T., J.-Y. Rho, Z. Fan, C. A. MacKay, S. C. Marks Jr and J. Tuukkanen (2002). "Mechanical
properties in long bones of rat osteopetrotic mutations." Journal of Biomechanics 35(2): 161-165.
Janmey, P. and Schmidt (2006). Experimental measurements of intracellular mechanics. Cytoskeletal
Mechanics: Models and Measurements. Cambridge: 18-49.
Javierre, E., F. J. Vermolen, C. Vuik and S. Zwaag (2008). "A mathematical analysis of physiological
and morphological aspects of wound closure." Journal of Mathematical Biology 59(5): 605-
630.
Jeon, J., V. Quaranta and P. T. Cummings (2010). "An Off-Lattice Hybrid Discrete-Continuum Model of Tumor Growth and Invasion." Biophysical Journal 98(1): 37-47.
Jiang, X. Y., D. A. Bruzewicz, A. P. Wong, M. Piel and G. M. Whitesides (2005). "Directing cell
migration with asymmetric micropatterns." Proceedings of the National Academy of Sciences 102(4): 975-978.
Jinnai, H., Y. Nishikawa, M. Ito, S. D. Smith, D. A. Agard and R. J. Spontak (2002a). "Topological
similarity of sponge-like bicontinuous morphologies differing in length scale." Advanced Materials 14(22): 1615-1618.
References
165
Jinnai, H., H. Watashiba, T. Kajihara, Y. Nishikawa, M. Takahashi and M. Ito (2002b). "Surface
curvatures of trabecular bone microarchitecture." Bone 30(1): 191-194.
Kadler, K. E., A. Hill and E. G. Canty-Laird (2008). "Collagen fibrillogenesis: fibronectin, integrins,
and minor collagens as organizers and nucleators." Current Opinion in Cell Biology 20(5):
495-501.
Kafer, J. (2007). "Cell adhesion and cortex contractility determine cell patterning in the Drosophila retina." Proceedings of the National Academy of Sciences 104(47): 18549-18554.
Kaiser, J. P., A. Reinmann and A. Bruinink (2006). "The effect of topographic characteristics on cell
migration velocity." Biomaterials 27(30): 5230-5241.
Kemkemer, R., C. Neidlinger-Wilke, L. Claes and H. Gruler (1999). "Cell orientation induced by
extracellular signals." Cell Biochemistry and Biophysics 30(2): 167-192.
Kerschnitzki, M., W. Wagermaier, Y. F. Liu, P. Roschger, G. N. Duda and P. Fratzl (2011a). "Poorly Ordered Bone as an Endogenous Scaffold for the Deposition of Highly Oriented Lamellar
Tissue in Rapidly Growing Ovine Bone." Cells Tissues Organs 194(2-4): 119-123.
Kerschnitzki, M., W. Wagermaier, P. Roschger, J. Seto, R. Shahar, G. N. Duda, S. Mundlos and P.
Fratzl (2011b). "The organization of the osteocyte network mirrors the extracellular matrix orientation in bone." Journal of Structural Biology 173(2): 303-311.
Kiehart, D. P., C. G. Galbraith, K. A. Edwards, W. L. Rickoll and R. A. Montague (2000). "Multiple
forces contribute to cell sheet morphogenesis for dorsal closure in Drosophila." Journal of Cell biology 149(2): 471-490.
Kilian, K. A., B. Bugarija, B. T. Lahn and M. Mrksich (2010). "Geometric cues for directing the
differentiation of mesenchymal stem cells." Proceedings of the National Academy of Sciences 107(11): 4872-4877.
Klotzsch, E., M. L. Smith, K. E. Kubow, S. Muntwyler, W. C. Little, F. Beyeler, D. Gourdon, B. J.
Nelson and V. Vogel (2009). "Fibronectin forms the most extensible biological fibers
displaying switchable force-exposed cryptic binding sites." Proceedings of the National Academy of Sciences 106(43): 18267-18272.
Kollmannsberger, P., C. M. Bidan, J. W. C. Dunlop and P. Fratzl (2011). "The physics of tissue
patterning and extracellular matrix organisation: how cells join forces." Soft Matter 7(20): 9549-9560.
Kommareddy, K. P., C. Lange, M. Rumpler, J. W. C. Dunlop, I. Manjubala, J. Cui, K. Kratz, A.
Lendlein and P. Fratzl (2010). "Two stages in three-dimensional in vitro growth of tissue
generated by osteoblastlike cells." Biointerphases 5(2): 45-52.
Kraning-Rush, C. M., S. P. Carey, J. P. Califano, B. N. Smith and C. A. Reinhart-King (2011). "The
role of the cytoskeleton in cellular force generation in 2D and 3D environments." Physical
Biology 8: 015009-015009.
Krauss, S., W. Wagermaier, J. A. Estevez, J. D. Currey and P. Fratzl (2011). "Tubular frameworks
guiding orderly bone formation in the antler of the red deer (Cervus elaphus)." Journal of
Structural Biology 175(3): 457-464.
References
166
Krieg, M., Y. Arboleda-Estudillo, P. H. Puech, J. Käfer, F. Graner, D. J. Müller and C. P. Heisenberg
(2008). "Tensile forces govern germ-layer organization in zebrafish." Nature Cell Biology 10(4): 429-436.
Kroon, M. (2010). "A continuum mechanics framework and a constitutive model for remodelling of
collagen gels and collagenous tissues." Journal of the Mechanics and Physics of Solids 58(6):
918-933.
Kuchen, E. E., S. Fox, P. Barbier de Reuille, R. Kennaway, S. Bensmihen, J. Avondo, G. M. Calder,
P. Southam, S. Robinson, A. Bangham and E. Coen (2012). "Generation of Leaf Shape
Through Early Patterns of Growth and Tissue Polarity." Science 335(6072): 1092-1096.
Kuhl, E. and G. A. Holzapfel (2007). "A continuum model for remodeling in living structures."
Journal of Materials Science 42(21): 8811-8823.
Kulangara, K. and K. W. Leong (2009). "Substrate topography shapes cell function." Soft Matter 5(21): 4072.
Kumar, G., C. K. Tison, K. Chatterjee, P. S. Pine, J. H. McDaniel, M. L. Salit, M. F. Young and C. G.
Simon Jr (2011). "The determination of stem cell fate by 3D scaffold structures through the
control of cell shape." Biomaterials 32(35): 9188-9196.
Kumar, S., I. Maxwell, A. Heisterkamp, T. Polte, T. Lele, M. Salanga, E. Mazur and D. Ingber
(2006). "Viscoelastic Retraction of Single Living Stress Fibers and Its Impact on Cell Shape,
Cytoskeletal Organization, and Extracellular Matrix Mechanics." Biophysical Journal 90(10): 3762-3773.
Lan Levengood, S. K., S. J. Polak, M. B. Wheeler, A. J. Maki, S. G. Clark, R. D. Jamison and A. J.
Wagoner Johnson (2010). "Multiscale osteointegration as a new paradigm for the design of calcium phosphate scaffolds for bone regeneration." Biomaterials 31(13): 3552-3563.
Latimer, A. and J. R. Jessen (2010). "Extracellular matrix assembly and organization during zebrafish
gastrulation." Matrix Biology 29(2): 89-96.
Lee, M. R., K. W. Kwon, H. Jung, H. N. Kim, K. Y. Suh, K. Kim and K.-S. Kim (2010). "Direct differentiation of human embryonic stem cells into selective neurons on nanoscale
ridge/groove pattern arrays." Biomaterials 31(15): 4360-4366.
Legant, W. R., C. S. Chen and V. Vogel (2012). "Force-induced fibronectin assembly and matrix remodeling in a 3D microtissue model of tissue morphogenesis." Integrative Biology 4(10):
1164-1174.
Legant, W. R., A. Pathak, M. T. Yang, V. S. Deshpande, R. M. McMeeking and C. S. Chen (2009).
"Microfabricated tissue gauges to measure and manipulate forces from 3D microtissues." Proceedings of the National Academy of Sciences 106(25): 10097-10097.
Levina, E. M., L. V. Domnina, Y. A. Rovensky and J. M. Vasiliev (1996). "Cylindrical substratum
induces different patterns of actin microfilament bundles in nontransformed and in ras-transformed epitheliocytes." Experimental cell research 229(1): 159-165.
Lichtenegger, H., A. Reiterer, S. E. Stanzl-Tschegg and P. Fratzl (1999). "Variation of Cellulose
Microfibril Angles in Softwoods and Hardwoods—A Possible Strategy of Mechanical Optimization." Journal of Structural Biology 128(3): 257-269.
References
167
Liu, W. F., C. M. Nelson, D. M. Pirone and C. S. Chen (2006). "E-cadherin engagement stimulates
proliferation via Rac1." Journal of Cell biology 173(3): 431-431.
Liu, Y. F., I. Manjubala, H. Schell, D. R. Epari, P. Roschger, G. N. Duda and P. Fratzl (2010a). "Size
and Habit of Mineral Particles in Bone and Mineralized Callus During Bone Healing in
Sheep." Journal of Bone and Mineral Research 25(9): 2029-2038.
Liu, Z., J. L. Tan, D. M. Cohen, M. T. Yang, N. J. Sniadecki, S. A. Ruiz, C. M. Nelson and C. S. Chen (2010b). "Mechanical tugging force regulates the size of cell–cell junctions."
Proceedings of the National Academy of Sciences 107(22): 9944-9949.
Lohmann, J. U. and D. Weigel (2002). "Building beauty: the genetic control of floral patterning." Developmental Cell 2(2): 135-142.
Luo, W., S. R. Jones and M. N. Yousaf (2008). "Geometric Control of Stem Cell Differentiation Rate
on Surfaces." Langmuir 24(21): 12129-12133.
Mahmud, G., C. J. Campbell, K. J. M. Bishop, Y. A. Komarova, O. Chaga, S. Soh, S. Huda, K.
Kandere-Grzybowska and B. A. Grzybowski (2009). "Directing cell motions on
micropatterned ratchets." Nature Physics 5(8): 606-612.
Maloney, J., E. Walton, C. Bruce and K. Van Vliet (2008). "Influence of finite thickness and stiffness on cellular adhesion-induced deformation of compliant substrata." Physical Review E 78(4):
041923.041921-041915.
Mammoto, T. and D. E. Ingber (2010). "Mechanical control of tissue and organ development." Development 137(9): 1407-1420.
Manjubala, I., A. Woesz, C. Pilz, M. Rumpler, N. Fratzl-Zelman, P. Roschger, J. Stampfl and P.
Fratzl (2005). "Biomimetic mineral-organic composite scaffolds with controlled internal architecture." Journal of Materials Science: Materials in Medicine 16(12): 1111–1119.
Manning, M. L., R. A. Foty, M. S. Steinberg and E. M. Schoetz (2010). "Coaction of intercellular
adhesion and cortical tension specifies tissue surface tension." Proceedings of the National
Academy of Sciences 107(28): 12517-12522.
Maree, A. F. M. and P. Hogeweg (2001). "How amoeboids self-organize into a fruiting body:
Multicellular coordination in Dictyostelium discoideum." Proceedings of the National
Academy of Sciences 98(7): 3879-3883.
Marklein, R. A. and J. A. Burdick (2010). "Controlling Stem Cell Fate with Material Design."
Advanced Materials 22(2): 175-189.
Martin, P. (1997). "Wound Healing - Aiming for Perfect Skin Regeneration." Science 276(5309): 75-
81.
Martin, P. and S. M. Parkhurst (2004). "Parallels between tissue repair and embryo morphogenesis."
Development 131(13): 3021-3034.
Maruthamuthu, V., B. Sabass, U. S. Schwarz and M. L. Gardel (2011). "Cell-ECM traction force modulates endogenous tension at cell–cell contacts." Proceedings of the National Academy of
Sciences 108(12): 4708-4713.

References
168
Maskarinec, S. A., C. Franck, D. A. Tirrell and G. Ravichandran (2009). "Quantifying cellular
traction forces in three dimensions." Proceedings of the National Academy of Sciences 106(52): 22108-22113.
Matziolis, G., J. Tuischer, G. Kasper, M. Thompson, B. Bartmeyer, D. Krocker, C. Perka and G. Duda
(2006). "Simulation of cell differentiation in fracture healing: Mechanically loaded composite
scaffolds in a novel bioreactor system." Tissue Engineering 12(1): 201-208.
Melchels, F. P. W., A. M. C. Barradas, C. A. van Blitterswijk, J. de Boer, J. Feijen and D. W. Grijpma
(2010). "Effects of the architecture of tissue engineering scaffolds on cell seeding and
culturing." Acta Biomaterialia 6(11): 4208-4217.
Melchels, F. P. W., B. Tonnarelli, A. L. Olivares, I. Martin, D. Lacroix, J. Feijen, D. J. Wendt and D.
W. Grijpma (2011). "The influence of the scaffold design on the distribution of adhering cells
after perfusion cell seeding." Biomaterials 32(11): 2878-2884.
Metzger, R. J. (1999). "Genetic Control of Branching Morphogenesis." Science 284(5420): 1635-
1639.
Mikos, A. G., A. J. Thorsten, L. A. Czerwonka, Y. Bao and R. Langer (1994). "Preparation and
characterization of poly(L-lactic acid) foams." Polymer 35(5): 1068-1077.
Misof, B. M., S. Gamsjaeger, A. Cohen, B. Hofstetter, P. Roschger, E. Stein, T. L. Nickolas, H. F.
Rogers, D. Dempster, H. Zhou, R. Recker, J. Lappe, D. McMahon, E. P. Paschalis, P. Fratzl,
E. Shane and K. Klaushofer (2012). "Bone material properties in premenopausal women with idiopathic osteoporosis." Journal of Bone and Mineral Research.
Mitrossilis, D., J. Fouchard, A. Guiroy, N. Desprat, N. Rodriguez, B. Fabry and A. Asnacios (2009).
"Single-cell response to stiffness exhibits muscle-like behavior." Proceedings of the National Academy of Sciences 106(43): 18243-18248.
Moelans, N., B. Blanpain and P. Wollants (2007). "An introduction to phase-field modeling of
microstructure evolution." Calphad 32(2): 268-294.
Moretti, F. A., A. K. Chauhan, A. Iaconcig, F. Porro, F. E. Baralle and A. F. Muro (2007). "A major fraction of fibronectin present in the extracellular matrix of tissues is plasma-derived."
Journal of Biological Chemistry 282(38): 28057-28062.
Narayanan, H., S. N. Verner, K. L. Mills, R. Kemkemer and K. Garikipati (2010). "In silico estimates of the free energy rates in growing tumor spheroids." Journal of Physics-Condensed Matter
22(19): 194122.
Nelson, C. M. (2009). "Geometric control of tissue morphogenesis." Biochimica et Biophysica Acta
(BBA) - Molecular Cell Research 1793(5): 903-910.
Nelson, C. M. and M. J. Bissell (2006). "Of extracellular matrix, scaffolds, and signaling: tissue
architecture regulates development, homeostasis, and cancer." Annual review of cell and
developmental biology 22: 287-287.
Nelson, C. M., R. P. Jean, J. L. Tan, W. F. Liu, N. J. Sniadecki, A. A. Spector and C. S. Chen (2005).
"Emergent patterns of growth controlled by multicellular form and mechanics." Proceedings
of the National Academy of Sciences 102(33): 11594-11599.
References
169
Nelson, C. M., M. M. VanDuijn, J. L. Inman, D. A. Fletcher and M. J. Bissell (2006). "Tissue
Geometry Determines Sites of Mammary Branching Morphogenesis in Organotypic Cultures." Science 314(5797): 298-300.
Neville, A. C. (1993). Biology of fibrous composites : development beyond the cell membrane / A.C.
Neville. New York, NY, USA :, Cambridge University Press.
Nichols, J., J. Cortiella, J. Lee, J. Niles, M. Cuddihy, S. Wang, J. Bielitzki, A. Cantu, R. Mlcak and E. Valdivia (2009). "In vitro analog of human bone marrow from 3D scaffolds with biomimetic
inverted colloidal crystal geometry." Biomaterials 30(6): 1071-1079.
Nicolella, D. P., D. E. Moravits, A. M. Gale, L. F. Bonewald and J. Lankford (2006). "Osteocyte lacunae tissue strain in cortical bone." Journal of Biomechanics 39(9): 1735-1743.
Niziolek, P. J., T. L. Farmer, Y. Cui, C. H. Turner, M. L. Warman and A. G. Robling (2011). "High-
bone-mass-producing mutations in the Wnt signaling pathway result in distinct skeletal phenotypes." Bone 49(5): 1010-1019.
Novak, I. L., B. M. Slepchenko, A. Mogilner and L. M. Loew (2004). "Cooperativity between cell
contractility and adhesion." Physical Review Letters 93(26): 268109.268101-268104.
Oh, S., K. S. Brammer, Y. S. J. Li, D. Teng, A. J. Engler, S. Chien and S. Jin (2009). "Stem cell fate dictated solely by altered nanotube dimension." Proceedings of the National Academy of
Sciences of the United States of America 106(7): 2130-2135.
Osher, S. (2001). "Level Set Methods: An Overview and Some Recent Results." Journal of Computational Physics 169(2): 463-502.
Ouchi, N. B., J. A. Glazier, J. P. Rieu, A. Upadhyaya and Y. Sawada (2003). "Improving the realism
of the cellular Potts model in simulations of biological cells." Physica a-Statistical Mechanics and Its Applications 329(3-4): 451-458.
Owan, I., D. B. Burr, C. H. Turner, J. Qiu, Y. Tu, J. E. Onyia and R. L. Duncan (1997).
"Mechanotransduction in bone: osteoblasts are more responsive to fluid forces than
mechanical strain." American Journal of Physiology-Cell Physiology 273(3): C810–C815.
Owen, T. A., M. Aronow, V. Shalhoub, L. M. Barone, L. Wilming, M. S. Tassinari, M. B. Kennedy,
S. Pockwinse, J. B. Lian and G. S. Stein (1990). "Progressive development of the rat
osteoblast phenotype in vitro: reciprocal relationships in expression of genes associated with osteoblast proliferation and differentiation during formation of the bone extracellular matrix."
Journal of Cellular Physiology 143(3): 420-430.
Pampaloni, F., E. G. Reynaud and E. H. K. Stelzer (2007). "The third dimension bridges the gap
between cell culture and live tissue." Nature Reviews Molecular Cell Biology 8(10): 839-845.
Parfitt, A. M. (1984). "The cellular basis of bone remodeling: the quantum concept reexamined in
light of recent advances in the cell biology of bone." Calcified Tissue International 36: 37-45.
Parfitt, A. M. (1994). "Osteonal and Hemi-Osteonal Remodeling: The Spatial and Temporal Framework for Signal Traffic in Adult Human Bone." Journal of Cellular Biochemistry 55:
273-286.
Park, J., S. Bauer, K. von der Mark and P. Schmuki (2007). "Nanosize and vitality: TiO2 nanotube diameter directs cell fate." Nano Letters 7(6): 1686-1691.

References
170
Park, J. Y., D. H. Lee, E. J. Lee and S.-H. Lee (2009). "Study of cellular behaviors on concave and
convex microstructures fabricated from elastic PDMS membranes." Lab on a Chip 9(14): 2043-2043.
Paszek, M. J., N. Zahir, K. R. Johnson, J. N. Lakins, G. I. Rozenberg, A. Gefen, C. A. Reinhart-King,
S. S. Margulies, M. Dembo, D. Boettiger and others (2005). "Tensional homeostasis and the
malignant phenotype." Cancer cell 8(3): 241-254.
Pathak, A., V. S. Deshpande, R. M. McMeeking and A. G. Evans (2008). "The simulation of stress
fibre and focal adhesion development in cells on patterned substrates." Journal of the Royal
Society Interface 5(22): 507-524.
Patwari, P. and R. T. Lee (2008). "Mechanical control of tissue morphogenesis." Circulation Research
103(3): 234-243.
Pazzaglia, U. E., T. Congiu, M. Marchese and C. Dell’Orbo (2010). "The shape modulation of osteoblast–osteocyte transformation and its correlation with the fibrillar organization in
secondary osteons." Cell and Tissue Research 340(3): 533-540.
Pazzaglia, U. E., T. Congiu, G. Zarattini, M. Marchese and D. Quacci (2011). "The fibrillar
organisation of the osteon and cellular aspects of its development." Anatomical Science International 86(3): 128-134.
Pelham, R. J. and Y. Wang (1997). "Cell locomotion and focal adhesions are regulated by substrate
flexibility." Proceedings of the National Academy of Sciences 94(25): 13661-13661.
Pellegrin, S. and H. Mellor (2007). "Actin stress fibres." Journal of Cell Science 120(20): 3491-3499.
Petersen, A., P. Joly, C. Bergmann, G. Korus and G. N. Duda (2012). "The Impact of Substrate
Stiffness and Mechanical Loading on Fibroblast-Induced Scaffold Remodeling." Tissue Engineering Part A 18(17-18): 1804-1817.
Petroff, A. P., M. S. Sim, A. Maslov, M. Krupenin, D. H. Rothman and T. Bosak (2010). "Biophysical
basis for the geometry of conical stromatolites." Proceedings of the National Academy of
Sciences 107(22): 9956-9961.
Peyton, S. R., C. M. Ghajar, C. B. Khatiwala and A. J. Putnam (2007). "The emergence of ECM
mechanics and cytoskeletal tension as important regulators of cell function." Cell
Biochemistry and Biophysics 47(2): 300-320.
Pittenger, M. F., A. M. Mackay, S. C. Beck, R. K. Jaiswal, R. Douglas, J. D. Mosca, M. A. Moorman,
D. W. Simonetti, S. Craig and D. R. Marshak (1999). "Multilineage potential of adult human
mesenchymal stem cells." Science 284(5411): 143-147.
Plateau, J. (1894). Statique expérimentale et théorique des liquides soumis aux seules forces moléculaires, Gauthier-Villars, Paris.
Ploetz, C., E. I. Zycband and D. E. Birk (1991). "Collagen fibril assembly and deposition in the
developing dermis: segmental deposition in extracellular compartments." Journal of Structural Biology 106(1): 73-81.
Pollard, T. D. and J. A. Cooper (2009). "Actin, a Central Player in Cell Shape and Movement."
Science 326(5957): 1208-1212.
References
171
Pompe, T., S. Zschoche, N. Herold, K. Salchert, M. F. Gouzy, C. Sperling and C. Werner (2003).
"Maleic anhydride copolymers - A versatile platform for molecular biosurface engineering." Biomacromolecules 4(4): 1072-1079.
Prendergast, P. J., R. Huiskes and K. Soballe (1997). "Biophysical stimuli on cells during tissue
differentiation at implant interfaces." Journal of Biomechanics 30(6): 539-548.
Quarles, L. D., D. A. Yohay, L. W. Lever, R. Caton and R. J. Wenstrup (1992). "Distinct Proliferative and Differentiated Stages of Murine MC3T3-E1 Cells in Culture: An In Vitro Model of
Osteoblast Development." Journal of Bone and Mineral Research 7(6): 683-692.
Quere, D. (2008). "Wetting and roughness." Annual Review of Materials Research 38: 71-99.
Radhakrishnan, B. and T. Zacharia (1995). "Simulation of curvature-driven grain-growth by using a
modified Monte-Carlo algorithm." Metallurgical and Materials Transactions a-Physical
Metallurgy and Materials Science 26(1): 167-180.
Ranft, J., M. Basan, J. Elgeti, J. F. Joanny, J. Prost and F. Julicher (2010). "Fluidization of tissues by
cell division and apoptosis." Proceedings of the National Academy of Sciences of the United
States of America 107(49): 20863-20868.
Rasband, W. S. (2008). "ImageJ." National Institutes of Health.
Rauzi, M., P. Verant, T. Lecuit and P.-F. Lenne (2008). "Nature and anisotropy of cortical forces
orienting Drosophila tissue morphogenesis." Nature Cell Biology 10(12): 1401-1410.
Riggs, B. L. and A. M. Parfitt (2005). "Drugs Used to Treat Osteoporosis: The Critical Need for a Uniform Nomenclature Based on Their Action on Bone Remodeling." Journal of Bone and
Mineral Research 20(2): 177-184.
Ripamonti, U. (2006). "Soluble osteogenic molecular signals and the induction of bone formation." Biomaterials 27(6): 807-822.
Ripamonti, U. (2009). "Biomimetism, biomimetic matrices and the induction of bone formation."
Journal of Cellular and Molecular Medicine 13(9b): 2953-2972.
Riveline, D., E. Zamir, N. Q. Balaban, U. S. Schwarz, T. Ishizaki, S. Narumiya, Z. Kam, B. Geiger and A. D. Bershadsky (2001). "Focal contacts as mechanosensors: externally applied local
mechanical force induces growth of focal contacts by an mDia1-dependent and ROCK-
independent mechanism." Journal of Cell Biology 153(6): 1175-1186.
Robling, A. G., A. B. Castillo and C. H. Turner (2006). "Biomechanical and molecular regulation of
bone remodeling." Annual Review of Biomedical Engineering 8(1): 455-498.
Rolli, C. G., T. Seufferlein, R. Kemkemer and J. P. Spatz (2010). "Impact of Tumor Cell Cytoskeleton
Organization on Invasiveness and Migration: A Microchannel-Based Approach." PLoS ONE 5(1): e8726.
Roux, W. (1881). Die züchtende Kampf der Teile, oder die 'Tielauslese' im Organismus (Theorie der
funktionellen Anpassung). Leipzig, Germany, Wilhelm Engelman.
Rubenstein, B. M. and L. J. Kaufman (2008). "The Role of Extracellular Matrix in Glioma Invasion:
A Cellular Potts Model Approach." Biophysical Journal 95(12): 5661-5680.
References
172
Ruiz, S. A. and C. S. Chen (2008). "Emergence of Patterned Stem Cell Differentiation Within
Multicellular Structures." Stem Cells 26(11): 2921-2927.
Rumpler, M., A. Woesz, J. W. C. Dunlop, J. T. van Dongen and P. Fratzl (2008). "The effect of
geometry on three-dimensional tissue growth." Journal of The Royal Society Interface 5(27):
1173-1173.
Saito, M., K. Fujii, T. Tanaka and S. Soshi (2004). "Effect of low- and high-intensity pulsed ultrasound on collagen post-translational modifications in MC3T3-E1 osteoblasts." Calcified
Tissue International 75(5): 384-395.
Salbreux, G., J. Prost and J. F. Joanny (2009). "Hydrodynamics of Cellular Cortical Flows and the Formation of Contractile Rings." Physical Review Letters 103(5): 058102.058101-058104.
Sander, E. A., T. Stylianopoulos, R. T. Tranquillo and V. H. Barocas (2009). "Image-based multiscale
modeling predicts tissue-level and network-level fiber reorganization in stretched cell-compacted collagen gels." Proceedings of the National Academy of Sciences 106(42): 17675-
17680.
Schlessinger, J. (2000). "Cell Signaling by Receptor Tyrosine Kinases." Cell 103(2): 211-225.
Schmierer, B. and C. S. Hill (2007). "TGF-beta–SMAD signal transduction: molecular specificity and functional flexibility." Nature Reviews Molecular Cell Biology 8(12): 970-982.
Schötz, E. M., R. D. Burdine, F. Jülicher, M. S. Steinberg, C. P. Heisenberg and R. A. Foty (2008).
"Quantitative differences in tissue surface tension influence zebrafish germ layer positioning." HFSP Journal 2(1): 42-56.
Schuckert, K. H. and M. Osadnik (2011). "Bone Tissue Engineering in Oral Surgery: A New Method
of Bone Development in Periodontal Surgery." Tissue Engineering Part C-Methods 17(12): 1179-1187.
Schulte, F. A., F. M. Lambers, G. Kuhn and R. Müller (2011a). "In vivo micro-computed tomography
allows direct three-dimensional quantification of both bone formation and bone resorption
parameters using time-lapsed imaging." Bone 48(3): 433-442.
Schulte, F. A., F. M. Lambers, D. J. Webster, G. Kuhn and R. Müller (2011b). "In vivo validation of a
computational bone adaptation model using open-loop control and time-lapsed micro-
computed tomography." Bone 49(6): 1166-1172.
Schwartz, M. A. and D. W. DeSimone (2008). "Cell adhesion receptors in mechanotransduction."
Current Opinion in Cell Biology 20(5): 551-556.
Schwarz, U. (2007). "Soft matters in cell adhesion: rigidity sensing on soft elastic substrates." Soft
Matter 3(3): 263-266.
Schwarz, U. and I. Bischofs (2005). "Physical determinants of cell organization in soft media."
Medical Engineering & Physics 27(9): 763-772.
Schwarz, U., T. Erdmann and I. Bischofs (2006). "Focal adhesions as mechanosensors: The two-spring model." Biosystems 83(2-3): 225-232.
Selhuber-Unkel, C., T. Erdmann, M. López-García, H. Kessler, U. S. Schwarz and J. P. Spatz (2010).
"Cell Adhesion Strength Is Controlled by Intermolecular Spacing of Adhesion Receptors." Biophysical Journal 98(4): 543-551.

References
173
Sen, S., A. J. Engler and D. E. Discher (2009). "Matrix Strains Induced by Cells: Computing How Far
Cells Can Feel." Cellular and Molecular Bioengineering 2(1): 39-48.
Sethian, J. A. and Y. Shan (2008). "Solving partial differential equations on irregular domains with
moving interfaces, with applications to superconformal electrodeposition in semiconductor
manufacturing." Journal of Computational Physics 217(13): 6411-6447.
Seto, J., H. S. Gupta, P. Zaslansky, H. D. Wagner and P. Fratzl (2008). "Tough Lessons From Bone: Extreme Mechanical Anisotropy at the Mesoscale." Advanced Functional Materials 18(13):
1905-1911.
Shapiro, F. (2008). "Bone development and its relation to fracture repair. The role of mesenchymal osteoblasts and surface osteoblasts." European Cells & Materials 15: 53-76.
Shea, L. D., D. Wang, R. T. Franceschi and D. J. Mooney (2000). "Engineered bone development
from a pre-osteoblast cell line on three-dimensional scaffolds." Tissue Engineering 6(6): 605-617.
Shi, F., J. Harman, K. Fujiwara and J. Sottile (2010). "Collagen I matrix turnover is regulated by
fibronectin polymerization." American Journal of Physiology-Cell Physiology 298(5):
C1265-C1275.
Shraiman, B. I. (2005). "Mechanical feedback as a possible regulator of tissue growth." Proceedings
of the National Academy of Sciences 102(9): 3318-3323.
Sia, S. K. and G. M. Whitesides (2003). "Microfluidic devices fabricated in poly(dimethylsiloxane) for biological studies." Electrophoresis 24(21): 3563-3576.
Singh, P., C. Carraher and J. E. Schwarzbauer (2010). "Assembly of fibronectin extracellular matrix."
Annual review of cell and developmental biology 26: 397-419.
Sivakumar, P., A. Czirok, B. J. Rongish, V. P. Divakara, Y. P. Wang and S. L. Dallas (2006). "New
insights into extracellular matrix assembly and reorganization from dynamic imaging of
extracellular matrix proteins in living osteoblasts." Journal of Cell Science 119(7): 1350-
1360.
Smith, M. L., D. Gourdon, W. C. Little, K. E. Kubow, R. A. Eguiluz, S. Luna-Morris and V. Vogel
(2007). "Force-Induced Unfolding of Fibronectin in the Extracellular Matrix of Living Cells."
PLoS Biology 5(10): e268.
Solon, J., I. Levental, K. Sengupta, P. C. Georges and P. A. Janmey (2007). "Fibroblast Adaptation
and Stiffness Matching to Soft Elastic Substrates." Biophysical Journal 93(12): 4453-4461.
Sottile, J., F. Shi, I. Rublyevska, H. Y. Chiang, J. Lust and J. Chandler (2007). "Fibronectin-
dependent collagen I deposition modulates the cell response to fibronectin." American Journal of Physiology-Cell Physiology 293(6): C1934-C1946.
St-Pierre, J. P., M. Gauthier, L. P. Lefebvre and M. Tabrizian (2005). "Three-dimensional growth of
differentiating MC3T3-E1 pre-osteoblasts on porous titanium scaffolds." Biomaterials 26(35): 7319-7328.
Stamenović, D. and D. E. Ingber (2009). "Tensegrity-guided self assembly: from molecules to living
cells." Soft Matter 5(6): 1137-1137.
References
174
Stein, G. S. and J. B. Lian (1993). "Molecular Mechanisms Mediating Proliferation Differentiation
Interrelationships during Progressive Development of the Osteoblast Phenotype." Endocrine Reviews 14(4): 424-442.
Stein, G. S., J. B. Lian, A. J. van Wijnen, J. L. Stein, M. Montecino, A. Javed, S. K. Zaidi, D. W.
Young, J. Y. Choi and S. M. Pockwinse (2004). "Runx2 control of organization, assembly
and activity of the regulatory machinery for skeletal gene expression." Oncogene 23(24): 4315-4329.
Steinberg, M. S. (1962). "Mechanism of Tissue Reconstruction by Dissociated Cells, .2. Time-Course
of Events." Science 137(3532): 762-762.
Steinberg, M. S. (2007). "Differential adhesion in morphogenesis: a modern view." Current Opinion
in Genetics & Development 17(4): 281-286.
Stevens, M. M. and J. H. George (2005). "Exploring and engineering the cell surface interface." Science 310(5751): 1135-1138.
Stroncek, J. D. and W. M. Reichert (2008). Overview of Wound Healing in Different Tissue Types.
Indwelling Neural Implants: Strategies for Contending with the In Vivo Environment. Boca
Raton (FL), CRC Press.
Suresh, S., J. Spatz, J. P. Mills, A. Micoulet, M. Dao, C. T. Lim, M. Beil and T. Seufferlein (2005).
"Connections between single-cell biomechanics and human disease states: gastrointestinal
cancer and malaria." Acta Biomaterialia 1(1): 15-30.
Syha, M. and D. Weygand (2010). "A generalized vertex dynamics model for grain growth in three
dimensions." Modelling and Simulation in Materials Science and Engineering 18(1):
015010.015011-015019.
Tamada, M., T. D. Perez, W. J. Nelson and M. P. Sheetz (2007). "Two distinct modes of myosin
assembly and dynamics during epithelial wound closure." Journal of Cell biology 176(1): 27-
33.
Tan, J. L., J. Tien, D. M. Pirone, D. S. Gray, K. Bhadriraju and C. S. Chen (2003). "Cells lying on a bed of microneedles: an approach to isolate mechanical force." Proceedings of the National
Academy of Sciences of the United States of America 100(4): 1484-1484.
Tanaka, H. and T. Araki (2000). "Surface effects on spinodal decomposition of incompressible binary fluid mixtures." EPL (Europhysics Letters) 51(2): 154-154.
Temenoff, J. S. and A. G. Mikos (2000). "Injectable biodegradable materials for orthopedic tissue
engineering." Biomaterials 21(23): 2405-2412.
Théry, M., A. Jiménez-Dalmaroni, V. Racine, M. Bornens and F. Jülicher (2007). "Experimental and theoretical study of mitotic spindle orientation." Nature 447(7143): 493-496.
Théry, M., A. Pépin, E. Dressaire, Y. Chen and M. Bornens (2006). "Cell distribution of stress fibres
in response to the geometry of the adhesive environment." Cell Motility and the Cytoskeleton 63(6): 341-355.
Thomopoulos, S., G. M. Fomovsky and J. W. Holmes (2005). "The development of structural and
mechanical anisotropy in fibroblast populated collagen gels." Journal of Biomechanical Engineering-Transactions of the Asme 127(5): 742-750.
References
175
Thompson, D. A. (1917). On growth and form, Cambridge University Press.
Thompson, D. A. W. and J. T. Bonner (1992). On Growth and Form, Cambridge University Press.
Thornton, K., J. Ågren and P. W. Voorhees (2003). "Modelling the evolution of phase boundaries in
solids at the meso-and nano-scales." Acta Materialia 51(19): 5675-5710.
Travasso, R., M. Castro and J. Oliveira (2011). "The phase-field model in tumor growth."
Philosophical Magazine 91(1): 183-206.
Trelstad, R. L. and K. Hayashi (1979). "Tendon collagen fibrillogenesis: Intracellular Subassemblies
and cell surface changes associated with fibril growth." Developmental Biology 71: 228-242.
Trepat, X., B. Fabry and J. J. Fredberg (2010). "Pulling it together in three dimensions." Nature Methods 7(12): 963-963.
van Oers, R. F. M., R. Ruimerman, E. Tanck, P. A. J. Hilbers and R. Huiskes (2008). "A unified
theory for osteonal and hemi-osteonal remodeling." Bone 42(2): 250-259.
Velling, T., J. Risteli, K. Wennerberg, D. F. Mosher and S. Johansson (2002). "Polymerization of type
I and III collagens is dependent on fibronectin and enhanced by integrins alpha(11)beta(1)
and alpha(2)beta(1)." Journal of Biological Chemistry 277(40): 37377-37381.
Vetter, A., D. R. Epari, R. Seidel, H. Schell, P. Fratzl, G. N. Duda and R. Weinkamer (2010). "Temporal Tissue Patterns in Bone Healing of Sheep." Journal of Orthopaedic Research
28(11): 1440-1447.
Vetter, A., Y. Liu, F. Witt, I. Manjubala, O. Sander, D. R. Epari, P. Fratzl, G. N. Duda and R. Weinkamer (2011). "The mechanical heterogeneity of the hard callus influences local tissue
strains during bone healing: A finite element study based on sheep experiments." Journal of
Biomechanics 44(3): 517-523.
Vetter, A., F. Witt, O. Sander, G. N. Duda and R. Weinkamer (2012). "The spatio-temporal
arrangement of different tissues during bone healing as a result of simple mechanobiological
rules." Biomechanics and Modeling in Mechanobiology 11(1-2): 147-160.
Vianay, B., J. Käfer, E. Planus, M. Block, F. Graner and H. Guillou (2010). "Single Cells Spreading on a Protein Lattice Adopt an Energy Minimizing Shape." Physical Review Letters 105(12):
128101.128101-128104.
Vogel, V. (2006). "Mechanotransduction involving multimodular proteins: Converting force into biochemical signals." Annual Review of Biophysics and Biomolecular Structure 35(1): 459-
488.
Vogel, V. and M. Sheetz (2006). "Local force and geometry sensing regulate cell functions." Nature
Reviews Molecular Cell Biology 7(4): 265-275.
Vogel, V. and M. P. Sheetz (2009). "Cell fate regulation by coupling mechanical cycles to
biochemical signaling pathways." Current Opinion in Cell Biology 21(1): 38-46.
Wagermaier, W., H. S. Gupta, A. Gourrier, M. Burghammer, P. Roschger and P. Fratzl (2006). "Spiral twisting of fiber orientation inside bone lamellae." Biointerphases 1(1): 1-5.
References
176
Wan, L. Q., K. Ronaldson, M. Park, G. Taylor, Y. Zhang, J. M. Gimble and G. Vunjak-Novakovic
(2011). "Micropatterned mammalian cells exhibit phenotype-specific left-right asymmetry." Proceedings of the National Academy of Sciences 108(30): 12295-12300.
Wang, H. and C. A. van Blitterswijk (2010). "The role of three-dimensional polymeric scaffold
configuration on the uniformity of connective tissue formation by adipose stromal cells."
Biomaterials 31(15): 4322-4329.
Wang, J. H. C., F. Y. Jia, T. W. Gilbert and S. L. Y. Woo (2003). "Cell orientation determines the
alignment of cell-produced collagenous matrix." Journal of Biomechanics 36(1): 97-102.
Wang, N. and Z. Suo (2005). "Long-distance propagation of forces in a cell." Biochemical and Biophysical Research Communications 328(4): 1133-1138.
Wang, Y., T. Azaïs, M. Robin, A. Vallée, C. Catania, P. Legriel, G. Pehau-Arnaudet, F. Babonneau,
M.-M. Giraud-Guille and N. Nassif (2012). "The predominant role of collagen in the nucleation, growth, structure and orientation of bone apatite." Nature Materials 11(8): 724-
733.
Wang, Y. L. and R. J. Pelham (1998). "Preparation of a flexible, porous polyacrylamide substrate for
mechanical studies of cultured cells." Molecular Motors and the Cytoskeleton, Pt B 298: 489-496.
Wartlick, O., P. Mumcu, F. Jülicher and M. Gonzalez-Gaitan (2011). "Understanding morphogenetic
growth control — lessons from flies." Nature Reviews Molecular Cell Biology 12(9): 594-604.
Weiner, S. and H. D. Wagner (1998). "The material bone: structure-mechanical function relations."
Annual Review of Materials Science 28(1): 271-298.
Weinkamer, R., M. A. Hartmann, Y. Bréchet and P. Fratzl (2004). "Stochastic lattice model for bone
remodeling and aging." Physical Review Letters 93(22): 228102.228101-228104.
Wheeler, D., D. Josell and T. P. Moffat (2003). "Modeling Superconformal Electrodeposition Using
The Level Set Method." Journal of The Electrochemical Society 150(5): C302-C310.
Wilhelmi (1999). "Langer's Lines: To Use or Not to Use." Plastic & Reconstructive Surgery 104(1):
208-214.
Winer, J. P., S. Oake and P. A. Janmey (2009). "Non-Linear Elasticity of Extracellular Matrices Enables Contractile Cells to Communicate Local Position and Orientation." PLoS ONE 4(7):
e6382.
Woesz, A., M. Rumpler, J. Stampfl, F. Varga, N. Fratzl-Zelman, P. Roschger, K. Klaushofer and P.
Fratzl (2005). "Towards bone replacement materials from calcium phosphates via rapid prototyping and ceramic gelcasting." Materials Science & Engineering C 25(2): 181-186.
Wolff, J. (1892). Das Gesetz der Transformation der Knochen. Translated as: The Law of Bone
Remodelling. Berlin, Germany, Springer Verlag.
Worring, M. and A. W. M. Smeulders (1993). "Digital Curvature Estimation." Cvgip-Image
Understanding 58(3): 366-382.
Wu, M. S. and H. O. K. Kirchner (2010). "Nonlinear elasticity modeling of biogels." Journal of the Mechanics and Physics of Solids 58(3): 300-310.

References
177
Yamamoto, T., T. Hasegawa, M. Sasaki, H. Hongo, C. Tabata, Z. Liu, M. Li and N. Amizuka (2012).
"Structure and formation of the twisted plywood pattern of collagen fibrils in rat lamellar bone." Journal of Electron Microscopy 61(2): 113-121.
Zamir, E. and B. Geiger (2001). "Molecular complexity and dynamics of cell-matrix adhesions."
Journal of Cell Science 114(20): 3583-3590.
Zeltinger, J., J. K. Sherwood, D. A. Graham, R. Mueller and L. G. Griffith (2001). "Effect of pore size and void fraction on cellular adhesion, proliferation, and matrix deposition." Tissue
Engineering 7(5): 557-572.
Zemel, A., F. Rehfeldt, A. E. X. Brown, D. E. Discher and S. A. Safran (2010). "Optimal matrix rigidity for stress-fibre polarization in stem cells." Nature Physics 6: 468-473.
Zhu, M. F., J. M. Kim and C. P. Hong (2001). "Modeling of Globular and Dendritic Structure
Evolution in Solidification of an Al–7mass% Si Alloy." ISIJ international 41(9): 992-998.
Zoumi, A., A. Yeh and B. J. Tromberg (2002). "Imaging cells and extracellular matrix in vivo by
using second-harmonic generation and two-photon excited fluorescence." Proceedings of the
National Academy of Sciences of the United States of America 99(17): 11014-11019.

178
List of Figures
Thesis
Figure 1-1: The sense of touch of cells ............................................................................................. 14
Figure 1-2: Mechanical interaction between cells ............................................................................. 15
Figure 1-3: Examples of collective multicellular behaviour .............................................................. 17
Figure 1-4: Theoretical approaches to describe multicellular systems ............................................... 20
Figure 1-5: Examples for modelling multicellular systems ............................................................... 23
Figure 1-6: From individual cells to emergent properties.................................................................. 28
Figure 2-1: Experimental protocol ................................................................................................... 35
Figure 2-2: Computational methods ................................................................................................. 37
Figure 2-3: Qualitative results, evolution of the geometry ................................................................ 38
Figure 2-4: Quantitative results, curvature profile and growth rate ................................................... 39
Figure 2-5: A chord model to describe tissue growth........................................................................ 41
Figure 2-6. Tissue organisation ........................................................................................................ 43
Figure 2-7: Importance of the boundary conditions .......................................................................... 46
Figure 3-1: Simulated growth .......................................................................................................... 56
Figure 3-2: Tissue growth in square- and cross-shaped pores ........................................................... 57
Figure 3-3: Investigation of tissue structure ..................................................................................... 59
Figure 3-4: Tissue growth kinetics ................................................................................................... 60
Figure 3-5: The impact of the third dimension ................................................................................. 63
Figure 3-6: Classifying geometries .................................................................................................. 66
Figure 4-1: Cells organisation .......................................................................................................... 74
Figure 4-2: Fibronectin organisation ................................................................................................ 76
Figure 4-3: Collagen organization .................................................................................................... 77
Figure 4-4: Effect of contractility inhibition ..................................................................................... 78
Figure 4-5: Laser cutting experiment ............................................................................................... 79
Figure 4-6: Inhibit contractility and cut ............................................................................................ 80
Figure 4-7: Biochemical treatments to impair tissue mechanics ........................................................ 81
Figure 4-8: Evolution of tissue structure during growth .................................................................... 84
Figure 4-9: How the organised tissue reacts to mechanics? .............................................................. 87
List of Figures
179
Appendices
Figure A-1: Principle of the 3D computational model .................................................................... 109
Figure A-2: Implementation of a changing scanning volume .......................................................... 111
Figure A-3: Comparison of the PTA evolution predicted by the 2D and the 3D models .................. 113
Figure A-4: Influence of the size of the circular mask used in the 2D growth model ....................... 114
Figure A-5: Influence of the size of the spherical mask in the 3D growth model ............................. 114
Figure A-6: Looking for minimal surfaces ..................................................................................... 115
Figure A-7: Accounting for cell migration ..................................................................................... 117
Figure A-8: A compromise between sensitivity and resolution ....................................................... 122
Figure A-9: Geometry of the computational implementation in 3D (continuous case)..................... 126
Figure B-1: Geometry of the computational implementation in 2D (continuous case) ..................... 130
Figure B-2: Representation of a chord on a curved surface ............................................................. 132
Figure B-3: Comparison of the computational model of CCTG with the chord model .................... 133
Figure C-1: Definition of the parameters used to describe regular geometries ................................. 135
Figure D-1: Principle of confocal microscopy ................................................................................ 141
Figure D-2: One-photon fluorescence excitation ............................................................................ 142
Figure D-3: Two-photon fluorescence excitation............................................................................ 143
Figure D-4: Second Harmonic Generation ..................................................................................... 144
Figure E-1: Optical sectioning of tissue grown in a triangular pore................................................. 146
Figure E-2: Orthogonal projection ................................................................................................. 147
Figure E-3: Quantification of fibre orientation ............................................................................... 148
Figure E-4: ALP staining on a tissue slice ...................................................................................... 149
Figure E-5: Actin staining on a longitudinal section of tissue ......................................................... 150
Figure E-6: Slice of tissue grown in PDMS scaffolds ..................................................................... 151
Figure E-7: The hyperboloid: a potential extension of the chord model to 3D ................................. 151
Figure F-1: Tissue culture with NIH3T3 ........................................................................................ 152
Figure F-2: Tissue culture with hMSCs, primary osteogenic and primary adipogenic cells ............. 153

180
Acknowledgments
I want to begin with the one who was there from the very beginning of the story to the last moment
before submission: Dr. John Dunlop. I met John in October 2008 via the big family of materials
scientists from Grenoble for a potential Masters project. 4 years later, I’m completing my PhD under
his supervision and the experience was great. From English to computer modelling to cooking
Apfelstrudel with Michi, I hope I’ll make good use of all that he taught me in the future. Beyond
being a relaxed and efficient group leader he’s also a really good friend, which motivates when it
comes to travel 1h to work. Cheers John! Actually you don’t need the costume to be a Superman…
I’m also thankful to Prof. Peter Fratzl (MPIKG) who gave me the opportunity to pursue my doctoral
studies in his Biomaterials department and to attend various conferences during this time. It’s amazing
how many ideas can emerge from his office! After each discussion we had there, understanding and
inspiration were often amplified and the growth rate of my to do list always showed a sharp increase.
My gratitude also goes to Prof. Yves Bréchet (Grenoble INP). Former teacher of mine and currently
on a research stay at the institute, his presence during one of those meetings has been fundamental to
believe in the relevance of the chord model. This particular discussion (in French s’il vous plait!) has
certainly been a turning point for my PhD.
Furthermore, I would like to thank the Berlin-Brandenburg School for Regenerative Therapies. This
interdisciplinary graduate school not only offered courses that were beneficial for my doctoral project,
but also a large network of great people. Among them, I’m grateful to Prof. Petra Knaus (FU) who
kindly fulfilled her role of second supervisor during efficient mentoring committees. A project in
common with her student even stemmed out of such a meeting. For a materials scientist, working in
close collaboration with a biologist like Jessica Kopf was a nice educational (not only) experience.
I can’t mention the BSRT without mentioning the pleasant atmosphere among the students. A
particular attention goes to the “French connection”, with which I could enjoy nice week-end
meetings: smelly cheese, wine, tarot, Pascal, Lucile and Tino, and recently Jean Baptiste ... what else?
In fact, this type of networking also gave rise to a serious cooperation project with Pascal Joly. I’m
grateful to Dr. Ansgar Petersen (Charité), who took the risk to leave two blondish students enclosed
hours long with a multiphoton microscope. I hope you don’t regret it: this is fun science and
according to the promising results and the rich discussions we had, it seems to work!
Dr. Philip Kollmannsberger (ETH Zürich) was another key person in my PhD. He is the one who can
explain physics to biologists and biology to physicists with simple words and no equations. His
background in experimental cell biology was really helpful in many respects. I’m glad I could visit
you in Zürich (no, not just for the mountains) and I’m looking forward to further collaborations.

Acknowledgments
181
I still owe a lot of my experimental knowledge to Dr. Krishna Prasad Kommareddy and Christine
Pilz. I must congratulate them for taking the challenge to teach cell culture experiments and other
biological protocols to an engineer, who mainly worked with bulky materials so far. Dr. Monika
Rumpler (LBI Vienna) also gave me a lot of tricks about how to behave with cells: “they feel when
you are stressed so keep relax”. By the way, I should also probably thank the cells for being so kind
with me and perform as predicted by the model from the first year of my PhD.
I also want to thank Prof. Carsten Werner, Dr. Manuela Herklotz and Dr. Marina Prewitz (IPF
Dresden). Taking the early train to Dresden was always worthwhile given the quality of the
discussions we had there. The new experiments you suggested and performed are really promising
and I’m excited about what comes next.
Cheers to Jate Panichpakdee for his hard work on developing soft scaffolds during his one-year stay at
the institute, and also to Fran Wang and Vanessa Gering who were precious supports in the lab and at
the computer during my last busy summer. You three were really nice and efficient lab-mates.
I really enjoyed working and spending time with the Biomat’s, the guests and many people of the
institute in general. I’m grateful to all of them for their enthusiasm and their help in many occasions. I
would like to thank in particular Matt for kindly reviewing this thesis prior to submission, Ingrid who
has been a faithful office-mate for almost 4 years now (it’s always a pleasure!), and Caro: I enjoyed
having lunch with you talking about your last (Anti-)Brigitte actions. You’ve been there since the
very beginning for the happy moments as well as in the “emotional valleys”, I’ll remember that.
It’s also fair to recognize the patience of the different generations of flat-mates and friends, who had
to deal with the mood of a scientist: bad after cell contamination, good after publication and
somewhat unstable in-between. Cheers guys!
Furthermore, I want to thank the people who followed my progression from abroad, and especially
those who came to taste the Currywurst during these 4 last years. It was always fun to have you here!
Finally, I would like to close this thesis with a big THANK to my families, the one I have in France
and the one I got in Berlin. A special mention goes to Mum and Dad: your support was determining
all along my education and encouraging me to live my life, wherever it is, is certainly the best
demonstration of love you could give me. In Berlin, I think in particular of Claire, Laura and Pascal
owing to the solid friendship they have shown me for the last 2 years. Spending time with you always
feels good and I’m looking forward to our future adventures. What about travelling in China, hiking
in Chartreuse (the mountain…) and horseback or tractor riding in Normandie?
So, to all of these people, the ones I forgot and those who took the time to read this work,
Merci.

182
Curriculum Vitae
Cécile BIDAN
Date and place of birth 2nd
July 1986 in Cambrai, France
Personal contact Andreasstraße 20, n°1502
10243 Berlin, Germany
+49(0)151/21-74-20-38
Professional contact Max Planck Institute of Colloids and Interfaces
Department of Biomaterials
Am Mühlenberg 1,
14476 Potsdam - Golm, Germany
+49(0)331/567-9426
+49(0)331/567-9402
http://www.mpikg.mpg.de/biomaterialien/index.html
Education
July 2004 Scientific A-level (Baccalauréat Scientifique)
Lycée Fénelon, Cambrai, France
2004-2006 Classes Préparatoires Physics and Chemistry
Lycée Henry Wallon, Valenciennes, France
2006-2007 Bachelor of Engineering
Ecole Nationale Supérieure d'Electrochimie Electrométallurgie de Grenoble
Grenoble INP, France
2008 Internship (4 months): Adaptation of an adhesion test (blister test) to surgical
conditions in order to test surgical glues.
Partnership between SIMaP lab (Grenoble) and CHU Vaudois (Lausanne, Switzerland)
2007-2009 Masters of Research in Materials Science
Ecole Nationale Supérieure d'Electrochimie Electrométallurgie de Grenoble
Grenoble INP, France
2009 Masters Internship (6 months): Curvature controlled growth of osteoblastic cells in
hydroxyapatite scaffolds.
Max Planck Institute of Colloids and Interfaces, Potsdam, Germany Research stay on DAAD German Academic Exchange Service Stipendium
Since 10/2009 PhD Candidate: Geometric control of tissue growth.
Max Planck Institute of Colloids and Interfaces, Potsdam, Germany
Student at the BSRT, Berlin-Brandenburg School for Regenerative Therapies
Curriculum Vitae
183
Publications
2011 Kollmannsberger P., C. M. Bidan, J.W.C. Dunlop, and P. Fratzl
The physics of tissue patterning and extracellular matrix organisation: how cells
join forces. Soft Matter, 2011, 7 (20), 9549 – 9560. DOI: 10.1039/C1SM05588G
2012 Bidan C. M., K. P. Kommareddy, M. Rumpler, P. Kollmannsberger, Y. Bréchet, P. Fratzl, J.W.C. Dunlop
How linear tension converts to curvature: Geometric control of bone tissue
growth. PlosOne, 2012, 7(5), e36336. DOI: 10.1371/journal.pone.0036336
Accepted Bidan C. M., K. P. Kommareddy, M. Rumpler, P. Kollmannsberger, Y. Bréchet, P.
Fratzl, J.W.C. Dunlop
Geometry as a principle for tissue engineering: Optimize scaffold design to
promote tissue growth.
Advanced Healthcare Materials, 2012, in press. DOI: 10.1002/adhm.201200159
Gamsjaeger E., C. M. Bidan, F.D. Fischer, P. Fratzl, J.W.C. Dunlop
Modelling the role of surface stress on the kinetics of tissue growth in confined
geometries.
Acta Biomaterialia, 2012
Submitted Bidan C. M., F. Wang, J.W.C. Dunlop
A three-dimensional model for tissue deposition on complex surfaces.
Invited publication for the CMBBE journal, special issue “Computational Cellular
and Biomolecular Mechanics and Mechanobiology”.
Conference proceedings
2010 Bidan, C., K. Kommareddy, I. Manjubala, M. Rumpler, P. Fratzl, and J. Dunlop Poster: Geometric control of tissue growth.
IMBS Davos workshop: Bone biology and therapeutics (Davos, Switzerland)
Bone, 2010, 46, S47 – S48. DOI:10.1016/j.bone.2010.01.107
2011 Bidan, C., K. Kommareddy, M. Inderchand, M. Rumpler, J. Dunlop, and P. Fratzl Poster: Geometric control of three-dimensional tissue growth.
Biostar 2010 (Stuttgart, Germany)
Tissue Engineering Part A, 2011, 17, 565 – 565.
2012 Bidan, C., P. Kollmannsberger, K. Kommareddy, M. Rumpler, Y. Bréchet, P. Fratzl,
and J. Dunlop
Presentation: From cell contractility to curvature-controlled tissue growth.
Computer Methods in Biomechanics and Biomedical Engineering 2012 (Berlin,
Germany)
CMBBE, 2012 (online)
Taylor and Francis award for the best presentation


185
Erklärung
Hiermit erkläre ich, dass ich die vorliegende Arbeit selbständig und unter Verwendung keiner anderen
als den von mir angegebenen Quellen und Hilfsmitteln verfasst habe.
Ferner erkläre ich, dass ich bisher weder an der Universität Potsdam noch anderweitig versucht habe,
eine Dissertation einzureichen oder mich einer Doktorprüfung zu unterziehen.
Cécile Bidan
Potsdam, den 29.10.2012