geology - epgp.inflibnet.ac.in
TRANSCRIPT
GEOLOGY
Paper: Hydrogeology and Engineering Geology
Module: Assessment of groundwater quality
Subject Geology
Paper No and Title Hydrogeology and Engineering Geology
Module No and Title Assessment of groundwater quality
Module Tag HG & EG VII
Principal Investigator Co-Principal Investigator Co-Principal Investigator
Prof. Talat Ahmad
Vice-Chancellor
Jamia Millia Islamia
Delhi
Prof. Devesh K Sinha
Department of Geology
University of Delhi
Delhi
Prof. P.P. Chakraborty
Department of Geology
University of Delhi
Delhi
Paper Coordinator Content Writer Reviewer
Dr. Shashank Shekhar
Department of Geology
University of Delhi
Delhi
Dr. Shashank Shekhar
Department of Geology
University of Delhi
Delhi
Dr. S. P. Rai (Scientist F)
National Institute of
Hydrogeology (NIH)
Roorkee

GEOLOGY
Paper: Hydrogeology and Engineering Geology
Module: Assessment of groundwater quality
Table of Content
1. Learning outcomes
2. Introduction
3. Groundwater Quality
4. Groundwater Contamination and Pollution
5. Measurement and reporting of water quality parameters
5.1. Organoleptic and Physical Parameters
5.2. Chemical Parameters
5.3. Radioactive Substances
5.4. Bacteriological Parameters
6. Quality criteria for portable water
7. Quality criteria for irrigation water
7.1. Salinity
7.2. Sodium Adsorption Ratio (SAR)
7.3. Specific ion toxicity
8. Graphical representation of groundwater chemical quality
data
8.1. Trilinear Diagram (Hill-Piper plot)
8.2. Durov’s Diagram
8.3. C-S Diagram
9. Summary
10. Acknowledgement
GEOLOGY
Paper: Hydrogeology and Engineering Geology
Module: Assessment of groundwater quality
1. Learning outcomes
After studying this module, you shall be able to:
Understand groundwater water quality concept.
Appreciate the concept of groundwater contamination and pollution.
Get familiar with the way water quality parameters are measured and
reported.
Get familiar with quality criteria for portable and irrigation water.
Learn about the way chemical groundwater quality data is graphically
represented
2. Introduction
The groundwater all over the world has emerged as a potential source for domestic
and irrigation purposes. In this case, it becomes important to assess the quality of
groundwater before assigning it for domestic or irrigation purposes. We must realize
that the natural groundwater without any anthropogenic influences and will also
have a baseline concentrating of different dissolved solutes. These solutes are
primarily introduced in to the groundwater system by the process of sediment-
groundwater interaction. This natural groundwater quality varies from place to place
depending upon nature of soil, nature of subsurface lithology, climatic conditions
etc. The dissolved solids in groundwater can be divided in major ions, minor
constituents and trace elements. In general, the major ions of groundwater include
sodium, potassium, calcium, magnesium cations and bicarbonate, carbonate,
chloride and sulphate anions. The minor constituents include small amount of
dissolved solids like iron, manganese, fluoride etc. Besides many elements of the
periodic table are present in very small concentration in the groundwater and they
are referred to as trace elements. Further, at some places we can also find organic
compound in groundwater.

GEOLOGY
Paper: Hydrogeology and Engineering Geology
Module: Assessment of groundwater quality
3. Groundwater Quality
When we talk of groundwater chemistry it includes all the dissolved solids in the
groundwater system; popularly referred to as the total dissolved solids (TDS),
including organic compound and trace elements. While groundwater quality is much
more than groundwater chemistry which mainly includes chemical constituents of
groundwater. It also includes biotic constituents of groundwater like bacteria,
physical parameters like color, turbidity, odor etc. The issue here is which
parameters define groundwater quality and what is the standard for these parameters.
There is no universal definition. We must understand that water quality is defined in
perspective of its desired use. Thus, the water quality desired for drinking purpose
will need to be assessed for a set of parameters in comparison to the agreed standard
norm. Similarly, the water quality desired for irrigation purpose will need to be
assessed for a different set of parameters in comparison to the agreed standard norm
for irrigation water. Holistically we can assess the water quality in terms of physical,
chemical and bacteriological parameters for different uses.
4. Groundwater Contamination and Pollution
At this stage, it is desired that we understand the term ‘groundwater contamination
and pollution’. They are very often used synonymously. Many a times groundwater
contamination is referred to geogenic source while pollution is exclusively assigned
to anthropogenic source. In literary perspective the word ‘contaminate’ means
making something dirty or impure by adding a substance that may be dangerous,
while the word ‘pollute’ means “adding dirty or harmful substance to land, air,
water etc. so that it is no longer pleasant or safe to use” (Oxford dictionary 8th
edition). It emerges out from here that loosely these two term terms can be used as
synonyms. Since literary meaning of pollution also emphasizes on the fact that
during pollution the addition of harmful substance to water, air etc. makes it no
longer safe. Therefore, if we want to be more specific we can say that groundwater
contamination can be from both natural (geogenic) or human induced
(anthropogenic) sources. While groundwater pollution is a stage when groundwater

GEOLOGY
Paper: Hydrogeology and Engineering Geology
Module: Assessment of groundwater quality
contamination has crossed the safe limits of the desired use. Since historically most
of the groundwater pollution was attributed to human activity, in due course of time
the use of groundwater pollution was generally restricted to human induced activity
leading to occurrence of certain parameters beyond safe limits of the desired use.
We must also be very clear here that a groundwater, which is polluted for drinking
purposes with respect to certain parameters, might be only contaminated for
irrigation uses. Technically the sediment groundwater interaction leading to
dissolution of solids and its addition to groundwater below desirable limits for
drinking purposes is also an act of groundwater contamination.
5. Measurement and reporting of water quality parameters
The water quality parameters are estimated following the standard protocols
formulated by Bureau of Indian Standards (BIS) in India. The analysis is finally
reported by laboratory in unit as given below.
5.1 Organoleptic and Physical Parameters
Colour: Reported in Hazen Unit. Hazen unit basically quantifies colour
to a numeric value, which is then used for comparison.
Odour: It is sensed physically and should be agreeable to a normal
human being.
Taste: Again, it is sensed physically and should be agreeable to a normal
human being.
Turbidity: Reported in Nephelometric Turbidity Unit (NTU). NTU is
basically quantification of scattered light at 90 degree from the incident
light beam.
pH: It is measure of negative logarithm to base 10 of the hydrogen ion
concentration in moles per liter. It is used for expressing acidity or
alkalinity of the solution.
5.2 Chemical Parameters
The chemical parameters are mostly reported from a laboratory in term of mg/liter.
For pesticides and some trace elements, it can also be represented as micro
gram/liter. The interrelationship amongst different units of measurements is:

GEOLOGY
Paper: Hydrogeology and Engineering Geology
Module: Assessment of groundwater quality
Milligram per liter (mg/l) ≃ parts per million (ppm) (Ayers & Westcot 1985)
Mill equivalent per liter (me/l) = mg/l ÷ equivalent weight (Ayers & Westcot 1985)
Where Equivalent weight = Formulae weight ÷ charge (after Todd 1980)
5.3 Radioactive Substances
The parameter used for quantifying the concentration of radioactive substances
in water is Becquerel/liter (Bq/l). Becquerel quantified radioactivity of a
substance.
5.4 Bacteriological Parameters
The bacteriological parameters with regards to BIS drinking water standards
specifies that the organism shall not be detectable in any 100 ml sample.
6. Quality criteria for portable water
Since water is a basic necessity for life, the quality criteria for drinking and
irrigation uses has been adopted at various institutional levels. The World Health
Organization (WHO) prepares a detailed guideline for drinking water quality. The
acceptable standards vis-à-vis microbial aspects, chemical aspects, physical aspects
like taste, appearance, odour and radiological aspects have been formulated. A
detailed look can be had at weblink:
http://www.who.int/water_sanitation_health/publications/gdwq4-with-add1-chapters/en/
(accessed 12-07-2017). It is not desired to memorize all of them but one should be
aware about availability of the list of standards and they can be referred on the basis
of requirement. On account of socio-economic and geologic variations across the
world, each country has suitably modified the WHO standards and adopted local
standards. In context of India, the Bureau of Indian standards has prepared a detailed
guideline giving specifications for drinking water. The guideline is exhaustive and
has detailed specifications for organoleptic and physical parameters; chemical
parameters and bacteriological parameters. The specification booklet by Bureau of
Indian standard is available from their office on payment basis. Some government
organization has one or other version of the specification on their website (For e.g.

GEOLOGY
Paper: Hydrogeology and Engineering Geology
Module: Assessment of groundwater quality
http://cgwb.gov.in/Documents/WQ-Standards.pdf (accessed 11-07-2017). It
becomes important to study theses parameters as their occurrence in drinking water
beyond permissible limits has serious and damaging effect on human health. Here as
an example we show with help of Fig.1 the damages a polluted groundwater with
respect to certain parameters causes on human health.
Fig.1 A schematic drawing to show the effect of polluted drinking water on human
body (Source: http://www.neerwater.com/images/men.jpg, accessed 11-07-2017).

GEOLOGY
Paper: Hydrogeology and Engineering Geology
Module: Assessment of groundwater quality
7. Quality criteria for irrigation water
Plants are sensitive to the water quality used for irrigation; the crop yield depends on
the type of water used for irrigation purpose. The main parameters identified for
assessing water quality for irrigation purposes (Ayers & Westcot 1985) are: Salinity;
Sodium Adsorption Ratio (SAR) and specific ion toxicity (Sodium, chloride,
Boron). These parameters are briefly discussed below:
7.1. Salinity: Very high salinity in irrigation water adversely affects plant
growth. The salinity of water is measured by total dissolved solids,
generally expressed as mg/l. The total dissolved solids in water control the
electrical conductivity of water. Now a days hand held devices are available
for estimation of the electrical conductivity of the water. Todd (1980)
elucidates and approximates Logan (1961) and Richard’s (1954)
relationship between TDS and electrical conductivity. It mentions that for
water having electrical conductivity in the range of 100 to 5000 micro
Siemens/cm the relationship is:
1 mg/l = 1.56 micro Siemens/cm
Since measurement of electrical conductivity is quite easy, most of the time
the water quality consideration with respect to salinity is discussed in terms
of electrical conductivity. Different agencies and workers have discussed in
detail about tolerance of crops vis-à-vis salinity of irrigation water. However,
the most holistic consideration with regards to suitability of irrigation water
can be taken when salinity is examined vis-à-vis Sodium Adsorption Ratio
(SAR). This can be easily done using C-S diagram. The detailed discussion
on Sodium Adsorption Ratio and C-S diagram follows further in text.
7.2. Sodium Adsorption Ratio (SAR): The sodium content relative to calcium
and magnesium content of the irrigation water controls the rate of
infiltration of water to the root zone of crops (Ayers & Westcot 1985). It has

GEOLOGY
Paper: Hydrogeology and Engineering Geology
Module: Assessment of groundwater quality
also been elucidated further by Todd (1980) that the soil permeability gets
reduced by reaction of sodium with the soil.
SAR = Na
√Ca+Mg/2 (Ayers & Westcot 1985)
It is to note here that all the cationic concentrations are in meq/liter.
7.3. Specific ion toxicity: In this category, we have toxicity primarily by
chloride, sodium and boron ions. What happens that circumstantially if the
concentration of these ions crosses the critical limit of the crop, the yield
reduces drastically? The water needs to be assessed vis –a – vis tolerance of
specific crops with regards to concentration of these ions in irrigation water.
8. Graphical representation of groundwater chemical quality data
Graphical representation of groundwater chemical quality data:
The chemical quality of groundwater is appreciated better by graphical
representation. In the very beginning, we must understand that mostly in graphical
representation the major ion concentration (that is Na, K, Mg, Ca, CO3, HCO3, SO4,
Cl) is used. Further, while plotting these concentrations are mostly in milli
equivalents per liter (meq/liter). The graphical representation of groundwater quality
data started by using bar graphs, circular diagram etc. However, limitation of these
plotting were that they could not represent substantial number of analysis for one
synoptic view. Piper (1944) improved upon Hill (1940) to produce trilinear diagram
for representation of major ion chemistry of groundwater. A similar plot with more
flexibility was proposed by S.A Durov and reported by Zaporozec (1972). Besides
Richards (1954) proposed a diagram for classification of irrigation water. The
diagram has Electrical conductivity on x-axis and SAR on y-axis and thus it is also
referred to as C-S diagram. Below we will briefly discuss about the important
graphical plots mentioned above.

GEOLOGY
Paper: Hydrogeology and Engineering Geology
Module: Assessment of groundwater quality
8.1. Trilinear Diagram (Hill-Piper plot): This is one of the most useful
diagrams for graphical representation of groundwater quality data (Fig.2). It
has unique advantage that large number of data can be plotted on a single
diagram. It also helps in ascertaining hydrochemical facies of groundwater.
The hydrochemical facies refers to a cation and anion concentration within a
distinct zone (Back 1961, Freeze and Cherry 1979). Prior to plotting a data,
the concentration of major ions is converted in terms of meq/l. Then the
cations are tabulated as percentage of total cations and similarly the anions
are tabulated as percentage of total anions. The percentage value of each
cation is plotted on the cation triangle on the left and percentage value of
each anion is plotted on the anion triangle on the right (Fig.2). The data
from cation and anion triangles are projected to the central diamond shaped
area as shown by dotted lines. In this way, huge number of data can be
plotted and the hydrochemical facies variation can be identified.
Fig. 2 Trilinear diagram for representation of major ion chemistry of
groundwater (After Piper 1944)

GEOLOGY
Paper: Hydrogeology and Engineering Geology
Module: Assessment of groundwater quality
8.2. Durov’s Diagram: The diagram proposed by Durov (Fig.3) has again two
cation and anion triangles, and in place of central diamond, area there is a
square. Like in a Trilinear plot here again major cations and anions are
converted in terms of meq/l and then percentage of each action with respect
to total cation and percentage of each anion with respect to total anion is
tabulated. These percentage values of the cations and anions are then plotted
in their respective triangles. Further, these plots can be projected to central
square area as shown by blue line in Fig.3. In extended Durov’s diagram the
square can be extrapolated blow and to its right for plotting two more
additional parameters.
Fig. 3 A prototype of Durov’s diagram (after Zaprorozec 1972).
GEOLOGY
Paper: Hydrogeology and Engineering Geology
Module: Assessment of groundwater quality
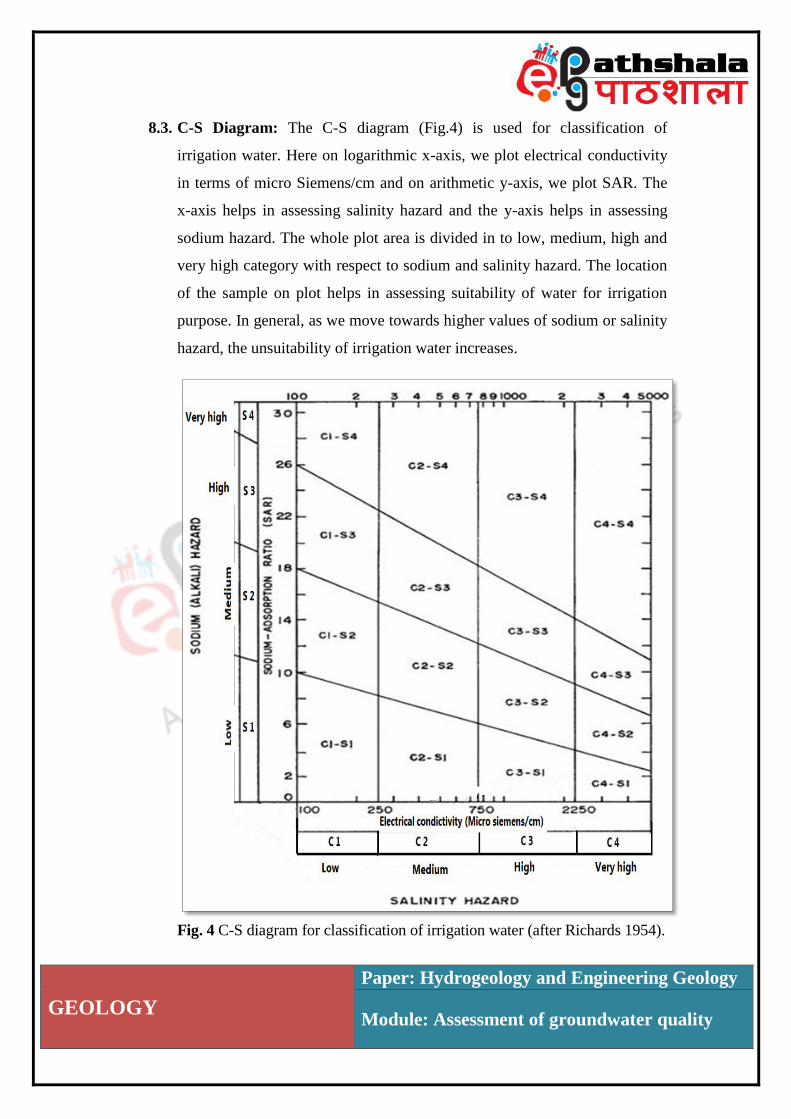
8.3. C-S Diagram: The C-S diagram (Fig.4) is used for classification of
irrigation water. Here on logarithmic x-axis, we plot electrical conductivity
in terms of micro Siemens/cm and on arithmetic y-axis, we plot SAR. The
x-axis helps in assessing salinity hazard and the y-axis helps in assessing
sodium hazard. The whole plot area is divided in to low, medium, high and
very high category with respect to sodium and salinity hazard. The location
of the sample on plot helps in assessing suitability of water for irrigation
purpose. In general, as we move towards higher values of sodium or salinity
hazard, the unsuitability of irrigation water increases.
Fig. 4 C-S diagram for classification of irrigation water (after Richards 1954).

GEOLOGY
Paper: Hydrogeology and Engineering Geology
Module: Assessment of groundwater quality
9. Summary
Groundwater quality encompasses groundwater chemistry, biotic
constituents of groundwater like bacteria, physical parameters like colour,
turbidity, odour etc.
The water quality is defined in perspective of its desired use like drinking or
irrigation.
Groundwater contamination is any addition to groundwater system either
from natural (geogenic) or human induced (anthropogenic) sources. While
groundwater pollution is a stage when groundwater contamination has
crossed the safe limits of the desired use.
Water quality parameters are estimated following the standard protocols
formulated by Bureau of Indian Standards (BIS) in India and similarly in
other parts of the world.
The different water quality parameters have defined units of reporting. Like
Hazen unit for colour, milli and micro gram per liter for chemical
constituents and Becquerel/liter for radioactive substances.
Pollution of drinking water adversely affects human body and its part.
The quality criteria of irrigation water mainly involves assessment of
salinity, sodium adsorption ratio and specific ion toxicity.
For holistic assessment of groundwater quality data graphical plots like
Trilinear diagram, Durov’s diagram and C-S diagram can be used.
The C-S diagram is specifically designed for assessment of irrigation water
quality data.
10. Acknowledgements
The content of the module is individual intellectual propriety of the content writer. It
is likely to be used in future for textbook etc. on the topic by the content writer

GEOLOGY
Paper: Hydrogeology and Engineering Geology
Module: Assessment of groundwater quality
Multiple Choice Questions-
1. C-S diagram is used for classification of
(a) Irrigation water
(b) Drinking water
(c) Industrial water
(d) None of the above
Ans: a
2. C-S plot is a semi logarithmic plot where
(a) X-axis is logarithmic
(b) Y-axis is arithmetic
(c) Both a and b
(d) None of the above
Ans: c
3. A C4-S4 category of water indicating very high salinity and Sodium Adsorption
Ratio is
(a) Good for irrigation uses
(b) Bad for irrigation uses
(c) Both a and b
(d) None of the above
Ans: b
4. While plotting data in Durov’s diagram the percentage of cations is estimated by
(a) Dividing the particular cation concentration with summation of all cation
concentration in meq/l
(b) Dividing the particular cation concentration with summation of all ions
concentration in meq/l
(c) Dividing values in meq/l with equivalent weigh
(d) None of the above
Ans: a
5. While plotting data in Durov’s diagram the percentage of anions is estimated by
(a) Dividing the particular anion concentration with summation of both
cation and anion concentration in meq/l
(b) Dividing the particular anion concentration with summation of all ions
concentration in meq/l
(c) Dividing values in meq/l with equivalent weigh
(d) None of the above
Ans: d
GEOLOGY
Paper: Hydrogeology and Engineering Geology
Module: Assessment of groundwater quality
6. Trilinear diagram has an advantage that
(a) A large number of data can be plotted
(b) The hydrochemical facies can be visually distinguished on the plot
(c) Both a and b
(d) None of the above.
Ans: c
7. On a Trilinear plot the hydrochemical facies refers to
(a) A cation and anion concentration within a distinct zone
(b) Trace element concentration within a distinct zone
(c) Pesticide concentration within a distinct zone
(d) Partial pressure of carbon dioxide
Ans: a
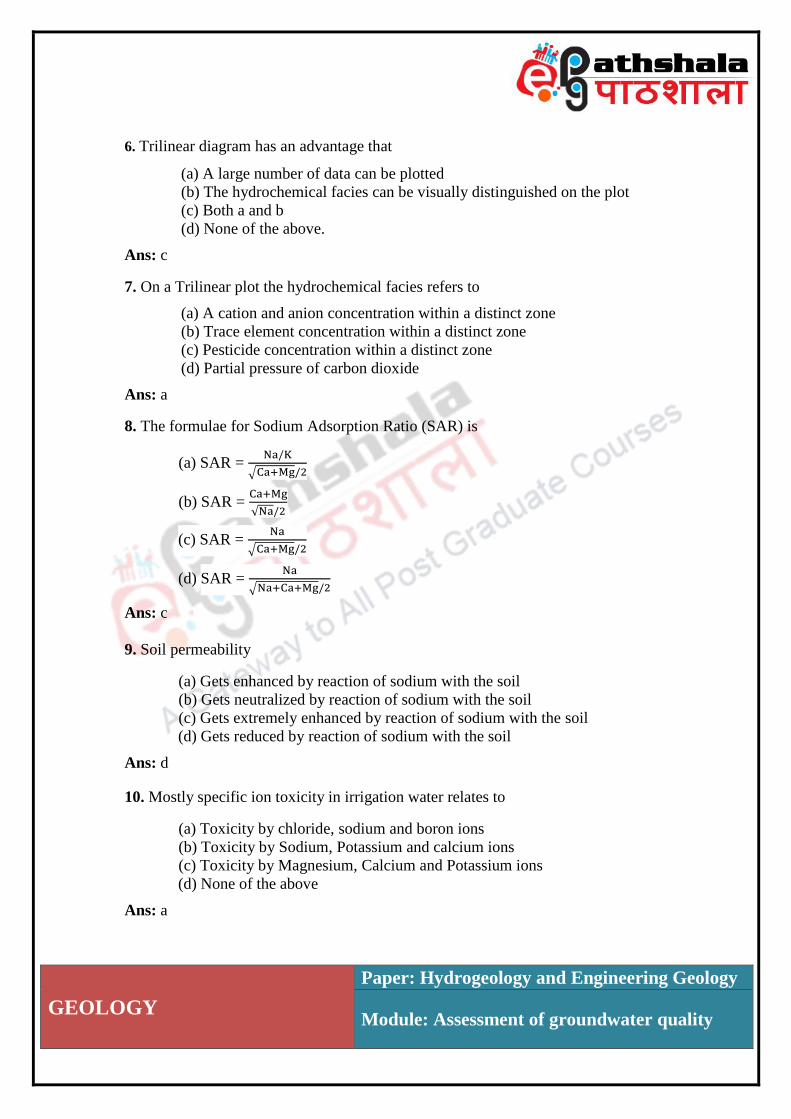
8. The formulae for Sodium Adsorption Ratio (SAR) is
(a) SAR = Na/K
√Ca+Mg/2
(b) SAR = Ca+Mg
√Na/2
(c) SAR = Na
√Ca+Mg/2
(d) SAR = Na
√Na+Ca+Mg/2
Ans: c
9. Soil permeability
(a) Gets enhanced by reaction of sodium with the soil
(b) Gets neutralized by reaction of sodium with the soil
(c) Gets extremely enhanced by reaction of sodium with the soil
(d) Gets reduced by reaction of sodium with the soil
Ans: d
10. Mostly specific ion toxicity in irrigation water relates to
(a) Toxicity by chloride, sodium and boron ions
(b) Toxicity by Sodium, Potassium and calcium ions
(c) Toxicity by Magnesium, Calcium and Potassium ions
(d) None of the above
Ans: a

GEOLOGY
Paper: Hydrogeology and Engineering Geology
Module: Assessment of groundwater quality
11. The concentration of radioactive substances in water is measured in terms of
(a) Milligram/liter (Mg/l)
(b) Becquerel/liter (Bq/l)
(c) Miliequivalence/liter (Meq/l)
(d) None of the above
Ans: b
12. The total dissolved solids can also be estimated
(a) By measuring only Sodium ion concentration in water
(b) By measuring only total anion concentrations in water
(c) By measuring trace element concentration in water
(d) By measuring electrical conductivity of the water
Ans: d
13. Unit Milligram per liter (mg/l) is approximately equal to
(a) Unit parts per billion (ppb)
(b) Unit parts per million (ppm)
(c) Unit Milli equivalent per liter (me/l)
(d) None of the above
Ans: b
14. We can estimate Milli equivalent per liter by dividing Milligram per liter with
(a) Total charge of the ions
(b) Total Formulae weigh only
(c) Cationic concentration only
(d) Equivalent weigh
Ans: d
15. We can estimate equivalent weigh by
(a) Dividing formulae weight with charge
(b) Dividing charge with formulae weigh
(c) Dividing charge with ion weigh
(d) None of the above
Ans: a
16. The measurement of turbidity is reported in
(a) Halophytic Turbidity Unit (HTU)
(b) Phreatophytic Turbidity Unit (PTU)
(c) Xerophytic Turbidity Unit (XTU)
(d) Nephelometric Turbidity Unit (NTU)
Ans: d

GEOLOGY
Paper: Hydrogeology and Engineering Geology
Module: Assessment of groundwater quality
17. The measurement of colour is reported in
(a) Hazen Unit
(b) Flozen Unit
(c) Trojan Unit
(d) Grazen Unit
Ans: a
18. Groundwater pollution is a stage when groundwater contamination has
(a) Started from anthropogenic sources
(b) Crossed the safe limits of the desired use
(c) Started from geogenic source
(d) None of the above
Ans: b
19. Technically the sediment groundwater interaction leading to dissolution of solids
and its addition to groundwater below desirable limits for drinking purposes is
(a) In no way groundwater contamination
(b) Always an act of pollution
(c) Also an act of groundwater contamination with respect to drinking use
(d) None of the above
Ans: c
20. The major ions of groundwater necessarily includes all of these
(a) Sodium, Potassium, Barium, Helium, Bicarbonate, Borates, Chloride
and Arsenic anions
(b) Strontium, Beryllium, Calcium, Magnesium, Phosphate, Carbonate,
Chloride and Nitrate anions
(c) Sodium, Aluminum, Iron, Magnesium, Rubidium, Fluoride, Chloride
and Sulphate anions
(d) None of the above
Ans: d

GEOLOGY
Paper: Hydrogeology and Engineering Geology
Module: Assessment of groundwater quality
Suggested Readings:
1. Todd, David Keith and Mays, Larry W., (2011), Groundwater Hydrology, 3rd
Edn., Wiley India Pvt. Ltd., New Delhi.
2. Ayres, R. S. and Westcot, D. W. (1985), Water quality for agriculture. FAO
Irrigation and Drainage Paper 29 Rev. 1. Food and Agricultural
Organization, Rome, 1, p.74.
3. Back, William (1961). Techniques for mapping of hydrochemical facies. US
Geol Surv Prof Pap, 424, 380-382.
4. Freeze, R. A., & Cherry, J. A. (1979). Groundwater (p. 604), 1st Edn., New
Jersey: Prentice Hall Inc. Englewood cliffs.
5. Hill, R. A. (1940). Geochemical patterns in Coachella valley. Eos,
Transactions American Geophysical Union, 21(1), 46-53.
6. Logan, J. (1961). Estimation of electrical conductivity from chemical analyses
of natural waters. Journal of Geophysical Research, 66(8), 2479-2483.
7. Piper, A. M. (1944). A graphic procedure in the geochemical interpretation
of water‐analyses. Eos, Transactions American Geophysical Union, 25(6),
914-928.
8. Richards, L. A. (1969). Diagnosis and improvement of saline and alkali soils.
United States Department of Agriculture; Washington.