geography skills
TRANSCRIPT
GEOGRAPHY SKILLS
Geography Skills 1
©M
cDou
gal L
ittel
l Inc
.All
right
s re
serv
ed.
Name Date
GEOGRAPHY SKILLS 1 Understanding Projections
1. Name the four projections. ______________________________________________________
2. Compare the sizes of Greenland and Antarctica on the Mercator projection with the Robinson
projection. ____________________________________________________________________
____________________________________________________________________________
3. What would you consider the main drawback of Goode’s Interrupted projection?
____________________________________________________________________________
4. Why do you think that the Mercator projection is considered the best for plotting direction?
____________________________________________________________________________
OUTLINE MAP
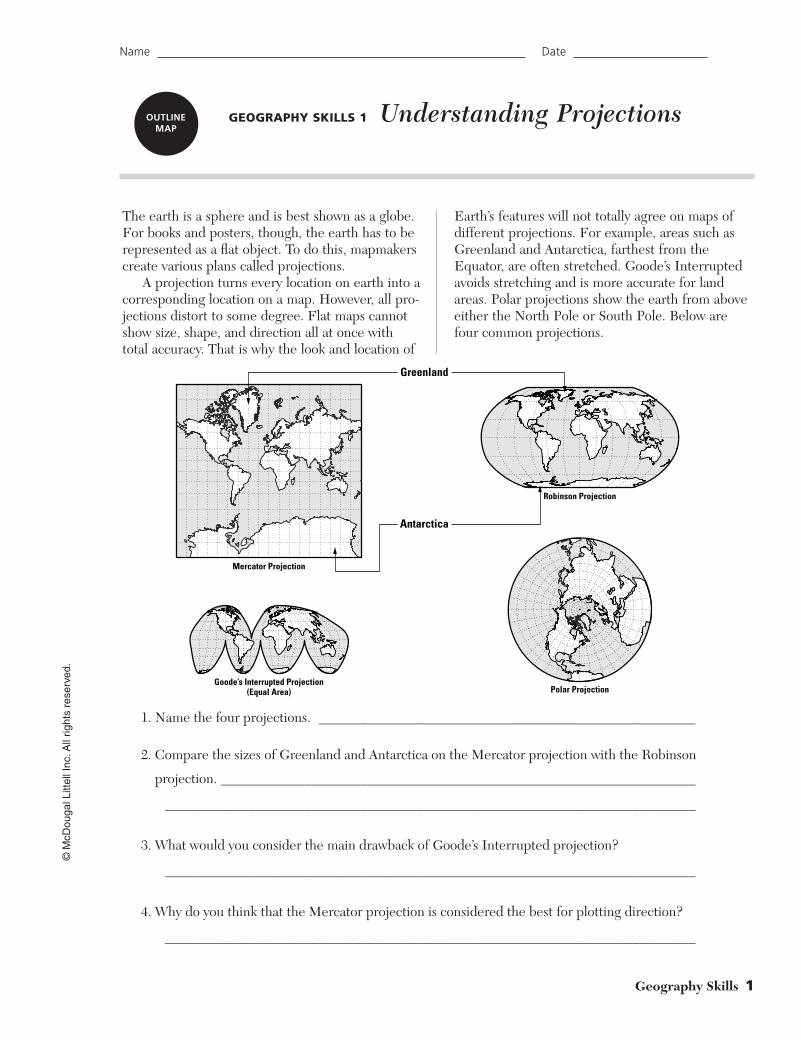
The earth is a sphere and is best shown as a globe.For books and posters, though, the earth has to berepresented as a flat object. To do this, mapmakerscreate various plans called projections.
A projection turns every location on earth into acorresponding location on a map. However, all pro-jections distort to some degree. Flat maps cannotshow size, shape, and direction all at once withtotal accuracy. That is why the look and location of
Earth’s features will not totally agree on maps ofdifferent projections. For example, areas such asGreenland and Antarctica, farthest from theEquator, are often stretched. Goode’s Interruptedavoids stretching and is more accurate for landareas. Polar projections show the earth from aboveeither the North Pole or South Pole. Below arefour common projections.
Greenland
Antarctica
Mercator Projection
Robinson Projection
Polar ProjectionGoode’s Interrupted Projection
(Equal Area)
001-wh10a-GSOM 11/11/2003 10:34 AM Page 1

©M
cDou
gal L
ittel
l Inc
.All
right
s re
serv
ed.
2 Geography Skills
Name Date
GEOGRAPHY SKILLS 2 Recognizing Latitude andLongitude
1. How many degrees separate the North Pole from the South Pole? ______________________
2. Between about what longitude and latitude degrees does most of the connected United States fall?
____________________________________________________________________________
3. An airplane lost from radar at 5° S and 55° W was over which continent?
____________________________________________________________________________
4. Mark the map titled “North and South America” at the approximate point where a ship in distress at 45° S and 5° E might be found.
OUTLINEMAP
Most maps contain imaginary horizontal andvertical lines of measurement. Horizontal lines,running east and west, are called latitude lines orparallels. Vertical lines, running north and south,are called longitude lines or meridians. The linesare numbered in degrees (shown by the symbol °).
Latitude starts at 0°, known as the equator,where the earth is at its widest. There are 90
degrees north of the equator and 90 degrees southof it. Longitude starts at 0°, the Prime Meridian,and goes 180 degrees west and 180 degrees east.
Because latitude and longitude cross and form agrid, the use of these lines to locate places is calledthe grid system. Every place in the world has a sin-gle grid location—where its latitude and longitudeintersect. Study the maps below.
0˚
30˚N
60˚N NorthPole
30˚S
60˚S
0˚30˚W
60˚W
90˚W
120˚
W
150˚
W18
0˚
NORTHAMERICA
SOUTHAMERICA
Prim
e M
erid
ian
0˚Equator
North Latitude
North Pole
South Latitude
South Pole
30˚N
60˚N
90˚N
NorthPole
Prim
e M
erid
ian
180˚150˚W 150˚E
120˚W 120˚E
90˚W 90˚E
60˚W 60˚E
30˚W 30˚EWest Longitude East Longitude
30˚S
60˚S
90˚S
0˚
0˚30˚W
60˚W
EquatorEquator
North Pole
South Pole
30˚N
60˚N60˚N
30˚N
0˚
30˚S
60˚S
90˚S
0˚
30˚W
60˚W
90˚W
120˚
W
150˚
W
180˚
90˚N
30˚S
90˚W
120˚
W
150˚
W18
0˚
60˚S
0˚
Latitude Lines (Parallels) Longitude Lines (Meridians)
Latitude and Longitude Grid North and South America
NORTHAMERICA
SOUTHAMERICA
002-wh10a-GSOM 11/11/2003 10:38 AM Page 2
Geography Skills 3
©M
cDou
gal L
ittel
l Inc
.All
right
s re
serv
ed.
Name Date
GEOGRAPHY SKILLS 3 Recognizing Continents and Oceans
1. What are the seven continents? __________________________________________________
____________________________________________________________________________
2. Which geographical formation separates the Americas? separates Asia from Africa? ________
____________________________________________________________________________
3. What appears to divide Asia from Europe? __________________________________________
4. Where is most of the earth’s land mass—north or south of the equator? __________________
5. A trip from Australia to Africa would cross which ocean? ______________________________
OUTLINEMAP
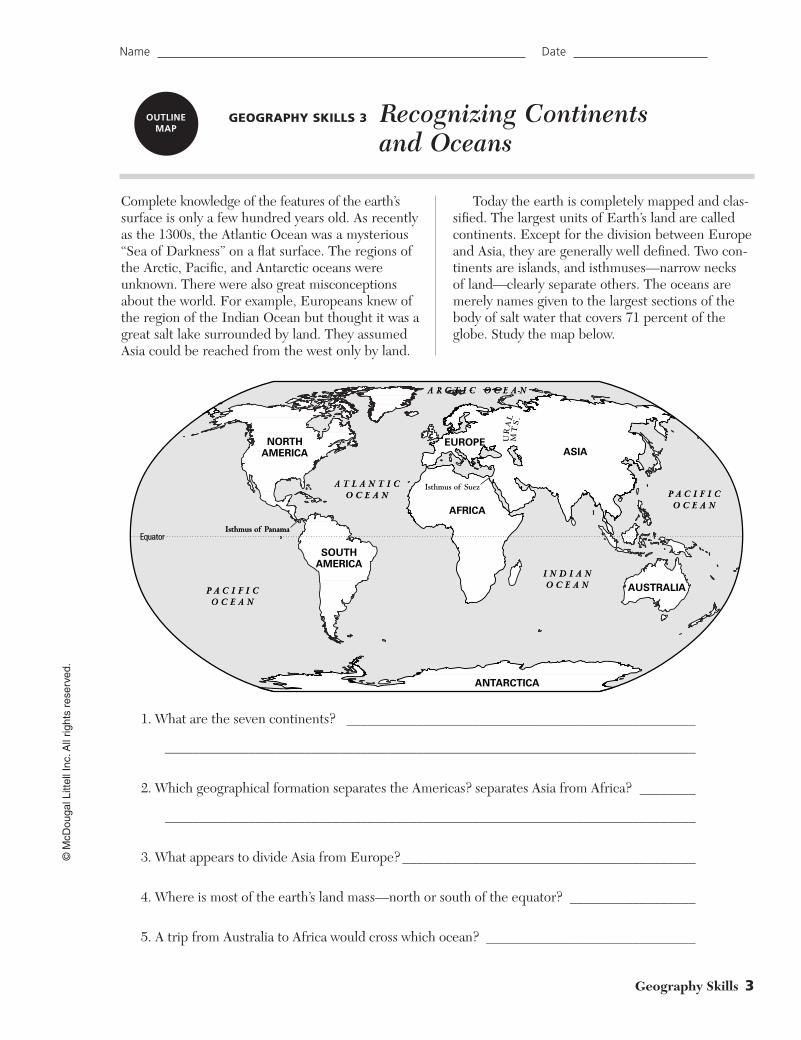
Complete knowledge of the features of the earth’ssurface is only a few hundred years old. As recentlyas the 1300s, the Atlantic Ocean was a mysterious“Sea of Darkness” on a flat surface. The regions ofthe Arctic, Pacific, and Antarctic oceans wereunknown. There were also great misconceptionsabout the world. For example, Europeans knew ofthe region of the Indian Ocean but thought it was agreat salt lake surrounded by land. They assumedAsia could be reached from the west only by land.
Today the earth is completely mapped and clas-sified. The largest units of Earth’s land are calledcontinents. Except for the division between Europeand Asia, they are generally well defined. Two con-tinents are islands, and isthmuses—narrow necks of land—clearly separate others. The oceans aremerely names given to the largest sections of thebody of salt water that covers 71 percent of theglobe. Study the map below.
EquatorEquatorIsthmus of Panama
NORTHAMERICA
SOUTHAMERICA
ANTARCTICA
ASIAEUROPE
AFRICA
AUSTRALIA
UR
AL
MT
S.
Isthmus of Suez
Isthmus of Panama
A T L A N T I CO C E A N
P A C I F I CO C E A N
P A C I F I CO C E A N
A R C T I C O C E A N
I N D I A NO C E A N
A T L A N T I CO C E A N
P A C I F I CO C E A N
P A C I F I CO C E A N
A R C T I C O C E A N
I N D I A NO C E A N
003-wh10a-GSOM 11/11/2003 10:39 AM Page 3

©M
cDou
gal L
ittel
l Inc
.All
right
s re
serv
ed.
4 Geography Skills
Name Date
GEOGRAPHY SKILLS 4 Designating Hemispheres
1. Why do you think the word hemisphere accurately describes the six globes shown above?
____________________________________________________________________________
2. The vertically cut globe creates what two hemispheres? ______________________________
3. Name the continents found all or mostly in the Northern Hemisphere. __________________
____________________________________________________________________________
4. Look at the globes for the northern and southern hemispheres. What is the main difference between
the North and South poles? ______________________________________________________
OUTLINEMAP
The study of the earth does not always involve theentire planet at once. Mapmakers often deal withlarge sections of the earth called hemispheres.
The word hemisphere combines sphere—meaning anything round, like a ball—with the pre-fix hemi—meaning “half.” The world can be divid-
ed into any of four hemispheres—Northern,Southern, Western, and Eastern. They are illustrat-ed below by both bird’s-eye and profile views.Hemispheres are further dramatized by the cuttingof the globe horizontally and vertically. Study theglobes below.
North Pole South Pole
Equator
Equator
Equator
North Pole
North Pole South Pole
Equator
Equator
North Pole
South Pole
North Pole
Equator
South Pole
South Pole
Northern Hemisphere Southern HemisphereNorthern Hemisphere
Southern Hemisphere
Western Hemisphere Eastern Hemisphere
WesternHemisphere
EasternHemisphere
004-wh10a-GSOM 11/11/2003 10:47 AM Page 4

Geography Skills 5
©M
cDou
gal L
ittel
l Inc
.All
right
s re
serv
ed.
Name Date
GEOGRAPHY SKILLS 5 Reading Physical Maps
1. Which continent is almost totally desert? __________________________________________
2. Ice is the sole physical feature of what continent? ____________________________________
3. What is the only totally inland sea that is identified? __________________________________
4. What is the prominent physical feature of Northern Asia?______________________________
5. What are the physical features of Africa below the equator? ____________________________
____________________________________________________________________________
OUTLINEMAP
Physical maps show the earth’s physical fea-tures, such as bodies of water and landforms.Among other natural features, these maps showwhere rivers, lakes, mountains, and types of vegeta-
tion such as grasslands and forests are located.Below is a physical map of the EasternHemisphere. Study it and answer the questions.
�y�y��yy��yy�y����yyyy����yyyy�y����yyyy��
��yyyy������yyyyyy
��yy��yy������
������yyyyyyyyyyyy
����yyyy
��yy
����yyyy
������������
yyyyyyyyyyyy �y��
��yyyy
��yy
���yyy
����yyyy
����yyyy�y�y��yy�y����yyyy
Equator
Tropic of Capricorn
Tropic of Cancer
Antarctic Circle
Arctic Circle
Prim
e M
erid
ian
EUROPE
ASIA
AFRICA
AUSTRALIA
ANTARCTICA
UR
AL
MT
S.
ATLAS M T S .
ALP S
H I M A L AYA S
Madagascar
A R C T I C O C E A N
I N D I A N O C E A N
A ra b i a nS e a
C a s p i a n S e a
E a s t C h i n a S e a
B e r i n gS e a
Sou t h Ch ina
Sea
Medi terra n e a n S e a
Danube R .
Nil
eR
.
Indu
s R.
Con
go R.
Vo l ga R. Yel l owR .
�yDeserts�y�yGrasslandForestsMountains�yIce
0 4,000 Kilometers
0 2,000 Miles
The Eastern Hemisphere: A Physical Map
005-wh10a-GSOM 11/11/2003 10:50 AM Page 5
©M
cDou
gal L
ittel
l Inc
.All
right
s re
serv
ed.
6 Geography Skills
Name Date
GEOGRAPHY SKILLS 6 Using Scales and the Compass Rose
1. Is Tasmania north, south, east, or west of Australia? __________________________________
2. About how many inches wide is Australia as it is shown in Map A? (Use a ruler to measure across
the widest part of the continent.) __________________________________________________
3. What is the approximate distance across Australia in miles? ____________________________
4. How much larger is Australia in Map B than it is in Map A? ____________________________
OUTLINEMAP
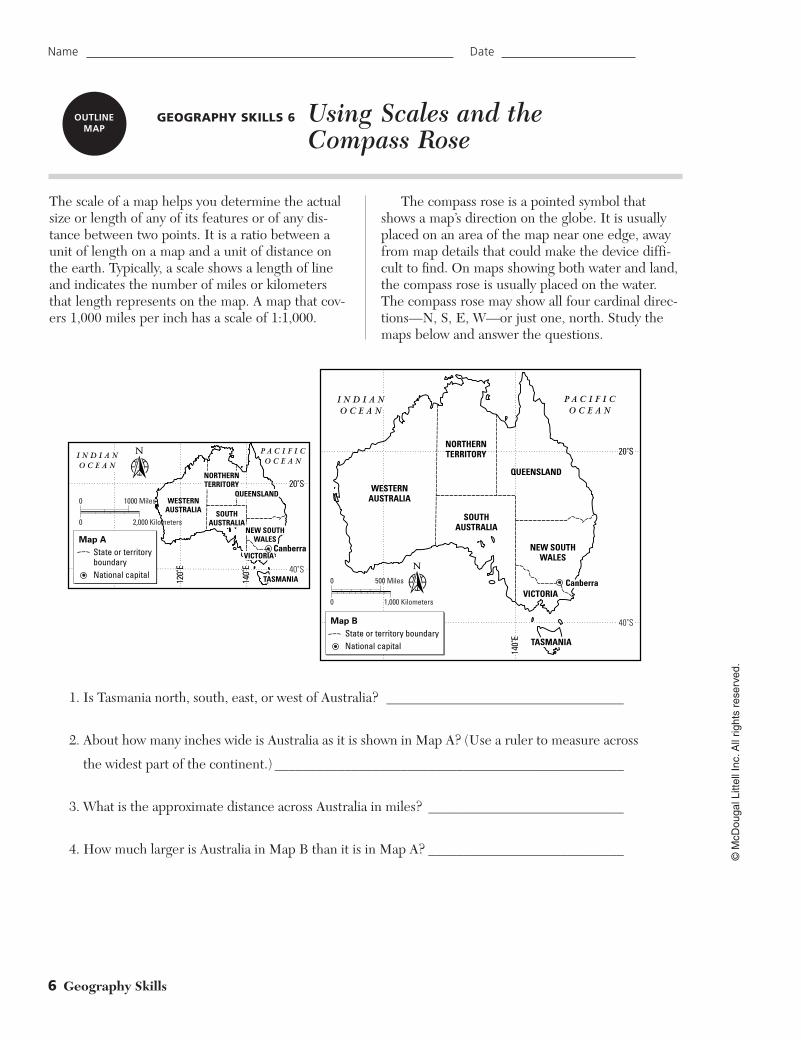
The scale of a map helps you determine the actualsize or length of any of its features or of any dis-tance between two points. It is a ratio between aunit of length on a map and a unit of distance onthe earth. Typically, a scale shows a length of lineand indicates the number of miles or kilometersthat length represents on the map. A map that cov-ers 1,000 miles per inch has a scale of 1:1,000.
The compass rose is a pointed symbol thatshows a map’s direction on the globe. It is usuallyplaced on an area of the map near one edge, awayfrom map details that could make the device diffi-cult to find. On maps showing both water and land,the compass rose is usually placed on the water.The compass rose may show all four cardinal direc-tions—N, S, E, W—or just one, north. Study themaps below and answer the questions.
PP AA C I F I CC I F I CO C E A NO C E A N
I N D I A NI N D I A NO C E A NO C E A N
PP AA C I F I CC I F I CO C E A NO C E A N
I N D I A NI N D I A NO C E A NO C E A N
CanberraCanberra
CanberraCanberra120˚
E
140˚
E 40˚S40˚S
20˚S
140˚
E
40˚S40˚S
20˚S
TTASMANIAASMANIA
TTASMANIAASMANIA
VICTORIAVICTORIA
QUEENSLANDQUEENSLAND
NEW SOUTHNEW SOUTHWWALESALES
SOUTHSOUTHAUSTRALIAAUSTRALIA
NORTHERNNORTHERNTERRITORTERRITORYY
P A C I F I CO C E A N
I N D I A NO C E A N
P A C I F I CO C E A N
I N D I A NO C E A N
Canberra
Canberra120˚
E
140˚
E 40˚S
20˚S
140˚
E
40˚S
20˚S
TASMANIA
TASMANIA
VICTORIA
QUEENSLAND
NEW SOUTHWALES
SOUTHAUSTRALIA
WESTERNAUSTRALIA
NORTHERNTERRITORY
VICTORIA
QUEENSLAND
NEW SOUTHWALES
SOUTHAUSTRALIA
WESTERNAUSTRALIA
NORTHERNTERRITORY
State or territory boundaryMap B
National capital
State or territory boundary
Map A
National capital
0 1,000 Kilometers
0 500 Miles
0 2,000 Kilometers
0 1000 Miles
006-wh10a-GSOM 11/11/2003 10:52 AM Page 6

Geography Skills 7
©M
cDou
gal L
ittel
l Inc
.All
right
s re
serv
ed.
Name Date
GEOGRAPHY SKILLS 7 Interpreting Lines, Labels, and Symbols
1. Vikings came from a region of four present-day countries north of Europe called Scandinavia. Which
one, identified on the map, was not a point of origin for Vikings? ________________________
2. Which of the cities on the map is farthest from the Vikings’ homeland? __________________
3. What direction did the Vikings go to reach Greenland? ________________________________
4. What is the region of North America where the Vikings landed? ________________________
5. The Arctic Circle runs just south, north, east, or west of Iceland?________________________
OUTLINEMAP
Maps show more than just size and direction. Theyalso define borders of cities, regions, states, andcountries. They can be used to depict historicalevents, to demonstrate how geography has influ-enced history, and to illustrate human interactionwith the environment.
Such information found on a map comes from areading of its various lines, labels, and symbols.Lines of various width indicate land boundaries,
types of roads and waterways, and routes of move-ment. Labels are words on a map that identify suchthings as cities, states, countries, continents, andbodies of water. Symbols are decorative objectssuch as large circles, dots, stars, and bursts used toidentify an area’s special features—cities, battlesites, resources, and the like. Study the map belowand answer the questions.
������
yyyyyy
SWEDENSWEDENNORNORWWAAYY FINLANDFINLAND
DENMARKDENMARK
E U R O P EE U R O P E
N O RN O R T HT H
A M E R I C AA M E R I C A
GREENLANDGREENLAND
VVinlandinland
ICELANDICELAND
MM ee dd ii tt ee rr rr aa nn ee aa nn SS ee aa
BB ll aa cc kk SS ee aa
AA T L A N T I CT L A N T I CO C E A NO C E A N
N o rN o r t ht hS e aS e a
50˚W
50˚W
60˚W
60˚W
70˚W
70˚W
40˚W
40˚W
0˚ P
rime
Mer
idia
n
30˚W
30˚W
20˚W
20˚W
10˚W
10˚W
30˚E
20˚E
10˚E
40˚E
40˚N
30˚N
Arctic CircleArctic Circle
50˚N
60˚N
70˚N
LondonLondon
ParisParis
RomeRome
SWEDENNORWAY FINLAND
DENMARK
E U R O P E
N O R T H
A M E R I C A
GREENLAND
Vinland
ICELAND
M e d i t e r r a n e a n S e a
B l a c k S e a
A T L A N T I CO C E A N
N o r t hS e a
London
Paris
Rome
50˚W
60˚W
70˚W
40˚W
0˚ P
rime
Mer
idia
n
30˚W
20˚W
10˚W
30˚E
20˚E
10˚E
40˚E
40˚N
30˚N
Arctic Circle
50˚N
60˚N
70˚N
Viking homeland
Modern boundariesfor Scandinavian countries�yRoute
0 2,000 Kilometers
0 1,000 Miles
The Viking Age, A.D. 800–1000
007-wh10a-GSOM 11/11/2003 10:55 AM Page 7
©M
cDou
gal L
ittel
l Inc
.All
right
s re
serv
ed.
8 Geography Skills
Name Date
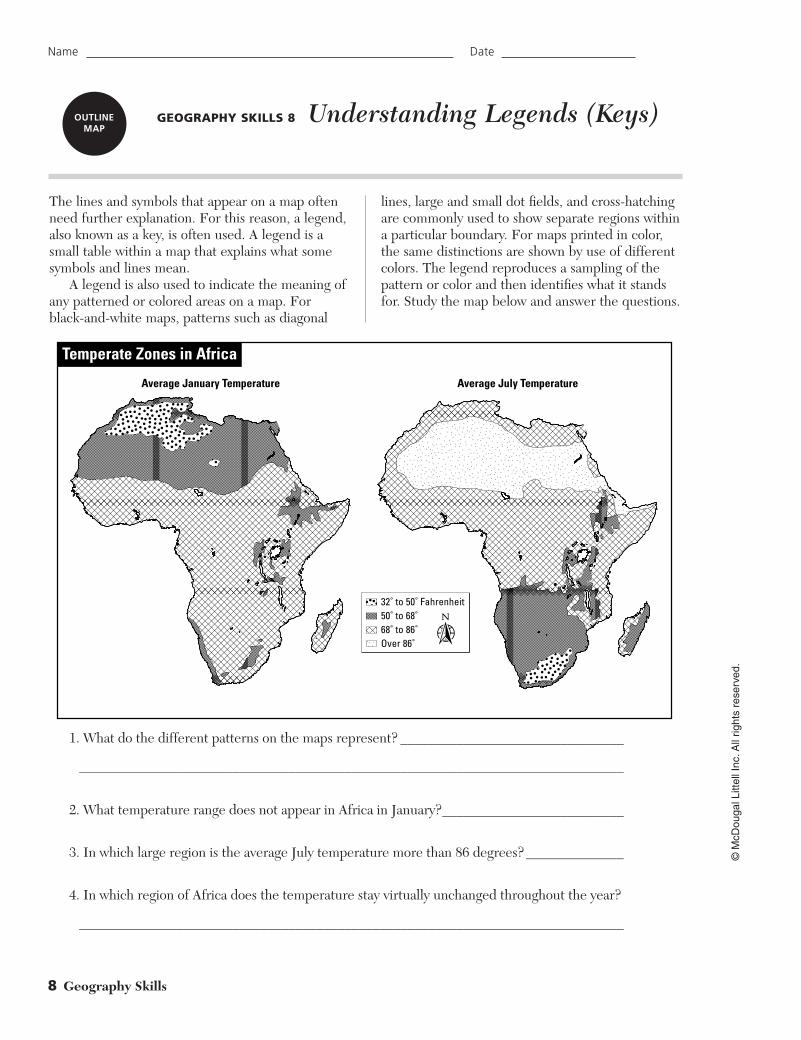
GEOGRAPHY SKILLS 8 Understanding Legends (Keys)
1. What do the different patterns on the maps represent? ________________________________
______________________________________________________________________________
2. What temperature range does not appear in Africa in January?__________________________
3. In which large region is the average July temperature more than 86 degrees? ______________
4. In which region of Africa does the temperature stay virtually unchanged throughout the year?
______________________________________________________________________________
OUTLINEMAP
The lines and symbols that appear on a map oftenneed further explanation. For this reason, a legend,also known as a key, is often used. A legend is asmall table within a map that explains what somesymbols and lines mean.
A legend is also used to indicate the meaning ofany patterned or colored areas on a map. Forblack-and-white maps, patterns such as diagonal
lines, large and small dot fields, and cross-hatchingare commonly used to show separate regions withina particular boundary. For maps printed in color,the same distinctions are shown by use of differentcolors. The legend reproduces a sampling of thepattern or color and then identifies what it standsfor. Study the map below and answer the questions.
����������������������������������������
yyyyyyyyyyyyyyyyyyyyyyyyyyyyyyyyyyyyyyyy
���yyy��������yyyyyyyy
�y��yy�y�y �y�y�y��yy�y�y��yy�y
������yyyyyy
����yyyy
��yy�y�y
������yyyyyy�y�y�y��yy������yyyyyy�y�y�y
��yy
�y�y��yy�y��yy�y
����yyyy������
����Over 86˚�
����yyyy32˚ to 50˚ Fahrenheit
�y50˚ to 68˚
�y68˚ to 86˚
Temperate Zones in Africa
Average January Temperature Average July Temperature
008-wh10a-GSOM 11/11/2003 10:58 AM Page 8
Outline Maps 9
©M
cDou
gal L
ittel
l Inc
.All
right
s re
serv
ed.
Name Date
04,
000
Kilo
met
ers
02,
000
Mile
s
The World: Physical
009-wh10a-GSOM 11/11/2003 11:00 AM Page 9

©M
cDou
gal L
ittel
l Inc
.All
right
s re
serv
ed.
10 Outline Maps
Name Date
04,
000
Kilo
met
ers
02,
000
Mile
s
The World: Political
010-wh10a-GSOM 11/11/2003 11:02 AM Page 10
Outline Maps 11
©M
cDou
gal L
ittel
l Inc
.All
right
s re
serv
ed.
Name Date
0 4,000 Kilometers
0 2,000 Miles
Western Hemisphere
011-wh10a-GSOM 11/11/2003 11:05 AM Page 11
©M
cDou
gal L
ittel
l Inc
.All
right
s re
serv
ed.
12 Outline Maps
Name Date
04,
000
Kilo
met
ers
02,
000
Mile
s
Eastern Hemisphere
012-wh10a-GSOM 11/11/2003 11:07 AM Page 12
Outline Maps 13
©M
cDou
gal L
ittel
l Inc
.All
right
s re
serv
ed.
Name Date
0 4,000 Kilometers
0 2,000 Miles
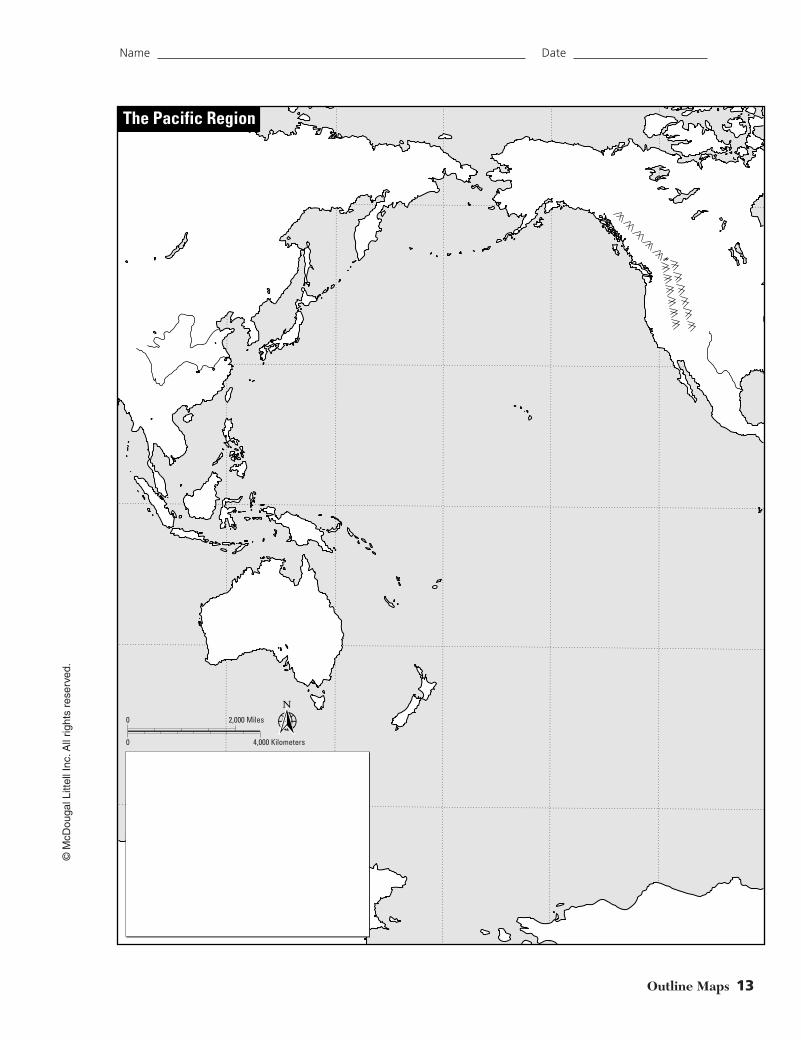
The Pacific Region
013-wh10a-GSOM 11/11/2003 11:08 AM Page 13
©M
cDou
gal L
ittel
l Inc
.All
right
s re
serv
ed.
14 Outline Maps
Name Date
0 2,000 Kilometers
0 1,000 Miles
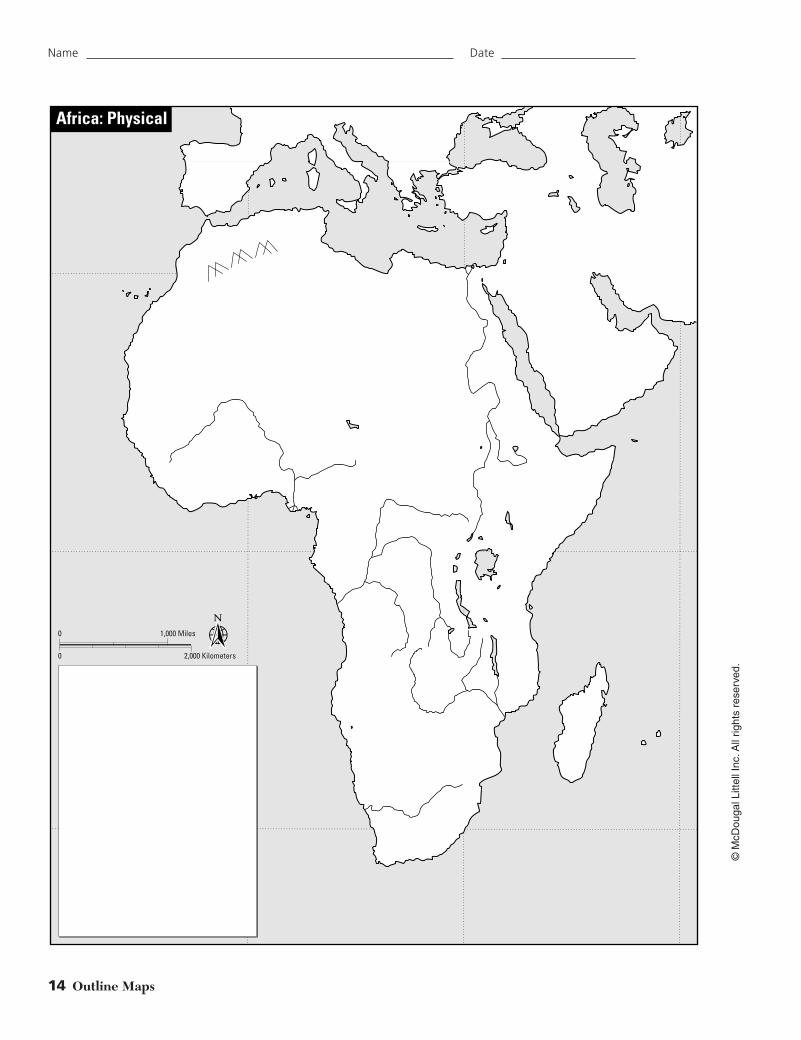
Africa: Physical
014-wh10a-GSOM 11/11/2003 11:08 AM Page 14
Outline Maps 15
©M
cDou
gal L
ittel
l Inc
.All
right
s re
serv
ed.
Name Date
0 2,000 Kilometers
0 1,000 Miles
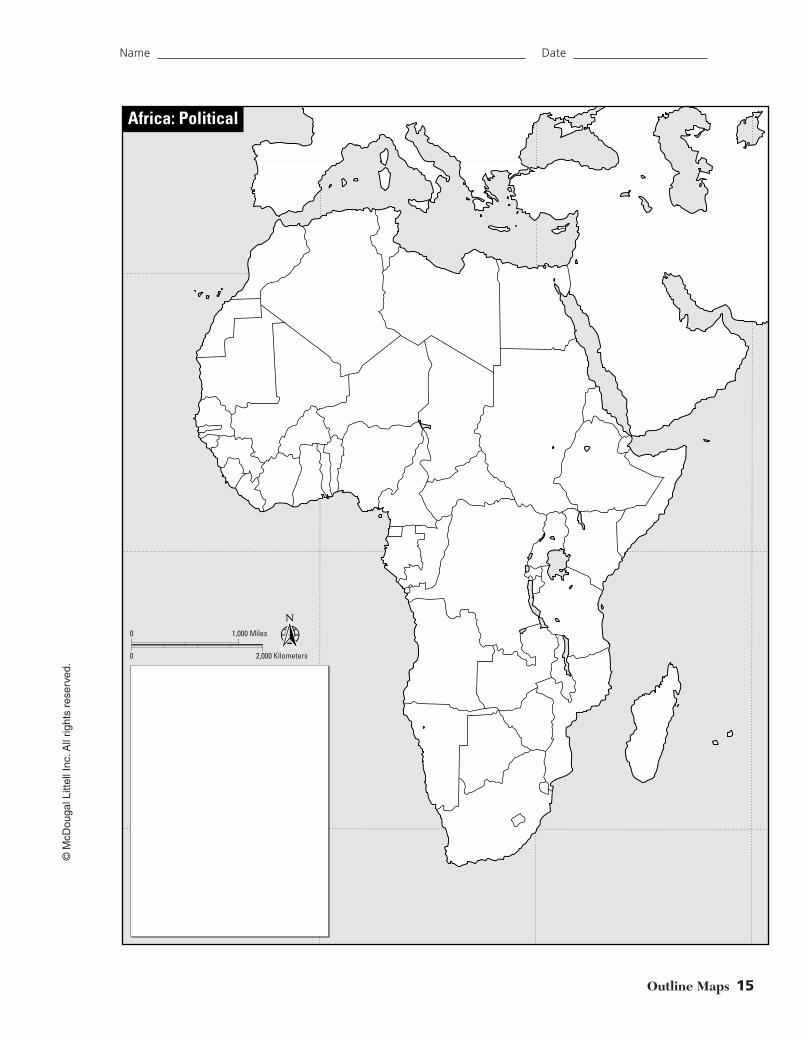
Africa: Political
015-wh10a-GSOM 11/11/2003 11:08 AM Page 15
©M
cDou
gal L
ittel
l Inc
.All
right
s re
serv
ed.
16 Outline Maps
Name Date
02,
000
Kilo
met
ers
01,
000
Mile
s
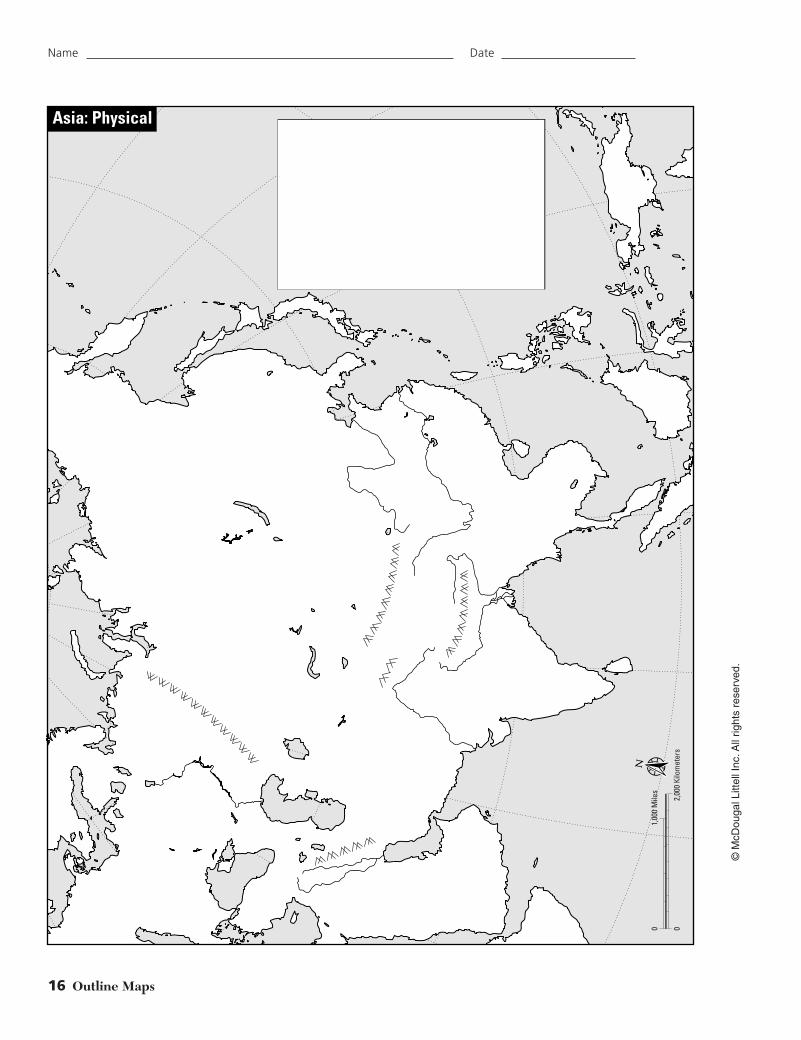
Asia: Physical
016-wh10a-GSOM_P1 11/11/2003 11:14 AM Page 16

Outline Maps 17
©M
cDou
gal L
ittel
l Inc
.All
right
s re
serv
ed.
Name Date
02,
000
Kilo
met
ers
01,
000
Mile
s
Asia: Political
017-wh10a-GSOM 11/11/2003 11:14 AM Page 17

©M
cDou
gal L
ittel
l Inc
.All
right
s re
serv
ed.
18 Outline Maps
Name Date
02,
000
Kilo
met
ers
01,
000
Mile
s
Eurasia
018-wh10a-GSOM 11/11/2003 11:15 AM Page 18
Outline Maps 19
©M
cDou
gal L
ittel
l Inc
.All
right
s re
serv
ed.
Name Date
02,
000
Kilo
met
ers
01,
000
Mile
s
East Asia
019-wh10a-GSOM 11/11/2003 11:15 AM Page 19

©M
cDou
gal L
ittel
l Inc
.All
right
s re
serv
ed.
20 Outline Maps
Name Date
02,
000
Kilo
met
ers
01,
000
Mile
s
North Asia and Russia
020-wh10a-GSOM 11/11/2003 11:15 AM Page 20
Outline Maps 21
©M
cDou
gal L
ittel
l Inc
.All
right
s re
serv
ed.
Name Date
02,
000
Kilo
met
ers
01,
000
Mile
s
Southeast Asia
021-wh10a-GSOM 11/11/2003 11:15 AM Page 21
©M
cDou
gal L
ittel
l Inc
.All
right
s re
serv
ed.
22 Outline Maps
Name Date
01,
000
Kilo
met
ers
050
0 M
iles
Southwest Asia
022-wh10a-GSOM 11/11/2003 11:15 AM Page 22
Outline Maps 23
©M
cDou
gal L
ittel
l Inc
.All
right
s re
serv
ed.
Name Date
0 200 Kilometers
0 100 Miles
The Middle East
023-wh10a-GSOM 11/11/2003 11:16 AM Page 23

©M
cDou
gal L
ittel
l Inc
.All
right
s re
serv
ed.
24 Outline Maps
Name Date
0 1,000 Kilometers
0 500 Miles
The Indian Subcontinent
024-wh10a-GSOM 11/11/2003 11:16 AM Page 24
Outline Maps 25
©M
cDou
gal L
ittel
l Inc
.All
right
s re
serv
ed.
Name Date
01,
000
Kilo
met
ers
050
0 M
iles
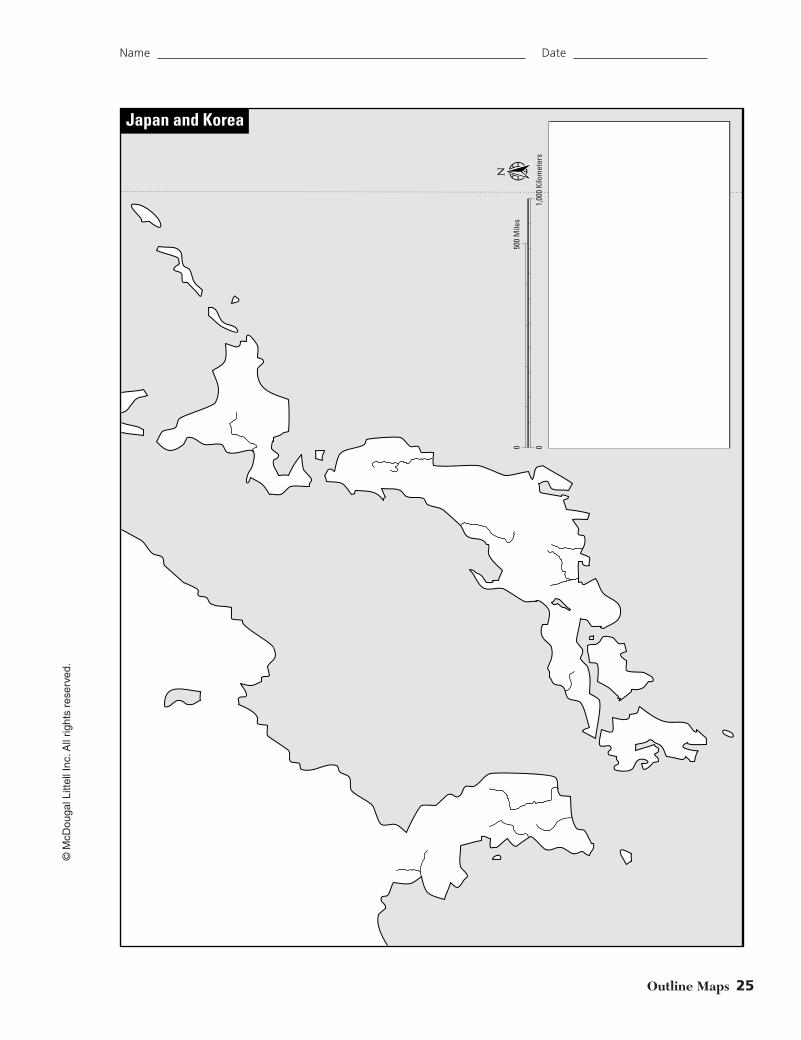
Japan and Korea
025-wh10a-GSOM 11/11/2003 11:16 AM Page 25

©M
cDou
gal L
ittel
l Inc
.All
right
s re
serv
ed.
26 Outline Maps
Name Date
Australia and New Zealand: Physical
01,
000
Kilo
met
ers
050
0 M
iles
026-wh10a-GSOM 11/11/2003 11:16 AM Page 26
Outline Maps 27
©M
cDou
gal L
ittel
l Inc
.All
right
s re
serv
ed.
Name Date
01,
000
Kilo
met
ers
050
0 M
iles
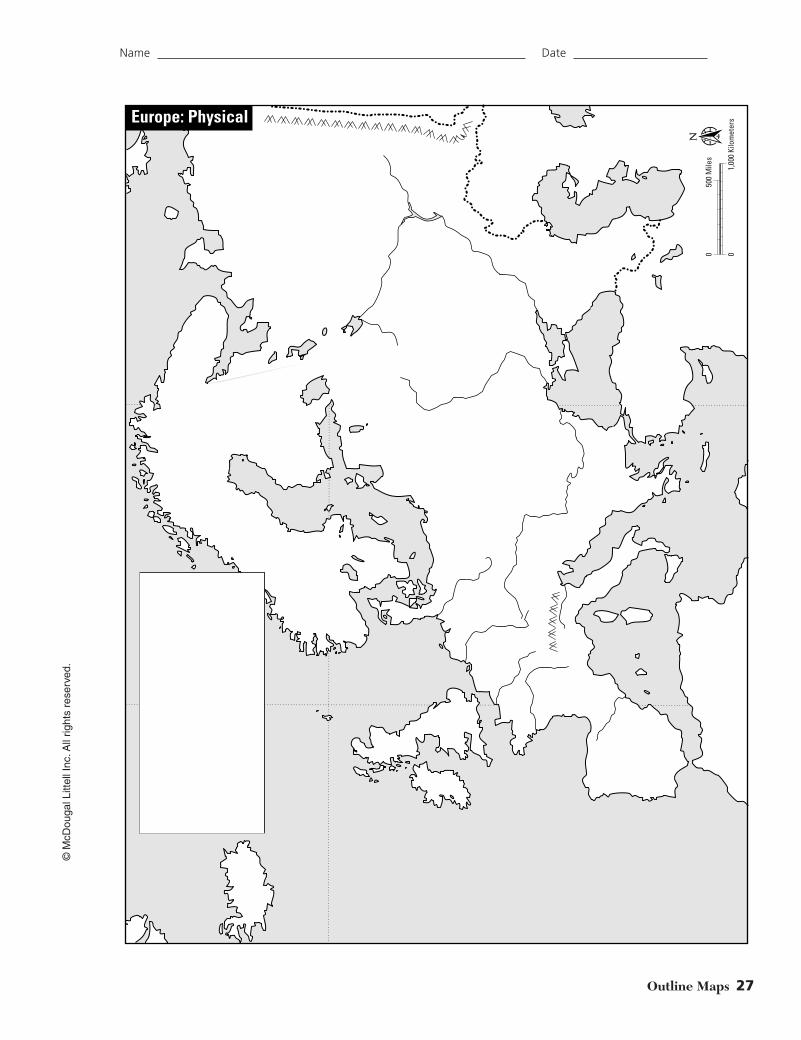
Europe: Physical
027-wh10a-GSOM 11/11/2003 11:16 AM Page 27

©M
cDou
gal L
ittel
l Inc
.All
right
s re
serv
ed.
28 Outline Maps
Name Date
01,
000
Kilo
met
ers
050
0 M
iles
Europe: Political
028-wh10a-GSOM 11/11/2003 11:16 AM Page 28

Outline Maps 29
©M
cDou
gal L
ittel
l Inc
.All
right
s re
serv
ed.
Name Date
01,
000
Kilo
met
ers
050
0 M
iles
The Mediterranean Region
029-wh10a-GSOM 11/11/2003 11:17 AM Page 29
©M
cDou
gal L
ittel
l Inc
.All
right
s re
serv
ed.
30 Outline Maps
Name Date
040
0 Ki
lom
eter
s
020
0 M
iles
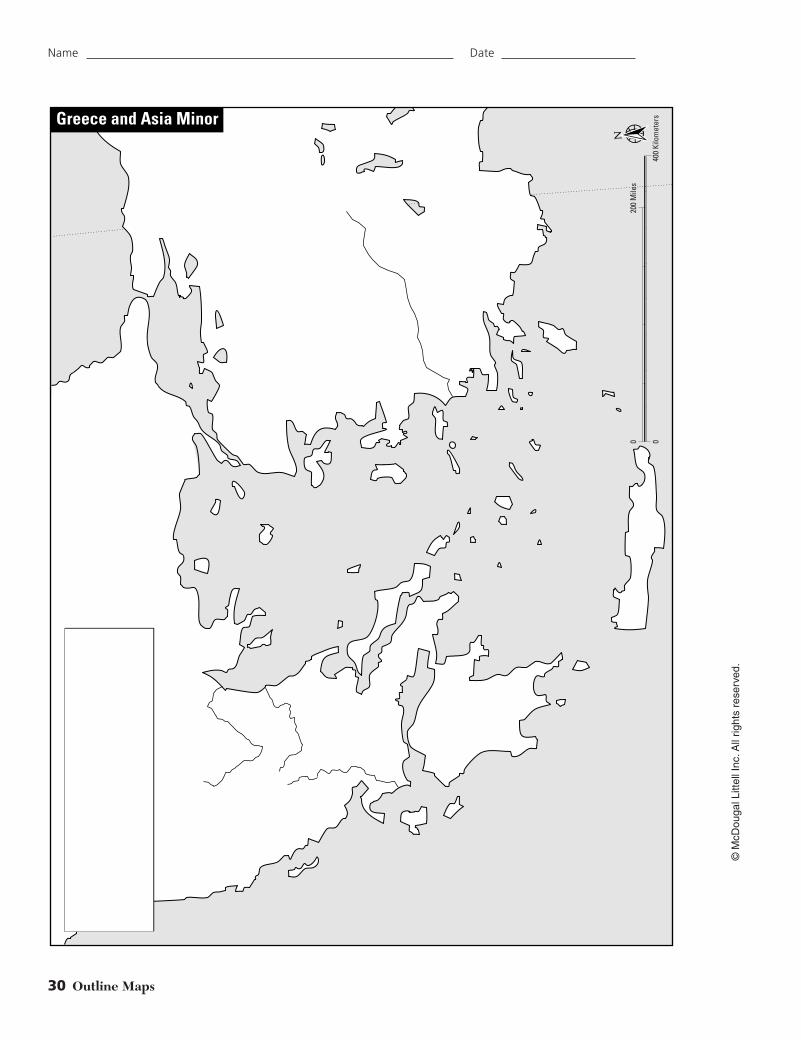
Greece and Asia Minor
030-wh10a-GSOM 11/11/2003 11:17 AM Page 30

Outline Maps 31
©M
cDou
gal L
ittel
l Inc
.All
right
s re
serv
ed.
Name Date
02,
000
Kilo
met
ers
01,
000
Mile
s
North America: Physical
031-wh10a-GSOM 11/11/2003 11:17 AM Page 31

©M
cDou
gal L
ittel
l Inc
.All
right
s re
serv
ed.
32 Outline Maps
Name Date
02,
000
Kilo
met
ers
01,
000
Mile
s
North America: Political
032-wh10a-GSOM 11/11/2003 11:17 AM Page 32
Users’ Note
The Outline Maps found on the EasyPlanner CD-ROM are “low-resolution”maps. This saves you time when printing and viewing the maps with yourcomputer--perhaps as much as 5-10 minutes per map. However, it means themaps print using “grayscale,” and depending on the quality of your printer,the images produced may not be as clear as you would like them to be. For“high-resolution” maps, please use the print Outline Map booklet found inthe Teacher’s Resource Package.

©M
cDou
gal L
ittel
l Inc
.All
right
s re
serv
ed.
34 Outline Maps
Name Date
01,
000
Kilo
met
ers
050
0 M
iles
Mexico and Central America
034-wh10a-GSOM 11/11/2003 12:02 PM Page 34

Outline Maps 35
©M
cDou
gal L
ittel
l Inc
.All
right
s re
serv
ed.
Name Date
0 1,000 Kilometers
0 500 Miles
South America: Physical
035-wh10a-GSOM 11/11/2003 11:18 AM Page 35
©M
cDou
gal L
ittel
l Inc
.All
right
s re
serv
ed.
36 Outline Maps
Name Date
0 1,000 Kilometers
0 500 Miles
South America: Political
036-wh10a-GSOM 11/11/2003 11:18 AM Page 36