geography - wordpress.com › 2019 › ... · 2019-04-11 · geography and history 2º eso ies...
TRANSCRIPT

GEOGRAPHY AND HISTORY
2º ESO IES VALDEBERNARDO
YEAR: 2018-19
NAME: …………………………………….

1
INDEX
Unit 6 – Demography: the study of the population
Unit 7 – Rural and urban settlements

2
TABLE OF CONTENTS:
1. Population growth: the evolution of the World’s population.
2. World population distribution. 2.1. Factors for high-density areas.
2.2. Demographic deserts: factors and areas.
3. Population changes: migrations. 3.1. Population changes: natural increase and migrations.
3.2. Migrations: types.
3.3. The effects of migration.
3.4. Global migration history and current migratory flows.
4. Population changes: natural increase. 4.1. The natural increase of population.
4.2. Birth rates and their factors.
4.3. Death rates and their factors.
4.4. Demographic models: the Demographic Transition Theory.
5. The structure of the population: population pyramids.
6. The population of Europe. 6.1. Evolution and distribution.
6.2. Population growth: natural increase and current migratory trends.
7. The population of Spain. 7.1. Evolution of Spanish population and distribution.
7.2. The migration history of Spain.
7.3. The natural increase of Spain’s population.

3
Demography: it is the science in charge of studying the population, changing in time and space. Population is all the people who inhabit a particular area. We study the evolution in time, the distribution in the space, the dynamics, etc. Demos (GR) People Graphy (GR) Writing, description, measurement. Currently: about 7,5 billion people. Distribution in regions:
- Asia: 4504 million (59,7 %) - Africa: 1256 million (16,6 %) - America: 1006 million (13,4 %) - Europe: 742 million (9,8 %) - Oceania: 40 million (0,5 %)
Evolution: very fast growth since the 18th century.
Most populated countries in the world: China (1,4 billion), India (1,3 billion), USA (325 million), Indonesia (263 million) and Brazil (209 million).

4
Distribution the population: the way people are spread across a given area. Measured by the population density, which is calculated by dividing the number of people and the area in square kilometres. The result is expressed in inhab / km2.
The population is unevenly distributed, and while there are demographic deserts (even less than 1 inhab/km2) there are super-populated areas (even more than 20000 inhab/km2). Population density depends on a set of factors that may be favour or discourage human settlements.
High-density areas of the world:
- Asia: eastern China, Japan, Ganges and Indus Valleys, Java (Indonesia). - Africa: coasts of Nigeria, Maghreb and banks of river Nile (Egypt). - Central and South America: Rio de Janeiro-Sao Paulo (Brazil), Río de la Plata
(Argentina-Uruguay) and central Mexico. - North America: eastern coast and south-west of the USA, Great Lakes. - Europe: Manchester to Milan curve (London, Netherlands, Ruhr valley, Po valley),
Paris, Bosporus strait (Istambul), Moscow (Russia). - Oceania: south-eastern coast of Australia.
Physical factors:
- Climate: temperate climates are more favourable. - Relief: flat or not very elevated lands. Coastal areas and the mouths of rivers tend to attract
large populations. - Soil: fertile lands, or with supplies or natural resources.
Human factors:
- Historical populations: areas with longer history of large populations (ie. the east coast Vs west coast of the USA).
- Economy:

5
o Primary sector (agriculture, livestock farming, etc.): favourable agricultural conditions, areas of intensive agriculture.
o Secondary sector (mining, industry, energy production): large deposits of raw materials for industry and energy production (coal, oil, etc.). Traditional industrial locations (English Midlands and Ruhr valley in Germany), related with the availability of raw materials. Areas where industries are delocalised (China, India, Bangladesh, etc.) tend to attract great numbers from rural to urban areas. Strategic areas are also favoured.
o Tertiary sector (services): areas of technological advances (developed world), specialised services (ie. tourism) and administrative centres (capitals of countries).
Highest densities (by country): Monaco (18589 inhab/km2), Singapore (7796 inhab/km2), Bahrain (1917 inhab/km2), Vatican City (1818 inhab/km2) … Bangladesh (1138 inhab/km2) … Taiwan (651 inhab/km2) … South Korea (513 inhab/km2) … Netherlands (414 inhab/km2).
Physical factors:
- Climate: extreme climates, either hot (desert, equatorial) and cold (high mountain, polar). - Relief: mountain ranges. - Soil: poor lands with scarcity of natural resources.
Human factors:
- Historical populations: areas barely populated in History, generally due to isolation (centre of large continents or remote islands, for example).
- Economy: lack of economic activities. That may be due to the climate or soil for the primary sector, lack of industries and tertiary activities. Areas of extensive agriculture (cereals, for example) have very low densities, such as the Great Plains (USA), Canada and Argentina.
Least densely-populated countries: Mongolia (1,9 inhab/km2), Namibia (2,6 inhab/km2), Australia (3 inhab/km2), Iceland (3,4 inhab/km2).

6
Migration: movement of people from one location to another to settle temporarily (but for more than one year) or permanently. Migrants make a conscious choice to leave their country of origin looking for a better life elsewhere.
Emigration leaving place of origin. Immigration receiving, arriving, entering in a country. Migratory balance of a country difference immigrants – emigrants (if positive, the country has more population, and if negative it is losing population). It is usually positive in developed countries,
Migrations can be classified depending on the following elements: duration, character, origin, causes and final destination.
- Character: o Voluntary migrations: people seek better opportunities and living conditions. o Forced migrations: refugees, that is, people who escape from wars, religious or
political prosecutions, etc. These migrants look for safety and protection of human rights rather than better economic conditions.
- Final destination: o Regional migrants: to the main economic location of a province or region. o National: within the borders of the same country, but different regions. o Continental: within the same continent. o Intercontinental: to another continent.

7
There are different effects depending if it the emitting or receiving country.
- Demographic: migrants tend to be revitalise the population of a country, so immigration implies younger and more active populations (and an increase in birth rates), while emigrant countries lose active population.
- Economic: countries of origin lose recently-educated population (even if there are unskilled workers), so they have a negative economic impact. On the other hand, emigrants tend to send money to their families in their countries of origin. The receiving countries receive young population with a long working life ahead, and if the migrants are unskilled workers they will occupy unwanted positions. If they are skilled workers they increase the added value to the workforce of the country. In addition to this, younger populations do not use some public services such as health care.
- Cultural diversity: migrations bring ethnical and cultural diversity to a country. However, some populations reject this due to racism and xenophobia.
Migrations have changed throughout history, and current flows do not reflect patterns of the past. From the Modern Age until the 20th century, migrations have been as follows:
- Europe: traditionally emitting continent towards the Americas and in less degree to Australia. Most of these migrations were related with colonial empires (Spain in Central and South America; England in North America, Oceania, etc.). Internally speaking, the Industrial Revolution (from the late 18th century until the Second World War) meant waves of rural exodus both inside the countries and internationally. From the 1950s onwards, Europe became a receiving continent from former colonies, such as Maghrebis and sub-Saharans to France, Caribbean and South-Asian populations in the United Kingdom; South and Central Americans in Spain, etc. Also, there have been important continental migrations, mostly from the east to the west of the continent, such as Turkish to Germany, Polish to the United Kingdom and Romanians to Spain.
- Asia: China, India and the Philippines have been emitting countries for intercontinental migrations until recently, while smaller countries experienced continental migrations. Recent economic changes caused that China and India have been subjected to great internal movements from rural to urban areas. Some Middle Eastern countries (United Arab Emirates, Saudi Arabia) are currently receiving migrants due to the economic growth experienced thanks to the extraction of oil and gas.
- Africa: African migrations have been traditionally marked by emigration. From the 15th century, forced migrations –slavery- towards Brazil, the Caribbean and North America were the most relevant. Currently, movements are voluntary due to the political instability after the end of colonial rule and the dire economic conditions, and the destinations are generally developed countries of Europe.
- America: mostly a receiving continent after the early European colonisation in the 15th century, until the 20th century it has been destination from the European metropolises (Spain, Portugal, Ireland, etc.) and slaves from Africa. In the 20th century, North America has continued receiving immigration from Asia and Latin America, while South America has emitted people towards the United States and European countries.

8
The natural increase of the population is related with births and deaths and excludes migrations. That is, it focuses on the ways the population of a place grows or decreases by ‘natural reasons’. This rate reflects historical, technological, economic, social and ideological changes in a place. Rate of Natural Increase: if it is positive, the population grows; if negative, it decreases.
The birth rate is based on the relation between the total number of births in one year and the total population of a place or country.
Factors that affect the birth rate:
- Biological: maternal age, fertility rate. - Demographic: since it relates births with the total population, if the older population is
greater, the birth rate is lower. - Socioeconomic: degree of urbanisation, ideology (religion), availability of birth control
methods (contraception), average age at marriage, cost of raising and educating children, existence of social provisions, degree of education, etc.
Birth rates tend to be higher in less developed countries (Niger 49 ‰, Zambia and Mali 46 ‰, etc.) while developed countries low or very low (Germany 8 ‰, Italy and Japan 9 ‰, etc.). Fertility rate: it is directly related with the birth rate. It links the total number of births in one year in one place with the number of women of child-bearing age (15-49 years of age). It is expressed as average number of children per woman, so no unit (‰) is used. It is considered that a fertility rate of 2.1 guarantees the stable replacement of the population, while lower rates reflect lower birth rates and a higher one a population growth. This

9
rate is also higher in less developed countries (Niger 7,3; Chad and Somalia 6,4; Angola 6,3, etc.) and lower in developed areas (European Union 1,58; Bosnia and Herzegovina, China and Romania 1,2; Greece, Spain and Italy 1,3, etc.).
The death rate is based on the relation between the total number of births in one year and the total population of a place or country.
Factors that affect the death rate:
- Demographic: since it relates the total number of deaths with the total population, if the older population is greater, the death rate will grow because of the life expectancy.
- Socioeconomic: degree of urbanisation, diet and nutrition, medical technology (vaccination, antibiotics, immunizations, etc.), existence of health care systems, hygiene and sanitation, economic level, access to clean water, violent conflicts, etc.
Death rates are lower in developed and developing countries (with increasing access to health care systems) with younger populations; traditionally-developed countries are ageing, so the death rate is growing (and the ‘3C’ is more important: cars, cancer and cardiovascular diseases); and death rates are high in less developed countries where infectious diseases affect more greatly, less access to health care, famines, wars. Afghanistan 18,2 ‰, Swaziland 18 ‰, Nigeria 15,3 ‰, Somalia 14,5 ‰, etc; United Arab Emirates 0,9 ‰, Qatar 1,1 ‰, Kuwait 1,8 ‰; Andorra 3,5 ‰, Ecuador 4,1 ‰, Mexico 5 ‰, Brazil and Ireland 6,3 ‰, China 7,1 ‰, USA and Netherlands 8,1 ‰.
Infant Mortality rate: number of children who die before reaching one year of age, in one year in a particular place or country. It directly reflects the socioeconomic level of the country, since access to health care is especially important for giving birth and for babies, and they are more sensitive in case of nutritional problems.
Afghanistan 112,8 ‰, Mali 100 ‰, Somalia 96,6 ‰, Central African Republic 88,4 ‰; Norway 2,5 ‰, Singapore 2,4 ‰, Iceland 2,1 ‰, Japan 2 ‰, Monaco 1,8 ‰.

10
Life expectancy: it is the average of years a newborn is expected to live for in a particular place. It also reflects the degree of access to health care and medical advances, as it is reflected by the great increase experienced in advanced countries during the 20th century. It is worth mentioning than women have a higher life expectancy than men.
COUNTRY LIFE EXP. FEMALES MALES COUNTRY LIFE EXP. FEMALES MALES
Japan 83.7 86.8 80.5 Cote
d’Ivoire 53.3 54.4 52.3
Switzerland 83.4 85.3 81.3 Chad 53.1 54.5 51.7
Singapore 83.1 86.1 80.0 C. African R. 52.5 54.1 50.9
Australia 82.8 84.8 80.9 Angola 52.4 54.0 50.9
Spain 82.8 85.5 80.1 Sierra Leone 50.1 50.8 49.3
The Demographic Transition Theory studies the birth and death rates and their evolution in time. In developed countries (ie. western Europe) the Pre-Industrial phase lasted until the 18th century, and the Modern phases began with the Industrial Revolution in the early 19th century. The fifth phase reflects ageing populations with lower birth than death rate.
Population pyramids are graphs that show the structure of the population, that is, the division of the population according to gender and age. Natural increase of the population, the life expectancy and the level of development can be analysed with population pyramids. Elaboration of a population pyramid:
- Axis X Left for males (blue), right for females (red). Ages in the centre. Careful with the length of the axis (take the longer measure, and organise your space from there).

11
- Axis Y Divide in group of five years (0-4; 5-9; 10-14…).
Analysis of a population pyramid: shape, age groups, longer and shorter bars, differences between males and females, birth and death rates, life expectancy, level of development of the country, stage in the demographic transition theory, future projections (increase or decrease of population), etc.
EUROPE
742.073.853 inhabitants – 9,8 % world’s population. 34 inhab/km2
74,2 % urban population – 25,8 % rural population. 41,8 – median age
LARGER POPULATIONS HIGHER DENSITIES
Russia 143 700 000 Monaco 18005,4 inhab/km2
Germany 80 716 000 Vatican City 1913,6 inhab/km2
Turkey 79 814 871 Malta 1413,1 inhab/km2
France 66 730 000 San Marino 532,3 inhab/km2
United Kingdom 64 100 000 Netherlands 405,8 inhab/km2
EUROPEAN UNION
Total population – 516 million. Population density – 118,3 inhab/km2
Median age - 42.9 years

12
European Union – Eurostat Natural movements: Birth rate – 10,1 ‰ Death rate – 10,2 ‰ Net migration rate – 2,5 ‰ Infant mortality rate – 4 ‰ Life expectancy at birth – 80,2 years (Male: 77,4 years; female: 83,2 years) Total fertility rate: 1.61. Migration in the European Union:
- Internal migration: o Younger workers from less economically developed regions and to move to more
prosperous regions in their country or to EU countries with good economic prospects. o Retirees from wealthier places with colder weather to the sun belt in southern
Europe. - External migration:
o 2010: 31,4 million people (6,3 % total population) born outside the EU. The largest absolute numbers of people born outside the EU were in Germany (6.4 million), France (5.1 million), the United Kingdom (4.7 million), Spain (4.1 million), Italy (3.2 million), and the Netherlands (1.4 million).
o From less developed areas of the world to Europe, many times to former colonial powers.
13
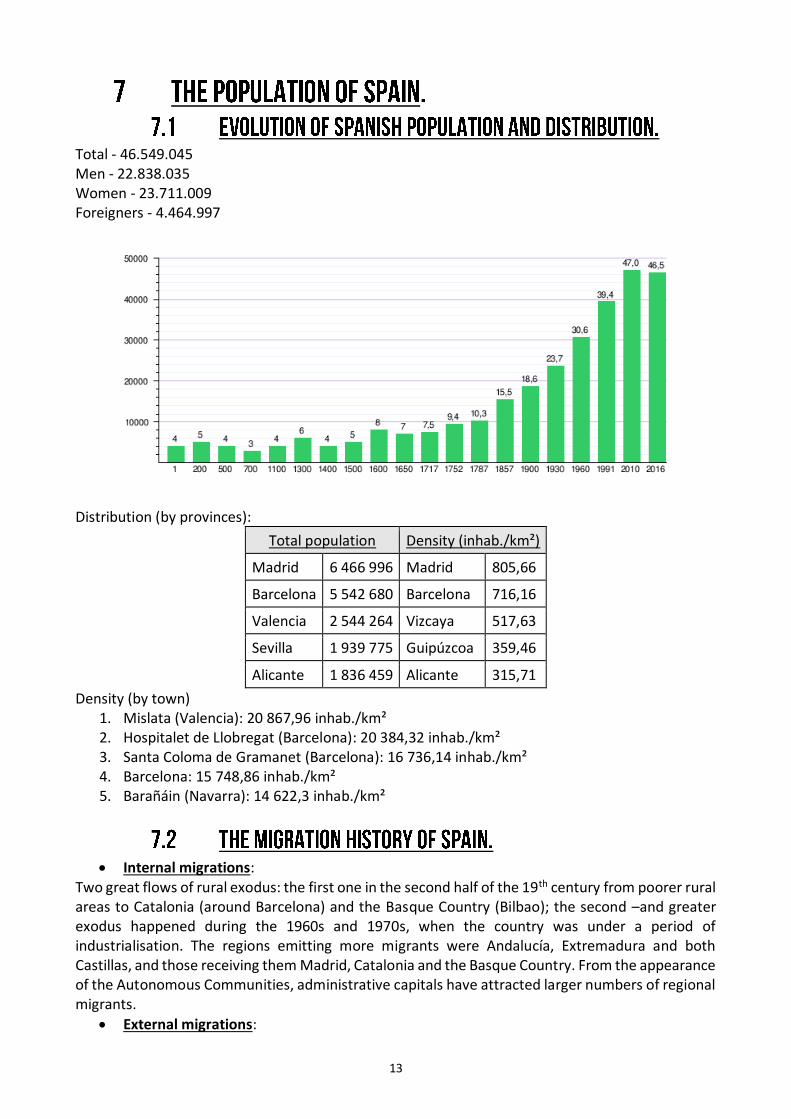
Total - 46.549.045 Men - 22.838.035 Women - 23.711.009 Foreigners - 4.464.997
Distribution (by provinces):
Total population Density (inhab./km²)
Madrid 6 466 996 Madrid 805,66
Barcelona 5 542 680 Barcelona 716,16
Valencia 2 544 264 Vizcaya 517,63
Sevilla 1 939 775 Guipúzcoa 359,46
Alicante 1 836 459 Alicante 315,71
Density (by town) 1. Mislata (Valencia): 20 867,96 inhab./km² 2. Hospitalet de Llobregat (Barcelona): 20 384,32 inhab./km² 3. Santa Coloma de Gramanet (Barcelona): 16 736,14 inhab./km² 4. Barcelona: 15 748,86 inhab./km² 5. Barañáin (Navarra): 14 622,3 inhab./km²
Internal migrations:
Two great flows of rural exodus: the first one in the second half of the 19th century from poorer rural areas to Catalonia (around Barcelona) and the Basque Country (Bilbao); the second –and greater exodus happened during the 1960s and 1970s, when the country was under a period of industrialisation. The regions emitting more migrants were Andalucía, Extremadura and both Castillas, and those receiving them Madrid, Catalonia and the Basque Country. From the appearance of the Autonomous Communities, administrative capitals have attracted larger numbers of regional migrants.
External migrations:

14
o History: Spain has been an emigrant country until very recently. From the migrations to the New World from the 15th century until the first half of the 20th century, to the attraction of industrialised European countries such as Germany, France and Switzerland between the 1940s and 1960s.
o 21st century: for the first time, Spain has recently experienced large-scale immigration in our modern history. From about a 3% of the total of the population to a historical record of about 5 million foreigners (about 13 % of the population). Currently, there are about 4,5 million immigrants living in Spain (about 10 % of the population). Spain has attracted two types of migrants:
Economic migrants from less developed countries, mostly from Eastern Europe, South America and Northern Africa. They comprise about 80 % of the foreign inhabitants.
Ageing population from richer countries such as the United Kingdom, Netherlands and Germany, looking for cheaper living costs and better weather for their retirement. They account for 20 % of the immigrants.
o In addition to this, the recent economic recession has had demographic consequences, making the migratory balance negative for several years, with Spanish nationals migrating to wealthier countries (Germany, United Kingdom, etc.) looking for better opportunities and foreign residents returning to their countries of origin.
MIGRATIONS 2016 IMMIGRATION EMIGRATION MIGRATORY BALANCE
Total 237.115 184.189 52.926
Spanish nationals 33.028 46.004 -12.976
Foreign nationals 204.087 138.185 65.902
Top five foreign nationals in Spain: Romania: 798 104; Morocco: 773 966; Ecuador: 316 756; United Kingdom: 312 098; Colombia: 250 087.
Total population - 46.549.045 inhabitants. Natural increase Total births - 187.703 Fertility rate - 1,38 Maternity age (average) – 32 years.
Total deaths - 219.835 Life expectancy - Total 83,11 (Males 80,31; females 85,84) Infant mortality rate – 2,65

15
Structure of the population. Young – 14,3 % Adult – 69 % Elderly – 16,7 % Total men - 22.838.035; total women - 23.711.009 (50,58 % female; 49, 42 % male) Median age – 42,7 years (Male: 41,5 years; female: 43,9 years)
GLOSSARY
Demography (with population) Population density
Migration Net migration rate
Natural increase of population
Birth rate, death rate Infant mortality rate
Life expectancy Population pyramid
Demographic transition theory.
Young – 14,3 %
Adult – 69 %
Elderly – 16,7 %
50,58 % female; 49, 42 % male.

16
EXERCISES:
1. Population density - Find the population density of the following countries.
COUNTRY AREA (Km2) TOTAL POPULATION (inhab) DENSITY
(inhab / km2)
Germany 357.000 81.000.000
Saudi Arabia 2.150.000 32.000.000
Argentina 2780000 42000000
Australia 7741000 24000000
Brazil 8515000 205000000
2. Distribution of European population - Identify the areas with more density of the map, and
explain the factors that may affect them.

17
3. Population densities - Complete the table and answer the questions.
COUNTRY TOTAL POPULATION AREA DENSITY
Hungary 9.900.000 inh. 93.033 km2
China 1.294.400.000 inh. 135,21 inh./km2
United States of America 9.529.063 km2 30,27 inh./km2
Singapore 4.200.000 inh. 618 km2
a. Which country has got more population? b. Which country is larger? c. Which country has a higher population density? d. Why has the smaller country a higher density than the larger?
4. Complete the table by looking for information in the CIA World Factbook.
COUNTRY TOTAL POPULATION NET MIGRATION RATE Positive or negative NMR?
Morocco
United Kingdom
Qatar
Italy
Romania
Canada
Turkey
South Africa
5. Natural increase of the population – Complete the table.
COUNTRY BIRTH RATE (‰) DEATH RATE (‰) NATURAL INCREASE
DR Congo 46 16
Ecuador 21 5
Spain 9.1 8.5
USA 13 8
India 21 7
Ireland 15 6
Japan 8 10
Niger 50 11
6. Population growth - With the following data of a country, find all the rates you can:
Total population: 62,007,540 Total area: 301,338 km2 Births: 474,000 Deaths: 608,000 Foreign nationals: 5,014,437 Immigration: 250,026

18
7. Death rates – Answer the following questions about the following map.
a. What death rates do you see in Europe and Africa? b. What factors explain these rates? c. Name five countries that have a death rate of more than 16 ‰. d. Name five countries that have a death rate of less than 4 ‰.
8. Population structure – Answer the following questions about this chart.
a. What do these pie charts show? b. What are the differences between the population in 1950 and 2000? c. Which age group grows the most across the three charts? d. Which age group falls the most across the three charts? e. What problems will the world population face in 2050?

19
9. Population structure – With the following data, draw a population pyramid in your notebook and answer the following questions:
Age Males Females Age Males Females
Total 100 100 40-44 4,2 4,2
0-4 16,7 16,4 45-49 3,3 3,4
5-9 14 13,8 50-54 2,6 2,8
10-14 12,6 12,4 55-59 2,2 2,4
15-19 11,5 11,3 60-64 1,7 1,8
20-24 9,3 9,2 65-69 1,2 1,4
25-29 7,6 7,5 70-74 0,8 1
30-34 6,4 6,3 75-- 0,6 0,9
35-39 5,3 5,2
a. What type of pyramid is it? b. Does it correspond to a developed, developing or less-developed country? c. Has it got a high or low birth rate? d. Has it got a high or low death rate? e. Which age has the longest bar? f. Which is the population group with more population? g. Are there more males or females? In what age groups? Why? h. Is its population going to grow or decrease in the near future? Why?
10. The population of Spain – Identify the areas with higher population density in Spain.

20
11. The population of Spain – Taking into account the Demographic Transition Theory, identify the moments of greater change of the Spanish population.
12. The population of Spain - With the following data, find the rates with no results:
Total population - 46.549.045 inhabitants. Density – 91,95 inhab./km2. Area: Total increase of the population: 57.953. Total births - 187.703
Birth rate: Total deaths: 219.835 Death rate: Total natural increase: Rate of natural increase:
TEXT – SPAIN’S POPULATION SET TO DROP 11% BY 2050. Stephen Burgen, The Guardian. 20 Oct 2016.
Low birth rate and high life expectancy ‘will lead to 5.3 million fewer inhabitants and over-65s making up 34% of total’.
Spain by 2050 will be a depopulated nation dominated by elderly and single people, according to a report that predicts the country will have lost 5.3 million inhabitants, or 11% of the current population, by the middle of the century. Spain’s low birth rate and high life expectancy are seen as a demographic problem that the report, released by the national statistics office on Thursday, expects to become more entrenched. If the trends continue, by 2050 the over-65s will make up 34.6% of the population, while close to a quarter of a million Spaniards will be over 100 years old. By that date there will be 1.7 million fewer children under 10 than there are today.

21
A country also once famed for large families seems destined to become a nation of singletons, with single-person households rising by about a fifth over the next 15 years, to make up 28% of the total. Two-person households will make up a third of the total. While the fertility rate is predicted to rise slightly, from 1.33 to 1.38, births will fall overall because there will be fewer women of childbearing age. The average age at which Spanish women have their first child is expected to rise from 31.9 to 33 years. In the first 10 years of the millennium, immigration from Latin America, north Africa and elsewhere in Europe boosted Spain’s reproductive population, but following the financial crisis hundreds of thousands of those immigrants have returned home. Meanwhile, large numbers of young Spaniards have themselves emigrated in search of work. However, immigration is predicted to slightly exceed emigration in the coming years. In 1900 life expectancy in Spain was 35, meaning that half of those born did not live to be 15. Life expectancy is now 80 for men and 85 for women; if the trends continue, by 2065 this will rise to 88 and 91 respectively. Demographers stress that elderly people should not be seen as burdensome on Spanish society. “They have resources, 70% have paid off their mortgages,” said Julio Pérez Díaz, a demographer at the Centre for Human and Social Sciences in Madrid. “They are big consumers and during the long financial crisis it has been pensioners who, above all, have saved their children and grandchildren from going under.” Antonio Argũeso, of the institute that produced the paper, cautioned: “These are not so much predictions but references to the way things might evolve. In the 1990s we didn’t think Spain would arrive at a population of 40 million but no one had predicted that 10 years later six million immigrants would arrive and take the population to 47 million”.
Answer the following questions in your notebook: 1. Summarise the news in three lines. 2. What rates related with births are presented in the text? Specify what it is mentioned
about each. 3. What factors related with the birth rates are included in the text? 4. What rates related with deaths are presented in the text? And the factors? 5. What has the role of migrants been for Spanish demographics?

22
TABLE OF CONTENTS:
1. Rural and urban settlements: the process of urbanization
2. Rural habitats across the World 2.1. Urban structure and morphology
2.2. Traditional houses and environment
3. Urban habitats: cities 3.1. The concept of city and its functions
3.2. Characteristics of cities: location, structure and morphology
4. Historical transformations of cities 4.1. Traditional cities
4.2. New cities and city expansion
4.3. Current forms of urban settlements: urban agglomerations
5. City life and urban problems
6. Settlements in Spain 6.1. Settlements today: urbanisation rate
6.2. Types of rural settlements in Spain
6.3. The history of urbanism in Spain
6.4. Urban Spain today: situation and problems

23
A settlements describes a territory occupied by people, and there are two basic types: rural and urban. In this unit we are going to study both of them, focusing on the types, functions, structure, morphology, historical evolution and the differences across the world. Urbanisation is the process which refers to the movement of people from rural areas to urban areas and its consequences.
The population of the world has been rural throughout the centuries, but –mostly– economic changes have led to an impressive growth in the urbanisation rate during the last century, causing many changes at all levels: politics, culture, economy, society, etc.

24
Rural populations in the world total 3.4 billion people (a little less than half of the current
world population), but they are decreasing quickly, especially in emerging and developing countries. Large areas of the world have populations that are mostly rural. Such places tend to be areas
which produce a range of foods and protect their natural environment.
Towns and villages are the conglomerations that each population forms when people group
together and organize themselves within a space that they use and work in. The form of a population depends on the activities on which it develops and on the
limitations imposed by the surrounding environment. Populations are characterized by having a diversity of forms and by having a diversity of forms and by their interaction with the environment in many different ways. There are three basic types of rural settlements:
- Dispersed: the houses are separated to one another and surrounded by the land they farm. - Concentrated: grouped into a village. They may be linear (along a road or a path) or clustered
(around a central point). - Interdispersed: some dwellings are isolated, while others are grouped together.
Dispersed and concentrated rural settlements

25
Traditional houses are characterized by their use of natural materials found in the
environment as well as by their functionality (home, workplace, stables, etc.). We can classify houses according their shape, the materials used in their construction, and their geographical location:
- Stone houses: These are durable homes which are characteristic of sedentary populations, such as agrarian communities in Europe, North Africa and the Middle East.
- Mud houses: These are made of adobe (a mixture of mud and straw). They sometimes have a wooden frame and often have roof made of branches. They are characteristic of communities involved in irrigated agricultural activities or extensive livestock farming (e.g. south of the Sahara desert or eastern and southern African savannahs).
- Wooden houses: These are found in forest areas, such as the equatorial forests of Africa and America, European and Canadian forests, and the taiga in Siberia. In wetter swamp areas, they are often built on wooden poles (stilts) to insulate their floors. These houses have a ground floor made of stone, the next floor made of wood and brick o adobe, and the top level made of wood.
- Houses of fur and fabric: These can be found in areas where nomadic livestock activities are carried out. Examples of these areas are the Asian steppes, the African deserts or the Lapland tundra in the north of Europe.
- Cave houses: These are also known as troglodyte homes because they are carved within rocks. They provide excellent thermal insulation because they are cool in summer and warm in winter. Although these structures were used during the Prehistoric times, sometimes these structures are currently used for storages or as cellars (e.g. eastern Andalucia).
- Ice homes: Eskimos build these near the Arctic using cubes of ice. They are called igloos.
During the last few decades, cities have become more densely populated. A majority of the
human population is now urban (4.13 billion people).
Cities are formed by a large group of people, houses and other permanent buildings which
form a settlements with high density of population. They are independent from food sources (that is, they do not produce their food), so they depend on the surroundings (hinterland: area of influence of a city). On the other hand, they provide services for the people living in them and for other individuals from more distant areas, and are the centre of political, economic and cultural activities.
Three main characteristics are needed for a human settlement to be considered a city: - Demographic size: Different countries use different criteria to define a city (10.000
inhabitants in Spain, 1.000 in Canada, 2.500 in the USA, etc.). - The functions they perform: They usually carry out work in the tertiary sector, and
sometimes in the secondary sector (mining and industrial cities). Cities are, by definition, independent from food sources. That is, they do not provide their own food, so they have to be supplied from somewhere else.
- Density and permanence: Cities have high population densities because the whole population is concentrated in a relatively small area.

26
A city is always linked with its origins and its original purpose. The main factors throughout history for location of cities have been generally defensive (on a hilly area such as Rome) or on the shores of a river such as Paris and London) and commercial (near crossroads, trading posts, navigable rivers, ports, etc., such as Istanbul, Hamburg, Barcelona, Lyon, etc.).
The urban structure is related with the different uses of the city, which are going to be related with past uses and their historical growth. We can identify historical areas, business areas, residential areas, commercial areas, slums and shantytowns.
Urban morphology refers to the external appearance of a city and is evident in the layout of the city and its streets, as well as in the buildings and their shapes. The different shapes are:
o Regular (grid layout): orthogonal or checkerboard plan. First used in Greece, spread thanks to the Romans, and re-used from the 16th century onwards in new cities (Montevideo, Havana, Lima, New York City, San Francisco, etc.) and in expansions (Eixample in Barcelona, Barrio de Salamanca in Madrid, etc.).
o Radial or circular plan: formed by a design of concentric rings, with streets radiating from its centre and cross streets forming circles around it. Moscow, Milan, Paris and Vitoria-Gasteiz are great examples of this type of plan.
o Irregular plan: with winding, narrow streets without a fixed model. Muslim and medieval cities such as Córdoba, central Madrid, Toledo and Lyon are examples of this.

27
Nowadays new cities and traditional ones have been experiencing radical changes. The main
reasons behind these changes are the rapid growth of their population and sizes.
Traditional cities are those that originated before the 19th century and the Industrial
Revolution. They preserve most of their old layout and historical heritage. A general overview of urban history.
- Ancient times: o The first cities in history were in ancient Mesopotamia, in the 4th millennium BCE. o Greeks lived in poleis (city-states), with a clear urban structure divided into the
acropolis (high city, on a hill, with a defensive and religious function) and the lower city, organised in irregular streets around a central square (Agora). They founded cities along the Mediterranean and Black Seas, so they influenced greatly other cultures such as the Romans.
o Rome was a very urban civilisation, and they used a grid system (invented in Greece) with two main streets (cardus and decumanus) with a central square (forum). They founded a great number of cities across their territories, and the structure of many current cities reflect their Roman past. From the 3rd century, urban lifestyle declined.
- Middle Ages: o The Islamic Caliphates promoted the development of cities as political, economic,
cultural and religious centres. Their walled cities (medina) were divided into neighbourhoods with a dense and irregular urban layout, with narrow streets.
o In the Late Middle Ages (12th-14th centuries), cities re-emerged in Western Europe. They followed irregular layouts, with a central square around which the main buildings (cathedral, town hall, etc.) were located and that acted as marketplace. The appearance of urban palaces for the nobility and the bourgeoisie is also relevant.

28
- Modern Age: o 15th century: urban regeneration continued, and new ideas for town planning with
Classical (Greek and Roman) influence sprang. The Italian city-states are examples of this.
o 16th century: the grid system is widely used in new cities, for example in newly-discovered territories such as the Americas, and in the expansion of some existing cities. However, it is not a complete grid, but the streets (narrow) are aligned and followed parallel and perpendicular lines.
o 17th and 18th centuries: the most relevant aspect is the appearance of some public spaces such as squares for embellishing the cities and showing the power of the monarchies, as well as public buildings and palaces. The Place Vendôme in Paris and the Plaza Mayor in Madrid are paradigmatic examples of the former, while the Louvre Palace and the Royal Palace of Madrid of the latter. Also, some urban projects were developed such as the famous ‘Trident’ in Rome.
The urban phenomenon is almost completely new for the majority of Africa and for large
parts of Asia, whereas in the US, Canada and Australia it was especially developed during the 19th century. However, there has been a recent vigorous (almost uncontrolled) growth in all the cities.
- 19th century: many urban projects in historical cities were carried out during the 19th century, responding to the needs presented by the new industrial societies and the increase of urban population due to the demand of workers in factories. Walls were torn down, whole neighbourhoods were demolished for sanitary reasons, and buildings began reaching higher levels. The project of Haussmann for Paris (organised radially around the Arch of Triumph and with great avenues) is the most important, but the Eixample of Barcelona by Ildefons Cerdà is also a notable example. In addition to this, the opening of large avenues was common, from new ones (Unter der Linden in Berlin) to the space left by the city walls (Ringstrasse in Vienna). The poverty of the proletariat (working class) and the insalubrity of their neighbourhoods led to the projection of some new urban tendencies such as the Garden City (E. Howard) to the Linear City (Arturo Soria, Madrid) in which industrial cities and nature would merge into one (suburban growth and urban sprawl).
- 20th century: the urban phenomenon becomes more widespread, and the changes in the industrial and the large rural exodus led to massive changes in the cities. Skyscrapers appeared in the late 19th century in the USA, and New York City became the city where they grew the most as symbol of the wealth and status of the private corporations that built them, as well as of the city itself. After Wold War II, commuter towns (ciudades dormitorio) and large residential neighbourhoods appeared, forming the first large metropolitan areas. The centre of European cities were neglected, commercial and administrative areas appeared around them (Central Business District). Urban expansion (commuter towns, suburban areas, etc.) also led to great changes in communications, so new infrastructures for transports were required: highways, railways, underground, etc.
- Current cities: From the 1970s onwards, cities have been ongoing another wave of change due to the closure of industries and the changes in the lifestyle. Industrial areas and cities have re-thought their urban model, historical centres have been redesigned and renewed and symbols have been built (the Tate Modern in London and the Guggenheim Museum in Bilbao’s Ría 2000 Plan are great examples). In other areas of the world there have been urban changes as well, from recently-developed cities specialised in trade (Dubai, Doha, Shanghai, etc.) or tourism (Cancún, Miami, etc.) to being the country’s capital (Brazil, Camberra, etc.). Also, it is worth mentioning the

29
importance of the urbanisation process in developing and underdeveloped countries, which has led to the creation of large megacities with great economic differences, that is, with very exclusive wealthy areas next to poor shanty towns and slums with very bad living conditions.
The growth of cities and the historical evolution have led to urban centres of different sizes, shapes and functions. It we look at the size, cities can be considered small (less than 50 000 inhabitants), medium (between 50 000 and 500 000 inhabitants) or large (more than 500 000 inhabitants).
Large cities have increased in the last decades, but also the area covered by them has also grown, and many have spread beyond their original limits over the surrounding rural areas or even joining other cities. These are called urban agglomerations, which can be:
Megacities: according to the UN, these are cities with more than 10 million inhabitants. They are economic, political and administrative centres that influence the rest of the world (Mexico City, Shanghai, Sao Paulo, etc.)
Metropolitan areas: the result of the growth of a city absorbing the surrounding towns and villages. This is the case of Paris, London and New York City.
Conurbations: one or more cities of similar size merging together. For example, Rotterdam-Amsterdam in the Netherlands.
Urban regions: when a large territory is urbanised due to the growth of individual towns. A clear example is the Ruhr region in Germany, with cities such as Düsseldorf, Dortmund, Essen, Köln, etc.
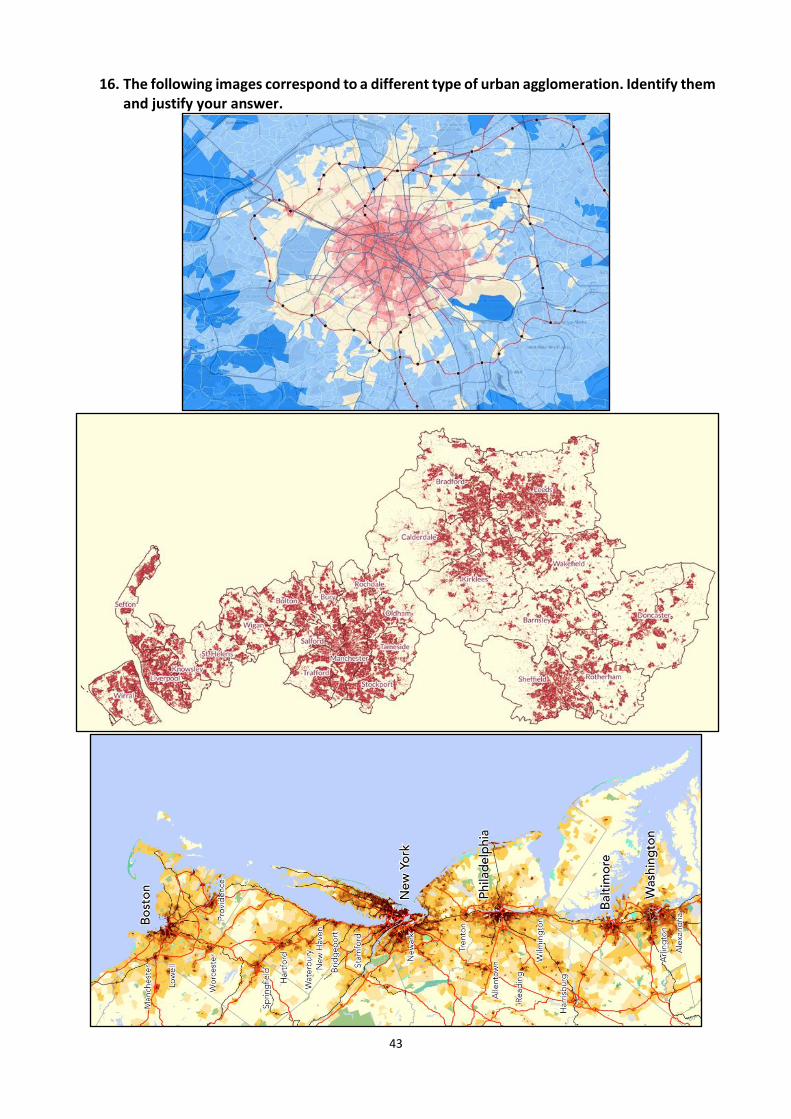
Megalopolis: a large territory that includes metropolises and conurbations, creating a chain of metropolitan areas beyond the limits of a region. The Boston-Washington (Boston, New York, Philadelphia, Baltimore, and Washington DC) and the Tokyo-Fukuoka (Tokyo, Yokohama, Nagoya, Kyoto, Osaka, Hiroshima, and Fukuoka) metropolises are the best examples of those.

30
According to the UN, cities (when dense) are more efficient than villages in the way they use
space because they cause less damage to the natural environment. Moreover, they are able to meet the needs (jobs, entertainment, commerce, etc.) of the population and offer technological, scientific and health innovations.
The populations of cities grow rapidly, and in some cases in a disorganized way, consequently creating new problems or highlighting pre-existing ones. In order to have a complete view, we should analyse the next aspects:
o Because of the high demand of land there is a deterioration of certain natural areas, lack of green areas, planning and organisation, speculation appears, etc.
o Pollution is a very serious problem in contemporary cities. Large cities are affected by noise, light and atmospheric pollution (70% of CO2 emissions); they have a great consumption of raw materials, industrial and manufactured products, and energy; they generate a great amount of rubbish every day, etc. Some cities are tackling pollution problems, but illnesses and even deaths are strongly linked with the pollution produced in urban areas.
o Urban sprawl presents another problem: because of the lower densities in urban areas, the suburban phenomenon has a higher environmental impact, a higher price for the local authorities, higher requirement for transport infrastructures, etc.
o Educational and social: even though cities allow their population to visit many educational centres and institutions, they generate poor personal relationships, as well as create pockets of poverty and social exclusion, violence and stress.

31
About 80 % of Spanish population today live in cities, which is a tendency that begun with the industrialisation of certain areas of the country and has continued throughout the 20th and 21st centuries. There are 8124 municipalities in Spain, and the 20 most populated towns concentrate a quarter of the total population. The distribution of population in the different regions is also very uneven: Castilla y León has 1724 (77 %) of towns with less than 500 inhabitants, while Canarias and Murcia have none; there are only 1314 municipalities in Spain with more than 5000 inhabitants.

32
Rural settlements in Spain are:
- North of Spain and mountainous areas: dispersed and Interdispersed settlements, with important presence of country houses and farmhouses separated from each other (caseríos, masías, etc.)
- Castillas, Andalucía, Extremadura and the Ebro valley: due to drier climate and flatter terrains, settlements are clustered (concentrated) and dispersed.
The process of urbanisation in Spain can be traced back to pre-Roman times, when Phoenicians and Greeks founded cities such as Cádiz, Málaga and Ampurias (Girona). The Romans began the conquest of the Iberian Peninsula in the 3rd century BCE, and they soon left their mark in the geography of Spain. Emerita Augusta (Mérida), Caesar Augusta (Zaragoza), Legio VII (León), Toletum (Toledo), Tarraco (Tarragona) and Barcino (Barcelona) are some of the main examples of Roman cities, and they used a dense system of roads connecting them and with other parts of the Empire.
The Germanic peoples that were established in the Iberian Peninsula –most notoriously the
Visigoths– inhabited some of the existing cities such as Toledo, but the ruralisation caused during the 4th and 5th centuries AD meant that most of the population lived in rural areas. The Umayyad conquest in 711 meant that some cities gained impulse (Toledo, Córdoba, Sevilla, Zaragoza, etc.), and there were foundations mostly in the southern half of the Peninsula such as Murcia, Badajoz,

33
Almería and Madrid. Cities such as Granada, Córdoba, and Sevilla keep Muslim influences in their layouts and monuments.
In the Christian part of the Iberian Peninsula, the process of urbanisation kept the same ideas that throughout Europe: rural society until the 12th century, when there was an urban resurgence. The defensive importance of cities was a particularity in the High Middle Ages in Spain, so cities such as Salamanca, Zamora, Ávila, Segovia, Jaca and Pamplona acted as political and defensive centres for the Christian kingdoms. In the Late Middle Ages, parallel to Europe, cities were founded and pre-existing cities grew. It is worth mentioning Bilbao (founded in the 13th century), Burgos, Toledo, Ciudad Real, Valencia, Barcelona, etc.
As explained above, medieval cities were walled and followed irregular layouts, with central squares functioning as political, religious, economic and social centres.
Medieval Toledo

34
Urbanism in Spain experienced great changes in the Modern Age, mostly centred in Madrid,
which was chosen as permanent court (capital of the kingdom) in 1561. New neighbourhoods in cities such as Sevilla and Madrid followed grid patters, as well as new foundations such as Santa Fe (Granada).
Santa Fe (Granada) was founded by the Reyes Católicos
In the 17th century and 18th centuries, urban spaces saw the introduction of new elements
such as the Plazas Mayores in Salamanca, Madrid and Barcelona mentioning a few. In the capital some green areas were created for the kings (Reales Sitios such as Casa de Campo and Buen Retiro), as well as for high nobility in others.

35
Madrid in the mid-16th century and in the late 17th century
The mid-19th century saw great transformations in Spanish cities: walls were pulled down
(due to hygienic reasons –the defensive was useless after the appearance of gunpowder in the 15th century, and their taxation role was substituted for new fiscal policies), and population grew a lot. Therefore, new expansions following grid layouts were planned in most cities, new wide avenues were opened, new infrastructures (train stations, for instance) were required, historic centres were reformed, etc. The expansion of Barcelona, by Ildefons Cerdà, is studied as great example of these new urban changes.
After the demolition of the city walls, he used the reserved space for defense (1200 metres) for his new project. Large diagonal avenues crossed the grid, where the spaces would be occupied by blocks with a public space in the centre. This inspired other expansions such as the one in Madrid (Argüelles, Chamberí, Barrio de Salamanca, Retiro, etc.), Bilbao, Valencia, etc. On the negative side, these expansions expelled people that had formed illegal neighbourhoods outside the city walls (arrabales) further out, where living conditions were poor, services were inexistent, etc.
The project of the Eixample by Ildefons Cerdà for Barcelona. The historic centre and surrounding villages (Sants,
Gràcia, etc.) can be distinguished too.
In addition to these expansions, new theories such as the Ciudad Lineal by Arturo Soria and the colonies for workers were created. They looked for the improvement of the living conditions of the working classes, but middle and high classes took also advantage of them.

36
Before the Civil War (1936-39), the most notable urban change that happened in our cities were the opening of large avenues in the historical centres. The Gran Vía in Madrid and the Vía Laietana in Barcelona are the main examples.
Urban growth accelerated parallel to the growth of population in Spain and the increase of
the industrialisation rate. From the late 1950s onwards the rural exodus brought to the great cities. Large shanty towns and irregular neighbourhoods appeared in the periphery of cities, so great public and private projects were created for sheltering the new urban population.
Barrio del Pilar and advertising for the Parque de San Juan Bautista (Madrid).
Since the arrival of democracy, the framework for urban planning of cities (Planes Generales de Ordenación Urbana) have been more respectful with the needs of the population, and services and infrastructures were thought even before the neighbourhoods were created. However, urbanised areas are larger, so urban sprawl is increasing. Cities such as Madrid, Barcelona, Valencia, Bilbao and Sevilla have great metropolitan areas. Current cities are divided into: historical centre, residential areas (19th century expansions and working-class neighbourhoods built from the 1950s onwards), communal areas (green areas, hospitals, schools, universities, etc. Generally in the urban periphery), suburbs (in the outskirts, with terraced and detached family houses built from the 1980s, and also large developments for large populations such as Sanchinarro or Ensanche de Vallecas) and industrial states (for industries and business, with good transport links). Currently, the largest cities are:
1. Madrid: 3 182 981 2. Barcelona: 1 620 809 3. Valencia: 787 808 4. Sevilla: 690 566 5. Zaragoza: 664 938 6. Málaga: 569 002 7. Murcia: 443 243 8. Palma: 406 492 9. Las Palmas de Gran Canaria: 377 650 10. Bilbao: 345 110
The largest metropolitan areas are:
1. Madrid: 5 989 237 2. Barcelona: 5 179 728 3. Valencia: 1 541 047 4. Sevilla: 1 304 613 5. Málaga: 966 478

37
The challenges urban spaces and the distribution of population in Spain face are mostly related with the redistribution of the population, since distant villages have been abandoned (demographic deserts) and rural areas are inhabited mostly by elderly population. Therefore, the formation of large urban spaces centre not only work, services, leisure, etc., but also younger populations that guarantee the future of many areas of the country.
GLOSSARY
Rural settlements Traditional houses
Cities Urban structure
Urban morphology Grid layout Radial plan
Irregular plan 19th century expansions
Demographic transition theory Urban agglomeration
Megacities Metropolitan areas
Conurbation Urban region Megalopolis
Eixample

38
Madrid in 1875

39
Madrid in 1944

40
Madrid today

41
EXERCISES:
13. Explain the differences between: a. City and rural settlement. b. Dispersed, concentrated and interdispersed settlements. c. Metropolitan area and conurbation. d. Grid system and irregular layout. e. Roman and medieval cities. f. Urban structure and urban morphology. g. 19th century expansions and urban sprawl.
14. Compare these urban landscapes by explaining their morphology and the different
historical periods in which they were created.
42
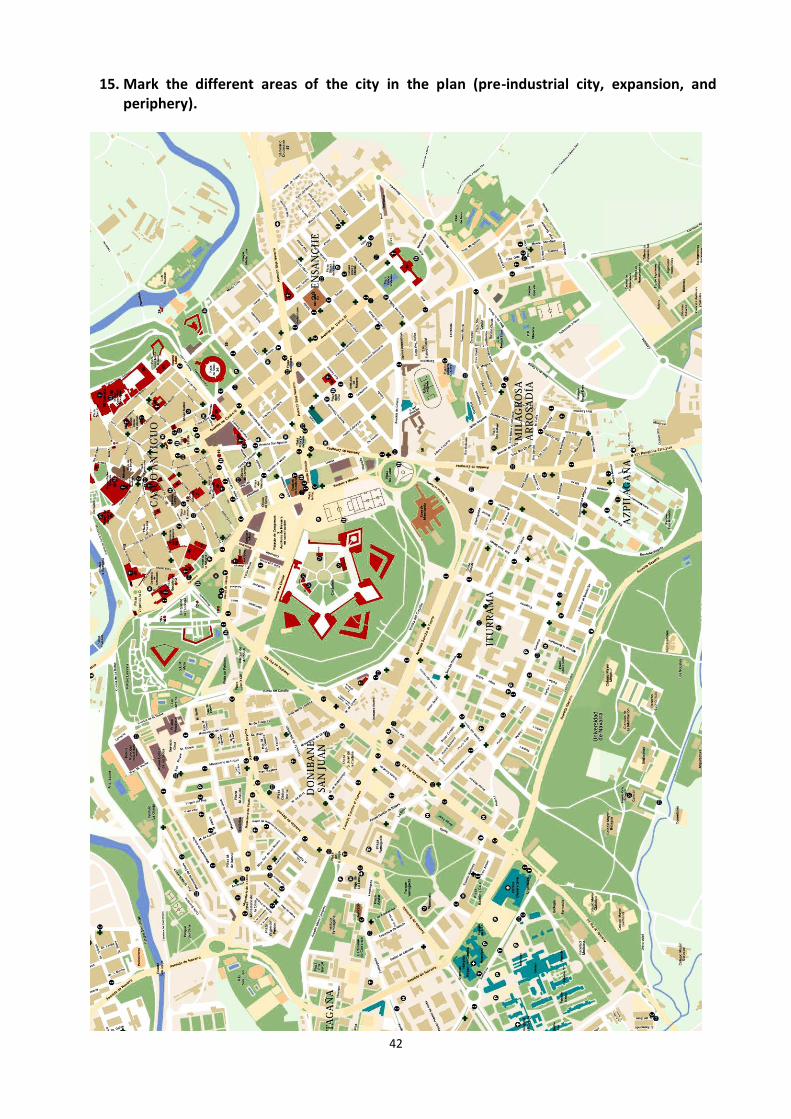
15. Mark the different areas of the city in the plan (pre-industrial city, expansion, and periphery).
43
16. The following images correspond to a different type of urban agglomeration. Identify them and justify your answer.

44
TEXT – THE 100 MILLION CITY: IS 21ST CENTURY
URBANISATION OUT OF CONTROL? John Vidal, The Guardian. 19 March, 2018. Projections suggest cities will swell at an astonishing pace – but whether that means our salvation or an eco-disaster is by no means certain
The 1960 street map of Lagos, Nigeria, shows a small western-style coastal city surrounded by a few semi-rural African villages. Paved roads quickly turn to dirt, and fields to forest. There are few buildings over six floors high and not many cars. No one foresaw what happened next. In just two generations Lagos grew 100-fold, from under 200,000 people to nearly 20 million. Today one of the world’s 10 largest cities, it sprawls across nearly 1,000 sq km. Vastly wealthy in parts, it is largely chaotic and impoverished. Most residents live in informal settlements, or slums. The great majority are not connected to piped water or a sanitation system. The city’s streets are choked with traffic, its air is full of fumes, and its main dump covers 40 hectares and receives 10,000 metric tons of waste a day. But new research suggests that the changes Lagos has seen in the last 60 years may be nothing to what might take place in the next 60. If Nigeria’s population continues to grow and people move to cities at the same rate as now, Lagos could become the world’s largest metropolis, home to 85 or 100 million people. By 2100, it is projected to be home to more people than California or Britain today, and to stretch hundreds of miles – with enormous environmental effects. Hundreds of far smaller cities across Asia and Africa could also grow exponentially, say the Canadian demographers Daniel Hoornweg and Kevin Pope at the University of Ontario Institute of Technology. They suggest that Niamey, the barely known capital of Niger – a west African country with the highest birth rate in the world – could explode from a city of fewer than one million people today to be the world’s eighth-largest city, with 46 million people, in 2100. Sleepy Blantyre in southern Malawi could mushroom to the size of New York City today.
Under the researchers’ extreme scenario – where countries are unable to control fertility rates and urbanisation continues apace – within 35 years more than 100 cities will have populations larger than 5.5 million people. By 2100, say the authors, the world’s population centers will have shifted to Asia and Africa, with only 14 of the 101 largest cities in Europe or the Americas. What happens to those cities over the next 30 years will determine the global environment and the quality of life of the world’s projected 11 billion people. It’s impossible to know how exactly how cities will grow, of course. But the stark fact, according to the United Nations, is that much of humanity is young, fertile and increasingly urban. Latest UN projections expect the world’s population to grow by 2.9 billion – equal to another China and India – in the next 33 years, and possibly by a further three billion by the end of the century. By then, says the UN, humanity is expected to have developed into an almost exclusively urban species with 80-90% of people living in cities. Whether those cities develop into sprawling, chaotic slums – with unbreathable air, uncontrolled emissions and impoverished populations starved of food and water – or become truly sustainable depends on how they respond. Many economists argue that population growth is needed to create wealth, and that urbanisation significantly reduces humanity’s environmental impact. Other observers fear cities are becoming ungovernable – too unwieldy to adapt to rising temperatures and sea levels, and prone to pollution, water shortages and ill health. Many cities are already investing in clean transport and water, sewage, renewable energy, planning, wellbeing and good housing for all. Others face what seem like insurmountable problems.
Answer the following questions in your notebook: 1. How las Lagos changed in the last 50 years? What problems has it got? 2. How is the projection for Lagos in the future? Is it the only African city with that future? 3. What will the problems of cities in the future? 4. What are the positive aspects of urbanisation? 5. What measures can be taken for a better urban life? 6. Look to the article ‘Cities in numbers’ (LINK) and explain briefly the different situation in
Europe and North America. 7. How would your ideal city be? Justify your answers.