geographical expansion of the euraxess-links … 28, 2014. ... innovation ‐ strategic guidelines...
TRANSCRIPT

0
Geographical expansion of the EURAXESS-Links Network
Annexes to the Final Report
February 28, 2014

Geographical expansion of the EURAXESS‐Links Network Final Report 28 February 2014
1
Contents 1 Annex I – Country reports .......................................................................................................6
Argentina 6
Introduction ..................................................................................................................................... 6
The R&D landscape in Argentina ..................................................................................................... 6
Research Community ...................................................................................................................... 9
Collaboration ................................................................................................................................. 13
Policy strategies ............................................................................................................................. 19
Australia 22
Introduction ................................................................................................................................... 22
The R&D landscape in Australia .................................................................................................... 22
Research Community .................................................................................................................... 26
Collaboration ................................................................................................................................. 31
Policy strategies ............................................................................................................................. 36
Chile 38
Introduction ................................................................................................................................... 38
The R&D landscape in Chile ........................................................................................................... 38
Research Community .................................................................................................................... 41
Collaboration ................................................................................................................................. 44
Policy strategies ............................................................................................................................. 47
Mexico 50
Introduction ................................................................................................................................... 50
The R&D landscape in Mexico ....................................................................................................... 50
Research Community .................................................................................................................... 55
Collaboration ................................................................................................................................. 58
Policy strategies ............................................................................................................................. 63
New Zealand ......................................................................................................................................... 65
Introduction ................................................................................................................................... 65
The R&D landscape in New Zealand .............................................................................................. 65
Research Community .................................................................................................................... 70
Collaboration ................................................................................................................................. 73
Policy strategies ............................................................................................................................. 77
Peru 80

Geographical expansion of the EURAXESS‐Links Network Final Report 28 February 2014
2
Introduction ................................................................................................................................... 80
The R&D landscape in Peru ........................................................................................................... 80
Research Community .................................................................................................................... 83
Collaboration ................................................................................................................................. 88
Policy strategies ............................................................................................................................. 89
Russian Federation ............................................................................................................................... 91
Introduction ................................................................................................................................... 91
The R&D Landscape in the Russian Federation ............................................................................. 91
Research community ..................................................................................................................... 94
Collaboration ............................................................................................................................... 101
Policy strategies ........................................................................................................................... 105
South Africa ........................................................................................................................................ 107
Introduction ................................................................................................................................. 107
The R&D landscape in South Africa ............................................................................................. 107
Research Community .................................................................................................................. 111
Collaboration ............................................................................................................................... 115
Policy strategies ........................................................................................................................... 118
South Korea ........................................................................................................................................ 120
Introduction ................................................................................................................................. 120
The R&D landscape in South Korea ............................................................................................. 120
Research Community .................................................................................................................. 125
Collaboration ............................................................................................................................... 127
Policy strategies ........................................................................................................................... 132
2 Annex 2 – Secondary data .................................................................................................. 134
2.1 EU‐wide / European Commission, DG RTD / International organisations ...................... 134
2.2 Country‐specific sources ................................................................................................. 136
3 Annex 3 – Primary data ...................................................................................................... 148
3.1 EU‐level interviewees ...................................................................................................... 148
3.2 Fieldwork interviewees ................................................................................................... 148
4 Annex 4 – Data PART II ....................................................................................................... 157

Geographical expansion of the EURAXESS‐Links Network Final Report 28 February 2014
3
List of figures
Figure 1: Evolution of FTE researchers in Argentina (2007‐2011) ........................................................ 11 Figure 2: R&D funders and beneficiaries in Australia............................................................................ 24 Figure 3: Number of proposals and success rate per thematic area, FP7............................................. 33 Figure 4: R&D funders and performers in Mexico, 2011 ...................................................................... 52 Figure 5: R&D funders and performers in New Zealand ....................................................................... 67 Figure 6: European Cooperation in Science and Technology (COST) and New Zealand ....................... 69 Figure 7: NZ‐EU International Research Staff Exchange Scheme (IRSES) .............................................. 69 Figure 8: Grant holders per priority area, FP7 ...................................................................................... 74 Figure 9 – R&D Personnel in Russia ....................................................................................................... 95 Figure 10 – Age distribution of researchers in Russia ........................................................................... 97 Figure 11 – Distribution of R&D personnel by type of R&D institutions ............................................... 98 Figure 12 – Distribution of researchers by research field ..................................................................... 98 Figure 13 ‐ Russia Participation in FP7 ................................................................................................ 101 Figure 14: GERD as a percentage of GDP in South Africa .................................................................... 109 Figure 15: GERD as a percentage of GDP, selected countries (2009 or nearest year) ........................ 109 Figure 16: R&D expenditure by sector of performance 2009/10 ....................................................... 110 Figure 17: Number of Full Time Equivalent (FTE) researchers per 1000 total employment, selected countries (2009 or nearest year) ......................................................................................................... 112 Figure 18: R&D personnel headcounts by sector (2009/10) ............................................................... 112 Figure 19: GERD by type of R&D South Africa, 2009/10 ..................................................................... 113 Figure 20: Research collaboration by paper in Africa (2004‐2008) ..................................................... 118
Geographical expansion of the EURAXESS‐Links Network Final Report 28 February 2014
4
List of table
Table 1: Size, career stage and place of work of FTE researchers in Argentina .................................... 10 Table 2: CONICET cooperation projects with Member States (2003 – 2013) ....................................... 15 Table 3: Overview of the bilateral relationship between Argentina and Spain, France, Germany, Italy and the UK ............................................................................................................................................. 16 Table 4: Overview of the bilateral relationship between Argentina and the United States, Brazil and Mexico ................................................................................................................................................... 18 Table 5: Full‐time equivalent on R&D activities, per sector of employment, 2005‐2010. .................... 27 Table 6: Staffing composition of Australia’s universities from 2000 to 2010 (FTE) .............................. 27 Table 7: Full‐time equivalent of Business Enterprise R‐D personnel by industry, 2005‐2010 .............. 28 Table 8: Doctoral graduates per field, 2010 .......................................................................................... 29 Table 9: Total number of students (incl. off‐shore) and number of undergraduate students, 2011 ... 29 Table 10: International students as percentage of all students at Group 8 and average figure on the remaining Australian Universities. ........................................................................................................ 30 Table 11: Numbers of applicants in retained proposals and of requested EU financial contribution in retained proposals (in € million) as well as corresponding success rates for FP7 calls concluded in 2007 ‐ 2012 in Australia ........................................................................................................................ 32 Table 12: Researchers main fields of work ............................................................................................ 42 Table 13: Funded activities, research areas and beneficiaries under bilateral agreements with Member States ...................................................................................................................................... 45 Table 14: R&D expenditure as % GDP, Mexico, 2002‐2011 .................................................................. 51 Table 15: Full‐time equivalent on R&D activities (and per sector of employment), Mexico, 2005‐2011 ............................................................................................................................................................... 55 Table 16: Doctoral graduates per field, 2011 ........................................................................................ 56 Table 17: Master’s degree enrolled students and graduates, 2001‐2013 ............................................ 56 Table 18: PhD enrolled students and graduates, 2001‐2013 ................................................................ 56 Table 19: Numbers of applicants in retained proposals and of requested EU financial contribution in retained proposals (in € million) as well as corresponding success rates for FP7 calls concluded in 2007 ‐ 2012 in Mexico ........................................................................................................................... 59 Table 20: Bi‐lateral activities by European country .............................................................................. 61 Table 21: Strategic approach of the bi‐lateral activities by European country ..................................... 61 Table 22: Full‐time equivalent on R&D activities, per sector of employment, 2001‐2009. .................. 70 Table 23: Full‐time equivalent of Business Enterprise R‐D personnel by industry, 2007‐2009 ............ 71 Table 24: Doctoral graduates per field, 2011 ........................................................................................ 71 Table 25: Numbers of applicants in retained proposals and of requested EU financial contribution in retained proposals (in € million) as well as corresponding success rates for FP7 calls concluded in 2007 ‐ 2012 in New Zealand .................................................................................................................. 74 Table 26: Size of the Peruvian research community ............................................................................. 83 Table 27: Place of work of FTE researchers (2004) ............................................................................... 83 Table 28: Research field of those registered in CONCYTEC (headcount) .............................................. 84 Table 29: Trend in the number of researchers ...................................................................................... 96 Table 30: Total number of researchers in Full‐Time Equivalent (FTE) ................................................ 157 Table 31: International or foreign students as a percentage of all tertiary enrolment, 2009 ............ 157 Table 32: R&D expenditure as a % of the GDP .................................................................................... 158 Table 33: Scientific and technical journal articles, 2009 ..................................................................... 158 Table 34: Number of patents applications, residents, 2011 ............................................................... 159

Geographical expansion of the EURAXESS‐Links Network Final Report 28 February 2014
5
Table 35: FP7 participation .................................................................................................................. 159

Geographical expansion of the EURAXESS‐Links Network Final Report 28 February 2014
6
1 Annex I – Country reports
Argentina Introduction
Background information
• Population: 41,086,9271 (2012)
• GDP (in EUR)
o Absolute value (at PPP): 350,000 million EUR (2012)2
o Per capita (at PPP): 8,481 EUR (2012)3
• Expenditure on R&D (% GDP): 0.65% of GDP (2011)4
• Brief description of the country relation with the EU: Research cooperation between the EU and Argentina dates back to the FP3 (1990‐1994). In 1999 both parties signed a S&T Cooperation Agreement in order to strengthen cooperation and extending it in areas of mutual interest. This agreement proposes facilitating Argentina’s interaction with the European Research Area. Argentina also has bilateral S&T agreements with several EU Member States involving joint research, institutional cooperation, students and researchers' mobility, and initiatives for sharing the use of research infrastructure.
The R&D landscape in Argentina
Background information on S&T policies
Science, technology and innovation have a central place in Argentina’s policies. Due to its political and economic context, Argentina suffered greatly in the last decades; the military dictatorship of the 70s and the economic crisis experienced in 1998 and 2001 set the scene of a science that needed to be reconstructed. Within this background, the country put its efforts to promote the generation of scientific and technological knowledge, improve the situation of researchers and research infrastructure in the country and stop brain‐drain, increase funding for R&D, and encourage productive innovation. The creation of the Ministry of Science, Technology and Innovation (MinCyT) in 20075 and the launch of the National Plan for Science, Technology and Innovation 2012‐2015 (PNCTI)6 in 2012 constitute important milestones in this process.
Another important actor is the National Scientific and Technical Research Council (CONICET) which was created in 1958 and is now an independent body under the Ministry of S&T. This is the main organisation in charge of the promotion of S&T in the country. It has its own researchers and
1 The World Bank Data (http://data.worldbank.org/indicator/SP.POP.TOTL) 2 The World Bank Data (http://data.worldbank.org/indicator/NY.GDP.MKTP.CD): 348,454,760,311 US dollars (2012) 3 The World Bank Data (http://datos.bancomundial.org/indicador/NY.GDP.PCAP.CD): 11,573 US dollars (2012) 4 Private and public expenditure in R&D. Ministry of Science, Technology and Productive Innovation. Indicators of Science and Technology in Argentina (2011). Available at http://www.mincyt.gob.ar/publicaciones 5 It is the first Ministry in Latin America to associate productive innovation with science and technology. 6 Ministry of Science, Technology and Productive Innovation. National Plan for Science, Technology and Innovation ‐ Strategic Guidelines 2012‐2015. Op. Cit.

Geographical expansion of the EURAXESS‐Links Network Final Report 28 February 2014
7
professionals, offers different grants, and finances projects, institutions and national research centres across the country.
Moreover, within the policies developed by the Argentinean government in S&T, it is clear that cooperation at multilateral and bilateral levels with other countries/organisations is a key part of its strategy. According to the national authorities interviewed, in the last years there was an increase in the number of bilateral agreements, joint funding for projects, mobility instruments, and bi‐national research centres established in the country.
The S&T indicators show that national research and development (R&D) expenditure was 0.65% of GDP in 2011 (up from 0.41% in 2003, when the efforts to strengthen S&T in the country started). Circa 70% of this investment is funded with public resources. Only Brazil have higher expenditure than Argentina7. In relation with the EU countries, it is below EU Member States such as Italy (1.26%), Spain (1.38%), Portugal (1.59%), France (2.25%) and Germany (2.82%), but higher than Romania (0.48%), Cyprus (0.49%), Bulgaria (0.57%), and close to Slovak Republic (0.68%)8. It should be noted that, according to the 2020 Plan, this investment will increase to 1.01% to 1.65% of GDP in 20209.
The PNCTI focuses on the development and reorientation of general purpose technologies (TPG) for the expansion and improvement of production activities in socio‐productive centres of high economic and social impact. In particular, the focus is on Biotechnology, Nanotechnology and ICTs, with emphasis on providing knowledge and solutions for the following sectors: Agro‐industry, Environment and Sustainable Development, Social Development, Energy, Industry and Health.
Immigration policies
According to the stakeholders interviewed, immigration policies in Argentina are very open. People from the EU Member States do not a visa to enter the country, as long as they stay for no more than 90 days. In the case of longer stays, interviewees have explained it is relatively easy to get permission for it as long as you can demonstrate it is for scientific purposes (i.e. fieldwork, attending an event, etc.).
Policies related to mobility and international attractiveness
The policy of international cooperation of the Argentinean Ministry of S&T has been conceived as a contribution to achieving the objective of strengthening national capacities in S&T. The premise underlying this policy is that in the field of S&T, national efforts are enhanced by cooperation with international actors. Cooperation with the EU and the individual Member States is key in this respect.
In terms of mobility instruments, CONICET has various instruments devoted to it, namely:
• Scientific Visits Programmes: These programmes, aimed at building long lasting research, include short and medium term trips and stays for researchers and fellows (from one to three months).
• Joint Research Projects Programmes ‐ Level 1: Biannual research projects in the framework of bilateral agreements. Projects are funded under two schemes: a) travel of Argentinean scientists to foreign countries and stays of foreign scientists in Argentina or b) travel and stays of Argentinean scientists abroad.
• Joint Research Projects Programmes ‐ Level II: Triennial projects in strategic areas defined jointly with the counterpart. CONICET funds staff expenses, travel to the host foreign
7 Ministry of Science, Technology and Productive Innovation. Indicators of Science and Technology in Argentina (2011). Op. Cit. 8 The World Bank Data (http://data.worldbank.org/indicator/GB.XPD.RSDV.GD.ZS/countries) 9 Ministry of Science, Technology and Productive Innovation. National Plan for Science, Technology and Innovation ‐ Strategic Guidelines 2012‐2015. Op.Cit

Geographical expansion of the EURAXESS‐Links Network Final Report 28 February 2014
8
institution, stay expenses, funding for research purposes and up to six‐month stays for the training of Human Resources.
• International Research Groups (GII): Four to six years programmes for research and training. It requires the participation of several groups of one or more Argentinean universities. The funding depends on the programme and consists of a combination of the mechanisms described.
• International Research Groups – Developing areas: It requires the participation of two or more groups of local researchers and one or more groups of foreign researchers in areas where Argentina is trying to improve its performance. CONICET uses a combination of the funding mechanisms described above.
• International Associated Laboratories: Twin research laboratories, located in each country. CONICET funds the budget for the academic‐scientific exchange, programmes for joint supervision of thesis, seminars and workshops.
• Current Bi‐national Laboratories: Fluid mechanics, Molecular vectors, Nano‐sciences, Informatics (with France)
• International Research Centres: Units located in Argentina and managed monitored and evaluated jointly with foreign institutions.
• Bi‐national Research Centres: Structural biology and neurobiology (with Max Planck Society, Germany), Climate and its Impacts (with CNRS France), Computer Simulation and Modelling (with CNRS France)
• Stays for Postdoctoral Students abroad: CONICET funds travel expenses and health insurance for Argentineans who apply for stays to carry out their Postdoctoral studies abroad for up to six months.
• Stays for Fellowships abroad with International funding: Programmes co‐founded by The Fulbright Commission and the Education Ministry of France (Houssay Fellowships) for travel and stays of doctoral or postdoctoral fellows abroad from three months up to one year.
• Stays for Researchers abroad: For funding of stays abroad of young researchers.
• Stays for foreign Researchers and/or Experts in Argentina: grants between three to 12 months for stays of researchers or experts at Research Units of CONICET.
• Fellowships for foreign PhD students and young researchers in Argentina: CONICET offers fellowships to foreigners for carrying out their PhD or Postdoctoral studies in Argentina.
The Argentina‐EU Liaison office (ABEST)10, which operates within the Argentinean Ministry of S&T through its National Directorate of International Relations, also coordinates Argentinean participation in Marie Curie and COST. There are also Annual ABEST III grants that target European and Argentinean researchers that need to travel in order to find partners for FP7 projects. In addition, there are bilateral agreements that have a mobility element, with France and Germany being the most significant ones. These programmes date for a long time ago; however new ones have been created. For example, there is a new one for education/training of engineers in France.
It is important to note too that there is a programme called RAICES11 (Roots) that aims to repatriate Argentinean researchers that are living abroad. This programme has an instrument to facilitate the 10 ABEST is one of the BILAT projects that the EC co‐finances in third countries. BILAT coordinates through networking different stakeholders for the enhancement and development of S&T Partnerships. 11 Network of Argentinean Researchers and Scientists Abroad (Raices). http://www.raices.mincyt.gov.ar/ (in Spanish)

Geographical expansion of the EURAXESS‐Links Network Final Report 28 February 2014
9
immigration of spouses / partners if these are also researchers. Over a thousand Argentinean researchers have been repatriated since the programme was launched in 2003.
Research Community
The size and characteristics of the research community in Argentina
In 2011, the number of people dedicated to research and development in the country was 98,445 (headcount), including (full‐time and part‐time) researchers, (full‐time and part‐time) research fellows, technical and support staff12. Within this population, it is estimated there are 50,340 full‐time equivalent (FTE) researchers, which includes both researchers and research fellows13. Expressed in terms of the European Framework for Research Careers, over 70% of these can be considered Established or Leading Researchers and the rest First Stage or Recognised Researchers (Table 1).
Overall, circa 90% of FTE researchers in the country work in either public organisations (e.g. CONICET research centres) or public universities. The rest work in the business sector, private universities or NGOs.
However, there are some differences between the most frequent place of work of researchers and research fellows. Whereas half of researchers work in public universities, followed by over a third that work in other public organisations, the majority of research fellows work in public organisations.
12 As per the definitions of the Ministry of S&T in Argentina, full‐time and part‐time researchers are senior staff who work in the creation of new knowledge, products, processes, methods and systems and who also manage the respective research projects and research teams. Full‐time and part‐time research fellows are the professionals who perform R&D activities under the direction/supervision of a senior researcher and therefore receive a stipend/pay for it in the form of a fellowship. Technical staff includes the people whose job requires technical knowledge and experience in one or several fields of knowledge. They execute their tasks under the supervision of a researcher and are generally laboratory assistants, assistant engineers, photographers, mechanical and electrical engineers, IT programmers, etc. Support staff includes the people who provide support services for S&T activities such as office staff, operators, administrators, etc. Ministry of Science, Technology and Productive Innovation. Indicators of Science and Technology in Argentina (2011). Op. Cit., p. 156. 13 To calculate the number of FTE researchers, the author used individual coefficients depending on the type of entity where the researchers and fellows work. For example, to calculate the number of FTE researchers in universities the following mathematical expression was used: Nr of Researchers (FTE) = Nr of Full‐time Researchers x 0.77 + Nr of Part‐time Researchers x 0.25 (Ministry of Science, Technology and Productive Innovation. Indicators of Science and Technology in Argentina (2011). Op. Cit.)

Geographical expansion of the EURAXESS‐Links Network Final Report 28 February 2014
10
Table 1: Size, career stage and place of work of FTE researchers in Argentina
Career stage
European Framework for
Research Careers
Public org.
Public univ.
Private univ.
Business sector
NGOs TOTAL %
FTE researchers
Established and Leading
Researchers 12,585 18,449 1,093 3,787 381 36,295 72.1%
FTE research fellows
First Stage and Recognised Researchers
9,981 2,956 268 642 198 14,045 27.9%
TOTAL 22,566 21,405 1,361 4,429 579 50,340 100%
% 44.8% 42.5% 2.7% 8.8% 1.2%
Source: Ministry of Science, Technology and Productive Innovation. Indicators of Science and Technology in Argentina (2011)
Regarding researchers’ academic level, 30% of full‐time and part‐time researchers are PhDs and 10% have completed a Master programme. The rest have completed undergraduate studies (Licenciatura or Bachelor degree). In addition to this, over three fourths of full‐time and part‐time research fellows have completed an undergraduate programme (76%), 12% have completed a PhD, 10% other programmes such as tertiary and technical degrees not covered by the above, and 2% a Master.
In terms of the number of PhD and Master students in the country, there is no aggregated data publicly available. However, in 2012 CONICET awarded 8,822 scholarships to PhD students14. It should be taken into account though that this leaves out PhD students with scholarships awarded years earlier, PhD students without scholarships and with scholarships awarded by organisations different from CONICET.
According to the Ministry of S&T, a quarter of full‐time and part‐time researchers, work in Natural Sciences (25%) and just over 20% on Social Sciences. Engineering and Technology is the field of 18% of researchers. Those working on Medical Sciences represent 14% of researchers and those in Agricultural Sciences 12%. One out of ten work in Humanities (9%).
Among full‐time and part‐time research fellows, there is a greater portion of researchers who work in Natural Sciences (38%) and a lower portion in Agricultural Sciences (7%), Engineering and Technology (15%) and Medical Sciences (11%). Social Sciences and Humanities are equally represented (20% and 9% respectively).
It is important to note that even though Natural Sciences’ researchers represent the largest group in both cases, when it comes to the number of research projects developed, those in the field of Engineering and Technology are more frequent15 (28% of 26,104 research projects in 201116). In addition to this, projects of applied research represent 47% of projects and basic research 35%.
In terms of the geographical distribution of the people dedicated to R&D in the country, they are concentrated in the capital city and the provinces of Buenos Aires, Córdoba, Entre Ríos, La Pampa
14 CONICET scholarships are the main instrument with which PhD students in the country usually fund their studies and research (http://www.conicet.gov.ar/becarios/?graficoid=8941). 15 This is the total of research projects developed in national and provincial agencies, public and private universities, companies and non‐profit organisations in 2011. 16 Natural Sciences’ research projects represent 22% of total projects.

Geographical expansion of the EURAXESS‐Links Network Final Report 28 February 2014
11
and Santa Fe. However, other regions have developed specific research areas that are quite significant. For example, Physics and Nuclear Physics in Río Negro (South‐West); Solar Energy and Thermal Energy in Salta (North), Agro‐industry in the East coast; Chemistry and TICs in South of Buenos Aires; and Marine Sciences in the Patagonia.
Argentina has managed to maintain a sustainable growth in the S&T personnel since 2007. The number of FTEs researchers grew from 53,187 in 2007 to 69,693 in 2011, representing an increase of over 30%. Full‐time equivalent research fellows is the group that grew the most (45%), followed by technical staff (36%), support staff (30%) and full‐time equivalent researchers (25%).
Figure 1: Evolution of FTE researchers in Argentina (2007‐2011)
Source: Coffey elaboration based on Ministry of Science, Technology and Productive Innovation. Indicators of Science and Technology in Argentina (2011)
The community of foreign researchers in Argentina
As for other countries, there is no official data available in terms of the number of EU researchers in the country. All evidence collected was therefore of an anecdotal nature, reflecting the perceptions of national authorities, individual researchers, universities and centres of research and embassies staff.
The national authorities interviewed have estimated that around 600 foreign researchers arrive to the country every year. The majority are from Europe and the United States and travel for short periods of time (usually for one month or for attending an event).
In the case of EU researchers, they go to Argentina in the framework of EU funded initiatives or bilateral agreements/projects with EU Member States. Moreover, there is also mobility of foreign researchers that occurs within specific cooperation agreements between Argentinean and foreign universities / research centres. There is no official data available on this either.
Interviewees revealed that there are permanent researchers in the country too, but it is not clear to the study team the length of time they would spend in the country, their intention to return to Europe and their specific area of research.
Very recently, CONICET has launched a pilot programme to fund stays of foreign PhDs in Argentina. The first group of 25 foreign researchers will arrive during 2013 and 2014. From the ten researchers that are already in the country, seven are from European research institutions / universities (i.e. in Norway, Romania, UK, Italy, and Spain). They will stay between 2 to 4 months conducting research in different regions of the country.
38.681
41.52343.717
47.580
50.340
30.00032.00034.00036.00038.00040.00042.00044.00046.00048.00050.00052.00054.00056.00058.00060.000
2007 2008 2009 2010 2011

Geographical expansion of the EURAXESS‐Links Network Final Report 28 February 2014
12
According to the national authorities interviewed, the number of foreign researchers in the country has increased in the last years, in particular researchers from Europe and the United States. Members of the EU Delegation in Argentina agreed on this and explained that this is backed up by the fact that ABEST, the Liaison Office between Argentina and the EU, is in its third phase of development.
They also said that European researchers that visit / work in Argentina hold PhDs already and are spread across the country.
The stakeholders interviewed explained that the most attractive fields for EU researchers in Argentina are Nanotechnology, Agro‐industry, Biotechnology, Health, Environmental Sciences and Renewable Energies, and TICs.
Perceived needs of the research community in Argentina
The government’s expenditure on S&T activities increased considerably in the last years (from 0.61% of the GDP in 2007 to 0.73% in 2011)17. The stakeholders interviewed recognised this as an important measure that has brought many improvements to the sector. However, many have mentioned there are still needs in terms of equipment, materials, infrastructure and technology.
Another problem identified by interviewees was that the enlargement of the population of researchers occurred in the last 10 years has not been accompanied by a similar increase in work opportunities. National authorities are aware of this problem and are currently working on providing solutions to it. For example, they are providing funds for PhDs to be able to travel and work abroad for a short or medium period of time so that they can continue with their research projects and access S&T infrastructure that is not currently available in the country.
In line with this, one of the main needs mentioned by the researchers interviewed was to have more funding available to travel and work abroad in order to access information, knowledge, training, and technologies that may not be available locally. Funding for attending events abroad is scarce and very difficult to obtain, hindering local researchers’ visibility as well as their networking opportunities with the global scientific community.
Mobility is also important to develop partnerships and cooperation for research projects. In effect, many interviewees have said that an initial face‐to‐face contact with potential partners abroad is key to set the basis for collaboration and that there are cooperation projects that have not succeeded because of the difficulties in finding the right partners and agreeing on a way of working without having the possibility to meet. The quotes below illustrate this:
“It is not the same to be in touch with your colleagues via email or face‐to‐face. Having the possibility of sitting beside your colleague and look both through the same microscope is key for the research you are carrying out together. So travelling and meeting your colleagues is fundamental” (Argentinean researcher, Dec 2013)
“COST grants18 are fundamental for Argentinean researchers because they provide the opportunity to travel and make contact with partners abroad aimed at developing a joint research project. This initial contact that you can only make if you travel is fundamental for research projects that include international cooperation” (National authority, Dec 2013).
The level of information on opportunities of collaboration and mobility with the EU and MS is relatively good. However, some researchers have mentioned that this is due to their own proactivity in searching for information and keeping updated and in contact with their colleagues abroad. In 17 Ministry of Science, Technology and Productive Innovation. Indicators of Science and Technology in Argentina (2011). Op. Cit. 18 European Cooperation in Science and Technology (COST). http://www.cost.eu
Geographical expansion of the EURAXESS‐Links Network Final Report 28 February 2014
13
effect, some of them feel the EU should consolidate and simplify all information on opportunities in one place and then national authorities and research institutions across the country should make sure they disseminate this among researchers.
In terms of barriers or difficulties, the main ones are the current restrictions on imports and foreign exchange market. This impacts the flow of equipment, materials, and money from abroad. As one interviewee explained, it also impacts the flow of information as a subscription to an international scientific magazine, for example, has become very expensive. Moreover, current inflation rates make it difficult to develop research projects’ budgets in advance for a grant.
Key expectations/problems related to the mandate of EURAXESS Links
All interviewees were convinced of the added value of a network that would connect EU and Argentinean researchers. The different interviewees indicated that the added value of EURAXESS Links was mainly the potential of:
• Consolidating all information available on cooperation and mobility opportunities between the EU and the countries where EURAXESS Links exists
• Finding the right partners for cooperating in research projects, both in Argentina and in the EU
• Identifying topics where the EU excels and in which Argentina would be interested in partnering, and vice versa
• Learning about past or on‐going research projects in Argentina / EU that could benefit from collaboration with EU / Argentinean researchers
• Establishing collaborations to allow Argentinean researchers access labs, equipment, infrastructure, materials, technologies and information that are not available in Argentina
• Establishing collaborations to provide EU researchers with locations in Argentina where they can carry out fieldwork
• Disseminating information on mobility opportunities and sources of funding both in the EU and in Argentina
• Providing access to support and advice on various administrative issues related to immigration regulations and the submission of proposals for funding, both in Argentina and the EU
• Institutionalising the broad network of relations and contacts that already exist between Argentinean and European researchers
It is important to note that the national authorities in Argentina favour the possibility of establishing EURAXESS Links in Argentina, but expanding its scope to reach all countries in the region via ABEST III, the ARG‐EU liaison office.
Collaboration
Level of S&T cooperation between the EC and Argentina
In Argentina, international scientific and technological cooperation is seen as a strategic tool for the policy design. Research cooperation between the EU and Argentina dates back to the Third Framework Programme (1990‐1994) (FP3)19.
19 Scientific and Technological Cooperation between EC and Argentina ‐ Roadmap 2011‐2012. Available at: http://ec.europa.eu/research/iscp/pdf/argentina_roadmap_2011‐2012.pdf#view=fit&pagemode=none

Geographical expansion of the EURAXESS‐Links Network Final Report 28 February 2014
14
The Scientific and Technological Cooperation Agreement with the EU signed in 1999 further reinforced this cooperation and extended it in areas of mutual interest20. Both sides ratified the agreement in the year 2000 and it came into force in May 200121. The agreement has a validity of five years and is renewed tacitly every five years. The last renovation occurred in 2011. The main areas of cooperation under this Agreement are in the thematic areas of Health; Food, Agriculture, Fisheries and Biotechnology; Environment; Nanotechnology; ICT and Energy.
In addition, in 2005 the Liaison Office Argentina‐European Union in S&T (ABEST) was created. The office received partial funding from the Sixth Framework Programme (FP6). It was launched in order to create a platform to enhance and expand cooperation activities with the EU and the Members States. As from October 2012, the office is in its third phase of operations (ABEST III).
Argentineans’ participation in a number of EU mobility instruments are coordinated by this office including Marie Curie scholarships22 and COST grants23. ABEST III also offers annual grants24 that target European and Argentinean researchers that need to travel in order to find partners for FP7 projects.
The EU’s FPs were presented by the interviewees as an important tool that has helped to internationalise research in Argentina. The participation of Argentinean researchers, groups and institutions in the FPs evidence there is an increasing trend not only for the participation, but also in relation to effectiveness rates and contribution amounts.
During the FP6 (2002‐2006) Argentinean researchers, groups and institutions submitted a total of 1,756 proposals to participate in consortia research projects, with 94 being successful. The successfully approved interventions of European institutions and research centres in the projects involving Argentinean partners reached 75125.
During the FP7, the effectiveness of Argentina’s participation increased: successful proposals represent circa 25% of presentations, the highest rate in Latin America26. Available figures indicate that 147 groups of Argentinean institutions and centres received funding to participate in 112 research projects, mainly in the areas of Food, Agriculture and Biotechnology; Health; Environment; and ICT. In addition, more than 80 Argentinean researchers have come to the EU funded by the Marie Curie Fellowships. For these activities more than €13 million EUR have been committed to the
20 Argentina was the seventh country in the world and the first in Latin America to set such legal basis for S&T cooperation. 21 http://ec.europa.eu/world/agreements/prepareCreateTreatiesWorkspace/treatiesGeneralData.do?step=0&redirect=true&treatyId=413 22 ABEST III. http://abest.mincyt.gob.ar/index.php?option=com_content&view=article&id=204%3Ahorizonte‐2020&catid=6%3Aquienes‐somos&Itemid=464&lang=es 23 ABEST III. http://abest.mincyt.gob.ar/index.php?option=com_content&view=article&id=150&Itemid=453&lang=es 24 ABEST III. http://abest.mincyt.gob.ar/index.php?option=com_content&view=article&id=145&Itemid=448&lang=en 25 Ministry of Science, Technology and Productive Innovation. Cooperation in Science, Technology and Innovation with the European Union: Evaluation of the Argentinean participation in the Framework Programmes. Available at: http://abest.mincyt.gob.ar/files/LIBRO_UE_ENG.pdf. Page 7. 26 The effectiveness index of Mexico was 23%, Brazil 22%, and Chile 21%. Ministry of Science, Technology and Productive Innovation. Cooperation in Science, Technology and Innovation with the European Union: Evaluation of the Argentinean participation in the Framework Programmes. Op.Cit.

Geographical expansion of the EURAXESS‐Links Network Final Report 28 February 2014
15
Argentinean participants. Furthermore, as of May 2013 there have been 7 Argentinean European Research Council ERC grantees27.
Level of S&T cooperation between individual Member States and Argentina
Stemming from the information available in terms of Argentina’s partners in research projects that include international cooperation, it is possible to say that Argentina’s main partners are France, Germany, Spain and Italy.
This is also the case for mobility of students, researchers and professors. According to the stakeholders interviewed, these are the countries were Argentineans travel most for S&T‐related activities and the ones that also send more researchers to work in Argentina. These countries have also been the most active ones in terms of promoting and disseminating information on their cooperation and mobility opportunities for Argentinean researchers.
In terms of Argentina’s major partners in FP6 funded projects, the United Kingdom is the most important (107 projects), followed by Germany (98), Spain (88), France (83), and Italy (75). The available 2011 data suggests that the same countries were the major partners in FP728.
In addition to the FPs, there are other cooperation initiatives between Argentina and individual Member States that are carried out under the auspice of CONICET. This Council has various cooperation programmes with foreign institutions29 and is also part of International Research Consortia30.
An overview of the number and topics of cooperation projects with Member States is presented in the table below. The Member States are listed in the descending order according to the number of projects they have with Argentina. From all countries (considering both EU and non‐EU countries), France is the country with which Argentina has the highest number of cooperation projects.
Table 2: CONICET cooperation projects with Member States (2003 – 2013)
Member State Type of Cooperation Programme Projects (2003‐
2013) Main research areas
France Joint Research Projects
International Associated Laboratories
International Research Centres
122 Health / Medicine
Biochemistry and Molecular Biology
Physics and Chemistry
Earth, Water and Environment
Social science
Agricultural Sciences
27 DG RTD – International Cooperation. http://ec.europa.eu/research/iscp/index.cfm?lg=en&pg=argentina#documents 28 Argentinean Ministry of Science, Technology and Productive Innovation. Cooperation in Science, Technology and Innovation with the European Union: evaluation of the Argentinean participation in the Framework Programmes. Op.Cit. 29 This includes Scientific Visits Programmes, Joint Research Projects Programmes, International Research Groups, International Associated Laboratories: Twin research laboratories, International Research Centres, Stays for Postdoctoral Students abroad, Stays for Fellowships abroad with International funding, Stays for Researchers abroad, Stays for foreign Researchers and/or Experts in Argentina, and Fellowships for foreign PhD students and young researchers in Argentina. 30 CONICET (2013): International Cooperation. Summary.

Geographical expansion of the EURAXESS‐Links Network Final Report 28 February 2014
16
Member State Type of Cooperation Programme Projects (2003‐
2013) Main research areas
Engineering
Biotechnology
Germany Scientific Visits Programmes
Joint Research Projects
International Research Centres
85 Biology and Health
Physical Chemistry
Biochemistry and Molecular Biology
Earth, Water and Environment
Social Sciences
Engineering
Italy Joint Research Projects 80 Earth, Water and Environment
Physics and Chemistry
Agricultural Sciences
Engineering and Materials Sciences
Technology
Spain Joint Research Projects 33 Natural Sciences
Agricultural Sciences,
Engineering and Materials Sciences
United
Kingdom
Scientific Visits Programmes
Joint Research Projects
7 Biology and Health
Natural Sciences
Source: TEP’s elaboration based on CONICET (2013): International Cooperation. Summary.
Argentina holds bilateral agreements with the stated Member States. Usually, the collaboration is implemented through the development of joint research projects, the organisation of different kinds of events, the creation of bi‐national research centres or laboratories and the granting of scholarships for mobility.
Table 3: Overview of the bilateral relationship between Argentina and Spain, France, Germany, Italy and the UK
France
The Cultural, Scientific and Technical Cooperation Agreement between Argentina and France was signed in 1964. Recent cooperation actions include the implementation of six joint programmes that aim to strengthen scientific cooperation and intensify relations between research centres, universities and other higher education institutions in both countries that involve doctoral and post‐doctoral training, exchange of scientists and the development of joint projects. The projects mainly focus on information and communication technologies (ICT) and mathematics.
Germany
Cooperation between Argentina and Germany began in 1969 with the Intergovernmental Framework Agreement on Scientific and Technological Cooperation. At present, this bilateral cooperation is developed between the Ministry of S&T in Argentina and seven German counterparts: German Academic Exchange Service (DAAD); Federal Ministry for Education and Research in Germany (BMBF); Max Planck Society; Leibniz

Geographical expansion of the EURAXESS‐Links Network Final Report 28 February 2014
17
Institute; the Fraunhofer Society; German Research Foundation (DFG); and Argentinean‐German University Centre (CUAA).
Spain
Agreements on Scientific and Technological Cooperation between Argentina and Spain were signed in 1972, 2003 and 2006. Also in 2006, a Cooperation Programme was signed between the former Department of Science, Technology and Productive Innovation (now Ministry) of Argentina and the Spanish Ministry of Education and Science. 2012 saw the signing of an agreement between the National Agency for Science and Technology Promotion, the National Directorate of International Relations of the Ministry of Science, Technology and Productive Innovation from Argentina, and the General Directorate for International Cooperation and Institutional Relations from Spain to collaborate in scientific and technological research in the field of genomics. Other bilateral cooperation opportunities between Argentina and Spain include jobs and study offers at the Madrid Institute for Advanced Studies for Argentinean researchers of all career stages.
Italy
The Ministry of S&T of Argentina and the Ministry of Foreign Affairs of Italy developed a Cooperation Programme between the countries on the basis of the Cultural Agreement signed in 1961. The programme facilitates exchange between research groups from Argentina and Italy, within the framework of joint research projects.
United Kingdom
Since 2010 the Argentinean Ministry of S&T has an agreement with the University of Oxford for funding scientific and technological research projects in the areas of Material Sciences and Engineering.
Source: TEP’s elaboration based on data from the Ministry of S&T in Argentina
Level of S&T cooperation between Argentina and non‐EU countries
The main non‐EU countries with which Argentina cooperates (via CONICET’s cooperation programmes) are: the United States, Brazil, and Mexico. The numbers and research fields of those projects are presented in the table below. The countries are listed in the descending order according to the number of projects. This distribution of countries is also in line with Argentinean registries in the Science Citation Index (SCI) that include international collaboration. This index reveals that its main non‐EU partners are the United States and Brazil31.
Country Type of Cooperation Programme Projects (2003‐2013)
Main research areas
USA Joint Research Projects
101 Biology and Health
Physics and Chemistry
Earth, Water and Environment
Engineering and Biotechnology
IT and Communications
Astronomy
Brazil Joint Research Projects 72 Biology and Health
Earth, Water and Environment
31 Ministry of Science, Technology and Productive Innovation. Indicators of Science and Technology in Argentina (2011). Op. Cit.

Geographical expansion of the EURAXESS‐Links Network Final Report 28 February 2014
18
Country Type of Cooperation Programme Projects (2003‐2013)
Main research areas
Physics and Chemistry
Engineering
Social Sciences
Veterinary
Mexico Joint Research Projects 41 Biology and Health
Agricultural Sciences
Engineering
Physics
Earth, Water and Environment
Social Sciences
Astronomy
Technology
Source: TEP’s elaboration based on CONICET (2013): International Cooperation. Summary.
In addition to this, there are examples of joint partnerships with Brazil and Mexico in FP7 projects too32. Moreover, in 2012, national authorities set up a scheme for providing scholarships abroad (Bec.AR)33. This initiative is projected to provide 1,000 scholarships to enable students to pursue postgraduate studies in Brazil (at Fundacion Getulio Vargas) and the US (jointly organised with the Fulbright).
Argentina holds bilateral agreements with these countries. These are described in the text box below.
Table 4: Overview of the bilateral relationship between Argentina and the United States, Brazil and Mexico
United States
In 1972, an Agreement on Scientific and Technological Cooperation was signed between the Government of Argentina and the Government of the United States of America. In 2008, during an official mission to Washington D.C., the Argentinean Minister of S&T presented the guidelines of the Ministry and discussed future cooperation activities in S&T. Two years later, Argentina and the United States signed a joint declaration of cooperation in science, as part of the First Joint Meeting on S&T. In the framework of this declaration, Argentina currently develops a number of collaborative activities with US’ government agencies, research centres and academic institutions and universities e.g. the United States–Latin America Cancer Research Network; University of Maryland; University of Illinois; and University of Texas at Austin.
Brazil
The Agreement on Scientific and Technological Cooperation between the Government of Argentina and the Government of the Federative Republic of Brazil was signed in 1980. Since then, the Ministry of S&T shares
32 For example, with both Brazil and Mexico: Towards a Latin American and Caribbean Knowledge Based Bio‐Economy in partnership with Europe (ALCUE‐KBBE) 2011 – 2013 (www.alcue‐kbbe.eu/) and Global Strategic Alliances for the Coordination of Research on the Major Infectious Diseases of Animals and Zoonoses (STAR‐IDAZ) 2011 – 2013 (www.star‐idaz.net/). Argentinean Ministry of Science, Technology and Productive Innovation. Cooperation in Science, Technology and Innovation with the European Union: evaluation of the Argentinean participation in the Framework Programmes. Op.Cit. 33 Scholarships for training courses in science and technology abroad (BEC.AR). http://bec.ar/ (in Spanish)
Geographical expansion of the EURAXESS‐Links Network Final Report 28 February 2014
19
cooperative activities in S&T with three Brazilian counterparts: the Ministry of S&T (nine bilateral programmes), the Ministry of Education (one cooperation programme), and the Ministry of Health (one bi‐national programme). The two countries also cooperate in the framework of MERCOSUR. Together with Paraguay, Uruguay and Venezuela (and five associated countries: Chile, Bolivia, Colombia, Ecuador and Peru), Brazil and Argentina share a common S&T area for the discussion and implementation of cooperative research, development and innovation activities, focused on solving MERCOSUR problems34.
Mexico
In 1998 an Interagency Agreement was signed between the National Science Council of the United Mexican States and the former Department of S&T (now Ministry). This launched the implementation of the Cooperation Programme between the two institutions. At present the two countries are carrying out a joint programme of S&T, facilitating the exchange of research groups between the two countries. Furthermore, the Argentinean‐Mexican Nano‐science and Nanotechnology Centre (CAMen) was established with the aim to promote the exchange and transfer of S&T knowledge in the area, contribute to the training and development of human resources in both countries and generate knowledge through the development and implementation of research and development projects.
Source: TEP’s elaboration based on data from the Ministry of S&T in Argentina
Policy strategies
EU policy strategies
The EC has adopted a more regional approach towards international cooperation with Latin America. In this respect, regional cooperation schemes such as the EU‐CELAC Summit are key mechanisms to strengthen S&T collaboration. However, in the case of Argentina, there is still a bilateral agreement and a strong and long‐standing relationship with the EU that will continue in the next years.
According to the EU Delegation in Argentina, cooperation with Argentina has always been very fluid, and has involved a number of DGs in the EC, Member States, and all regions in Argentina. The links between the country and the EU are historic and cultural, and date from a long time ago. In their view, they are amongst the strongest links in Latin America; and possibly outside Latin America too.
S&T is the least problematic cooperation area between Argentina and the EU. The relationship is considerably developed and there are no major conflicts. In addition to this, Argentinean researchers and research organisations have proved to have a great capacity to submit proposals for cooperation projects with the EU and succeed in it.
From the EC’s perspective, the research areas in Argentina that are more important for the EU are:
• Agriculture
• Marine Sciences
• Health
• Nanotechnology
• Information and Communication Technologies
Cooperation in these areas has occurred via the FPs mainly, but also via the network of contacts between Argentinean and EU researchers that exists from decades ago and that will continue in the next years.
34 MERCOSUR Meeting in Science and Technology (RECYT). http://www.recyt.mincyt.gov.ar/index.php?lang=es (in Spanish)

Geographical expansion of the EURAXESS‐Links Network Final Report 28 February 2014
20
From Argentina’s side, S&T policies are high in the government’s agenda and this includes strengthening international cooperation to enhance national capacities. This is reflected in its relationship with the EU where new cooperation opportunities between the EU and the Argentinean Ministry of S&T were launched in the last year. For example35:
• Programme for Strengthening the Competitiveness of SMEs and Employment Creation in Argentina which is expected to increase the participation of SMEs in the innovation chain linked to the academic sector and other stakeholders (budget: 19.6 billion EUR ‐ 50% EU funding)
• Reciprocal Cooperation Agreement with COST complementing the activities of the FPs (Argentina is the first and only Latin American country and fourth in the world to conclude this agreement)
• Twinning Programme in Food, Agriculture, Biotechnology and Fisheries providing joint funding for various activities (e.g. meetings, short term stays, exchanges of information and materials)
Member State policy strategies (identified privileged partnerships/relationships)
As mentioned before, the links between Argentina and Europe date from a long time ago and are based on historic and cultural factors. The interviews revealed that the bilateral relationship in the area of S&T is one of the most important elements of the relationship between Argentina and individual Member States. According to the PNCTI, the prioritised Member States for the period 2012 – 2020 are France, Germany, Spain, Italy, the UK, and then the Netherlands and Belgium. In the present study we will focus on the first three Member States.
In the case of cooperation with France, this is one of the most active Member States in terms of fostering cooperation between the Argentinean and French research communities. In effect, S&T is the key element of the French‐Argentinean bilateral relationship.
France sends officials missions regularly to the country and is interested in establishing offices and research centres in Argentina. It also aims to train and support the development of S&T in the country and has taken several actions in this direction e.g. the creation of the ARFITEC programme to foster the exchange of engineering students between the two countries. Moreover, many Argentinean researchers have studied/worked in France already and have established long lasting relationships with French researchers and institutions. This has facilitated the development of an increasing number of joint research projects and international research groups, which is in the interest of both countries.
In the case of cooperation with Germany, both countries are interested in continuing and reinforcing this relationship. In effect, there have been some recent actions that will strengthen collaboration, particularly in the fields of Biotechnology, Biomedicine, and Engineering. For example, last year the Max Planck Society chose Argentina – out of a group of Latin American that were examined too ‐ to establish a new Partner Institute for biomedical research that will run in cooperation with CONICET. The decision was based partly on the existing cooperation over a period of more than 20 years between a German and an Argentinean researcher, who is now director of the Institute36. Another action has been a recent cooperation agreement signed by the Argentinean and German national authorities to strengthen cooperation in the Engineering fields. Moreover, there is also an
35 Argentinean Ministry of Science, Technology and Productive Innovation. Cooperation in Science, Technology and Innovation with the European Union: evaluation of the Argentinean participation in the Framework Programmes. Op.Cit. 36 www.mpg.de/4489950/Argentina_Partnership

Geographical expansion of the EURAXESS‐Links Network Final Report 28 February 2014
21
Argentinean‐German University Centre (CUAA)37 for actions of mobility and exchange of students, teachers and researchers that has experienced a steady increase in the number of participants, in particular in joint Master and PhDs programmes.
In this sense, Germany’s strategy to internationalise its universities and research centres is of strategic importance for Argentina and its relations with this country. In addition to this, there are various German sources of funding for international cooperation in S&T and mobility initiatives (in particular, the DAAD and the Alexander von Humboldt Foundation) that are also strategic for S&T collaboration between researchers in the two countries.
In the case of cooperation with Spain, the shared language is key for the dynamism and continuity of the relationship. However, it should also be noted that the economic crisis in Spain has also affected the number of exchanges between Argentinean and Spanish researchers in the last years. In spite of this, Argentina, together with Mexico and Chile, is still one of the main Latin American countries with which Spain cooperates and will continue like this in the next years. Spanish research institutions have highlighted that the main assets of Argentina is that there is an increasing promotion of research and that there is a critical mass of researchers of a high academic level38.
It is also important to note that beyond these countries with which Argentina has a strong bilateral relationship already, national authorities have expressed that they are interested in building S&T cooperation with countries from northern Europe (e.g. Sweden, Norway, and Finland) in areas related to the use of natural resources. According to them, there has been limited cooperation so far due to the fact that there is limited knowledge of Argentina in these countries and that there is no funding available for Argentinean research institutions to travel there and initiate contact.
37 www.cua‐dahz.org 38 Díaz Catalán C., Fernández Esquinas M., Sebtián J. (2010). Scientific Cooperation between Argentina and Spain: Institutional Relations between Universities and Research Centres. Available at: http://digital.csic.es/bitstream/10261/36981/1/Informe%20COARES_documento_de_trabajo.pdf (in Spanish)

Geographical expansion of the EURAXESS‐Links Network Final Report 28 February 2014
22
Australia Introduction
Background information
• Population: 22,683,600 (in 2012)39
• GDP (in EUR)
o Absolute value (at PPP): 1,131,736,857,299 (in 2012)40
o Per capita (at PPP): 31,978 (in 2012)41
• Expenditure on R&D (% GDP): 2.38 (in 2010)42
• Brief description of the country relation with the EU: Australia has a small population of 22 million people producing though a total of 3% of the “global knowledge” per year. It is considered as a science superpower, given its geographical location, excellence in research but primarily its advanced technology. Australia and the EU signed a Science and Technology Agreement in 1994. Many of the researchers working in Australia have strong links and settled networks with Europe. This is partly the case due to the fact that Australia is a country of migrants the vast majority of whom came from the European continent.
The R&D landscape in Australia
Background information on S&T policies
Research policy was not always a top priority in the national debates and political agenda of the successive governments in Australia. The situation has changed since the last five years, in the context of the global economic uncertainty, when the national stakeholders reconsidered the value of research in supporting the national growth. Increasing the business investment in research, focusing on excellence and encouraging international collaboration became the major targets for the Australian government.
The concept of research policy in Australia is not founded on legal instruments which have the binding force of traditional law, but it lies on public debates, periodic reviews and policy statements, including:
• Research Workforce Strategy, Research Skills for an Innovative Future (2013); a long‐term strategy framework on how to educate and reinforce Australia’s research workforce to support innovation. It also refers to researchers’ mobility, career paths and research training.
• An Industry and Innovation Statement: A Plan for Australian Jobs (2013): a policy statement referring to the allocation of EUR 800 million within five years to research‐industry collaboration for innovation.
39 The World Bank Data (http://data.worldbank.org/indicator/SP.POP.TOTL) 40 The World Bank Data (http://data.worldbank.org/indicator/NY.GDP.MKTP.CD): 1,532,407,884,934 US dollars (2012) 41 The World Bank Data (http://data.worldbank.org/indicator/NY.GNP.PCAP.PP.CD/countries): 43,300 US dollars (2012) 42 The World Bank Data (http://data.worldbank.org/indicator/GB.XPD.RSDV.GD.ZS/countries)

Geographical expansion of the EURAXESS‐Links Network Final Report 28 February 2014
23
• Australian Innovation System Report 2012 (2012): a policy statement outlining the new innovation goals and priorities.
• New National Research Investment Plan (2012): an Investment Plan providing a set of principles on how to drive investments in future major strategic research funding.
• Powering Ideas: An Innovation Agenda for the 21st Century (2009): a strategy document setting a ten‐year plan to strengthen the national innovation system and increase the support for R&D, largely in the public sector.
• Venturous Australia: Building Strength in Innovation (2008): a review of the National Innovation System.
Australia has become strong in basic and experimental research in its universities, government agencies and its not‐for‐profit research institutes. This is justified by its high public‐sector expenditure on R&D, the high international ranking of the local universities and the increasing publication rates in top scientific journals.
During the past decade, the national stakeholders looked into encouraging the R&D in industry and also building an innovation‐led economy. Related to the first target, the government’s goal is to arrive at an increase of 25% in the share of business in innovation (particularly in high‐technology manufacturing) over the next decade. To achieve this goal, the government launched the Industrial Transformation Research Programme (2011‐14) which encourages industry‐driven research in universities. Also, in 2011 the government decided to replace the R&D tax concession by an R&D tax incentive scheme based on a tax credit in an effort to support SMEs and open the national market to foreign‐owned companies43. Related to the second target, the Australian Public Service Innovation Action Plan (2011) aims to drive innovation in the public sector44 while the Framework of Principles for Innovation Initiatives (2009) intends to improve the accessibility and efficiency of innovation initiatives across Australia.
Australia is a federation and each State individually invests in R&D. In 2010, the national R&D expenditure as a percentage of the GDP was 2.38% (compared to 1.65% in 2002 and to 1.76% and 1.94% for the EU27 in 2002 and 2010 respectively) 45.
Australia’s rate of R&D spending has increased by 51% in recent years and is greater than the relative share in Canada, the United Kingdom, Belgium, Norway and Ireland but significantly less than that of Denmark and Sweden. In 2013‐2014, the total Federal Government expenditure on science, research and innovation has been estimated to EUR 7.2 billion compared to EUR 7.4 billion in the previous fiscal year 2011‐2012, which was an increase of about three per cent above the previous year.
While the level of R&D expenditure by Australian firms is considerably smaller than the top R&D‐spending firms in Europe, the rate of growth of R&D has been considerably higher. In 2010, the business enterprise expenditure on R&D was 1.27% of the GDP compared to 0.82% in 2001. Overall, over the decade to 2008, the share of government funding declined to 34% whereas the share funded by the industry increased to 62%.
Concerning the major R&D funders in Australia, these are the Australian Research Council (ARC), which provides competitive funding for university researchers in all fields except medicine; the
43 The R&D Tax credit has two components: a 45% refundable tax credit targeting firms with an annual turnover of less than EUR 14.5 million and a 40% non‐refundable tax credit targeting firms with an annual turnover of EUR 14.5 million or more. 44 Since 2011, the Australian Public Service Innovation Indicators (APSII) project has been collecting detailed information about innovation in the Australian public service that will be comparable with European data. 45 OECD Science, Technology and Industry Scoreboard 2011.

Geographical expansion of the EURAXESS‐Links Network Final Report 28 February 2014
24
National Health and Medical Research Council (NHMRC), which provides competitive funding in medical fields and the Commonwealth Scientific and Industrial Research Organisation (CSIRO) which provides limited funds.
As for the main R&D performers, business enterprises perform the majority of R&D and are largely self‐funded. The government funds R&D centres in a percentage of 20%, business enterprise in a percentage of 22.5% (mainly via the tax concession for R&D) while above 50% goes directly to universities (via block grants and competitive funding schemes).
The following figure provides an overview of the R&D funders and performers in Australia.
Figure 2: R&D funders and beneficiaries in Australia
Source: Erawatch
When it comes to the national R&D responsible bodies, the Department of Industry, Innovation, Science, Research and Tertiary Education (DIISRTE) is responsible for innovation, research, science and tertiary education policy in Australia. It consults with the Commonwealth State and Territory Advisory Council on Innovation (CSTACI), the Coordinating Committee on Innovation (CCI), the Australian Research Committee (ARCom), the Prime Minister Science, Engineering and Innovation Council (PMSEIC) as well as the Chief Scientist on matters of research governance, collaborations and policy.
Other significant actors are the publicly‐funded research agency Commonwealth Scientific and Industrial Research Organisation (CSIRO) which administers the annual budget, a group of the major research intensive universities (Group of 846) and the Australian Academy of Science.
46 The Group of 8 is a company owned by the following eight Universities: The Australian National University; The University of Melbourne; The University of New South Wales; The University of Queensland; The University of Sydney; Monash University, University of WA; and the University of Adelaide. The Group of 8 has strong links with international universities. It conducts 80% of the research in Australian and it is research intensively oriented.

Geographical expansion of the EURAXESS‐Links Network Final Report 28 February 2014
25
In addition, in Australia, there are 37 public sector universities, two private universities, and two Australian branches of overseas universities. Universities are independent in the way they decide their internal management and on how to use their (public) funding. However, they are accountable for the funding allocation, their performance and any commercialisation of research results to the national government.
The major fields of research in Australia are medicine, engineering and ICT. Over the last decade, Australia’s focus was put on emerging technologies such as space science and astronomy, marine and climate science, enabling technologies and future industries, such as bio‐ and nano‐technology. Over the past decade, the country has experienced a significant growth in all before mentioned R&D areas. For instance, the Australian Space Research programme (ASRP) is being developing “niche” space capabilities and the Stem Cells Australia does cutting‐edge health research. Also, between 2009 and 2013, a total of EUR 28 million was dedicated to the ICT sector whereas in 2010‐2011, the Australian industry allocated EUR 260 million in R&D for environmentally sustainable economic development.
Immigration policies
Information about visa requirements is quite difficult to get in aggregate, since there are local employment arrangements/agency level industrial agreements at each institutions. Generally speaking, all non‐national researchers are entitled to obtaining a temporary or permanent visa while recruitment to research and/or academic positions is open and merit‐based. Lately, temporary residence visas are increasingly used for both short and long‐term research appointments in an effort to reply to serious staff shortages in many fields.
Researchers with a non‐European origin are subject to issuing a ‘scientific visa’.
European researchers normally apply for a ‘working visa’ via their employer (university or other institutions) and the whole process does not take more than a couple of months. After three years, they may be entitled to a permanent visa.
Policies related to mobility and international attractiveness
Australia follows the global trend of promoting researchers’ mobility, both inward and outbound. Each Australian University offers a variety of scholarships, fellowships and grants which usually target non‐national students and involve mobility.
The national authorities are very much interested in investing in “incoming” researchers which, together with tourism, mining, and financial services are the main sources of national revenues.
At postgraduate levels, the International Postgraduate Research Scholarships (IPRS), funded by the Commonwealth Government, enables international students to undertake a postgraduate research qualification in Australia and gain experience with leading Australian researchers. IPRS target all international students (except New Zealand) and are available for a period of two years. The scholarship covers tuition fees and health cover costs for scholarship holders, and health cover costs for their dependents.
In addition, the Australian Research Council (ARC) offers study tours and fellowships open to international researchers (as long as they apply through an eligible Australian organisation), while it also provides funding for eligible organisations to promote collaboration47, mobility and networking between Australia‐based and overseas researchers48.
47 In 2013, Europe accounted for the highest percentage (47%) of total instances of collaboration by region with ARC‐funded projects. This is compared to 31% (Americas), 16% (Asia), and 4% (Oceania). Five EU Member States feature in the top ten countries for instances of international collaboration on ARC‐funded projects for 2013; the UK (1,040), Germany (543), France (392), the Netherlands (200) and Italy (170). The ARC has provided

Geographical expansion of the EURAXESS‐Links Network Final Report 28 February 2014
26
In line with outbound mobility, short study leaves (at PhD and post‐doc levels) are very much promoted by all Australian universities whereas the Australian Researchers Mobility Portal (see below) provides information on support for Australian researchers to work overseas. In addition, researchers permanently working at an Australian University have the opportunity every 6 years throughout their career to go abroad for 1 year and do research in a foreign institution.
Australia is also very keen on exchange programmes. International research collaboration and exchange are mainstreamed across the funding schemes of the National Competitive Grants Programme (NCGP). Also, exchange scholarships at students’ level (with a duration of 3 months) are very much promoted by the Australian universities (e.g. the University of Melbourne, the University of Canberra and the University of Sydney have established institutional agreements with overseas partners for student exchange).
In addition, the Endeavour Scholarships and Fellowships are internationally competitive scholarships for Australian to go and spend some time to neighbouring countries and in parallel, non‐Australian students to come and study in Australia. Another initiative promoting the two‐way flow of students is the New Colombo Plan between Australia and the Asia–Pacific region. The programme will be run between 2015‐2020 with a total budget of EUR 65 million targeting Japan, Indonesia, Singapore and Hong Kong.
When it comes to Australia’s participation in EU mobility schemes, there were 48 Australian fellows hosted by European institutions and 34 European Marie Curie Fellows based in Australia. Under this scheme, the Australian Academy of Science managed the DIISRTE contribution towards the costs for Australian research organisations to establish or reinforce long‐term research co‐operation through short‐term institutional staff exchanges.
Finally, there is a plethora of bi‐lateral agreements between the Australian institutions (universities and research centres) and European counterparts (especially with Germany, France, Italy, the UK) which includes provisions about mobility schemes and exchange of personnel along with knowledge transfer. There are many interconnected grants with European universities as well.
Welcome Offices and Services like EURAXESS
The majority of Australian universities have “international offices” for incoming researchers. For examples, the University of Sydney has the “International Services” department which provides a range of administrative services for international students.
Australian universities are also very keen on organising international exhibitions as well as study abroad fairs around the country to inform potential interested students about exchange programmes and other mobility schemes.
Finally, there is a dedicated portal called Australian Researchers’ Mobility portal (http://mobility.anu.edu.au/), supported by FEAST programme (see below), which offer information related to inward and outbound mobility. It also includes a reference to the EURAXESS LINKS portal.
Research Community
The size and characteristics of the research community in Australia
AU$2.5 million from 2009 to 2013 to support Australia’s participation as an Associate Member of the European Molecular Biology Laboratory. 48 In the past five years the ARC has awarded fellowships and awards to 301 researchers identified as European Union citizens including 5 Federation Fellows/Australian Laureate Fellows; 116 Future Fellows; and 54 Discovery Early Career Researcher Awardees. In addition, through the ARC Centres of Excellence scheme, the ARC funds prestigious hubs of expertise, attracting researchers of high international standing and the most promising research students from both within in Australia and abroad. The ARC also supports international research collaboration and mobility through the Industrial Transformation Research Programme.

Geographical expansion of the EURAXESS‐Links Network Final Report 28 February 2014
27
In Australia, in 2008, the total number of researchers (in FTE) was 92 648.8, compared to 87 201 in 2006. The number of researchers has been steadily increasing in the last 15 to 20 years with approximately additional 10 000 researchers every two years.
In terms of researchers’ place of work, in 2008, Higher Education Institutions (HEIs) employed the largest share of researchers amounting to 58.7%, followed by 29.9 in the Business Enterprise, 8.9 in the Government sector, whereas only 3.3 recorded in the private non‐profit49, as a percentage of national total.
Table 5: Full‐time equivalent on R&D activities, per sector of employment, 2005‐2010.
Source: OECD.StatExtracts
As illustrated in the table above, the majority of researchers in Australia are employed in the HEIs, including universities. Over the decade to 2010, Teaching‐Only academic staff in the universities has increased from 18.4% to 20.5%, as a proportion of all academic staff. Likewise, Research‐Only staff has increased from 22% in 2000 to 28.3% and that was mainly due to the augmentation of the research funding50.
Table 6: Staffing composition of Australia’s universities from 2000 to 2010 (FTE)
2000 2010 Increase 2000‐2010
Research only 8 651 14 937 6 286 72.7%
Teaching only 7 256 10 844 3 588 49.4%
Teaching and research
23 469 27 074 3 605 15.4%
49 http://www.oecd‐ilibrary.org/science‐and‐technology/oecd‐science‐technology‐and‐industry‐scoreboard‐2013_sti_scoreboard‐2013‐en 50 For instance, competitive research grants by the Commonwealth rose from $0.459 billion to $1.174 billion between 2000 and 2009.
2005 2006 2007 2008 2009 2010
.. 126701,8 .. 137488,7 .. ..Researchers .. 87201 .. 92648,8 .. ..Technicians .. 20891,5 .. 24243,3 .. ..Other support staff .. 18609,3 .. 20596,6 .. ..
43686,5 46461,7 50896,1 53885,7 57887,6 56532,3Researchers 23793,9 24770,9 26102 27721,2 29589,2 28313,4Technicians 13676,6 14821,5 16452,7 17200,7 18784 18930Other support staff 6216 6869,3 8341,3 8963,8 9514,4 9288,9
.. 16760 17042,2 17042,2 .. ..Researchers .. 8721 8284,8 8284,8 .. ..Technicians .. 5094,8 6104,9 6104,9 .. ..Other support staff .. 2944,2 2652,5 2652,5 .. ..
.. 58905,2 .. 61773,2 .. 69199,1Researchers .. 50866,9 .. 53592 .. 60630,7Technicians .. .. .. .. .. ..Other support staff .. 8038,3 .. 8181,2 .. 8568,4
.. 4574,9 .. 4787,6 .. ..Researchers .. 2842,2 .. 3050,8 .. ..Technicians .. 975,2 .. 937,7 .. ..Other support staff .. 757,5 .. 799,1 .. ..
Private non-profit Total R&D personnel
Total R&D personnel
Total intramural Business enterprise Total R&D personnel
Total R&D personnel
Government Total R&D personnel
Total R&D personnel
Higher education Total R&D personnel
Total R&D personnel
Year
Sector of employment Occupation
Total intramural Total R&D personnel
Total R&D personnel

Geographical expansion of the EURAXESS‐Links Network Final Report 28 February 2014
28
Source: Group of 8
The following table shows the allocation of Business Enterprise R‐D personnel (in FTE) by industry. The vast majority of “business” researchers work for the services sector in a total of 16 051.9 FTEs.
Table 7: Full‐time equivalent of Business Enterprise R‐D personnel by industry, 2005‐2010
Source: OECD
When it comes to the number of doctoral graduates in Australia, in 2010, the graduation rates was 1.9, as a percentage of the population (compared to 1.3 in 2000)51. Australia has 8 doctorate holders per 1 000 workers, less than the 11 per 1 000 in the United States and much less than in Germany, which has 20 doctorate‐holders per 1 000 workers. In the same year, the doctoral graduates per field of education were as follows52:
51 OECD Science, Technology and Industry Scoreboard 2011. 52 Idem.
2005 2006 2007 2008 2009 2010
Industry
TOTAL BERD 23793,9 24770,9 26102 27721,2 29589,2 28313,4 AGRICULTURE, HUNTING AND FORESTRY 213,2 172 167,2 185,5 193,3 156,8 MINING AND QUARRYING 1186,6 1029,9 954,9 1238,6 1213,5 1298,7 MANUFACTURING 9463,1 9081,3 9193,4 8682,2 8748,9 9313,6 ELECTRICITY, GAS and WATER SUPPLY 232,2 244,4 173,2 194,4 208 243,9 CONSTRUCTION 286,7 567,8 827,3 1047,6 974,5 1248,5 SERVICES SECTOR 12412,2 13675,6 14786 16372,9 18251 16051,9
Year

Geographical expansion of the EURAXESS‐Links Network Final Report 28 February 2014
29
Table 8: Doctoral graduates per field, 2010
Sciences Engineering, manufacturing and construction
Health and welfare
Humanities, arts and education
Social sciences, business and law
Services and agriculture
25.3 14.1 15.2 16.5 20.7 8.3
Source: OECD
The table below presents data on undergraduate students in the year 2011 available for each of the Universities belonging to the Group of 8 whereas it also gives the average figures for the remaining universities in the country. The same table also provides an indication about the total number of students at the Australian Universities, including off‐shore students.
Table 9: Total number of students (incl. off‐shore) and number of undergraduate students, 2011
Source: Group of 8
The community of foreign researchers in Australia
Similar to other countries in the scope of this study, there is no official record of the number of foreign (EU and non‐EU) researchers studying and/or working in Australia. Based on interviewees’ perceptions, the number of foreign researchers travelling to Australia has been increased in the last decade, in particular, at post‐doctoral levels. Foreign PhD students rarely travel to Australia due to the high tuition fees and the difficulty in receiving a scholarship.
Regarding the countries of origin, data again are not available. According to the people interviewed, China is at the top of the list of the incoming researchers followed by other countries in South East Asia. From Europe, the majority of foreign researchers are French, Germans, British, Italian as well as

Geographical expansion of the EURAXESS‐Links Network Final Report 28 February 2014
30
many Greeks. Most of the researchers of European origin are gathered in well‐connected local research communities sustained by the well‐established diaspora in Australia53.
The table below provides an indication of the number and the corresponding percentage of international students in the eight Australian universities for the year 2011.
Table 10: International students as percentage of all students at Group 8 and average figure on the remaining Australian Universities.
Source: Group of 8, 2013
As for the length of staying of foreign researchers (both EU and non‐EU), according to the interviewees, they visit Australia for both short‐ and long‐term stays. Over the recent years, there has been a tendency for long stays which is also explained by the open and transparent recruitment processes and the high degree of meritocracy related to career progression. For instance, foreign researcher coming to Australian universities, can be permanently hired by the university after four years of doing research/teaching at the university.
In terms of geographical distribution, in Australia, there are 39 universities which are quite well spread across the country and with a certain concentration down on the East coast. The research community (including foreign researchers) is quite well spread across the country depending on the specific field of research (e.g. climate change research in Melbourne, geography in Hobart, Sydney, biology in Brisbane) but with a certain concentration towards the South East coast.
Perceived needs of the research community in Australia
53 Australia is an attractive destination (in terms of weather conditions, living standards, liberty, etc.), a good environment to live (in terms of administrative work, child care, etc.) and has top universities. To this, data coming for the MORE 2 study ranks Australia as the second most popular non‐EU destinations for EU researchers currently mobile outside the EU in a percentage of 15% following the US (53%) and followed Canada (6%), Japan (5%), China (4%) and Singapore (3%).

Geographical expansion of the EURAXESS‐Links Network Final Report 28 February 2014
31
First and foremost, Australia suffers from the fate of distance. Researchers established in the country constantly feel geographically remote and that is why they are so keen on travelling overseas and be engaged in international collaborations. However, information on bi‐ or multi‐lateral collaborations is not always accessible and funding is not always guaranteed to travel long distance.
According to the researchers interviewed, on the one hand, the national government is much more interested in enhancing its collaboration with Asian countries due to the economic boost in this geographical area as well as the geographical proximity. On the other hand, researchers themselves are very pro‐Europe thanks to the fact that quality in research remains higher in Europe. However, when it comes to funding international collaborations, researchers follow the government’s choices and priorities. They would, therefore, very much appreciate greater exposure of the EU credibility and comparative value to the political hierarchy of Australia.
Related to this, people interviewed stated that despite the interest on behalf of the Australian research community in joint actions with European counterparts, the national government is not always providing funding for these actions. As a result, the local universities and research centres need to identify themselves sources to co‐fund such activities.
Finally, the primary need as communicated by the government is to change the balance of Australia’s economy towards innovation‐led productivity. National policies and strategies focus on building business R&D and innovation but this swift requires time. For this, the Australian research community would really appreciate strong collaboration with Europe in the fields of innovation, knowledge transfer and collaboration between academia and industry.
Key expectations/problems related to the mandate of EURAXESS Links
The Australian Government would welcome the opportunity to be part of the EURAXESS LINK as it could achieve a high degree of information flows for the research and business sectors. According to the interviewees, Australia needs additional resources and desires to be globally interconnected. Therefore, EURAXESS LINK would enhance the “globalisation” of research and would allow important linkages among countries and regions.
An interviewee, commented that EURAXESS should focus on PhD students and well‐established high level researchers, since mobility at post‐doc level is easier.
When it comes to the question whether EURAXESS LINK should undertake both Australia and New Zealand, all people interviewed agreed on that possibility. Even if similarities in both countries are not always visible, they are very close to each other and have developed strategic relationships in various areas. For instance there is a lot of engagement between the two countries in the field of research infrastructure. In addition, the size of the network of people involved in science is small in Australia and New Zealand, compared to Europe. Also, the universities in New Zealand are mostly “teaching universities” whereas in Australia, they perform cutting‐edge research. Therefore, not only would EURAXESS LINK encourage the collaboration between Australia and Europe but also between Australia and New Zealand.
Collaboration
Level of S&T cooperation between the EC and Australia
Australia and the EU signed a Science and Technology Agreement back in 1994 which initially targeted researchers so as to enable them to participate in joint programmes. This agreement was the very first signed between the EU and a third country. The cooperation was focused notably on joint science and technology assignments, organisation of workshops, research infrastructure set‐ups and research staff exchange. Since 1997, when the Agreement covered all research areas, around 370 projects have been jointly implemented of approximately EUR 2 billion.

Geographical expansion of the EURAXESS‐Links Network Final Report 28 February 2014
32
Since 2008, the Science and Technology bi‐lateral agreement has been replaced by the EU‐Australia Partnership Framework which touches upon several thematic areas including foreign policy, international security, and trade, regional cooperation in the Pacific area as well as climate change, energy and environment. The Partnership Framework has been already reviewed in 2009 providing a re‐orientation of the common priorities between the two parties.
Australia’s participation in the EU Framework Programmes
Australia’s participation in the Framework Programmes has grown significantly since FP45455. Under FP7, the average success rate of applications arrived at around 29% and Australia ranked third in the top‐three third countries, right after New Zealand (29%) and Japan (30%). Between 2007 and 2009, the success rate was constantly above 40% while in 2010 the percentage experienced a certain decrease but re‐achieved over 40% in 2011 and 2012.
Table 11: Numbers of applicants in retained proposals and of requested EU financial contribution in retained proposals (in € million) as well as corresponding success rates for FP7 calls concluded in 2007 ‐ 2012 in Australia
Applicants in retained proposals
Success rates of
applicants
2007 2008 2009 2010 2011 2012 Total 2012 2007‐2012
46 44 63 36 44 43 276 23.1% 29.1%
EC contribution to retained proposals
Success rates in
EC contribution
2007 2008 2009 2010 2011 2012 Total 2012 2007‐2012
1.2 1.3 1.5 0.3 3.9 1.3 9.6 20.2% 23.2%
Source: European Commission, Sixth FP7 Monitoring Report, MONITORING REPORT 2012, 7 August 2013
By December 2012 (most recent data available), Australia has participated in 210 cooperative projects of a total EU funding of EUR 972 million (of which EUR 5.2 million were dedicated to the Australian partners).
The figure below presents the success rate (in percentage of the total number of proposal submitted) by dedicated thematic area under FP7.
54 FP4: 60 projects; FP5: 90 projects; FP6: 173 projects. 55 The total value of the projects in which Australians were involved increased from EUR 95 million in FP4 (60 projects) to EUR 275 million in FP5 (90 projects) and to EUR 450 million in FP6 (173 projects).

Geographical expansion of the EURAXESS‐Links Network Final Report 28 February 2014
33
Figure 3: Number of proposals and success rate per thematic area, FP7.
Source: www.montroix.com, May 2012
According to the interviewees, the high success rate under the majority of the thematic areas was due to the fact that the Australian partners included an extensive list of publications as well as detailed information about the national financial support of the actions.
Australia's large participation under FPs was also due to its strong bilateral collaborations with a number of EU Member States, including the United Kingdom, France and Germany. It also participated in strong consortia with Italy, Spain, the Netherlands and the Scandinavian countries.
Australia’s participation in the European Research Council (ERC)
Since 2007, the ERC has awarded grants to 20 researchers identified as Australian citizens, of whom 17 were Starting grantees and three were Advanced grantees. Nine of these grantees were based at British host institutions, two in Germany, two in Austria and two in Denmark. Finland, Norway, Sweden, Switzerland, and France each host one Australian grantee. Two Australian grantees were awarded Proof of‐Concept grants. Also, there were 16 Australian Principal Investigators who received ERC grants to work at European institutions (reaching a percentage of 11% of all grants dedicated to third countries).
COST
Australia was the first third‐country participating in the COST (European Cooperation in Science and Technology) programme funding 120 Australian professional researchers to participate in 85 COST actions in various research areas over 2005‐10. Financial support for Australian researchers was related to short‐term scientific missions and/or attendance to a workshop/meetings of COST.
BILAT programmes
EU‐Australia bilateral programme FEAST (Forum for European–Australian Science and Technology Cooperation) was a success project aiming to strengthen the relation and facilitate research collaboration between the EU and Australia. The major sources of funding were the European Commission, through FP7, and the Australian Government Department of Industry, Innovation, Science, Research and Tertiary Education. Additional resources were also provided by the Australian

Geographical expansion of the EURAXESS‐Links Network Final Report 28 February 2014
34
National University. The project was initiated in 1999 by the Science attaché in the French Embassy who wanted to find opportunities for mobility between France and Australia. Yet, the information was quite fragmented and the need for a website where all information would be available to anyone (one stop‐shot) was born. Overall, it supported the bilateral dialogue and became more than an informative portal. It came into an end in 2012 and nowadays, all the intellectual property belongs to the Australian national university and even though the government wanted a third party to take over, the University did not accept it.
Its successor, CAESIE (Connecting Australian‐European Science and Innovation Excellence) project started last year and it aims to enhance the discussion around innovation for SMEs. Due to the limited industry‐academia links and linkages in the country (similar to Europe), this project is considered as “filling the existing gap”. It aims to enhance the industrial research design so as to set up specific research in academia‐industry (e.g. food processing and manufacturing) as well as promotes international linkages. Despite the fact that CAESIE has been formally launched, an organisational platform to replace FEAST has not been formed yet.
Another key bilateral project is PACE‐Net and its successor PACE‐Net Plus which aim to strengthen the bi‐regional dialogue and exchange of expertise on S&T between Europe and the Pacific, Australia and New Zealand. The first project focused on the following research areas: health, sustainable agriculture, nutrition and climate change. PACE‐Net Plus has slightly modified its scope focusing on health and diseases prevention but also marine sciences.
Level of S&T cooperation between individual Member States and Australia
The DIISRTE supports S&T collaboration with a number of countries in Europe including Germany, France, Italy and the United Kingdom. All four countries, together with Switzerland56 are also very important partners for Australia in the field of scientific co‐publications57.
Australia also has strong links with other European countries such as Spain, the Netherlands and the Scandinavian countries while there are also increasing opportunities for cooperation with the EU's new Member States.
Germany
Germany and Australia signed the Treaty on Science and Technology Cooperation back in 1976. For Australia Germany is one of the most important science collaboration partners. The German and the Australian governments are the project leaders for CAESIE. In 2013, the Australian and German Ministers for Foreign Affairs signed a Strategic Partnership which focuses on strengthening and
56 For years, there has been a very close cooperation between Australian and Swiss scientists and institutions. The two countries signed a Memorandum of Understanding (MoU) for cooperation in the fields of science, research and innovation in 2013. The MoU provides a formal government‐level framework for strengthening science, research and innovation collaboration and strongly supports knowledge exchange between the two countries. 57 In 2012, Australia and the EU28 (with any one Member State, or multiple Member States) produced 11 204 joint scientific publications, a significant increase from 5 838 joint scientific publications in 2007 (growth of 92%). In 2010, Germany: 1 893 joint scientific publications; France: 1 346; Italy: 911; UK: 3 920; and Switzerland: 753 (Thomson Reuters InCitesTM, 2011). Australia’s second highest scientific publication partner is the United States, with 7 386 joint publications in 2012, and 4 134 in 2007 (growth of 79%). On the Australian side, the most prolific institutions in terms of joint scientific publications with EU28 Member States were the Group of Eight universities (with the University of Sydney being the highest) and the Commonwealth Scientific and Industrial Research Organisation and on the EU side, were the University of Oxford and the University of Cambridge from the United Kingdom, and the Max Planck Society from Germany.

Geographical expansion of the EURAXESS‐Links Network Final Report 28 February 2014
35
deepening the bilateral cooperation as well as promote actions in the areas of biodiversity and preventative health.
France
France signed with Australia the Agreement on Cultural and Scientific Cooperation in 1977. In 2012, the two governments signed a Joint Statement of Strategic Partnership to mark 170 years of friendship and close collaboration in science and innovation between Australia and France. France has two “scientific attachés” (one at university level and a second one for PhDs and up) in Australia. Also, there are several MoU between French and Australian universities, offering France the fifth position in total number of agreements with Australia (following China, US, Germany and Japan).
Italy
Italy and Australia signed the treaty‐level Agreement of Cultural Co‐operation in 1975 which encouraged the development of relations in the social, cultural, artistic and scientific fields. Since 2012, both governments decided to strengthen science and research cooperation and as a result, in 2013 they signed a Memorandum of Understanding (MoU) for Cooperation in Scientific Research and Technology. This MoU establishes a framework for co‐operation in S&T by strengthening the bilateral science and research relations.
United Kingdom
The United Kingdom is an extremely important partner for Australia. In the absence of a formal government‐to‐government agreement, the two countries enjoy a long‐standing relationship in S&T which is primarily founded on the cooperation between the research institutes of the two countries. It was only in 1998 when the British Council in Australia signed a ‘Partners in Innovation’ arrangement in order to enhance industry innovation and technology diffusion through science and technology collaboration.
Level of S&T cooperation between Australia and non‐EU countries
The main non‐EU countries with which Australia cooperates are China, India, the US and the Asia‐Pacific zone and it primarily focuses on exchange of students (study visits), knowledge transfer and commercialisation of research results. Collaboration with China and India are very important for Australia and this is certified by the establishment of bi‐lateral funds dedicated to the collaboration with these two countries; the Australia‐China Science and Research Fund58 since 2011 and the Australia‐India Strategic Research Fund (AISRF) since 2006. People interviewed also agreed on the strong focus on Asian countries and the recent growth in collaboration with China in particular.
Other important partners in Asia are Indonesia, Korea, Malaysia, Singapore and Thailand. In particular with Singapore, the bilateral cooperation is well advanced in the fields of biotechnology, energy, engineering and information sciences. With all the before mentioned countries Australia has signed a formal agreement with the exception of Indonesia in which case the agreement is about to be finalised. Among other activities, the bilateral partners also award prizes for research excellence and significant projects.
In addition, the collaboration between Australia and the US is founded on an S&T Treaty (entered into force in 2007), strong research linkages between universities and government research agencies, as well as a high share of 14% of all international collaborations in Australia with US partners.
With New Zealand, there is no a formal S&T agreement in place. The two countries enjoy close collaboration in many policy fields, including science and innovation. They mostly collaborate in
58 A total of EUR 6.8 million was initially announced and an additional allocation of EUR 3.2 million was realised in the 2012‐13 Budget.

Geographical expansion of the EURAXESS‐Links Network Final Report 28 February 2014
36
marine and freshwater biology, molecular biology, geoscience and oceanography as well as animal science and ecology.
Australia has a bilateral MoU with Latin America and an agreement about to be signed with Brazil. In Chile, a CSIRO‐Chile International Centre of Excellence in Mining and Mineral Processing opened in Santiago in 2011 (with a ten‐year horizon) promoting four research programs: GeoResources and mine planning; intelligent mining systems; mineral processing and metallurgical systems; water, energy and environment impact.
Policy strategies
EU policy strategies
The long‐standing relations between the EU and Australia are based on bilateral dialogues in several fields ranging from trade and development cooperation, to education, science and innovation and migration policies. For instance, the Joint Science and Technology Cooperation Committee (JSTCC), based on the existing S&T agreement, was established to serve as a forum to identify common activities and areas of collaboration. In the future, both parties are considering designing a map to measure the progress towards common goals.
To demonstrate its commitment to enhancing S&T cooperation with Europe, the Australian government set up an office of the Department of Innovation, Industry, Science and Research (DIISR) in Brussels59. This office is located in the Australian Embassy and it primarily aims to highlight Australian research excellence in Europe and provide advice to European and Australian stakeholders on opportunities for increasing research cooperation in areas of mutual interest.
In return, Australia is home to three European Studies Centres located at the Australian National University, RMIT University and Monash University. These centres aim to promote a better understanding of the EU and EU‐Australia relations as well as provide a focal point for teaching, research and outreach activities with the EU, Australia and the Asia Pacific Region.
For more than 13 years, the International Science Linkages (ISL), established by the Australian government, had a dedicated funding for collaboration with the EU of approximately EUR 40 million. The programme was terminated in the 2010‐2011 budget and was not renewed due to a new approach adopted by the government to support international science collaboration through the ‘internationalisation’ of research programmes themselves. However, since 2008, the Commonwealth Scientific and Industrial Research Organisation (CSIRO) has received a concrete mandate to use the Flagship Collaboration Fund for international collaboration (more than EUR 65 million during seven years) to strengthen research co‐operation across all sectors of industry and science with Europe.
Regarding the areas of common interest, in the last 10 years, there has been a lot of synergies with the EU in the field of open access to data and publications. Even though the regime of data accessibility is slightly different between the EU and Australia, they both work towards the equal treatment and common interests.
Important collaboration also exist in marine science and oceanic research, bio‐diversity but also in medical research, preventive health, robotics, mining technology and clean energy (in particular solar and geothermal).
In addition, Australia is a significant partner for the EU in the development of the next‐generation radio telescope “Square Kilometre Array (SKA)”.
Also, in 2008, Australia became an associate member of EMBL, the European Molecular Biology Laboratory, Europe’s flagship for the life sciences. EMBL Australia aims to create a total of 18 to 20
59 DIISRTE has four dedicated science offices overseas representatives in Washington DC, Brussels, New Delhi and Beijing. It currently manages around 30 science and technology treaties.

Geographical expansion of the EURAXESS‐Links Network Final Report 28 February 2014
37
research groups across Australia, offering hosting institutions access to the scientific excellence and scientific governance which drives EMBL and EMBL Australia.
Finally, in the ICT sector, the EC is promoting, with the USA, Australia and Japan, a global research agenda in trustworthy infrastructures, including sharing of knowledge and best research practices for improving the resilience of present and future global networks and infrastructures.
Member State policy strategies (identified privileged partnerships/relationships)
Australia & France
France considers Australia as a key player in the international scene and in relation to science and innovation. Besides, many French companies are established in Australia and often promote linkages with academia. France’s interest in collaborating with Australia in the field of S&T is certified by the fact that in the French Embassy in Australia there are two people responsible for research and development. According to the interviewees, Australia is a top destination for French students and researchers. Information accessible to researchers interested in going to France is available via CAMPUS‐ France. It mainly targets post‐doc students and stays can last between one and three years.
On an annual basis, there are some 370 exchanges of students and research staff. This number has been increasing year after year and is supported by several bilateral initiatives between prestigious French and Australian R&D institutes. For instance, the Sydney University has very recently signed with the French institution Sciences Po a dual arts degree.
France focuses its collaboration with Australia in the areas of health, energy, environment and transport.
Australia & Italy
Italy is another European country with which Australia is strongly bonded in the field of science. The position of a scientific attaché exists since 30 years. Bilateral S&T cooperation is also facilitated by the presence of some hundreds of researchers of Italian origin working in Australian universities and research centres. Many of these researchers maintain strong research links with Italy.
There are currently 190 agreements between Australian and Italian universities (i.e. research programmes, staff exchanges, scholarships). Bilateral collaboration is efficiently promoted, for example, by joint workshops and symposia of which over 100 have been promoted by the Office of the Science Attaché of this Embassy and held in Australia since 1982 on common thematic areas of interest such as biomedicine, nanotechnology, applications of synchrotron radiation, advanced technologies for renewable energy, Earth observation & remote sensing, nuclear physics, astrophysics, pure and applied mathematics, food safety, advanced railway technology and applications of advanced characterization techniques for the preservation of cultural heritage, space science and oncology.
The two countries perform joint actions in astronomy and astrophysics, medicine, geoscience, marine sciences and maths.

Geographical expansion of the EURAXESS‐Links Network Final Report 28 February 2014
38
Chile Introduction
Background information
• Population: 17,464,81460
• GDP (in EUR)
o Absolute value (at PPP): 199,000 million (2012)61
o Per capita (at PPP): 11,400 (2012)62
• Expenditure on R&D (% GDP): 0.42%63 (2010)
• Brief description of the country relation with the EU: Relations with Chile were built initially on the 1996 Framework Cooperation Agreement, which established a political and economic association. In 2002, the EU and Chile concluded an Association Agreement (fully enforced since 2005) that further developed the synergies between the different strands of political, cooperation and trade relations. In the S&T field, there is a long‐standing tradition of cooperation dating back to the FP3. In 2002, the EU and Chile created a formal cooperation basis through the S&T Cooperation Agreement, ratified in 2003 and entering into force in 2007. Chile also has multiple bilateral S&T agreements with EU Member States involving joint research projects, joint centres of excellence and student and researcher exchange.
The R&D landscape in Chile
Background information on S&T policies
In the 2005 – 2010 period, the Chilean government has almost doubled its investment in S&T, registering an average annual increase of circa 14% and achieving a figure of 0.42% of GDP64. According to the national authorities interviewed, in 2012 this was circa 0.5% and it will continue to increase in the next years, showing the government is committed to further strengthening S&T in Chile.
The S&T policies in Chile are responsibility of the Presidency, who receives advice from the National Commission for Scientific and Technological Research (CONICYT). This organisation is in charge of promoting the formation of advanced human capital, disseminating scientific and technological research and strengthening the country’s S&T foundation. CONICYT is an autonomous public
60 The World Ban Data (http://data.worldbank.org/indicator/SP.POP.TOTL) 61 The World Bank Data (http://data.worldbank.org/indicator/NY.GDP.MKTP.CD): 269,869,337,788 US dollars (2012) 62 The World Bank Data (http://datos.bancomundial.org/indicador/NY.GDP.PCAP.CD): 15,452 US dollars (2012) 63 OECD Library (http://www.oecd‐ilibrary.org/science‐and‐technology/gross‐domestic‐expenditure‐on‐r‐d_2075843x‐table1) 64 CNIC (2010). Progress, Challenges and Proposals for S&T (http://biblioteca.cnic.cl/media/users/3/181868/files/18813/DocReferencia‐Ciencia.pdf) (in Spanish)

Geographical expansion of the EURAXESS‐Links Network Final Report 28 February 2014
39
institution which is part of the National Science, Technology and Innovation System and which relates administratively with the government through the Ministry of Education (MINEDUC)65.
Another important player in the S&T System in Chile is the Chilean Economic Development Agency (CORFO). This organisation is responsible for increasing competitiveness in SMEs through innovation and technological dissemination. With this main aim, CORFO finances entrepreneurship, technology transfer and innovation in SMEs, seeks to attract foreign investment, and supports optimisation of management of procedures. CORFO is part of the Ministry of Economy, Development and Tourism (MINECON).
The National Innovation Strategy was defined in 2007 after a process of consultation with high level authorities from the public, scientific, academic and private sectors. This strategy defines national priorities for strategically oriented scientific activities and public policies in order to develop an efficient National Innovation System. In line with this, five economic sectors have been identified as the ones which offer more development potential for the future: Aquaculture, Agro‐industry, Mining, Global Services and Tourism.
In addition to this, and according to a recent study on Chile’s level of scientific production66, the research areas with more potential67 in Chile are:
• Biochemistry, Genetics and Molecular Biology
• Energy
• Neuro‐sciences
• Dentistry
Other areas with potential include: Materials Sciences; Environmental Sciences; Pharmacology, Toxicology and Pharmaceutical; Chemical Engineering; Business, Management and Accounting; Decision Theory; and Veterinary.
A large amount of the research CONICYT supports and funds corresponds to the areas of Environment and Energy due to their importance for the development of the country in general, and to the areas of Education and Health since these significantly impact the population’s quality of life. CONICYT also focuses on Chile’s unique natural conditions in order to develop research in the areas of Earth Sciences and Oceanography, and Astronomy.
It is important to note that one of the issues mentioned by interviewees is that research and, more generally, S&T policies, are mainly driven by an economic and commercial interest. This serves to explain the current increased support to innovation and applied research (see section below on the programme of International Centres of Excellence). Another recent measure that is in line with this approach is a decrease in taxes for those businesses that carry out research.
Immigration policies
According to the stakeholders interviewed, immigration policies in Chile are very open, in particular towards EU citizens. If a foreign researcher has a work contract in Chile, it is not difficult to get a visa. Foreign researchers first get a temporary residency of one year and then they can apply to a more permanent residency.
Stakeholders with experience in receiving students and researchers from abroad said that they have obtained the visas relatively easy and quickly. What usually takes more time is that all papers need to be translated.
65 Idem 66 Principales indicadores cienciométricos de la actividad científica chilena 2011. Op.Cit. 67 These areas have indicators of remarkable quality and excellence, but are still underdeveloped in Chile.
Geographical expansion of the EURAXESS‐Links Network Final Report 28 February 2014
40
One interviewee mentioned that one of the obstacles towards the immigration of foreign researchers is that the cost of living in Chile, in particular in the capital city, is high. Thus, they may find other countries and cities in Europe more attractive than Santiago.
Policies related to mobility and international attractiveness
Chile is relatively active in attracting foreign researchers for working in the country more permanently or visiting it for shorter periods of time. Evidence of this is the broad offer of national programmes and funding sources available for foreign researchers. Some of the programmes open to researchers or institutions from the EU include:
• Scholarship for PhD degrees in Chile for foreigners. Enables highly qualified foreign graduates to acquire or continue a PhD in any area of expertise at a Chilean university.
• Postdoctoral fellowship in Chile. Enables young postdoctoral research scientists to develop research projects in any area of expertise within well‐established research groups in Chile. Is open to foreign researchers (residing in Chile or outside).
• Support for the return to Chile of researchers from abroad. Supports the return to Chile of highly qualified young scientists with a PhD in any area of expertise obtained abroad. Non‐nationals residing in a foreign country must hold a certificate of definite residence in Chile to be able to apply.
• Programme for International Scientific Cooperation (PCCI). Promotes the creation and/or strengthening of lines of research in all areas of expertise both in Chile and abroad by supporting the exchange of researchers. Researchers from the country of one of the participant foreign institutional counterparts are able to apply.
• Abate Juan Ignacio Molina Prize for Excellence in Science. Supports international cooperation between Chile and Germany by giving recognition to an outstanding German researcher or expert in any area of expertise for his/her scientific career. This is a joint initiative between CONICYT and the Alexander von Humboldt Foundation.
• Attraction of advanced human capital from abroad short‐term visit programme (MEC). Offers outstanding scientists from abroad the opportunity to teach and conduct research at a Chilean regional university.
• Support for international networking between research centres. Supports activities that promote international networking between Chilean science and technology research centres and those based abroad.
• STIC AmSud and MATH AmSud regional programmes. Promotes and strengthens the collaboration of research networks in the field of ICT and Mathematics, by financing the exchange of researchers and doctoral students between Argentina, Brazil, Chile, Paraguay, Peru, Uruguay and France.
• Ibero‐American Programme for Science, Technology and Development (CYTED). Fund projects from public or non‐profit private R&D Centres, technological centres or public or private companies based in a country of the Iberoamerican region (this includes Portugal and Spain)
• Call for proposals supporting the development of international research projects. Enables world‐class research teams in Chile and abroad to collaborate in cutting‐edge research projects and new innovation processes.
• Programme for international cooperation joint research projects. Enhances and strengthens links and exchanges between researchers in Chile and abroad.

Geographical expansion of the EURAXESS‐Links Network Final Report 28 February 2014
41
• ALMA‐CONICYT fund for the development of the Chilean astronomy. Provides funds for research fellow positions (short‐term), support for graduate students and the creation of permanent positions, among other options. Positions can be filled with either Chilean or foreign researchers.
• GEMINI‐CONICYT fund – National programme for the development of astronomy and related sciences. Same as above.
• FONDAP research centres in priority areas. Supports the establishment in Chile of high quality scientific research centres focused on one of the country’s priority areas. Centres must incorporate the participation of both Chilean and foreign researchers.
Finally, there is also a well‐established programme for the attraction of International R&D Centres of Excellence for Competitiveness (Innova Chile) that supports the establishment in Chile of such centres to carry out R&D, technology transfer and commercialisation activities in fields of technological cutting edge, with high national and international economic impact, and that strengthen national R&D capabilities.
The first call for applications took place in 2009. Since then, four CEIs have been established: Fraunhofer‐Gesellschaft (Germany ‐ Biotechnology), CSIRO (Australia ‐ Mining, Energy, Water and Climate issues), Inria (France ‐ Resource Management, Telecommunications and Astronomy), and Wageningen UR (the Netherlands – Food industry) have been established.
In 2014, additional four centres from the United States, Spain, Australia and Germany are to be established68.
Research Community
The size and characteristics of the research community in Chile
The most recent data reveals there are 5,440 full‐time equivalent (FTE) researchers in Chile (2010)69. A third of these have a PhD (33%)70. Despite it is a small community of researchers (compared to other countries in the region)71, Chilean researchers have been then most productive in the region, going from 0.43 papers published per year per FTE researcher in 2001 to 1.26 in 201072.
According to interviewees, only in 2012, 2,731 scholarships for Master and PhD programmes either in Chile or abroad were awarded by CONICYT. However, the formal academic level of university professors is still relatively low, only 18 to 40% have a PhD.
According to this institution, there are circa 2,400 Chileans doing their PhDs abroad with a FONDECYT scholarship at the moment.
68 http://www.english.corfo.cl/press‐room/news/prestigious‐international‐rd‐institutions‐arrive‐in‐chile‐with‐support‐from‐corfo 69 Principales indicadores cienciométricos de la actividad científica chilena 2011 (http://cincel.cl/documentos/Recursos/Informe_2013_baja_resolucion.pdf (in Spanish). According to UNESCO Statistics, this is equivalent to 9,453 headcount (http://stats.uis.unesco.org/unesco/TableViewer/tableView.aspx?ReportId=2642) 70 EC (2011): Review of S&T Cooperation between the European Union and the Republic of Chile 2007‐2011 (http://www.ec.europa.eu/research/iscp/pdf/review_eu‐chile_s&t_coopagree.pdf) 71 In 2010, Colombia had 7,160 FTE researchers, Argentina 34,879, Mexico 45,044, and Brazil 106,359. 72 This was 0.25 to 0.29 in Argentina, 0.26 to 0.33 in Mexico, 0.23 to 0.45 in Brazil, and 0.16 to 0.64 in Colombia.

Geographical expansion of the EURAXESS‐Links Network Final Report 28 February 2014
42
Over half of Chilean researchers work in public and private Higher Education institutions (60%), followed by circa 25% that work in the business sector73. The rest work in a NGOs (10%) or for the government (5%)74.
In terms of research fields, most FTE researchers work in the field of Engineering and Technology, followed by those that work in Natural and Social Sciences. This is presented in the table below.
Table 12: Researchers main fields of work
Research field Nr of FTE Researchers (2010) %
Engineering and Technology 1,585 29%
Natural Sciences 1,044 19%
Social Sciences 1,017 19%
Agricultural Sciences 859 16%
Medical and Health Sciences 741 14%
Humanities 194 3%
TOTAL 5440 100%
Source: TEP’s elaboration based on data from UNESCO Institute for Statistics (2010)
In addition to this, and according to a recent study on Chile’s level of scientific production75, the strongest research areas76 in Chile are:
• Computer Sciences
• Earth Sciences
• Physics and Astronomy
• Engineering
• Mathematics
According to the latest data, the total number of FTE researchers has increased from 4,809 in 2001 to 5,440 in 2010 (13%). This is mainly due to the considerable increase in funding available for research coming from CONICYT. According to this institution, funding increased a 25% in the last 5 to 10 years. This is quite a noticeable step forward in the country’s commitment to develop its productive capabilities.
The community of foreign researchers in Chile
As for other countries, there is no official data available in terms of the number of EU researchers in the country. All evidence collected was therefore of an anecdotal nature, reflecting the perceptions
73 UNESCO Statistics 2010 (or latest year available) (http://www.uis.unesco.org/ScienceTechnology/Documents/sti‐hr‐rd‐en.pdf) 74 http://stats.oecd.org/Index.aspx?DataSetCode=PERS_OCCUP 75 Principales indicadores cienciométricos de la actividad científica chilena 2011. Op.Cit. 76 These areas have indicators of quality and excellence close to the average level in the world and are also of a relevant dimension in Chile.

Geographical expansion of the EURAXESS‐Links Network Final Report 28 February 2014
43
of national authorities, individual researchers, universities and centres of research and embassies staff.
National authorities have estimated that, in the last 1.5 years, there have been around 200 European researchers in the country, and 600 in the last 4 to 5 years, most of them coming from Spain and France. This estimation is based on the total number of EU researchers who live in Chile and that have applied (and won) CONICYT funds, on researchers that arrive to the country via mobility instruments aimed to attract foreign expertise to local universities, and on researchers who come for shorter periods of time (e.g. attending and event). It is important to note that these figures do not include foreign researchers / professors that go to Chile in the framework of local universities’ own mobility programmes and agreements with foreign institutions.
The stakeholders interviewed explained that the most attractive fields for EU researchers in Chile are those related to the country’s natural resources (e.g. Environmental Sciences, Climate Change, Biotechnology, Astronomy, Mining, Forestry), and also Physics and Mathematics.
EU researchers and students in the country are concentrated in the capital city. However, there are important research centres and universities in other regions of the country that are attractive to foreign researchers too (e.g. Atacama Desert).
Perceived needs of the local research community
The stakeholders interviewed mentioned that in Chile there are sufficient funds for S&T. There are various sources of funding, including both the public and private sources. In Chile, the private sector participates considerably in research too, particularly in the mining sector.
The main issue in Chile is that there is a small community of researchers. Even though these researchers are considerably productive in terms of the number of papers and publications, the local community is in need of an international network of collaborations to be able to strengthen S&T in the country.
In line with this, stakeholders have mentioned that there is a need to increase the links between Chilean researchers and international partners. According to national authorities, in CONICYT projects where it is mandatory to have international cooperation, Chilean researchers do not usually have the same rates of success than with local projects. Despite there has been a dramatic increase in the demand for these funds (from 20 applications to 130 in two years), only a few can win them. One of the reasons is that it is not always easy to find the right international partner for a project.
Linked with this is the need for a better dissemination of information on collaboration and mobility opportunities across Chile. Most of the information is currently disseminated among researchers and institutions within the capital city only.
Mobility is a very important aspect for researchers in Chile. Because of their history and politics, Chileans have always had high mobility. Many have gone abroad to do their Masters or PhDs and are now returning to the country. Short and long term mobility is seen as an opportunity to increase international connections that can then be used for developing joint research projects. At the moment, there is a lot of interest in PhD programmes that provide the possibility of spending 6 months to a year abroad (i.e. what is locally called “sandwich programmes”).
CONICYT has a lot of funds and agreements for researchers and students mobility. However, there is also a need to be able to advance from mobility projects to projects of joint research with foreign institutions. According to this organisation, around 95% of the cooperation actions between Chile and other countries are of mobility. Only 5% are for carrying out joint research.

Geographical expansion of the EURAXESS‐Links Network Final Report 28 February 2014
44
Key expectations/problems related to the mandate of EURAXESS Links
All interviewees were convinced of the added value of a network that would connect EU and Chilean researchers. The different interviewees indicated that the added value of EURAXESS Links was mainly the potential of:
• Increasing local researchers’ awareness of and interest on opportunities abroad
• Consolidating and organising information on collaboration opportunities with the EU
• Enhancing dissemination of information on collaboration opportunities across the country and on a timely manner
• Expanding local researchers’ network of contacts
• Providing support and advice on issues related to applying to EU calls for funding
• Disseminating information on the broad number of international cooperation opportunities at the different stages of the research and innovation that are open for application to Chilean and foreign individuals, research groups and institutions or that have an international cooperation dimension.
• Complementing the international agreements and collaborations that already exist in the country
One thing mentioned in the interviews was that it is important that this network is not redundant and does not replicate existing networks or sources of information that are provided by other institutions such as CONICYT. Thus, the network should be established in the country in cooperation with other local institutions. The network should also take into account the international agreements and collaborations that already exist and that are well established in the country.
Collaboration
Level of S&T cooperation between the EC and Chile
The links between Chile and the EU date back to the 19th century and, over time, these have turned into a strong diplomatic relationship. There are also significant cultural links thanks to European immigration to Chile and also Chileans to Europe.
The deep economic, social, and cultural relationship between Chile and Europe has resulted in the signing of agreements and legal instruments on various areas77, including S&T. The broader legal frame under which the EU‐Chilean bilateral relations take place is the Association Agreement signed in 2002, covering the main aspects of the political, commercial and cooperation dialogue.
The Scientific and Technological Cooperation Agreement between the EU and Chile was signed in 2002, ratified in 2003, and entered into force on 1 January 200778.
In addition to this, there is a Chile‐EU Liaison Office79 to support and enhance the Chilean participation in the EU’s FPs, disseminate the research opportunities offered in Chile and Europe to the scientific and innovation community and promote the Chilean programmes open to the
77 For example, the Association Agreement between Chile and the EU signed in November 2002 and the Free Trade Agreement with the European Free Trade Association (EFTA) signed in June 2003 (http://www.minrel.gob.cl/minrel/site/artic/20080722/pags/20080722130343.html) 78 EC (2011): Review of S&T Cooperation between the European Union and the Republic of Chile 2007‐2011 79 http://www.sti‐cooperation.cl/index.php/en

Geographical expansion of the EURAXESS‐Links Network Final Report 28 February 2014
45
participation of European researchers80. Thus, the Liaison Office is the focal point for the EU‐Chile S&T Cooperation and is settled in the Department of International Relations in CONICYT.
According from data from this Office, 70 Chilean institutions participated in the FP6 (2002 – 2006), which constituted an important increase in Chile’s participation compared to previous FPs (30 participants in FP4 and 23 participants in FP5). The success rate of the Chilean participants in FP6 was overall 18% (70 participants with main listed projects out of 393 applicants)81.
From 2007 to 2010, 74 Chilean entities had participated in the FP782, with a general success rate of 22% (74 participants with main listed projects among 338 proposers), similar to Brazil and Mexico but lower than Argentina.
Level of S&T cooperation between individual Member States and Chile
Chile has 67 bilateral agreements with a total of 16 Member States. The most important Member States (in terms of the number of agreements with each country) are Belgium, France, Germany, Finland and Spain. The French bilateral cooperation represents circa 50% (22 agreements) of the total of agreements83, followed by Germany (10), Spain (6), Finland (3) and Belgium (2). The agreements are all implemented by CONICYT84. The funded activities under these agreements are scholarships, researcher mobility and joint research projects.
According to national authorities, these are also the Member States that have been more interested over time in establishing relationships with Chilean researchers. There are also many Chilean researchers that have studied in these countries and have maintained their contacts and relations when they went back to Chile.
The table below presents the type of funded activities, research area and number of beneficiaries for Chile under the bilateral agreements with Member States. It only includes the arrangements in which there is at least one successful Chilean beneficiary between 2005 and 200985.
Table 13: Funded activities, research areas and beneficiaries under bilateral agreements with Member States
Country Counterpart Type of funded activity and research area Chilean beneficiaries (2005‐2009)
Germany BMBF Researcher mobility and joint research projects
Areas: Biotechnology, ICT, Environment
40
80 http://www.sti‐cooperation.cl/jdownloads/Documentos%20de%20anlisis%20%20Analysis%20Documents/opportunities.pdf 81 CONICYT‐Chile (2010): Analytical report on Science and Technology cooperation between the EU, its Member States and Chile, p.28. 82 The latest data available for Chile’s participation in FP7 is from 2010. Therefore, all of the quoted statistics do not relate to the whole FP7 time framework, but to the period 2007 to 2010 only. 83 Collaborations in S&T between Chile and France come second among all collaborations with countries. In addition to bilateral national agreements, there are more than 300 agreements between Chilean and French universities. 84 There are 24 agreements with other European countries / Member States including: the UK (8), Italy (6), Denmark (2), Hungary (2), Portugal (2), Croatia (1), the Netherlands (1), Norway (1), and Poland (1) (www.conicyt.cl/sobre‐conicyt/convenios/convenios‐internacionales/) (in Spanish) 85 Although a bilateral agreement existed between Chile and Belgium, there were no Chilean beneficiaries to it in the period 2005‐2009.

Geographical expansion of the EURAXESS‐Links Network Final Report 28 February 2014
46
DAAD Researcher mobility and joint research projects
Areas: Biotechnology, ICT, Environment, Geology, Nanotechnology and Materials, Astronomy
20
DAAD Scholarships
Areas: All thematic fields
21
DFG Researcher mobility and joint research projects
Areas: Biotechnology, ICT, fisheries and aquaculture, genomics, biodiversity, geology
27
Total Nr of beneficiaries 108
France ECOS Researcher mobility and joint research projects
Areas: Life sciences, Biology, Mathematics, Social science, Health, Earth science and Astronomy
91
INRIA Researcher mobility and joint research projects
Areas: ICT, mathematics
21
INSERM Researcher mobility and joint research projects
Areas: Health
7
CNRS Researcher mobility and joint research projects
Areas: All thematic fields
50
IRD Researcher mobility and joint research projects
Areas: Earth, Ocean and Atmospheric Science, Social Sciences and Environmental Science.
5
Total Nr of beneficiaries 174
Spain CSIC
N/A 33
Total Nr of beneficiaries 33
Finland Academy of
Finland
Researcher mobility and joint research projects
Areas: Renewable energy, education
8
Total Nr of beneficiaries 8
Source: TEP’s elaboration based on: CONICYT‐Chile (2010): Analytical report on Science and Technology cooperation between the EU, its Member States and Chile.

Geographical expansion of the EURAXESS‐Links Network Final Report 28 February 2014
47
In addition to this, Chile is currently implementing three multilateral cooperation agreements in S&T, namely86:
• STIC‐Amsud: Cooperation scheme with France covering researcher mobility and joint research projects in the area of Information and Communication Technologies (ICTs). Other countries in the region involved include: Argentina, Brazil, Peru and Uruguay.
• MATH‐Amsud: Cooperation scheme with France covering researcher mobility and joint research projects in the area of Mathematics. Other countries in the region involved include: Argentina, Brazil, Peru and Uruguay.
• Ibero‐American S&T for Development (CYTED): Cooperation scheme that involves 19 Latin American countries, Spain and Portugal. It is for joint research projects in the areas of Food/Agriculture, Health, Industrial Development, Sustainable Development, ICT, Social Sciences and Energy.
Additionally, the cooperation with a few Member Sates includes the establishment of foreign International Centres of Excellence in Chile.
Level of S&T cooperation between Chile and non‐EU countries
Chile currently has S&T bilateral agreements with 24 countries (non‐EU countries)87. The main scientific partner for Chile is the United States, partnering in 18.6% of national scientific productions. This is also the country where most Chilean researchers go to study. According to one of the interviewees, most young researchers have visited the United States at some point of their training.
With the United States, Chile has a Basic Agreement on S&T Cooperation signed in 1992. There are 15 additional cooperation agreements signed between 1974 and 201388.
In Latin America, Argentina, Brazil and Mexico are the most frequent partners89. Chile has seven S&T cooperation agreements with Brazil, four with Argentina and three with Mexico90. Moreover, Chile currently chairs the Community of Latin American and Caribbean States (CELAC), which hold its first Summit in January 2013. The first EU‐CELAC Summit took place in the framework of this high level meeting too.
Policy strategies
EU policy strategies
The EC has adopted a more regional approach towards international cooperation with Latin America. In this respect, regional cooperation schemes such as the EU‐CELAC Summit are key mechanisms to strengthen S&T collaboration. However, in the case of Chile, there is still a bilateral agreement and a strong and long‐standing relationship with the EU that will continue in the next years.
According to the Country Strategy Paper 2007 – 201391, the priority objective of the EC for the period 2007‐2013 is to deepen the EU‐Chile Association Agreement through cooperation and policy dialogue in the areas of innovation and competitiveness, social cohesion and education. The Association
86 CONICYT‐Chile (2010): Analytical report on Science and Technology cooperation between the EU, its Member States and Chile, Op.Cit. 87 www.conicyt.cl/sobre‐conicyt/convenios/convenios‐internacionales/ 88 www.conicyt.cl/sobre‐conicyt/convenios/convenios‐internacionales/ (in Spanish) 89 http://www.cincel.cl/Documentos/Recursos/Informe_2013_baja_resolucion.pdf 90 www.sti‐cooperation.cl/index.php/es/7pm‐/areas‐tematicas/medio‐ambiente/170?task=view (in Spanish) 91 http://eeas.europa.eu/chile/csp/07_13_en.pdf

Geographical expansion of the EURAXESS‐Links Network Final Report 28 February 2014
48
Agreement is the central axis of the EU‐Chile relationship and provides the appropriate framework for mutually beneficial activities in areas of common interest. The mid‐term review of this strategy confirmed the strategy remained valid, with one adjustment. Based on Chile´s 2008 decision to establish a national scholarship programme (Becas Chile) with funds of 6,000 million USD to finance postgraduate and other studies for a projected total of 30,000 students, the EU re‐evaluated the need to continue EU assistance for Education‐Academic exchanges and scholarships. Considering the EU assistance planned for 2010 – 2013 was likely to fund less than 200 students, it decided to drop this type of assistance. However, considering the important role that cooperation in higher education can play in strengthening ties between Chilean and EU stakeholders and boosting mobility, capacities and skills, the EC decided to continue to encourage Chile to participate further in the Erasmus Mundus programme so as to complement Becas Chile.
From the Chilean side, relations with Europe have a high priority for the Chilean foreign policy. The continued interest of Chile is to deepen its dialogue with Europe, agree on common views and joint initiatives on global issues and emphasize the political, economic, social and cultural integration with the EU and its individual Member States92.
One of the main interests of national authorities is to cooperate with the EU in combining basic and applied research. Moreover, they see the EU could also take more advantage of Chile’s natural resources, regionalise research and create clusters. Chile is also developing what is called “natural labs” and the country has received international funding for this already.
Chile could also benefit from cooperation with the EU in social sciences, which are developed to a limited extent in Chile. It is estimated that there around 3,000 Chileans abroad studying and researching; half of them are in the Social Sciences. These researchers will go back to the country and will demand work opportunities and funds. They will also bring their international connections, which could be used to strengthen international cooperation.
92 http://www.minrel.gob.cl/minrel/site/artic/20080722/pags/20080722130343.html

Geographical expansion of the EURAXESS‐Links Network Final Report 28 February 2014
49
Member State policy strategies (identified privileged partnerships/relationships)
Stakeholders from the Member States interviewed have explained that Chile is very open to international research opportunities and there has always been a lot of support and willingness to develop bilateral cooperation. Moreover, there is funding available for strengthening cooperation with Member States. Chile is also a small country with few researchers, thus they are open to work with foreign researchers and institutions.

Geographical expansion of the EURAXESS‐Links Network Final Report 28 February 2014
50
Mexico Introduction
Background information
• Population: 120,847,47793 (2012).
• GDP (in EUR)
o Absolute value (at PPP): 862,000 million94 (2012)
o Per capita (at PPP): 12,03595 (2012)
• Expenditure on R&D (% GDP): 0.4696 (in 2011)
• Brief description of the country relation with the EU: Mexico is the second largest Latin American country, behind Brazil. In the S&T sector, Mexico, traditionally, has been basic‐research oriented whereas in recent years a swift towards applied research and innovative performance has been observed. International co‐operation for Mexico is considered as an important source of financing, and a necessary tool to enhance technology transfer. Mexican‐EU cooperation on S&T is dated back in 2004 (with the signature of the Agreement for Scientific and Technological Cooperation) and it continues to be reinforced. In parallel, a number of bilateral S&T agreements with EU Member States is in place. Other than Europe, Mexico is closely cooperating on S&T policies with Latin American countries and Ibero‐American regions. Nevertheless, the openness of the Mexican R&D system to non‐national beneficiaries is still in a premature phase and the limited public funding available for research discourages foreign talent.
The R&D landscape in Mexico
Background information on S&T policies
Science and technology has been always included in the agenda of the Mexican Government but since the change of government in 2013 (next to the presidential elections in mid‐2012), it is receiving an increasing importance at policy and implementation levels.
The national government’s priorities, in short term, include the set‐up of dedicated agencies for Innovation and the promotion of political debates on moving towards a knowledge‐based economy and involve as many national performers as possible.
In Mexico, R&D is legally bounded by the new Science and Technology Law (2002) and the Special Programme for Science, Technology and Innovation PECiTI 2008‐2012, as well as its successor PECiTI 2013‐2037. Both PECiTI programmes are the response to the steady low levels of public support of R&D in the last decade. They aim to stimulate entrepreneurship in research and facilitate collaboration between industry and academia, as well as to involve a larger share of public investments in R&D for the coming years. 93 The World Bank Data (http://data.worldbank.org/indicator/SP.POP.TOTL) 94 The World Bank Data (http://data.worldbank.org/indicator/NY.GDP.MKTP.CD): 1,178,126,184,343 US dollars (2012) 95 The World Bank Data (http://data.worldbank.org/indicator/NY.GNP.PCAP.PP.CD/countries): 16,450 US dollars (2012) 96 The World Bank Data (http://data.worldbank.org/indicator/GB.XPD.RSDV.GD.ZS/countries)
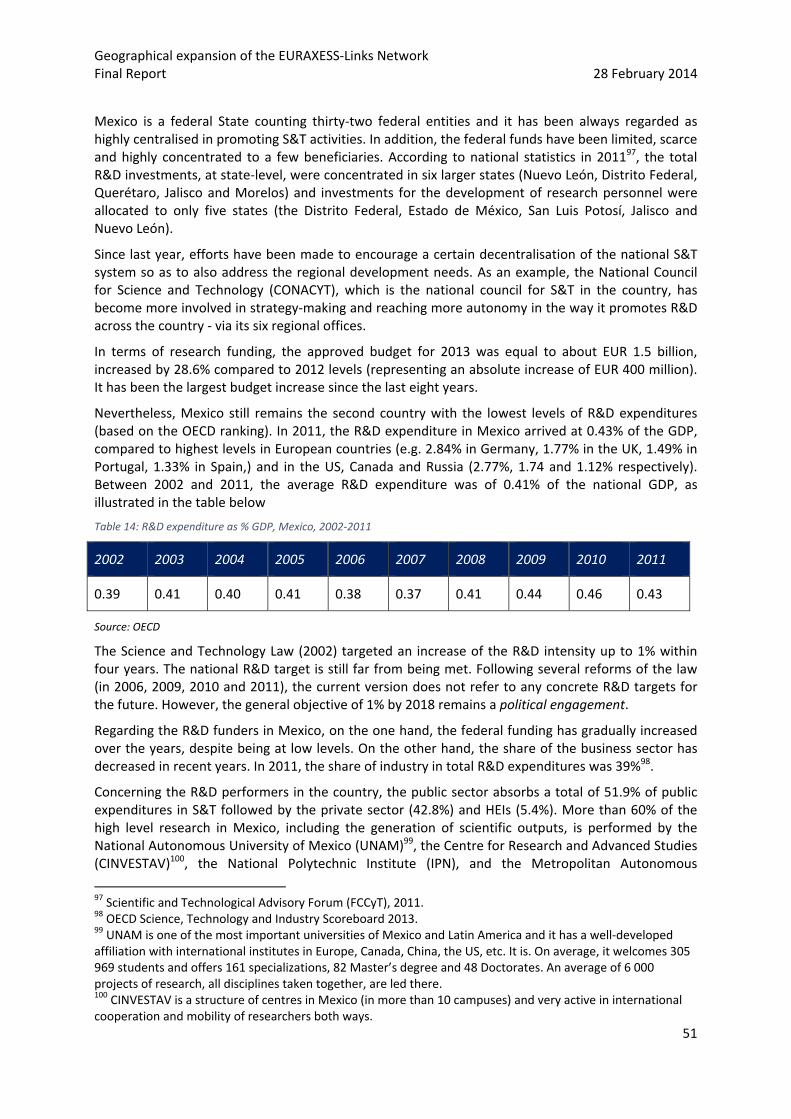
Geographical expansion of the EURAXESS‐Links Network Final Report 28 February 2014
51
Mexico is a federal State counting thirty‐two federal entities and it has been always regarded as highly centralised in promoting S&T activities. In addition, the federal funds have been limited, scarce and highly concentrated to a few beneficiaries. According to national statistics in 201197, the total R&D investments, at state‐level, were concentrated in six larger states (Nuevo León, Distrito Federal, Querétaro, Jalisco and Morelos) and investments for the development of research personnel were allocated to only five states (the Distrito Federal, Estado de México, San Luis Potosí, Jalisco and Nuevo León).
Since last year, efforts have been made to encourage a certain decentralisation of the national S&T system so as to also address the regional development needs. As an example, the National Council for Science and Technology (CONACYT), which is the national council for S&T in the country, has become more involved in strategy‐making and reaching more autonomy in the way it promotes R&D across the country ‐ via its six regional offices.
In terms of research funding, the approved budget for 2013 was equal to about EUR 1.5 billion, increased by 28.6% compared to 2012 levels (representing an absolute increase of EUR 400 million). It has been the largest budget increase since the last eight years.
Nevertheless, Mexico still remains the second country with the lowest levels of R&D expenditures (based on the OECD ranking). In 2011, the R&D expenditure in Mexico arrived at 0.43% of the GDP, compared to highest levels in European countries (e.g. 2.84% in Germany, 1.77% in the UK, 1.49% in Portugal, 1.33% in Spain,) and in the US, Canada and Russia (2.77%, 1.74 and 1.12% respectively). Between 2002 and 2011, the average R&D expenditure was of 0.41% of the national GDP, as illustrated in the table below
Table 14: R&D expenditure as % GDP, Mexico, 2002‐2011
2002 2003 2004 2005 2006 2007 2008 2009 2010 2011
0.39 0.41 0.40 0.41 0.38 0.37 0.41 0.44 0.46 0.43
Source: OECD
The Science and Technology Law (2002) targeted an increase of the R&D intensity up to 1% within four years. The national R&D target is still far from being met. Following several reforms of the law (in 2006, 2009, 2010 and 2011), the current version does not refer to any concrete R&D targets for the future. However, the general objective of 1% by 2018 remains a political engagement.
Regarding the R&D funders in Mexico, on the one hand, the federal funding has gradually increased over the years, despite being at low levels. On the other hand, the share of the business sector has decreased in recent years. In 2011, the share of industry in total R&D expenditures was 39%98.
Concerning the R&D performers in the country, the public sector absorbs a total of 51.9% of public expenditures in S&T followed by the private sector (42.8%) and HEIs (5.4%). More than 60% of the high level research in Mexico, including the generation of scientific outputs, is performed by the National Autonomous University of Mexico (UNAM)99, the Centre for Research and Advanced Studies (CINVESTAV)100, the National Polytechnic Institute (IPN), and the Metropolitan Autonomous
97 Scientific and Technological Advisory Forum (FCCyT), 2011. 98 OECD Science, Technology and Industry Scoreboard 2013. 99 UNAM is one of the most important universities of Mexico and Latin America and it has a well‐developed affiliation with international institutes in Europe, Canada, China, the US, etc. It is. On average, it welcomes 305 969 students and offers 161 specializations, 82 Master’s degree and 48 Doctorates. An average of 6 000 projects of research, all disciplines taken together, are led there. 100 CINVESTAV is a structure of centres in Mexico (in more than 10 campuses) and very active in international cooperation and mobility of researchers both ways.
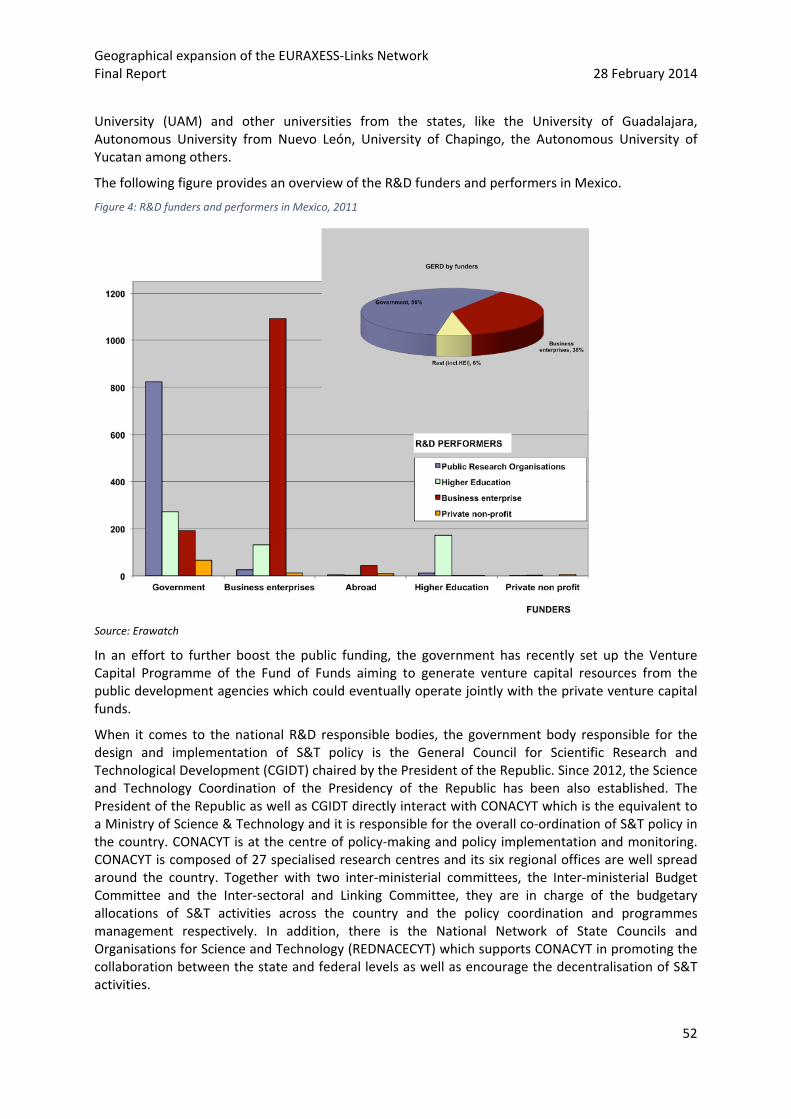
Geographical expansion of the EURAXESS‐Links Network Final Report 28 February 2014
52
University (UAM) and other universities from the states, like the University of Guadalajara, Autonomous University from Nuevo León, University of Chapingo, the Autonomous University of Yucatan among others.
The following figure provides an overview of the R&D funders and performers in Mexico.
Figure 4: R&D funders and performers in Mexico, 2011
Source: Erawatch
In an effort to further boost the public funding, the government has recently set up the Venture Capital Programme of the Fund of Funds aiming to generate venture capital resources from the public development agencies which could eventually operate jointly with the private venture capital funds.
When it comes to the national R&D responsible bodies, the government body responsible for the design and implementation of S&T policy is the General Council for Scientific Research and Technological Development (CGIDT) chaired by the President of the Republic. Since 2012, the Science and Technology Coordination of the Presidency of the Republic has been also established. The President of the Republic as well as CGIDT directly interact with CONACYT which is the equivalent to a Ministry of Science & Technology and it is responsible for the overall co‐ordination of S&T policy in the country. CONACYT is at the centre of policy‐making and policy implementation and monitoring. CONACYT is composed of 27 specialised research centres and its six regional offices are well spread around the country. Together with two inter‐ministerial committees, the Inter‐ministerial Budget Committee and the Inter‐sectoral and Linking Committee, they are in charge of the budgetary allocations of S&T activities across the country and the policy coordination and programmes management respectively. In addition, there is the National Network of State Councils and Organisations for Science and Technology (REDNACECYT) which supports CONACYT in promoting the collaboration between the state and federal levels as well as encourage the decentralisation of S&T activities.
Geographical expansion of the EURAXESS‐Links Network Final Report 28 February 2014
53
In terms of the R&D sectors Mexico is eminent at geonomics. Volcanology and social science follow whereas the list of prominent R&D sectors for the country research performance also includes transport and ICTs, health (on diabetes), agriculture, biotechnology, aeronautics and space research, electronics and metrology. Also, there has been a lot going on lately in the area of nanotechnology. Finally, in the field of environment and climate change, sustainable energy (and primarily, solar and hydro‐thermal energy) is lately gaining more weight but the government still has to be convinced about the benefits of investing more in new energy technologies.
Immigration policies
Carrying out scientific research by foreign researchers in Mexico requires prior approval by the Mexican government through the Secretariat of Foreign Relations (SRE). In order to obtain a “research permit”, despite the fact that all appropriate Mexican technical agencies review the applications, the SRE is the only authorised body to grant the final official approval. All research applications must be submitted 90 days ahead of the start of the proposed research trip to Mexico.
For researchers coming from Europe, since 2012, a new legislation has been put in place to “facilitate migration policies” while discussions between the EU and the SRE about the adoption of a “European working visa” are ongoing. Final decision is still pending.
Policies related to mobility and international attractiveness
Mexico suffers from a large outflow of skilled migrants, especially to the US and Canada. For instance, by 2011, the number of Mexican professionals working abroad (including R&D personnel) increased from 411 000 to more than 1 million. People interviewed referred to approximately 4 000 Mexican students/researchers based in Europe, and particularly, in the UK, Finland, Spain and the Czech Republic. Inward mobility in Mexico is at low levels, according to the interviewees; the basic salary of researchers is squat and working conditions are very fragile, resulting in few incentives for foreign researchers to come to Mexico. Yet, since the last years, the national authorities have put in place several instruments to stimulate Mexican researchers to return to the country but also to attract foreigners. The most important initiative is the Institutional Consolidation Programme (PCI) which focuses on inward mobility and in particular, it promotes the repatriation and retention of researchers by helping them join national HEIs and research centres in Mexico.
In addition, in an effort to particularly attract European researchers to Mexico, the FP7 project ACCESS2MEXCYT encouraged mobility of European researchers to Mexico to become involved in research programmes run by Mexican research institutions.
As for researchers’ outbound mobility, the main national instrument is the Post‐graduate Scholarship Programme of CONACYT (since 30 years now). The programme encourages researchers’ mobility and is the most important source of funding for Mexicans wishing to pursue postgraduate studies in Mexico but also abroad. In 2011, the total number of scholarships for studies abroad was of 4 082101. As a sub‐call of the main programme, CONACYT also supports doctorate graduates spending post‐doctorate research periods abroad as well as sabbatical research periods.
Aiming to increase the internationalisation of research via exchange programmes for students/researchers with the EU and other countries, the Mexican government participates in the Excellence Postgraduate Programme (PNPC). The programme is open to foreign students and researchers (from 157 countries, including 22 European countries)102 wishing to collaborate with Mexico via exchanging training sessions in the countries involved.
101 In the same year, a total of 20 141 scholarships were granted and the total number of beneficiaries was 40 596. Around 65% of all national scholarships were granted for studies in institutions outside the Mexican capital of Mexico City, proving an additional effort for decentralising research. 102 Germany, Austria, Belgium, Bulgaria, Cyprus, Slovenia, Spain, Finland, France, Hungary, Great Britain,

Geographical expansion of the EURAXESS‐Links Network Final Report 28 February 2014
54
Also, the Yearly Academic Exchange Programme of UNAM aims to develop and strengthen academic cooperation between UNAM and its counterparts in Mexico and abroad in six areas; health, ICT, energy, environment, social sciences and security. The cooperation is based on knowledge exchange and participation in joint research projects.
Exchange of research staff in the framework of joint research projects, for sharing knowledge, for training purposes and networking as well as for participating in academic workshops, seminars and conferences is also promoted via the Bilateral Cooperation Programme financed partially by CONACYT’s institutional fund. In 2012, the European partners were the German Foundation for Scientific Research (DFG); the German Academic Exchange Service (DAAD); the National Centre for Scientific Research (CNRS, France); and the National Scientific Research Fund (FRS‐FNRS, Belgium).
In addition, under the EU Framework Programmes, Mexico participated in a total of 47 projects under the Marie Curie International Research Staff Exchange Scheme (IRSES).
Finally, at bilateral level, between Mexico and Spain, due to a long‐lasting relationship between the two countries, a bilateral fund exists and it focuses on staff exchanges and good practices sharing between Spanish and Mexican universities as well as among individual researchers.
Welcome Offices and Services like EURAXESS
In Mexico, the majority of the research institutions (including UNAM, Cinvestad) have international departments/offices in charge of establishing institutional agreements and exchange programmes with universities abroad. ANUIES, the National Association of Universities and HEIs also offers a great range of information targeting researchers, from students’ scholarships to international academic programmes. Also, practical information, including mobility schemes, for both national and foreign researchers, is provided by CONACYT and the SRE. Information on both websites is also available in English while ANUIES website is only available in Spanish.
Since 2009, CONACYT has an office in the Mexican Mission to the EU which also provides information about mobility schemes and career opportunities for European researchers interested in travelling to Mexico for studies and/or work.
Greece, Ireland, Italy, Latvia, Lithuania, the Netherlands, Poland, Portugal, Czech Republic, Slovakia, Romania.

Geographical expansion of the EURAXESS‐Links Network Final Report 28 February 2014
55
Research Community
The size and characteristics of the research community
Since 2000, the total number of researchers in Mexico has experienced several alterations. Between 2005 and 2006, the number of researchers dropped by around 7 000 and remained at similar levels till 2009 when it went through a significant increase of around 5 000. Since then, the number of researchers in Mexico has remained nearly unchanged.
As shown in the table below, in 2011, the total number of researchers (in FTE) was 46125 (compared to 45 045 in 2010) and as of 2009, it has been slowly increasing with approximately additional 1 000 researchers per year.
Table 15: Full‐time equivalent on R&D activities (and per sector of employment), Mexico, 2005‐2011
Source: OECD.StatExtracts
Based on the most recent data available103, in 2007, in Mexico there were 0.94 researchers per thousand employed (in FTE), well far from the EU‐27 average of 6.49.
In terms of researchers’ place of work, in 2011, for the first time in years, industry employed the largest share of researchers, amounting to 41.1, followed by 36.2 in Higher Education104, 19.8 in the Government sector, and only 2.9 was recorded in the private non‐profit, as a percentage of the national total105.
The national government is currently looking to boost the labour market for researchers in academia. For the moment, it is difficult for junior researchers to find a position at a national university due to “internal entry barriers” related to informal rules set by experienced researchers. Vacant positions are usually taken by experienced researchers, or by research assistants well connected to “old generations” working in the same research institution. In 2010, based on statistics published by UNAM, only 20.6% of researchers below 40 years old had an academic research position.
103 OECD Science, Technology and Industry Scoreboard 2013. 104 It should be noticed that in Mexico, the percentage of public higher education institutions is 33% whereas the private corresponds to the 67%. 105 OECD Science, Technology and Industry Scoreboard 2013
2005 2006 2007 2008 2009 2010 2011
83685 66967 70293 .. .. .. ..Researchers 43922 36264 37930 37638,904 42972,606 45044,722 46124,961Technicians 25796 19328 20037 .. .. .. ..Other support staff 13967 11375 12326 .. .. .. ..
42331 31791 34376 .. .. .. ..Researchers 19888 14927 16103 11849,339 16181,247 18696,328 18954Technicians 16353 11806 12284 .. .. .. ..Other support staff 6090 5058 5989 .. .. .. ..
14837 14274 14247 .. .. .. ..Researchers 6589 7331 7322 8018,64 8282,85 8755,59 9154,083Technicians 5125 3632 3602 .. .. .. ..Other support staff 3123 3311 3323 .. .. .. ..
25218 19384 19889 .. .. .. ..Researchers 16691 13232 13569 16677,965 17381,039 16365,041 16691,204Technicians 3986 3401 3559 .. .. .. ..Other support staff 4541 2751 2761 .. .. .. ..
1299 1518 1781 .. .. .. ..Researchers 754 774 936 1092,96 1127,47 1227,762 1325,674Technicians 332 489 592 .. .. .. ..Other support staff 213 255 253 .. .. .. ..
Private non-profit Total R&D personnel
Total R&D personnel
Total intramural Business enterprise Total R&D personnel
Total R&D personnel
Government Total R&D personnel
Total R&D personnel
Higher education Total R&D personnel
Total R&D personnel
Year
Sector of employment Occupation
Total intramural Total R&D personnel
Total R&D personnel
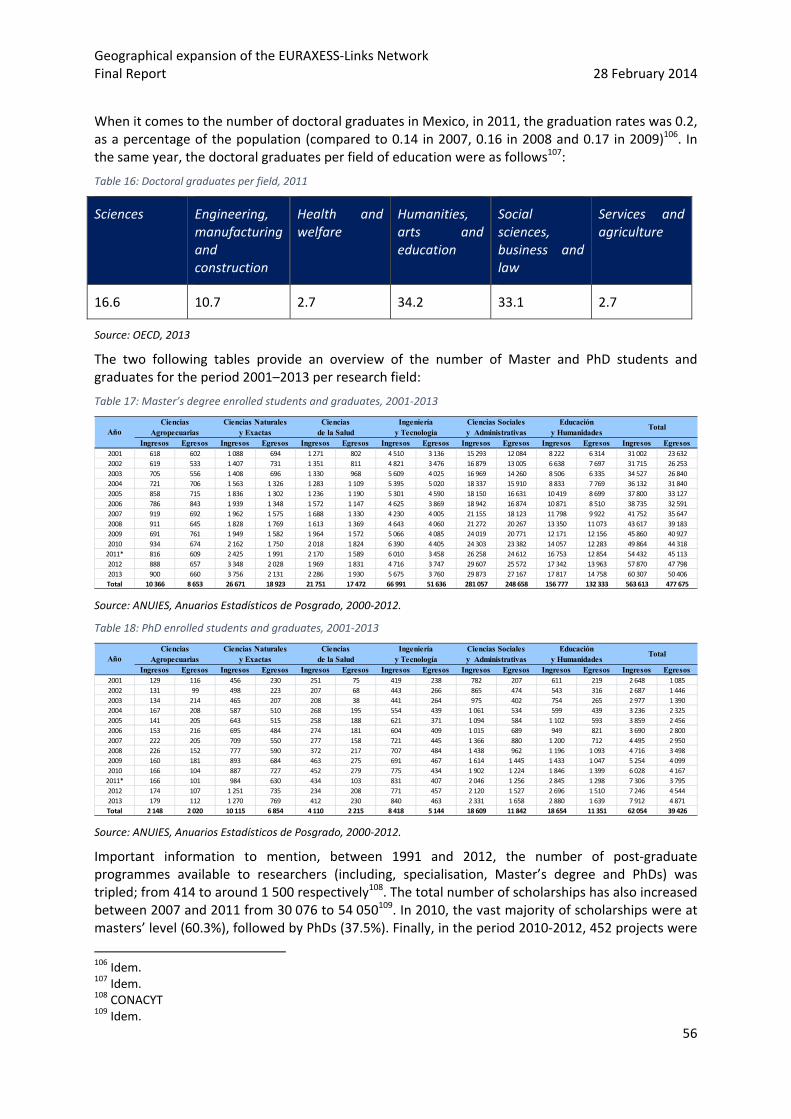
Geographical expansion of the EURAXESS‐Links Network Final Report 28 February 2014
56
When it comes to the number of doctoral graduates in Mexico, in 2011, the graduation rates was 0.2, as a percentage of the population (compared to 0.14 in 2007, 0.16 in 2008 and 0.17 in 2009)106. In the same year, the doctoral graduates per field of education were as follows107:
Table 16: Doctoral graduates per field, 2011
Sciences Engineering, manufacturing and construction
Health and welfare
Humanities, arts and education
Social sciences, business and law
Services and agriculture
16.6 10.7 2.7 34.2 33.1 2.7
Source: OECD, 2013
The two following tables provide an overview of the number of Master and PhD students and graduates for the period 2001–2013 per research field:
Table 17: Master’s degree enrolled students and graduates, 2001‐2013
Source: ANUIES, Anuarios Estadísticos de Posgrado, 2000‐2012.
Table 18: PhD enrolled students and graduates, 2001‐2013
Source: ANUIES, Anuarios Estadísticos de Posgrado, 2000‐2012.
Important information to mention, between 1991 and 2012, the number of post‐graduate programmes available to researchers (including, specialisation, Master’s degree and PhDs) was tripled; from 414 to around 1 500 respectively108. The total number of scholarships has also increased between 2007 and 2011 from 30 076 to 54 050109. In 2010, the vast majority of scholarships were at masters’ level (60.3%), followed by PhDs (37.5%). Finally, in the period 2010‐2012, 452 projects were
106 Idem. 107 Idem. 108 CONACYT 109 Idem.
Ingresos Egresos Ingresos Egresos Ingresos Egresos Ingresos Egresos Ingresos Egresos Ingresos Egresos Ingresos Egresos2001 618 602 1 088 694 1 271 802 4 510 3 136 15 293 12 084 8 222 6 314 31 002 23 6322002 619 533 1 407 731 1 351 811 4 821 3 476 16 879 13 005 6 638 7 697 31 715 26 2532003 705 556 1 408 696 1 330 968 5 609 4 025 16 969 14 260 8 506 6 335 34 527 26 8402004 721 706 1 563 1 326 1 283 1 109 5 395 5 020 18 337 15 910 8 833 7 769 36 132 31 8402005 858 715 1 836 1 302 1 236 1 190 5 301 4 590 18 150 16 631 10 419 8 699 37 800 33 1272006 786 843 1 939 1 348 1 572 1 147 4 625 3 869 18 942 16 874 10 871 8 510 38 735 32 5912007 919 692 1 962 1 575 1 688 1 330 4 230 4 005 21 155 18 123 11 798 9 922 41 752 35 6472008 911 645 1 828 1 769 1 613 1 369 4 643 4 060 21 272 20 267 13 350 11 073 43 617 39 1832009 691 761 1 949 1 582 1 964 1 572 5 066 4 085 24 019 20 771 12 171 12 156 45 860 40 9272010 934 674 2 162 1 750 2 018 1 824 6 390 4 405 24 303 23 382 14 057 12 283 49 864 44 3182011* 816 609 2 425 1 991 2 170 1 589 6 010 3 458 26 258 24 612 16 753 12 854 54 432 45 1132012 888 657 3 348 2 028 1 969 1 831 4 716 3 747 29 607 25 572 17 342 13 963 57 870 47 7982013 900 660 3 756 2 131 2 286 1 930 5 675 3 760 29 873 27 167 17 817 14 758 60 307 50 406Total 10 366 8 653 26 671 18 923 21 751 17 472 66 991 51 636 281 057 248 658 156 777 132 333 563 613 477 675
Educación TotalAgropecuarias y Exactas de la Salud y Tecnología y Administrativas y Humanidades
Ciencias Ciencias Naturales Ciencias Ingeniería Ciencias SocialesAño
Ingresos Egresos Ingresos Egresos Ingresos Egresos Ingresos Egresos Ingresos Egresos Ingresos Egresos Ingresos Egresos2001 129 116 456 230 251 75 419 238 782 207 611 219 2 648 1 0852002 131 99 498 223 207 68 443 266 865 474 543 316 2 687 1 4462003 134 214 465 207 208 38 441 264 975 402 754 265 2 977 1 3902004 167 208 587 510 268 195 554 439 1 061 534 599 439 3 236 2 3252005 141 205 643 515 258 188 621 371 1 094 584 1 102 593 3 859 2 4562006 153 216 695 484 274 181 604 409 1 015 689 949 821 3 690 2 8002007 222 205 709 550 277 158 721 445 1 366 880 1 200 712 4 495 2 9502008 226 152 777 590 372 217 707 484 1 438 962 1 196 1 093 4 716 3 4982009 160 181 893 684 463 275 691 467 1 614 1 445 1 433 1 047 5 254 4 0992010 166 104 887 727 452 279 775 434 1 902 1 224 1 846 1 399 6 028 4 1672011* 166 101 984 630 434 103 831 407 2 046 1 256 2 845 1 298 7 306 3 7952012 174 107 1 251 735 234 208 771 457 2 120 1 527 2 696 1 510 7 246 4 5442013 179 112 1 270 769 412 230 840 463 2 331 1 658 2 880 1 639 7 912 4 871Total 2 148 2 020 10 115 6 854 4 110 2 215 8 418 5 144 18 609 11 842 18 654 11 351 62 054 39 426
Educación TotalAgropecuarias y Exactas de la Salud y Tecnología y Administrativas y Humanidades
Ciencias Ciencias Naturales Ciencias Ingeniería Ciencias SocialesAño

Geographical expansion of the EURAXESS‐Links Network Final Report 28 February 2014
57
supported to encourage the mobility of researchers, out of which 308 were for post‐doctoral students (68%)110.
The community of foreign researchers in Mexico
Similar to other countries in the scope of this study, there is no official record of the number of foreign (EU and non‐EU) researchers studying and/or working in Mexico. Based on interviewees’ perceptions, the largest foreign research community in the country are from Central America and other Latin American countries.
When it comes to Europe, interviewees admitted that there has been a tradition in mobility between Mexico and Europe, even if it has not been officially recorded. The interviewees talked about a certain increase of incoming European researchers in Mexico for the last five years, especially from Spain, France and German. Currently, they estimated around 1 000 European researchers living in Mexico.
Foreign researchers (including Europeans) usually perform temporary stays in Mexico but it overall depends on the funding instrument available to them. Despite the fact that the remuneration package for a researcher in Mexico is not attractive, people deciding to permanently stay in Mexico are driven by the excellence in research the Mexican research institutions globally demonstrate.
In terms of geographical distribution, and in relation to the remark above, the research community in Mexico (including foreigners) is well spread across the thirty‐two federal entities, depending on the specific research field for which a university/research centre is considered as showing excellence.
Perceived needs of the research community in Mexico
The national R&D expenditure is low. This factor entails limited funding opportunities for (foreign) researchers, insufficient infrastructure and scarcity of mobility schemes to attract talent. According to the interviewees, an important barrier in attracting foreign researchers in Mexico is also language. Information is not always available in English on websites and print publications and job announcements at public universities are usually published in Spanish (with the exception of CONACYT, UNAM and private universities that often publish vacancies in English). As for the courses at the universities, Spanish is the main language and it is rarely the case where English is foreseen. To this, the long and uncertain process of issuing a “research permit” discourage foreign researchers from applying in Mexico. Thus, the R&D sector in Mexico lacks a great number of skilled personnel.
In addition, recruitment at the HEIs is not open and merit‐based. Researchers need to have several years of professional experience and a well‐established network in local HEIs in order to have chances to be awarded a position. When it comes to the foreign research community, networking among foreign researchers is currently underdeveloped and chances to compete against nationals are very limited.
Another problem is related to the collaboration between industry and academia. To the interviewees’ opinion, there is an important lack of absorptive capacity from the business sector and a knowledge gap between academia and industry. However, CONACYT is currently aiming to encourage linkages between the two sectors and follow the trend of other Latin American countries that successfully do so over the last decade. Also, for the period 2007‐2013, there was a specific focus on supporting the SMEs and improve their competitiveness and efficiency. The Mexican government co‐financed programmes related to this focal area by 50%.
Key expectations/problems related to the mandate of EURAXESS Links
110 Idem.

Geographical expansion of the EURAXESS‐Links Network Final Report 28 February 2014
58
Since 2009, CONACYT has an office in the Mexican Mission to the EU aiming to facilitate the bi‐lateral cooperation in S&T. In return, an S&T Counsellor was supposed to staff the EU Delegation to Mexico, but this has not been the case so far.
Related to the absence of S&T Counsellor, interviewees felt that the Mexico‐EU research collaboration suffers from a certain lack of knowledge and misunderstanding of the Mexican scientific landscape on behalf of Europe. For instance, an interviewee commented that Mexico has recently shown a very good performance in science internationally but Europe tends to “ignore” it.
In addition, people were concerned about the inadequate amount of information on the new EU Framework Programme for Research and Innovation (i.e. Horizon2020) and in particular, in relation to procedural rules and regulations third countries need to respect when applying.
Therefore, interviewees were very much in favour of a EURAXESS LINK in Mexico. They considered EURAXESS LINK as a “network promoter” between Mexican and European research institutions but also among institutions at national level. According to them, researchers’ mobility is not advanced and EURAXESS LINK would focus towards this direction and encourage researchers (national and non‐national) going both ways.
An interviewee suggested to first send a science observer for 3‐4 years to familiarise himself with the R&D landscape in Mexico, set up personal and professional links, be informed about any existing measures and try to predict the increasing importance the national government will show on S&T for the future.
Finally, all people agreed on the fact that Mexico should be a standalone EURAXESS LINK due to the size of the country, the complexity of its current system and its geographical position while the role of the EU Delegation to Mexico should be strengthened.
Collaboration
Level of S&T cooperation between the EC and Mexico
The EU‐Mexico Economic Partnership, Political Coordination and Cooperation Agreement serves as the institutionalised framework of the bi‐lateral cooperation between Mexico and the EU. It came into force in 2000 and promotes high‐level political dialogue while it encourages the Mexican authorities to focus on concrete policy areas, amongst others education and culture, science and technology.
In particular, in the field of science, Mexico and the EU signed in 2004 the sectoral Agreement for Scientific and Technological Cooperation. The Agreement offers the ground for cooperation and mutual access to research programmes for both parties, including the participation of Mexico in the Framework Programmes for Research and Innovation of the European Commission.
The S&T collaboration between Mexico and the EU takes several forms, including: the organisation of informative workshops (e.g. funding mechanisms) and congresses, inviting the EC and EU MS embassies to raise awareness about available joint actions and schemes; the organisation of Info days on specific topics; the set‐up a network of National Contact Points‐NCPs (located either to research centres or universities) with the aid of SRE; Networking and institutional alliances; Implementation of R&D projects; Research exchanges; Joint‐use of research infrastructures and labs; and knowledge exchange (i.e. best practices).
In 2008, Mexico became a strategic partner for the EU, and it is not any more considered as a “developing country”. The new status certifies the importance of the partnership with Mexico for the EU. From now on, at policy‐level, the S&T bi‐lateral agenda as well as the identification of research areas of common interest will be decided by Mexico and the EU on equal terms. In practice, under Horizon 2020, Mexico will not get any more unilateral funding by the European Commission but

Geographical expansion of the EURAXESS‐Links Network Final Report 28 February 2014
59
funding will be jointly allocated111. From the side of Mexico, CONACYT will provide the funding for Mexican researchers participating in open calls.
Mexico’s participation in the EU Framework Programmes
Mexican participation in the FPs has almost triple between FP6 and FP7. During the last funding period, collaboration has increased in two ways; the establishment of a common fund, the EU‐Mexico Fund for Science and Technology Cooperation (FONCICYT)112 and second, the increasing number of projects involving Mexican partners (research institutes and individuals).
On the former, FONCICYT managed to finance 34 projects for a total budget of EUR 20 million, achieving for instance, the establishment of the NCPs and the creation of CONACYT liaison office in Brussels. On the latter, the participation of Mexican partners in FP7 was increasing.
The table below illustrates the success rates of applicants over the financing period 2007‐2012 and indicated the EC contribution in the proposals.
Table 19: Numbers of applicants in retained proposals and of requested EU financial contribution in retained proposals (in € million) as well as corresponding success rates for FP7 calls concluded in 2007 ‐ 2012 in Mexico
Applicants in retained proposals
Success rates of
applicants
2007 2008 2009 2010 2011 2012 Total 2012 2007‐2012
17 14 58 28 27 19 163 24,4% 23,9%
EC contribution to retained proposals
Success rates in
EC contribution
2007 2008 2009 2010 2011 2012 Total 2012 2007‐2012
1,8 1,0 1,7 3,0 3,5 1,3 12,3 17,9% 14,8%
Source: European Commission, Sixth FP7 Monitoring Report, MONITORING REPORT 2012, 7 August 2013
Among the third countries participating in FP7, Mexico ranked eleventh in terms of applications and ninth in terms of requested EC contribution.
Many bi‐lateral synergies between Mexico and European countries were created and resulted in the successful implementation of joint applied‐research projects, human resource development and well‐developed research networks.
EULARINET programme
In the framework of international cooperation, under FP7, Mexico participated in the EULARINET programme; the EU–Latin America Research and Innovation Networks. The project, which ended in 2012, aimed to strengthen the bi‐regional dialogue on S&T between EU Member States, Associate States and Latin American partner countries at policy, programme and institutional levels, involving industry and academia. CONACYT was the Mexican partner in the network.
111 Special focus will be given on collaboration against climate change, food security and energy production, as declared in the Joint EU‐Mexico statement in June 2012. 112 Co‐financed by the European Commission and CONACYT for the period 2007‐2011 and institutionally supported by the sectoral agreement for Scientific and Technological Cooperation between the EU and Mexico.

Geographical expansion of the EURAXESS‐Links Network Final Report 28 February 2014
60
BILAT113 project ‐ UEMEXCyT II
The BILAT project, UEMEXCyT II, aimed to support policy dialogue as well as promote and monitor the bilateral co‐operation in research and innovation between the EU and Mexico. It came to an end in 2012 and based on its evaluation, it successfully improved the channels of communication between Mexico and the EU Member States (e.g. via the establishment of a Bureau for EU‐Mexican Science and Technology Cooperation).
Enterprise Europe Network (EEN)
Since 2008, the Enterprise Europe Network Initiative114 has been established to promote innovation in business, technology transfer and facilitate access to the FP7 funding. As a result, four contact points were established in Mexico to encourage European SMEs in growing business and exporting to Mexico but also, to support local SMEs in getting information about EU legislation and funding.
Level of S&T cooperation between individual Member States and Mexico
Mexico has signed bi‐lateral S&T agreements with several EU Member States including Belgium, Bulgaria, the Czech Republic, Germany, France, Hungary, Italy, Spain, Poland and the UK115. In addition CONACYT retains a number of inter‐institutional agreements (99 in total) with research institutions in 25 EU countries.
The S&T cooperation between Mexico and the individual European countries is threefold; first and the most current type of activities is the academic collaboration between HEIs in both countries, including teacher and researcher training and networking activities. A second type of activities is the “public‐private” collaboration between the scientific and industrial communities of two countries by the realisation of bilateral technological research projects. Finally, a third type is scholarships for graduate and post‐graduate studies.
The following two tables provide an overview of all types of activities between Mexico and EU Member States.
113 Bilateral coordination for the enhancement and development of S&T partnerships. 114 It is launched under the Competitiveness and Innovation Framework Programme (CIP) of the European Commission. 115 Signature of bi‐lateral S&T agreements: France (since 1972); Germany (since 1974); Spain (since 1978); Bulgaria (since 1980); Hungary (since 1980); Poland (since 1981); the Czech Republic (since 1981); Italy (since 1984); Belgium (since 1987); the United Kingdom (since 1998).

Geographical expansion of the EURAXESS‐Links Network Final Report 28 February 2014
61
Table 20: Bi‐lateral activities by European country
Source: ACCESS2MEXCyT, provisional results
Table 21: Strategic approach of the bi‐lateral activities by European country
Source: ACCESS2MEXCyT, provisional results
The countries with which Mexico, via its Ministry of Foreign Affairs (SRE), has developed long‐lasting collaboration in S&T are, in decreasing importance, Spain, France, German and the UK.
Spain
The bi‐lateral cooperation agreement, since 1978, between Mexico, represented by CONACYT and Spain, represented by the Spanish Centre for the Development of Industrial Technology (CDTI) is implemented through a bilateral fund which finances staff exchanges, implementation of joint R&D projects and good practices’ exchange. Five agreements have been concluded by different institutions in the two countries and aim to train human resources, lead conjoined research and promote cooperation between academia and industry.

Geographical expansion of the EURAXESS‐Links Network Final Report 28 February 2014
62
France
The bi‐lateral cooperation agreement, since 1972, between Mexico, represented by CONACYT and France, represented by ANR (Agence Nationale de la Recherche) focuses on publishing call for proposals for R&D projects targeting Mexican and French researchers in strategic areas, such as energy, health, ICT, biotechnology, etc. The bi‐lateral cooperation has been very successful in the field of data processing and it is founded on increasing interest from both parties. A total of 13 agreements have been recorded between Mexican and French research institutions.
Germany
Mexico signed bi‐lateral cooperation agreement with Germany in 1974. The Public‐Private Partnership (PPP) German programmes are much promoted under this bi‐lateral cooperation. In addition, a total of four agreements, all established with the German Academic Exchange Service (DAAD), are vowed mainly to human resources training. Lately, a structured PhD scheme between Germany and Mexico is about to be launched while initiatives such as the existing “International research training group” between universities in Germany and Brazil are planned to also engage Mexican partners.
UK
The S&T agreement between Mexico and the UK in 1998 came to formalise the long‐lasting collaboration in science between the two countries. In 2012, the UK was the second most popular overseas destination for Mexican students, with a total of 1 970 students coming to the UK. In Mexico, the British Council has been very active in promoting scientific collaboration. A new Memorandum of Understanding (MoU) between the UK and Mexico was signed in 2013 to support greater academic collaboration and institutional partnerships. The two counterparts are the British Council and CONACyT. The MoU will focus on mobility for both early stage and established researchers as well as academic and enterprise collaboration in priority areas like nano‐sciences and nanotechnology for advanced manufacturing (automotive / aeronautics), biotechnology for agriculture, food industry and health. The University of Manchester is also one of the most significant partners of CONACyT in scholarships and students exchange.
Level of S&T cooperation between Mexico and non‐EU countries
The Mexican government has signed a bi‐lateral agreement in research with the US in 1972 and together with Canada are very strong partners for Mexico, also due to their geographical proximity. The close collaboration among these three countries is founded on the North‐America Free Trade Agreement which also has a significant impact on the S&T cooperation among them.
In addition, Mexico is being running specific cooperation schemes with all countries in the Caribbean zone while it has developed regional cooperation with Central and Latin America116. In 2012, the Presidents of Chile, Colombia, Mexico and Peru signed the four‐nation Pacific Alliance Agreement that particularly encourages joint research.
A number of international cooperation schemes were implemented or are ongoing among the countries of Latin America and the Caribbean but also between this region with Europe. For instance,
• CYTED programme (Latin‐American Programme of Science and Technology for Development): it involves twenty‐two countries117 and aims to facilitate the funding of thematic network mobility and training as well as co‐ordinated actions;
116 Signature of bi‐lateral S&T agreements: Brazil (since 1976); Argentina (since 1986); Colombia (since 1987); Peru (since 1989); Venezuela (since 1989); Chile (since 1991); Cuba (since 1999). 117 Argentina, Bolivia, Brazil, Chile, Colombia, Costa Rica, Cuba, Dominican Republic, Ecuador, El Salvador, Spain, Guatemala, Honduras, Mexico, Nicaragua, Panama, Paraguay, Peru, Portugal, Uruguay and Venezuela.

Geographical expansion of the EURAXESS‐Links Network Final Report 28 February 2014
63
• ENLACE project (Enhancing Scientific Cooperation between the European Union and Central America): Mexico teams up with partners from Austria, Belgium, Greece, Hungary, Italy and Spain whereas from the side of Latin America the consortium includes Costa Rica, Nicaragua, Honduras, Guatemala, together with Mexico;
• ALCUENET project (Latin America, Caribbean and European Union Network on Research and Innovation): it runs for the period 2012 to 2016 and brings together from the one hand, Austria, Spain, Finland, France, Portugal and Norway and from the other hand, Argentina, Mexico, Panama, Costa Rica, Dominican Republic, Barbados and Uruguay;
• PILAC initiative (Initiative on Innovation Policies in Latin America and the Caribbean): it exists since 2011 and promotes dialogue and best‐practice exchange on innovation and technology‐oriented research between Mexico and Latin American countries.
In Asia118, Mexico mostly cooperates with Japan (which is viewed by the Mexican authorities as a very strong partner in science) in the fields of knowledge sharing and academic exchange, while the collaboration with China, India and South Korea is underdeveloped.
Japan is a very important partner for Mexico and this is certified by the increasing degree of joint actions between the two countries. Since June 2011, the academic authorities of Japan and Mexico (23 Japanese universities and 14 Mexican HEIs) agreed on increasing the bilateral scientific cooperation in knowledge areas such as biotechnology, nanotechnology, climate change, earth sciences, humanities and technological innovation and on establishing a scientific and academic community to promote knowledge sharing and academic exchanges.
Policy strategies
EU policy strategies
The EU has adopted a more regional approach when promoting international cooperation with Latin American countries, including Mexico, and to this end, instruments such as the EU‐CELAC Action Plan 2013‐2015119 or the EU/LAC Joint Initiative for Research and Innovation (JIRI) Committee are in place. The latter aims to identify areas of common interests, enhance political dialogue (including technical aspects) and raise the question of funding activities in Latin America and the Caribbean.
Nevertheless, Mexico is very much considered as an individual player and strategic partner in the region, according to the interviewees. People asked shared the view that the two parties have been cooperating for years on several topics of global interest (such as climate change and global economic governance, justice and security, Human Rights, social cohesion, etc.) and the epitome of this long‐lasting relationship has been the political decision Mexico, as of 2014, to be considered as “equal partner” to the EU.
The areas of common interests and strategic collaboration between Mexico and the EU are the following: health (with a particular focus on rare diseases), energy (especially geothermal), ICT (due
118 Signature of bi‐lateral S&T agreements: Russia (since 1981); Korea (since 1994); China (since 1996); Japan (since 1997); India (since 2000); Vietnam (since 2001). 119 The Plan defines eight strategic areas for joint activities:
1. Science, Research, Innovation and technology (e.g. development of EU‐LAC Knowledge area); 2. sustainable development, environment, climate change, biodiversity, energy; 3. regional integration and interconnectivity to promote social inclusion and cohesion; 4. migration (e.g. Structured and Comprehensive Dialogue on Migration); 5. education and employment to promote social inclusion and cohesion; 6. drugs; 7. gender (e.g. actions for women empowerment); and 8. investments and entrepreneurship for sustainable development.

Geographical expansion of the EURAXESS‐Links Network Final Report 28 February 2014
64
to large networks set up in the country by Google and Microsoft), biodiversity, astronomy and societal challenges (Mexican authorities very much welcome the European cohesion policy).
The main challenges of this relationship in the future is first, to invest in new research areas, such as food security and intellectual property rights protection; second, to promote the coordination between public and private sectors (since Mexico lacks a real spill‐over), and third, to create innovation and learning networks, with a special focus on the commercialisation of the research outcomes.
Member State policy strategies (identified privileged partnerships/relationships)
Mexico & Spain
Mexico has inherited its scientific culture from Spain. The two countries collaborate in research and development since many years and their cultural, linguistic and education resemblances enhance and facilitate this relationship. The scientific collaboration with Mexico is of great importance for Spain and is based on extensive economic activities linking the two countries. According to the interviewees, Mexico is the second most common destination for Spanish researchers in Latin America, after Argentina. The cooperation is manifold ranged from joint research projects and training workshops to research grants for PhD students, agreements for equipment exchange and mobility schemes targeting researchers at all career stages. The majority of the initiatives are funded by CONACyT and the Centre for the Development of Industrial Technology (CDTI) in Spain whereas UNAM has created strong links with many Spanish universities. On top of the cooperation instruments in place, Spain teams up with Mexico in the framework of various international cooperation schemes, such as the CYTED programme, by engaging political dialogue and synergies with other neighbouring countries in Latin and Central America. In terms of focus areas of the collaboration, these are currently energy research, transport and health. In the future, the collaboration aims to strengthen the establishment of networks of researchers and further encourage training programmes and mobility between the two countries.
Mexico & Germany
Germany is present in all Latin America via the active involvement of the German Research Foundation (DFG), the Fraunhofer Institution, the Alexander von Humboldt Foundation (AvH) and the German Academic Exchange Service (DAAAD). The latter has an Office in Mexico and funds large numbers of exchange students and researchers. The German authorities were planning to expand their network to Latin American countries, including Mexico, for about 10 years. They basically wanted to well define research topics of interest for the German research community without touching upon political interests. Based on interviewees’ perceptions, a hundred of German researchers visit Mexico on an annual basis for short‐term visits (up to three months). They are mainly post‐doctoral researchers travelling to Mexico under a research grant or are invited by national research centres. From the German point of view, Mexico is very strong in academic and basic research. However, it lacks in technological infrastructure, advanced equipment and spill‐over facilities between HEIs and the business sector. Germany, therefore, is being interested in filling this current gap by providing Mexico with the technological know‐how and enjoying, in return, the outcomes of fundamental research carried out in Mexico. The research areas the two countries have developed a prominent collaboration are neuroscience, chemistry, geonomics, geology as well as social science. For both Germany and Mexico, investing in technology‐oriented research is the priority for the next years.
Geographical expansion of the EURAXESS‐Links Network Final Report 28 February 2014
65
New Zealand Introduction
Background information
• Population: 4,433,100 (in 2012)120
• GDP (in EUR)
o Absolute value (at PPP): 123,380,807,725 (in 2012)121
o Per capita (at PPP): 22,140 (in 2011)122
• Expenditure on R&D (% GDP): 1.30 (in 2009)123
• Brief description of the country relation with the EU: With a population of 4.3 million, New Zealand used to be one of the wealthiest nations However, the global economic crisis had direct effects on the country’s economic performance. The national investments in R&D modest, and it is only recently that the country is considered as “entering the global research map”, by receiving publicity and becoming an attractive destination for the foreign research community. International S&T cooperation is very important for New Zealand since it lacks in research personnel and the commercialisation of research outcomes is underdeveloped.
The R&D landscape in New Zealand
Background information on S&T policies
During the last decade, New Zealand has been altering its economic model into market oriented, driven by the concepts of knowledge society and knowledge based economy. The national R&D system has become the driving force in achieving the desired growth, following the years of the economic crisis. To this end, the government has adopted a number of significant changes at policy level including, the creation of the new Ministry of Business, Innovation and Employment (MBIE), the intensive reforms of the structure and mandate of the Crown research institutes, the appointment of the Prime Minister’s Chief Science Advisor, the establishment of the Callaghan Innovation.
For the current government, the key to economic recovery is innovation and new schemes have been put in place to leverage industry funding and therefore, boost industry and R&D links. For instance, a total of EUR 98 million is allocated to firms as grants to support R&D technology development. Also, another EUR 10 million is dedicated to support technology transfer from research organisations to the private sector and thus, promote the commercialisation of new products and processes.
The key stepping stones and national agenda on research and development are presented in the following main documents:
120 The World Bank Data (http://data.worldbank.org/indicator/SP.POP.TOTL) 121 The World Bank Data (http://data.worldbank.org/indicator/NY.GDP.MKTP.CD): 167,347,054,534 US dollars (2012) 122 The World Bank Data (http://data.worldbank.org/indicator/NY.GNP.PCAP.PP.CD/countries): 30,030 US dollars (2012) 123 The World Bank Data (http://data.worldbank.org/indicator/GB.XPD.RSDV.GD.ZS/countries)

Geographical expansion of the EURAXESS‐Links Network Final Report 28 February 2014
66
• System wide funding policy issues (2011): a policy document analysing and reflecting on the current funding policy issues.
• Igniting Potential New Zealand’s Science and Innovation Pathway (2010): a discussion document presenting the new science priorities of the national R&D system and putting emphasis on business research.
• New Zealand Research Agenda (2007): a discussion paper which identifies and recommends new priorities for future research, science and technology investments and activities, by 2020.
• Growing an Innovative New Zealand (2002): a government strategy paper presenting a set of key indicators to measure New Zealand’s innovation and entrepreneurship performance as well as discuss on the necessary improvements in the national R&D system.
In addition, in 2009, the government set out six new science priorities, related to the commercialisation of research outcomes, the improvement of infrastructure, the increasing investments in R&D and in specific focus areas New Zealand is eminent at, such as high‐value manufacturing and services, biological industries, energy and minerals, hazards and infrastructure, environment as well as health and society.
Traditionally, New Zealand focused on basic research performed at the HEIs while applied research is gradually becoming the new trend.
New Zealand has been traditionally investing very little in R&D. It is a small country and its investments are generally dedicated only to a few sectors, i.e. agriculture, marine science, environment, societal challenges124. Its R&D expenditure as a percentage of the GDP has slightly increased from 1.12 in 2001 to 1.30125 in 2011, compared to 1.76 and 1.94 respectively for the EU‐28. In 2010, the total expenditure on R&D in New Zealand was of approximately EUR 1.3 billion.
The government126 is the most important R&D funder with EUR 607 million, followed by the business enterprise with a total of EUR 551 million in the same year127. The contribution to the R&D expenditure on behalf of the industry has been quite low over the years due to the absence of the industry sector itself in the country; in 2011, it counted for 0.59 as a percentage of the GDP (compared to 0.41 in 2001)128. For this reason, the government aims to double business sector’s R&D expenditure to a level of more than 1% of the GDP in the next years.
Regarding the R&D performers in the country, the higher education sector is the major research performer carrying out 33% of the total research activities, amounting to EUR 436 million. In 2008, the government funding of R&D in higher education, by type of funding, amounted to 92.9 for
124 The government has identified around 10 National Science Challenges for which a total of $60 million over a period of four years were set aside so as to coordinate investments in these crucial challenges for New Zealand’s future. These are aging well; a better start; healthier lives; high value nutrition; Nez Zealand’s biological heritage; our land and water; life in a changing ocean; the deep South; science for technological innovation; and resilience to Nature’s challenges. Government’s plan on how to deal with the identified challenges includes multidisciplinary research programmes and increased collaboration, interaction between researchers and end‐users as well as a long‐term vision and a multiannual funding. 125 OECD Science, Technology and Industry Scoreboard 2011. 126 And in particular, the Ministry of Business, Innovation and Employment (MBIE), the Health Research Council (HRC) of New Zealand and the Royal Society of New Zealand (RSNZ). 127 In the same year, the private non‐profit sector contributed EUR 30 million whereas the overseas funding arrived at EUR 71 million. 128 Idem.

Geographical expansion of the EURAXESS‐Links Network Final Report 28 February 2014
67
institution‐based funding and only to 7.1 for project‐based funding, as a percentage of the national funding of domestic R&D129.
As for other R&D performers, the Crown Institutes (see below) and the Ministries receive an annual funding based on a series of packages called “Votes”. Each Vote represents a total number of output expenses the funding of which is specified in the annual national budget.
The following figure provides an overview of the R&D funders and performers in New Zealand.
Figure 5: R&D funders and performers in New Zealand
Source: Erawacth
When it comes to the national R&D responsible bodies, since 2012, the Ministry of Business, Innovation and Employment (MBIE) is the responsible body for the national research policy. The MBIE was the result of a large merge of the Ministry of Science and Innovation and the Ministry of Economic Development as well as of the Department of Labour and the Department of Building and Housing. The new Ministry has inherited a dual role; to lead policy‐making towards economic growth and innovation as well as to facilitate the collaboration among the existing research agencies as well as between the government and the business sector. The MBIE closely cooperates with the Royal Society of New Zealand (RSNZ) 130 which is an independent national academy of sciences representing some 60 scientific and technological societies and individual members.
In 2012, a new governmental agency for industrial research was created under the name Callaghan Innovation. It is responsible for funding and creating technology platforms and synergies with Europe. The Callaghan Innovation serves as one‐stop shop for high‐tech firms to become better connected and competitive in and out New Zealand. It mainly targets companies in the sectors of food and beverage manufacturing, agro‐technologies, digital technologies, health technologies, therapeutics, and high‐value wood products.
In addition, in New Zealand, there are eight Universities131, two institutes of technology132, seven centres of research excellence, eight commercially‐orientated (government) research institutes ‐ the
129 OECD Science, Technology and Industry Scoreboard 2011. 130 http://www.royalsociety.org.nz/publications/reports/evaluation/ 131 Auckland University of Technology; Lincoln University; Massey University; University of Auckland; University of Canterbury; University of Waikato; University of Otago; and Victoria University of Wellington.

Geographical expansion of the EURAXESS‐Links Network Final Report 28 February 2014
68
Crown Research Institutes (CRIs) ‐ and a few private organisations dedicated to knowledge transfer. All abovementioned key actors have adopted since recently a new mandate to invest largely in innovation and become more research results’ commercialisation‐oriented.
The Crown Research Institutes (CRIs) are crown entities or state owned enterprises charged with conducting research on behalf of the Crown (and of the government). The CRIs are a distinguished player of New Zealand’s national research and innovation system, and important research performers, as mentioned before.
New Zealand’s strengths in research lie in biology, agriculture, horticulture, environmental science, earth science, materials science, health research, ICT and indigenous knowledge. The country is also very competitive and shows excellence in oceanic science, water resources and geology. For instance, in 2010, the largest share of the government funding went to biological sciences (35%), followed by high value manufacturing and services (22%), health and society (18%), environment (16%) while energy and minerals as well as hazards and infrastructure received 5% each.
Immigration policies
In New Zealand, the recruitment procedures at the universities and the Crown Institutes are designed in a way so non‐national researchers can easily access and equally compete for permanent research and academic positions. Non‐nationals may be granted work permits and even residency permits prior to their arrival.
The current immigration policies are simple and the national authorities are very supportive throughout the process, according to the interviewees. This is due to two reasons; first, New Zealand CRIs and universities are very much in favour of welcoming skilled staff from abroad to be deployed in national public or private research organisations. Second, New Zealand CRIs and universities intend to become international “best performers” in terms of recruiting and competition procedures.
Moreover, the whole process is even more user‐friendly for foreign graduates since the universities and CRIs usually offer an “extensive relocation support” in terms of assistance with visa applications and contribution for relocation costs. Also, the process of recognition of their qualifications/degrees is usually rapid. This is the case for graduates of many European institutions.
Policies related to mobility and international attractiveness
Inward mobility and favourable research and study leave arrangements are promoted by the national institutions to a great extent. Non‐nationals may also be entitled to research mobility schemes. In July 2010, the International Relationships Fund (IRF) of the MBIE was established to support activities, including researchers’ mobility and joint research funding.
New Zealand is very much engaged in attracting qualified researchers and retaining talent, according to the interviewees, since it is a small, remote country and very dependent on foreign personnel. The importance of incoming researchers is also emphasised in the national R&D strategy and is supported by the Ministry through a sub‐programme of the International Relationship Fund (IRF). In the framework of this scheme, travel related costs and not direct research costs (e.g. conference, seminar or workshop attendance) are covered for all applicants. This measure not only does it include travelling to European countries but also to Australia, China, India, Japan, Korea, and the USA.
With the European countries in particular, inward mobility is primarily founded on bilateral initiatives between New Zealand and individual countries. For instance, Julius von Haast Fellowship Award allows internationally recognised German researchers to spend time working collaboratively with their colleagues in New Zealand. It is open to all fields of research and is awarded for three years. The
132 Waikato Institute of Technology and Unitec Institute of Technology.

Geographical expansion of the EURAXESS‐Links Network Final Report 28 February 2014
69
most recent fellows came from Fraunhofer Institute and the Max Planck Institute of Biophysics. Both were hosted by the University of Auckland.
Likewise, outbound mobility schemes are typically incorporated into the bilateral arrangements and relationships between New Zealand and individual EU countries. The majority of New Zealand researchers going abroad, primarily go to Anglo‐Saxon countries (US, Canada and the UK), according to the interviewees. This is justified by the existing linguistic and cultural connections as well as similarities in the research systems of the countries. Based on interviewees’ perceptions, around 40% of New Zealand researchers have an overseas working experience and then, return to New Zealand having with them their international networks.
New Zealand also encourages exchange programmes with European countries. The two major exchange schemes, managed by the Royal Society NZ, have been:
• The European Cooperation in Science and Technology (COST): it offered travel grants for New Zealand researchers travelling to Europe, and European researchers travelling to New Zealand, participating in trans‐national networking. It fosters the establishment of scientific excellence in nine key domains via a range of networking tools such as workshops, conferences, training schools, short‐tern scientific missions and publications.
Figure 6: European Cooperation in Science and Technology (COST) and New Zealand
Source: RSNZ
• The New Zealand‐EU Marie‐Curie International Research Staff Exchange Scheme (IRSES): it provided funding for staff exchanges, for a period of 24‐48 months, between New Zealand and European research institutions. Under this scheme, New Zealand contributed financially (around EUR 30 million). In 2013, a total of 186 applications were submitted.
Figure 7: NZ‐EU International Research Staff Exchange Scheme (IRSES)

Geographical expansion of the EURAXESS‐Links Network Final Report 28 February 2014
70
Source: RSNZ
Additional exchange programmes at bilateral level are:
1. Dumont d’Urville award: it aimed to promote and support scientific and technological cooperation between New Zealand and French researchers in the public, non‐governmental and private sectors in the fields of food, agriculture and fisheries bio‐technology, energy efficiency, biodiversity and nano‐sciences. In 2011, 6 awards
were given.
2. The International Mobility Fund for Germany: it provides funding for New Zealand and German researchers to travel between the two countries in order to work on joint research projects in the areas of health, food, agriculture, bio‐sciences, environment, marine and polar science and sustainable energy. Nearly 60 awards have been given since 2009, covering fundamental and applied research.
3. The International Mobility Fund for Spain: it provides funding for New Zealand and Spanish researchers to travel between the two countries in order to work on joint researcher projects.
Welcome Offices and Services like EURAXESS
The majority of New Zealand Universities have international bureaus to provide information to foreigners, such as the International Office of the University of Auckland targeting international students or the Victoria University of Wellington which its dedicated International Students webpage.
For local people interested in going abroad, it is mainly through the FRIENZ programme (see below) that they seek for and are offered relevant information when relocating.
Research Community
The size and characteristics of the research community in New Zealand
In New Zealand, in 2009, the total number of researchers (in FTE) was 16 600, compared to 14 600 in 2007. Since 2003, the number of researchers has been steadily increasing by additional 2 000 researchers every two years.
Table 22: Full‐time equivalent on R&D activities, per sector of employment, 2001‐2009.
Source: OECD.StatExtracts
2001 2002 2003 2004 2005 2006 2007 2008 2009
14963,5 .. 18205 .. 18929 .. 21000 .. 23800Researchers 10328,5 .. 12363 .. 12986 .. 14600 .. 16600Technicians 2784 .. 3285 .. 3200 .. 3750 .. 3900Other support staff 1851 .. 2556 .. 2800 .. 2580 .. 3200
Year
Sector of employment Occupation
Total intramural Total R&D personnel
Total R&D personnel

Geographical expansion of the EURAXESS‐Links Network Final Report 28 February 2014
71
Based on the most recent data available133, in 2011, in New Zealand there were 7.36 researchers per thousand employed (in FTE), compared to 12.4 in 2009. This decline is mainly due to the fact that in New Zealand, part‐time occupation is greatly promoted in the research profession.
In terms of researchers’ place of work, in 2011, HEIs employed the largest share of researchers amounting to 57.1 followed by 31.3 in the Business Enterprise, 11.7 in the Government sector, whereas 0.0 was recorded in the private non‐profit, as a percentage of the national total134.
The following table shows the allocation of Business Enterprise R&D personnel (in FTE) by industry. The majority of “business” researchers work in the services sector (4 100) followed by those working in manufacturing (3 900).
Table 23: Full‐time equivalent of Business Enterprise R‐D personnel by industry, 2007‐2009
Year 2007 2008 2009
Industry
TOTAL BERD 8100 .. 8300
AGRICULTURE, HUNTING AND FORESTRY 520 .. 340
MINING AND QUARRYING .. .. ..
MANUFACTURING 3700 .. 3900
ELECTRICITY, GAS and WATER SUPPLY .. .. ..
CONSTRUCTION .. .. ..
SERVICES SECTOR 3800 .. 4100
Source: OECD.StatExtracts
When it comes to the number of doctoral graduates in New Zealand, in 2009, the graduation rates was 1.4, as a percentage of the population (compared to 0.8 in 2000)135. In 2011, the percentage arrived at 1.9. In the same year, the doctoral graduates per field of education were as follows136:
Table 24: Doctoral graduates per field, 2011
Sciences Engineering, manufacturing and construction
Health and welfare
Humanities, arts and education
Social sciences, business and law
Services and agriculture
27.8 11.4 14.9 17.8 23.2 4.9
Source: OECD, 2013
As already mentioned, New Zealand government is targeting to attract skilled research personnel from abroad due to the lack of domestic human resources. Its domestic population is becoming more and more qualified only in the last decade. In 2012, there were 180 000 New Zealand students
133 OECD Science, Technology and Industry Scoreboard 2013. 134 http://www.oecd‐ilibrary.org/science‐and‐technology/oecd‐science‐technology‐and‐industry‐scoreboard‐2013_sti_scoreboard‐2013‐en 135 OECD Science, Technology and Industry Scoreboard 2011. 136 Idem.

Geographical expansion of the EURAXESS‐Links Network Final Report 28 February 2014
72
enrolled in tertiary education, a number increased by 0.9% compared to 2011. The percentage of graduates with a tertiary qualification rose within a decade from 47% in 2002 to 52% in 2012.The number of students completing bachelor degrees increased between 2011 and 2012 whereas fewer students completed master’s degrees, in a total 3 370 (2.9% less than in 2011) and doctoral studies, in a total 636 (8.9% down from 2011 levels). However, it should be noticed that, a considerable proportion of international students at bachelor’s or higher degrees has been estimated in 2012 counting for 13.5% of all students (3.4% higher than in 2011). Likewise, the enrolment of international students at master’s and doctoral level studies increased at a rate of 15% and 6.9% respectively between 2011 and 2012.
The community of foreign researchers in New Zealand
Similar to other countries in the scope of this study, there is no official record of the number of foreign (EU and non‐EU) researchers studying and/or working in New Zealand. Evidence from the interviews showed that there is a strong presence of South East Asia and US researchers in the country whereas on the European side, French, German and British nationals predominate. Australian researchers in New Zealand are not many.
It is mostly PhD and post‐doctorate students that chose New Zealand to conduct their research/studies realising both short‐ and long‐term stays. Almost one third ends up with a permanent position, most likely at a university. Lately, there has been the trend for mid‐career researchers, especially from Europe, travelling to New Zealand.
According to the interviewees, researchers (including foreign researchers) are mainly gathered in Wellington and Auckland due to the international reputation of both universities located in the area but also due to the easiness of travelling to neighbouring countries, basically Australia and the Pacific islands.
Perceived needs of the research community in New Zealand
New Zealand is a small country with a small number of researchers and an economy that has suffered the effects of the global economic crisis. Funding for research is very limited and that is why it is dedicated to few research areas. Technical expertise and infrastructure are underexploited and knowledge transfer from other countries is deemed necessary by the interviewees.
Also, in New Zealand, as stated before, there are no barriers to non‐national researchers to apply for national funding and/or for a job vacancy. New Zealand is a very attractive destination to live but also conduct research for foreign researchers. It is a multi‐linguistic environment, it encourages the international labour market for researchers and promotes open and merit‐based recruitment. Nevertheless, the absence of funding schemes, the low salary standards, the premature stage of large research infrastructure as well as the geographical distance of the country (which also entails difficulties in sustaining links with institutions worldwide) discourage foreign researchers from travelling to New Zealand or eventually selecting New Zealand over Australia (based on the cultural, linguistic and physical proximity of the two countries).
Interviewees shared the need to both increase the R&D funding and develop incentives to attract researchers into the national R&D system. Besides, based on predictions performed by the national authorities, the universities in New Zealand by 2020 will need to attract between 500 and 900 new academic staff each year. This is due to the higher pace of ageing academic staff compared to the inflow of younger academics.
Based on track records, and compared to other third countries, there has been a limited number of applications from New Zealand candidates in the Framework Programmes and ERC grants. This is due to several reasons, including the difficulty in understanding the processes and European rules by the local people, the non‐availability of information in a centralized format or the limited involvement of European representatives in New Zealand to promote such participation.

Geographical expansion of the EURAXESS‐Links Network Final Report 28 February 2014
73
Key expectations/problems related to the mandate of EURAXESS Links
All interviewees were positive for a potential EURAXESS LINK in New Zealand. People interviewed shared the need for a liaison person or in other words, an “institutionalised body”, to push information to the right direction. Besides, the lack of an S&T Counsellor at the EU Delegation to New Zealand (opposite to the existing one in the Mission of New Zealand to the EU since four years now) is perceived by the interviewees as a missing opportunity for Europe.
New Zealand is a small country, with a relatively small number of research institutes and a research community adequately interconnected. Therefore, according to the interviewees, one person acting as EURAXESS LINK could be easily connect with the research community as well as the national stakeholders.
According to the interviewees, EURAXESS LINK would be a useful instrument aiming to channel to Europe and make practical information available to all interested parties. It is considered to be a good idea to also increase coherence with individual European countries.
As for the possibility of having one EURAXESS LINK responsible for both Australia and New Zealand, people interviewed were not positively predisposed. They were of the opinion that the research environment in the two countries is not identical and the focus on science differs; a fact which is often misjudged by Europe. Also, the distances are not to be neglected and this factor has to be taken into serious consideration.
An interviewee expressed the opinion of setting up a EURAXESS LINK in New Zealand that would be also responsible for the Pacific islands (Fiji, New Caledonia). The Pacific islands seem to be a less important partner for Europe whereas they have advanced and improved their performance in science.
Collaboration
Level of S&T cooperation between the EC and New Zealand
New Zealand and the EU share a long history in Science and Technology. Historically, the EU started building its cooperation with the New Zealand via its already well‐established partnership with Australia. The direct research collaboration between New Zealand and the EU was initially formalized under a non‐binding Arrangement for Cooperation in Science and Technology in 1991 which offered a platform for cooperation in several research areas such as agriculture, renewable energies and ICT. The bi‐lateral Agreement on Scientific and Technological Cooperation between New Zealand and the EU was signed in 2008 (and entered into force in 2009) and it serves as a legal basis for the S&T cooperation in both parties. It encourages formal discussions and interactivity in identified thematic areas of common interest.
The S&T cooperation New Zealand and the EU is also founded on two Joint Declarations; the Joint Declaration on Relations between the European Union and New Zealand in 1999 and the Joint Declaration on Relations and Cooperation between the EU and New Zealand adopted in 2007 address several issues relevant to S&T including environment and climate change, sustainable development and fisheries.
New Zealand’s participation in the EU Framework Programmes
The participation of New Zealand in FP5 and FP6 was estimated at relatively low levels mainly due to the lack of knowledge and/or understanding of opportunities. It was also because of the fact that New Zealand, as many other countries, was not eligible to automatic funding and its domestic financial sources were very limited. The picture has improved though under FP7 where New Zealand ranked 19th, among the third countries, in terms of number of applicants (313 eligible proposals

Geographical expansion of the EURAXESS‐Links Network Final Report 28 February 2014
74
submitted), 28th in terms of number of participations and 34th in terms of requested EC contribution (EUR 22.34 million).
The table below illustrates the success rates of applicants over the financing period 2007‐2012 and indicated the EC contribution in the proposals.
Table 25: Numbers of applicants in retained proposals and of requested EU financial contribution in retained proposals (in € million) as well as corresponding success rates for FP7 calls concluded in 2007 ‐ 2012 in New Zealand
Applicants in retained proposals
Success rates of
applicants
2007 2008 2009 2010 2011 2012 Total 2012 2007‐2012
11 21 24 17 17 25 115 52,1% 39,1%
EC contribution to retained proposals
Success rates in
EC contribution
2007 2008 2009 2010 2011 2012 Total 2012 2007‐2012
1,1 0,1 1,0 0,3 1,0 0,4 3,9 9,9% 19,2%
Source: European Commission, Sixth FP7 Monitoring Report, MONITORING REPORT 2012, 7 August 2013
New Zealand’s success rate of applicants was higher than the Third countries applicant success rate of 23.2% and was the second best following Japan (30%). Likewise, its EC financial contribution success rate was recorded higher than the Third countries rate of 17.5%.
A total of 34 signed grant agreements involving 40 participants from New Zealand benefited from a total of EUR 131.74 million of EC financial contribution of which EUR 3.60 million (2.73%) was dedicated to participants from New Zealand. The figure bellow presents the number of projects per priority areas.
Figure 8: Grant holders per priority area, FP7
Geographical expansion of the EURAXESS‐Links Network Final Report 28 February 2014
75
Source: RSNZ
The top 5 collaborative partners for New Zealand were the UK, Germany, the Netherlands, France and Italy, in descending order.
European Research Council (ERC) Principal Investigators
There were five New Zealand ERC Principal Investigators137, in a percentage of 2.23% of the total 224 Principal Investigators for Third Countries, benefited from EUR 8.96 million (2.54% of the total EUR 353.26 million for all Third Countries).
Marie Curie Fellowships
New Zealand was awarded a total of 24 Marie Curie fellows in a percentage of 2.01% of the total 1 194 Marie Curie Fellows for Third Countries, benefited from EUR 4.09 million (1.96% of the total 208.21 million dedicated to Third Countries).
BILAT programmes
The bilateral programme FRENZ (Facilitating Research Co‐operation between Europe and New Zealand) was a three‐year programme (2010‐2012)138 between the MBIE and the European Commission with several research organisations and European partners supporting it. It aimed to stimulate New Zealand scientists to become aware of European opportunities and in particular, to promote the effective participation in FP7 (following a smooth transition from FP6 application procedures). It overall provided information, guidance and support to the participating of the New Zealand research community in FP7 by developing:
• an integrated ‘one stop shop’ web portal;
• a central ‘Helpdesk’ facility, underpinned by activities on‐site in key research organisations across New Zealand; and
• a unique database of approximately 900 New Zealand‐based European researchers.
The programme encouraged mobility between European and New Zealand researchers (i.e. study tours in both directions for scientists and science managers in the area of food, environment, etc.) and also, created collaborative links between the two parties (i.e. workshops and linkages, training for the participation under Horizon2020, info days, etc.).
Its successor, FRIENZ (Facilitating Research and Innovation Cooperation between Europe and New Zealand”), currently under way, aims to develop strategic research, science and innovation partnerships between Europe and New Zealand as well as support the institutional dialogue under the bilateral S&T agreement and strengthen the cooperation and linkages between research and innovation actors.
Level of S&T cooperation between individual Member States and New Zealand
New Zealand has very strong links with individual EU Member States. Bilateral collaboration is long‐lasting and well advanced with France, Germany and the UK. In the case of France and Germany, a bi‐lateral S&T agreement is in place for more than 30 years.
Close collaboration in science also exists between New Zealand and Italy as well as New Zealand and the Netherlands, primarily focusing on research mobility. Moreover, New Zealand together with Finland, Denmark and Ireland have created a science forum engaging small countries to strategy‐making and common acting in the S&T field. 137 Principal Investigator is the lead scientist or engineer for a particularly well-defined science (or other research) project, such as a laboratory study or clinical trial. The Principal Investigator is an individual who assembles a team to carry out an ERC-funded project under his/her scientific guidance. 138A pilot initiative was established in 2006 as part of a DG External Relations’ project.

Geographical expansion of the EURAXESS‐Links Network Final Report 28 February 2014
76
Germany
The Science & Technology Cooperation Agreement between New Zealand and Germany was signed back in 1977 in an effort to “facilitate and encourage scientific and technological cooperation for peaceful purposes between civilian agencies and organisations in the public and private sectors of each country”. Based on its review in 2006, the collaboration was evaluated as very successful and several areas for future actions were identified, such as commercialization of research outcomes, better use of the EU Framework Programmes and better coordination of funding (for instance through simultaneous applications to New Zealand and German based funding bodies). The two parties also agreed on enhancing exchanges and reciprocal staff secondments as well as intensifying the organization of research workshops in prioritised areas.
Moreover, the S&T cooperation between the two countries is established under the signature of a number of Memoranda of Understanding (MoU) between the Ministry in New Zealand and Germany's leading universities as well as with the Alexander von Humboldt Foundation, the world‐leading international researcher exchange and development organisation. These memoranda are often supported by funding programmes.
Finally, the presence of an S&T Counsellor in the German Embassy has been extremely important in fostering this bilateral cooperation, according to the interviewees.
France
The New Zealand‐France Cultural Agreement was signed in 1977 and it was the legal basis to facilitate and encourage scientific cooperation and exchanges between the two counties. The key areas of research collaboration at that time were marine research, geosciences and biological productivity. In 2005, a second agreement was signed between the two countries in order to include additional areas of common interest, such as biotechnology, nano‐sciences and renewable energy.
In the framework of the current agreement, both parties allocate yearly around EUR 90 000 to a multi‐annual travel grant scheme, the Dumont d’Urville Programme, which is managed by the Royal Society and the Égide agency in New Zealand and France respectively.
There are also many ad hoc agreements between the French NCRS (Centre national de la recherche scientifique) and New Zealand research institutes.
UK
Traditionally, the UK has been New Zealand’s key research partner. However, no formal bilateral S&T agreement by the two governments was signed for years. The two countries used to cooperate under the framework of the S&T Agreement between New Zealand and the EU while they closely collaborate under the EU Framework Programmes. The two countries signed an S&T agreement only in 2011. In addition, there are more than 150 MoU signed between New Zealand Tertiary Education institutions and their British counterparts.
At government‐level, in the New Zealand Ministry there is a desk‐officer responsible for New Zealand UK linkages and a UK Science promoter is based in and funded by the British High Commission in Wellington. At technical‐level, official visits by both New Zealand and UK officials and experts to the other country are very regular.
For the moment, a common fund to further promote the S&T collaboration is not in place.
Level of S&T cooperation between New Zealand and non‐EU countries
The MBIE has identified a number of priority partners in developing its international strategy for science and technology. It collaborates closely with the US, especially in the domains of geothermal

Geographical expansion of the EURAXESS‐Links Network Final Report 28 February 2014
77
energy and marine research as well as with Australia139, in the areas of biotechnology, forest research and horticulture research. With the latter, there is no a formal S&T agreement in force based on the excellent diplomatic relations and the long‐lasting collaboration in various policy sectors.
New Zealand collaborate to a great extent with US and Australia (and the UK) in the field of scientific co‐publications. Other countries were Canada, Japan, South East Asia and China (whereas from Europe, were Germany, France, Netherlands, Italy and Sweden)140.
In Asia, New Zealand is investing a lot in its collaboration with China and Japan whereas it collaborates to a certain extent with South Korea and Malaysia. The most common types of activities include officials’ visits, joint workshops and funding schemes for scientists’ exchange. It is also member of the Asia Pacific Economic Cooperation (APEC) which gathers 21 countries. New Zealand is very much interested in the Working Group on Industrial Science and Technology dealing with global issues, such as climate change and sustainable development as well as in the Life Science Innovation Forum and the AgBiotech Policy Dialogue.
China, in particular, is considered as a key scientific partner for New Zealand. A formal S&T agreement between the two countries was signed in 1987 and renewed in 2003. The two parties closely collaborate in the areas of forestry, agriculture, geology, seismology, volcanology, Antarctic research, meteorology, horticulture and environmental protection. In addition, New Zealand government intends to improve access of its national researchers to research infrastructure in China and also to enhance research linkages between the two countries.
New Zealand embassies in Brussels, Washington and Beijing are the only ones worldwide with a New Zealand S&T Counsellor.
Likewise, Japan is viewed as very important partner in the areas of biological sciences, functional food, biotechnology and nanotechnology. New Zealand counts a lot on this collaboration for knowledge transfer and support in research facilities. The two countries signed a MoU for bilateral cooperation in 2005 so as to provide funding for scientists and post‐doctoral fellows. In 2009, the two parties agreed on a new funding scheme to support joint research projects in the fields of biosciences and biotechnology. The signature of an S&T agreement between the two countries is currently under negotiation.
In addition, Israel and Singapore, being small and advanced economies, are considered by the national authorities as important partners for dialogue and policy‐making. In 2011, New Zealand and India signed a protocol for Cooperation on Science and Innovation.
Policy strategies
EU policy strategies
New Zealand and the EU have been partners for several years and shared common interests in several research areas. The level of understanding between New Zealand and the EU is at satisfactory levels, according to the interviewees, and targeted initiatives at political level to assist cooperation have been implemented. For instance, the Joint Science and Technology Cooperation Committee (JSTCC) serves as a platform for discussion and for designing a roadmap for collaboration based on
139 A Closer Economic Partnership (CEP) between New Zealand and Australia was signed in 1983. A CEP also exists with Singapore (2001) as well as with Thailand, China, ASEAN, Malaysia and Hong Kong since 2005. 140 Between 2002 and 2007, New Zealand ranked by the OECD eleventh in research publications. A total 44% of New Zealand scientific publications involved multiple countries. In 2007, New Zealand researchers collaborated with authors from 125 countries.

Geographical expansion of the EURAXESS‐Links Network Final Report 28 February 2014
78
clear guidance and mutual understanding. JSTCC meetings offers the basis for identifying areas of common interests and opportunities under Horizon2020.
The bilateral relations are equally important for both parties (based on the S&T agreement review in 2013). From the one hand, New Zealand is considered as an important partner for Europe. It has an expertise in "niche” areas, shows excellence and delivers world class research results in the fields of bioengineering/biomathematics in medicine, land use data, resilient structures, and optimisation in industry. New Zealand enjoys a “unique geographical position”, close to Pacific Islands as well as China and South East Asia, with which has developed a large trade policy, but also close to Antarctica. It also offers “one of the most business friendly environments in the world”. From the other hand, the EU is one of the three key partners for New Zealand worldwide. The EU is excellent in quality results, has a large pool of researchers willing to travel abroad, offers very competent training and larger scientific infrastructures whereas scientific information, benchmarking and knowledge transfer are open and easily accessible.
Concerning the areas of highly common interest between New Zealand and the EU, four research areas are identified:
1. Health – fighting against chronic diseases;
2. Food/Agriculture/Biotechnology ‐ developing novel plants and optimised animal production;
3. Information and Communication Technologies (ICT) ‐ linking humans with computers and computer‐based systems; and
4. Environment research.
In addition, New Zealand government put a lot of emphasis on food safety and security and the EU is lately showing an increasing interest towards this direction.
The main challenges of this relationship in the future is to invest more in societal challenges, based on a participatory approach, but also to facilitate knowledge transfer and commercialisation of research. In addition under Horizon 2020, the two parties are expected to focus on innovation and cooperation with SMEs, since New Zealand lacks in heavy industry and big multinational companies, and is characterised by a great number of SMEs.
Knowledge Based Bio‐economy forum
Since 2010, the “Knowledge Based Bio‐economy forum” (KBBE) gathers New Zealand, the EU, Canada and Australia. It is considered as a strategic level cooperation programme and New Zealand contributes around EUR 97 million among 19 collaborative activities in the areas of fisheries and agriculture, bio‐based industrial products, food and health as well as sustainable agriculture.
Member State policy strategies (identified privileged partnerships/relationships)
New Zealand & Germany
New Zealand sustains a long‐lasting collaboration with Germany. According to the interviewees, this partnership has proved to be extremely successful and profitable for both parties. Since the beginning of this partnership, the two countries identified common interests (via regular institutionalised dialogues) and designing concrete instruments to promote their collaboration (e.g. Julius von Haast Fellowships). For Germany, New Zealand is excellent in some “niche” areas and offers skilled personnel whereas for New Zealand, Germany has technical expertise, advanced equipment and large infrastructure to share.
Germany teamed up with New Zealand under FP7 to a great extent; 2/3 of the consortia including a New Zealand partner also involved a partner from Germany.

Geographical expansion of the EURAXESS‐Links Network Final Report 28 February 2014
79
They primarily collaborate in geology, atmospheric science, climate change, marine science and agriculture as well as Antarctic research. In the future, the two countries aim to closely collaborate on:
• developing vaccines against chronic diseases such as asthma and psoriasis;
• increasing the staff exchange between the Human Interface Technology Laboratory of New Zealand and German Universities;
• sharing expertise and research infrastructure related to climate change research; and
• investing significant funds to improving plant and animal breeding processes and products.
New Zealand & the UK
The UK was and will be one of the most important partners for New Zealand in several policy areas, including S&T. The two countries have close trade and investment links, similar legal and IPRs frameworks. Their scientific collaboration is traced back many decades. From the UK side, the UK presence in New Zealand is very much industry‐oriented, with the aim of fostering the commercialization of the research results performed in New Zealand. From New Zealand side, the UK has been always served as a source of ‘best practices’ in science and education.
The collaboration activities between the UK and New Zealand include joint projects, study visits (at PhD and post‐doc levels), staff exchanges, missions of specialists for commercially‐oriented research, twinning to enhance exchange of good practices and information, joint workshops, etc. They mostly collaborate in the areas of biological sciences, education, medical and health science, biotechnology and science instrumentation (e.g. censors, measuring machines).
According to the interviewees, the UK’s interest has overtime grown and nowadays, the collaboration is considered as smoother and people involved are much more interested in strengthening this collaboration. In the future, both parties show interest in investing their relations in high‐tech and innovation for the industry sector.

Geographical expansion of the EURAXESS‐Links Network Final Report 28 February 2014
80
Peru Introduction
Background information:
• Population: 29,987,800141 (2012)
• GDP (in EUR):
o Absolute value (at PPP): 147,000 million142 (2012)
o Per capita (GNI at PPP): 7,625143 (2012)
• Expenditure on R&D (% GDP): 0.11%144 (2004 ‐ 2011)
• Brief description of the country relation with the EU: The EU structures its relations with Peru under the Framework Agreement establishing cooperation between the EU and the Andean Community countries, which was signed in 1993 and became effective in 1998. The political dialogue is based on the Rome Declaration signed in 1996. Political relations were strengthened and institutionalised through the signing of a Political Dialogue and Cooperation Agreement between the EU and the Andean Community in December 2003. Once ratified, it will replace the Rome Declaration and the Framework Agreement. The new Agreement covers subjects such as conflict prevention, governance, migration and terrorism. Both the EU and the Andean Community countries agreed as of 2004 that their “common strategic objective” was the conclusion of an Association agreement that includes a free trade area between both regions.
The R&D landscape in Peru
Background information on S&T policies
For the first time in 2006, Peru’s government formulated a long‐term National Plan of Science, Technology and Innovation (PNCTI)145, covering the period between 2006 and 2021. In this Plan, the Peruvian State recognised that S&T is a matter of public necessity and national interest. Since then, there have been various initiatives towards strengthening Peru’s S&T development. The most significant and recent one has been President Ollanta Humala’s (2011 – 2016) intention to create a Ministry of Science of Technology before the end of his mandate. At the moment, there is a discussion in the country on the advantages and challenges of doing this146.
141 The World Bank Data (http://data.worldbank.org/indicator/SP.POP.TOTL) 142 The World Bank Data (http://data.worldbank.org/indicator/NY.GDP.MKTP.CD): 196,961,048,689 US dollars (2012) 143 The World Bank Data (http://data.worldbank.org/indicator/NY.GNP.PCAP.PP.CD/countries):10,240 US dollars (2012) 144 Private and public average expenditure in R&D (2004 – 2012). CONCYTEC based on data from UNESCO, WEO‐FMI and World Bank. (http://portal.concytec.gob.pe/images/stories/images2013/octubre/documento_brechas_i_d.pdf) 145 http://www.minedu.gob.pe/normatividad/reglamentos/PlanNacionalCTI‐CDH2006‐2021.php (in Spanish) 146 http://www.scidev.net/america‐latina/autoridad/noticias/per‐debate‐por‐probable‐creaci‐n‐de‐ministerio‐de‐cyt.html (in Spanish)

Geographical expansion of the EURAXESS‐Links Network Final Report 28 February 2014
81
Two other highlights of Peru’s S&T development are the creation of the National Fund for Scientific and Technological Development (FONDECYT)147, managed by the National Council of Science and Technology (CONCYTEC) and responsible for managing and administering national and international resources, and the S&T programme FINCYT148, funded with a loan from the Inter‐American Development Bank (IDB) and the Public Treasury which is aimed at providing public resources to finance innovation, research and training projects.
In terms of the government’s expenditure on R&D, this has been 0.11% in average between 2004 and 2011149. Of this investment, the government funds circa 55%, of which three‐fifths are concentrated in Lima and Callao. R&D expenditure is well below that of developed countries and below Latin American countries’ average level. Nonetheless, the country has maintained a steady growth rate and an increase of GDP per capita that has resulted in a rise in productivity and expected growth rates of circa 6.1% for the period 2013‐2018150.
Peru’s government is currently committed to ensuring the long‐term sustainability of the country’s economic growth by covering the gap investment in R&D. Thus, this expenditure is expected to increase to 0.36% by 2016. In line with this, CONCYTEC’s budget was tripled in 2013 and quadrupled for 2014. According to CONCYTEC’s authorities, the money available for scholarships is now 20 times greater than in the past.
However, the problem that arises when trying to ensure the optimal use of resources in R&D is the insufficient critical mass of researchers.
The focus areas are described in the PNCTI and respond to Peru’s competitive advantages and strategic economic and commercial priorities, as well as to a favourable institutional framework. These areas are namely:
• Biotechnology
• Science and Technology of Materials
• TICs
• Environmental Sciences and Technology
• Basic Sciences and Social Sciences.
According to CONCYTEC, these are the fields where Peru has more capacity to cooperate internationally.
Finally, the government has identified the need to attract foreign experts and researchers to train local researchers and professors and help them internationalise. Currently, important actions towards achieving this objective are being implemented (see below).
Immigration policies
According to the stakeholders interviewed, there are no specific immigration policies to favour researchers’ immigration. However, immigration policies in general have become friendlier and more open lately. A researcher wanting to work / study in the country would need to demonstrate that he
147 http://portal.concytec.gob.pe/index.php/fondecyt‐becas.html (in Spanish) 148 http://www.fincyt.gob.pe/web/index.php (in Spanish) 149 Private and public average expenditure in R&D (2004 – 2012). CONCYTEC based on data from UNESCO, WEO‐FMI and World Bank. (http://portal.concytec.gob.pe/images/stories/images2013/octubre/documento_brechas_i_d.pdf) 150 CONCYTEC “R&D: Gap in investment and human resources”. October 2013. (http://portal.concytec.gob.pe/index.php/concytec/areas‐de‐la‐institucion/informacion‐comunicacion/otros‐enlaces/noticias/824‐i‐d‐brecha‐en‐inversion‐pero‐tambien‐en‐recursos‐humanos.html)

Geographical expansion of the EURAXESS‐Links Network Final Report 28 February 2014
82
/ she has the necessary economic resources and then the process would consist of various administrative tasks.
However, beyond immigration regulation, there are some barriers at universities / research centres’ level that may discourage foreign researchers from going to Peru. CONCYTEC’s authorities explained that, in private universities there are almost no barriers, but in public ones it is more difficult to attract foreign human resources. Researchers and professors from abroad can apply for a position in a public university, but the salary offered is usually too low. And, in some cases, foreign applicants are not accepted. In line with the objective of further internationalising Peru’s community of researchers, CONCYTEC is working already on removing these barriers.
In addition to this, the National Assembly of Universities (ANR) and the Ministry of Foreign Affairs have already developed a simpler process to issue visas for foreign university students and professors/researchers that want to come to Peru for short periods of time (e.g. to attend an event). It is free of charge and the only requirement is that the visitor does not have a work contract in Peru and does not receive any money allowance apart from a scholarship or his/her own resources. This visa is used only for the countries with which Peru has a bilateral collaboration agreement. It takes two weeks to get the visa. Universities have to ask the ANR to issue it and this organisation then liaises with the Ministry, which contacts the relevant consulate.
Policies related to mobility and international attractiveness
CONCYTEC has four calls for proposals planned for 2013‐2014 aimed at strengthening the country’s research capacities and internationalising its human resources. The four calls are, namely:
• Establishment of international centres of excellence. The objective is to attract foreign centres of excellence that conduct applied research and that could cooperate with Peruvian researchers to provide advanced technological solutions to the local business community. This will work by establishing a link between the relevant Peruvian researchers, the foreign expertise, and the local businesses in need of a specific technological solution. The aim is to help local researchers turn their knowledge into something that the market demands. The programme will have a budget of 7 million USD for each centre. There is an additional 60,000 USD to fund travelling expenses to initiate the contact with the foreign group of researchers. During the first stage of the programme, the objective is to have four centres established in the country. The call will be open to all countries151.
• Development of networks of researchers. It is expected that the networks are formed by groups of researchers in different institutions that can work collaboratively and that this results in new cooperation agreements between local and foreign institutions. CONCYTEC will fund up to 12 networks with a budget of 600,000 USD per network for three years152.
• Strengthening PhD and Master programmes. CONCYTEC plans to provide funds to strengthen the programmes’ curricula develop research projects, create opportunities for international internships. The objective is to reach 18 Master and 12 PhD programmes in the first call153.
• Mobility instruments to attract foreign expertise. An example of this is a call aimed at attracting Post‐docs that could spend two years in the country as professors, training the local human resources, conducting research, etc. There are also some funds available
151 http://portal.concytec.gob.pe/index.php/fondecyt‐becas/cienciactiva/fomulac‐centros‐excelencia‐en‐i‐d‐i.html (in Spanish) 152 http://portal.concytec.gob.pe/index.php/fondecyt‐becas/cienciactiva/cientificos‐inc‐subvenciones‐para‐formacion‐de‐circulos‐de‐investigacion‐en‐ciencia‐y‐tecnologia.html (in Spanish) 153 http://portal.concytec.gob.pe/index.php/fondecyt‐becas/cienciactiva/generacion‐cientifica‐fortalecimiento‐de‐programas‐de‐doctorado‐en‐universidades‐peruanas.html (in Spanish)

Geographical expansion of the EURAXESS‐Links Network Final Report 28 February 2014
83
targeted at senior researchers that could visit Peru for shorter periods of time (e.g. 1 – 2 months) for specific research collaborations.
In addition to these national initiatives to attract foreign researchers, universities have their own institutional agreements to allow the exchange of students and professors with foreign institutions.
Research Community
The size and characteristics of the research community in Peru
According to data provided by CONCYTEC, there are 13,900 researchers (headcount) in the country, and slightly over 13% of these hold a PhD (1,848)154. Based on estimations made by the evaluator using data from the OECD and World Bank, there were 3,048 FTE (full‐time equivalent) researchers in Peru in 2004155. This is the latest data available for FTE researchers in the country.
The II University National Census156 conducted by the National Assembly of Universities in 2010 shows that there are circa 44,600 Master students and over 4,000 PhD students in the country.
In terms of researchers’ place of work, based on the latest data (2004), 45% of FTE researchers work for the government, followed by a 40% that work in higher education institutions (HEIs). The rest work in the business sector (14%) or in NGOs (1%)
Tables 1 to 3 summarise the data provided above.
Table 26: Size of the Peruvian research community
TOTAL
Researchers (registered in CONICYT) / Headcount 13,900
w/PhD 1,848
FTE Researchers (est. for 2004) 3,048
PhD students 4,047
Master students 44,577
Source: CONCYTEC (2013), II University National Census (2010), OECD and the World Bank Data (2004)
Table 27: Place of work of FTE researchers (2004)
TOTAL %
Government 1,402 45%
HEIs 1,219 40%
154 Data provided by CONCYTEC after the interview. It is based on data from its database of researchers (November 2013). 155 The OECD estimated the number of FTE researchers in Peru using the average FTE/headcount ratio for Latin American countries. For 2004, this was 0.24 per 1,000 labour force. The World Bank estimated that in 2004, labour force in Peru was 12,703,690. 156 The census provides data on students and professors from all public and private universities in Peru. (http://www.anr.edu.pe/index.php?option=com_content&view=article&id=139&Itemid=651)
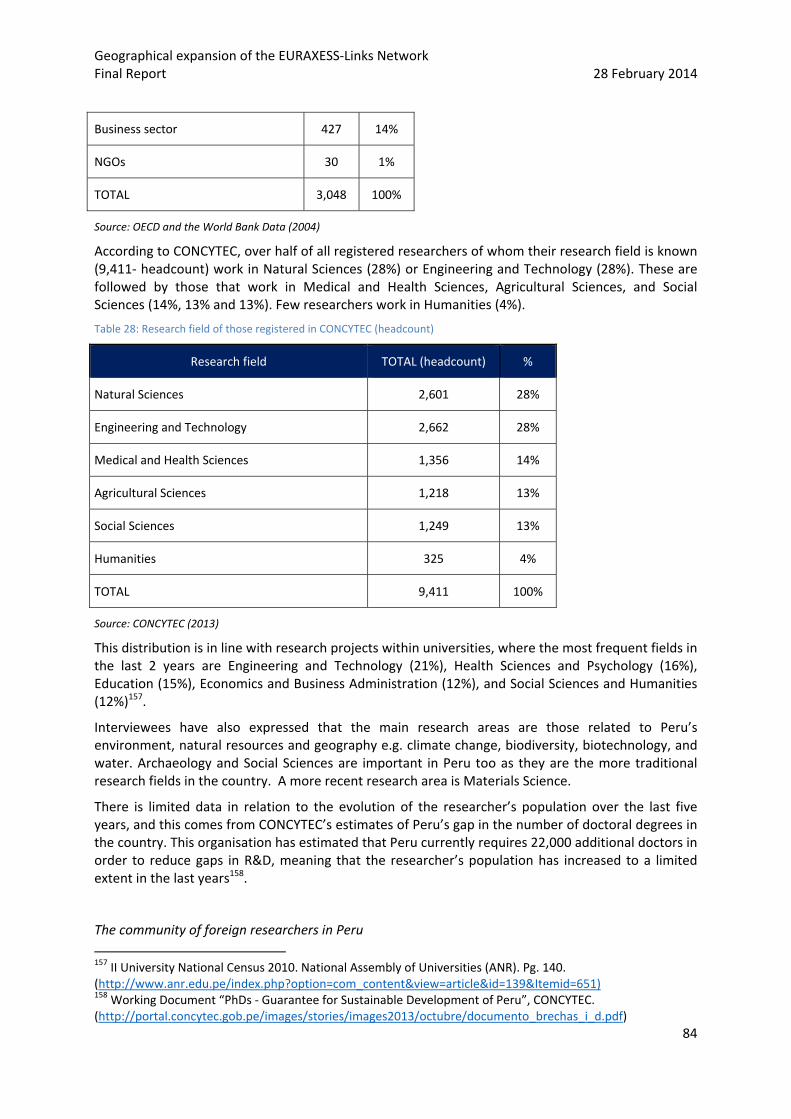
Geographical expansion of the EURAXESS‐Links Network Final Report 28 February 2014
84
Business sector 427 14%
NGOs 30 1%
TOTAL 3,048 100%
Source: OECD and the World Bank Data (2004)
According to CONCYTEC, over half of all registered researchers of whom their research field is known (9,411‐ headcount) work in Natural Sciences (28%) or Engineering and Technology (28%). These are followed by those that work in Medical and Health Sciences, Agricultural Sciences, and Social Sciences (14%, 13% and 13%). Few researchers work in Humanities (4%).
Table 28: Research field of those registered in CONCYTEC (headcount)
Research field TOTAL (headcount) %
Natural Sciences 2,601 28%
Engineering and Technology 2,662 28%
Medical and Health Sciences 1,356 14%
Agricultural Sciences 1,218 13%
Social Sciences 1,249 13%
Humanities 325 4%
TOTAL 9,411 100%
Source: CONCYTEC (2013)
This distribution is in line with research projects within universities, where the most frequent fields in the last 2 years are Engineering and Technology (21%), Health Sciences and Psychology (16%), Education (15%), Economics and Business Administration (12%), and Social Sciences and Humanities (12%)157.
Interviewees have also expressed that the main research areas are those related to Peru’s environment, natural resources and geography e.g. climate change, biodiversity, biotechnology, and water. Archaeology and Social Sciences are important in Peru too as they are the more traditional research fields in the country. A more recent research area is Materials Science.
There is limited data in relation to the evolution of the researcher’s population over the last five years, and this comes from CONCYTEC’s estimates of Peru’s gap in the number of doctoral degrees in the country. This organisation has estimated that Peru currently requires 22,000 additional doctors in order to reduce gaps in R&D, meaning that the researcher’s population has increased to a limited extent in the last years158.
The community of foreign researchers in Peru 157 II University National Census 2010. National Assembly of Universities (ANR). Pg. 140. (http://www.anr.edu.pe/index.php?option=com_content&view=article&id=139&Itemid=651) 158 Working Document “PhDs ‐ Guarantee for Sustainable Development of Peru”, CONCYTEC. (http://portal.concytec.gob.pe/images/stories/images2013/octubre/documento_brechas_i_d.pdf)
Geographical expansion of the EURAXESS‐Links Network Final Report 28 February 2014
85
There is no official data available in terms of the number of EU researchers in the country. The registry of foreign experts and volunteers from the Peruvian Agency for International Cooperation (ACPI)159 shows that for the period 2011 – 2015, there are 17 French researchers in the country (all from the Institute for Research for Development ‐ IRD) and one Belgian. However, this only includes those that come to Peru in the framework of the country’s bilateral and multilateral agreements with Europe and its Member States, leaving out the mobility of foreign researchers that occurs within specific cooperation agreements between Peruvian and European universities / research centres. In relation to this, one interviewee representing Peruvian universities explained that it is usually undergraduate students from Spain, Germany and France who travel to the country. Inward mobility of foreign university professors or researchers is relatively limited.
Lima is the political, economic and scientific centre in the country. The most internationalised universities are in Lima and are private160. Even though most foreign researchers concentrate in Lima, there are other locations in the country which are also attractive to them. For example, the Peruvian Amazon (for its biodiversity, natural resources and presence of native communities), the Andes Mountains (for questions related to climate change), and the North Coast (for its pre‐Columbian cultural legacy).
In terms of how long foreign researchers stay in the country, this is variable. In the case of the French researchers registered in ACPI, they stay between one and two years. However, as evidenced in the interviews with researchers, some go for shorter periods of time.
Perceived needs of the local research community
The stakeholders interviewed agreed that there has been a considerable increase in the investment in S&T in the last years. However, the community of highly professionalised and specialised researchers is still small. Even though there are universities and research centres in the country that are committed to attracting the best scientists and that have programmes to attract foreign researchers, the country is still behind in terms of having human resources of excellence.
An example of this are some public and private universities in the country that get funds from the mining and oil industry, but cannot develop research projects because they do not have the appropriate human resources.
It is the opinion of the stakeholders interviewed that these drawbacks, in combination with Peru’s commitment to further develop S&T as a driver of sustainable economic growth, provide a unique opportunity to strengthen international cooperation and collaboration. In this sense, one of the main needs is of international partners to conduct research in the country, but also to train and help specialise local human resources. In addition to this, there are many Peruvian researchers that could benefit from research stays abroad that would provide them access to labs and equipment that is not available locally.
One of the needs mentioned by interviewees was also improving the command of foreign languages by local researchers, English in particular. CONCYTEC recognised this need too and explained that they have launched full scholarships for one year of English classes targeted at students that have finalised their graduate or post‐graduate programmes and that are very good students.
It is important to note that there are some additional barriers that need to be overcome in order to increase the internationalisation of human resources and research institutions in Peru, namely:
159 http://www.apci.gob.pe/contenido_servicio1.php?ID=5068&TIPO=Registro&CATE=EXPERTOS Y VOLUNTARIOS 160 For example, Pontifical Catholic University of Peru, University of the Pacific, University San Ignacio de Loyola, and Cayetano Heredia Peruvian University.

Geographical expansion of the EURAXESS‐Links Network Final Report 28 February 2014
86
• There are universities that have closed calls to cover vacancies, limiting the work opportunities for young Peruvian researchers that have finalised their PhDs abroad and that would like to return to the country. In most cases, they do not come back
• Some public universities do not support professors that want to spend time abroad. There is no sabbatical year for them and they need to ask for a special leave of not more than 12 months if they still want to keep their position when they return161
• The information on cooperation opportunities and mobility does not reach all universities / research institutions and also these institutions are not always good in disseminating the information to researchers. There is no local institution or authority that compiles and disseminates information across the country.
Despite of these barriers, national authorities and institutions such as the ANR are already working to generate mechanisms to change this situation and are strongly committed to it. In this sense, they see EURAXESS links could complement their efforts.
Key expectations/problems related to the mandate of EURAXESS Links
Most interviewees have agreed that having EURAXESS Links would complement the current government’s efforts to internationalise universities/research institutions and researchers in Peru.
The national authorities and universities / research institutions interviewed have expressed a strong interest in having EURAXESS Links in Peru and would be willing to support the process of establishing the network in the country. In this respect, CONCYTEC mentioned that they will have a new building shortly where there will be space/offices for international organisations or initiatives that would like to be based in Peru. Other stakeholders said they could use their current network of contacts and exchanges with foreign and local institutions to facilitate the establishment of EURAXESS Links.
Interviewees have also explained that there are no similar networks of researchers in Peru. Researchers have their personal network of contacts and they keep in touch with colleagues in Peru and abroad via those personal networks162. In this sense, they see EURAXESS Links could bring the following benefits to the local community:
• Improve the level of information available and knowledge on EU calls and opportunities for international cooperation and mobility. There is an expectation that EURAXESS Links will provide information on EU calls that is clearer, simpler, more complete, easy to find, and accessible than it is now163.
• Help Peruvian researchers to expand their network of contacts, develop links for future collaboration and access education or training opportunities abroad.
161 This special leave is only available for professors/researchers with full time positions and not for younger researchers with more flexible or temporary contracts. 162 Researchers that study/work abroad usually do it via their personal connections and by finding their own resources (e.g. winning international scholarships or funds). 163 Some interviewees said that, compared to the US, the UE has a limited capacity to communicate with its stakeholders and disseminate information on opportunities for collaboration, funding and mobility. Interviewees mentioned that the information on when and how to apply to the EU’s calls is usually complex and difficult to find (e.g. it is not always clear which countries are eligible for funding). There is also no calendar or schedule of coming calls, which makes it difficult for researchers to start developing their proposals in advance, find partners abroad, and prepare all the paper work needed.

Geographical expansion of the EURAXESS‐Links Network Final Report 28 February 2014
87
• Identify international funding sources for research projects. This could benefit particularly researchers that finish their PhDs or Masters abroad and do not have the money to continue with their projects when they come back.
• Find international partners for research projects, expanding the opportunities to access labs, technologies or other resources that are not available in Peru.
From the EU perspective, establishing EURAXESS Links in Peru could bring the following benefits:
• Help the EU to capitalise the investment it already makes in funding research and mobility of foreign researchers. It could help to maintain contact with past beneficiaries over time and could potentially increase the quality of scientific relationships.
• Provide EU researchers / institutions access to Peru’s international calls for cooperation and mobility planned for the next years and that are aimed at strengthening the links of Peruvian groups of researchers with researchers abroad.
• Access a database of research projects carried out by researchers in Peruvian universities that the ANR has compiled and will release in 2014164.
164 The database contains data on research projects conducted in universities from 2010 to 2013. This will include data on the number of research projects per university, research fields, researchers, geographical location, and sources of funding, among other variables. The data comes from the 76 public and private universities in the country and could be used by EU researchers to find partners for their projects.

Geographical expansion of the EURAXESS‐Links Network Final Report 28 February 2014
88
Collaboration
Level of S&T cooperation between the EC and the country
The EU’s relations with Peru cover political dialogue, trade and development cooperation. Political and policy dialogue is based on the Rome Declaration and has developed in the context of EU‐CELAC (Community of Latin American and Caribbean States) relations, the Framework Cooperation Agreement with the Andean Countries (CAN) signed in 1993165, and a Memorandum of Understanding (MoU) agreed in 2009 establishing a mechanism for bilateral consultations. This is implemented through high‐level political and sectoral dialogue meetings166.
The 2007‐2013 Regional Strategy167 defines the priorities of regional cooperation between the EU and the CAN. Its priorities are the economic and regional integration, the economic and social cohesion, and the fight against illegal drugs.
In terms of S&T cooperation, the EU does not have a formal Science and Technology Cooperation Agreement with Peru. The Political Dialogue and Cooperation Agreement between the European Community and its Member States, of the one part, and the Andean Community and its Member Countries (Bolivia, Colombia, Ecuador, Peru and Venezuela) was signed in 2003, however its entry into force is still pending168. Thus, most S&T cooperation with Peru occurs in the framework of regional initiatives such as the promotion of the “EU‐LAC Knowledge Area”169.
The VII EU‐LAC Summit held in Chile in January 2013 concluded with an Action Plan for the years 2013‐2015. One of the areas included was “Science, research, innovation and technology”. The main objective in this area is to develop the “EU‐LAC Knowledge Area” through improving cooperation in research and innovation and helping to strengthen scientific and technological capacities and infrastructures in the region170.
In addition to this, there are other cooperation schemes providing funding to Peruvian researchers and research institutions including the FP7, ALFA III171 (based on the cooperation between higher education institutions of the EU and Latin America), @LIS2172 (boosting the interconnections between research networks and communities in the EU and Latin America) and Erasmus Mundus (offering joint masters and doctoral programmes and mobility of students and academics).
Peru participates in the FPs since 2008. According to the stakeholders interviewed, the FP7 is the main instrument through which the EC finances activities of research in Peru. The FP7 is a valuable tool as it supports Peru in its efforts to further develop S&T in the country. However, researchers’ awareness of this instrument, as well as the level of success of those who have submitted projects, is still limited. Stakeholders have explained that this is mainly because there is no office in Peru that coordinates and provides support for Peruvian participants, as there is in Mexico.
As of February 2012, Peru has submitted 134 eligible proposals, involving 159 Peruvian participants. The success rate of Peruvian applicants was 12.6%, lower than the average for all Third Countries’
165 The Andean Community comprises Bolivia, Colombia, Ecuador and Peru. It is one of the oldest regional organisations in Latin America based on the Cartagena Agreement of 1969. The General Secretariat of the Andean Community is located in Lima. 166 http://eeas.europa.eu/peru/index_en.htm 167 EC (2007): Andean Community. Regional Strategy paper 2007‐2013, p. 3. 168 Council Decision on the signature of a Political Dialogue and Cooperation Agreement between the European Community and its Member States and the Andean Community and its member countries: http://eur‐lex.europa.eu/LexUriServ/LexUriServ.do?uri=COM:2003:0695:FIN:EN:PDF 169 http://ec.europa.eu/research/iscp/pdf/alcue_som_2010_en.pdf 170 Council of the European Union (2013): EU‐CELAC Action Plan 2013‐2015, 5748/13 PRESSE 32 171 http://www.alfa3programme.eu/en/ 172 http://ec.europa.eu/europeaid/where/latin‐america/regional‐cooperation/alis/index_en.htm

Geographical expansion of the EURAXESS‐Links Network Final Report 28 February 2014
89
success rate (22.8%). The greatest number of successful applicants was in the areas of Health; Food, Agriculture and Fisheries and Biotechnology; and Information and Communication Technologies173.
Level of S&T cooperation between individual Member States and the country
Peru has 56 bilateral agreements with 16 Member States. The most important Member States (in terms of the number of agreements with each country) are France, Germany, Spain, Italy and Poland174.
The stakeholders interviewed agreed on this and said that Peru has privileged relationships with France and Germany mainly. According to the EU Delegation in Peru, the bilateral relationship with France and Germany is key to further develop S&T and strengthen Peru’s commercial and industrial expansion. Compared to other Member States, Germany and France offer more funds and resources for S&T cooperation projects and are also more proactive in finding Peruvian partners for their projects. For example, they send missions to the country on a regular basis to make contact with national authorities and research institutions. France also has its own research institutions in the country e.g. the French Institute of Andean Studies (IFEA) and a representation of the Research Institute for Development (IRD). Germany provides mobility opportunities for Peruvian researchers via the German Academic Exchange Service (DAAD), and funding for research institutes via the Alexander von Humboldt Foundation and the Max Planck Society.
When it comes to mobility, Spain is one of the privileged destinations for Peruvian researchers though, mainly due to language and historical reasons. Spain is also the Member State with which Peru has established more cooperation projects within the FP7 framework (24 projects), followed by France (18), United Kingdom (17), and Germany (12)175.
A large portion of the S&T cooperation between Peru and the EU occurs in the framework of institutional agreements between specific universities / research institutions in Peru and Member States. Representatives of the universities and research institutions interviewed have mentioned agreements and joint research projects with institutions in Belgium, Denmark, Germany, Finland, France, Italy, Poland, Spain, Sweden, and the UK. There has been exchange of students and researchers in the framework of these agreements.
Level of S&T cooperation between the country and non‐EU countries
Peru has 126 international agreements in S&T (excluding those with EU countries)176. According to the stakeholders interviewed, the most important agreements between Peru and non‐EU countries are with Latin American countries (Brazil and Cuba in particular) and the United States. However, Peru is recently developing stronger economic and commercial relationships with Japan, China and the Republic of Korea. The recent cooperation agreements with these countries have also included agreements related to education and mobility of undergraduate and postgraduate students.
Policy strategies
EU policy strategies
173 http://ec.europa.eu/research/iscp/pdf/lac/peru_2012.pdf#view=fit&pagemode=none 174 Peruvian Observatory of Scholarships (www.observatoriobecas.gob.pe) 175 http://ec.europa.eu/research/iscp/pdf/lac/peru_2012.pdf#view=fit&pagemode=none 176 Peruvian Observatory of Scholarships (www.observatoriobecas.gob.pe)
Geographical expansion of the EURAXESS‐Links Network Final Report 28 February 2014
90
The EU cooperation with Peru occurs in the framework of the EU’s general principles of cooperation (as set forth in Article 177 of the EC Treaty) which include the sustainable economic and social development of the developing countries, the smooth integration of the developing countries into the world economy and the campaign against poverty.
According to the EU Delegation in Peru, the relationship between Peru and the EU is going through a very promising phase at this moment. The Memorandum of Understanding (MoU) agreed in 2009 has turned the EU and Peru into partners. There will be a meeting on this in Lima in 2014 and another in Brussels. Also in the framework of this MoU, DG RTD and CONCYTEC have agreed to maintain a structured and regular dialogue on S&T cooperation.
The relationship has also been strengthened by a commercial agreement between Peru, Colombia and the EU, which will favour commercial exchange between them. In 2014 Peru will be home of a global agreement on climate change. This was announced during the VII EU‐LAC Summit held in Chile in 2013.
Member State policy strategies (identified privileged partnerships/relationships)
The EU Member States have maintained close bilateral relations with Peru for decades and their main priorities have been the fight against poverty and the strengthening of State institutions, democracy and civil society. As explained in one of the interviews carried out with a Member State representatives, the relationship in the S&T field is currently evolving from a vertical one characterised from the transference of financial resources from the EU Member States to the country to a more horizontal one based on technical cooperation and exchange of experience.
Cooperation with France and Germany is already strong and dynamic and Peru’s national authorities are interested in enhancing them during the next years. The existing cooperation agreements set the main framework for S&T collaboration. Beyond these, there are actions being taken at an institutional level. For example, in the case of France, in 2013 CONCYTEC’s Director travelled to the country and made contact with various cultural and research organisations with which CONCYTEC is already working in the development and implementation of new cooperation activities. In the case of Germany, an agreement with Max Planck Society was signed in 2013.

Geographical expansion of the EURAXESS‐Links Network Final Report 28 February 2014
91
Russian Federation Introduction
Background information
• Population: 143,533,000177
• GDP (absolute value and per capita in EUR)
o In absolute value: US $ 2,014,774,938,342178
o Per Capita (PPP): US $ 22,720179
• Expenditure on R&D as percentage of GDP: 1.12 in 2011 180
• Brief description of the country relation with the EU
Russia is the EU's biggest neighbour and third biggest trading partner, with Russian supplies of oil and gas making up a large percentage of its exports to Europe.
The current basis for cooperation is the 1994 Partnership and Co‐operation Agreement (PCA).
At the St. Petersburg Summit in May 2003, the EU and Russia agreed to reinforce their cooperation by creating in the long term four “common spaces” in the framework of the PCA and on the basis of common values and shared interests. These cover the following issues:
‐ The Common Economic Space, covering economy and environment:
‐ The Common Space of Freedom, Security and Justice;
‐ The Common Space of External Security, including crisis management and non‐proliferation; and
‐ The Common Space of Research and Education, Including cultural aspects.
The R&D Landscape in the Russian Federation
Background information on R&D policies
The Russian Federation inherited a strong tradition in basic research in hard sciences from the Soviet Union, together with large research infrastructures. Issues such as under‐funding and institutional instability have lowered the attractiveness of the research sector in Russia in the years after the independence in 1991. Since then, several changes have been implemented in order to re‐establish the tradition in research and modernise and make more attractive the sector of research.
Currently, there are three schemes to access Russian S&T programmes:
• Russian Federal Targeted Programmes (RTP);
• Bilateral and Multilateral Programmes (see previous section);
• New Russian Initiatives.
177 Data refer to 2012 (last available year). Source: World Bank 178 Data refer to 2012 (last available year). Source: World Bank 179 Data refer to 2012 (last available year). Source: World Bank 180 Data refer to 2011 (last available year). Source: World Bank

Geographical expansion of the EURAXESS‐Links Network Final Report 28 February 2014
92
The Russian Federal Targeted Program (FTP) consists of five major blocks: Life Sciences, Nanotechnologies & New Materials, Information and Telecommunication Technologies, Sustainable Use of Environment, and Energy Efficiency. It provides opportunities for all interested entities, including foreign organisations, to implement promising R&D drawing on Russian federal funding.
In parallel to FP 7 the Russian Federal Targeted Program (FTP) “R&D in Priority Areas of Russia’s Scientific and Technological Development in 2007‐2012” gained the approval of the Russian Federation Government and is currently being implemented in Russia.
The resources of FP7 and Russian R&D FTP were combined in a new cooperation mechanism of coordinated calls for co‐funded research proposals between the European Union and Russia (the Ministry of Education & Science, the Ministry of Industry & Trade, Ministry of Information, and Rosatom) first launched in 2007:
• 2007‐2008: Two EU ‐RU coordinated calls for research proposals in Energy and Food‐Agriculture‐ Biotechnology;
• 2008‐2009: Three EU ‐RU coordinated calls for research proposals in Health, Nano‐technologies & New Materials and in Nuclear Fission Energy research;
• 2009‐2010: One EU ‐RU coordinated call for research proposals in Aeronautics;
• 2010‐2011: Two EU ‐RU coordinated calls for research proposals in IC T, Nano‐technologies & New Materials.
These are parallel research calls published by both the EU and Russia with common research content and a requirement that research teams on both sides that wish to collaborate, establish links and submit separate but complementary proposals to the EU and to the Russian funding agency involved. These co‐funded activities demonstrate that EU S&T cooperation with Russia is moving towards a partnership between equals based on sharing funds and responsibilities.
The main strategic document for the S&T sector is the “Strategy for the Development of Science and Innovation in the Russian Federation up to the year 2015”181, which was prepared by the Ministry of Education and Science and approved in early 2006.
Among other things, the strategy set specific targets for R&D expenditure as regard to GDP. It was envisaged to achieve the 2% threshold by 2010 and the 2.5% in 2015. Real data however are far from set targets. The Russian Federation spends slightly more than 1% of its GDP in R&D (1.16% on 2010 according to HSE data). In absolute figures funding inflows into R&D have substantially increased over the last years, and GERD reached €15b (RUB610b) in 2011 (up from €11b in 2009). The international economic crisis is one of the causes of this comparatively low level of R&D expenditure.
The R&D expenditure structure in Russia is marked by two important facts. First fact is the overwhelming domination of the government sector. Although official statistics give around 30% of expenditure in the business and enterprise sector, this value is largely overstated. A range of research institutes and enterprises have been established as independent units and are counted to the business and enterprise sector, but are still controlled by the state, either directly or indirectly via shareholdings. Therefore the R&D expenditure in the government sector is de facto much higher than the 60% that are currently indicated in official statistics and the contribution of businesses to R&D spending is rather limited in comparison to EU countries.
Second fact is the high expenditure on defence related R&D in Russia. The Soviet Union had traditionally spent immense resources on defence and related R&D; a spending pattern, which is to a
181 http://erawatch.jrc.ec.europa.eu/erawatch/opencms/information/country_pages/ru/supportmeasure/support_0022
Geographical expansion of the EURAXESS‐Links Network Final Report 28 February 2014
93
certain extent continued by Russia. More than 50% of governmental expenditure on R&D is dedicated to defence R&D and is with this only slightly below the US value, but much higher than those of European competitors. The EU front runner is here the UK with slightly more than 30% of government R&D expenditure for defence
What concerns distribution of funding, in the Soviet system, R&D funds was allocated generally as block funds based on planning decisions. Since Russia’s independence in 1991 this funding mode has gradually been changing and competitive and project based R&D funding schemes have been established. In 2005, around 25% of the civil governmental R&D funding was allocated competitively. The share of competitive funding is constantly increasing, while the share of block grant funding against reporting requirements is decreasing.
Research funding is allocated either directly from the state budget to research organisations, channelled through the Ministry of Education and Science and the Ministry of Industry and Trade or distributed via several agencies. The portfolio of funding instruments has been further diversified over the past five years, with a special focus on support tools for innovation and for universities. Competitive R&D funding allocation is handled by several research and innovation funds and ministries, in particular the Ministry of Education and Science (MON).
A legal framework for most of the Russian funding instruments is provided by the State Programme Development of Science and Technology for the period 2013‐2020. The programme was approved in December 2012 and has a planned budget of €40b (RUB 1600b). Its budget has been subdivided into six categories: fundamental research (the biggest share with around 50% of the budget), applied R&D, institutional development of the S&T sector, R&D infrastructures, international cooperation, and programme implementation.
Additional Russian initiatives include the programme “Measures to Attract Leading Scientists to Russian Educational Institutions” and the Skolkovo project (see section on Policies related to mobility and international attractiveness) are quite easy to participate in because their design has been based on the idea to attract foreign specialists.
Immigration policies
Russia continues to facilitate the process of opening its R&D and innovation programmes to European participation and engaging foreign research excellence. Over the past year a number of significant changes in the legislation have been implemented by the Russian Federation which consequently facilitate the participation of foreign researchers in Russian programmes.
An important breakthrough has been achieved in migration legislation. The procedures for obtaining work permits have been substantially simplified and the number of required permits has been reduced for top‐level specialists. Moreover, this category of specialists has been put beyond the quota regime of work permits and invitations, and the employer (university or research centre) has the right to decide the degree of qualification of such employees on the basis of reliable and verifiable information and documents confirming the professional knowledge and skills. Nevertheless, the implementation of such legislation can be still improved.
The Russian Ministry of Education and Sciences is currently preparing a bill on the unilateral recognition of diplomas and certificates of academic degrees obtained in leading world universities. This will remove some restrictions to hire scientists and researchers who have been trained abroad.
Policies related to mobility and international attractiveness
One of the main initiatives to foster R&D in Russia and attract foreign researchers is the creation of the Skolkovo Innovation Centre, a high technology business area near Moscow182. The project aims at
182 http://rustradeusa.org/eng/256/366/
Geographical expansion of the EURAXESS‐Links Network Final Report 28 February 2014
94
creating conditions to develop innovation in 5 priority industries (space and telecom, medical equipment and pharmaceuticals, energy efficiency, information and nuclear technology) and its further commercialisation. It has led to notable simplifications in the immigration policies in order to attract foreign scientists.
Based on the priorities of economic development, the Russian government has also decided two main exceptions with respect to the Skolkovo project: (i) no necessity to obtain permits in state bodies – invitations and permits are obtained through the Managing Company or its affiliated branches; (ii) no need to receive special quotas for hiring foreign employees as opposed to the standard procedure. The maximum term of a work permit is three years since the date of arrival in Russia, but that term can be prolonged every three years.
In addition, the Migrants programme was created. This is a Marie Curie‐like programme, which allows top researchers from EU academic institutions to come to Russia for 2 years to build large facilities. In order to increase the attractiveness of the programme, the length of the mandatory period of stay in Russia is not very long. A clause of the programme states that foreign researchers participating need to stay in Russia for no more than 4 months per year.
Welcome Services to inbound researchers are not very well developed or coordinated, according to the interviewees. Initiatives lead within each single university and research institution.
Research community
The size and characteristics of the research community in Russia
The Russian Federation has inherited a large R&D sector and a large and highly qualified workforce from the Soviet Union at the time of its independence in 1991. As a result of the transformation processes to a market economy and due to serious cuts in funding, the R&D sector experienced a dramatic downsizing. The R&D personnel shrank by more than 50% since 1991 reaching 736,540 people by 2010183.
183 Data from Eurostat, 2012 last available year

Geographical expansion of the EURAXESS‐Links Network Final Report 28 February 2014
95
Figure 9 – R&D Personnel in Russia
Source: National Research University Higher School of Economics (HSE), Science and Technology Indicators in the Russian Federation (2013)
A similar downsizing trend was registered also for researchers, whose number started to decrease sharply during the 1990’s, both in absolute terms and in total employment.
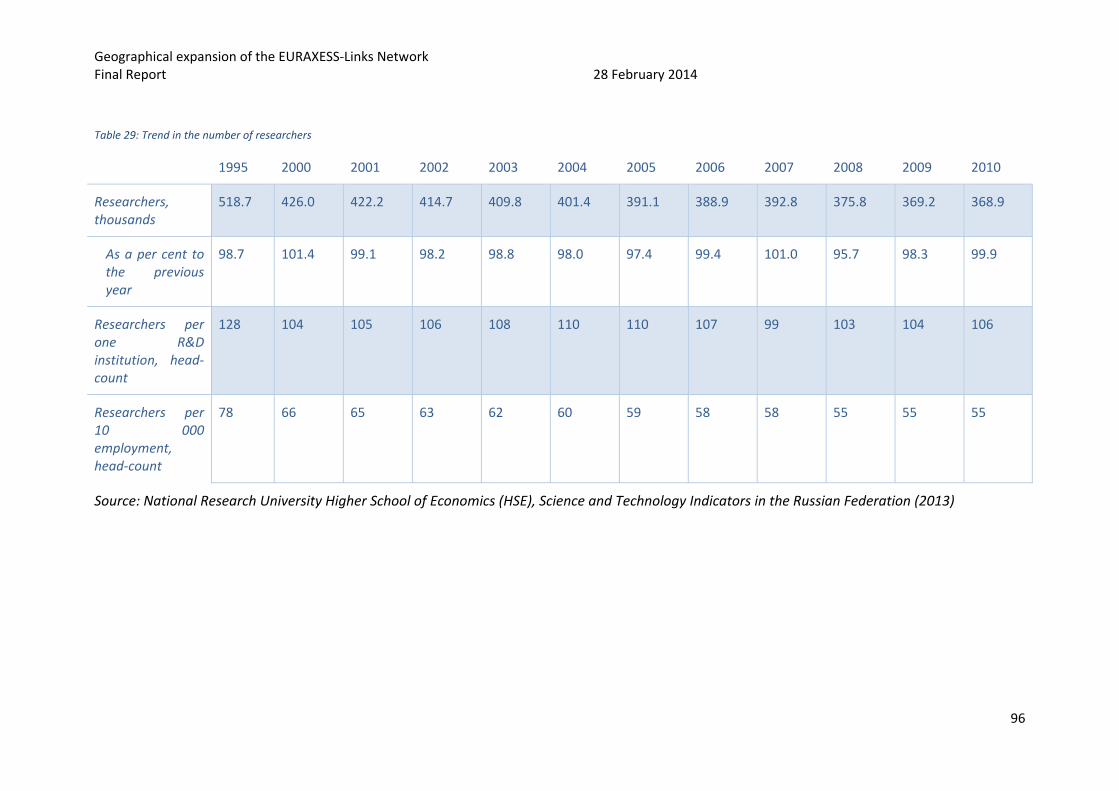
Geographical expansion of the EURAXESS‐Links Network Final Report 28 February 2014
96
Table 29: Trend in the number of researchers
1995 2000 2001 2002 2003 2004 2005 2006 2007 2008 2009 2010
Researchers, thousands
518.7 426.0 422.2 414.7 409.8 401.4 391.1 388.9 392.8 375.8 369.2 368.9
As a per cent to the previous year
98.7 101.4 99.1 98.2 98.8 98.0 97.4 99.4 101.0 95.7 98.3 99.9
Researchers per one R&D institution, head‐count
128 104 105 106 108 110 110 107 99 103 104 106
Researchers per 10 000 employment, head‐count
78 66 65 63 62 60 59 58 58 55 55 55
Source: National Research University Higher School of Economics (HSE), Science and Technology Indicators in the Russian Federation (2013)

Geographical expansion of the EURAXESS‐Links Network Final Report 28 February 2014
97
Low salaries, limited career perspectives and outdated equipment distract young talents from embarking on a scientific career and lead them to the business sector for better paid job opportunities. The situation regarding salaries has improved over the past five to ten years, where economic growth has allowed increasing financial inflows into the R&D sector. Nevertheless, research does not represent yet again an attractive career for many young graduates, who still prefer to look at other professions in the private sector for better job opportunities184.
This situation reflects into the demographics of researchers and R&D personnel, who is experiencing a progressive aging. Indeed, researchers aged 50 and above represent the large majority of researchers in Russia. Nevertheless, this trend seems to have passed it works peak in 2008 and started to reverse.
Figure 10 – Age distribution of researchers in Russia
Source: National Research University Higher School of Economics (HSE), Science and Technology Indicators in the Russian Federation (2013)
The Russian researchers’ community tends to live in or close the areas of the two major Russian cities (Moscow and St. Petersburg), where many of the research institutions and research facilities are located.
While the size of private sector research has increased over the last few years, the major Russian research institutions are public sector (often State‐owned) ones.
184 CREST OMC Working Group, Country Report Russia: An Analysis of EU‐Russian Cooperation in S&T, 2011

Geographical expansion of the EURAXESS‐Links Network Final Report 28 February 2014
98
Figure 11 – Distribution of R&D personnel by type of R&D institutions
Source: National Research University Higher School of Economics (HSE), Science and Technology Indicators in the Russian Federation (2013)
With regard to the research field, the long tradition of Russia (also under the Soviet Union) in basic research in the fields of hard sciences has led to a large predominance of researchers in the areas of natural sciences and engineering. Conversely, social sciences and humanities were neglected under the Soviet Union, which has continued until nowadays.
Figure 12 – Distribution of researchers by research field
Source: National Research University Higher School of Economics (HSE), Science and Technology Indicators in the Russian Federation (2013)
More in details, areas of work among natural sciences and engineering include energy (including nuclear energy and energy efficiency), space technologies and telecommunications, ICT, nanotechnologies and biotechnologies.

Geographical expansion of the EURAXESS‐Links Network Final Report 28 February 2014
99
The community of foreign researchers in Russia
There are no statistics available in the number or trends of foreign researchers (including R&D personnel) living and working in Russia. On this topic, interviewees have commented based more on their impressions than on available figures. Interviewees have agreed that while Russia still remains an outbound country in terms of researchers’ mobility, something has started to change in the last few years. In the last 2‐3 years several things happened:
• The Russian government started programmes to become more attractive to foreign researchers (as from 2008‐2009), by building bridge with the Russian diaspora and by starting modifying visa and labour legislation, in order to make Russia a more attractive destination for foreign researchers185;
• Programmes were subscribed and/or implemented to facilitate inbound mobility, such as the Migrants programme and the Skolkovo project186;
• Changes in the international context. The deepening of the economic and financial crisis in Europe affected negatively EU researchers, who started to look at Russia as a possible destination. At the same time, Russian universities and research facilities started to experience an increase in their funding, also as an effect of the raise of the price of goods exported by Russia (such as oil and natural gas).
As mentioned, however, there are no statistics available on the topic. Interviewees commented that as a combined effect, the number of foreign researchers in the country has probably increased, but it is still too early to have real changes in the researchers’ mobility balance. Notably, a large part of the incoming scientists is returning Russian researchers from the Russian diaspora.
Concerning the geographical distribution of foreign researchers, interviewees agreed that they tend to live and work in the areas of Moscow and St. Petersburg, where the great part of research institutions and facilities are.
As for the fields of activities, interviewees agreed that many of them tend to work on research areas such as natural sciences and engineering, space technologies and telecommunications, ICT, nanotechnologies and biotechnologies. According to some interviewees, foreign researchers could be hired in order to build solid research structures in areas such as humanities and social sciences, where Russian institutions are generally less strong.
Perceived needs of the research community in Russia
Several factors still negatively affect the Russian research world and thus the researchers’ community. While the situation has improved in the last few years, unclear and unstable framework conditions and regulatory deficiencies of the Russian market continue to hamper the development of the S&T sector and foreign investment in Russian R&D. This concerns insufficient protection of property rights and intellectual property rights (IPR), deficiencies of laws and their application, corruption, bad infrastructure, etc.
Difficult framework conditions have immediate repercussions on international S&T cooperation. For example, cumbersome visa procedures, language barriers or harsh living conditions in Russia do limit scientific exchange and the attractiveness of Russia for foreign researchers.
185 See section on Policies related to mobility and international attractiveness 186 Ibid.
Geographical expansion of the EURAXESS‐Links Network Final Report 28 February 2014
100
Some advancement regarding framework conditions is taking place. The government has continued to improve the legal framework for IPR in Russia in general and the allocation of IPR in Russia’s publicly funded research sector in particular. Thus, Part IV of the Civil Code devoted to IPR came into force in 2008, proclaiming the author of created IP as its primary owner. New laws on technology transfer and on patent attorneys are in preparation, which should continue to bring more clarity on treatment of publicly created IP and its selling to private investors. Improvements of laws are not sufficient, they need to be applied properly too.
Nevertheless, the issue mentioned above are far from being fully solved.
Notably, 2014 is the EU‐Russia Year of Science187, which leads to the organisation of a series of events and presentations all across Russia about cooperation programmes and opportunities. Hopefully, this will contribute to increase awareness about opportunities of cooperation with Europe.
The Russian researchers’ community is quite interested in mobility and mobility towards Europe notably. Indeed, for historical, geographical and cultural reasons Europe is the major destination for Russian researchers.
Concerning mobility, the Russian researchers’ community is quite interested in the topic and many of them make efforts in order to be informed about opportunities. In general, however, the level of awareness of existing opportunities (even with Europe) and of existing structure (such as the NCPs network of FP7) is relatively low, according to the interviewees.
Key expectations/problems related to the mandate of EURAXESS Links
Interviewees were strongly convinced of the real added value of a network that would strengthen the links between the EU and Russian researchers. Some of the interviewees went as far as asking why a structure like EURAXESS Links is not present in the country yet.
The interviewees indicated that the added value of EURAXESS Links was mainly the potential of:
• Consolidating all information available on cooperation and mobility opportunities between the EU and the other EURAXESS countries, thus reducing the current fragmentation and of the NCPs system;
• Improve the cooperation in fields where Russian research institutions are less strong, thus improving the quality of research in the country;
• Establish collaborations to provide EU researchers with locations in Russia where they can carry out fieldwork;
• Disseminating information on mobility opportunities and sources of funding both in the EU and in Russia;
• Providing support and advice on the administrative process related to immigration regulations and procedures;
• Providing support and advice on the administrative process to submit proposals as well as on the management and reporting procedures;
187 http://www.eu‐russia‐yearofscience.eu/en/1379.php

Geographical expansion of the EURAXESS‐Links Network Final Report 28 February 2014
101
• Providing a more institutionalised framework to the existing network between EU and Russian researchers.
It has to be mentioned that all the interviewees commented on the inherent difficulties of one EURAXESS Links Officer in covering a large territory such as Russia. According to them, the frequency of travels across the territory would be a crucial success factor.
Collaboration
The Russian Federation has a long list of S&T agreements with several countries across the world. The focus on some specific areas and countries largely corresponds to the overall Russian strategy in foreign policy. The main target countries/regions are:
• The European Union and a large part of its Member States;
• Former Soviet Union countries and neighbourhood countries;
• Other third countries (mostly the US);
• Iran and North Korea (in the field of nuclear energy).
Level of S&T cooperation between the EC and Russia
The Agreement on Cooperation in Science and Technology between the European Union and the Government of the Russian Federation provides the framework for EU ‐Russia S&T cooperation. It was signed in 2000 and has been renewed twice, most recently in 2009, each time for a duration of five years. It is due for renewal in 2014.
Russia participates traditionally in the EU’s Framework Programme for RTD and other EU multilateral S&T cooperation tools (e.g. EUREKA, ERA‐NETs, until 2010 INTAS). In the analysis of cooperation in the EU FPs, it can be observed that Russia consistently has one of the highest participations of all “Third Countries” (countries not being EU Member States or Associated Countries to the FP) in the past FP’s and the current FP7.
According to data from the European Commission reported by EraWatch, in the period between 2002 and 2006, Russian teams have been involved in 309 projects funded in the different FP6 sub‐programmes (including EURATOM). In these projects more than 450 Russian research organisations have participated and received an EC contribution of around €50 million (without INTAS). Most projects with Russian participation were funded in the following scientific fields of FP6 in order of importance (citing here only the top three priorities):
• Sustainable development, global change and ecosystems;
• Nanotechnologies and nano‐sciences;
• Information society technologies (IST).
In the FP7 Russia is still the strongest “Third Country” performer in terms of funding received and in the number of participants in the funded projects. Up to May 2013, 695 Russian research organisations have been involved in 436 FP7‐funded research projects. Most projects with Russian participation have been funded in the FP7 sub‐programmes People (123 projects), Transport (TPT – 63 projects), and ICT (36 projects). Then follow: Environment (ENV – 31 projects), Space (SPA – 30 projects), Knowledge‐Based Bio Economy (KBBE – 29 projects), Nanotechnology, Materials and New Processes (NMP – 27 projects), Infrastructure (INFRA – 24 projects), Health (21 projects), Energy (13 projects) and Fission (12 projects). All other FP7 sub‐programmes (e.g. SME, etc.) have 10 or less projects with Russian participation.
Figure 13 ‐ Russia Participation in FP7

Geographical expansion of the EURAXESS‐Links Network Final Report 28 February 2014
102
Source: EraWatch, Country Report 2012: Russian Federation
The success rates 188of Russian participants per FP7 sub‐programme show that results were the highest in nuclear fission (48.15%) and in infrastructure (47.71%). The lowest success rate (1.56%) was achieved in the European Research Council (ERC), where only one applicant out of 64 applicants received funding. The total cost of the projects selected for funding with Russian participation amounts to €4 billion. Russian organisations have received more than €60 million in EU funding in these projects.
Within the Horizon 2020 programme (2014‐2020) the status of Russian will change. Similarly to the research teams from other industrialised and emerging economies (e.g. China), Russian participants in Horizon 2020 projects will not receive funding from the EU automatically189. The effects of this change in status have been commented negatively by the interviewees. They have noticed that, besides the intrinsic difficulties of the administrative process to participate in EU multi‐lateral cooperation, the absence of an automatic funding mechanism will represent a further obstacle to participation.
188 The success rate is one of the key performance parameters to measure countries’ participation in FPs and is defined as the percentage of proposals retained for funding out of the total number of eligible proposals, for any given call 189 Under Horizon 2020, rules have changed for third countries willing to participate. While enlargement and neighbourhood countries and developing countries are eligible for automatic funding, industrialised and emerging economies (such as Russia) will receive funding only under specific conditions. Industrialised and emerging economies will have to fulfil the all following criteria:
• have a good capacity in science, technology and innovation; • have a good track record of participation in Union research and innovation programmes; • have close economic and geographical links to the Union.
(See http://www.eutrainingsite.com/2014‐2020.php?id=106#euf)

Geographical expansion of the EURAXESS‐Links Network Final Report 28 February 2014
103
As mentioned earlier, 2014 is the EU‐Russia Year of Science. Agreed on 2012, it is a joint initiative of the EU‐Commission and the Ministry of Education and Science of the Russian Federation and it is organised with the EU Member States across the EU and Russia. it is meant to “highlight the achievements and the potential of the rich science and research cooperation between Russia and Europe190” It provides the framework for the presentation to a wider public and the launch of Horizon 2020 and the Russian State Programme and the Federal Targeted Programmes for R&D.
Level of S&T cooperation between individual Member States and Russia
The Russian Federation has active agreements in place with 15 out of the 28 EU members191 and with five associated countries to FP7 (Israel, Norway, Macedonia, Serbia and Turkey).
Germany and France are probably the EU Member States with the strongest bi‐lateral cooperation with Russia.
Germany
Germany and Russia have a long history of cooperation in science. Since 1986, the inter‐governmental Agreement between Russia and Germany on Scientific and Technological Cooperation has been the basis for strong cooperation. This agreement, which came into force by July 1987, was renewed by the agreement on scientific and technological cooperation in 2009. Dedicated bilateral sectoral agreements in many fields of science and technology are evidence of a diverse and broad cooperative relationship: high‐temperature‐superconductivity, laser research and technology, innovative strategies and technologies for sustainable environmental protection and the efficient use of natural resources, biological research and biotechnology, marine and polar research, and information and telecommunication technology. Another recent cooperation has been commenced in the field of nanotechnology.
Joint research institutions such as the German‐Russian Otto‐Schmidt‐Laboratory for marine and polar research in St. Petersburg and the Moscow Laser Innovation Centre are representative of the sustainable progress of cooperation. Other examples are the German‐Russian Terahertz‐Centre in Regensburg or the German‐Russian Centre of Multifunctional Nanostructured Materials in Hamburg. The creation of joint institutes also includes the development of research programmes and the constitution of scientific networks between German and Russian institutes. The projects and programmes which are implemented in the context of about 700 partnerships between higher education institutions result in thousands of scientists and students working and studying in Germany every year.
Scientific cooperation between Germany and Russia received a new impetus by a Strategic Partnership launched in 2005. This joint initiative, coordinated by the BMBF (Germany Ministry of Education and Research), aims at bilateral activities in science, education, the economy and public administration. It focuses on research and innovation, training and qualification of executives in business and administration, and training of civil service executives.
190 http://www.eu‐russia‐yearofscience.eu/en/1358.php 191 Those are: Austria, Bulgaria, Czech Republic, Finland, France, Germany, the Netherland, Hungary, Italy, Poland, Romania, Slovakia, Slovenia, Spain, and United Kingdom and Croatia.

Geographical expansion of the EURAXESS‐Links Network Final Report 28 February 2014
104
France
French‐Russian scientific cooperation, which dates back to 1966, is today based on inter‐governmental Agreements (1992 for Science and Technology, 1996 for Space), and involves mainly the three biggest French institutes: CNRS for basic research, CEA for nuclear and applied research, and CNES for space research.
Basic research cooperation ‐ Since 2001, scientific cooperation has seen new developments with the creation of joint structures, in close cooperation with CNRS: these structures (either virtual laboratory between two units, networks between several partners or mixed international units) are platforms for the exchange of students and researchers and provide increased visibility to cooperation. An international laboratory between CNRS and the Independent University of Moscow in mathematics (Laboratoire Poncelet) was created in 2004.
As of end 2010, a total of 13 virtual laboratories and 22 research networks existed between France and Russia, mainly in mathematics, physics and chemistry, but also in the humanities (3 research networks). Since the signature in 2006 of an Agreement between CNRS and Russian Foundation for Basic Research (RFBR), joint financing of projects has been provided through joint calls.
Cooperation in the field of nuclear studies ‐ The French Commissariat for Atomic Energy (CEA) has framework agreements with the Russian State Corporation (formerly Federal Agency) Rosatom and with the National Research Centre “Kurchatov Institute” in the field of nuclear studies which cover, amongst others, nuclear safety, future reactors, cycle of combustible. Together with CNRS it is also part of a joint laboratory in Dubna. And, of course, CEA is very much involved in the ITER project.
CEA also manages the French part of the G8 Global Partnership initiated in Canada in 2002 which aims to fight the spread of weapons and materials of mass destruction. In Russia, it works on submarine dismantlement and naval bases remediation, nuclear safety of nuclear power plants, chemical weapons dismantlement and bio‐security, with some projects linked to research in biology.
Space cooperation ‐ Space cooperation between France and Russia includes a program on future launchers, earth observation, telecommunications, human space flights projects and scientific cooperation (including in the medical field). The French National Centre of Space Research (CNES) has a representation in Moscow.
Technological cooperation ‐ The joint French‐Russian Committee for Science & Technology has promoted cooperation between French and Russian institutes and SMEs in the field of innovation since 2003. A range of infrastructures have been created to support the transfer of technologies between France and Russia:
• The Franco‐Russian Technological Network (RFR ) (www.rfr‐net.org), a network of Innovation Centres working through a database of technological patents and requests;
• International Technology Transfer Centres in St. Petersburg (between the Aerospace University and the Franche‐Comté University), in Tomsk (between the Scientific and Technological Centre of Lorraine and the Tomsk Polytechnic University) which reinforce local links between partners in the field of innovation;
• Intellectual property harmonisation: different research contract models have been elaborated jointly by French and Russian ministries responsible for research, so as to address what is often a major hurdle when beginning a cooperation;
• Co‐funding of innovative projects is undertaken by OSÉO‐Anvar (a branch of the French Innovation Agency) and by the Russian Foundation for Assistance to Small Innovative Enterprises (FASIE).

Geographical expansion of the EURAXESS‐Links Network Final Report 28 February 2014
105
In addition, it should be mentioned that in November 2009 Russia and France signed an agreement on the temporary employment of citizens on the territory of their respective states
Level of S&T cooperation between Russia and non‐EU countries
Another regional focus of S&T cooperation is what is defined by Russia as “Near Neighbourhood”, meaning countries of the Former Soviet Union and Mongolia. Agreements are in place with all Central Asian Republics except Turkmenistan, with the three Caucasus Republics, with Moldova, Ukraine and Mongolia. These agreements reflect on the one hand Russian foreign policy priorities, which put importance on cooperation and linkages with, but also on domination and control of the “Near Neighbourhood”. On the other hand, they reveal still existing ties of scientists, which have shared the same education and which have collaborated for years still within the Soviet Union and in its post‐Soviet period. As a matter of fact a lot of scientists in Former Soviet Union countries have received higher education in Russian cities; several, including some of the best scientists have stayed at least for a short period in Moscow or St. Petersburg and have established long lasting contacts. In addition, this cooperation is facilitated by the use of the Russian language in the region, which is, although declining, still widely spoken in the region and which serves the function of “lingua franca”.
A third focus is on cooperation with major S&T players worldwide, which are Japan and the USA and with the emerging S&T players Argentina, Brazil, China, Egypt, India, Malaysia, Mexico, South Africa and South Korea.
The final group of countries with cooperation agreements includes two particular cases of international politics, Iran and North Korea, with which Russia has established special ties. The cooperation in the atomic energy field with Iran should be emphasized in this context, which gives cause for political tensions with the USA and other international players.
Policy strategies
EU policy strategies
As mentioned, Russia has been for several years one of the main S&T partners of the EU. Cooperation is that strict in several strategic areas that resources of FP7 and Russian R&D FTP were combined in a new cooperation mechanism of coordinated calls for co‐funded research proposals between the European Union and Russia.
The details of the main actions and achievements of EU‐Russia S&T cooperation are detailed in specific Roadmaps on a biannual basis. The last available one refers to the 2011‐2013 period. It focuses on the following areas of activity:
• Health Research;
• Food, Agriculture and Fisheries, and Biotechnology Research;
• Information and Communication Technologies (ICT) Research;
• Nano‐sciences, Nanotechnologies, Materials and New Production Technologies;
• (Non Nuclear) Energy ;
• Transport (Including Aeronautics) Research;
• Environment (Including Climate Change) Research ;
• Space Research;
• Research Infrastructures.

Geographical expansion of the EURAXESS‐Links Network Final Report 28 February 2014
106
Russian scientists and teams participate in projects of the European initiatives such as COST and EUREKA. COST supports networking among researchers of its member states. Researchers from other international partners may, however, also participate in COST actions. By May 2013, Russian researchers had been involved in 47 running COST actions. Russia is herewith in fourth place in participation rates among non‐member countries of COST (after Australia, the USA, and New Zealand).
Russia is a member of EUREKA since 1993. But the participation of Russian organisations in comparison to the duration of its involvement is rather low. This may reflect the limited innovative capacities available in the country. But this trend could be also due to the lack of financing for EUREKA and that responsibility for the programme has been changing several times among Russian ministries. In 2011, the responsibility for EUREKA in Russia was moved to the Skolkovo Foundation, and there are some signs of more intensive funding activities, such as a joint Israel‐Russia call for EUREKA projects in 2012.
Russia’s interest in European science goes beyond the EU R&D Framework Programmes. For instance, Russia actively participates in a number of international large‐scale projects such as CERN, ITER, International Space Station, Gloriad, etc. Russia also continues to participate actively in ERA‐NET projects.
Under the Russian Federal Targeted Programmes (FTPs), EU countries continue to be the most active international partners. Since 2007, European organisations have taken part in 153 projects funded under the FTP 'Research and Development in Priority Areas of Russia’s Scientific and Technological Development in 2007‐2013'. This constitutes over 56% of all projects with foreign participation implemented in the framework of this programme. Almost half of these cooperation projects are carried out with research institutions in Germany (44 projects) and France (28 projects). The largest number of projects with the participation of EU countries are in the areas of nano‐systems and materials, and living systems.
Member State policy strategies (identified privileged partnerships/relationships)
Germany
Bilateral cooperation between Germany and Russia rests on a long, solid tradition. It is reinforced by a series of bilateral sectoral agreements and by the creation of many joint research institutions.
Cooperation is focused on areas of common interests where Russia is strong, such as natural sciences (including marine and polar research), basic and applied physics and energy and environment (including strategies and technologies for sustainable environmental protection and the efficient use of natural resources). Another recent cooperation has been commenced in the field of nanotechnology, where also Germany has a strong position.
France
French‐Russian scientific cooperation involves the three biggest French institutes: CNRS for basic research, CEA for nuclear and applied research, and CNES for space research.
Besides historical ties, cooperation between France and Russia focuses on common interests on the fields of basic research, space and technological cooperation and nuclear energy. In fact, France is the one of the biggest producers of nuclear energy among EU Member States, and its nuclear energy companies create and manage nuclear plants all across the world.

Geographical expansion of the EURAXESS‐Links Network Final Report 28 February 2014
107
South Africa Introduction
Background information
• Population: 51,189,307192
• GDP
o Absolute value (at PPP): 300,000 million EUR (2012)193
o Per capita (at PPP): 5,930 EUR (2012)194
• Expenditure on R&D (% GDP): 0.87% of GDP (2009/10)195
• South Africa EU relations196:
South Africa and the EU have developed a strong relationship since the dawn of multi‐racial democracy in 1994.
The legal basis for relations between South Africa and the EU is formed by the Trade, Development and Cooperation Agreement (TDCA) signed in 1999. The agreement sets the foundations for close relations on trade, development, economic cooperation and political dialogue.
The relationship was further consolidated by the Strategic Partnership (2007), which focuses on fostering bilateral cooperation on areas of mutual interest including science & technology.
The R&D landscape in South Africa
Background information on S&T policies
Following the advent of multi‐racial democracy in 1994, South Africa faced the challenge of economic liberalisation. Fiscal austerity constrained public support for research and development (R&D) and the technology‐intensive production historically built around the military‐industrial complex. The opening of markets and South Africa’s rapid integration in global production systems tended to reduce innovation among South African businesses197.
In response to these difficulties, the White Paper on Science and Technology (1996) was adopted to guide policies and strategies for renovation of the national system of innovation. The National Research and Development Strategy (NRDS) was the second major systemic policy framework in this drive to transform and develop state innovative capacity. The NRDS complemented the vision of the White Paper by specifying details of the institutional change of public innovative capabilities.
192 World Bank data (http://data.worldbank.org/indicator/SP.POP.TOTL) 193 World Bank Data (http://data.worldbank.org/indicator/NY.GDP.MKTP.CD): 348,454,760,311 US dollars (2012) 194 The World Bank Data (http://data.worldbank.org/indicator/NY.GDP.PCAP.CD): 11,573 US dollars (2012) 195 Human Sciences Research Council and South African Department of Science and Technology, National Survey of Research and Experimental Development (2009/10 Fiscal Year). Available at http://www.dst.gov.za/index.php/resource‐center/rad‐reports 196 European External Action Service, South Africa. Available at http://eeas.europa.eu/south_africa/ 197 For further detail see the summary ERAWATCH Country Fiche on South Africa, available at: http://erawatch.jrc.ec.europa.eu/erawatch/opencms/information/country_pages/za/country?tab=country&country=za

Geographical expansion of the EURAXESS‐Links Network Final Report 28 February 2014
108
In 2007 a Ten‐Year Innovation Plan proposed to help drive South Africa’s transformation towards a knowledge‐based economy, in which science and technology play a key role in enhancing productivity, economic growth and socioeconomic development.
The Ten‐Year Plan for Science and Technology, 2007 The plan envisages that South Africa will undergo a major transformation, moving away from an economy based on raw materials towards a knowledge‐based economy. Moving away from the short‐term, the plan provides a longer‐term strategy, setting several goals to be achieved by 2018 including the ambitious target that the country should be investing GERD/GDP two per cent (the most recent figure, for 2010, stands at 0.87 per cent and has declined over the last three years). The Plan focuses on five ‘grand challenges’ for South Africa’s science and technology system over the next decade:
1. The ‘Farmer to Pharma’ value chain to strengthen the bio‐economy 2. Space science and technology 3. Energy security 4. Global‐change science with a focus on climate change 5. Human and social dynamics, to apply science and technology activities to achieve the
Millennium Development Goals on livelihoods and affordable access to services. Progress in all these areas is expected to be based on three foundations:
a) technology development and innovation; b) human capital; and c) knowledge infrastructure (including the research institutions mandated to promote sector
research). South Africa’s Department of Science and Technology (DST) assists the coordination of South Africa’s S&T system through:
a) developing five‐year research and development plans for the whole of government; b) preparing the framework for a national S&T expenditure plan (NSTEP) aimed at providing a
holistic view of government's total science and technology spending; and c) introducing reforms to improve the budgeting process and the management of the S&T
system.
The most recently available figures show that South Africa’s GERD/GDP ratio198 stood at 0.87 per cent in 2009/2010, marking a third successive annual decrease (Figure 14). This decrease is in part explained by falling spending by business, which contributes more than half of the country's R&D expenditure. Businesses in South Africa dropped their R&D spending by 9.7% in 2009–10, with government departments also spending less. Over the same period, national science councils and universities spent more. South Africa’s GERD/GDP ratio is low in comparison with its international competitors (Figure 15).
198 The gross expenditure on research and development (GERD)/GDP ratio is used to indicate the intensity of R&D in the economy.

Geographical expansion of the EURAXESS‐Links Network Final Report 28 February 2014
109
Figure 14: GERD as a percentage of GDP in South Africa
Source: Statistics South Africa (2011)
Figure 15: GERD as a percentage of GDP, selected countries (2009 or nearest year)
Source: OECD Main Science and Technology Indicators, (2011/01 Edition); Argentina‐RICYT; India‐NSTMIS; UNESCO Institute for Statistics Science Report (2011)
In 2009/10 the business sector performed 53.2% of GERD in South Africa, notwithstanding the proportionate decrease from 58.6% that was recorded in 2008/09 (Figure 16). A distant second, higher education’s share rose to 24.3% from 19.9% in 2008/09 while the government’s share increased from 20.4% to 21.6%. The not‐for‐profit sector’s share of R&D performance dropped from 1.1% to 0.9%.
0,6
0,73
0,810,87
0,920,95 0,93 0,92
0,87
0
0,1
0,2
0,3
0,4
0,5
0,6
0,7
0,8
0,9
1
1991 1992 1993 1994 1995 1996 1997 1998 1999 2000 2001 2002 2003 2004 2005 2006 2007
Per cent
0,00
0,50
1,00
1,50
2,00
2,50
3,00
3,50
4,003,94
3,60 3,563,36
2,91
2,41 2,27 2,261,92
1,701,39 1,25
0,87 0,76 0,60

Geographical expansion of the EURAXESS‐Links Network Final Report 28 February 2014
110
Figure 16: R&D expenditure by sector of performance 2009/10
Source: South African National Research and Experimental Development Survey 2009/10
Immigration policies
The policy makers interviewed in the science and technology field were unaware of strategic immigration policies which make it easier for European researchers to conduct research in South Africa. Desk research suggests temporary work permits are available to Europeans wishing to study in South Africa199, as well as for researchers based abroad who would like to conduct research in the country. Exceptional skills permits200, valid for three years may also be used where South African institutions hire European researchers. These exceptional skills would need to be substantiated by qualifications or publications and testimonials, with host institutions asked to confirm that the researcher’s exceptional skills will be to the benefit of the South African environment in which he/she intends to operate201.
Policies related to mobility and international attractiveness
South Africa lacks a broad skills foundation, described by the OECD as a major bottleneck for South Africa’s economic and social development202. Although 16% of workers are in S&T occupations, only 4% of the adult population enjoys a tertiary level education. The skills base is further weakened by the ageing of the white male population of researchers and engineers.
Acutely aware of the skills deficit the country faces, and in parallel to investing in its domestic S&T system, South Africa is investing in attracting foreign researchers, and in particular Europeans, to work in the country. A science and technology counsellor is permanently based in the South African mission to the EU. The counsellor is tasked, amongst other duties, with promoting research opportunities for Europeans in South Africa and regularly attends and presents at events in Brussels and across the Member States203.
199 http://www.home‐affairs.gov.za/index.php/types‐of‐temp‐res‐permits 200 http://www.southafrica.info/travel/documents/workpermits.htm#.UuDnBhDFK2w 201 http://www.home‐affairs.gov.za/index.php/types‐of‐temp‐res‐permits 202 OECD Science, Technology and Industry Outlook 2012 203 http://www.southafrica.be/st‐section‐profile/ See for example South Africa’s participation in the Digital Agenda for Europe ICT 2013 event on 6 to 8 November 2013 in Vilnius, Lithuania. The event was targeted at
53%
22%
24%
1%
Business
Government
Higher Education
Not‐for‐profit

Geographical expansion of the EURAXESS‐Links Network Final Report 28 February 2014
111
In parallel to promoting South Africa as a research destination, the DST works closely with the ESASTAP Plus initiative which aims to support the deepening of scientific and technological cooperation between South Africa, the EU and its Member States, with a special focus on innovation. ESASTAP Plus assists South African research institutions to participate in the EU’s Horizon 2020 framework programme204, while simultaneously promoting reciprocal European participation in South African research and innovation programmes. Staff from ESASTAP Plus organise and participate in events both within South Africa and in Europe205 to promote opportunities for research cooperation between researchers and research institutions.
ESASTAP Plus206
The ESASTAP Plus network supports the deepening of scientific and technological cooperation between South African, the EU and its Member States with a special focus on innovation. In order to enhance South African ‐ EU cooperation in science, technology and innovation, ESASTAP Plus officers attend and organise events across South Africa and in Europe to:
• Enrich the science, technology and innovation policy dialogue;
• Promote strategic cooperation under the main instruments, chiefly Horizon 2020;
• Better coordinate and exploit synergy between EU and national programmes; and
• Expand cooperation to specifically address innovation partnerships.
In accordance with this strategy ‘a major focus of the initiative will be to target coordination of Member States and Associated Countries' research policies and programmes vis‐à‐vis South Africa, encouraging the development of new joint initiatives implemented by several countries. Synergy between different EU cooperation initiatives will also be encouraged, e.g. between development cooperation and research programmes207.
Research Community
The size and characteristics of the research community in South Africa
The most recent figures (for 2009/10) suggest South Africa had a headcount of 40,797 researchers (8,500 of who hold a doctoral degree or equivalent), with a full time equivalent (FTE) of 19,793208. This represents 1.5 FTE researchers per 1,000 total employed, a rate which has remained unchanged over the last five years (Figure 17). Compared with many EU countries, such as Sweden and France, South Africa has a smaller proportion of researchers in its workforce. South Africa’s rate ranks alongside China (although China has a significantly larger headcount of researchers) while Argentina, for example, fared much better.
innovators, researchers, academics and industry representatives. http://www.esastap.org.za/download/sa_ict_networking_sumrep_2013.pdf 204 http://ec.europa.eu/programmes/horizon2020/en/what‐horizon‐2020 205 http://www.esastap.org.za/events/index.php 206 http://www.esastap.org.za/about/index.php 207 http://www.esastap.org.za/about/index.php 208 OECD Main Science and Technology Indicators, (2011/01 Edition)

Geographical expansion of the EURAXESS‐Links Network Final Report 28 February 2014
112
Figure 17: Number of Full Time Equivalent (FTE) researchers per 1000 total employment, selected countries (2009 or nearest year)
Source: OECD Main Science and Technology Indicators, (2011/01 Edition); Argentina‐RICYT
In terms of headcount the majority of South African R&D personnel work in the higher education sector209, although the most recent figures (for 2009/10) suggest that in terms of FTE, a slightly greater number are employed in the business sector. The remaining 30% of R&D staff are employed by science councils, the government and the not‐for‐profit sector.
Figure 18: R&D personnel headcounts by sector (2009/10)
Source: HSRC (Human Sciences Research Council) 2009/2010
Engineering sciences, natural sciences and medical and health sciences dominated the scientific fields for South Africa’s R&D activities in 2009/10 (Figure 19). Medical and Health Sciences, ICT, Social Sciences and Humanities, and Agricultural Sciences all saw increases in the proportion of expenditure devoted to them when compared with the previous year. There was a decline in the proportion of
209
0
2
4
6
8
10
12 10,5 10,4 10,4 10,19,1
8,5
76,4
2,71,5 1,5
Business enterprises
31%
Not‐for‐profit1%
Government4%
Science councils10%
Higher education (excluding
postgraduate and postdoctoral students)
35%
Higher education doctoral and postdoctoral students19%

Geographical expansion of the EURAXESS‐Links Network Final Report 28 February 2014
113
R&D funds spent on Engineering Sciences, Natural Sciences, and Applied Sciences compared to 2008/09.
Figure 19: GERD by type of R&D South Africa, 2009/10
Source: South African National Research and Experimental Development Survey 2009/10
The community of foreign researchers in South Africa
There is no official data on foreign (including EU) researchers in South Africa. Some interviewees estimated that, at most, the number of foreign researchers would be in the same proportion as the number of foreign students, with researchers from the African continent predominating, and a minority from the EU numbering around 400 ‐ 600.
South Africa is a regional hub for study and research with data suggesting new patterns are emerging in student mobility in the Southern Africa Development Community (SADC)210. The SADC has the highest outbound mobility ratio worldwide (6%), even though the outflow of students (at least in some countries) has been surpassed by growth in local tertiary enrolment. While their African counterparts pursue tertiary education in Europe and North America, nearly one‐half of SADC mobile students are instead choosing to study in South Africa. The most popular disciplines amongst mobile students from the region are social sciences, business and law. It is suggested that SADC students’ tendency to remain within the region parallels the SADC’s vision for regionalisation and intra‐region mobility211.
Where do foreign students come from? Where do South African students go?
Rank Country of origin
Number of students
Rank Destination country
Number of students
1. Zimbabwe 14,359 1. United States
1,641
210 New Patterns in Student Mobility in the Southern Africa Development Community. UIS Information Bulletin Number 7, February 2012. 211 New Patterns in Student Mobility in the Southern Africa Development Community. UIS Information Bulletin Number 7, February 2012.
Engineering Sciences22%
Natural Sciences18%
Medical and Health Sciences
17%
Information, Computer and Communication Technologies
15%
Social Sciences and Humanities
13%
Applied Sciences and Technologies
8%
Agricultural Sciences7%

Geographical expansion of the EURAXESS‐Links Network Final Report 28 February 2014
114
2. Namibia 7,264 2. United Kingdom
1,543
3. Botswana 4,849 3. Australia 839
4. Lesotho 4,004 4. Cuba 377
5. Swaziland 3,453 5. Malaysia 198
6. DR Congo 1,815 6. Brazil 174
7. Zambia 1,529 7. Germany 157
8. Angola 1,135 8. Canada 150
9. Mauritius 1,108 9. New Zealand
118
10. Nigeria 1,084 10. France 116
Source: UNESCO Institute for Statistics (UIS) (2010)
Interviewees considered European researchers working in South Africa are concentrated in the three urban areas where the majority of the domestic research population is located: Gauteng Province (containing Johannesburg and Pretoria) and the metropolitan areas centred on Cape Town and Durban. Given the opportunities offered by South Africa’s landscape and bio‐diversity, EU researchers working on projects such as the SKA212 and the Group on Earth Observations213 may also be found at locations outside the main urban centres.
Perceived needs of the research community in South Africa
Interviewees frequently commented that the extent to which South African research institutions, including universities, were able to attract foreign talent varied significantly. While some leading universities such as Stellenbosch University and the University of Cape Town have relatively long traditions of working with partners in Europe, other, particularly publically funded, institutions were less likely to have links abroad. This lead some interviewees to conclude that the likelihood of a young researcher moving abroad would be closely linked to the institution at which they currently studied and whether that institution took a proactive attitude towards researcher mobility.
Key expectations/problems related to the mandate of EURAXESS Links
Several interviewees commented that some universities were far more proactive than others at raising awareness of the possibility for their students to study or work abroad as part of their studies or to undertake research. The role of mobility offices within the institutions was highlighted as being key to determining whether young researchers would be aware of these opportunities. Were Euraxess Links to be expanded to South Africa, they claimed, the portal would be accessed by a wider cross section of the research community than currently goes abroad.
Most interviewees were aware of ESASTAP Plus, with a small number questioning whether expanding EURAXESS Links to South Africa risks overlapping with the work of ESASTAP Plus in promoting research collaboration with Europe. Where they understood that EURAXESS would go beyond the
212 Square Kilometre Array radio telescope https://www.skatelescope.org/ 213 GEO http://www.earthobservations.org/ag_partorg.shtml

Geographical expansion of the EURAXESS‐Links Network Final Report 28 February 2014
115
work of ESASTAP Plus, which promotes opportunities for South African researchers and research institutions under the EU’s Framework Programme Seven (FP7) and in future, Horizon 2020, these interviewees agreed that EURAXESS Links might well play a useful role in further EU‐South African collaboration.
Some interviewees suggested younger researchers in South Africa are already aware of and using EURAXESS Links (although no‐one could point to any hard evidence of this). For these interviews, formalising South African involvement with the initiative would allow it to be promoted more successfully.
Collaboration
Level of S&T cooperation between the EC and South Africa
South Africa and the European Union agreed to cooperate in the field of science and technology, signing an agreement to lay the foundations for this collaboration in 1997. South African researchers have steadily increased their involvement in the EU’s FP (Framework Programmes) 4, 5 and 6 to the extent that under FP7 South Africa stands fifth for the level of third country participation.
As the EU's largest trading partner in Africa and by far the strongest of sub‐Saharan Africa's economies, the EU has invested heavily in its relations with South Africa. Science and Technology cooperation forms a key element of the EU – South Africa Strategic Partnership: both partners recognise the fundamental role of science and technology innovation for development (including harnessing the contribution of knowledge generation and innovation to support the European Development Cooperation Programme) and are committed to closer cooperation in this regard. Both the EU and South Africa are committed to supporting African science and technology initiatives, including in areas of capacity building and infrastructure development, within the context of the African Union / NEPAD214 science and technology programmes, as well as those of the Africa, Caribbean and Pacific Group of States215.
The importance that South Africa places on research collaboration with the EU and its member states is illustrated by the fact the country has a science and technology counsellor based permanently in Brussels whose tasks include promoting research opportunities for European researchers and institutions. Numerous events aim to raise awareness and provide information for those who are interested in working together with their South African counterparts.
Interviewees closely involved with ESASTAP Plus considered that expanding EURAXESS would be a natural next step for South Africa. Existing arrangements for the promotion of FP7 opportunities could be used to promote EURAXESS, with synergies identified in terms of the intended audiences, the existing network of contacts and the good relations between the initiative and the relevant government bodies could all be to the advantage of EURAXESS Links.
South Africa’s participation in the EU Framework Programmes
With over 180 participants under 140 signed grant agreements, South Africa was the fifth most active non‐EU partner country in FP7216 between 2008 and 2013 and the fourth most active in terms of the share of the FP7 budget its research institutions received. Over the same period 11 researchers and 38 institutions received funding to the tune of €1.9 million from the Marie Sklodowska‐Curie Actions.
214 The New Partnership for Africa's Development (NEPAD) is an economic development programme of the African Union. 215 The South Africa‐European Union Strategic Partnership Joint Action Plan (May 2007) http://register.consilium.europa.eu/doc/srv?l=EN&t=PDF&gc=true&sc=false&f=ST%209650%202007%20INIT&r=http%3A%2F%2Fregister.consilium.europa.eu%2Fpd%2Fen%2F07%2Fst09%2Fst09650.en07.pdf 216

Geographical expansion of the EURAXESS‐Links Network Final Report 28 February 2014
116
Under the auspices of the COST (European CO‐operation in Scientific and Technical Research217) initiative, the EU and South Africa signed a reciprocal arrangement in 2009 to provide European researchers and their counterparts in South Africa with the opportunity to meet, learn from each other and explore opportunities for working together. The agreement enables foresees RSTSMs (Short Term Scientific Missions under a Reciprocal Agreement)218.
Level of S&T cooperation between individual Member States and South Africa
The burgeoning research community in South Africa works in close collaboration with researchers across Africa and beyond and the EU is the closest research partner. South Africa also enjoys good bilateral relations with the EU’s Member States, 12 of which have signed bilateral cooperation agreements with the country since 1995. The focus of these agreements, and the nature of the ensuing cooperation depends on the research priority of the Member State concerned. Whereas research cooperation between South Africa and Germany, for example encompasses a diversity of fields, Finland focusses on cooperation in telecommunications, reflecting its expertise in that field and the desire on the part of South Africa to develop this sector.
12 of the EU’s member states have signed agreements with South Africa to advance science and technology cooperation on a bilateral level. Relations between South Africa and these countries result from historical traditions (e.g. United Kingdom, the Belgian region of Flanders) or economic cooperation (Germany).
A full list of these agreements is available on the ESASTAP website219. The following Member States were considered by several researchers to be among the most important in terms of the number of joint research projects and the fields of research covered:
United Kingdom220: the UK and South Africa’s formal bilateral Science and Technology Agreement (1995) pre‐dates that of the EU. The two countries have agreed that shared priority focus areas will be health research; astronomy and space; biosciences; and climate change, which reflect the five challenges set out in the Ten Year Innovation Plan. The UK’s Department for Business, Innovation and Skills works together with the Foreign and Commonwealth Office to fund the UK Science and Innovation Network (SIN)221. In South Africa, the SIN’s objectives are to:
• Influence science and innovation policies of South African government, industry and academia to benefit the UK;
• Improve UK policy based on international experience and emerging opportunities and challenges with South Africa;
• Stimulate strategic science collaborations with South Africa to benefit the UK and deliver wider policy goals;
• Harness South African international technology partnerships and investment to grow UK innovation capability
217 http://www.cost.eu/about_cost/cost_countries/international_cooperation/reciprocal_agreements 218 An RSTSM must last between a minimum of five days and a maximum of three months. The agreements cover travel and subsistence expenses to and within the host country.
219 http://www.esastap.org.za/southafrica/bilateral_int.php 220 https://www.gov.uk/government/priority/uk‐science‐and‐innovation‐network‐working‐with‐south‐africa 221 https://www.gov.uk/government/world/organisations/uk‐science‐and‐innovation‐network

Geographical expansion of the EURAXESS‐Links Network Final Report 28 February 2014
117
Under the EU’s FP7, South African institutions successfully partnered with UK institutions more than those from any other EU country.
Germany222: South Africa is Germany´s main cooperation partner on research, science and technology in Africa. Germany’s strong industrial basis is reflected in a focus on research collaboration in advanced manufacturing as well as climate change, energy, astronomy, sustainability, biodiversity, geosciences, integrated water resource and sustainable land management.
Among other projects, Germany’s Federal Ministry of Education and Research funds:
EnerKey, a project which aims to develop and apply an effective implementation concept for a sustainable and effective energy and climate protection structure in order to improve the sustainability in urbanised Gauteng province223.
SASSCAL, an initiative whereby Germany cooperates with South African and its southern African neighbours to conduct problem‐oriented research in the area of adaptation to climate change and sustainable land management224.
France: Several institutions exist to promote French – South African research collaboration in numerous fields. These include F’SATI225, the French South African Institute of Technology. A graduate school, F’SATI aims to provide industry with highly skilled technical manpower in the domain of Electrical and Electronic Engineering, especially in the fields of Telecommunication, the Enabled Environment, Power Engineering, and Satellite Engineering.
Although there has been little systematic evaluation of these bilateral agreements, research carried out for the European Commission suggests that the most successful arrangements tend to be those where partners and their responsibilities are specified, with considerable inputs from both sides.
South African officials were keen to stress their appreciation that the EU and its Member States took an approach of partnership to research collaboration, rather than using the country as a kind of giant laboratory in which to conduct experiments with minimal local involvement. South Africa’s research policy prioritises international cooperation where it can benefit the country in areas where it would otherwise be lacking in expertise. According to those stakeholders in research policy interviewed, this was done with a view to strengthening the country’s economy as it transitions from a focus on natural resources to a knowledge base.
Level of S&T cooperation between South Africa and non‐EU countries
In recent years South Africa has joined the BRIC group of leading developing economies, signing a Memorandum of Understanding on science and technology collaboration226. While interviewees agreed this was politically significant as South Africa positions itself as a global actor, no‐one considered that science and technology collaboration with its BRIC partners would offer South Africa the same level of support and investment, nor the same opportunities as currently presented by the EU. It was doubted whether this would change in the medium‐term. On an individual level, South African researchers continue to be attracted to the EU (and developed economies in general) by a
222 ttp://www.southafrica.diplo.de/Vertretung/suedafrika/en/08__Science__Environment/Science/Res__coop/Res__ccop__with__SA.html 223 http://www.enerkey.info/ 224 http://www.sasscal.org/ 225 http://www.ambafrance‐rsa.org/F‐SATI‐the‐French‐South‐African 226 http://www.brics5.co.za/about‐brics/

Geographical expansion of the EURAXESS‐Links Network Final Report 28 February 2014
118
mixture of the higher salaries available in (Western) European research institutions and the quality of expertise and research infrastructure available there.
To a certain extent South Africa intends to play a leading role in collaborating with its African neighbours. Young researchers from (particularly, southern) Africa are attracted to South Africa by the opportunities it offers in terms of research infrastructure and better access to funding. Interviewees agreed that if the Euraxess network could work anywhere in Africa it would be in South Africa, with several highlighting the role that South Africa was able to play in acting as a bridgehead to the rest of the African continent. Evidence such as the number of papers on which African scientists have collaborated underscore the importance of South Africa as a regional hub (Figure 20).
Figure 20: Research collaboration by paper in Africa (2004‐2008)227
Source: Thomson Reuters Global Research Report: Africa (2010)
Policy strategies
EU policy strategies
Since 1995 the EU's annual financial commitments to South Africa have averaged €125 million, with programmes focused on health, primary education and job creation228. As the EU increasingly focuses its development funding on the world's poorest countries, there is a debate as to whether upper middle‐income countries like South Africa should continue to receive financial support from 2014.
South Africa is the fifth most successful country in accessing EU Framework Programme (FP7) research funding. The EU and South Africa also work together on a range of high profile science and technology research projects with other global partners. These include:
• Astronomy: several interviewees explained that astronomy is the research field most attractive for foreign researchers. South Africa hosts the Southern African Large Telescope
227 This analysis counts all the collaborations between countries represented by co‐authorship on the publications collated from within the Thomson Reuters Web of Science. The counts are by paper not by number of researchers. For example, a paper co‐authored by two researchers from Ghana, three from Nigeria and one from Kenya counts as a single paper in each country’s total and as one link between each pair of countries. 228 International development cooperation with South Africa is financed from the EU's Development Cooperation Instrument.

Geographical expansion of the EURAXESS‐Links Network Final Report 28 February 2014
119
(SALT) and won the bid to host the Square Kilometre Array (SKA) telescope (together with Australia) whose core will be constructed in South Africa’s sparsely populated Northern Cape Province.
• The Group on Earth Observations (or GEO) coordinates international efforts to build a global system to facilitate access to earth observation data for nine priority areas including natural and human‐induced disasters, environmental sources of health hazards and energy management.
• South Africa works with the EU in the European & Developing Countries Clinical Trials Partnership (EDCTP) aims to accelerate the development of new or improved drugs, vaccines, microbicides and diagnostics against HIV/AIDS, tuberculosis and malaria, with a focus on clinical trials in sub‐Saharan Africa.
Member State policy strategies (identified privileged partnerships/relationships)
The Member States’ policy strategies towards S&T cooperation with South Africa vary. The United Kingdom (widely recognised by all interviewees as the leading European partner for South African researchers, and the country with which South Africans most frequently partner under FP7) has generally left its institutions to forge their own links with South African partners, rather than relying on its bilateral agreements. For historical as well as linguistic reasons, links between the two countries are strong. This approach has changed more recently, however, as the UK increases its commitments to space science projects on which it frequently partners with South African institutions, structuring this cooperation around a bilateral agreement.
Germany, another leading partner for South Africa, has invested considerably in its bilateral relations. The importance of South Africa as an export market for German companies (some of which maintain their own research facilities in South Africa) brings a focus to research collaboration activities. As Horizon 2020 gets underway it seems likely that this research cooperation including businesses will only increase.
In recent years, EU Member States have prised their own links with South Africa, above those of the Union as a whole, particularly as the Eurozone entered a period of economic crisis from 2008. Countries have prioritised their own economic interests, focussing their cooperation on industrial sectors in which they have traditionally been strong, rather than seeking to coordinate their efforts.
From a South African perspective, greater cooperation would be welcome, with a recent report concluding that better coordination between the EU’s Member States would have a positive impact on the efficiency of all cooperation activities between South Africa and Europe229. This would help South African institutions to forge stronger links with their European counterparts, enabling them to compete better for funds under Horizon 2020.
229 Review of the Science and Technological (S&T) cooperation Agreement between the European Union and South Africa (January 2014)

Geographical expansion of the EURAXESS‐Links Network Final Report 28 February 2014
120
South Korea Introduction
Background information
• Population: 50,004,000 (2012)230
• GDP (absolute value and per capita in EUR)
o In absolute value: US $ 1 129 598.3 mill (2012)231
o Per capita (PPP): US $ 30 970.0 (2012)232
• Expenditure on R&D as percentage of GDP: 3.74% (in 2010)233
• Brief description of the country relation with the EU
Since 2010, the EU and South Korea have upgraded their relationship to a Strategic Partnership, ensuring a high level of commitment from both sides. Relations are governed by two key agreements, as well as more specific agreements in several fields.
The EU and South Korea are important trading partners. South Korea is the EU's tenth largest trade partner, and the EU is South Korea's fourth export destination (after China, Japan and the US).
The most relevant achievement in EU‐South Korea relations is probably the Free Trade Agreement (FTA) entered into force in 2011.
Additional areas of cooperation (beside S&T) include human rights, non‐proliferation of weapons of mass destruction, counter‐terrorism, as well as climate change and energy security.
The R&D landscape in South Korea
Background information on S&T policies
Research plays a very significant role in South Korea policies for economic growth. Such an interest dates some decades back, as the country has focussed its policies for economic development and growth after the deep economic crisis of 1997.
A major part of South Korea’s scientific development strategy was the creation in 1999 of the “21st Century Frontier R&D program”, launched as part of a national plan called the “Long‐term Vision for Science and Technology Development Toward 2025.234” It involves 23 projects aimed, over a 10‐year period, to significantly develop core technologies that hold commercial potential, including
230 Data refer to 2012 (last available year). Source: World Bank 231 Data refer to 2012 (last available year). Source: World Bank 232 Data refer to 2012 (last available year). Source: World Bank 233 Data refer to 2010 (last available year). Source: World Bank 234 http://www.google.be/url?sa=t&rct=j&q=&esrc=s&frm=1&source=web&cd=1&cad=rja&ved=0CCsQFjAA&url=http%3A%2F%2Fwww.eclac.cl%2Fiyd%2Fnoticias%2Fpais%2F8%2F31518%2FCorea_doc_2.pdf&ei=nQ3wUtWwF_GS0AXZ9YDoCA&usg=AFQjCNGWSd6tbIRKVgb‐nVnlzuK8cwrRKA&sig2=OzmLAxltG‐gfRqosQwotKQ
Geographical expansion of the EURAXESS‐Links Network Final Report 28 February 2014
121
nanotechnology, space technology and bioscience. Each of these projects benefits from funds of at least USD1 million.
A second, parallel plan was introduced by the government in 2003, which identified ten “growth engine industries for the future”, ranging from biomedicine to next‐generation semiconductors and intelligent robots. The core technologies upon which these industries depend were allocated a share of up to 50% of total public R&D investment.
The latest development in this area is the new ambitious ”Vision for Creative Economy and People Happiness with Science Technology and ICT” launched in February 2013235. Under this vision, the Ministry of Science, ICT and Future Planning (MSIP) is pursuing a strategy based on the following five points:
1. Establishing a Creative Economy System;
2. Strengthening National R&D and Innovation Capacity;
3. Promoting SW and Content Industry as the Core of the Korean Economy;
4. Promoting International Cooperation and Globalization:
5. Developing Science and Technology for the Happiness of the People.
The priorities currently identified by the government for scientific and technological research are the fields of biotechnology, healthcare, engineering sciences, new materials, aerospace, nuclear energy, oceanology, and advanced technologies. Fundamental research has recently also received a funding boost, to now reach a quarter of all public spending on R&D, aimed to improve the country’s poor showing in terms of scientific output measured against economic strength.
Such ambitions on research‐driven economic growth are sustained by massive investments in R&D, both by the government and by the private sector. In 2010, Korea’s gross domestic expenditure on R&D was €30,161m (KRW 43.8t), which accounted for 3.74% of GDP. The figure increased from €26,066m (KRW 37.9t) and 3.57% in 2009, €23,726m (KRW 34.4t) and 3.37% in 2008, €21,527m (KRW 31.3t) and 3.21% in 2007, €18,086m (KRW 27.3t) and 3.01% in 2006, and €16,612m (KRW 24.2t) and 2.79% in 2005. Business sector R&D intensity (BERD as % of GDP) also increased to 2.80 in 2010 from 2.09 in 2005. The Republic of Korea ranked 7th in Gross Expenditure on R&D (GERD) and 3rd in GERD per GDP in the world in 2008. Amongst the national GERD, private sector took up 71.8% in 2010 and 75% in 2005236.
According to the five‐year plan, the Ministry of Strategy and Finance (MOSF) has allocated the government budget on R&D to five areas as follows:
• Development of basic and original technology
‐ increasing the volume of R&D investment on this area to the total government R&D budget by 50% in 2012 from 25% in 2008;
‐ enhancing the number of small scale basic research including young individual researchers in universities;
‐ promoting the development of core original technology through collaboration between industry, university and public research organisations;
• Development of new growth‐generation industries in the foreseeable future
‐ fostering new industry such as green car, next generation Wise Ship; 235 Ministry of Science, ICT and Planning, “The Vision for Creative Economy and People’s Happiness with Science, Technology and ICT”, February 2013 236 Data from OECD, Main Science and Technology Indicators 2011
Geographical expansion of the EURAXESS‐Links Network Final Report 28 February 2014
122
‐ supporting technology‐ based SMEs;
‐ strengthening R&D investment in knowledge‐based service industry such as cultural contents, and design;
• Stimulation of Korea’s low carbon green growth through investment in green technology
‐ Enhancing investment in development of eco‐friendly new renewable energy and green energy such as solar and hydro‐fuel batteries and LED;
• Enlargement of international collaboration
‐ attracting globally talented researchers, nurturing world class universities and enlarging collaborative research with foreign research organisations;
• Enhancement of efficiency and effectiveness of R&D investment
‐ increasing institutional funding for government‐supported research institutes by more than 70% by 2011;
‐ Improving R&D management both removal of unnecessary regulations
R&D budgets of the ministries are distributed to each research group of Government‐supported Research Institutes (GRIs), universities and industry based on projects selected through competitive tendering. Each ministry has organisations that are responsible for planning, selecting and evaluating R&D projects and proliferating R&D outcomes.
The Korean policy mix aiming to stimulate greater private R&D investment includes a variety of instruments. A matching fund system for R&D performing firms has been strengthening since 2000s. The Korean government has also been providing diverse tax incentives to promote private sector’s R&D investment and innovation activities such as:
• deduction of income and corporate tax as much as a certain percentage (25% for SMEs and 3~6% for non‐SMEs) of research and human development cost related to general R&D activity;
• deduction of income and corporate tax as much as a certain percentage (30% for SMEs and 20% for non‐SMEs) of research and human development cost related to new growth engines and core technology development R&D activities;
• deduction of income or corporate tax as much as 10% of money invested in research and human development facilities; exemption of local tax on real estate owned by corporate in‐house R&D institutes;
• deduction of income or corporate tax as much as 7% of technology acquiring cost until 2012; 50% cut of income tax of foreign experts until 2012; and
• no tax charge on researcher’s income acquired by research activity within 130 euro.
Resulting from those policy instruments as mentioned above, the number of corporate in‐house R&D centres has increased from 13,324 in 2006 to 21,162 in 2010. Among them, the number of in‐house R&D centres in SMEs has also increased from 12,398 in 2006 to 20,047 in 2010.

Geographical expansion of the EURAXESS‐Links Network Final Report 28 February 2014
123
S&T Human Resources
Since 2006, South Korea recognised the importance of S&T Human Resources, and the Korean government came up in 2006 with the Basic Plan for Promoting S&T Human Resources over the period of 2006‐2010. The core programmes for HRST development include:
1. Promoting the world‐class research‐oriented universities;
2. Promoting research capabilities of S&T postgraduate students;
3. Promotion of efficient allocation and utilisation of HRST through tripartite (industry‐academia‐research) exchange programs;
4. Improvement of HRST’s welfare and research environments;
5. Promoting lifelong education system for HRST etc.
In the early 2011, MEST announced “The Second Basic Plan for Nurturing Human Resources in Science, Engineering and Technology over the period of 2011‐2015”237. The core programmes for HRST development include:
• Strengthening understanding, interest and potential of elementary, middle and high school students regarding science and technology through modification of textbooks for promoting STEAM (science, technology, education, arts and mathematics) education and smart class and so on;
• Promotion of world class research‐oriented universities with global research capability through more incentives for the selected universities in competitive funding process more participation of researchers in GRIs in education using their qualified infrastructure and making more stable research environment for GRIs to attract talented HRST.
• Strengthening counter capability for industrial demand for HRST and promoting world class research institutes in business enterprise sector;
• Enhancing the use of potential HRST such as human resources in foreign countries, women and retired scientists and strengthening HRST policy infrastructure.
Immigration policies
According to the stakeholders interviewed, immigration policies in South Korea are relatively open. European citizens do not need a visa to enter the country if the length of stay does not exceed 90 days.
Those seeking short term stay for travel/transit, medical treatment, visiting relatives, a major sporting event, attending conferences, various cultural or artistic events, religious ceremony, or other similar reasons need to apply for a specific visa (C‐3).
None of the two procedures above allows visitors to perform any economic activity. Those require a business visa.
Policies related to mobility and international attractiveness
As a means to attract high calibre scientists and engineers from overseas countries, the NRF has operated full‐fledged programmes as follows:
• World Class University (WCU) programme for attraction of renowned foreign researchers as full‐time professors or leading researchers with €534.4m in total for five years until 2012;
237 http://ec.europa.eu/enterprise/policies/innovation/files/countryreports/korea_en.pdf

Geographical expansion of the EURAXESS‐Links Network Final Report 28 February 2014
124
• Providing post‐doctoral students of developing countries with costs of living and others financial support for 6 months‐1 year;
• Providing renowned foreign scientists with costs of living in Korea for 10days to 3months to build networks;
• Attraction of foreign research centres to conduct joint research with financial and managerial benefits.
The Korea Institute for Advancement of Technology (KIAT) has supported companies for employment of foreign engineers, issuing a gold visa to easily get a job in Korea, training Korean and helping living conditions with a counselling centre. The Ministry of Justice has introduced an on‐line visa programme for high calibre overseas human resources, the Human Net KOREA programme. It also announced the legislation of a new law, which grants the right of residence to those overseas expert human resources dwelling in Korea possessing high calibre and capability.
In addition, many GRIs have managed post‐doctoral programme for foreign students and scientists and some of them have employed directly renowned foreign researchers with high salary and good living conditions.
Recently the Ministry of Education has encouraged open recruitment for staff in universities and the GRIs. Any non‐nationals are now eligible in competitions for permanent research and academic positions. There is no simple and clear system or measures in place for the recognition of professional qualifications.
In case of foreign doctoral students, universities and the GRIs also have open recruitment and grants system supported by the NRF. The research grants are not portable. These types of recruitment for foreign doctoral students are conducted usually through global networks of universities and the GRIs. Universities and the GRIs try to keep individual researchers and organisations in their global networks posted the information on the supporting system of the NRF or to ask them to propose directly to universities and the GRIs who have their own supporting system for foreign doctoral students.
The Korean High Education Institutions and the GRIs have operated postgraduate training programmes for Masters, PhDs, and Post‐doc diplomas with high openness to foreign students and researchers. There are national policies for universities to enlarge English spoken lectures and open doctoral programmes in collaboration with other universities and the GRIs. The 28 GRIs established the University of Science and Technology (UST) together in 2003 as an associated university with postgraduate programmes. Senior researchers in the GRIs can be assigned as professors and to teach master and doctoral students who work with them in the GRIs and get a graduate certificate from the UST. Nearly 10% of students in the UST are foreigners. There is also a concerted postgraduate programme between Korean HEIs and the GRIs. Based on the signed agreement between them, the GRIs and the universities openly recruit students who also work and learn, to participate in a project, in the GRIs. Foreign students can be an applicant for this programme.
Unfortunately, mobility schemes for national researches to move to abroad have not been developed well. Many policy experts and R&D institutes demand such kinds of policy or institutions. Some opportunities in this sense come from EU programmes.
In the second Roadmap for EU‐South Korea cooperation in S&T238, it was agreed to set up schemes that would tackle these objectives and proposed to engage in co‐financing the new Marie Curie International Research Staff Exchange Scheme (IRSES). The existing large infrastructure projects
238 European Commission, Second Roadmap for EU‐South Korea cooperation in S&T 2011‐2013
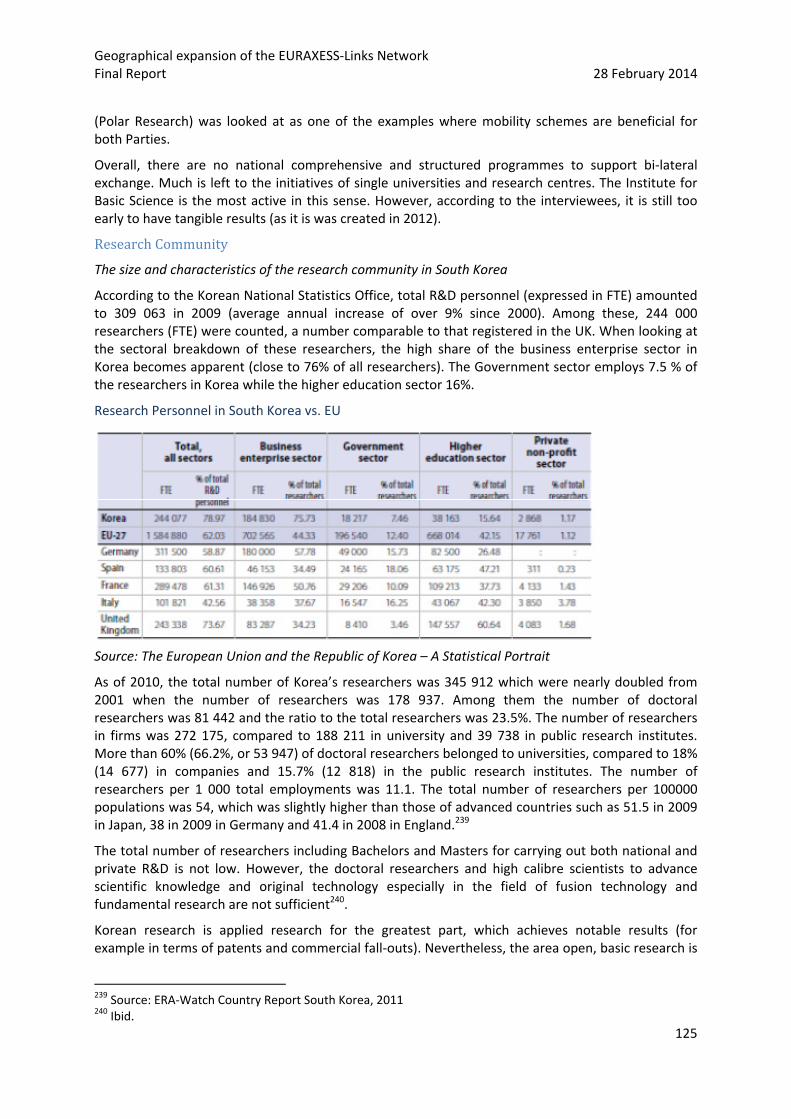
Geographical expansion of the EURAXESS‐Links Network Final Report 28 February 2014
125
(Polar Research) was looked at as one of the examples where mobility schemes are beneficial for both Parties.
Overall, there are no national comprehensive and structured programmes to support bi‐lateral exchange. Much is left to the initiatives of single universities and research centres. The Institute for Basic Science is the most active in this sense. However, according to the interviewees, it is still too early to have tangible results (as it is was created in 2012).
Research Community
The size and characteristics of the research community in South Korea
According to the Korean National Statistics Office, total R&D personnel (expressed in FTE) amounted to 309 063 in 2009 (average annual increase of over 9% since 2000). Among these, 244 000 researchers (FTE) were counted, a number comparable to that registered in the UK. When looking at the sectoral breakdown of these researchers, the high share of the business enterprise sector in Korea becomes apparent (close to 76% of all researchers). The Government sector employs 7.5 % of the researchers in Korea while the higher education sector 16%.
Research Personnel in South Korea vs. EU
Source: The European Union and the Republic of Korea – A Statistical Portrait
As of 2010, the total number of Korea’s researchers was 345 912 which were nearly doubled from 2001 when the number of researchers was 178 937. Among them the number of doctoral researchers was 81 442 and the ratio to the total researchers was 23.5%. The number of researchers in firms was 272 175, compared to 188 211 in university and 39 738 in public research institutes. More than 60% (66.2%, or 53 947) of doctoral researchers belonged to universities, compared to 18% (14 677) in companies and 15.7% (12 818) in the public research institutes. The number of researchers per 1 000 total employments was 11.1. The total number of researchers per 100000 populations was 54, which was slightly higher than those of advanced countries such as 51.5 in 2009 in Japan, 38 in 2009 in Germany and 41.4 in 2008 in England.239
The total number of researchers including Bachelors and Masters for carrying out both national and private R&D is not low. However, the doctoral researchers and high calibre scientists to advance scientific knowledge and original technology especially in the field of fusion technology and fundamental research are not sufficient240.
Korean research is applied research for the greatest part, which achieves notable results (for example in terms of patents and commercial fall‐outs). Nevertheless, the area open, basic research is
239 Source: ERA‐Watch Country Report South Korea, 2011 240 Ibid.
Geographical expansion of the EURAXESS‐Links Network Final Report 28 February 2014
126
under‐developed. The new government strategy has started to tackle the issue, and created the Institute for Basic Science (http://www.ibs.re.kr/en). According to some of the stakeholders interviewed, this Institute is by far the most active in Korea in attracting foreign researchers.
The community of foreign researchers in South Korea
There are no official data on the number of foreign researchers working and living in South Korea. All evidence collected was based on perceptions of national authorities, researchers and centres of research.
Rough estimates quantified in few hundreds the number of foreign researchers in the country, with a slight trend to increase in the latest years.
Consistently with the S&T cooperation policy of the country (see section 1.1.6 below), the largest foreign researchers community come from the US, other South Asian countries and Europe (mostly, Germany, UK, Denmark but France and Italy as well). However, it is not possible to have figures on the respective weight of those communities and their trends over time.
Arrival of foreign researchers in South Korea is linked to the presence of bi‐lateral agreements with third countries (such as the US and many European countries), which are often complemented by bi‐lateral agreements between research centres in the two countries.
Interviewees revealed that the great part of foreign researchers only stays in South Korea for a limited period of time (i.e. the percentage of permanent foreign researchers seems extremely limited). However, there are no figures available on that.
At any rate, consistently with the overall research structure of South Korea, many of them work in private sector research organisations, often linked to the research labs of the main Korean firms (especially in the technological area).
Many researchers (both national and foreigners) work and live in Seoul and in the surrounding areas, where the main part of the research facilities and laboratories are located. Nevertheless, a small but not negligible portion works in different areas of the country, where sort of technological clusters or hubs are located.
The only quantitative indicators available are proxies, such as the number of foreign doctoral students. According to the OECD, the number of foreign doctoral students in Korea has increased to 6.7 % in 2009 from 1.2% in 1998 (OECD, 2011). They mainly have come from India, Vietnam and other the Third world countries in Asia in order to study and take part in a project while studying. Recently, high level of qualified researchers to be hired by universities and GRIS and joined a project as a researcher has increased. However, more doctoral students and post‐doctoral scientists have gone abroad, especially to the USA and got jobs as a researcher in universities and private companies. According to IMD in 2011, Korea’ brain drain index was 3.68, 44th in the world. The outflow versus inflow rate of high calibre S&T human resources is 11.68, which is the second largest amongst the OECD member countries. Such kind of unbalanced ratio between outflow and inflow of the HRST is a serious matter241. The relevance of the brain drain phenomenon was mentioned also by the stakeholders interviewed, who commented that this is now considered as an issue by the government, which has started to take action.
Perceived needs of the research community in South Korea
A few issues were mentioned during the interviews as problems hampering cooperation with the EU. Many of them concerned the Intellectual Property Rights (IPRs) of products created under joint research programmes and related contractual issues, and the difficult understanding of different provisions under the legislative systems of EU Member States.
241 Ibid.
Geographical expansion of the EURAXESS‐Links Network Final Report 28 February 2014
127
Another relevant issue is the structure and timing of Korean research programmes, which often hampers the participation to multi‐lateral joint programmes. The Korean cycle for presenting programmes (and obtaining approval and funding) is quite rigid, and often non‐compatible with the EU mechanisms. Usually, projects have to be presented during the first half of the year, and the carried out during the second semester of the year. This cycle often conflicts with the multi‐annual approach of the FP7, hampering higher participation from Korean institutions. The EU research evaluation system (based on ex‐ante and ex‐post evaluation) is perceived as more rigorous and worth pursuing, according to many of the interviewees. Nevertheless, its co‐existence with the Korean one is still quite complex (as it is the change of the current Korean system).
Finally, the administrative burden to participate and carry our research projects under the FP7 is perceived as long and burdensome by Korean researchers and their institutions, notably decreasing any incentive to participate.
Key expectations/problems related to the mandate of EURAXESS Links
Overall, Korean researchers are quite attentive to mobility and proactive in searching for and pursuing opportunities to work and live abroad. Interviewees affirmed that the average level of awareness of EU research programmes and opportunities within the Korean research community is good, but mostly thanks to the proactive attitude mentioned before. On the contrary, direct activities (such as presentations, networking events, etc.) to spread this knowledge are less numerous than the optimal. This is in good part to the lack of available resources (for instance at the EU Delegation to South Korea).
When confronted with the possibility, interviewees agreed on the added value of an office that would better connect European and South Korean researchers (it has to be noticed that awareness of EURAXESS Links was quite low among researchers). Interviewees indicated that the added value of EURAXESS Links was mainly the potential of:
• Consolidating all information available on cooperation and mobility opportunities between the EU and South Korea;
• Strengthening the cooperation in areas of scientific activities where Korea is currently lagging behind other developed countries, such as basic research;
• Providing access to support and advice on various administrative issues related to immigration policies and procedures for entering European countries;
• Supporting and advising Korean researchers on procedures for applying to EU FPs, reducing thus the complexities of a system perceived as burdensome and very different from the national practices;
• Introducing in the country a more rigorous system for evaluating and funding research, based on ex‐ante and ex‐post evaluation and on longer time‐horizons than the national current practices.
Collaboration
Korea’s development of science and technology has long continued to have close relations with the US. The first GRI in Korea is the Korea Institute of Science and Technology (KIST242) which was established with the support and consulting of the US. The majority of Korean students who wanted to undertake postgraduate studies have done do in the US. The US has long been the strongest ally in both economic and political terms.
242www.kist.re.kr
Geographical expansion of the EURAXESS‐Links Network Final Report 28 February 2014
128
Recently, the situation has started to change due to the need for enhancing a more open innovation paradigm pursuing efficient and speedy development with more partners abroad for R&D in science, technology and innovation. In particular, most of the EU countries have become strategic partners with recognition of their strong capability of science and technology. The majority of R&D investment of the Korean government was considered to have shifted too much to the area of economic development and industrial growth. On the contrary, the EU was perceived as successful in balancing economic growth and quality of life. Furthermore, it was considered to have developed more efficient research and innovation systems than those in Korea. Therefore, South Korea decided to partially shift the focus of its S&T cooperation policies towards Europe.
The increasing participation in the FP and EUREKA programmes and bi‐ and multi‐lateral agreements, including the Korea‐EU Free Trade Agreement, are clear evidence of this change.
Many Korean researchers in the GRIs and universities have also tried to build collaborative relations with many European countries thorough joint projects and partnerships as well as participating in the FP and EUREKA. The European countries have endeavoured to establish ties with Korea, which has some strength in research and innovation systems. There has been a tendency to strengthening interactions between researchers in Korea and the EU. Even though the partnerships are still in an early stage, such kinds of mutual interests will enhance the pace and depth of building partnerships and positive outcomes.
Finally, South Korea is pursuing a policy of support and cooperation (including in the field of S&T) with neighbour countries from South Asia, especially developing one such Thailand and Vietnam.
Level of S&T cooperation between the EC and South Korea
In 2006 the European Community and the Government of the Republic of South Korea concluded an S&T agreement, which became effective in 2007. Both parties agreed to carry out a review of progress achieved once the agreement had been in place for five years.
Broadly speaking the agreement refers to mutual access to programs on an equitable basis as well as the timely sharing of relevant information. It requires that both South Korea and the European Union encourage, develop and facilitate cooperative activities in S&T based on the following principles:
• Mutual and equitable contributions and benefits
• Mutual access to S&T programs, projects and facilities
• Timely exchange of relevant information
Article III of the S & T agreement refers to direct cooperative activities that may include the exchange of information on activities, policies, practices, laws and regulations concerning research and development.
Annex I of the agreement clarifies that not only that the European Union afford access to Korean organizations and individuals to the EU program, but that legal entities established in the Community may participate in the research and development projects or programs funded by the Korean Government, in accordance with their rules and regulations.
Korea seems to approach cooperation with the EU in exactly the same way as it approaches bi‐lateral cooperation with any of its other allies, for example the US, Japan, Germany, the UK, France, Denmark or Italy.
In particular, Korean partners do not seem to understand the specificity of EU programmes their role in the construction of the European Research Area for example, the role of Joint Initiatives or the

Geographical expansion of the EURAXESS‐Links Network Final Report 28 February 2014
129
concept of “variable geometry”243. Korea seems to approach basic and applied research as well as innovation and entrepreneurship as totally separate activities rather than as part of a continuum, or as activities that are somehow related and need to eventually join‐up for example through the involvement of companies, end‐users and other types of stakeholders.
Compared to other Asian countries, Korean S&T cooperation with the EU especially via the FP7 is quite low.
Participation of Asian Countries to the FP7
Source: A review of the S&T Agreement between the European Union and the Republic of Korea
The success rate of Korea (29%) is the same than for Japan, and greater than for China (26%) and India (23%). The implementation of cooperation activities has been quite low and is characterised by small amount of projects and small amount of funds. During FP6 and FP7 63 projects involved 72 Korean participations for a total cost of 805 million €, the EC contribution being 455 million € (1.67 million € to Korean partners). However, the trend is towards an increasing participation of Korea in EU programmes, as it increased around 20 times from FP6 to FP7244.
As pointed out by the last roadmap for EU‐South Korea S&T cooperation, activities focussed on five main areas:
• (Non‐Nuclear) Energy;
• Nano‐Sciences, Materials and Production (NMP);
• Information and Communication Technologies;
• Researchers’ Mobility;
• International Cooperation.
243 European Commission (2013), A review of the S&T Agreement between the European Union and the Republic of Korea 244 Ibid.
Geographical expansion of the EURAXESS‐Links Network Final Report 28 February 2014
130
As mentioned in the previous sections, dissemination activities around EU opportunities for cooperation and mobility in research are less numerous than what researchers and research institutions would like to.
In order to revert this situation, the KORRIDOR project245was launched under the FP7. The project aimed to increase public awareness of cooperation opportunities for European researchers in Korean RTDI programmes through disseminating information on existing cooperation opportunities and opening up new ones.
Building from the activities of the KORRIDOR project, the KONNECT Project246 was launched in October 2013. It aims at strengthening science, technology, and innovation cooperation between Korea and the EU and promoting innovation and the enhancement of communication for technology‐related policy dialogue (including awareness raising around Horizon 2020).
The Korean R&D system is complex and changes quickly. It seems more entrepreneurial and less methodical than the EU system, which places a lot of emphasis on formal ex‐ante and ex‐post evaluation at project, program and policy level. Keeping up with available programs is challenging even for Korean scientists. The BILAT and ERANET projects KETSCAP, KORRIDOR and KORANET have helped maintain knowledge of who is doing what, but more effort is required really know what is going on.
With increasing globalisation and for promoting cross‐border flows of knowledge, the Korean government has emphasised on international cooperation with EU through the participation in inter‐governmental schemes such as EUREKA, COST, FP7 and ERAnets. The Korean government is establishing a global open innovation system through promotion of networking and co‐projects with EU partners and pursuing strategic S&T globalisation with a view towards becoming a global S&T leader, as is stated in the S&T Basic Plan devised in 2008 and the Advancement Planning in S&T in 2010.
The KIAT has supported the EU Framework Programme (FP) activities and EUREKA with a view towards encouraging researchers’ participation. A research team participated the consortium with EU countries is taken between €0.130m and €0.324m each year for three or five years.
Level of S&T cooperation between individual Member States and South Korea
South Korea has a series of bi‐lateral agreements with many EU Member States (17 bi‐lateral agreements with EU Member States). The main partners in the field of S&T cooperation are Germany and UK.
Germany
Germany is one of Korea’s most important trade partners ($20B trade volume in 2009). There are many agreements between German and Korean institutes and universities that date back decades, and others more recent247.
A bi‐lateral agreement between governments exists since 1986, signed between the Federal Ministry of Education and Research (BMBF) and the Korean MEST. Many German companies have subsidiaries and research laboratories in South Korea (such as Merck and Bosch), while Korean GRIs have a campus in the country (such as the KIST). Also German research institutions have bi‐lateral agreements with South Korean research centres as well as joint laboratories in Korea, such as the Fraunhofer and Max‐Plank Institutes.
245 http://www.access4.eu/southkorea/230.php 246 http://ec.europa.eu/research/iscp/pdf/newsletter/newsletter_number_38_october_2013.pdf 247 KIST Europe, Annual report 2012

Geographical expansion of the EURAXESS‐Links Network Final Report 28 February 2014
131
Germany hosts 5 000 South Korean students at any one time (the largest of any Asian country in Germany).
There is great demand to cooperate with Germany on nano‐technology research. Korea may be a future candidate for increased basic research cooperation. Korea is a producer of primary nano‐materials, there is an interest on nano‐safety, characterisation and related technologies.
In 2010 the BMBF established joint German‐Korean structures for research on:
• Algae Biotechnology (Berlin University of Technology and Dongseo University in Pusan)
• Bio‐nano composites (JINBiT = University of Munster and Gwangju Institute of S&T)
UK
S&T Cooperation agreement was signed between Governments in June 1985.
Currently, bi‐lateral cooperation involves several different research areas, including: Bio‐nanotechnology, Energy, Risk Management, Hydrogen Storage, Global Navigation and Satellite Systems, Life Sciences, Polar Research, Food Safety, Environmental Technology, Material Research, Mathematics, women in science, science museums.
The S&T agreement is currently under revision and the new one will be signed in 2014. The new bi‐lateral S&T agreement will include the following areas (some of which will be maintained from the previous agreement):
• Energy research;
• Brain sciences and neuro‐sciences;
• Degenerative diseases (especially those linked to ageing like Alzheimer);
• Big data and Open data;
• Healthcare and personal devices for health monitoring.
The UK Science and Innovation Network has an office with three people in Korea, supporting bi‐lateral cooperation.
Among British companies present in South Korea, Rolls Royce has a joint research centre at Pusan National University involving Lloyds Register Education Trust and the University of Liverpool.
Korean firms doing research in the UK include Samsung Advanced Institute of Technology at Imperial College, POSCO at Sheffield and LG Life Sciences at the University of Aberdeen. The SAMSUNG Global Research Outreach program funds 30‐40 projects in Europe.
Human Mobility based on the Chevening Scholarship program involved 800 Koreans so far, while four UK academics participated in the MEST World Class University Program.
Many bottom‐up agreements between institutions exist:
• KIAT under the Global Industry Academia Program, where each year a new university is selected and which was promoted through the EU program KORRIDOR,
• The UK‐Korea Neuroscience program involves the Korean Brain Research Centre and Sheffield, Bristol and Manchester Universities,
• The UK‐Korea Alzheimer’s Consortium involves Cambridge and Bristol Universities.
Level of S&T cooperation between South Korea and non‐EU countries
The US are the oldest and main partner of South Korea, for historical, geo‐political and commercial reasons.

Geographical expansion of the EURAXESS‐Links Network Final Report 28 February 2014
132
The two countries established the global green growth cooperation partnership (smart grid) and the Korea‐US summit global issue cooperation partnership (climate change, staving off poverty, etc.) through the Korea‐US summit meeting held in June 2009. Korea’s development of science and technology has long continued to have close relations with the US. The first GRI in Korea is the KIST which was established with the support and consulting of the US. The majority of Korean students who wanted to undertake postgraduate studies have done do in the US. The US has long been the strongest ally in both economic and political terms.
Since 1990s, Korean government has tried to expand global partners to Japan, China, India, Brazil and Russia and developing countries. The G20 Seoul summit is a good example of recent approach for multilateral summit diplomacy. Korea served as a chair country for the Summit and addressed the issue of strengthening science and technology cooperation in diverse areas with countries such as Russia and India. The Korean government has also made strategic endeavour to strengthen multilateral cooperation with East Asian countries to solve such problems as climate and environment within the region and to widen reciprocal cooperation with developing countries such as Vietnam, Uzbekistan and Brunei and the like.
Policy strategies
EU policy strategies
Relevance for the EU248
South Korea a top global provider of a wide range of consumer electronic goods ‐ mobile phones, tablets, cameras, video recorders and TV sets. These are produced by companies such as Samsung and LG. Companies such as Hyundai and Daewoo are important producers of cars and other vehicles. In addition, South Korea is a major exporter of construction services.
The great industrial groups of South Korea account for a large part of Korean industrial output. Their subsidiaries in Europe work with European centres of excellence such as the DTU of Denmark, Fraunhofer of Germany, and Manchester University of the UK. They are present in EU industrial clusters such Cosmetic Valley a region close to Paris that includes the cities of Orleans and Chartres. Their suppliers include many European companies both large and small.
South Korea is now developing the infrastructure needed to support its “growth engines”, for example clusters, science parks, incubators and venture capital, as well as the global knowledge networks needed to feed into this. In parallel with this, it has started to develop its own capacity for creative research in basic science and new technologies. One of the main initiatives to achieve this has been the establishment of the IBS or Institute for Basic Science.
South Korea has recently emerged as a leader on green development issues. It promotes a vision of growth that emphasizes resource efficiency, quality of life and respect for the environment. It launched the Global Green Growth Initiative249, intended to boost the growth of developing economies in a sustainable manner. This has earned the support of EU member states such as Denmark and the UK.
These inter‐related, mutually reinforcing initiatives are part of a larger plan for Korea to become a global leader in green technologies, a market they consider to be worth as much as €2Trillion per year by 2020. Korea plans to commit as much as 2% of annual GDP for the “green reorganization” of its economy.
All these activities create opportunities for Europe and its Member States.
248 European Commission (2013), A review of the S&T Agreement between the European Union and the Republic of Korea 249 http://gggi.org/

Geographical expansion of the EURAXESS‐Links Network Final Report 28 February 2014
133
Member State policy strategies (identified privileged partnership/relationships)
Germany
Germany has a strong position in nano‐technology research, an area that Korea wants to develop as part of the efforts in basic research. Furthermore, Germany is an example of cluster‐based economic development.
Another field in common interest is that of green energy. Germany has committed to quit nuclear energy production by 2020. South Korea is massively investing into green energy research, as it represent a potential immense future market. Therefore, cooperation and synergy in the area are of mutual interest.
UK
Besides historical ties and linguistic reasons, cooperation between UK and South Korea rests on common interests in the fields of green energy and neuro‐sciences, as well as neuro‐degenerative diseases linked to an ageing population (such as Alzheimer).
Geographical expansion of the EURAXESS‐Links Network Final Report 28 February 2014
134
2 Annex 2 – Secondary data 2.1 EU-wide / European Commission, DG RTD / International organisations
• A study of European Researchers working in and collaborating with China, In preparation for the launch of EURAXESS‐Link China, July 2008.
• A survey of European Researchers in Japan, In preparation for the launch of ERA‐Link Japan, November 2007.
• A survey of potential users of European Researchers Abroad Link (ERA‐Link), a communication tool for European researchers in the US, June 2005.
• Evaluation of the EURAXESS Project (2008 – 2012), June 2013.
• EURAXESS ‐ Communications Strategy 2010 & beyond, May 2010.
• EURAXESS‐Links Abroad (ELA) Geographic Expansion‐ Feasibility study, June 2009.
• EURAXESS Links, Key Messages, ‐for EURAXESS LINKS REPRESENTATIVES‐.
• EURAXESS Links, Modus Operandi of the Links Representatives, Brussels, 11 April 2013.
• EURAXESS Links Monthly reports, 2010, 2011, 2012.
• European Research Area Committee, Strategic Forum for International S&T Cooperation, Second Report of Activities of the Strategic Forum for International S&T Cooperation (SFIC), ERAC‐SFIC 1353/11, Brussels, 19 May 2011.
• European Research Area, A Strategic European Framework for International Science and Technology Cooperation, Communication from the Commission to the Council and the European Parliament, COM(2008)588 final of 24.09.2008, EUR 23607 EN.
• MORE2 Study on Mobility Patterns and Career Paths of Researchers, 2013.
• Researchers Report 2013.
• Scientific and Technical Research Committee, Strategic Forum for International S&T Cooperation, Work Programme SFIC 2011‐2012, Brussels, 28 June 2011.
• Erawatch ‐ Platform on Research and Innovation policies and systems: http://erawatch.jrc.ec.europa.eu/
• EU External Actions, EU delegations: http://www.eeas.europa.eu/delegations/index_en.htm
• EURAXESS Researchers in Motion: http://ec.europa.eu/euraxess/index.cfm/services/researchPolicies
• Research & Innovation, International Cooperation: http://ec.europa.eu/research/iscp/index.cfm
• World Bank (for statistics on background information such as population and GDP):
o http://data.worldbank.org/indicator/SP.POP.TOTL
o http://data.worldbank.org/indicator/NY.GDP.MKTP.CD
o http://data.worldbank.org/indicator/NY.GNP.PCAP.PP.CD/countries
• OECD (for statistics on background information such as population and GDP):
o http://www.oecd‐ilibrary.org/economics/country‐statistical‐profiles‐key‐tables‐from‐oecd_20752288 (Peru and Argentina are not covered)

Geographical expansion of the EURAXESS‐Links Network Final Report 28 February 2014
135
o http://www.oecd‐ilibrary.org/economics/country‐statistical‐profiles‐key‐tables‐from‐oecd_20752288 (Peru and Argentina are not covered)
• UNESCO:
o http://www.oecd‐ilibrary.org/sites/rdxp‐table‐2013‐1‐en/index.html?contentType=/ns/Table,/ns/StatisticalPublication,/ns/KeyTableEdition&itemId=/content/table/rdxp‐table‐2013‐1‐en&containerItemId=/content/table/2075843x‐table1&accessItemIds=/content/tablecollection/2075843x&mimeType=text/html (Peru and Argentina are not covered)
• Data on researchers’ community are available via:
http://www.oecd.org/innovation/inno/oecdunescoinstituteforstatisticseurostatcareersofdoctorateholderscdhproject.htm (a joint project carried out by OECD, UNESCO and Eurostat)
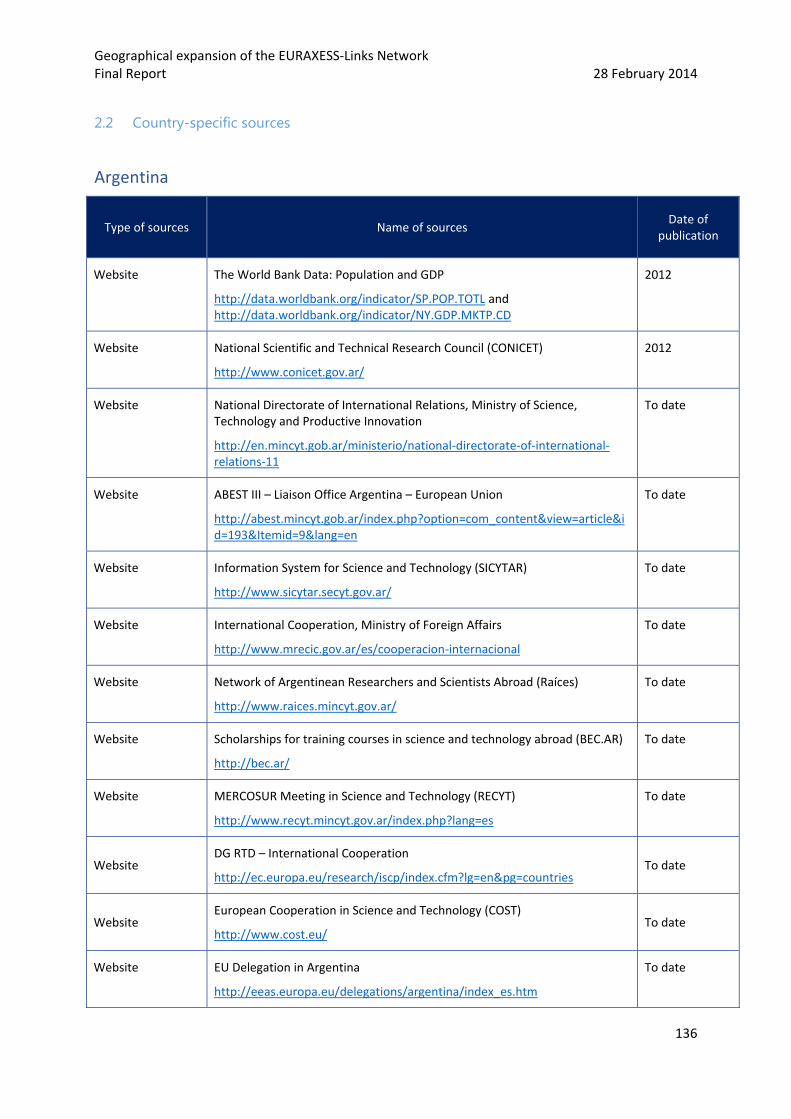
Geographical expansion of the EURAXESS‐Links Network Final Report 28 February 2014
136
2.2 Country-specific sources
Argentina
Type of sources Name of sources Date of
publication
Website The World Bank Data: Population and GDP
http://data.worldbank.org/indicator/SP.POP.TOTL and http://data.worldbank.org/indicator/NY.GDP.MKTP.CD
2012
Website National Scientific and Technical Research Council (CONICET)
http://www.conicet.gov.ar/
2012
Website National Directorate of International Relations, Ministry of Science, Technology and Productive Innovation
http://en.mincyt.gob.ar/ministerio/national‐directorate‐of‐international‐relations‐11
To date
Website ABEST III – Liaison Office Argentina – European Union
http://abest.mincyt.gob.ar/index.php?option=com_content&view=article&id=193&Itemid=9&lang=en
To date
Website Information System for Science and Technology (SICYTAR)
http://www.sicytar.secyt.gov.ar/
To date
Website International Cooperation, Ministry of Foreign Affairs
http://www.mrecic.gov.ar/es/cooperacion‐internacional
To date
Website Network of Argentinean Researchers and Scientists Abroad (Raíces)
http://www.raices.mincyt.gov.ar/
To date
Website Scholarships for training courses in science and technology abroad (BEC.AR)
http://bec.ar/
To date
Website MERCOSUR Meeting in Science and Technology (RECYT)
http://www.recyt.mincyt.gov.ar/index.php?lang=es
To date
Website DG RTD – International Cooperation
http://ec.europa.eu/research/iscp/index.cfm?lg=en&pg=countries To date
Website European Cooperation in Science and Technology (COST)
http://www.cost.eu/ To date
Website EU Delegation in Argentina
http://eeas.europa.eu/delegations/argentina/index_es.htm
To date
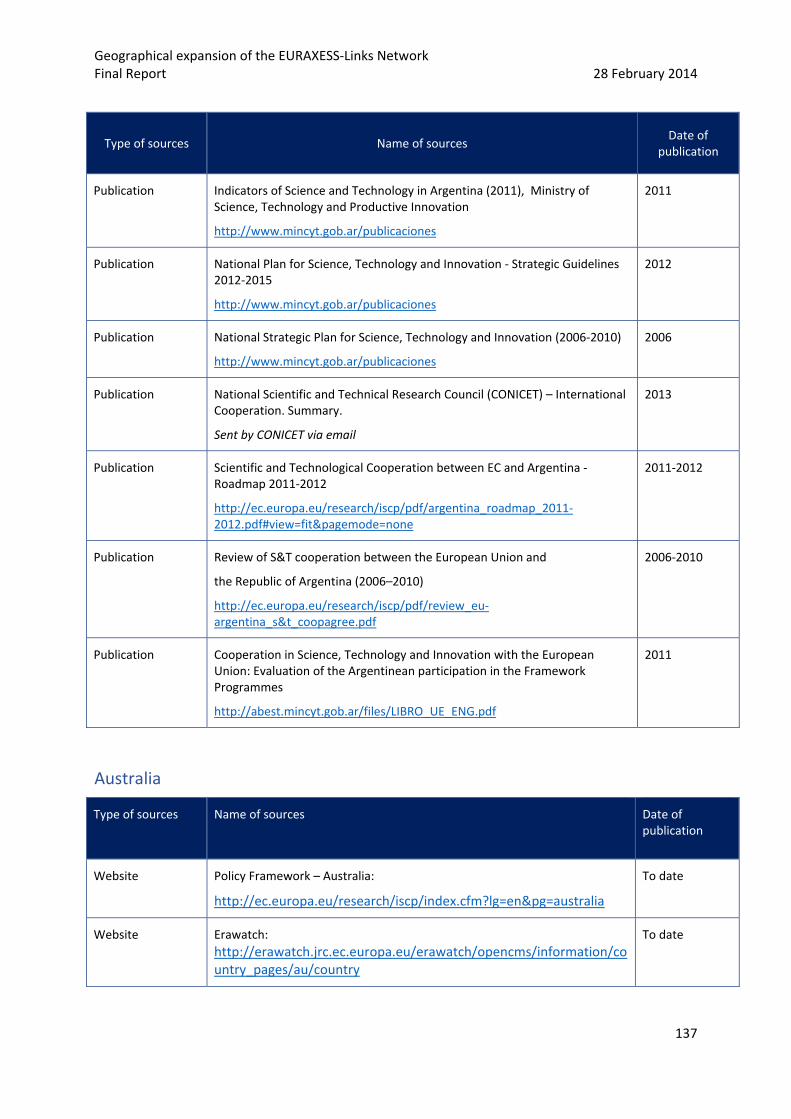
Geographical expansion of the EURAXESS‐Links Network Final Report 28 February 2014
137
Type of sources Name of sources Date of
publication
Publication Indicators of Science and Technology in Argentina (2011), Ministry of Science, Technology and Productive Innovation
http://www.mincyt.gob.ar/publicaciones
2011
Publication National Plan for Science, Technology and Innovation ‐ Strategic Guidelines 2012‐2015
http://www.mincyt.gob.ar/publicaciones
2012
Publication National Strategic Plan for Science, Technology and Innovation (2006‐2010)
http://www.mincyt.gob.ar/publicaciones
2006
Publication National Scientific and Technical Research Council (CONICET) – International Cooperation. Summary.
Sent by CONICET via email
2013
Publication Scientific and Technological Cooperation between EC and Argentina ‐ Roadmap 2011‐2012
http://ec.europa.eu/research/iscp/pdf/argentina_roadmap_2011‐2012.pdf#view=fit&pagemode=none
2011‐2012
Publication Review of S&T cooperation between the European Union and
the Republic of Argentina (2006–2010)
http://ec.europa.eu/research/iscp/pdf/review_eu‐argentina_s&t_coopagree.pdf
2006‐2010
Publication Cooperation in Science, Technology and Innovation with the European Union: Evaluation of the Argentinean participation in the Framework Programmes
http://abest.mincyt.gob.ar/files/LIBRO_UE_ENG.pdf
2011
Australia
Type of sources Name of sources Date of publication
Website Policy Framework – Australia:
http://ec.europa.eu/research/iscp/index.cfm?lg=en&pg=australia
To date
Website Erawatch: http://erawatch.jrc.ec.europa.eu/erawatch/opencms/information/country_pages/au/country
To date
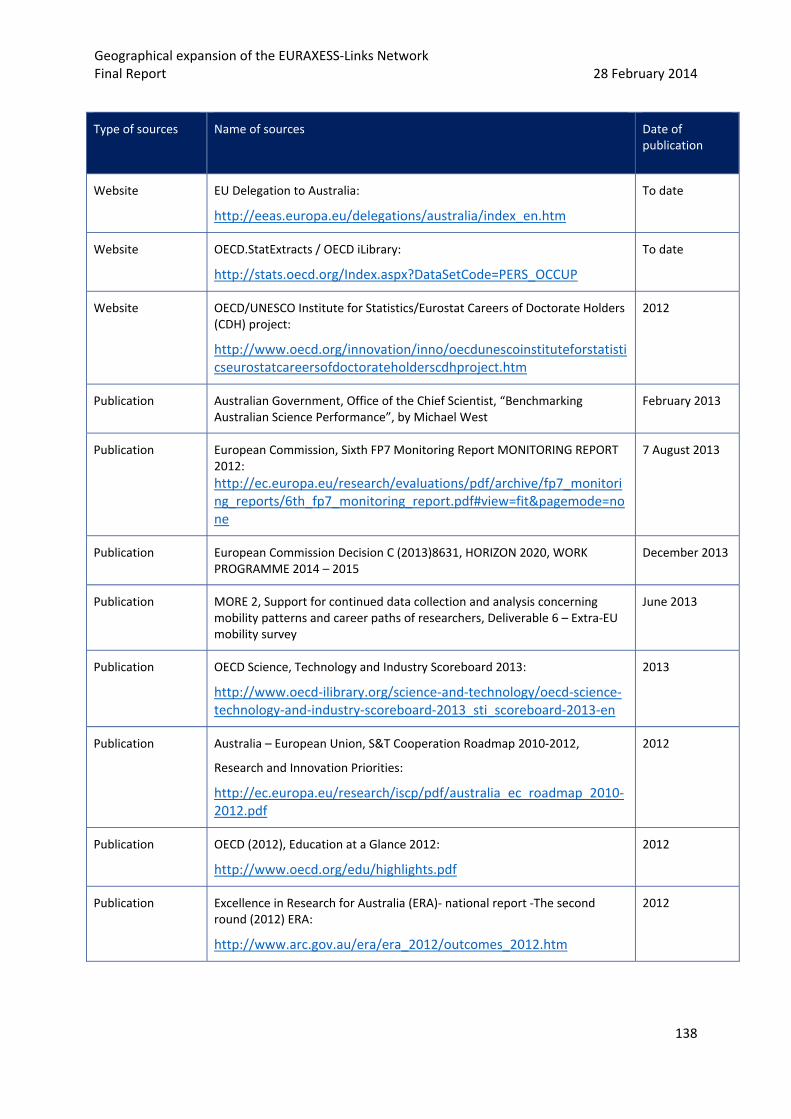
Geographical expansion of the EURAXESS‐Links Network Final Report 28 February 2014
138
Type of sources Name of sources Date of publication
Website EU Delegation to Australia:
http://eeas.europa.eu/delegations/australia/index_en.htm
To date
Website OECD.StatExtracts / OECD iLibrary:
http://stats.oecd.org/Index.aspx?DataSetCode=PERS_OCCUP
To date
Website OECD/UNESCO Institute for Statistics/Eurostat Careers of Doctorate Holders (CDH) project:
http://www.oecd.org/innovation/inno/oecdunescoinstituteforstatisticseurostatcareersofdoctorateholderscdhproject.htm
2012
Publication Australian Government, Office of the Chief Scientist, “Benchmarking Australian Science Performance”, by Michael West
February 2013
Publication European Commission, Sixth FP7 Monitoring Report MONITORING REPORT 2012: http://ec.europa.eu/research/evaluations/pdf/archive/fp7_monitoring_reports/6th_fp7_monitoring_report.pdf#view=fit&pagemode=none
7 August 2013
Publication European Commission Decision C (2013)8631, HORIZON 2020, WORK PROGRAMME 2014 – 2015
December 2013
Publication MORE 2, Support for continued data collection and analysis concerning mobility patterns and career paths of researchers, Deliverable 6 – Extra‐EU mobility survey
June 2013
Publication OECD Science, Technology and Industry Scoreboard 2013:
http://www.oecd‐ilibrary.org/science‐and‐technology/oecd‐science‐technology‐and‐industry‐scoreboard‐2013_sti_scoreboard‐2013‐en
2013
Publication Australia – European Union, S&T Cooperation Roadmap 2010‐2012,
Research and Innovation Priorities:
http://ec.europa.eu/research/iscp/pdf/australia_ec_roadmap_2010‐2012.pdf
2012
Publication OECD (2012), Education at a Glance 2012:
http://www.oecd.org/edu/highlights.pdf
2012
Publication Excellence in Research for Australia (ERA)‐ national report ‐The second round (2012) ERA:
http://www.arc.gov.au/era/era_2012/outcomes_2012.htm
2012

Geographical expansion of the EURAXESS‐Links Network Final Report 28 February 2014
139
Type of sources Name of sources Date of publication
Publication European Union–Australia, Partnership Framework, A strategic partnership built on shared values and common ambition:
http://eeas.europa.eu/delegations/australia/documents/eu_australia/partnership_framework2009eu_en.pdf
November 2009
Publication Australia – European Union, S&T Cooperation Roadmap 2010‐2012,
Research and Innovation Priorities
To date
Publication European Union – Australia Partnership Framework:
http://eeas.europa.eu/australia/docs/australia_pfw_en.pdf
To date
Chile
Type of sources Name of sources Date of publication
Website
National Commission for Scientific and Technological Research (CONICYT)
http://www.conicyt.cl/
2012
Website
Ministry of Economy, Development and Tourism ‐ Innovation Surveys in R&D
http://www.economia.gob.cl/estudios‐y‐encuestas/encuestas/encuestas‐de‐innovacion‐e‐id/
2007 ‐ 2008
Website
Ministry of Foreign Affairs
http://www.minrel.gob.cl/minrel/site/edic/base/port/tecnologias.html
http://www.minrel.gob.cl/minrel/site/artic/20080722/pags/20080722130343.html
To date
Website Más Ciencia Para Chile
http://www.mascienciaparachile.cl/ 2010‐2013
Website International Cooperation Agency (AGCI)
http://www.agci.cl/ To date
Website National Innovation Council for Competitiveness
http://www.cnic.cl/ To date
Website Chile‐European Union STI Initiative (CEST+I)
http://www.sti‐cooperation.cl// To date
Website Scholarships for Chileans (Becas Chile), Ministry of Education
http://www.becaschile.cl/ To date
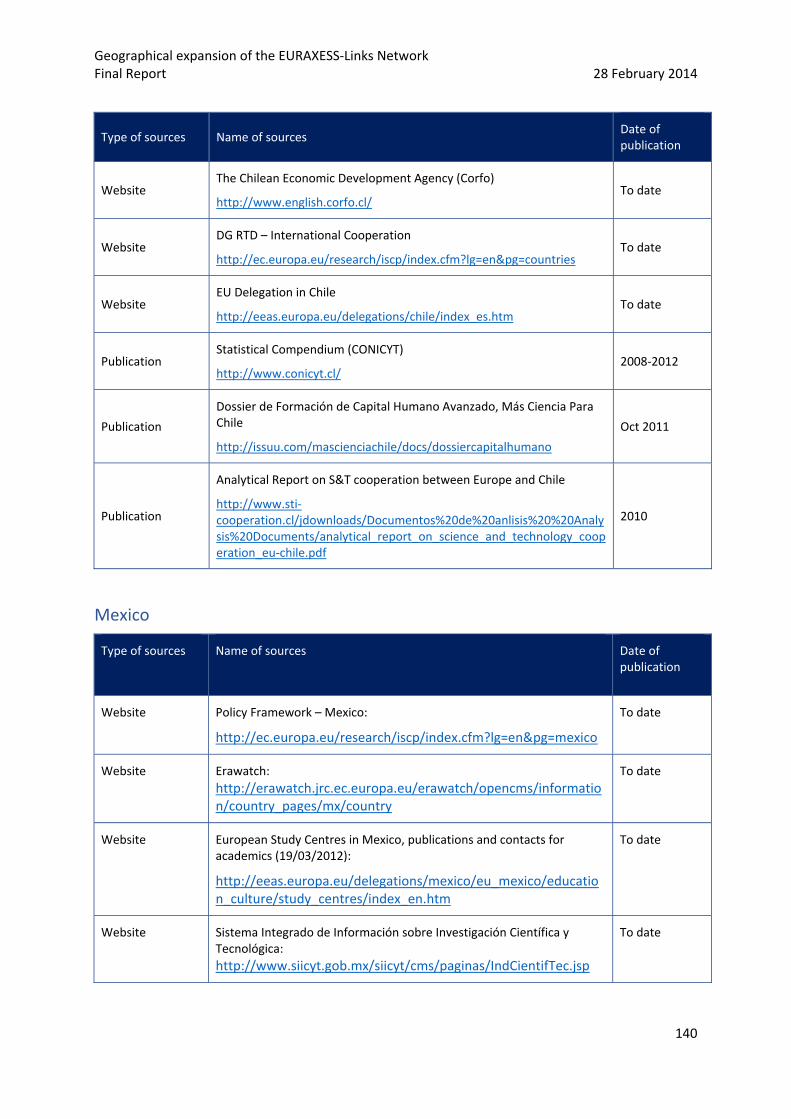
Geographical expansion of the EURAXESS‐Links Network Final Report 28 February 2014
140
Type of sources Name of sources Date of publication
Website The Chilean Economic Development Agency (Corfo)
http://www.english.corfo.cl/ To date
Website DG RTD – International Cooperation
http://ec.europa.eu/research/iscp/index.cfm?lg=en&pg=countries To date
Website EU Delegation in Chile
http://eeas.europa.eu/delegations/chile/index_es.htm To date
Publication Statistical Compendium (CONICYT)
http://www.conicyt.cl/ 2008‐2012
Publication
Dossier de Formación de Capital Humano Avanzado, Más Ciencia Para Chile
http://issuu.com/mascienciachile/docs/dossiercapitalhumano
Oct 2011
Publication
Analytical Report on S&T cooperation between Europe and Chile
http://www.sti‐cooperation.cl/jdownloads/Documentos%20de%20anlisis%20%20Analysis%20Documents/analytical_report_on_science_and_technology_cooperation_eu‐chile.pdf
2010
Mexico
Type of sources Name of sources Date of publication
Website Policy Framework – Mexico:
http://ec.europa.eu/research/iscp/index.cfm?lg=en&pg=mexico
To date
Website Erawatch: http://erawatch.jrc.ec.europa.eu/erawatch/opencms/information/country_pages/mx/country
To date
Website European Study Centres in Mexico, publications and contacts for academics (19/03/2012):
http://eeas.europa.eu/delegations/mexico/eu_mexico/education_culture/study_centres/index_en.htm
To date
Website Sistema Integrado de Información sobre Investigación Científica y Tecnológica: http://www.siicyt.gob.mx/siicyt/cms/paginas/IndCientifTec.jsp
To date

Geographical expansion of the EURAXESS‐Links Network Final Report 28 February 2014
141
Type of sources Name of sources Date of publication
Website OECD.StatExtracts / OECD iLibrary:
http://stats.oecd.org/Index.aspx?DataSetCode=PERS_OCCUP
To date
Website OECD/UNESCO Institute for Statistics/Eurostat Careers of Doctorate Holders (CDH) project:
http://www.oecd.org/innovation/inno/oecdunescoinstituteforstatisticseurostatcareersofdoctorateholderscdhproject.htm
2012
Publication OECD Science, Technology and Industry Scoreboard 2013:
http://www.oecd‐ilibrary.org/science‐and‐technology/oecd‐science‐technology‐and‐industry‐scoreboard‐2013_sti_scoreboard‐2013‐en
2013
Publication Country Strategy paper – MEXICO 2007‐2013
http://eeas.europa.eu/delegations/mexico/documents/projects/csp.pdf
2013
Publication OECD (2012), Education at a Glance 2012:
http://www.oecd.org/edu/highlights.pdf
2012
Publication MEXICO – EUROPEAN UNION
STRATEGIC PARTNERSHIP
JOINT EXECUTIVE PLAN OF THE STRATEGIC PARTNERSHIP:
http://www.consilium.europa.eu/uedocs/cms_Data/docs/pressdata/en/er/114467.pdf
May 2010
Publication European Parliament recommendation to the Council of 12 March 2009 on an EU‐Mexico Strategic Partnership:
http://www.europarl.europa.eu/sides/getDoc.do?pubRef=‐//EP//TEXT+TA+P6‐TA‐2009‐0141+0+DOC+XML+V0//EN
2009
Publication COMMUNICATION FROM THE COMMISSION TO THE COUNCIL AND THE
EUROPEAN PARLIAMENT
Towards an EU‐Mexico Strategic Partnership, Brussels, 15.7.2008
COM(2008) 447 final:
http://www.eeas.europa.eu/mexico/docs/com08_447_en.pdf
2008
New Zealand
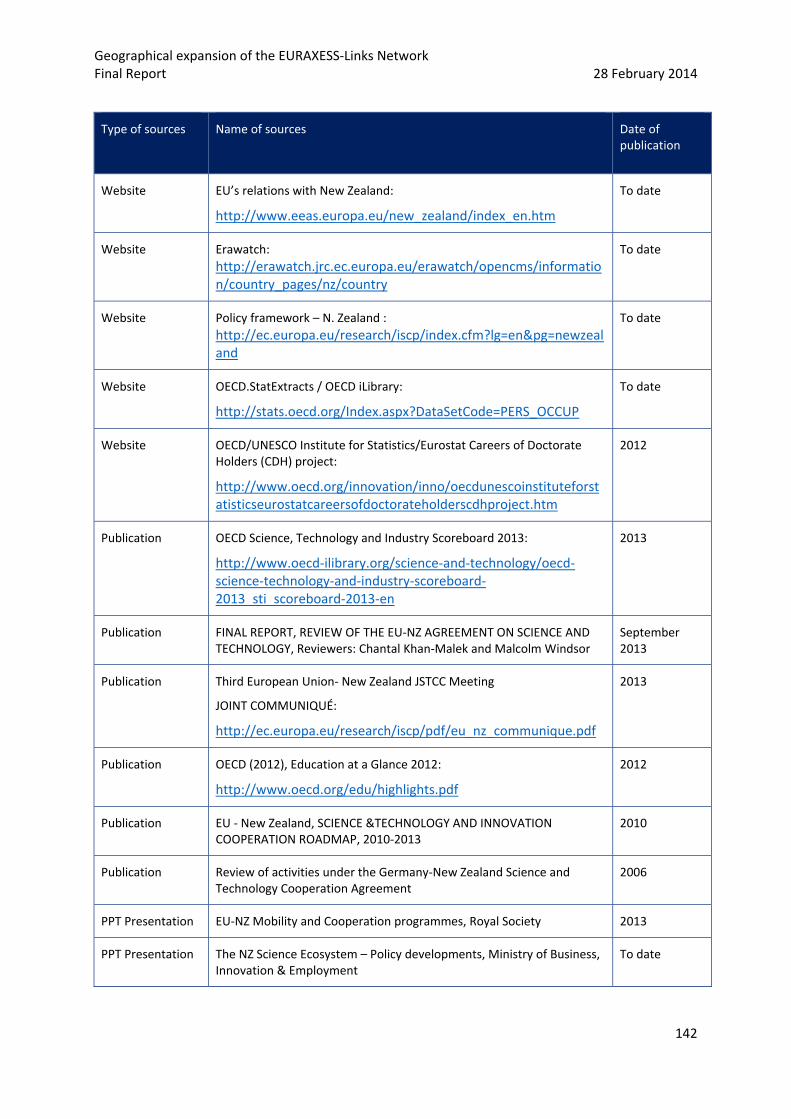
Geographical expansion of the EURAXESS‐Links Network Final Report 28 February 2014
142
Type of sources Name of sources Date of publication
Website EU’s relations with New Zealand:
http://www.eeas.europa.eu/new_zealand/index_en.htm
To date
Website Erawatch: http://erawatch.jrc.ec.europa.eu/erawatch/opencms/information/country_pages/nz/country
To date
Website Policy framework – N. Zealand : http://ec.europa.eu/research/iscp/index.cfm?lg=en&pg=newzealand
To date
Website OECD.StatExtracts / OECD iLibrary:
http://stats.oecd.org/Index.aspx?DataSetCode=PERS_OCCUP
To date
Website OECD/UNESCO Institute for Statistics/Eurostat Careers of Doctorate Holders (CDH) project:
http://www.oecd.org/innovation/inno/oecdunescoinstituteforstatisticseurostatcareersofdoctorateholderscdhproject.htm
2012
Publication OECD Science, Technology and Industry Scoreboard 2013:
http://www.oecd‐ilibrary.org/science‐and‐technology/oecd‐science‐technology‐and‐industry‐scoreboard‐2013_sti_scoreboard‐2013‐en
2013
Publication FINAL REPORT, REVIEW OF THE EU‐NZ AGREEMENT ON SCIENCE AND TECHNOLOGY, Reviewers: Chantal Khan‐Malek and Malcolm Windsor
September 2013
Publication Third European Union‐ New Zealand JSTCC Meeting
JOINT COMMUNIQUÉ:
http://ec.europa.eu/research/iscp/pdf/eu_nz_communique.pdf
2013
Publication OECD (2012), Education at a Glance 2012:
http://www.oecd.org/edu/highlights.pdf
2012
Publication EU ‐ New Zealand, SCIENCE &TECHNOLOGY AND INNOVATION COOPERATION ROADMAP, 2010‐2013
2010
Publication Review of activities under the Germany‐New Zealand Science and Technology Cooperation Agreement
2006
PPT Presentation EU‐NZ Mobility and Cooperation programmes, Royal Society 2013
PPT Presentation The NZ Science Ecosystem – Policy developments, Ministry of Business, Innovation & Employment
To date
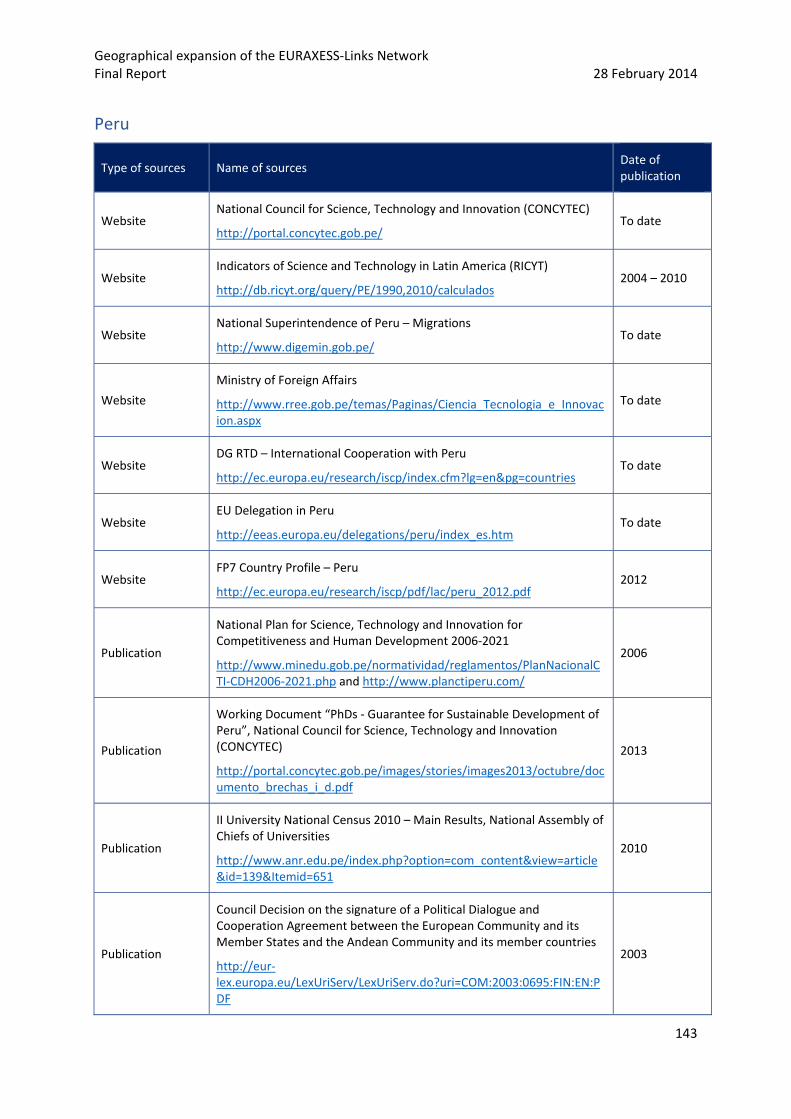
Geographical expansion of the EURAXESS‐Links Network Final Report 28 February 2014
143
Peru
Type of sources Name of sources Date of publication
Website National Council for Science, Technology and Innovation (CONCYTEC)
http://portal.concytec.gob.pe/ To date
Website Indicators of Science and Technology in Latin America (RICYT)
http://db.ricyt.org/query/PE/1990,2010/calculados 2004 – 2010
Website National Superintendence of Peru – Migrations
http://www.digemin.gob.pe/ To date
Website
Ministry of Foreign Affairs
http://www.rree.gob.pe/temas/Paginas/Ciencia_Tecnologia_e_Innovacion.aspx
To date
Website DG RTD – International Cooperation with Peru
http://ec.europa.eu/research/iscp/index.cfm?lg=en&pg=countries To date
Website EU Delegation in Peru
http://eeas.europa.eu/delegations/peru/index_es.htm To date
Website FP7 Country Profile – Peru
http://ec.europa.eu/research/iscp/pdf/lac/peru_2012.pdf 2012
Publication
National Plan for Science, Technology and Innovation for Competitiveness and Human Development 2006‐2021
http://www.minedu.gob.pe/normatividad/reglamentos/PlanNacionalCTI‐CDH2006‐2021.php and http://www.planctiperu.com/
2006
Publication
Working Document “PhDs ‐ Guarantee for Sustainable Development of Peru”, National Council for Science, Technology and Innovation (CONCYTEC)
http://portal.concytec.gob.pe/images/stories/images2013/octubre/documento_brechas_i_d.pdf
2013
Publication
II University National Census 2010 – Main Results, National Assembly of Chiefs of Universities
http://www.anr.edu.pe/index.php?option=com_content&view=article&id=139&Itemid=651
2010
Publication
Council Decision on the signature of a Political Dialogue and Cooperation Agreement between the European Community and its Member States and the Andean Community and its member countries
http://eur‐lex.europa.eu/LexUriServ/LexUriServ.do?uri=COM:2003:0695:FIN:EN:PDF
2003

Geographical expansion of the EURAXESS‐Links Network Final Report 28 February 2014
144
Type of sources Name of sources Date of publication
Database
National Directory of Researchers, National Council for Science, Technology and Innovation (CONCYTEC)
http://directorio.concytec.gob.pe/appDirectorioCTI/index.jsp
To date
Article
Commission of Science, Technology and Innovation, “Peru invests $380 million USD in innovation and development, 0.15% of national GDP”
http://www.ccit‐congreso.org/index.php?option=com_content&view=article&id=104:peru‐invierte‐us‐380‐millones‐en‐innovacion‐y‐desarrollo‐015‐del‐pbi‐nacionallaboratorio‐analista&catid=3:newsflash&Itemid=70
2013
Article
El Comercio.pe, “Peru gives importance to science, technology and innovation”
http://elcomercio.pe/economia/1624266/noticia‐peru‐recien‐le‐da‐importancia‐ciencia‐tecnologia‐innovacion_1
2013
Russia
Type of sources Name of sources Date of publication
Website EU‐Russia cooperation on S&T
http://www.st‐gaterus.eu/en/113.php
To date
Website Erawatch: http://erawatch.jrc.ec.europa.eu/erawatch/opencms/information/country_pages/ru/country
To date
Website Information exchange on S&T with Russia
http://www.increast.eu/en/136.php
Also including yearly country report: http://www.increast.eu/_media/Russia_Country_Report_EN_March2012.pdf (2012).
To date
Programne EU‐Russia Year of Science 2014
http://www.eu‐russia‐yearofscience.eu/en/1475.php
To date
Publication EU‐Russia S&T agreement
http://ec.europa.eu/research/iscp/pdf/russia_eu_agreement_cooperation_st_en.pdf
2000

Geographical expansion of the EURAXESS‐Links Network Final Report 28 February 2014
145
Type of sources Name of sources Date of publication
Publication Compendium of S&T cooperation between the European Union, the EU Member States and the Russian Federation
http://eeas.europa.eu/delegations/russia/documents/more_info/compendium_of_science_technology_cooperation_between_eu_and_russia_2011_en.pdf
2011
Programme decree No. 220 of 9/04/2009, "Measures to Attract Leading Scientists to Russian Educational Institutions"
(http://eng.mon.gov.ru/pro/ved/uch)
To date
Publication Science and Technology Indicators in the Russian Federation – Data Book
http://www.hse.ru/en/primarydata/innov2013
2013
South Africa
Type of sources Name of sources Date of publication
Website SouthAfrica.info
http://www.southafrica.info/services/education/research.htm
Lists research organisations in SA
To date
Website International Education Association of South Africa (IEASA)
http://www.studysa.co.za/
Information on Erasmus Mundus programme
To date
Website National Research Foundation
http://www.nrf.ac.za/about_overview.php
A South African research council with some data on research fields
To date
Website Esastap Plus
http://www.esastap.org.za/
Links to many useful sources including South Africa’s bilateral agreements with the EU and its Member States and a report on SA Research and Innovation Capacity
http://www.esastap.org.za/download/sa_ri_capacity.pdf
To date
Website DST website
National policy documents including the 2010 Innovation strategy
http://www.dst.gov.za/images/Dept_Science_Technology_V7_web.pdf
To date

Geographical expansion of the EURAXESS‐Links Network Final Report 28 February 2014
146
Type of sources Name of sources Date of publication
Website Council for Scientific and Industrial Research
http://www.csir.co.za/research_and_development/background.html
South African research council
To date
ERAWATCH Country Fiche on South Africa
http://erawatch.jrc.ec.europa.eu/erawatch/opencms/information/country_pages/za/country?tab=country&country=za
Report SACCESS project report on Opportunities for European researchers within the South African Innovation System
2012
Country fiche EC delegation ‐ Participation of South Africa in the FP7 2013
Presentation EC delegation – Horizon 2020 and South Africa October 2013
Presentation DST South Africa research activities October 2013
Presentation Research cooperation between South Africa and other African states September 2012
South Korea
Type of sources Name of sources Date of publication
Website S&T agreement: http://ec.europa.eu/research/iscp/index.cfm?pg=countries
To date
Website Country profile: http://ec.europa.eu/research/iscp/index.cfm?lg=en&pg=korea
To date
Website a review of the S&T arrangement between the European Union and the Republic of Korea : http://ec.europa.eu/research/iscp/index.cfm?pg=allpublications
To date
Website Country's S&T landscape (erawatch): http://erawatch.jrc.ec.europa.eu/erawatch/opencms/information/country_pages/kr/country
To date
Project Konnect ‐ Science, Technology, and Innovation Coordination between Europe and Korea
2013
Country fiche EC delegation ‐ Participation of South Korea in the FP7 2013

Geographical expansion of the EURAXESS‐Links Network Final Report 28 February 2014
147
Type of sources Name of sources Date of publication
Programme Korridor – Stimulating and facilitating the participation
of European researchers in Korean R&D
programmes
http://www.access4.eu/_media/Korridor_final_Web.pdf
2012
Publication The European Union and the Republic of Korea 2012 edition – A statistical portrait
http://epp.eurostat.ec.europa.eu/cache/ITY_OFFPUB/KS‐32‐11‐816/EN/KS‐32‐11‐816‐EN.PDF
2013

Geographical expansion of the EURAXESS‐Links Network Final Report 28 February 2014
148
3 Annex 3 – Primary data 3.1 EU-level interviewees
Body Name of interviewee Date
Unit D1 Policy coordination, EFTA and enlargement countries and Russia
Armand BEUF
Policy Officer ‐ Science, Technology and Innovation cooperation with Australia, New Zealand and Pacific countries
7 November 2013
Dolores Cahill
Policy Officer ‐ Science, Technology and Innovation cooperation with Korea
6 November 2013
Unit D2 Latin America
Sieglinde Gruber
Head of Unit
29 October 2013
Luis Samaniego Moffre
Policy Officer ‐ S/T relations with Mexico, Central America, Caribbean
8 November 2013
Unit D.3 European Neighbourhood, Africa and the
Gulf
Nienke Buisman
Policy Officer – South Africa
7 November 2013
3.2 Fieldwork interviewees
Argentina
Organisation Name of the interviewee Position/Role Date of interview
EU Delegation in Argentina Luis Pedro Pereira Mateus Cooperation Officer 31/10/2013
Ministry of Science, Technology and Innovation
Mónica Silenzi General Coordinator of the National Directorate of International Relations and ABEST III
28/11/2013
National Scientific and Technical Research Council
(CONICET)
Viviana Álvarez Schueller
Head of International Cooperation Section
19/12/2013
German Embassy in Argentina Kathrin Megerle S&T Counsellor 11/01/2014

Geographical expansion of the EURAXESS‐Links Network Final Report 28 February 2014
149
Organisation Name of the interviewee Position/Role Date of interview
Research Laboratory of New Information Technology ‐ National University of La Plata
Javier Díaz Director 26/12/2013
Argentinean Researcher (at IANIGLA)
Claudia Viviana Rubinstein Independent Researcher (CONICET) and Director of Institute of Snow Research, Glaciology and Environmental Sciences (IANIGLA)
05/12/2013
Argentinean Researcher (at Research Institute of Materials Science and Technology ‐ INTEMA)
Juan Pablo Busalmen Independent Researcher (CONICET)
08/01/2014
Argentinean Researcher (at National Commission of Atomic Energy ‐ CNEA)
Carlos Balseiro Independent Researcher (CNEA and CONICET)
27/12/2013
EU Researcher (at University of Lille)
Thomas Servais Research Director at the University of Lille. He visited Argentina twice within a cooperation project with Claudia Rubinstein.
09/12/2013
EU Researcher (at University of Stavanger)
Udo Zimmerman Associate Professor at the University of Stavanger, Department of Petroleum Engineering. Holds a CONICET scholarship for foreign researchers.
09/01/2014
Australia
Organisation Name of the interviewee Position/Role Date of interview
EU Delegation to Australia
Lynne Hunter
John Tuckwell
Andrea Nicolaj
Adviser (Science and education policies included)
Senior Adviser, Trade, Economics and Agriculture
First Counsellor Trade and Economics
28 November 2013

Geographical expansion of the EURAXESS‐Links Network Final Report 28 February 2014
150
Organisation Name of the interviewee Position/Role Date of interview
Australian Embassy & Mission to the EU
Clare McLaughlin Counsellor (Education and Science)
13 December 2013
Department of Industry Cameron Slatyer
Manager, International Strategy Section, Research Collaboration and International Engagement Branch
17 December 2013
Australian Research Council Justin Withers
Director, Policy and Integrity
Australian Research Council
19 December 2013
Group of 8 Martin Grabert Director, International & Business Relations
20 December 2013
Ministry of Foreign Affairs of Italy,
Embassy of Italy
Oscar Moze Science Attaché
18 December 2013
French Embassy Marie Helene Wehr mailto:marie‐[email protected]
Attaché for Science and Technology
20 December 2013
EU‐Australia bilateral programme FEAST
Rado Faletic Director 20 December 2013
The University of New South Wales | Sydney
Andrea Morello
Associate Professor | School of Electrical Engineering and Telecommunications
Program Manager | Centre for Quantum Computation and Communication Technology
18 December 2013
University of Melbourne Richard O. Sinnott Director, eResearch 18 December 2013
CSIRO Marine and Atmospheric Research
Mathieu Mongin
Biogeochemical modeller
16 January 2014

Geographical expansion of the EURAXESS‐Links Network Final Report 28 February 2014
151
Chile
Organisation Name of the interviewee Position/Role Date of interview
EU Delegation in Chile Claudia Geier Cooperation Officer 12/11/2013
CONICYT Maria Mesonero Kromand Director of the International Relations Department
02/12/2013
InnovaChile ‐ CORFO Gloria Maldonado Deputy Director, Head of Industrial and International Promotion, InnovaChile of CORFO
18/12/2013
French Embassy Thomas Lagathu Regional cooperation officer of the Embassy of France
22/11/2013
European Southern Observatory (ESO) in Chile
Fernando Comerón Chilean Representative 17/12/2013
Chilean Researcher (at Fraunhofer Chile)
Juana Castañeda Project Manager at Fraunhofer Chile Research ‐ Center for Systems Biotechnology
28/11/2013
Chilean Researcher (at Catholic University of Valparaiso)
Paula Rojas Saperas Research Director 26/12/2013
EU Researcher Sebastien Carretier Researcher DR2 IRD and Professor at the University of Chile (Earth Sciences)
23/12/2013
EU Researcher (from University of Leipzig)
Jost Heitzenberg
Professor and Chair in Physics of the Atmosphere at the University of Leipzig and Director of the Institute for Tropospheric Research in Leipzig
18/12/2013
Mexico
Organisation Name of the interviewee
Position/Role Date of interview
EU Delegation to Mexico Juan Garay Amores Cooperation section 8 November 2013
Mexico Embassy & Mission to the EU
Jesus Velazquez Cooperation Affairs 19 November 2013
CONACYT‐ Consejo Nacional de Ciencia y Tecnologia (office in Brussels)
Erika Mari Guzmán Romero
INCO NCP 19 November 2013

Geographical expansion of the EURAXESS‐Links Network Final Report 28 February 2014
152
Organisation Name of the interviewee
Position/Role Date of interview
CONACYT in Mexico Arturo Borja
Director for International Cooperation
Chair of the Joint Steering Committee Mexico‐EU on S&T)
12 December 2013
DFG – German Research Foundation
Dietrich Halm
Director,
DFG Office Latin America
c/o German House of Science and Innovation
19 December 2013
Universidad de Colima
Jürgen Haberleithner
Director de Asuntos Internacionales
8 December 2013
Coordinación de Relaciones Internacionales, Cinvestav
Anaid Linares Rojas Director General
16 January 2014
ANUIES
Brenda Elizabeth Galaviz Aragón
Directora de Cooperación Internacional
28 January 2014
New Zealand
Organisation Name of the interviewee
Position/Role Date of interview
EU Delegation to NZ Lucy Ross Adviser 20 November 2013
NZ Embassy & Mission to the EU
Bruce McCallum Counsellor (Science & Innovation)
9 December 2013
Ministry of Business, Innovation and Employment (MBIE)
Rick Petersen Senior Adviser (Europe) 18 December 2013
Royal Society of New Zealand
FRIENZ programme
Mark Stagg
Senior Manager (International Engagement)
Coordinator
18 December 2013
Embassy of the Federal Republic of Germany, Wellington
Silke Rolfe
Deputy Head of Mission
24 January 2014

Geographical expansion of the EURAXESS‐Links Network Final Report 28 February 2014
153
Organisation Name of the interviewee
Position/Role Date of interview
British High Commission Steve Thompson Science and Innovation Officer
21 January 2014
Co‐ordinator for New Zealand
Project Management Agency c/o German Aerospace Center (DLR)
European and International Cooperation
Hans‐Jörg Stähle
German Co‐ordinator for the NZ bilateral relationship
16 January 2014
NIWA Principal Scientist ‐ Marine Geology
Geoffroy Lamarche
Programme Leader ‐ Marine Physical Resources
16 January 2014
Evaluator contracted by the European Commission to review the activities under and success or otherwise of the NZ –EU Science & Technology Cooperation Agreement
Chantal Khan‐Malek CNRS ‘responsible’ for the FRIENZ project
10 January 2014
Precision Agriculture, Lincoln Agritech Ltd
Armin Werner Group Manager 21 January 2014
Peru
Organisation Name of the interviewee Position/Role Date of interview
EU Delegation to Peru Victor Velarde & Luis Piselli
Cooperation Officer & Officer in Communication and Public Affairs
7/11/2013
National Council of Science and Technology (CONCYTEC)
María Gisella Orjeda Fernández & Ricardo López Mejía
President & International Cooperation Specialist
18/12/2013
Spanish Embassy Juan Diego Ruiz Cumplido
General Coordinator of the Office for Cooperation
19/12/2013
National Assembly of Universities’ Chancellors (ANR)
Sofia Wong (o Luis Jaime Castillo)
Director General of the Directorate General of International Relations and Cooperation
10/12/2013

Geographical expansion of the EURAXESS‐Links Network Final Report 28 February 2014
154
Organisation Name of the interviewee Position/Role Date of interview
Catholic University of Peru Magally Alegre Henderson Research Advancement Officer
28/11/2013
Researcher (at Peruvian Amazon Research Institute (IIAP)
Dennis del Castillo Torres Director of PROBOSQUES 12/12/2013
Researcher (at Catholic University of Peru) Eric Cosio
Senior Lecturer & Fellow of the Alexander von Humboldt Foundation
6/12/2013
Researcher (at Institute of Tropical Medicine “Alexander von Humboldt” at the University of Cayetano Heredia)
Eduardo Gotuzzo Director 17/12/2013
EU Researcher Milosz Giersz Assistant Professor at the University of Warsaw
Pending
EU Researcher Véronique Wright IFEA ‐ Peru Pending – Scheduled (13/01/2014)
Russia
Organisation Name of the interviewee Position/Role Date of interview
EU Delegation to the Russian Federation
Mr Richard Burger S&T Cooperation 6/11/2013
Permanent Representation of Russia to the EU
Mr Gleb Kurochkin
Counsellor (S&T Cooperation)
Potential interviewee Declined interview
DLR Project Management Agency
Secretariat of EU‐Russia Year of Science 2014
Mr Jörn Grünewald Head of Support and Coordination Action
8/01/2014
Institute for Statistical Studies and Economics of
Knowledge State University ‐ Higher School of Economics (HSE)
Dr Anna Pikalova
Centre for International Projects
Director
22/03/2014
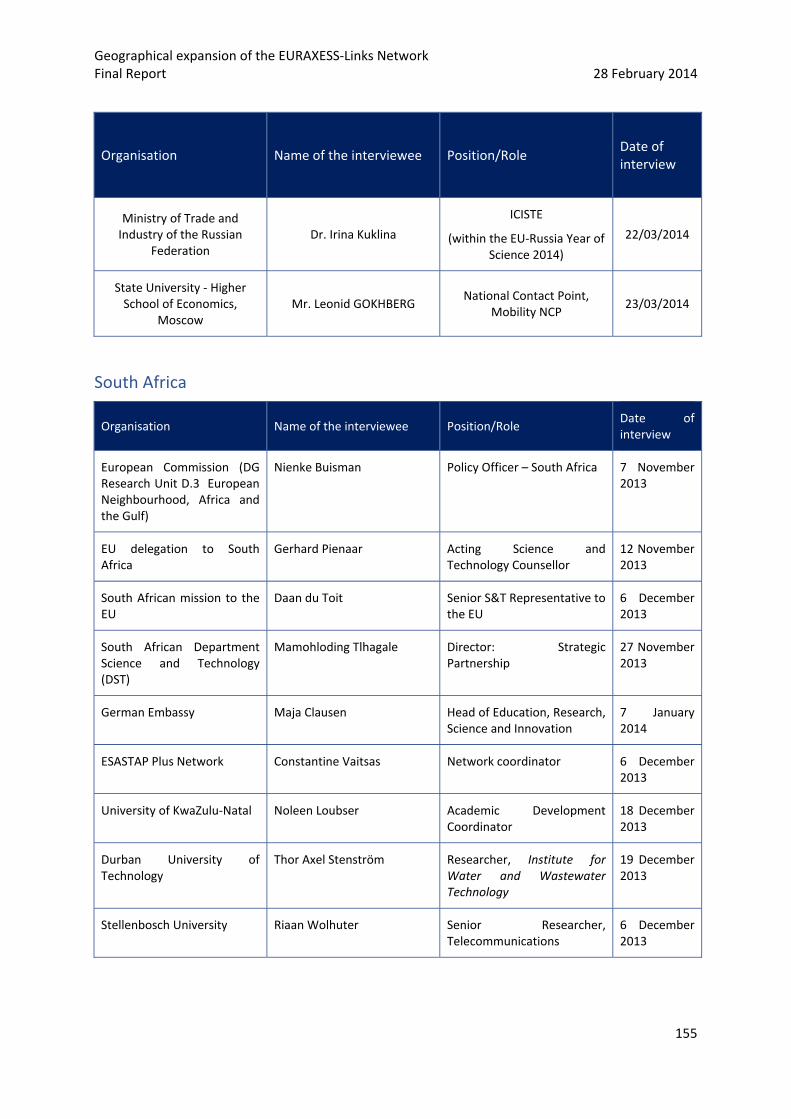
Geographical expansion of the EURAXESS‐Links Network Final Report 28 February 2014
155
Organisation Name of the interviewee Position/Role Date of interview
Ministry of Trade and Industry of the Russian
Federation Dr. Irina Kuklina
ICISTE
(within the EU‐Russia Year of Science 2014)
22/03/2014
State University ‐ Higher School of Economics,
Moscow Mr. Leonid GOKHBERG
National Contact Point, Mobility NCP
23/03/2014
South Africa
Organisation Name of the interviewee Position/Role Date of interview
European Commission (DG Research Unit D.3 European Neighbourhood, Africa and the Gulf)
Nienke Buisman Policy Officer – South Africa 7 November 2013
EU delegation to South Africa
Gerhard Pienaar Acting Science and Technology Counsellor
12 November 2013
South African mission to the EU
Daan du Toit Senior S&T Representative to the EU
6 December 2013
South African Department Science and Technology (DST)
Mamohloding Tlhagale
Director: Strategic Partnership
27 November 2013
German Embassy Maja Clausen Head of Education, Research, Science and Innovation
7 January 2014
ESASTAP Plus Network Constantine Vaitsas Network coordinator 6 December 2013
University of KwaZulu‐Natal Noleen Loubser Academic Development Coordinator
18 December 2013
Durban University of Technology
Thor Axel Stenström Researcher, Institute for Water and Wastewater Technology
19 December 2013
Stellenbosch University Riaan Wolhuter Senior Researcher, Telecommunications
6 December 2013
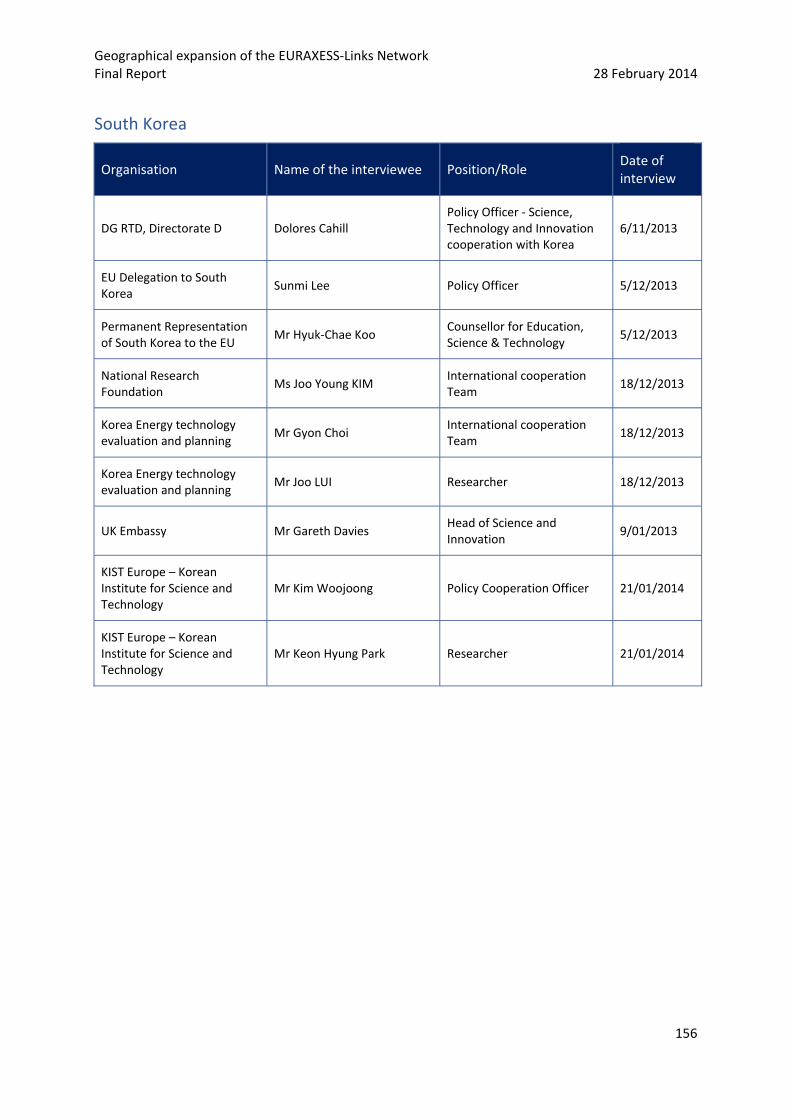
Geographical expansion of the EURAXESS‐Links Network Final Report 28 February 2014
156
South Korea
Organisation Name of the interviewee Position/Role Date of interview
DG RTD, Directorate D Dolores Cahill Policy Officer ‐ Science, Technology and Innovation cooperation with Korea
6/11/2013
EU Delegation to South Korea
Sunmi Lee Policy Officer 5/12/2013
Permanent Representation of South Korea to the EU
Mr Hyuk‐Chae Koo Counsellor for Education, Science & Technology
5/12/2013
National Research Foundation
Ms Joo Young KIM International cooperation Team
18/12/2013
Korea Energy technology evaluation and planning
Mr Gyon Choi International cooperation Team
18/12/2013
Korea Energy technology evaluation and planning
Mr Joo LUI Researcher 18/12/2013
UK Embassy Mr Gareth Davies Head of Science and Innovation
9/01/2013
KIST Europe – Korean Institute for Science and Technology
Mr Kim Woojoong Policy Cooperation Officer 21/01/2014
KIST Europe – Korean Institute for Science and Technology
Mr Keon Hyung Park Researcher 21/01/2014
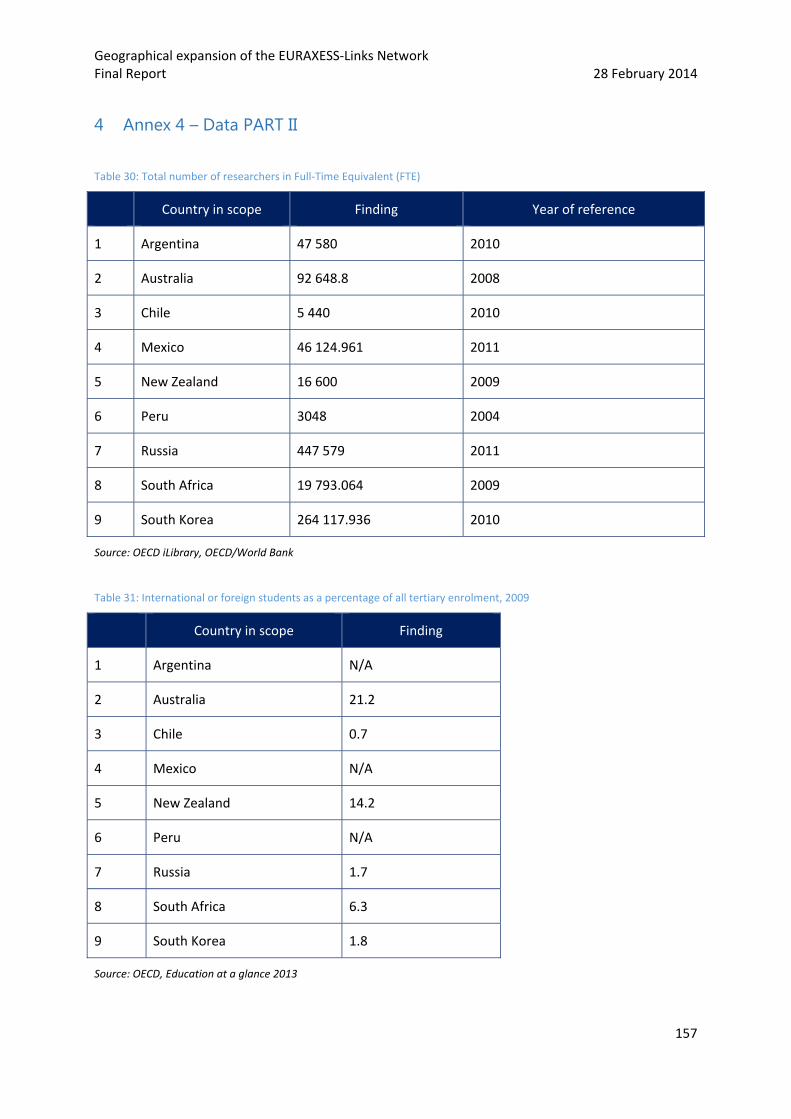
Geographical expansion of the EURAXESS‐Links Network Final Report 28 February 2014
157
4 Annex 4 – Data PART II
Table 30: Total number of researchers in Full‐Time Equivalent (FTE)
Country in scope Finding Year of reference
1 Argentina 47 580 2010
2 Australia 92 648.8 2008
3 Chile 5 440 2010
4 Mexico 46 124.961 2011
5 New Zealand 16 600 2009
6 Peru 3048 2004
7 Russia 447 579 2011
8 South Africa 19 793.064 2009
9 South Korea 264 117.936 2010
Source: OECD iLibrary, OECD/World Bank
Table 31: International or foreign students as a percentage of all tertiary enrolment, 2009
Country in scope Finding
1 Argentina N/A
2 Australia 21.2
3 Chile 0.7
4 Mexico N/A
5 New Zealand 14.2
6 Peru N/A
7 Russia 1.7
8 South Africa 6.3
9 South Korea 1.8
Source: OECD, Education at a glance 2013

Geographical expansion of the EURAXESS‐Links Network Final Report 28 February 2014
158
Table 32: R&D expenditure as a % of the GDP
Country in scope Findings Year of reference
1 Argentina 0.62 2010
2 Australia 2.38 2010
3 Chile 0.42 2010
4 Mexico 0.46 2011
5 New Zealand 1.30 2009
6 Peru 0.11 2004‐2011
7 Russia 1.16 2010
8 South Africa 0.87 2009
9 South Korea 3.74 2010
Source: The World Bank Data, CONCYTEC based on data from UNESCO, WEO‐FMI and World Bank
Table 33: Scientific and technical journal articles, 2009
Country in scope Findings
1 Argentina 3,655
2 Australia 18,923
3 Chile 1,868
4 Mexico 4,128
5 New Zealand 3,188
6 Peru 159
7 Russia 14,016
8 South Africa 2,864
9 South Korea 22,271
Source: The World Bank Data

Geographical expansion of the EURAXESS‐Links Network Final Report 28 February 2014
159
Table 34: Number of patents applications, residents, 2011
Country in scope Findings
1 Argentina 688
2 Australia 2 383
3 Chile 339
4 Mexico 1 065
5 New Zealand 1 501
6 Peru 39
7 Russia 26 495
8 South Africa 656
9 South Korea 138 034
Source: The World Bank Data, Indicators of Science and Technology in Argentina (2011), Ministry of Science, Technology and Productive Innovation
Table 35: FP7 participation
Country in scope
Nr of applicants
Year of reference
Nr of successful applicants
Year of reference
Requested EC
contribution by
successful applicants
Year of reference
1 Argentina 584 2012 151 2012 10,76 2012
2 Australia 1 092 2013 324 2013 10,51 2013
3 Chile 396 2012 84 2012 5,00 2012
4 Mexico 588 2012 138 2012 9,12 2012
5 New Zealand
332 2013 129 2013 4,27 2013
6 Peru 159 2012 20 2012 2,96 2012
7 Russia 2 598 2012 590 2012 61,85 2012
8 South Africa
1 145 2013 309 2013 35,80 2013

Geographical expansion of the EURAXESS‐Links Network Final Report 28 February 2014
160
Country in scope
Nr of applicants
Year of reference
Nr of successful applicants
Year of reference
Requested EC
contribution by
successful applicants
Year of reference
9 South Korea
264 2013 66 2013 3,21 2013
Source: European Commission