geographic skills you need to study geography! methods of geographic inquiry
TRANSCRIPT
Geographic skills you need to study Geography!
Methods of Geographic Inquiry

Geography’s Basic Geography’s Basic ToolsTools
Let us begin with:

A Map is a simplified representation of the real earth. It is a scaled down version of the real world. This scaled down version is in proportion to the real world. A map is usually on a 2D surface (flat) trying to represent a 3D image..

Map ProjectionsMap Projections
Definition: When the features of a globe are transferred (projected) onto flat surfaces.
• Since the globe is in 3D and a flat surface is in 2D. All maps are created by projecting the 3D globe onto a 2D surface.
• Therefore all 2D maps have some “Distortion”.

There are many types of “Map projections” that try to deal with distortion. A 2D map can never eliminate ALL of the distortion. So each map projection tries to preserve some of the following:
1. Lambert Azimuthal - tries to preserve AREA2. Mercator projection - tries to preserve DIRECTION3. Robinson - tries to preserve SHAPE4. Sinusoidal - tries to preserveDISTANCE

Canada – Lambert Conformal Conic Canada – Lambert Conformal Conic (Area)(Area)
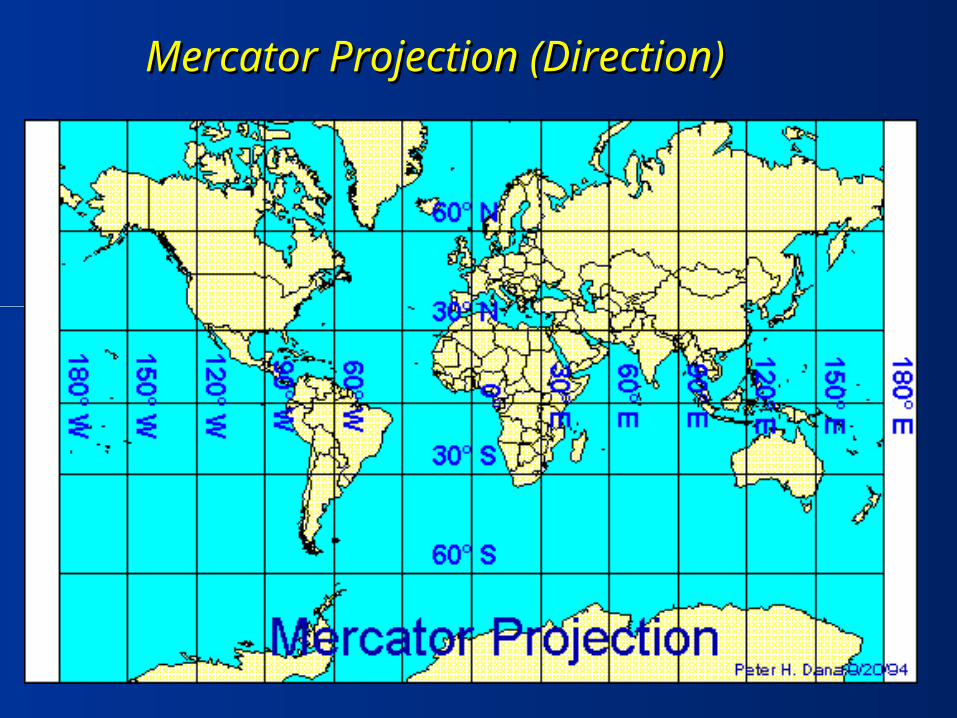
Mercator Projection Mercator Projection (Direction)(Direction)

Robinson Projection Robinson Projection (Shape)(Shape)

Sinusoidal Projection Sinusoidal Projection (Distance)(Distance)

Goode’s Projection (Unusual - Area)Goode’s Projection (Unusual - Area)
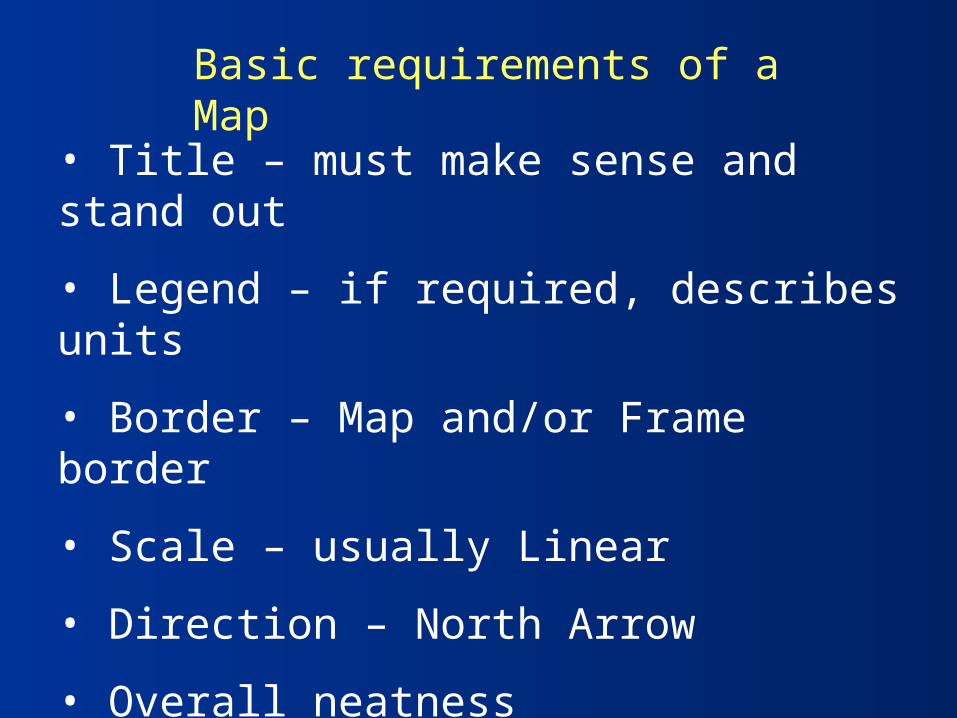
Basic requirements of a Map
• Title – must make sense and stand out
• Legend – if required, describes units
• Border – Map and/or Frame border
• Scale – usually Linear
• Direction – North Arrow
• Overall neatness
• Balance!! Very little white space.
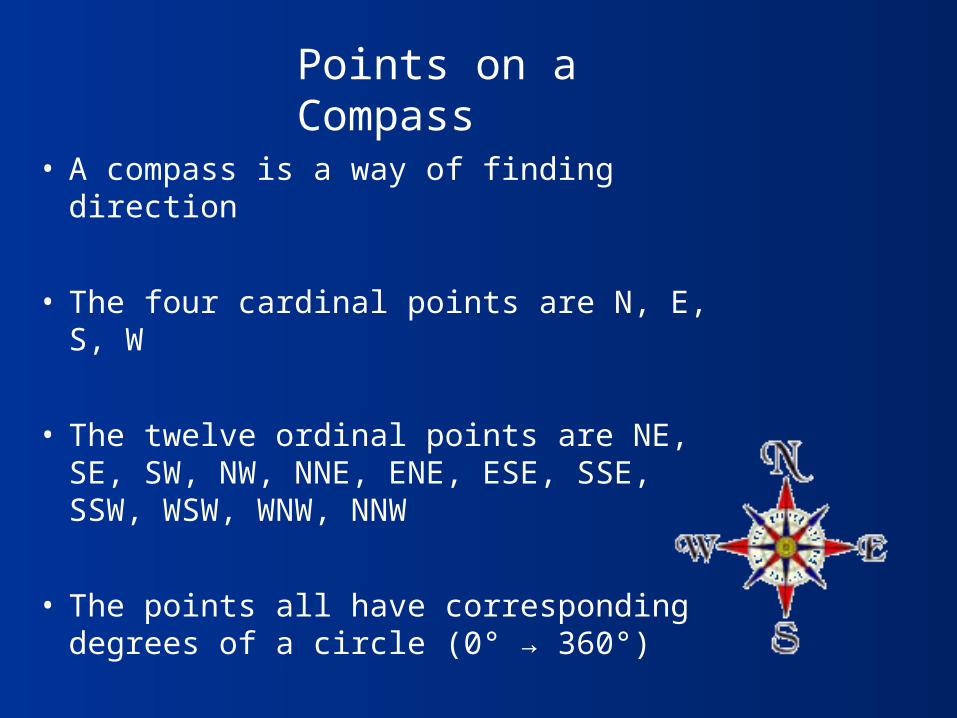
• A compass is a way of finding direction
• The four cardinal points are N, E, S, W
• The twelve ordinal points are NE, SE, SW, NW, NNE, ENE, ESE, SSE, SSW, WSW, WNW, NNW
• The points all have corresponding degrees of a circle (0° → 360°)
Points on a Compass

Scale
Three ways to show scale:
1. Linear Scale –
2. Ratio or Representative Fraction –
1:10 000 000
3. Statement –
One Cm on the map is equal to 100 Km in real life
Note : Be able to convert back and forth

A map with a scale of 1:17 500 000 shows the entire earth as if high up in space. Since things appear small on this map this type of scale is called a ‘small-scale’.
As you approach the earth and get closer and see more things in detail (things get larger), this type of scale is called a ‘large scale’. An example would be something like 1:500.
Remember 1:1 is real life size!
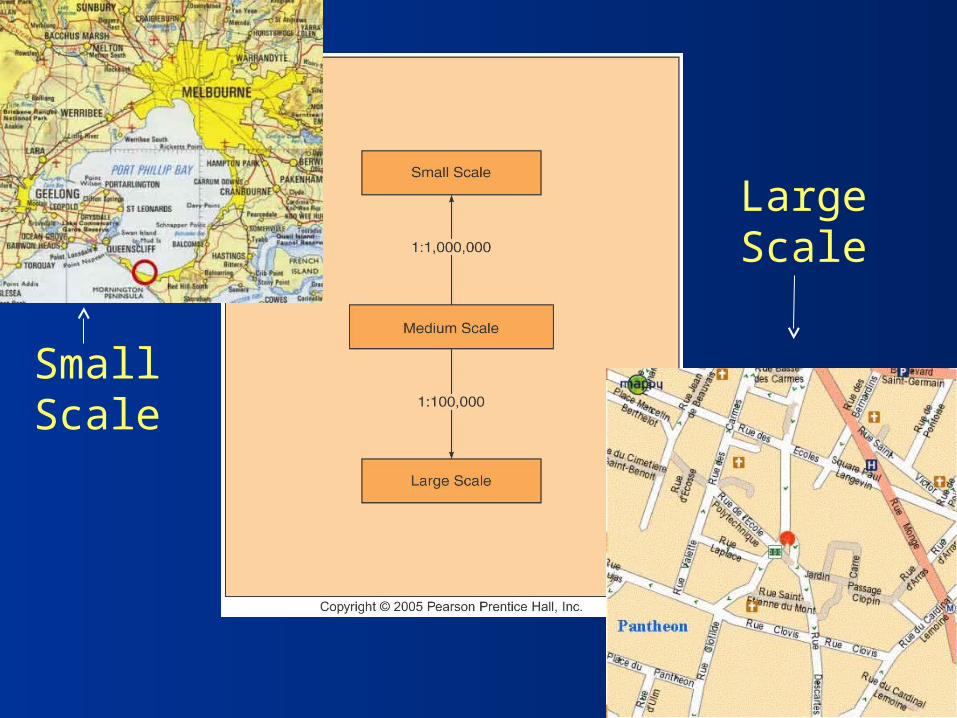
Small Scale
Large Scale
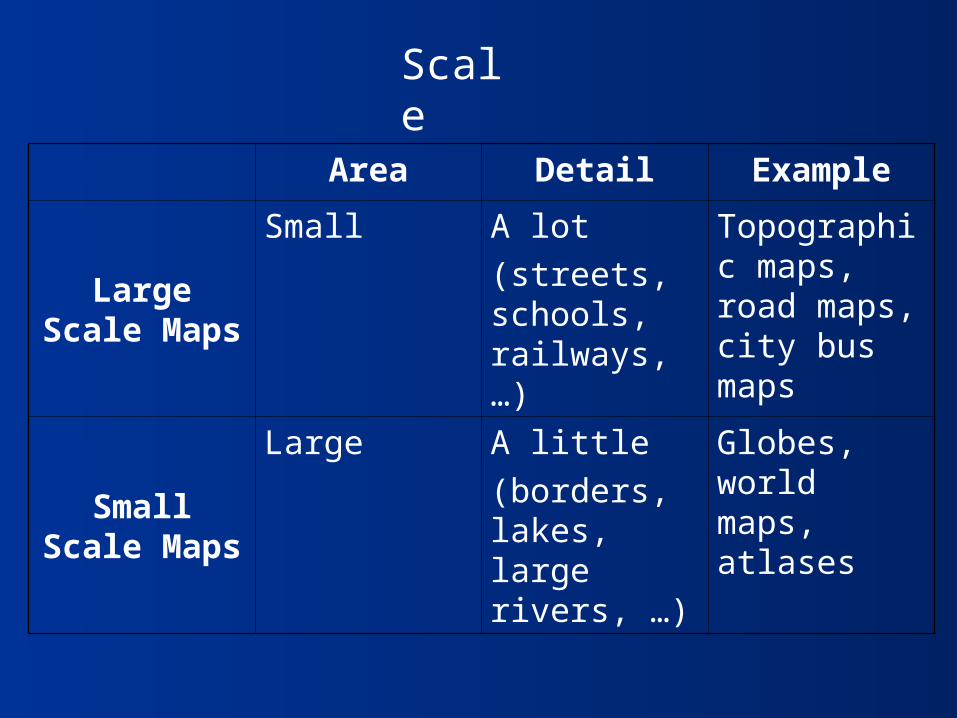
Area Detail Example
Large Scale Maps
Small A lot
(streets, schools, railways, …)
Topographic maps, road maps, city bus maps
Small Scale Maps
Large A little
(borders, lakes, large rivers, …)
Globes, world maps, atlases
Scale

Scale – Mapping Our Location
Building Footprint

Scale – Mapping Our Location
Neighbourhood
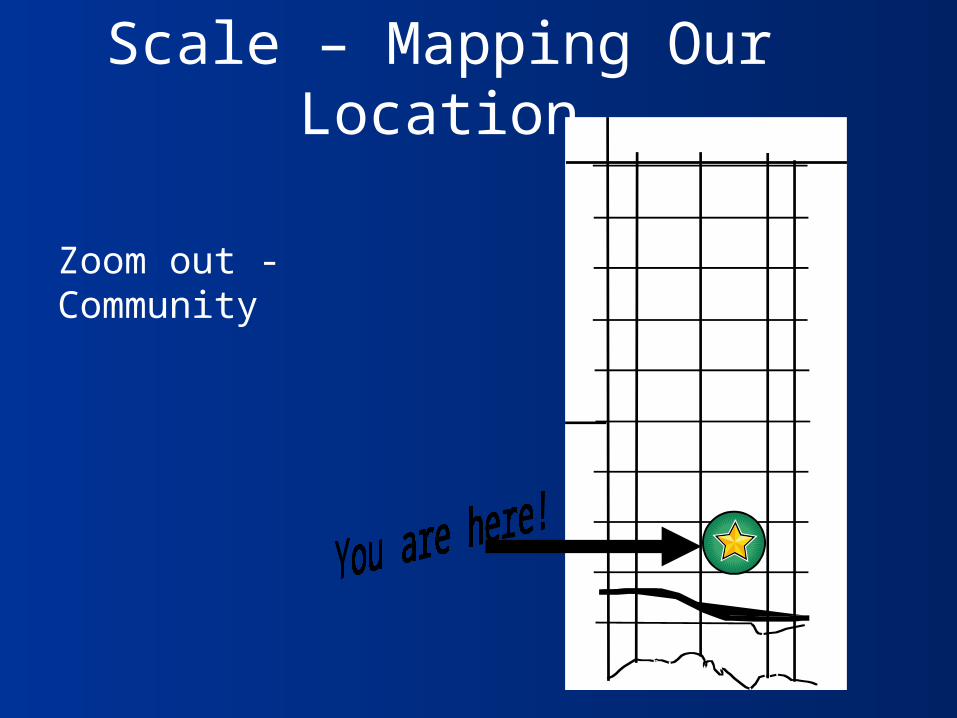
Scale – Mapping Our Location
Zoom out - Community
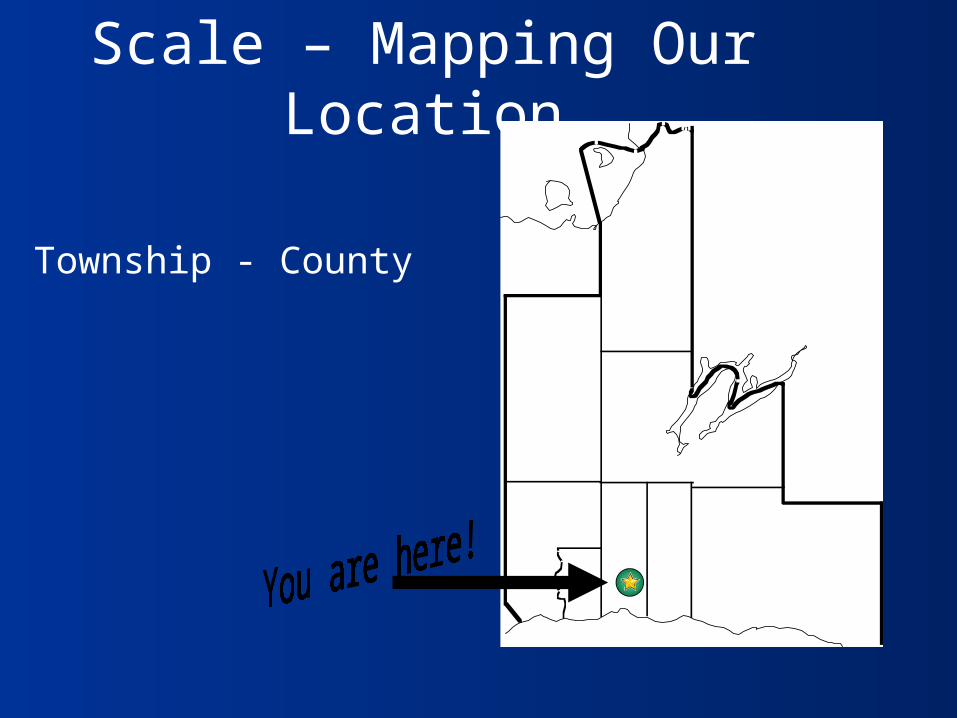
Scale – Mapping Our Location
Township - County

Scale – Mapping Our Location
Southern Ontario
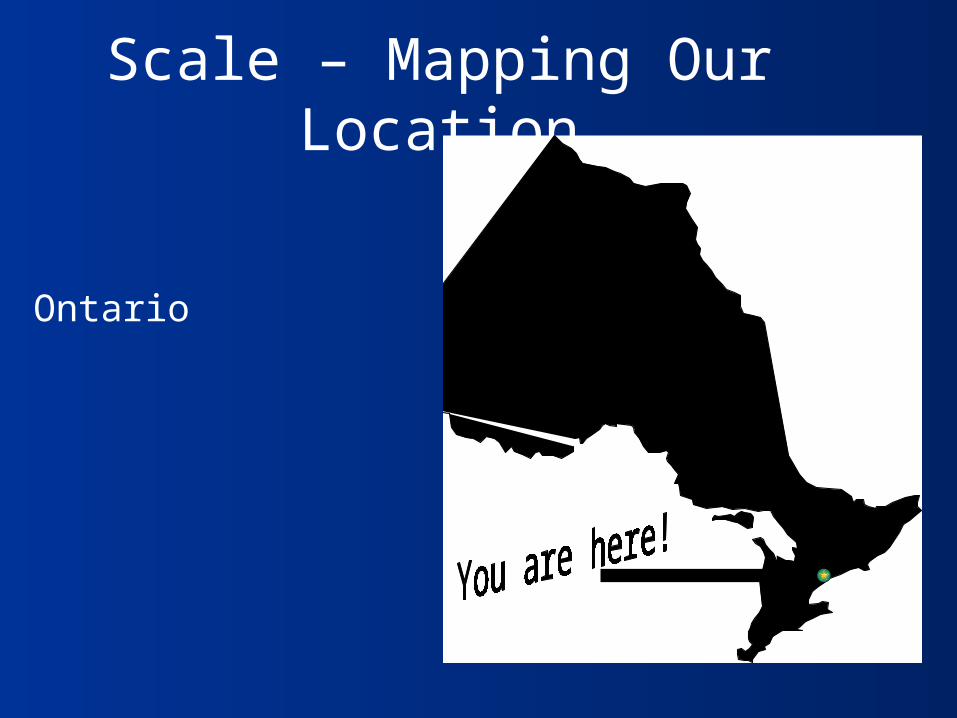
Scale – Mapping Our Location
Ontario

Scale – Mapping Our Location
Canada

Scale – Mapping Our Location
World

Latitude and Longitude
• Grid work of lines extending north-south and east-west.
• Latitude is measured north and south of the equator
• Longitude is measured east and west from the prime meridian.
• This is different from the way you measure your usual x and y co-ordinates in math.

Latitude and Longitude
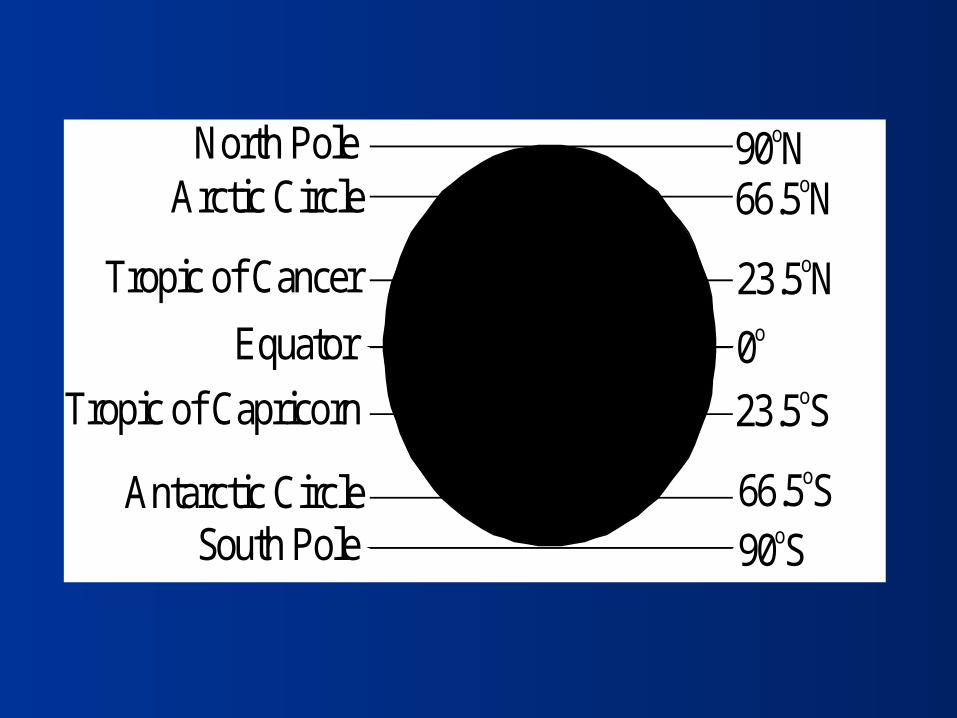
0o
23.5oN
66.5oN
23.5oS
66.5oS
90oN
90oS
North PoleArctic Circle
Tropic of Cancer
Equator
Tropic of Capricorn
Antarctic CircleSouth Pole
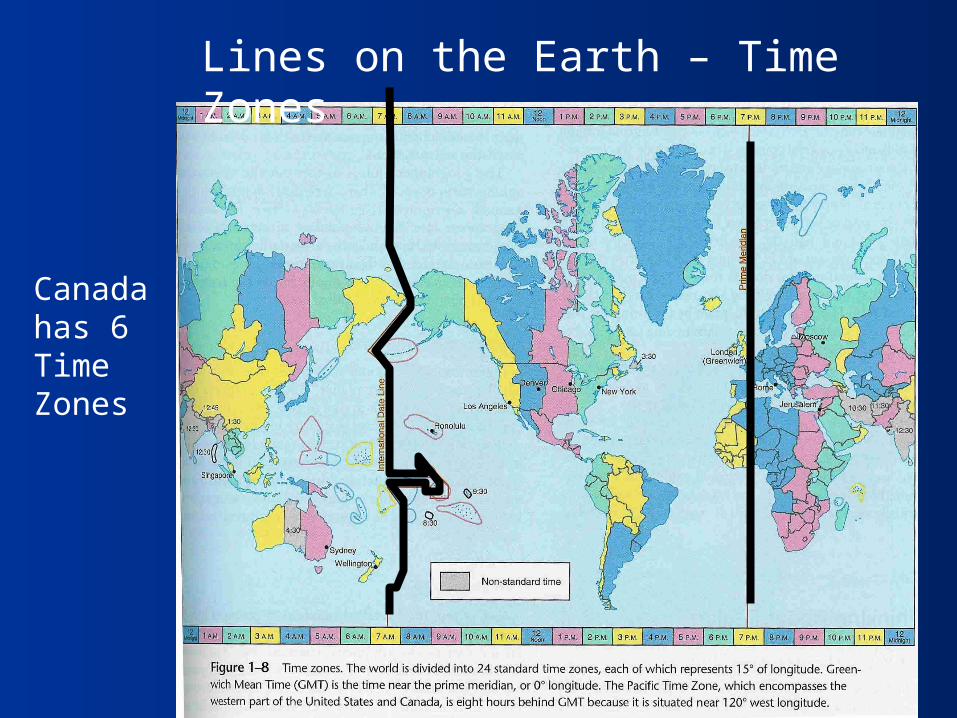
Lines on the Earth – Time Zones
Canada has 6 Time Zones
Reading Maps – Locating Reading Maps – Locating Places on a MapPlaces on a Map
We can use grid systems to locate places on a map.
The 3 grid systems used today are:
1. Latitude and Longitude2. Military Grid3. Alphanumeric Grid

Military Grid Military Grid
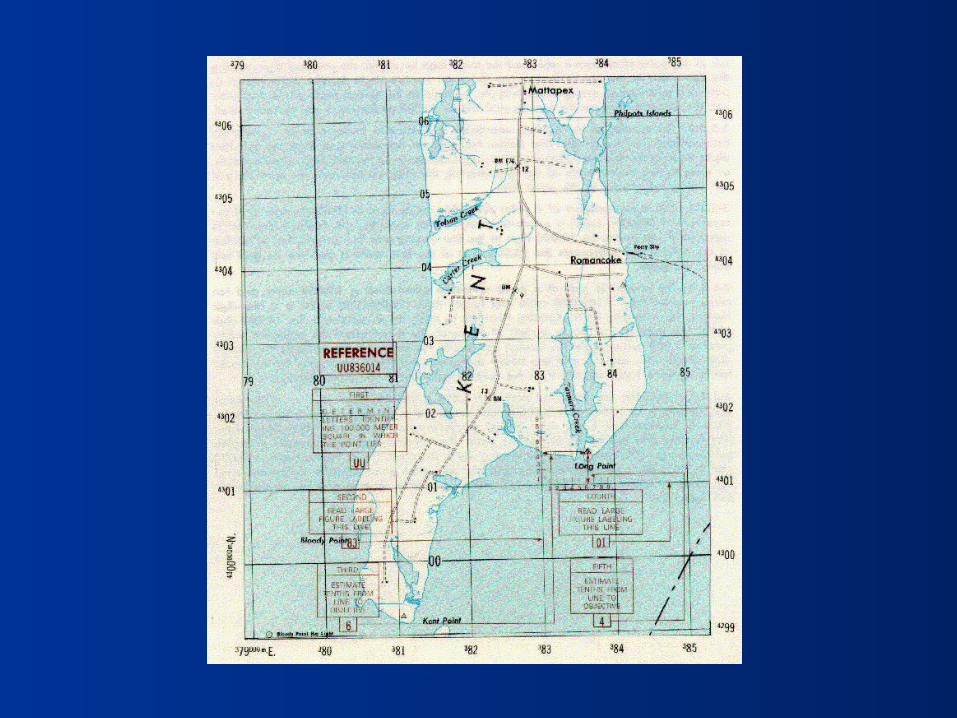
• A grid of blue lines on a map (eastings and northings) is used to identify squares in a grid pattern.
• This grid system is used mainly on topographic maps.

Why was the military Why was the military grid system grid system introduced?introduced?
• It was easier to place a grid system on a map then to use degrees, minutes and seconds from a globe.
• With the increasing range in artillery in WWI, latitude and longitude was too cumbersome.

Reading a Military GridReading a Military Grid
Easting: vertical line running from top to bottom on a topographic map
Northing: horizontal line across the topographic map.
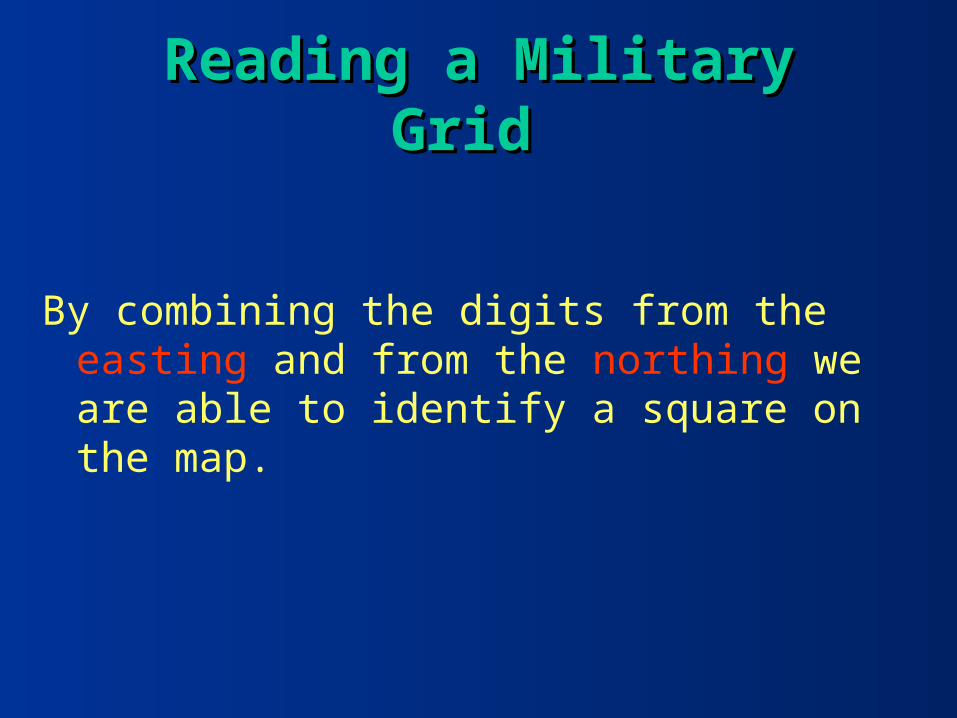
Reading a Military GridReading a Military Grid
By combining the digits from the easting and from the northing we are able to identify a square on the map.
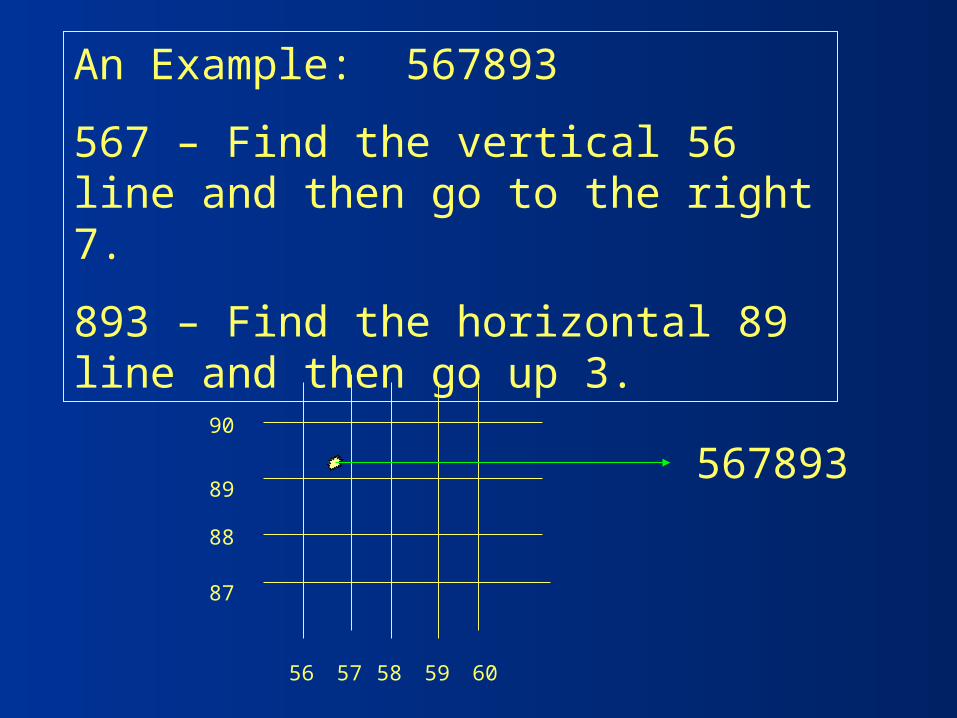
An Example: 567893
567 – Find the vertical 56 line and then go to the right 7.
893 – Find the horizontal 89 line and then go up 3.
56 57 58 59 60
87
88
89
90
567893

Alphanumeric GridAlphanumeric Grid
• This system uses LETTERSLETTERS and NUMBERSNUMBERS to identify squares in a grid pattern.
• This grid system is used mainly on Road Maps.Road Maps.

Reading an Reading an Alphanumeric GridAlphanumeric Grid
The LETTERS represent the horizontal lines.
The NUMBERS represent the lines running from the top to the bottom of the map.
The Alphanumeric grid system is not as not as accurateaccurate as the Military grid system or Latitude and Longitude.

A B C D1234
Map Types
We need different types of maps to portray different information
The three most common types are:1. General Purpose Maps 2. Thematic Maps3. Topographic Maps4. Digital Maps

General Purpose Maps

Thematic Maps

Topographic Maps - Contours
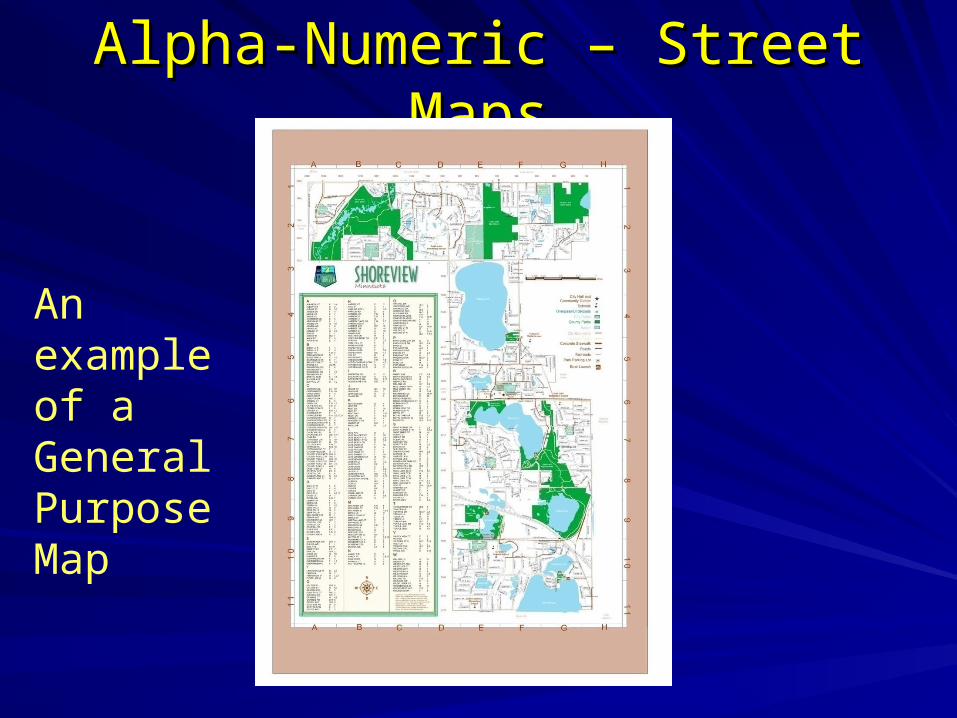
Alpha-Numeric – Street MapsAlpha-Numeric – Street Maps
An example of a General Purpose Map

Digital Maps – from Google Maps
What are some of the advantages of these type of new maps?
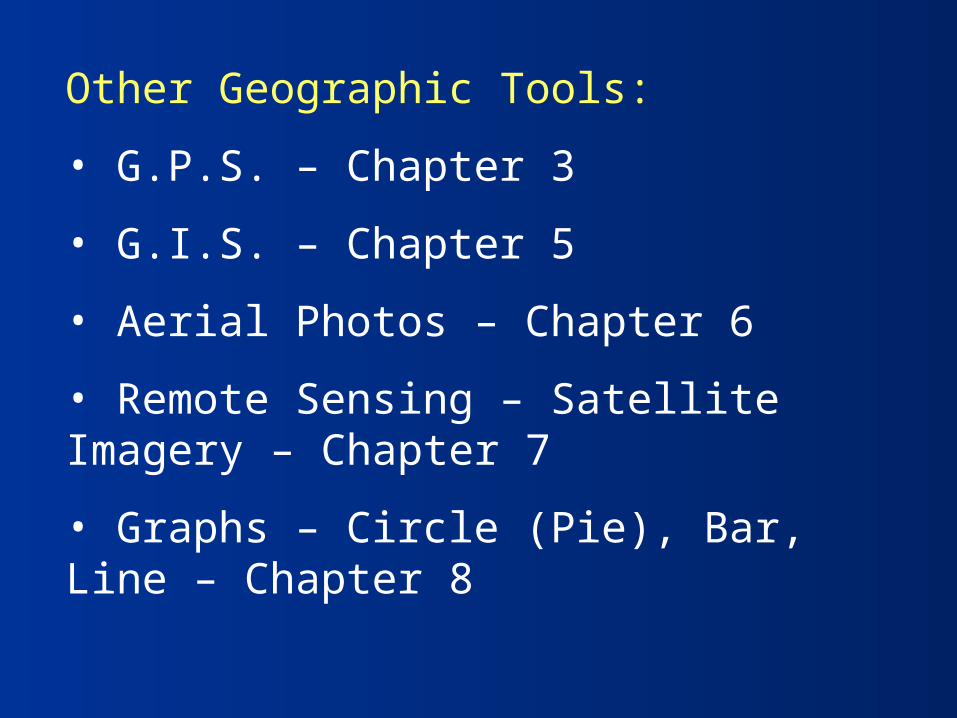
Other Geographic Tools:
• G.P.S. – Chapter 3
• G.I.S. – Chapter 5
• Aerial Photos – Chapter 6
• Remote Sensing – Satellite Imagery – Chapter 7
• Graphs – Circle (Pie), Bar, Line – Chapter 8

G.P.S.

G.I.S.

Aerial Photos
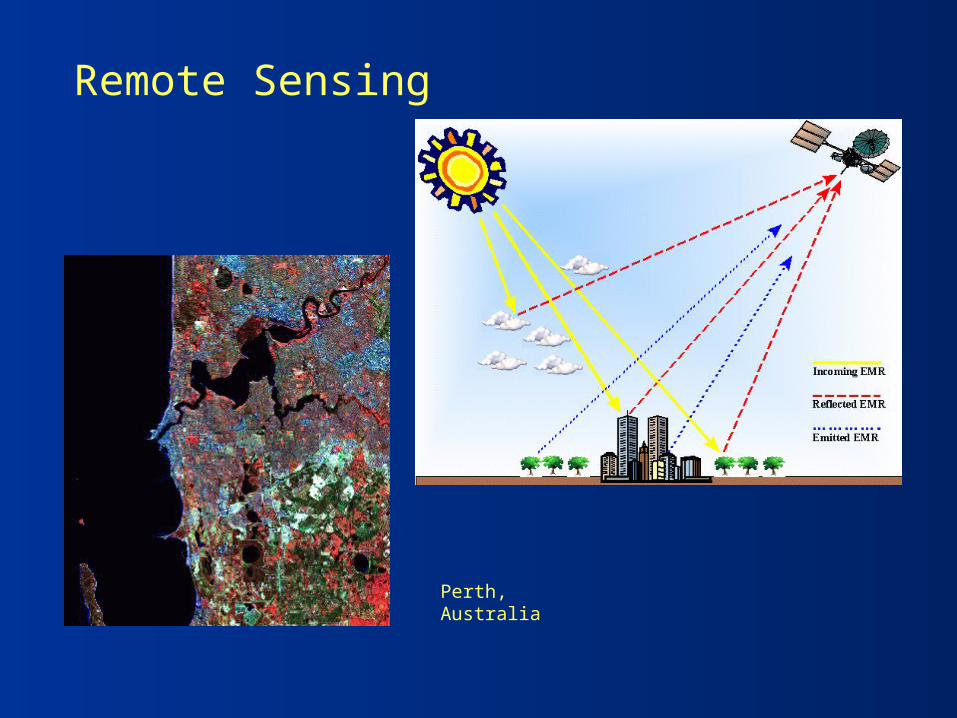
Remote Sensing
Perth, Australia

Graphs
The End!