geographic information systems & critical infrastructure ...shekhar/tli/gis_n_cip.pdf ·...
TRANSCRIPT

Geographic Information Systems &Critical Infrastructure Protection
Shashi ShekharMcKnight Distinguished University ProfessorDepartment of Computer Science and EngineeringUniversity of Minnesotawww.cs.umn.edu/~shekhar

CT 8330: Critical Infrastructure Protection (CIP)Technological Leadership Institute, University of Minnesota
Session on Geographic Information Systems & CIP
Supplementary Material: http://www.cs.umn.edu/~shekhar/tli/
Tu. June 27th, 2017, Alumni Center Rm. 235Tu. June 28th, 2016, Alumni Center Rm. 235Tu. June 23rd, 2015, Alumni Center Rm.235Tu. June 17th, 2014, Alumni Center Rm. 235Tu. June 18th, 2013Tu. June 19th, 2012Fr. June 17th, 2011Th. July 22nd, 2010

IntroductionsØ Round-table Introductions
Ø Name, AffiliationØ Background in GIS, GIS for CIPØ Objective for session on GIS and CIP

Learning ObjectivesWe should be able to answer the following questions after this session:
1. What is a Geographic Information System (GIS)?n What are GIS Data-layers?n What are common GIS Operations? What are their inputs and outputs?n What are Geo-referencing systems? Data transfer standards?
2. How may GIS help?n Critical Infrastructure Protection (CIP)? n Emergency Management (EM)?

Outline & Schedule (4 hours)
Hour Topics Lecture Exercise
0:00-0:30 Introductions 30 minutes
0:30 -1:00 Motivation 7 slides, 15 minutes 15 minutes
1:00-1:30 GIS: Data, Standards 14 slides, 15 minutes 15 minutes
1:30-2:00 GIS: Analytic Tools 14 slides, 15 minutes 15 minutes
2:00-2:15 Break 15 minutes
2:15-2:45 GIS for CIP - I 8 slides, 15 minutes 15 minutes
2:45-3:15 GIS for CIP - II 9 slides, 15 minutes 15 minutes
3:15-3:30 Case Study 6 slides, 10 minutes,Video (5-minutes)
3:30-3:45 Wrap-up 3 slides (5 minutes)

Outline
Ø MotivationØ GIS & London Cholera (1854)Ø GIS & WTC (2001)Ø GIS & DHS/CIP
Ø Basics of GISØ How can GIS help CIP ?Ø Case StudyØ Next

GIS & London Cholera • London Cholera, 1854• Before germ theory• John Snow
• Cluster around a water pump• disabling pump helped!
• Modern Use• Cancer clusters• Crime hotspots

GIS & World Trade Center
Source: Sean C. Ahern,Hunter College - CUNY
n Support firefighters, rescue workers, utility crews n 50+ GIS professionals for 2+ months


DHS & GIS• National Strategy for Homeland Security, 2002
• 6 Missions: Intelligence/Warning, Protect Key Infrastructure, …• 4 Foundations: Information Sharing and Systems, Law, …
• Homeland Security Presidential Directive 5 & 8, 2003• National Planning Scenarios• Universal Task List (UTL), Target Capability List (TCL)• National Response Plan
• National Incident Management System (NIMS), 2004• Incident Command System• Common Operational Picture

NIMS• Concepts and Principles
• A Common Operational Picture accessible across agencies
• Interoperability Standards • Geospatial Information (item 4)

Example DHS Scenario & GIS
§ Preparation of response to a chem-bio attack
§ Help public officials to make important decisions
§ Guide affected population to safety
Base Map Weather Data
Plume Dispersion
Demographics Information
Transportation Networks
( Images from www.fortune.com )

A recent use-caseØ Motivation:
Ø Reduce delaysØ Example: Tornado outbreak(2012)
Ø Approach:Ø Monitor TweetsØ Filter on disaster keywordsØ Color maps
Even before cable news outlets beganreporting the tornadoes that ripped throughTexas on Tuesday, a map of the state beganblinking red on a screen in the Red Cross' newsocial media monitoring center, alertingweather watchers that something washappening in the hard-hit area. (AP)
A tornado moves through the Dallas-Fort Worth area on Tuesday, April 3, 2012 in this still image taken from video. (Reuters TV/Reuters)

Active Learning Exercisen Learning Objectives: What is a Geographic Information System (GIS)?
n Activity: Review the following document: P. Folger, Geospatial Information and Geographic Information Systems (GIS): An Overview for Congress, Congressional Research Service Report 7-5700, www.crs.gov, May 18, 2011.
n Answer the following questions using the congressional report:
1. Provide a definition of GIS based on this report.
2. Name two GIS applications used in daily lives of millions of people.
3. The report lists examples of why and how geospatial information is used. Which two examples are relevant to Emergency Management?
4. Name two CIP related federal agencies, which are members of Federal Geographic Data Committee.

Active Learning Exercise (Extra)
n Learning Objectives: What is a Geographic Information System (GIS)?
n Activity: Review “Spatial Computing “, Communications of the ACM, 59(1), January, 2016 Short (4-minute) video overview .
n Answer the following questions using the above paper:
1. Name a few transformative spatial computing ideas beyond GIS.
2. List a few recent changes in the field of Spatial Computing.
3. List a short opportunity, which may help in CIP or Emergency Management.

Outline
Ø MotivationØ GIS: An Overview
Ø Basics of GISØ Transfer StandardsØ Analytical Tools
Ø How can GIS help CIP ?Ø Case StudyØ Next

Defining GISn Sample definitions
n “… a computer data system capable of capturing, storing, analyzing, and displaying geographically referenced information—information attached to a location, such as latitude and longitude, or street location” (USGS.gov)
n “… It allows you to analyze data visually and see patterns, trends, and relationships that might not be visible in tabular or written form.” (EPA.gov)
n Key: Spatial data are unique because they are linked to maps (location matters!)
n A GIS at least consists of n a database n map informationn a link between them
Source: www.epa.gov/region5fields/gis.html
What’s special about spatial?n Everything happens in geographic spacen Primitive = f(x, y, z, t)n Tobler’s lawn Geographical relationsn Hagerstrand’s time-space geographyn Makes search and query powerful

Geographic Mistakes - Coordinate Systemsn spatial.ly/2011/01/geographical-mistakes-keeping-geographers-busy
n Q? What is wrong with circular ranges of missiles (left bottom map)?n Correction: North Korea’s missiles (www.economist.com/node/1788311)

Basics I: Coordinate Systemsn Coordinate system
n a standardized method for assigning codes to locations n so that locations can be found using the codes alone.
n Two directionsn East-ing, e.g., x-direction value n North-ing, e.g., y-direction
n Two kinds of locationsn Relative location, e.g., units of map’s paper sheet n Absolute locations
n Geographic: Latitude, longitude, elevationn Projected: Universal Transverse Mercator System
n (& polar stereographic) n military gridn state plane
n Caution:n To compare maps, use common coordinate system.n To compute distance, direction, over large areas
n Coordinate systems mattern Earth as flat (locally), spherical, ellipsoidal, etc.

Alternative georeferencingn Symbolic Geo-referencing
n Place names (e.g., Dinkytown, Eyjafjallajökull, )n Street address (200 Union St. SE, MN 55455)n Internet URLs
n Geo-code symbolic to numerical geo-referencen Ex.: street address to latitude-longitude on mapn Reverse Geo-code: GPS reading to place-name
n A GIS package should be able to move between n map projections n coordinate systemsn datums, and Ellipsoidsn And do geocoding

22
Basics II: Spatial Data-Genresn Raster: geo-images e.g., Google Earth
n Vector: point, line, polygons
n Graph, e.g., roadmap: node, edge, path
Raster Data for UMN CampusCourtesy: UMN
Vector Data for UMN CampusCourtesy: MapQuest
Graph Data for UMN CampusCourtesy: Bing
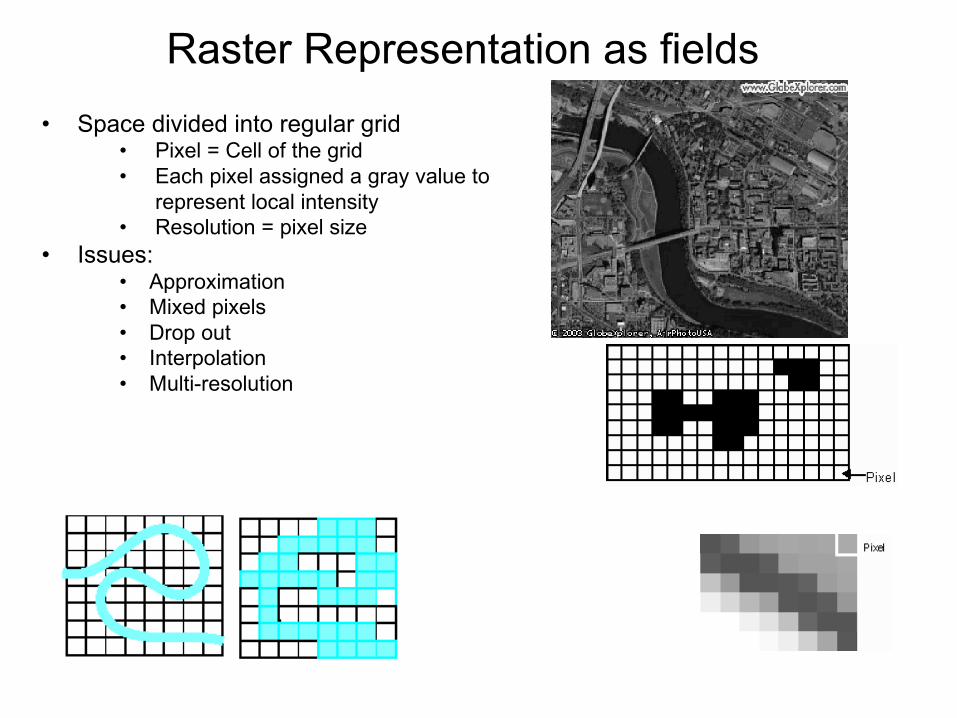
Raster Representation as fields• Space divided into regular grid
• Pixel = Cell of the grid• Each pixel assigned a gray value to
represent local intensity• Resolution = pixel size
• Issues:• Approximation• Mixed pixels• Drop out• Interpolation• Multi-resolution
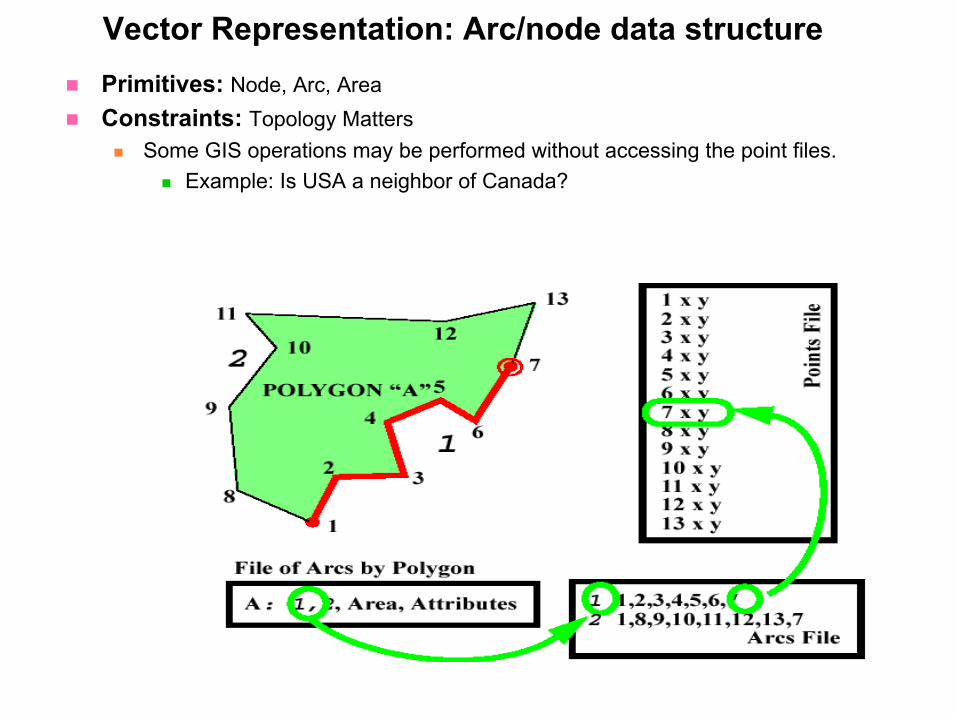
Vector Representation: Arc/node data structuren Primitives: Node, Arc, Arean Constraints: Topology Matters
n Some GIS operations may be performed without accessing the point files.n Example: Is USA a neighbor of Canada?

3D Terrain Models, e.g., Elevation
n Raster Representationn Regularly Spaced Grid, e.g., 50m to 500mn Pixel value represents local elevation
n Vector Representationsn Triangulated Irregular Networks (TIN)
n use optimal Delaunay triangulation of a set of irregularly distributed points.
n Contours
DEM GRID using ArcMap DEM TIN using ArcMap
Source for 5 pictures: SpatialSys.com
Contours

4D: Adding Time to GISn The missing t in (x, y, z, t)n Much interest in spatio-temporal dynamics, models
n GPS trajectoriesn Seasonal variation
n Only a few methods as yet, still researchn Spatial modeling tools in few GIS, e.g. CA in IDRISIn Transaction-based problem solved in 2D e.g. Oracle Spatial
Source: http://upload.wikimedia.org/wikipedia/commons/1/12/2004_Indonesia_Tsunami_100px.gif

OutlineØ MotivationØ GIS: An Overview
Ø Basics of GISØ Transfer StandardsØ Analytical Tools
Ø How can GIS help CIP ?Ø Case StudyØ Next

Data resources and Formatsn Data Sources
n NSDI clearinghousesn Geospatial One Stopn National Mapn GDT, ESRI etc. n Geography networkn Alexandria www.alexandria.ucsb.edun MetroGIS www.metrogis.org,
www.datafinder.org/catalog
n Data Formatsn SHP, E00n DXFn GeoTIFFn Imgn VPFn DRG, DEM,
DOQQn TIGER/SDTS
n Ex. Review MetroGIS datafinder to identify 3 data layers for estimating CIP.n What kinds of critical infrastructure are covered by these datasets?
n Caution: Data exchange by translation can lead to errors in attributes and in geometry.n Example: Digitization errors

Approach: Interoperability via Standards
• SDTS•A US federal standard (FIPS 173) in 1992.• terminology, set of references, list of features, transfer mechanism, accuracy standard.• Includes DLG and TIGER data formats• FGDC – standards for metadata and selected feature (e.g., raster profile)• Other standards efforts are DIGEST, DX-90, the Tri-Service Spatial Data Standards, …
• OGC• Open GIS Consortium, Inc. (www.opengis.org) with 256 members worlwide• Develops standards, Test Compliance• Simple feature model, WCS, WML, Sensor ML…
• ISO TC 211•19129 : GIS - Imagery, Gridded and Coverage Data•19130 : GIS-Sensor data model
• Agreement between OGC and ISO

Transfer Standards

OGC Initiativesn Recent
n Critical Infrastructure Protection Initiative, Phase 1.2 (CIPI 1.2) In Progress n Emergency Mapping Symbology, Phase 1 (EMS 1)In Progress n Land Information Initative, Phase 1 (LII-1)Initiatedn OGC Web Services, Phase 2 (OWS-2)Initiated
n Pastn Conformance & Interoperability Test & Evaluation, Phase 1 (CITE 1)n Geospatial Fusion Testbed (GFST) n Geographic Objects (GO-1) n Geospatial One-Stop - Portal Initiative (GOS-PI)n Multihazard Mapping Initiative, Phase 1 (MMI -1)n Object Domain Modeling Support (ODMS) Initiative (ODMS)n Open Location Services Testbed (OpenLS 1)n Web Mapping Testbed, Phase 1 (WMT 1)

Active Learning Exercisen Learning Objectives: What are Geo-referencing systems? Data transfer standards?
n Activity 1: Review MetroGIS (www.metrogis.org, www.datafinder.org/catalog)n Identify 3 data layers (and their data formats) for estimating CIP.n What kinds of critical infrastructure are covered by these datasets?n How up-to-date and complete are these datasets?n Which data transfer standards are supported?
n Activity 2: Revisit : P. Folger, Geospatial Information and Geographic Information Systems (GIS): An Overview for Congress, CRS Report 7-5700, www.crs.gov, 2011.
OMB Circular A-16 was issued to ensure that federal surveying and mapping activities met the needs of federal and state agencies and the general public and to avoid duplication of effort.
Name a federal GIS initiatives relevant to CIP and its contribution for data transfer standards.

OutlineØ MotivationØ GIS: An Overview
Ø Basics of GISØ Transfer StandardsØ Analytical Tools
Ø How can GIS help CIP ?Ø Case Studies

Prob
lem
Com
plex
ity
Recorded View Predictive ViewSpatial Data Analysis
Time
Situational Awareness
(area limitation study -where could they be?)
Knowledge Discovery
(correlating signatures to predict events)
Data Bases, Queries
Situational Awareness
Predictive Analysis
Knowledge Discovery
Captures observations and information needs
Where are the hot-spots? When are Hot-moments?
How does situation this year compares with historic data?
CUAHSI
USGS
From known classes (e.g. terrorist attack, hazmat spills, …), which class of event does this represent?
Predict impact of an event given other environmental and socio-economic variables.
What other events could occur with this pattern?
e.g. bar closing or evacuation => crime events nearby a little later
(1)
(2)
(3)
(4)

Analytic Tools and GISn Functionality:
n Searches based on spatial relationships, e.g. distance
n Spatial Statisticsn Spatial Models, e.g. plume
simulationn Spatio-temporal
n Example Toolsn ESRI ArcGIS, ArcViewn AutoCAD Mapn GRASSn IDRISI (Clark University,
Worchester, MA)

Analytic Tools and GIS
n Measurements , e.g., Distance, perimeter, adjacency, directionn Ex.: Open Google Maps (not in Lite mode)n Right-click on starting point. Choose Measure distance.n Click anywhere on map to create a path to measure.
n Search n Location analysis n Terrain analysis n Flow analysis n Spatial Patternsn Create new maps

Searchn Search : Thematic search; Search by region, proximity, nearest neighbor, …n CIP Example: What is near a planned electric power transmission line (red)?
n A gas pipeline (yellow)n Mitigation: Protect gas line during construction Or relocate to avoid spatial
interdependencyn Source: (Abdalla 2010)

Location Analysisn Location analysis: Buffer, corridor, overlay, …n CIP Example: Defective (yellow) electric power station => outage area (circle)
n Affects backup (red) communication line between data centersn Mitigation: Establish alternative communication
n Source: (Abdalla 2010)

Location Analysis - 2n Location analysis: Buffer, corridor, overlay, …
n Distance or Travel time
n CIP Example: Hospital Drive Time
n Another example: Ecology
Source: Nevada’s approach to CIP (publicintelligence.info/nevadasilvershield.pdf)

Terrain Analysisn Terrain analysis : Slope/aspect, catchment, drainage, Floodsn CIP Example: Flood prediction using Terrain contours and predicted precipitation
n Includes a transmission line powering a air traffic radio beaconn Mitigation: protect beacon by sandbags, backup generator at beacon
n Source: (Abdalla 2010)
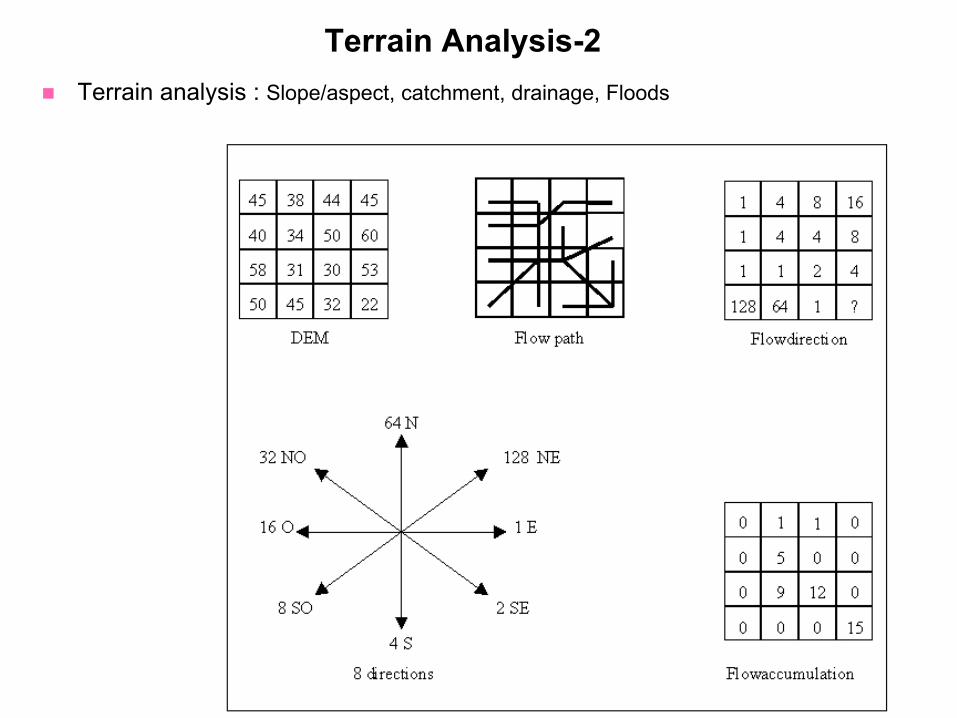
Terrain Analysis-2n Terrain analysis : Slope/aspect, catchment, drainage, Floods

Flow Analysis n Flow analysis : Connectivity, shortest path, travel-time mapn CIP Example: A flood shuts down a power substation (!)
n serving an air traffic control (tower) and a chemical plant (triangle)n Source: (Abdalla 2010)

Flow Analysis - 2
n Flow analysis n Connectivity n Shortest path n Travel-time map

Spatial Patternsn Spatial Patterns
n Spatial autocorrelation, Distribution Change detection, …n Hotspot, Colocation, …
n CIP Example:

Spatial Patterns
45
RHD Source: Ring-Shaped Hotspot Detection: A Summary of Results, IEEE Intl. Conf. on Data Mining, 2014 (w/ E. Eftelioglu et al.)

Create new Mapsn Create new maps: map overlay, re-classification, …n CIP Example: No fly zones for UAVs
n Overlays airports, military bases, national parks, temporary restrictions (e.g., events)

Simulation to Project Scenarios
Oil Refinery Scenario Reservoir Dam Scenario
• Simulation for Scenario based planning• Specify incident location• Project impact footprint using a physical model
• Plume simulation using gas/particle dispersion• Flood simulation using water flow

Create new Mapsn Create new maps: map overlay, re-classification, n CIP Example: South Portland's City Council on Monday approved a buffer between important
public facilities and liquefied natural gas distribution plants. The buffers are shown on the map as light blue shaded circles around important public facilities. Courtesy city of South Portland
Active Learning Exercisen Learning Objectives
n What are GIS Data-layers?n What are common GIS Operations? What are their inputs and outputs?
n Learning Objectives: Why and how GIS is use in CIP?
n Activity: Use Google Maps to measure (straight line as well as driving) distance between the MSP airport and University of Minnesota.
n Activity: Review D. Fletcher, Spatial Information Technologies in CIP : A Research Agenda , National Consortium on Remote Sensing in Transportation - Infrastructure Management, USDOT Research and Special Programs Administration, 2002.
1. What are critical transportation infrastructures (CTI)? Provide two examples. 2. Review sample CTI disaster information needs (pp. 4). Which of these are geo-spatial?3. What is remote sensing? How may it help assess infrastructure damage?4. Match GIS benefits in disaster management (pp. 6) with GIS Analytic Tools, e.g.,
measurements, search, location analysis, terrain analysis, flow analysis, spatial patterns, …

Active Learning Exercise (Extra)n Learning Objectives
n What are GIS Data-layers?n What are common GIS Operations? What are their inputs and outputs?
n Activity: Revisit : P. Folger, Geospatial Information and Geographic Information Systems (GIS): An Overview for Congress, CRS Report 7-5700, www.crs.gov, 2011.
(a) The attributes of different types of geospatial data - such as roads and bridges, buildings, lakes and rivers, counties - can each constitute a layer or theme in GIS. List three layers of geospatial information relevant to CIP.
(b) The power of GIS is the ability to combine geospatial information in unique ways - by layers or themes - and extract something new. List two possible use of such power in context of emergency management using specific GIS operations discussed in last slide.

Outline
Ø MotivationØ Basics of GISØ How can GIS help CIP ?
Ø Critical InfrastructureØ Role of GIS in CIP
Ø Next

Critical Infrastructure (CI)
“systems and assets, whether physical or virtual, so vital to the United States that the incapacity or destruction of such systems and assets would have a debilitating impact on security, national economic security, national public health or safety, or any combination of those matters” (Patriot Act, 2001)
“The framework of interdependent networks and systems comprising identifiable industries, institutions and distribution capabilities that provide a reliable flow of products and services essential to the defense and economic security of the of the US, the smooth functioning of government at all levels, and society as a whole.” - President’s Commission on Critical Infrastructure Protection, Critical Foundations Protecting America’s Infrastructure, 1997
Q? Which CIs are geo-spatial ?

Why are CIs critical ?n Provide basic support for life, livelihood, and communitiesn Disruption affects all sectors: businesses, households, other CIsn CIs are vulnerable to physical damage in disasters
n 1993 Midwest Floods, 1994 Northridge Earthquake, 2003 Northeast Blackout,

Economic impactsn 1993 Midwest floods : Des Moines (IA)
suffered more loss from infrastructure outage than from physical flooding
n 1994 Northridge EQ highway damage accounted for 27% (US$1.5 billion) of regional business loss
n 1995 Kobe EQ: massive failures of virtually all major infrastructures essentially lead to cessation of urban economic functions
n 2003 Northeast blackout estimated to have cost US$4.5~$10.0 billion in economic loss
Highway bridge damage in Northridge earthquake (photo: EERI)

Household impacts
n Infrastructure outages can affect households in complex waysn Public safety dangers from utility loss and traffic delays for first respondersn Infrastructure outage could force households to seek emergency sheltern Infrastructure loss may compound or even cause health problems and injuriesn Business disruption may cause job loss or financial hardship; etc.
n Some socio-economic groups (e.g., elderly) are especially vulnerable
n One survey found that households gave highest priority in disaster policy ton Electric powern Water n Hospitals

Mapping Critical Facilities & Infrastructuren Critical Facilities
n Cultural Significance, Public Assembly, Technological Hazards, Economic, Critical to City Operation
n Critical Infrastructuren Power, Telecom, Water,
Transportation, …
Source: Nevada’s approach to CIP (publicintelligence.info/nevadasilvershield.pdf)

Infrastructure Interdependencies
Power outage in Kobe led to:
n Loss of water filtration plants & pump stationsn Fire ignitions from natural gas leaks and
electricity sparksn Malfunction of traffic signalsn Loss of satellite emergency communicationsn Hospital shutdownsn Loss of water and elevators in high-risesn Lack of heating at emergency shelters
Urban fires in 1995 Kobe Earthquake
“bidirectional relationship between two infrastructures through which the state of each infrastructure influences or is correlated to the state of the other”(Rinaldi et al., 2001)
(Source: Nojima and Kameda, 1996)

Geospatial Interdependencies• Geographic proximity of infrastructure components
• Common corridor• Transmission lines, water pipelines, gas pipelines, telecommunications
• Geographic catastrophe impacts multiple infrastructures• Electric fire may ignite gas pipelines
Source: The Geospatial Dimensions of Critical Infrastructure and Emergency Response : No 1 - Infrastructure Interdependencies , GITA Whitepaper, 2008.

Physical Interdependencies
Transportfor
Electricityfor
Water for Telecom for
Oil, Gas for
Hospital for
Transport
Traffic signals Cooling, cleaning
Communications
Vehicle fuel, lube
Electricity
Ship fuel Cooling, Cleaning
SCADA Generator fuel
Water Cleaning supplies
Pumping, control
SCADA Pump fuel
Telecom Shipping supplies
Switches Cooling Heat building
Oil, Gas Supply chain
Compressor, storage control
Cooling, production
SCADA
Hospital
Exercise: Fill out interaction of various CI with Hospital and Public Health.

Water
Transpor-tationOil
Telecom
NaturalGasElectric
Power
Interdependencies

Active Learning Exercise
n Learning Objectives: Why and how GIS is used in CIP ?
n Activity: Review “The Geospatial Dimensions of Critical Infrastructure and Emergency Response : No. 1 - Infrastructure Interdependencies”, GITA Whitepaper, 2008.
1. What is a geospatial interdependency? Provide an example to illustrate your definition.2. How is geospatial interdependency different from physical interdependency ? 3. Report states that “mutual dependence and interconnectedness made possible by the
information and communications infrastructure lead to the possibility that our infrastructures may be vulnerable in ways they never have been before.“
Which GIS operations may be used to identify geospatial interdependencies among critical infrastructure components such as transportation, energy, water, communications, etc. ?

Active Learning Exercise (Extra)
n Learning Objectives: Why and how GIS is used in CIP ?
n Activity: Review “Location-Based Critical Infrastructure Interdependency , R. Abdalla et al., DRDC Report 2009-130, Defense R&D Canada, Toronto 2010.
1. What is a geographic or spatial interdependency? (Section 3.2, pp. 5 & sc. 5.3.1, p. 13).2. What is location-based Critical Infrastructure Interdependency (LBCII)? List 6 steps of
LBCII. List 3 components of LBCII. (Section 4, pp. 8-11).3. List a few GIS analytical tools used in the Vancouver case study in Section 5.3. Recall
GIS Analytic tools include measurements, search, location analysis, terrain analysis, flow analysis, spatial patterns, etc.

Outline
Ø MotivationØ Basics of GISØ How can GIS help CIP ?
Ø Critical InfrastructureØ Role of GIS in CIP
Ø Next

Disasters• Natural
– Flood, Tsunami, Winter Storm, Thunderstorm, Tornado, Hurricane– Earthquake, Volcano, Landslide, Fire or Wildfire, Heat
• Man-made, Technological – Terrorism, Nuclear Power Plant Emergency– Dam Failure, Chemical Emergencies, Hazardous Material

Disaster Resilience• Resilience
– Survival through natural & man-made disasters– Needs never exceed resources & ability to respond– Physical, Emotional, Relationship and Spiritual
• Disaster life-cycle phases– Risk Assessment– Risk Reduction & Mitigation– Prevention & Preparedness– Response– Recovery
• Disaster Resilience for critical infrastructure• Critical infrastructure for Disaster Resilience

Risk Assessment: Risk Maps

Government Center
TheatreFarm Chemicals
Hospital
Chemical Factory
TelephoneSwitching
Risk Assessment: Mapping Critical Assets

Preventionn Delay an adversary from gaining access to critical infrastructure is paramount
n such as Pumping Stations , Substations, Regulator Stations, Switching Centers
n Equipment or technology to delay entry or access is based on n its spatial relationship to the critical facility or infrastructure
GIS uses include:n Perimeter Management n Barrier Management n Patrol route planningn Persistence Surveillance

Prevention: Perimeter Management

Preparedness: Modeling Scenarios
Oil Refinery Scenario Reservoir Dam Scenario
• GIS for Scenario based planning• Specify incident location• Map impact footprint using a model, e.g., plume simulation• Assess vulnerable population using demographic maps• Plan response, e.g., evacuation routes or shelter in place• …

Preparedness: Emergency Management Planning

Detection & Response
n Detection is accomplished using n video motion detectors n infrared n vibration n closed-circuit television n proximity sensors n and modeling tools.
n GIS uses include:n Emergency Management Planning n Mapping Critical Asset Locationsn Infrastructure Inventoryn Modeling Events
Ground Sensors
Airport SecurityViewshed
Sentry Placement

Response & Recovery
n GIS is used to create a common operational view during response.
n GIS uses in Recovery include:n Customer Reliabilityn Emergency Vehicle Dispatch
and Trackingn System Restoration Monitoringn Damage Assessment

Response: Situation Awareness
n Provide a real-time situation awareness
n Where are affected people?n Which roads and sites are usable?q Structural health and performance, …
OBJECTIVES
GIS Technologies q Field deployable in an ad-hoc environment
q Floodq Partial Infrastructure loss (e.g. electricity,
cell towers, Internet, …)q Remote sensing: air, satellite, … q VGI, e.g. OpenStreetMapq Citizens as sensors, e.g. Tweetsq In-situ sensing
q Reestablish within 12-24 hoursq Despite poor infrastructure

Active Learning Exercisen Learning Objectives
n Why and how GIS is used in Critical Infrastructure Protection (CIP)?
n Activity: Review: M. Kulawiak et al, “Geographical Information System for Analysis of Critical Infrastructures and their Hazards due to Terrorism, Man-Originated Catastrophes and Natural Disasters for the City of Gdansk”, in Information Fusion and Geographic Information Systems (Ed. V.V. Popovich et al.).
1. Name two GIS layers used in this case study.2. Name two kinds of GIS analysis used in this case study.3. Did the case study address the issue of interoperability across data sources?4. Did it address the issue of data accuracy?5. Is their system capable of addressing multiple incident?

OutlineØ MotivationØ Basics of GISØ How can GIS help CIP ?Ø Case StudyØ Next

77
Scenario- Nuclear Power Plant Accident
Nuclear Power Plants in Minnesota
Twin Cities

78
Buffer Zone (10-miles) Around a Nuclear Power Plant
Affected Cities
Monticello Power Plant
Evacuation Destination
U of M

79
A Scenario: Monticello Emergency Planning Zone and Population
Monticello EPZSubarea Population2 4,675 5N 3,9945E 9,6455S 6,7495W 2,23610N 39110E 1,78510SE 1,39010S 4,616 10SW 3,40810W 2,35410NW 707Total 41,950
Emergency Planning Zone (EPZ) is a 10-mile radius around the plant divided into sub areas.
Data source: Minnesota DPS & DHS Web site: http://www.dps.state.mn.us
http://www.dhs.state.mn.us

80
Evacuation Routes
MonticelloPower Plant
Twin Cities
Evacuation Destination
Estimate EPZ evacuation time:Summer/Winter (good weather):3 hours, 30 minutesWinter (adverse weather):5 hours, 40 minutes

81
Scenarios for Metro Evacuation
Scenario Evacuation Zone
Possible Event Locations
Evacuation Population
Evacuation Destination
Nuclear Detonation –10-Kiloton Improvised
Nuclear Device
Large (50 m.) Entire Metro Over 2 million. Out of Evac.
Zone
Chemical Attack – Blister Agent
Medium(2-5 m.) CBD (Mpls, St. Paul) TBD Out of Evac.
ZoneChemical Attack – Toxic
Industrial ChemicalsMedium(2-5 m.)
Refinery(Newport) TBD Out of Evac.
ZoneChemical Attack – Nerve
AgentMedium(2-5 m.) CBD (Mpls, St. Paul) TBD Out of Evac.
ZoneChemical Attack – Chlorine
Tank ExplosionMedium (2-5 m.) Rail yards TBD Out of Evac.
ZoneRadiological Attack –
Radiological Dispersal Devices
Medium (2-5 m.) CBD (Mpls, St. Paul) TBD Out of Evac.
Zone
Explosives Attack –Improvised Explosive
Device
Small(1-2 m.)
Mall of America,U of M sports event
TBD Out of Evac. Zone

Research Theme 1: Spatial Databases
only in old planOnly in new plan In both plans
Evacutation Route Planning
Parallelize Range Queries
Storing graphs in disk blocksShortest Paths

OutlineØ MotivationØ Basics of GISØ How can GIS help CIP ?Ø Case StudyØ Next
Ø geospatial.umn.eduØ Csci 5715: Spatial Computing (Fall 2014)

Looking Aheadn Csci 5715: From GPS and Google Earth to Spatial Computing
n Fall 2016: Mondays 630pm-9pm, 3-115 Keller Hall (9/12-12/12)
n Topics: Positioning, Remote Sensing, Spatial Statistics and Data Mining, Spatial Databases (SQL3/OGIS), data-structures (e.g., R-tree, Vornoi diagram), algorithms (e.g., routing), Geo-visualization (e.g., cartography).
n Recent Syllabus: http://www.spatial.cs.umn.edu/Courses/Fall15/5715/

Spatial Resources at UMNn Provides training on spatial tools and data-sets
n Recent Workshops:
n Mapping 101: Introduction to Spatial Analysis using ArcGIS Online
n Desktop GIS 101: Analyzing Data and Creating Maps
n SQL 101: Spatial Data Revealed
n Imagery 101: Discovering Commercial Satellite Imagery with DigitalGlobe Basemap
n LiDAR 101: Basics of Using LiDAR Data
n Cartography 101: Designing Appealing Maps
n Esri Virtual Campus
n Details: https://uspatial.umn.edu/

Other Resources on GIS & CIPn 2016 book