geographic information systems and emergency … · contacted each state agency involved for...
TRANSCRIPT

Copyright © 2003 John M. Morgan, III and Matthew S. Felton All Rights Reserved
GEOGRAPHIC INFORMATION SYSTEMS AND EMERGENCY MANAGEMENT: LESSONS LEARNED DURING HURRICANE ISABEL
John M. Morgan, III, Ph.D. Matthew S. Felton
November 27, 2003
Center for Geographic Information Sciences Towson University 8000 York Road
Baltimore, Maryland 21252-0001

Copyright © 2003 Towson University Center for Geographic Information Sciences
2
Preface
The Center for Geographic Information Sciences at Towson University is pleased to have had an opportunity to provide 24/7 volunteer GIS support to the State’s Emergency Operations Center (EOC) during the Hurricane Isabel emergency. The purpose of this report is to document the lessons learned by CGIS staff during their time at the EOC. This report describes events prior to, during, and immediately following the actual emergency. Because Hurricane Isabel represents the first large-scale use of GIS in support of emergency preparedness and management by MEMA and the EOC, it is hoped that CGIS’s experiences will form the basis for the use of GIS by the EOC in the future.
This report incorporates comments provided by MEMA staff. We appreciate the assistance of Seamus Mooney, who coordinated the review of this report within MEMA. We also appreciate the assistance of the CGIS Technical Writer, Susan Wooden, who reviewed the document and prepared the executive summary.
John M. Morgan, III, Ph.D. Matthew S. Felton
Copyright © 2003 Towson University Center for Geographic Information Sciences
3
Executive Summary
This report documents lessons learned by the Center for Geographic Information Sciences (CGIS) while providing volunteer geographic information systems (GIS) support to the Maryland Emergency Management Agency (MEMA) and the Emergency Operation Center (EOC) during Hurricane Isabel in September 2003. Responding to a call for assistance at a meeting of the Executive Committee of the Maryland State Geographic Information Committee (MSGIC), Dr. Jay Morgan, Director of CGIS, had written to Don Keldson, Director of MEMA, offering GIS assistance, an offer they discussed further at Towson University on August 24, during a demo of the Emergency Management Mapping Application (EMMA), a Web-based application recently developed by CGIS. With Hurricane Isabel’s potential to make land fall in the Mid-Atlantic area, MEMA accepted CGIS’s offer of GIS support on September 13.
CGIS began mobilizing staff and resources on September 15. CGIS contacted each state agency involved for permission to use their data at the EOC. CGIS also contacted the Maryland Department of Planning for permission to use MdProperty View data for a beta test version of EMMA. Based on CGIS’s recommendation, MEMA IT staff loaded ESRI’s ArcView 8.3 on their GIS computer, an upgrade from ArcView 3.2. CGIS devised a system for backup equipment and uninterrupted server use, and participated in a pre-activation meeting on September 16. At 6:00 PM on September 17, CGIS began providing 24/7 coverage to the EOC, with four two-member teams on 12-hour shifts.
CGIS staff members remained consistently occupied. They requested and received a variety of work-related items, including additional tables, network access, and printer connections. CGIS and MEMA staff members agree on the benefits of the cooperative experience. To improve the EOC’s GIS capabilities, CGIS staff developed the following recommendations. Data: a point file of critical state facilities; specific ArcGIS Layer files; comprehensive layout templates; a set of standard maps; real-time data feeds; interoperability of MEMA/FEMA geospatial data; and census data on vulnerable populations. Hardware and software: increased computing and plotting capabilities; an internal computing network and secure FTP site; a larger work space; and space on MEMA’s Web site for current emergency information. Procedures: Global Positioning System units for first responders; map request forms; a GIS-specific review of MEMA’s action plan along with tighter integration of GIS; and MEMA GIS coordinator participation in strategy meetings. People: a one-day GIS workshop for state agency representatives to the EOC; and a focus group session.
Because Hurricane Isabel represents the first large-scale use of GIS in support of emergency preparedness and management by MEMA and the EOC, it is hoped that CGIS’s experiences will form the basis for expanded use of GIS by the EOC in the future.

Copyright © 2003 Towson University Center for Geographic Information Sciences
4
GEOGRAPHIC INFORMATION SYSTEMS AND EMERGENCY MANAGEMENT: LESSONS LEARNED DURING HURRICANE ISABEL
Pre-Isabel Emergency
In a May 15, 2003 letter to the director of the Maryland Emergency
Management Agency, Dr. Jay Morgan, Director of the Center for GIS, offered volunteer GIS support to the State’s Emergency Operations Center (EOC) in the event of an emergency. Jay Morgan sent the letter in response to a call for assistance made at a meeting of the Executive Committee of the Maryland State Geographic Information Committee (MSGIC). He discussed the idea further with Don Keldson, MEMA Director, at a demo of the Emergency Management Mapping Application (EMMA) at Towson University on August 24, 2003. EMMA is a Web-based emergency services application CGIS is developing that allows an organization to pull up all relevant information as first and early responders pull up to a scene.
Figure 1. NASA's Terra satellite image (true-color composite) taken at 11:50 AM
EDT on September 18, 2003 just as heart of Isabel was making landfall.
With the growing potential of Hurricane Isabel to make landfall in the Mid-Atlantic area, Jay Morgan reiterated his willingness to provide volunteer GIS support to the EOC at a meeting with Kimberly Golden on Friday, September 12. CGIS was informed via email on Saturday, September 13 that MEMA had accepted the offer of support.
Copyright © 2003 Towson University Center for Geographic Information Sciences
5
Planning
The effort to mobilize CGIS staff and resources to provide 24/7 GIS support at the EOC for the duration of the Hurricane Isabel event began on Monday, September 15. CGIS staff met to determine data requirements, staff resources, and necessary supplies and equipment to take to the EOC. In addition, selected MSGIC Executive Committee members (Jack Martin of Maryland State Highway Administration, and Ken Miller of Maryland Department of Natural Resources) were contacted and asked to suggest additional data that could be utilized during the emergency. The Maryland Department of Planning was also contacted in order to determine if MdProperty View data could be used as part of a beta test version of EMMA. MSGIC and the Maryland Department of Planning responded quickly to our request for assistance.
The data we identified to take to the EOC consisted of a number of vector and raster layers (Table 1). These layers included data developed by various state agencies and several commercial data sets. CGIS developed much of the data under contract for state agencies, including hazard mitigation data being developed for MEMA. Each state agency involved was contacted to assure that CGIS had permission to use the data at the EOC. CGIS purchased a 250 GB Maxtor external drive to transport the vector and raster data sets to the EOC.
CGIS was asked to participate in a pre-activation meeting at the EOC on Tuesday, September 16. On arrival at the EOC, CGIS staff determined that only one computer had been allocated by MEMA to support GIS work. The designated GIS computer, along with all the other computers in the EOC, had been loaded with ArcView 3.2. It is interesting to note that a request to load ArcView 8.3 on the designated GIS computer had been made by MEMA staff to their IT Deparment on Monday. This request was not acted upon until CGIS staff provided reassurance to MEMA’s IT staff that the installation of ArcView 8.3 would not impact the other operations of the designated GIS computer or their network.
Because the designated GIS computer is used by MEMA staff, CGIS decided to take a Pentium 4 desktop PC as well as a laptop to the EOC. The two CGIS computers were installed at the EOC on Wednesday morning. An extra laptop was also taken to the EOC to be used in the event of a problem with either of CGIS’s two computers or MEMA’s designated GIS computer.
Deployment During the Isabel Emergency
CGIS began providing 24/7 support to the EOC at 6:00 PM on Wednesday, September 17. Two-member teams were assigned to work a 12-hour shift. By organizing four teams, voluntary 24/7 GIS support was guaranteed from Wednesday evening through Saturday morning without having to assign a team to more than one shift. The eight CGIS staff members involved each had
Copyright © 2003 Towson University Center for Geographic Information Sciences
6
substantial ArcView and ArcGIS experience. One of the two team members was designated as the team leader during their shift. Teams were instructed to arrive an hour prior to the beginning of their shift to assure an orderly transition between teams.
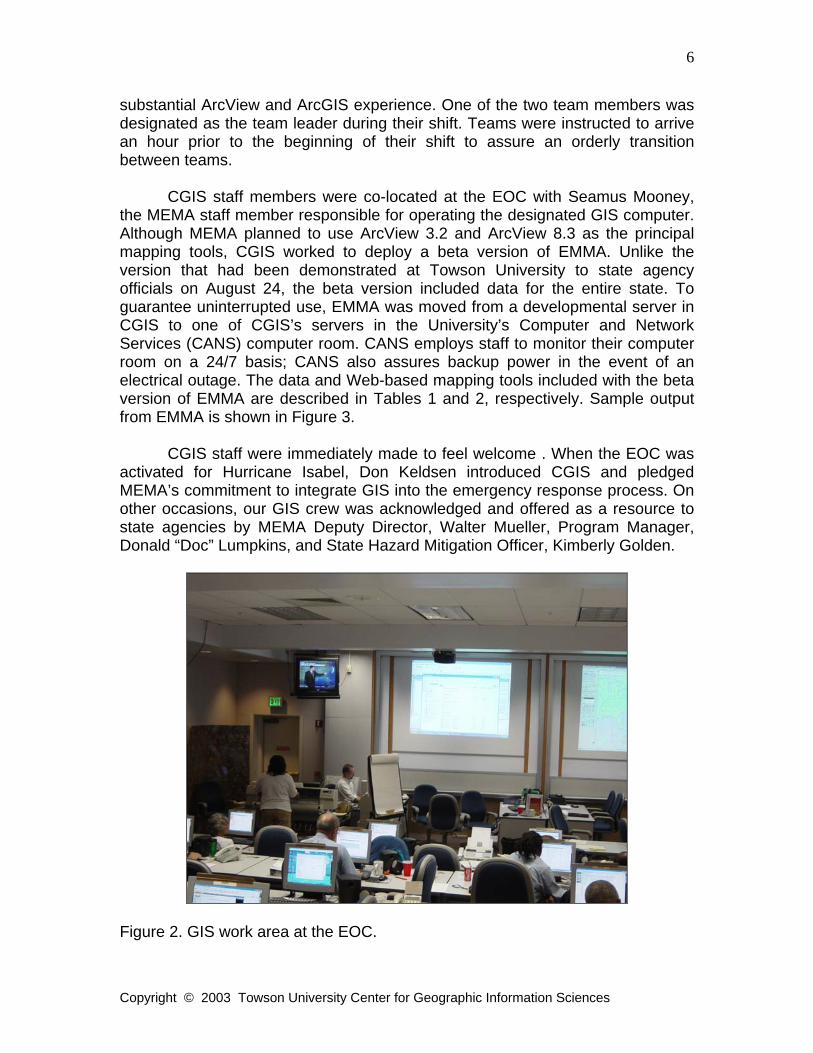
CGIS staff members were co-located at the EOC with Seamus Mooney, the MEMA staff member responsible for operating the designated GIS computer. Although MEMA planned to use ArcView 3.2 and ArcView 8.3 as the principal mapping tools, CGIS worked to deploy a beta version of EMMA. Unlike the version that had been demonstrated at Towson University to state agency officials on August 24, the beta version included data for the entire state. To guarantee uninterrupted use, EMMA was moved from a developmental server in CGIS to one of CGIS’s servers in the University’s Computer and Network Services (CANS) computer room. CANS employs staff to monitor their computer room on a 24/7 basis; CANS also assures backup power in the event of an electrical outage. The data and Web-based mapping tools included with the beta version of EMMA are described in Tables 1 and 2, respectively. Sample output from EMMA is shown in Figure 3.
CGIS staff were immediately made to feel welcome . When the EOC was activated for Hurricane Isabel, Don Keldsen introduced CGIS and pledged MEMA’s commitment to integrate GIS into the emergency response process. On other occasions, our GIS crew was acknowledged and offered as a resource to state agencies by MEMA Deputy Director, Walter Mueller, Program Manager, Donald “Doc” Lumpkins, and State Hazard Mitigation Officer, Kimberly Golden.
Figure 2. GIS work area at the EOC.

Copyright © 2003 Towson University Center for Geographic Information Sciences
7
Figure 3. Sample EMMA screen.
CGIS provided volunteer staff to the EOC continuously from 6:00 PM on Wednesday, September 17 through 6:00 PM on Saturday, September 20, as well as from 10:00 AM to 5:00 PM on Sunday, September 21. CGIS staff members were constantly occuppied from Wednesday evening through Sunday afternoon. Throughout this period, MEMA staff members accommodated CGIS staff needs. As newcomers to the EOC, CGIS staff requested and received a variety of work-related articles, including additional tables, network access, and printer connections.
Figure 4. Responding to requests for customized maps.

Copyright © 2003 Towson University Center for Geographic Information Sciences
8
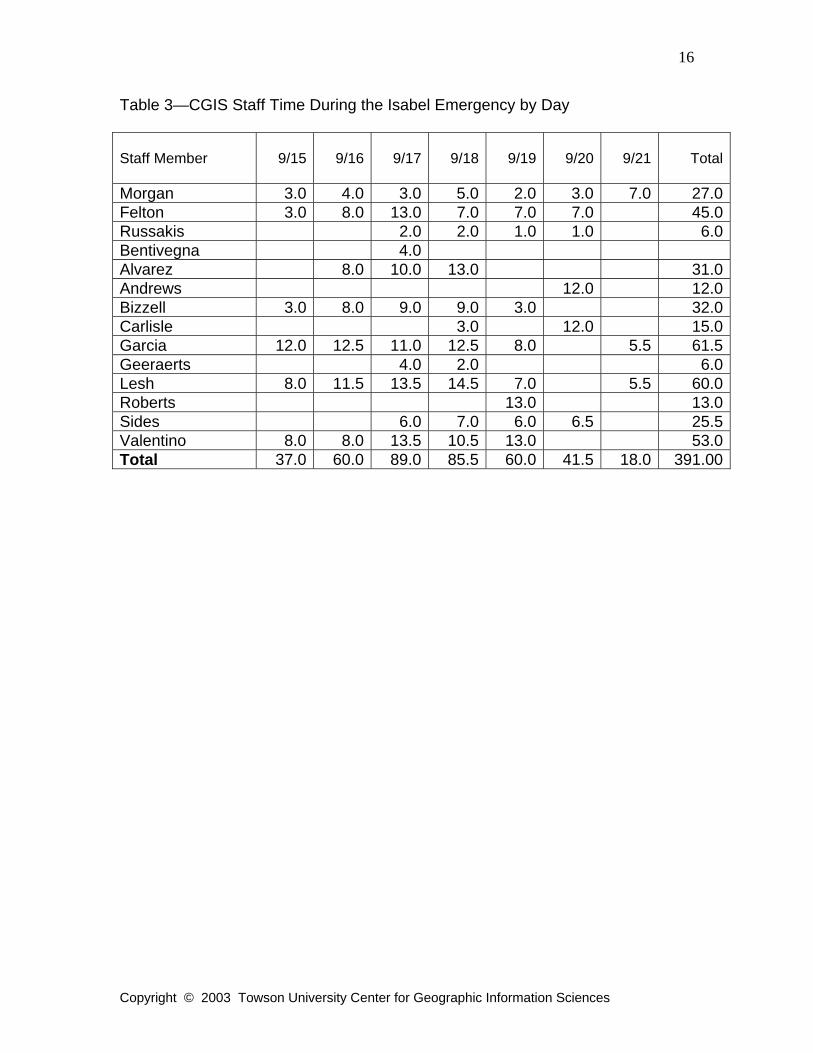
CGIS volunteered a total of 391.0 staff hours during the Isabel emergency. A detailed description of staff time is included in Table 3. This table does not reflect the time required to prepare and edit this report. If and when events require the EOC to be activated in the near future, CGIS staff will be available to provide volunteer 24/7 GIS support, as needed.
Post-Isabel Emergency Issues
To date, the only post-Isabel activity that CGIS has been asked to respond to was an email request by FEMA for hurricane storm surge inundation data.
Recommendations
CGIS and MEMA staff members agree that the time spent at the EOC during the Hurricane Isabel emergency was a useful experience for both organizations. In addition to providing 24/7 GIS support, CGIS staff gained a unique perspective on how GIS can be used to assist with Maryland’s emergency preparedness and management activities. CGIS staff compiled the following recommendations in an effort to suggest ways in which the GIS capabilities of the EOC can be improved before its next activation. The recommendations are organized into four sections--data, hardware and software, procedures, and people. Data 1. One data layer that is desperately needed is a point file of critical state
facilities. Many of the maps that were prepared during the Isabel emergency identified facilities such as prisons, hospitals, and nursing homes located in flood prone areas. Although the State Highway Administration has developed a "points of interest" file that includes all facilities shown on the 1:24,000 scale grid map sheets, this file does not include all critical state facilities. In addition, MEMA has a file of state facilities extracted from the MdProperty View cadastral database (Maryland Department of Planning). However, this file can be misleading, because multiple points are included for every parcel that comprises a state-owned facility. An effort should be undertaken to merge, cross-reference, and expand these two files. In addition, the points should be attributed with important information, such as the capacity of schools that serve as evacuation centers. Contact information for each facility should also be included. Linkages to tabular data collected by the American Red Cross for each school, as well as the scanned floor plans for each school, should be included.
2. Data stored on the EOC GIS computer(s) should have well organized
directory structure that is logical and follows documented naming conventions. An effort should be undertaken before the next EOC

Copyright © 2003 Towson University Center for Geographic Information Sciences
9
activation to develop: 1) ArcGIS “layer” files that jump-start the symbolization process; 2) layout templates for small and large maps at both the state and the county scales that include information about evacuation routes, shelters, and critical facilities, as well as logos, disclaimers, date printed, and, most importantly, the title of the .mxd used to create the map (for fast retrieval); and 3) .mxd documents that serve as templates for routine requests.
3. Although we strongly suspect that every emergency requiring activation at
the EOC will have unique mapping needs, we also believe that a standard set of maps for all emergencies can be identified, based on our experience during Hurricane Isabel. We recommend the following maps be identified as “standard maps”:
a. Critical Facilities b. Transportation Infrastructure c. Evacuation Routes d. Shelters e. Flooding by name of area
Besides providing value by themselves, these maps can serve as a “jump start” to hazard-specific maps as needed. We also believe that a list of standard maps can grow and change as additional experience is gained during future emergencies.
4. Consideration should be given by MEMA to subscribing to commercial,
real-time data feeds, such as NEXRAD weather information. Using ArcView 8.3 and a temporary subscription to Meteorlogix GIS Web services, we were able to display real-time weather data from NEXRAD as an overlay to other geospatial data developed for use at the EOC.
5. Prior to the activation of the EOC, MEMA requested that CGIS provide an
FTP site for use by officials from the Federal Emergency Management Agency (FEMA), and others, for sharing data. FEMA staff at the EOC expressed a concern about possible problems with using MEMA data with FEMA’s GIS software (MapInfo). Interoperability of MEMA’s geospatial data is an issue that should be considered now, so that it does not become an issue during future emergencies.
6. Census data for “special populations” (population over 65, urban
populations likely to be dependent on public transportation, Hispanic population, etc.) should be assembled by census tract for the entire state. These data are needed to identify special populations at risk during emergency events.

Copyright © 2003 Towson University Center for Geographic Information Sciences
10
Hardware and Software 1. The designated computer in the EOC is woefully inadequate to handle the
large amount of geospatial data that are available to support the state’s emergency management efforts. This computer should be replaced with at least three computers with the following minimum configuration: 3.2 GHz Pentium 4 processor, 1.0 GB RAM, 120 GB hard drive, enhanced video card, 20 inch flat panel display, and access to a large (250 GB or larger) shared network drive. Two of the computers should be available to GIS analysts for developing the maps. The third computer should be used for displaying maps on the “big screens.”
2. The HP plotter in the EOC should be replaced with a newer, faster model,
such as an HP 5500. An adequate supply of consumables (ink-jet cartridges and plotter paper) should be ordered, as well. When CGIS arrived at the EOC on Tuesday, the plotter was not operational due to an empty ink-jet cartridge (CGIS subsequently ordered a set of ink-jet cartridges to replace those in the plotter), and the plotter was not easily accessible via the network. The plotter had to be physically moved and connected directly to one of CGIS’s workstations to plot large maps (36” wide).
3. The EOC needs to establish an internal computer network for sharing
information among state agency representatives. For example, the most frequently updated map showed power outages by county. With an EOC network, this map could have been stored in a folder as a .pdf or .jpg file to be viewed and printed on an as-needed basis by the state agency reps. Alternatively, maps could be published to ArcReader portable map files (.pmf) that can be viewed, zoomed, and queried by state agency representatives with limited GIS experience. CGIS staff members fielded requests from different agency representatives who wanted the data and did not realize that the most up-to-date data had already been printed for someone else. Although there was a designated place in the front of the EOC for completed maps, there was no system for putting the information into the hands of those who needed it.
4. A secure FTP site should be established to provide file sharing between
the EOC and external agencies. Prior to the storm, the National Weather Service periodically emailed storm surge estimation data to Seamus Mooney. When he was not available, file access was delayed. Transfer of files via email is not an adequate method of transfer, particularly for larger GIS files. The FTP site would also provide provide MEMA with the means of sharing GIS data to and from the counties. While a lot of GIS data were generated by MEMA and by the counties, none was shared during the Isabel emergency.

Copyright © 2003 Towson University Center for Geographic Information Sciences
11
5. MEMA’s Web site should be revised. The site contained minimal links relating specifically to Hurricane Isabel. An updated site would include maps showing real-time status of shelters, power outages (by county), evacuation status (voluntary, mandatory), and links to USGS stream flow data. Such an update is easily accomplished and would show tremendous progress toward “e-government.”
6. A larger work area must be designated at the EOC for GIS operations.
The work area used during the Hurricane Isabel emergency accommodated one person and was too small during the hours three or four people were working.
Procedures 1. Consideration should be given to providing state and local government
first responders with GPS devices (or GPS enabled telephones) to collect location information on hazards, calls for service, and other emergency response information. This information should be transmitted to EOC in a timely fashion so that maps can be prepared showing the location and area-wide extent of emergency conditions during the event.
2. A request form should be developed to track requests for ad hoc maps. At
a minimum, the form should include the name and agency of the requester, date and time requested, date and time required, and a brief description of the map requested that includes data layers, area to be mapped, and other relevant information. The form should also have space for the initials of the person who completed the request along with the date and time completed. All of the map requests that were processed during the Hurricane Isabel emergency were transmitted to us orally by the requester. CGIS staff were instructed to log all requests, but having the information on a form would have speeded up completion of individual mapping tasks.
3. A review of MEMA’s “action plans” should be conducted by experienced
GIS staff. Map generation and spatial analysis tasks should be documented and planned ahead of time. This would incorporate them into the planning and response process, rather than just as moment-by-moment, ad-hoc requests. There will always be additional ad-hoc requests for maps. However, this integration would provide a great deal of guidance for the specific role GIS should play during an emergency event.
4. A state agency representative who thoroughly understands the process
and potential of GIS, and who can prioritize map requests, should be present during all strategy meetings during an emergency event. Ideally, this would be MEMA’s GIS coordinator. From our perspective, it seemed

Copyright © 2003 Towson University Center for Geographic Information Sciences
12
that the maps we prepared were not being fully leveraged in the decision making process.
5. Late in the day on Wednesday, September 17, CGIS staff members were
able to develop a reasonable estimate of areas that would be flooded given a tidal storm surge height predicted by the National Weather Service. On Friday morning, September 19, a television news reporter stated that “… no one predicted this magnitude of flooding would occur.” If GIS had been more tightly integrated into MEMA’s action plans, earlier notice could have been given to people in highly populated areas such as the Inner Harbor, Annapolis, Fells Point, and Bowley’s Quarters. This advance notice might have helped residents and businesses better prepare for the flooding that occurred.
6. Although the state agency representatives to the EOC seemed to be
impressed by our maps, we are not sure how our maps were used. For example, we spent nearly two days preparing detailed county maps showing FEMA Q3 flood plains, hurricane storm surge inundation areas, and high hazard dams. These maps were delivered to MEMA on Wednesday, September 17, but were never used during the emergency. We asked if we could hang the maps on the walls of the EOC but were denied permission.
7. Although discussions have begun regarding the acquisition of large-scale
digital orthophotography and LIDAR data, we are uncertain how the detailed data would be used by state agency representatives to the EOC during an actual emergency. The majority of maps prepared by CGIS staff were small-scale, statewide, choropleth maps show data aggregated to counties.
8. As the storm drew closer, the number of GIS requests and their
complexity increased. By complexity, we mean the lists of information that EOC representatives asked us to map. Some were provided in a “clean” database format. However, some were printed lists that had to be examined closely to determine how the data were to be used. This was time consuming, as was the actual creation of the data. The decision as to the “doability” of most map projects was determined by Seamus Mooney, along with input from CGIS staff based on our understanding of the request. We feel that this issue can be resolved via item 1 in “people” issues.
People 1. CGIS staff members who worked at the EOC learned that many of the
state agency representatives to the EOC may not be fully aware of the geospatial data that are available, along with the mapping capabilities of

Copyright © 2003 Towson University Center for Geographic Information Sciences
13
GIS. We recommend a one-day workshop for EOC representatives to familiarize them with GIS, and Web-based and standalone GIS software. Because ArcView 3.2 is installed on all EOC computers, we recommend that an “Introduction to ArcView” course be held for interested state agency representatives.
2. Consideration should be given to holding a focus group session with the
state agency representatives to the EOC to identify other important data that should be available via GIS. We recommend a focus group session in concert with the one-day workshop described above.

Copyright © 2003 Towson University Center for Geographic Information Sciences
14
Table 1. Data Taken to the EOC for Use During the Hurricane Isabel Emergency Data Source of Data ADC Digital Maps1 GIS Integrated Solutions LLC Aerial Photography (Dec. 2002) Aerials Express Dam Break Danger Reach Maryland Department of the Environment Detention Centers Maryland Department of Juvenile Services CHART Camera Locations Maryland Department of Transportation County/Municipal Boundaries Maryland State Highway Administration Flood Plains Federal Emergency Management Agency Hazmat Locations Maryland Department of the Environment Hospitals and Nursing Homes Maryland Department of Health and Mental Hygiene Land Cover2 Towson University Center for GIS MdProperty View Maryland Department of Planning MEMA Infrastructure Data Maryland Emergency Management Agency National Elevation Data U.S. Geological Survey NEXRAD Weather3 Meteorlogix Web Service Oil/Gas Pipelines Maryland Department of Natural Resources Roads Maryland State Highway Administration SHA Points of Interest Maryland State Highway Administration Storm Surge Inundation Areas Maryland Emergency Management Agency Streams Maryland State Highway Administration Streetmap USA ESRI USGS Gauge Stations U.S. Geological Survey 1GIS Integrated Solutions LLC granted CGIS the right to use ADC Digital Map data for the duration of Hurricane Isabel event. 2The land cover data were developed by the Center for GIS as part of its NASA/Raytheon Synergy project. 3Access to licensed NEXRAD weather data was provided by Environmental Systems Research Institute for the duration of the Isabel event. Note: data highlighted in the table were included with the Web-based Emergency Management Mapping Application (EMMA) as well as via desktop GIS.

Copyright © 2003 Towson University Center for Geographic Information Sciences
15
Table 2. List of GIS Tools Provided by the Beta Version of the Emergency Management Mapping Application (EMMA)
Category Function Tested Prototyped PlannedNavigation Zoom in x Zoom out x Pan x Full extent x Zoom previous x Locate address x Analysis Identify feature x Identify service area x Identify ADC page/grid x Link to SDAT information x Select by rectangle x Select by line or polygon x Select by radius x Find from attributes x Query attributes x Measure x Clear (selection, measure, etc.) x Lookup feature x Buffer results x Export results x Display Print x Set refresh rate x Legend x Layer list (with expandable layers) x Save map image x Help x Add new layer x Incident Autoplot incedent point x Return to point x Generate Incident report x Launch viewer x Autoplot incident scene x Field Input Map input x Direct X/Y input x Address location input x Autoplot from GPS x Real-Time Data Stream flow from USGS x x Weather from Meteorlogix x Hospital status x Resource tracking x x CHART weather data x CHART traffic data x MEIMSS secure data x
Copyright © 2003 Towson University Center for Geographic Information Sciences
16
Table 3—CGIS Staff Time During the Isabel Emergency by Day
Staff Member 9/15 9/16 9/17 9/18 9/19 9/20 9/21 Total
Morgan 3.0 4.0 3.0 5.0 2.0 3.0 7.0 27.0Felton 3.0 8.0 13.0 7.0 7.0 7.0 45.0Russakis 2.0 2.0 1.0 1.0 6.0Bentivegna 4.0 Alvarez 8.0 10.0 13.0 31.0Andrews 12.0 12.0Bizzell 3.0 8.0 9.0 9.0 3.0 32.0Carlisle 3.0 12.0 15.0Garcia 12.0 12.5 11.0 12.5 8.0 5.5 61.5Geeraerts 4.0 2.0 6.0Lesh 8.0 11.5 13.5 14.5 7.0 5.5 60.0Roberts 13.0 13.0Sides 6.0 7.0 6.0 6.5 25.5Valentino 8.0 8.0 13.5 10.5 13.0 53.0Total 37.0 60.0 89.0 85.5 60.0 41.5 18.0 391.00

Copyright © 2003 Towson University Center for Geographic Information Sciences
17
Appendix A
AN ATLAS OF MAPS PRODUCED DURING THE HURRICANE ISABEL EMERGENCY

Copyright © 2003 Towson University Center for Geographic Information Sciences
18

Copyright © 2003 Towson University Center for Geographic Information Sciences
19

Copyright © 2003 Towson University Center for Geographic Information Sciences
20
Maps 1, 2, and 3: Maps showing evacuation routes were created at CGIS the day before Hurricane Isabel was expected to hit. Recipients of the maps posted them on the Internet for citizen use.

Copyright © 2003 Towson University Center for Geographic Information Sciences
21

Copyright © 2003 Towson University Center for Geographic Information Sciences
22
Maps 4, 5, 6, and 7: This series of maps shows the number of police, school, fire, and hospital facilities at risk of storm surges, by county.

Copyright © 2003 Towson University Center for Geographic Information Sciences
23

Copyright © 2003 Towson University Center for Geographic Information Sciences
24
Maps 8, 9, 10, and 11: This series of maps shows the number of police, school, fire, and hospital facilities located in flood hazard areas, by county.
Copyright © 2003 Towson University Center for Geographic Information Sciences
25
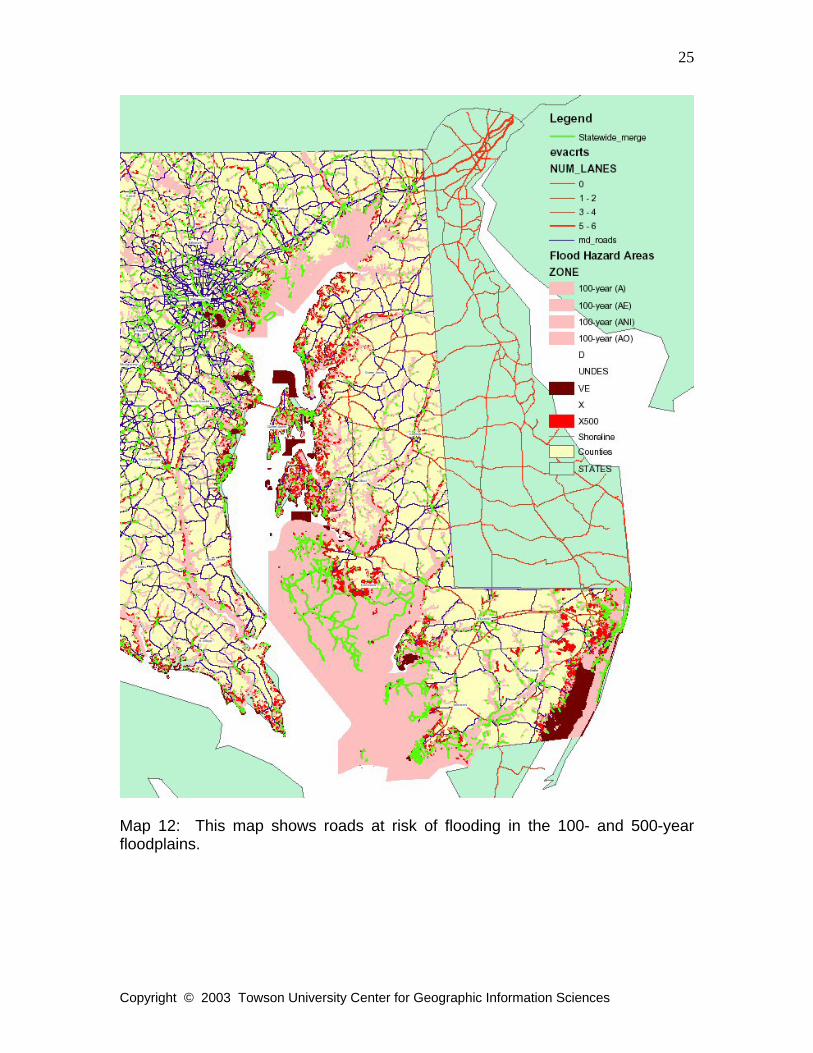
Map 12: This map shows roads at risk of flooding in the 100- and 500-year floodplains.

Copyright © 2003 Towson University Center for Geographic Information Sciences
26

Copyright © 2003 Towson University Center for Geographic Information Sciences
27
Maps 13, 14, 15, 16, and 17: This series of maps were created in an effort to estimate potential damage to counties by water threats such as rainfall, storm surge, flooding, and wave height.

Copyright © 2003 Towson University Center for Geographic Information Sciences
28
Map 18: This map shows the National Weather Service’s prediction of storm surges and the percentage of risk in each of Maryland’s counties.
Map 19: This map shows the number of marine, dive team, and swift-water rescue assets in plotted locations. A spreadsheet listing exact cities and towns where the assets are located accompanied the map.

Copyright © 2003 Towson University Center for Geographic Information Sciences
29
Maps 20 and 21: These maps were created during hurricane activity. The maps track Isabel’s effects on Maryland, relevant to shelters (Red Cross versus non Red Cross and open versus closed), evacuations (mandatory versus voluntary), bridge closures, power outages, and rescues.

Copyright © 2003 Towson University Center for Geographic Information Sciences
30
Map 22: This map shows total rainfall as of 11:45 p.m. on the night of September 18, 2003. The map was updated throughout the night and used to ascertain flooding risks.
Map 23: This map shows the distribution of Maryland’s hospitals and shelters, as well as the reported total current occupancy of the open shelters.

Copyright © 2003 Towson University Center for Geographic Information Sciences
31
Map 24: This map shows updated shelter information, an ongoing task throughout hurricane activity. As more people were being evacuated, the map was updated to reflect their destinations.

Copyright © 2003 Towson University Center for Geographic Information Sciences
32
Maps 25 and 26: These maps show total number of outages per county. As power outages swept through Maryland, electric companies reported current outages to the Emergency Operations Center every hour on the hour. Following each report, an updated map was created. As Hurricane Isabel receded from the area, and electric crews began to correct power problems, maps were updated to reflect areas where power had been restored, as well as new outages still being reported.

Copyright © 2003 Towson University Center for Geographic Information Sciences
33
Map 27: This map shows the dispersion of waste water and fresh water treatment facilities, hospitals, major highways, and airports.
Map 28: This map shows stream gauges and flood stage status.

Copyright © 2003 Towson University Center for Geographic Information Sciences
34

Copyright © 2003 Towson University Center for Geographic Information Sciences
35
Copyright © 2003 Towson University Center for Geographic Information Sciences
36
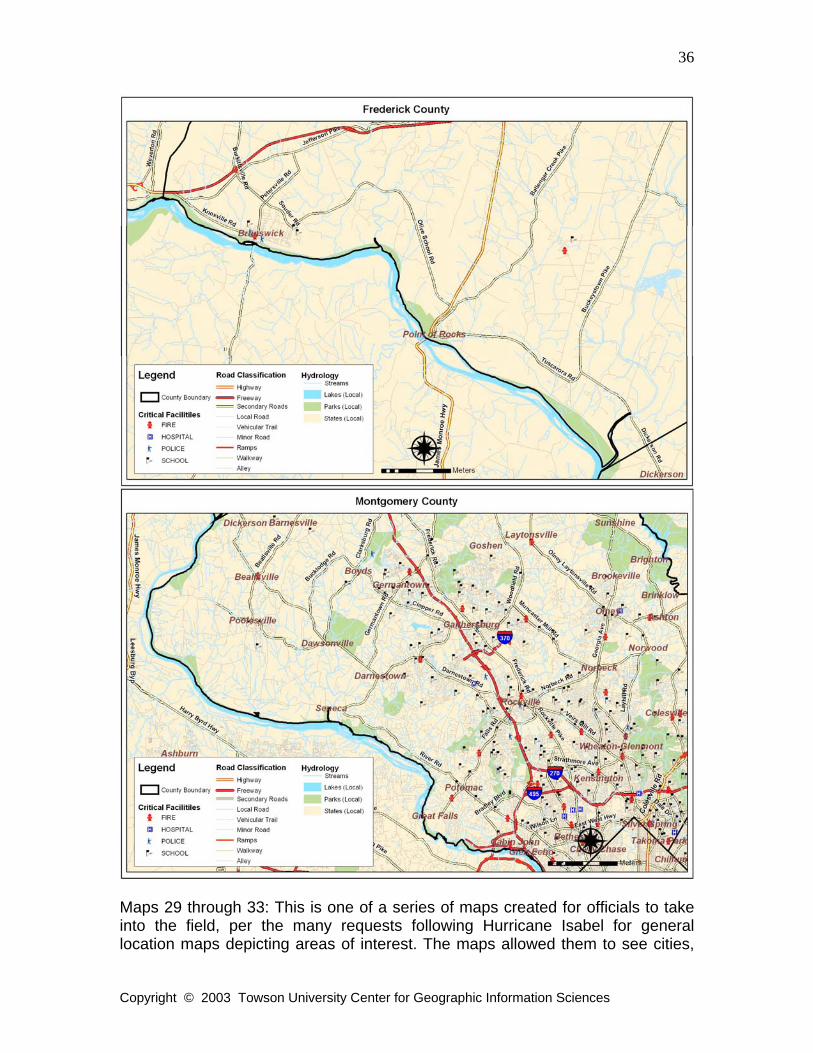
Maps 29 through 33: This is one of a series of maps created for officials to take into the field, per the many requests following Hurricane Isabel for general location maps depicting areas of interest. The maps allowed them to see cities,

Copyright © 2003 Towson University Center for Geographic Information Sciences
37
towns, roads, parks, and rivers. The maps also show critical facilities, such as fire, hospital, police, and school facilities. Other examples of maps requested and produced include maps of Martin State Airport, Stemmers Run, and even Charleston, North Carolina.
Map 34: Following Hurricane Isabel, a helicopter flew over the area shown on this map so photographs could be taken. Each red dot corresponds to a photograph and is labeled with a unique ID number. A spreadsheet was then generated with information about each site and the possible hazard occurring there.
Copyright © 2003 Towson University Center for Geographic Information Sciences
38

Copyright © 2003 Towson University Center for Geographic Information Sciences
39

Copyright © 2003 Towson University Center for Geographic Information Sciences
40
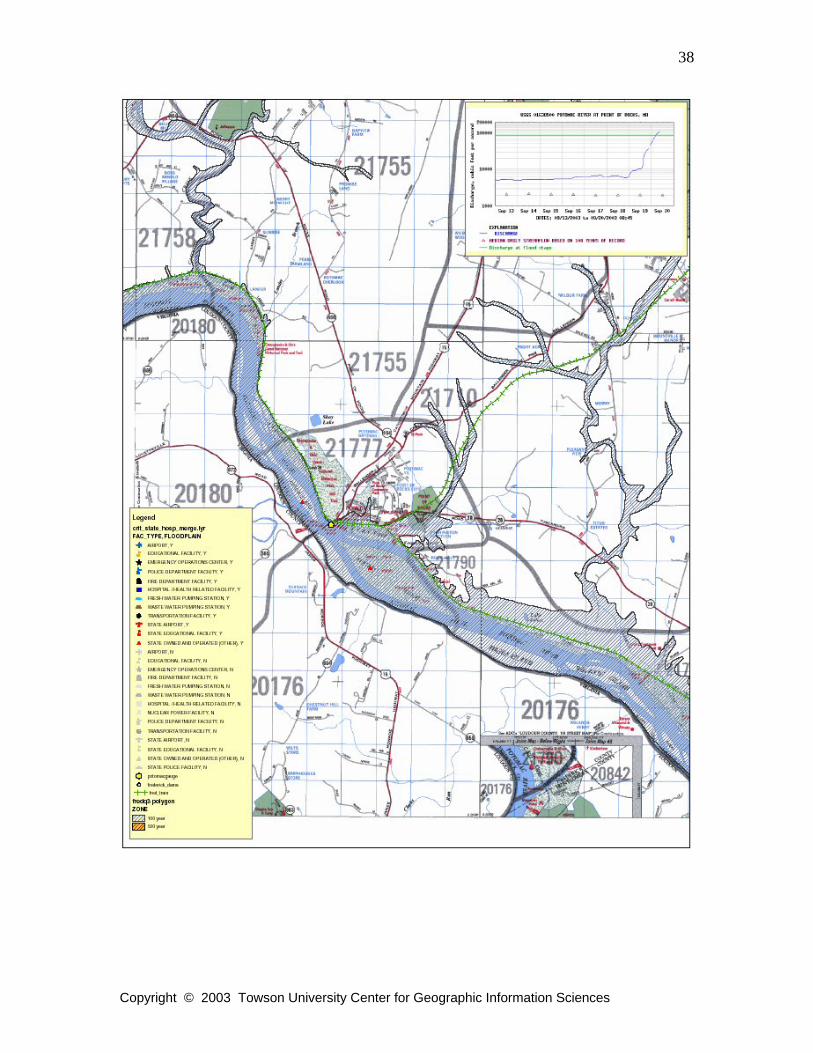
Maps 35, 36, and 37: The Potomac River at Point of Rocks, Maryland, was reported by the USGS to be discharging at flood stage on September 20th. We were able to incorporate the USGS chart data into maps of the area at different scales, while showing the 100- and 500-year flood plains.
Copyright © 2003 Towson University Center for Geographic Information Sciences
41

Copyright © 2003 Towson University Center for Geographic Information Sciences
42
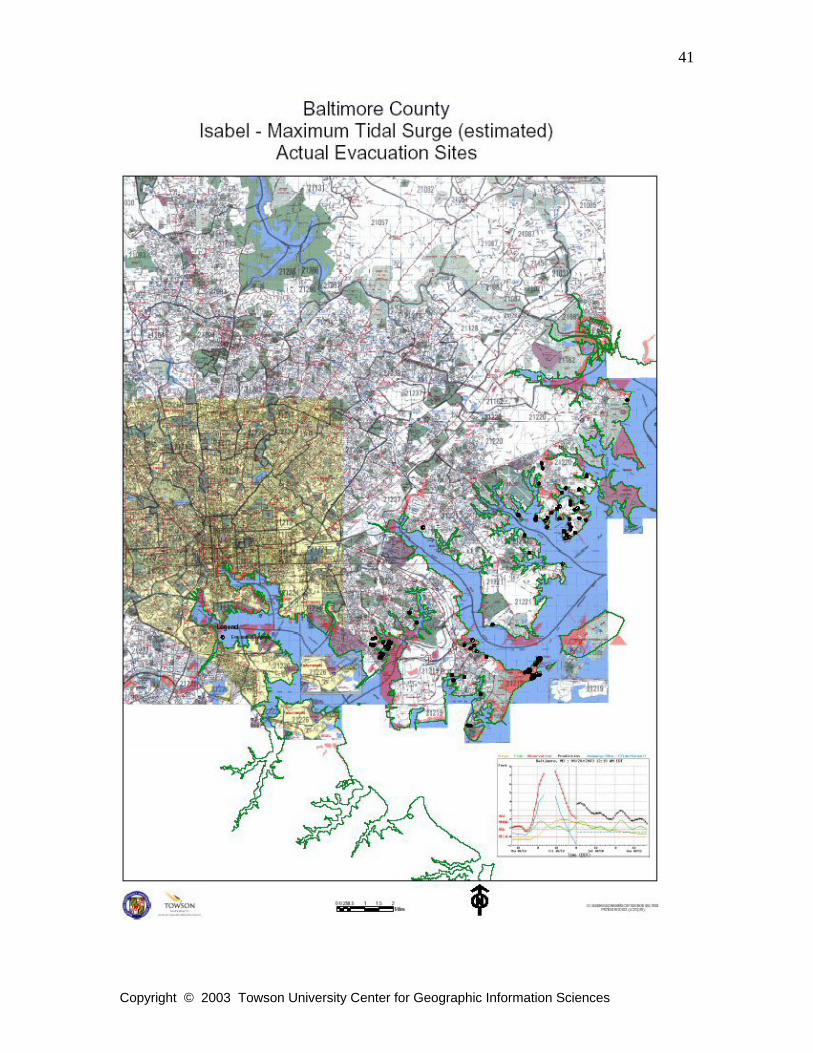
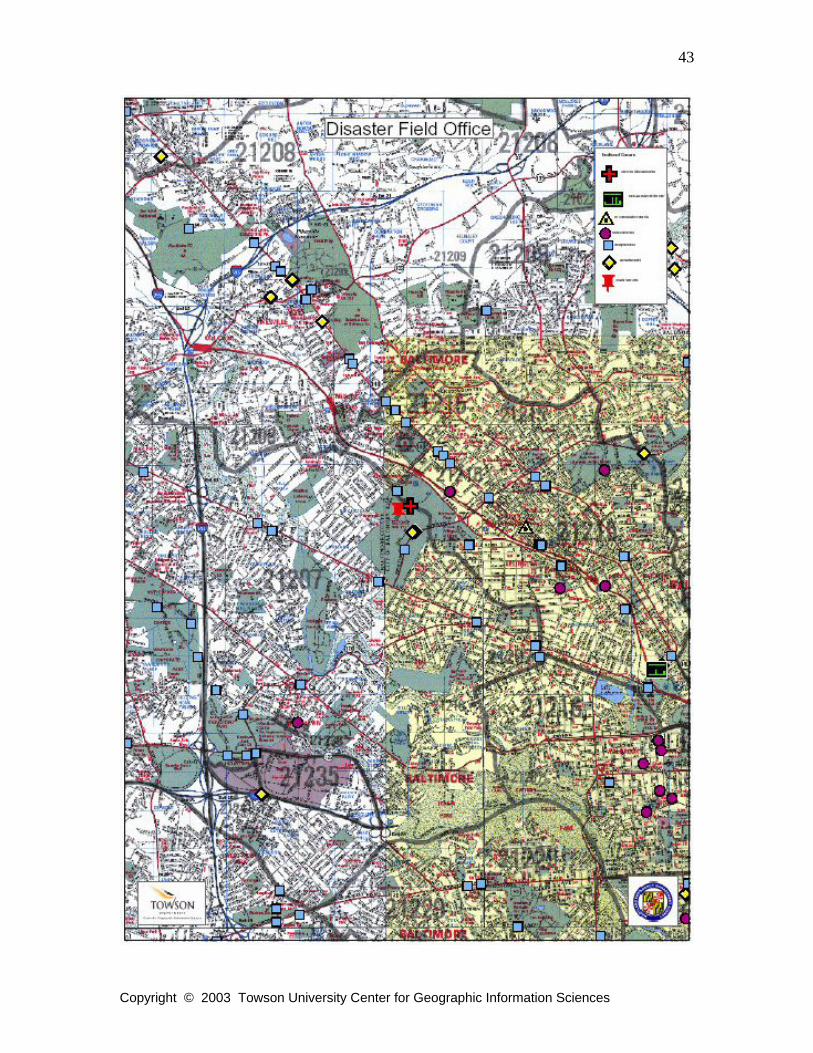
Map 38: This map shows the maximum estimated tidal surge for Baltimore County coastal areas, as well as the actual evacuation sites from the night Hurricane Isabel made landfall.
Copyright © 2003 Towson University Center for Geographic Information Sciences
43
Copyright © 2003 Towson University Center for Geographic Information Sciences
44
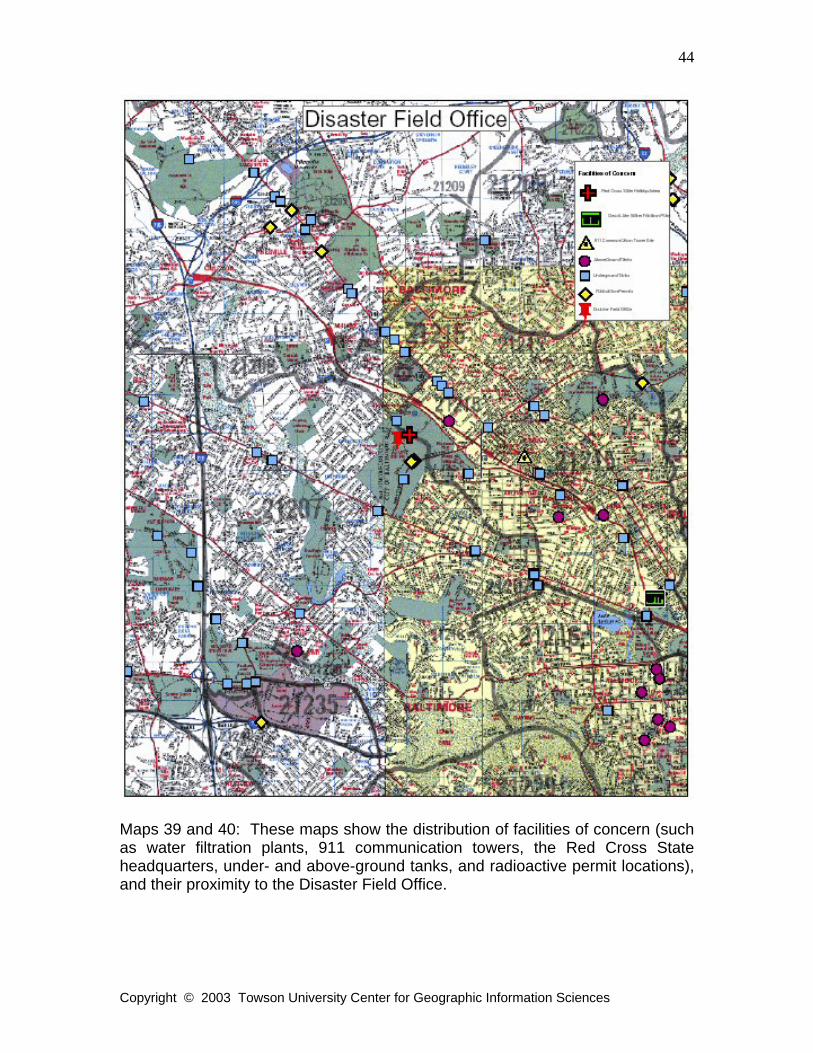
Maps 39 and 40: These maps show the distribution of facilities of concern (such as water filtration plants, 911 communication towers, the Red Cross State headquarters, under- and above-ground tanks, and radioactive permit locations), and their proximity to the Disaster Field Office.