geographic information system -...
TRANSCRIPT

*CNISNUNEZ12S*
GEOGRAPHIC INFORMATION SYSTEM
Submitted by:
FELCAR NUÑEZ DANN ANGELO ALBAÑO
Masterands
Submitted to:
MR. DOMINO PUSON Professor

*CNISNUNEZ12S*
This report will cover the following information about Geographic Information System:
1. Definition of Geographic Information Systems (GIS)
2. History of GIS
3. Type of data utilized by GIS
4. GIS operations and functions
5. Elements of GIS
6. GIS in Healthcare
7. Nursing and GIS
8. GIS in Health Research
9. Limitations of GIS in Health Research
10. Advantages of GIS in healthcare
11. Current limitations of GIS in healthcare
GEOGRAPHIC INFORMATION SYSTEMS (GIS)
DEFINITION:
GIS is a system of hardware and software used for storage, retrieval, mapping, and analysis of
geographic data. Practitioners also regard the total GIS as including the operating personnel
and the data that go into the system. Spatial features are stored in a coordinate system
(latitude/longitude, state plane, UTM, etc.), which references a particular place on the earth.

*CNISNUNEZ12S*
Descriptive attributes in tabular form are associated with spatial features. Spatial data and
associated attributes in the same coordinate system can then be layered together for mapping
and analysis. GIS can be used for scientific investigations, resource management, and
development planning.
GIS differs from CAD and other graphical computer applications in that all spatial data is
geographically referenced to a map projection in an earth coordinate system. For the most
part, spatial data can be "re-projected" from one coordinate system into another, thus data
from various sources can be brought together into a common database and integrated using
GIS software. Boundaries of spatial features should "register" or align properly when re-
projected into the same coordinate system. Another property of a GIS database is that it has
"topology," which defines the spatial relationships between features. The fundamental
components of spatial data in a GIS are points, lines (arcs), and polygons. When topological
relationships exist, you can perform analyses, such as modeling the flow through connecting
lines in a network, combining adjacent polygons that have similar characteristics, and
overlaying geographic features.
HISTORY:
In 1854, John Snow depicted a cholera outbreak in London using points to represent the
locations of some individual cases, possibly the earliest use of the geographic method. His study
of the distribution of cholera led to the source of the disease, a contaminated water pump (the
Broad Street Pump, whose handle he had disconnected, thus terminating the outbreak) within
the heart of the cholera outbreak.
The year 1960 saw the development of the world's first true operational GIS in Ottawa, Ontario,
Canada by the federal Department of Forestry and Rural Development. Developed by Dr. Roger

*CNISNUNEZ12S*
Tomlinson, it was called the Canada Geographic Information System (CGIS) and was used to
store, analyze, and manipulate data collected for the Canada Land Inventory (CLI) – an effort to
determine the land capability for rural Canada by mapping information about soils, agriculture,
recreation, wildlife, waterfowl, forestry and land use at a scale of 1:50,000. A rating
classification factor was also added to permit analysis.
CGIS lasted into the 1990s and built a large digital land resource database in Canada. It was
developed as a mainframe-based system in support of federal and provincial resource planning
and management. Its strength was continent-wide analysis of complex datasets. The CGIS was
never available in a commercial form.
In 1964, Howard T. Fisher formed the Laboratory for Computer Graphics and Spatial Analysis at
the Harvard Graduate School of Design (LCGSA 1965–1991), where a number of important
theoretical concepts in spatial data handling were developed, and which by the 1970s had
distributed seminal software code and systems, such as 'SYMAP', 'GRID' and 'ODYSSEY' – that
served as sources for subsequent commercial development—to universities, research centers
and corporations worldwide.
By the early 1980s, M&S Computing (later Intergraph) along with Bentley Systems Incorporated
for the CAD platform, Environmental Systems Research Institute (ESRI), CARIS (Computer Aided
Resource Information System) and ERDAS (Earth Resource Data Analysis System) emerged as
commercial vendors of GIS software, successfully incorporating many of the CGIS features,
combining the first generation approach to separation of spatial and attribute information with
a second generation approach to organizing attribute data into database structures. In parallel,
the development of two public domain systems (MOSS and GRASS GIS) began in the late 1970s
and early 1980s.
By the end of the 20th century, the rapid growth in various systems had been consolidated and
standardized on relatively few platforms and users were beginning to explore the concept of

*CNISNUNEZ12S*
viewing GIS data over the Internet, requiring data format and transfer standards. More
recently, a growing number of free, open-source GIS packages run on a range of operating
systems and can be customized to perform specific tasks. Increasingly geospatial data and
mapping applications are being made available via the World Wide Web.
TYPE OF DATA UTILILIZED BY GIS
TABULAR DATA
Tabular data consists of attribute tables that define the parameters of the map features. There
is really no limit to what the tables can contain, whether Boolean strings (True/False), Text, or
Numeric data. For example, a Boolean entry in a cities table may define whether or not each
city is a national capital. A text entry may have the city's name, or the archaeological period in
which it flourished. A numeric entry could have population figures or lat/long coordinates. The
advantage of the relational database system is that the different columns can be sorted and
selected according to the user's need. These selections then appear highlighted on the map.

*CNISNUNEZ12S*
SPATIAL DATA
Spatial data places the features on the map. The coordinates of a point are the most obvious
example of this, but it also incorporates projection systems, line and polygon attributes, and
other information. There are two main classes of spatial data: vector and raster.
Vector Data - Most work archaeologists do in GIS is based in vector data. This system of
recording features is based on the interaction between arcs and nodes, represented by points,
lines, and polygons. A point is a single node, a line is two nodes with an arc between them, and

*CNISNUNEZ12S*
a polygon is a closed group of three or more arcs. With these three elements, it is possible to
record most all necessary information.
Points represent discrete locations on the ground. Either these are true points, such as
the point marked by a USGS brass cap, such as a section corner, or they may be virtual
points, based on the scale of representation. For example, a city's location on a driving
map of the United States is represented by a point, even though in reality a city has
area. As the map's scale increases, the city will soon appear as a polygon. Beyond a
certain scale of zoom (i.e., when the map's extent is completely within the city), there
will be no representation of the city at all; it will simply be the background of the map.
Here is a view of the Puget Sound area with airports. The airports are stored as points
within the GIS.
Lines represent linear features, such as rivers, roads and transmission cables. Here are
major roads in the Puget Sound region, along with line attributes. In ArcGIS, lines are
also known as "arcs," hence the name "ArcGIS." Each line is composed of a number of
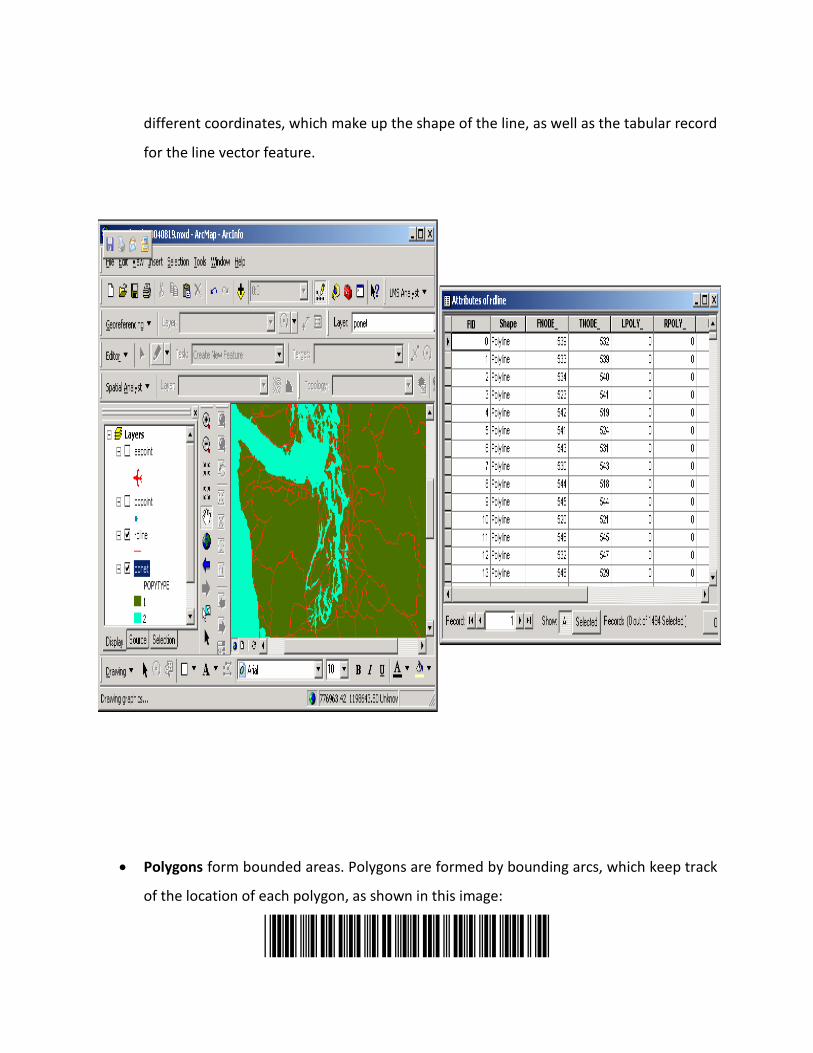
*CNISNUNEZ12S*
different coordinates, which make up the shape of the line, as well as the tabular record
for the line vector feature.
Polygons form bounded areas. Polygons are formed by bounding arcs, which keep track
of the location of each polygon, as shown in this image:

*CNISNUNEZ12S*
Raster Data - Raster data is characterized by pixel values. Basically, a raster file is a giant table,
where each pixel is assigned a specific value from 0 to 255. The meaning behind these values is
specified by the user- they can represent elevations, temperatures, hydrography, etc. Satellite
imagery uses raster data to record different wavelengths of light. Raster data is advantageous
to vector data in constructing 3D images, as the values for every pixel are calculated through a
process called interpolation. In ArcMap, it is possible to control what type of interpolation
method is used when converting from vector to raster data. Other programs, such as Erdas
Imagine, are tailored specifically to raster data and may be more appropriate for certain
projects

*CNISNUNEZ12S*
GIS OPERATIONS AND FUNCTIONS
Data Input
Data input covers the range of operations by which spatial data from maps, remote sensors,
and other sources are transformed into a digital format. Among the different devices commonly
used for this operation are keyboards, digitizers, scanners, CCTS, and interactive terminals or
visual display units (VDU). Given its relatively low cost, efficiency, and ease of operation,
digitizing constitutes the best data input option for development planning purposes.

*CNISNUNEZ12S*
Two different types of data must be entered into the GIS: geographic references and
attributes. Geographic reference data are the coordinates (either in terms of latitude and
longitude or columns and rows) which give the location of the information being entered.
Attribute data associate a numerical code to each cell or set of coordinates and for each
variable, either to represent actual values (e.g., 200 mm of precipitation, 1,250 meters
elevation) or to connote categorical data types (land uses, vegetation type, etc.). Data input
routines, whether through manual keyboard entry, digitizing, or scanning, require a
considerable amount of time.
Data Storage
Data storage refers to the way in which spatial data are structured and organized within the GIS
according to their location, interrelationship, and attribute design. Computers permit large
amounts of data to be stored, either on the computer's hard disk or in portable diskettes.
Data Manipulation and Processing
Data manipulation and processing are performed to obtain useful information from data
previously entered into the system. Data manipulation embraces two types of operations: (1)
operations needed to remove errors and update current data sets (editing); and (2) operations
using analytical techniques to answer specific questions formulated by the user. The
manipulation process can range from the simple overlay of two or more maps to a complex
extraction of disparate pieces of information from a wide variety of sources.
Data Output
Data output refers to the display or presentation of data employing commonly used output
formats that include maps, graphs, reports, tables, and charts, either as a hard-copy, as an

*CNISNUNEZ12S*
image on the screen, or as a text file that can be carried into other software programs for
further analysis.
ELEMENTS OF A GIS
Hardware and Software Components
Hardware components of a basic GIS work station consist of: (1) a central processing unit (CPU)
where all operations are performed; (2) a digitizer, which consists of a tablet or table where
analog data are converted to digital format; (3) a keyboard by which instructions and
commands as well as data can be entered; (4) a printer or plotter to produce hard copies of the
desired output; (5) a disk drive or tape drive used to store data and programs, for reading in
data and for communicating with other systems; and (6) a visual display unit (VDU) or monitor
where information is interactively displayed. Several GIS software packages are available
representing a very broad range of cost and capability.
Users and Users' Needs
Planners need to carefully evaluate their GIS needs and proposed applications before taking the
decision to acquire an install a GIS. Once a positive conclusion has been reached, its hardware-
software configuration should be designed based on those needs and applications and within
the constraints posed by the financial and human resources available to operate the system.
It is possible that the costs of establishing a GIS exceed the benefits to a single agency. Under
these circumstances, it is worthwhile determining if several agencies might share the GIS. The
potential users must agree on the data to be compiled, the data formats, standards of accuracy,
etc. As a result, the data requirements of a variety of users are made compatible, and the value
of the data increases commensurately.

*CNISNUNEZ12S*
Sharing information has its costs as well as benefits. Negotiating with other users can be a
painful task, and compromises inevitably ensure that no one user will get the equipment most
precisely suited to his uses. In this regard, it is important to establish a comfortable working
relationship among sharers.
Information and Information Sources
General reference maps and information on natural hazards and natural resources should form
a "library of knowledge" for any GIS. Virtually all countries have topographic maps, road maps,
generalized soils maps, some form of climate information, and at least the locational
component of natural hazards information (e.g. location of active volcanoes, fault lines,
potential flood areas, areas of common occurrence of landslides, areas of past tsunami
occurrence, etc.). Natural hazards locational data can be made compatible in a GIS with
previously collected information about natural resources, population, and infrastructure, to
provide planners with the wherewithal for a preliminary evaluation of the possible impacts of
natural events.
GEOGRAPHIC INFORMATION SYSTEMS IN HEALTH AND HEALTHCARE
GIS have many potential applications in studying geographically differentiated health and
healthcare phenomena and changes in those phenomena over time, for example,
cardiovascular disease in a given community. Traditionally, two broad types of GIS applications
can be distinguished, which also reflect the two traditions in health geography (geography of
disease and geography of healthcare systems), namely (1) health outcomes and epidemiology
applications and (2) healthcare delivery (services) applications.

*CNISNUNEZ12S*
GIS can help health care professionals, public health officials, and community members to
identify potential environmental risks related to the health outcomes and to support decision
making for allocation of scarce disease prevention resources in high-risk areas. Given the
important role that environmental health risks can play in public health, it is critical that
community/public health nurses begin to integrate environmental health assessment skills into
their professional practices by creating assessment and analytic tools to be used at the local
and community-based level. A simple community survey using GIS can be an effective means to
raise awareness about environmental health risk factors and utilizing GIS mapping tools can
further enhance the accessibility of the combined exposure and health information for both lay
and professional audiences.
Moreover, GIS also play an important role in the following: profiling and understanding the
varying needs of target communities; profiling their environment and health and social services
available to them; linking and using such information for planning, optimizing, and targeting
suitable health and social care services (geographically accessible physical services-"fair access
for all") and well-tailored intervention programs to those communities (eg, consumer health
information, self-help and self-care programs); continually monitoring, assessing, and tweaking
such interventions during their execution; testing different "what if" scenarios before making
any financial commitments; and ascribing priorities in a climate of finite resources.
Another use of GIS is in emergency situations, for example, in dealing with bioterrorism,
especially when combined with geographically enabled syndromic surveillance systems such as
RODS (Realtime Outbreak and Disease Surveillance system).

*CNISNUNEZ12S*
NURSING AND GEOGRAPHIC INFORMATION SYSTEMS
Some of the uses of GIS in nursing include the following: supporting academic practice, faculty
outreach, and educational initiatives at a school of nursing; visualizing nursing workforce
distribution for policy evaluation; conducting community assessment and nursing research;
conducting health intervention research in diabetes; providing public health nursing education
and practice; and designing population-based health interventions.
Understanding of GIS is essential for nursing science to continue to evolve in the 21st century.
The integration of geography into nursing education, can aid in both for understanding the
geographic factors that influence nursing education outcomes and providing students with
insights about core subjects in the nursing curriculum.
The key advantage that information systems offer is the ability to link data systems in a way
that gives us a much clearer picture about the context in which healthcare is delivered. To take
the example of diabetes, geographical data have identified that prescribing practices and
collection/dispensing of self-testing glucose strips vary widely across areas of different
population density. In the current climate of increased emphasis on self-management in long-
term conditions, GIS can enable us to provide (or at least aim for) self-care support best tailored
to the geographical location of the patient and the type/severity of disease. In this context, GIS
also provide an ideal tool to facilitate integration of service delivery and service evaluation. GIS
allow us to examine questions such as "what would happen if community nurses introduce
telephone or Web-based support for patients with diabetes recently discharged from hospital?"
The various facets of this intervention (availability of telephone services, availability of
broadband Internet, relative costs and reliability of these services, socioeconomic data) could
be mapped by geographical location, and a decision could be made about feasibility of the
service.

*CNISNUNEZ12S*
GIS is able to assist nursing as a science as it continues to grow increasingly global in nature,
ever-widening what is envisioned by the person and the environment. Geography, cartography,
and information sciences all lend themselves to the ever-widening boundaries of nursing, both
physical and theoretical in nature, and should not be overlooked. GIS tools and technology are
new ways of incorporating these global realms into nursing science and research, and
ultimately into practice.
GIS IN HEALTH RESEARCH
It is not surprising, then, that health-related fields would find GIS useful. GIS is a tool for
analyzing spatial data, and there are many aspects of health research that analyze the spatial
setting of quantitative phenomena. Generally speaking, there are 2 broad areas where health
fields use GIS. They are, first, the geography of disease and health, and second, the geography
of healthcare.
The geography of disease and health involves describing and analyzing illness spatially. It is
mainly interested in aspects of disease such as spatial clustering, or associations between
disease and elements of the environment. For instance, mapping of certain cancers, traumatic
injuries, and deaths can be used to determine areas of needed patient education for health
promotion, prevention, and care.
The second aspect of health research that typically uses GIS is the geography of healthcare.
Health resources have to be located somewhere, and this area uses GIS to evaluate the spatial
aspect of needs for healthcare and spatial aspects of healthcare provision. Researchers may
look for places where healthcare needs were not being met, and where people travelled long
distances to get care.

*CNISNUNEZ12S*
In a unique application of GIS, the National Indian Council on Aging (NICOA) mapped American
Indian elders. NICOA produced documents, one of which was a map of the United States, with
each point on the map representing each American Indian elder. The council reported that this
was the first time GIS was used to map a minority population for healthcare implications. The
study went on to describe and locate available relevant services as well as several disease
processes present, such as diabetes. This was an effort that utilized both types of GIS in health
approaches.
The use of GIS in healthcare is likely to increase in the foreseeable future. Demographic and
financial pressures on healthcare systems are encouraging greater emphasis on measuring
health needs accurately and managing them in ways that are both clinically effective and cost-
effective. Of course, the desired nursing outcome to the use of such a tool is increasing the
understanding of space and time as they relate to access and use. Increasing pressures of
chronic conditions across all age groups necessitate an understanding of not only who your
patient is, but also where and how far, and the environmental impact of that time and space on
health.
LIMITATIONS OF GIS IN HEALTH RESEARCH
As with any tool it is often wise to gain an understanding of its intended uses and possible
problems. There are several notable pitfalls in using GIS in a research project and several will be
mentioned here, following the stages of a typical study. In conceptualizing a study that utilizes
GIS, it is important to recognize that GIS used by non experts can potentially create misleading
results due to the complexities of geographic data quality and scale, as well as more subtle
issues related to misleading maps. This is where creating nontraditional (ie, out of academic
health fields) interdisciplinary partnerships is important until proficiency can be attained.
A second important conceptual concern is the fact that GIS is not well-equipped to handle
temporal data, and is best suited for providing a current snapshot of a phenomenon. This is a

*CNISNUNEZ12S*
significant concern in many fields, including those related to health. However, as in the study
underway by the authors, this is overcome by overlaying longitudinal snapshots to see past
patterns and hopefully be able to more accurately predict the future map.
In the second stage of a research project-data collection-researchers should consider issues of
cost and availability. Although free and low-cost data are becoming more available every year,
quite often the data needed for a study are either expensive to obtain, or do not yet exist. For
instance, the authors had to create the database from the census for the map in Figure 5. It did
not come ready-made for importing. However, now the last 2 censuses are readily available in
forms compatible for GIS use.
In the final 2 stages, methodology and analysis, there are several related pitfalls worth
considering. Issues of cause and effect are important in all fields, though GIS was initially
designed for cataloging data, not for analyzing causes. There is a tendency to believe that
because computers are powerful tools, whatever emerges from them is necessarily true. But
just because 2 things coincide in space does not mean that one causes the other, even if they
appear together on a wonderfully expressive map.
Finally, there are social, ethical, and cultural issues to consider. Models such as GIS inherently
simplify, which can be useful in grasping ideas, but can also be problematic when studying the
complexities of humans. An all-powerful GIS that knows all of your whereabouts and activities
would not only threaten privacy, but also would not be an optimum tool for understanding
culture, society, and individual values in isolation of other techniques. This is but another
compelling reason to add nursing's caring voice to this tool as an advocate for person within the
environment whether community or health related.
ADVANTAGES OF GIS TECHNOLOGY IN HEALTHCARE

*CNISNUNEZ12S*
Several advantages of GIS technology for public health practice, planning, and research are as
follows:
1) GIS technology improves the ability of practitioners, planners, and researchers to
organize and link datasets (for example, by using geocoded addresses or geographic
boundaries). Geography provides a near-universal link for sorting and integrating
records from multiple information sources into a more coherent whole. This ability to
link datasets can help public health practitioners plan more cost-effective interventions.
For example, suppose that a childhood lead poisoning prevention program could access
residential databases maintained by the tax assessor's office and map the street
addresses of houses built before 1950 (when lead-based paint was commonly used).
Suppose that the prevention program could also access hospital and managed care plan
electronic databases to identify street addresses for new births. Combining these
datasets, the program could apply GIS technology to identify infants at high risk for
exposure to lead-based paint and send a public health worker to follow up with specific
households. By matching the addresses of these infants to a street map (from a
"topologically integrated geographic encoding and referencing" [TIGER] file), using the
"address-match" and "route-scheduling" functions of GIS software, the health worker
can implement and efficient schedule of household visitations.
2) GIS technology provides public health practitioners and researchers with several new
types of data. For example, with GIS technology, local public health departments can
use global positioning systems (GPS) to receive signals from satellites to determine
latitude-longitude coordinates for point locations not found in TIGER files, such as rural
residences, wells, and septic tanks. Public health practitioners can also use digital
imagery from satellites or aerial photos to add details to (or improve the accuracy of) a
mapping project. If a sequence of digital images for a small area of interest is available,
automated change detection can be used to observe changes over time, such as the

*CNISNUNEZ12S*
addition of housing developments, roads, and landfills and other changes in land use
and land cover. Public health practitioners can also begin to explore the utility of data
collected by marketing firms about consumer spending patterns, retail expenditures,
and lifestyle segmentation profile.
3) GIS technology encourages the formation of data partnerships and data sharing at the
community level. For example, to develop a map of motor vehicle injuries and fatalities
in a community, a local public health department could develop data partnerships with
the Department of Transportation (for information about traffic flow and accidents),
local ambulance services (for information about injuries requiring transportation by
ambulance to hospital emergency rooms), and the Medical Examiner's office (for
information about fatalities). Some GIS projects may be feasible only if all parts of local
government join together and contribute (for example, developing a regional data
warehouse or obtaining digital aerial photos or satellite images for an entire region).
4) Compared with tables and charts, maps developed using GIS technology can be an
extremely effective tool to help community decision makers visualize and understand a
public health problem. In addition, action is more likely when the decision maker can
see on a map that a problem is occurring in his or her "backyard." GIS technology
enables detailed maps to be generated with relative speed and ease. In turn, this
provides public health practitioners with the ability to provide quick responses to
questions or concerns raised in a community meeting, for example, by preparing
supplemental maps or by displaying more information about a point on the map during
the course of the meeting.
CURRENT LIMITATIONS OF GIS IN HEALTHCARE

*CNISNUNEZ12S*
Some of the current limitations of GIS from a public health perspective are as follows:
1) Community health planning and other public health applications remains a relatively
underdeveloped marketplace niche for GIS technology.
2) Current, accurate, low-cost base street maps are essential for epidemiologic uses.
Without an up-to-date base street map, for example, a public health practitioner
investigating a disease outbreak may have to spend considerable extra time and effort
to digitize the locations of cases or may not be able to map all case reports. Current and
accurate base street maps are especially needed for urban areas with high growth and
for those rural areas where residents only have post office box addresses.
3) Practitioners, planners, and researchers, and especially state and local public health
department staff, need training and user support in GIS technology, data, and
epidemiologic methods in order to use GIS technology appropriately and effectively. The
cost of training programs offered by commercial GIS vendors can be a financial burden
for a small local public health agency or individual practitioner. GIS training programs
specifically custom-designed for public health professionals are still relatively limited or
in the early stages of development. The time required for training can be a severe
challenge for organizations in which demands on personnel are already high. Another
drawback is that public health professional specialties currently do not recognize
continuing education credit for individuals who participate in GIS software training.
4) Statistical and epidemiological methods need to be developed to protect individual and
household confidentiality. Even if a single database may appear to have effective
confidentiality safeguards, when several databases are linked within a geographic
information system, the "sum" may be less well protected than the "parts." A false

*CNISNUNEZ12S*
identification may be just as damaging to an individual as a correct identification that is
not kept confidential.
5) GIS software continues to evolve rapidly; typically, a new iteration (or upgrade) is
released about every 18 months. Every software package has its strengths and
weaknesses. Current prices for some GIS products (in particular, for Web-enabled GIS
applications and for neighborhood lifestyle segmentation datasets) remain a potential
barrier. In addition, costs for maintenance and upgrades can be substantial.
6) The technology to prepare and display maps on the Web is still in the very early stages
of development. Models and methods for Web-enabled GIS technology need to be
developed for public health applications and field tested. Full GIS capability on the Web
is a considerable technical challenge because GIS software has only recently started to
be developed using Web-accessible programming languages and the size of GIS map
images and data files can be large and significantly slow access and display functions
over the Web. Spatial statistical software programs will also need to be developed for
use with these Web-enabled GIS applications.
REFERENCES:

*CNISNUNEZ12S*
http://www.nwgis.com/gisdefn.htm
http://en.wikipedia.org/wiki/Geographic_information_system
http://www.umich.edu/~ipcaa/GIS/General%20GIS%20Concepts.htm
http://www.oas.org/DSD/publications/Unit/oea66e/ch05.htm
envirn.umaryland.edu/.../Geographic%20Information%20Systems%20a%20new%20tool%20for
%20
http://journals.lww.com/cinjournal/Fulltext/2009/01000/Wireless_Technology_Improves_Nurs
ing_Workflow_and.12.aspx
http://courses.washington.edu/gis250/lessons/introduction_gis/spatial_data_model.html