geoderma - pub.epsilon.slu.se
TRANSCRIPT
This is an author produced version of a paper published in Geoderma.
This paper has been peer-reviewed and is proof-corrected, but does not
include the journal pagination.
Citation for the published paper:
Stenberg, B. (2010) Effects of soil sample pretreatments and standardised
rewetting as interacted with sand classes on Vis-NIR predictions of clay
and soil organic carbon. Geoderma.
Volume: 158 Number: 1-2, pp 15-22.
http://dx.doi.org/10.1016/j.geoderma.2010.04.008
Access to the published version may require journal subscription.
Published with permission from: Elsevier
Epsilon Open Archive http://epsilon.slu.se

Effects of Soil Sample Pretreatments and Standardised Rewetting as Interacted with Sand Classes on Vis-NIR predictions of Clay and Soil Organic Carbon Bo Stenberg1 Abstract Numerous studies have examined the soil analytical potential of diffuse reflectance spectroscopy in the near infrared range, alone or combined with the visible range (Vis-NIR). Soil organic matter (SOM), soil organic carbon (SOC) and clay content are the most commonly and successfully predicted parameters, but predictions are quite variable due e.g. to the range of soil types covered by the calibrations. Especially organic matter predictions are also suggested to be influenced by for example soil moisture content and inclusion of the visible range in the calibration. Excess quartz sand is also suggested to have a negative influence. This study was undertaken to examine the effect of a selection of standardised sample pretreatment procedures, including rewetting, on predictions of clay and SOC content. A subset of 400 samples was selected from a dataset of 3000 Swedish agricultural soils to cover clay and organic matter contents without co-variation. The selected samples were analysed by NIR and Vis-NIR on air-dry samples, either carefully mixed to avoid stratification of particle size classes or shaken to promote separation, resulting in predominantly larger particles being analysed. Unshaken samples were also analysed immediately after standardised additional drying at 35°C for 12 hours and stepwise volumetric rewetting up to 30%. Shaking and additional drying had small negative effects on clay predictions, while drying only had small positive effects on SOC predictions. Volumetric rewetting to 20 or 30% before scanning reduced clay prediction errors by up to 15%, RMSEP reduced from 5.4 % clay to 4.5 % clay, and SOC prediction errors by up to 30%, from 0.9 % SOC to 0.6 % SOC, indicating that standardised rewetting should be considered. The mechanisms concerned could not be specifically identified, but known bands for water, hydroxyl and clay mineral-dependent absorption near 1400, 1900 and 2200 nm were involved in the improved clay calibrations and bands near 1700, 2000, 2300 and 2350 nm in the improved SOC calibrations. The SOC predictions were most inaccurate for soils with a high sand content. For these samples the average prediction error was more than twice as high as those for less sandy samples. Rewetting eliminated this bias, largely explaining the positive effects of rewetting. Keywords Clay content, near infrared spectroscopy, partial least squares regression, soil organic carbon, spectral features, water effect
1 Department of Soil and Environment, SLU, PO Box 234, SE-532 23 Skara, Sweden Fax: +46 511 67134, E-mail: [email protected]
1
1. Introduction The interest in using diffuse reflectance spectroscopy in the visible (Vis) and near infrared (NIR) region for soil mapping purposes is steadily increasing. Applications of interest differ, but include estimation of the carbon pool to monitor carbon sequestration (Huang et al., 2007), precision agriculture (Wetterlind et al., 2008), land resource inventory and surveillance (Shepherd and Walsh, 2007), etc. Simplicity, rapidity and low cost are reported to be favourable features of Vis-NIR spectroscopy. The most frequently studied soil properties are probably soil organic carbon (SOC) and clay content, but calibration performance is reported to be very variable (Viscarra Rossel et al., 2006; Stenberg and Viscarra Rossel, 2009). There are many conceivable reasons for this. The distribution of the dependent variable, the general composition of the soil and the origin of soils in the datasets studied are often mentioned. Differences in laboratory practices such as sample pretreatment, sample presentation and instrumentation could also be a factor. Although soil organic matter (SOM) in all its complexity would, theoretically, be spectrally active over more or less the entire NIR region (Ben-Dor and Banin, 1995), it is often reported that SOM signals are weak (eg.Viscarra Rossel and McBratney, 1998). This implies that the high variability of the mineral fraction, which is typically much greater, could mask spectral absorption by organic matter, especially as spectral features of minerals and organic matter may coincide (Stenberg and Viscarra Rossel, 2009). Most minerals have unique spectral features that dominate a soil spectrum (Clark et al., 1990). The mineral composition varies geographically, but also with soil texture. The clay fraction is dominated by clay minerals such as smectites, kaolinites, illites, vermiculites, etc., while the sand fraction is dominated by resistant minerals such as quarts and feldspars. Therefore, if mineralogy and texture differ substantially between samples, the weaker features of organic matter would be more difficult to separate out in a calibration. There is also a possibility that certain mineral compositions could interfere more with organic matter than others. In a large set of samples gathered to represent Swedish agricultural land, it was found that the prediction power for SOM of all soils was very poor, but that it was substantially improved by excluding the least clayey soils (Stenberg et al., 2002). Water and hydroxyls (OH) have strong influences in the Vis-NIR region. Overtones of OH stretching absorb near 1400 nm and combinations of H-O-H bending and OH stretching absorb at 1900 nm (Clark, 1999). There are also weaker bands all over the Vis-NIR range. Water is apparent in all soils, even when dried. Its absorption pattern changes when adapting to physical and chemical matrix variations. Aquaphotomics, a relatively new term in NIR spectroscopy (Tsenkova, 2007), is the study of how the water peaks in the near infrared spectrum change under the influence of other molecules in samples and systems. For example, water peak frequencies can contribute to protein calibrations by means of hydrogen bonding interactions. It can be assumed that a similar process can be responsible for phenomena observed in the measurement of moist or wet soil. It is also well known that the bands near 1400 and 1900 nm can be attributed to free water, as well as water contained in the lattice of various clay minerals or adsorbed to particle surfaces. Depending on the mechanisms and minerals involved, absorption bands may shift and be sharp or broad (Clark et al., 1990). It has frequently been shown that Vis-NIR relates better to organic matter than NIR alone. For example, Islam et al. (2003) obtained considerably better results for Australian soils by
2
including the visible region (350-700 nm) in the calibration. Similar observations have been reported for Norwegian soils (Fystro, 2002). It has been suggested that the brightness of the sample is an important feature in the visible region for prediction quality of organic C content (Udelhoven et al., 2003). However, the converse has been reported for US land resource areas (Chang et al., 2001) and south-eastern Australia (Dunn et al., 2002). Although the general observation is that darker soil contains more organic matter, many other soil properties, such as texture, structure, moisture and mineralogy, are also influential in this respect (Clark, 1999; Hummel et al., 2001), implying that darkness would only be a useful feature within a limited geological variation. The purpose of this study was to test the effect of sample pre-treatment, such as standardisation of dryness and sample presentation, and rewetting on the calibration performance of Vis-NIR and NIR spectra for SOC and clay content. The benchmark was a defined volume of sieved, air-dried and stored soil prepared to avoid particle size stratification. This was assumed to represent a fairly normal procedure for laboratory NIR analysis. In relation to this, further standardisation steps regarding moisture were tested. Soils were subjected to additional drying directly before analysis with the reflectance probe and samples were remoistened in a high humidity chamber. The effect of particle size stratification due to shaking was also tested, as this can easily occur if care is not taken to avoid it. In addition, the influence on spectra and calibration performance of rewetting by adding volumetrically defined amounts of water was evaluated. 2. Materials and Method 2.1. Soil sampling, analysis and selection For the experiments, 400 soil samples representative of Swedish agricultural land were selected (see below) from a soil library of approximately 3000 Swedish topsoil samples taken between 1988 and 1995. In the original sampling performed for a national monitoring project (Eriksson et al., 1997) random sampling within small geographical areas evenly distributed over Swedish agricultural soil was performed to reach a density of approximately 1 sample per 900 ha. Each sample comprised 6-20 soil cores from 0-20 cm taken from an area of 10-20 m2 each. These samples were dried at 25-30 °C, crushed and passed through a 2 mm screen (Eriksson et al., 1997). Organic carbon was analysed on finely ground soil using a LECO CNS 700 elemental analyser (LECO, St. Joseph, MI). All soils with a pH exceeding 6.7 were corrected for carbonate by treatment with 2 M HCl and reanalysed for carbon. Soil clay content was analysed by the sedimentation/pipette method according to Gee and Bauder (1986). Clay was defined as particles <2 µm. Soil classes were not specifically analysed for this original dataset, but mineral agricultural soils in Sweden are dominated by young weakly developed Eutric and Dystric Cambisols (European Comission, 2005). The dominant clay mineral is illite, but in some soils almost as much vermiculite can occur and in southern Sweden a significant amount of smectite can be present (Eriksson et al., 2005). Soil material in the original dataset not used for chemical analyses was stored in plastic jars. During sub-selection in 2007 for the present study, soils exceeding 7% SOC were excluded, as the frequency of soils with higher SOC decreased drastically and soils high in both SOC and clay were lacking. The clay content of the remaining 2600 soils was plotted against SOC content and 400 evenly distributed samples were selected. In this way, any
3
interdependence between clay and SOC was avoided (r=0.06) and the selection was fairly well distributed over both the clay and SOC range, although the strong bias towards low SOC and clay content in the original dataset could not be completely avoided. 2.2. Vis-NIR analysis and pretreatments Vis-NIR spectra were collected using a FieldSpec Pro FR scanning instrument (Analytical Spectral Devices Inc., Boulder, CO, USA, www.asdi.com). The spectral range covered both the visible and the near infrared regions, 350-2500 nm, sampled at 1.4-2 nm intervals with a spectral resolution of 3-10 nm. A wavelength interval of 1 nm was interpolated to the instrument output file. Thus, spectra consisted of 1 data point every nm. The instrument was equipped with a bare optic fibre connected to a self constructed probe with a 20W Al-coated halogen tungsten light source placed 7 cm over the sample, resulting in a field of view of ~7.5 cm2. Each soil sample spectrum comprised 100 averaged spectra collected from one Petri dish placed on a rotating sample stage. The total sample area analysed was about 50 cm2. The total time a sample was allowed to remain under the light source was standardised to 12-18 seconds to avoid heating of the sample but still ensure that all 100 spectra were properly collected. Before scanning, each sample was thoroughly mixed and 40 cm3 soil were measured with a baker and carefully transferred into a 10 cm Petri dish. First, shaking of the sample in the Petri dish was performed by rapidly moving the dish in circles over the table to produce an even surface. This is a rapid method and would be preferable from a rationality perspective, but may result in interfering particle size stratification of samples. Thereafter the sample was remixed and flattened by exerting a little pressure on the surface, without changing the total volume significantly, using a cardboard disc slightly smaller than the Petri dish. This produced an even and smooth soil surface for the spectroscopic measurements, while care was taken to avoid particle size stratification. This pretreatment was considered the standard procedure and is hereafter referred to as flat-dry. All other pretreatments were performed in sequence on the same sample. Additional drying of the flat-dry samples was performed at 35 °C for 12 hours, which is a common temperature used in labs for producing air-dry soil before analyses (Pretreatment: 35 °C). The spectra of these samples were measured 30 min after they were exposed to room temperature (22 °C). Remoistening, as a potential standard procedure, of flat-dry samples was performed in a climate chamber for 12 hours at room temperature but at 90 % relative humidity (90% RH). Spectra were measured within 10 minutes of their removal from the climate chamber, during which time the dishes were kept lidded to prevent excessive loss of moisture. The intention with additional drying and remoistening was to establish a standardised dryness or moisture independent of influence of storage. The samples were then rewetted volumetrically (θ). Water was added with a simple spray flask for uniform and non-disruptive application. The precise volume was established by recording the change in weight of the Petri dish. Water was gradually added to reach θ 12.5, 20 and 30 %, (±1.2) with 12 hours of incubation at 90% RH and room temperature between water contents to allow the water to distribute, settle and absorb before each scanning. Finally, an additional aliquot of 2 cm3 (θ 5%) was added to the θ 30 % samples and NIR spectra were measured immediately. Thus water was not allowed to settle and a wet surface was produced, at least on the more clayey samples. In all, eight different pretreatments were compared.
4
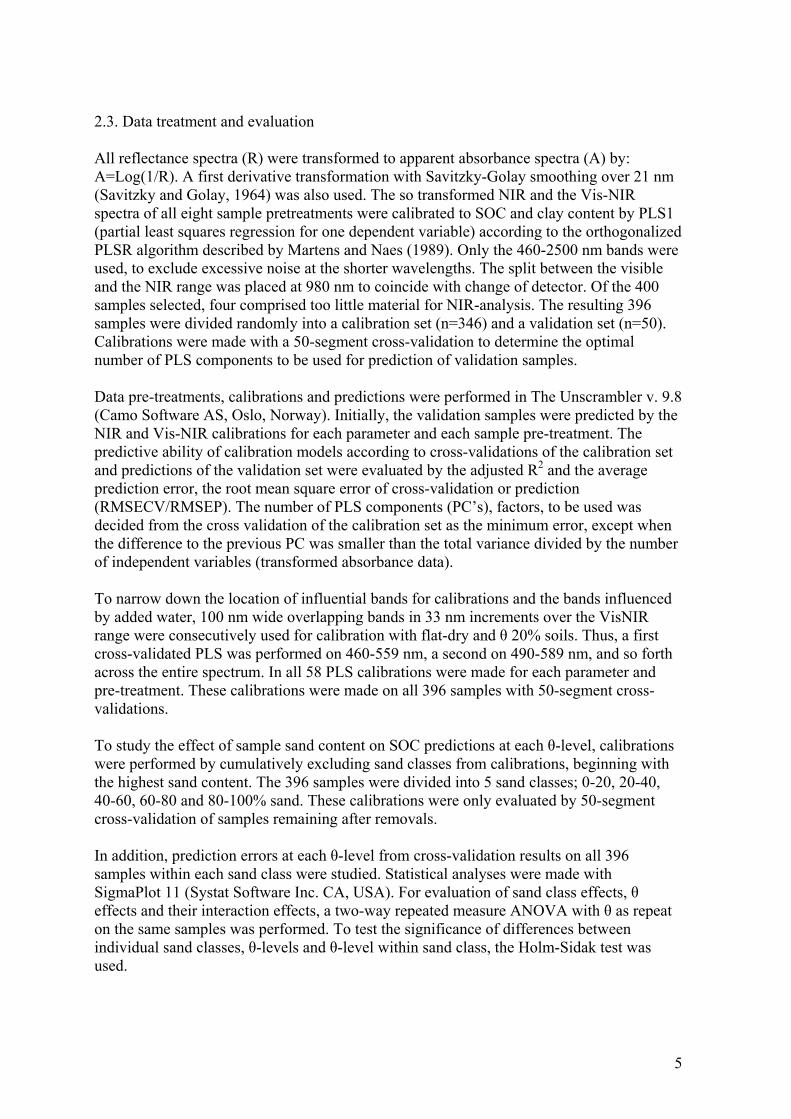
2.3. Data treatment and evaluation All reflectance spectra (R) were transformed to apparent absorbance spectra (A) by: A=Log(1/R). A first derivative transformation with Savitzky-Golay smoothing over 21 nm (Savitzky and Golay, 1964) was also used. The so transformed NIR and the Vis-NIR spectra of all eight sample pretreatments were calibrated to SOC and clay content by PLS1 (partial least squares regression for one dependent variable) according to the orthogonalized PLSR algorithm described by Martens and Naes (1989). Only the 460-2500 nm bands were used, to exclude excessive noise at the shorter wavelengths. The split between the visible and the NIR range was placed at 980 nm to coincide with change of detector. Of the 400 samples selected, four comprised too little material for NIR-analysis. The resulting 396 samples were divided randomly into a calibration set (n=346) and a validation set (n=50). Calibrations were made with a 50-segment cross-validation to determine the optimal number of PLS components to be used for prediction of validation samples. Data pre-treatments, calibrations and predictions were performed in The Unscrambler v. 9.8 (Camo Software AS, Oslo, Norway). Initially, the validation samples were predicted by the NIR and Vis-NIR calibrations for each parameter and each sample pre-treatment. The predictive ability of calibration models according to cross-validations of the calibration set and predictions of the validation set were evaluated by the adjusted R2 and the average prediction error, the root mean square error of cross-validation or prediction (RMSECV/RMSEP). The number of PLS components (PC’s), factors, to be used was decided from the cross validation of the calibration set as the minimum error, except when the difference to the previous PC was smaller than the total variance divided by the number of independent variables (transformed absorbance data). To narrow down the location of influential bands for calibrations and the bands influenced by added water, 100 nm wide overlapping bands in 33 nm increments over the VisNIR range were consecutively used for calibration with flat-dry and θ 20% soils. Thus, a first cross-validated PLS was performed on 460-559 nm, a second on 490-589 nm, and so forth across the entire spectrum. In all 58 PLS calibrations were made for each parameter and pre-treatment. These calibrations were made on all 396 samples with 50-segment cross-validations. To study the effect of sample sand content on SOC predictions at each θ-level, calibrations were performed by cumulatively excluding sand classes from calibrations, beginning with the highest sand content. The 396 samples were divided into 5 sand classes; 0-20, 20-40, 40-60, 60-80 and 80-100% sand. These calibrations were only evaluated by 50-segment cross-validation of samples remaining after removals. In addition, prediction errors at each θ-level from cross-validation results on all 396 samples within each sand class were studied. Statistical analyses were made with SigmaPlot 11 (Systat Software Inc. CA, USA). For evaluation of sand class effects, θ effects and their interaction effects, a two-way repeated measure ANOVA with θ as repeat on the same samples was performed. To test the significance of differences between individual sand classes, θ-levels and θ-level within sand class, the Holm-Sidak test was used.
5
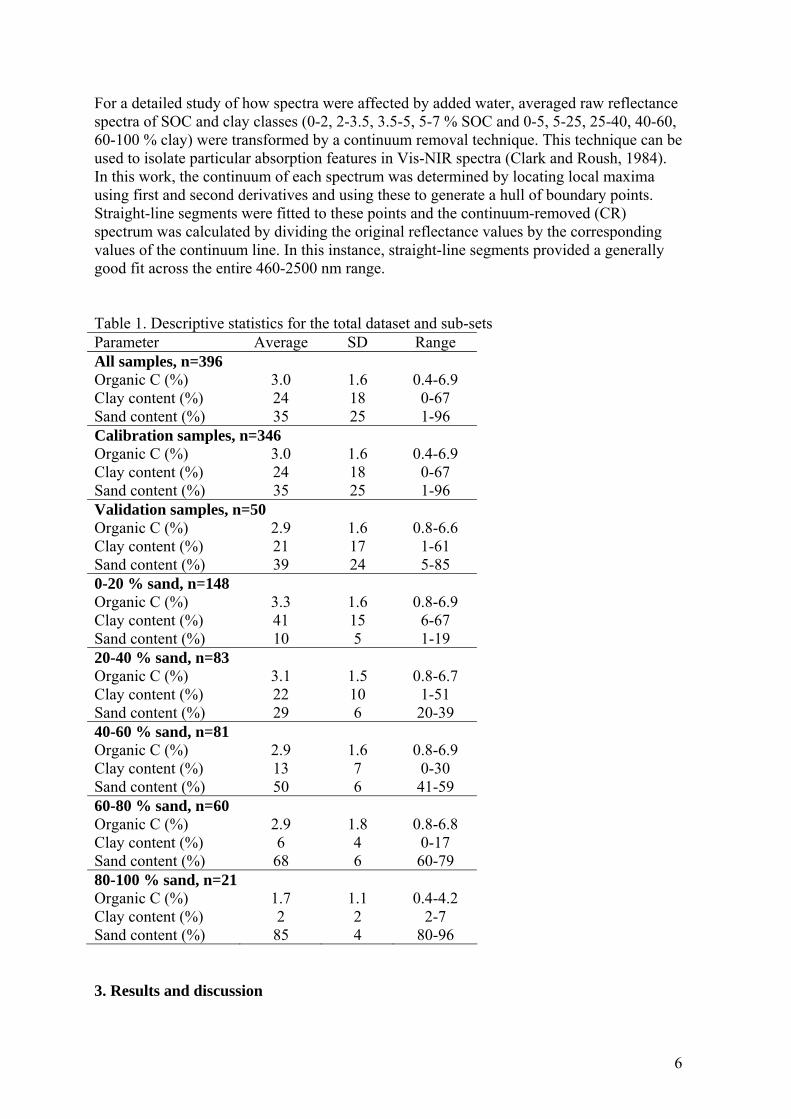
For a detailed study of how spectra were affected by added water, averaged raw reflectance spectra of SOC and clay classes (0-2, 2-3.5, 3.5-5, 5-7 % SOC and 0-5, 5-25, 25-40, 40-60, 60-100 % clay) were transformed by a continuum removal technique. This technique can be used to isolate particular absorption features in Vis-NIR spectra (Clark and Roush, 1984). In this work, the continuum of each spectrum was determined by locating local maxima using first and second derivatives and using these to generate a hull of boundary points. Straight-line segments were fitted to these points and the continuum-removed (CR) spectrum was calculated by dividing the original reflectance values by the corresponding values of the continuum line. In this instance, straight-line segments provided a generally good fit across the entire 460-2500 nm range. Table 1. Descriptive statistics for the total dataset and sub-sets Parameter Average SD Range All samples, n=396 Organic C (%) 3.0 1.6 0.4-6.9 Clay content (%) 24 18 0-67 Sand content (%) 35 25 1-96 Calibration samples, n=346 Organic C (%) 3.0 1.6 0.4-6.9 Clay content (%) 24 18 0-67 Sand content (%) 35 25 1-96 Validation samples, n=50 Organic C (%) 2.9 1.6 0.8-6.6 Clay content (%) 21 17 1-61 Sand content (%) 39 24 5-85 0-20 % sand, n=148 Organic C (%) 3.3 1.6 0.8-6.9 Clay content (%) 41 15 6-67 Sand content (%) 10 5 1-19 20-40 % sand, n=83 Organic C (%) 3.1 1.5 0.8-6.7 Clay content (%) 22 10 1-51 Sand content (%) 29 6 20-39 40-60 % sand, n=81 Organic C (%) 2.9 1.6 0.8-6.9 Clay content (%) 13 7 0-30 Sand content (%) 50 6 41-59 60-80 % sand, n=60 Organic C (%) 2.9 1.8 0.8-6.8 Clay content (%) 6 4 0-17 Sand content (%) 68 6 60-79 80-100 % sand, n=21 Organic C (%) 1.7 1.1 0.4-4.2 Clay content (%) 2 2 2-7 Sand content (%) 85 4 80-96 3. Results and discussion
6
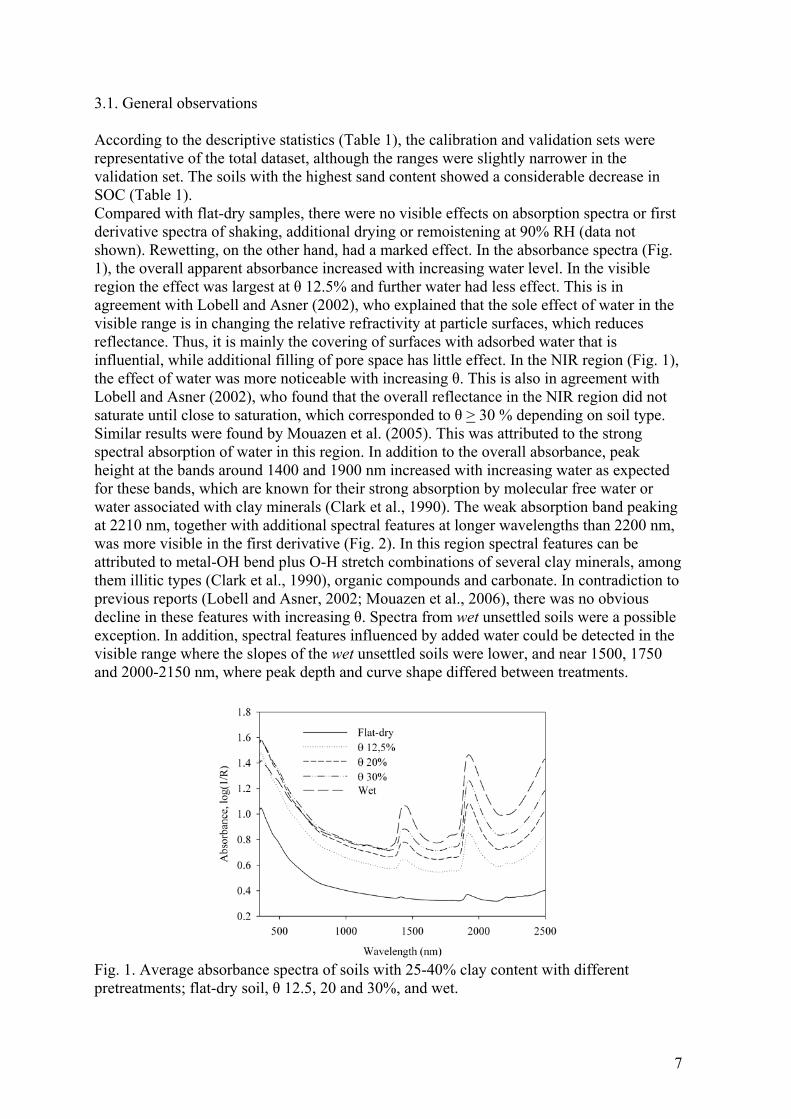
3.1. General observations According to the descriptive statistics (Table 1), the calibration and validation sets were representative of the total dataset, although the ranges were slightly narrower in the validation set. The soils with the highest sand content showed a considerable decrease in SOC (Table 1). Compared with flat-dry samples, there were no visible effects on absorption spectra or first derivative spectra of shaking, additional drying or remoistening at 90% RH (data not shown). Rewetting, on the other hand, had a marked effect. In the absorbance spectra (Fig. 1), the overall apparent absorbance increased with increasing water level. In the visible region the effect was largest at θ 12.5% and further water had less effect. This is in agreement with Lobell and Asner (2002), who explained that the sole effect of water in the visible range is in changing the relative refractivity at particle surfaces, which reduces reflectance. Thus, it is mainly the covering of surfaces with adsorbed water that is influential, while additional filling of pore space has little effect. In the NIR region (Fig. 1), the effect of water was more noticeable with increasing θ. This is also in agreement with Lobell and Asner (2002), who found that the overall reflectance in the NIR region did not saturate until close to saturation, which corresponded to θ > 30 % depending on soil type. Similar results were found by Mouazen et al. (2005). This was attributed to the strong spectral absorption of water in this region. In addition to the overall absorbance, peak height at the bands around 1400 and 1900 nm increased with increasing water as expected for these bands, which are known for their strong absorption by molecular free water or water associated with clay minerals (Clark et al., 1990). The weak absorption band peaking at 2210 nm, together with additional spectral features at longer wavelengths than 2200 nm, was more visible in the first derivative (Fig. 2). In this region spectral features can be attributed to metal-OH bend plus O-H stretch combinations of several clay minerals, among them illitic types (Clark et al., 1990), organic compounds and carbonate. In contradiction to previous reports (Lobell and Asner, 2002; Mouazen et al., 2006), there was no obvious decline in these features with increasing θ. Spectra from wet unsettled soils were a possible exception. In addition, spectral features influenced by added water could be detected in the visible range where the slopes of the wet unsettled soils were lower, and near 1500, 1750 and 2000-2150 nm, where peak depth and curve shape differed between treatments.
Fig. 1. Average absorbance spectra of soils with 25-40% clay content with different pretreatments; flat-dry soil, θ 12.5, 20 and 30%, and wet.
7
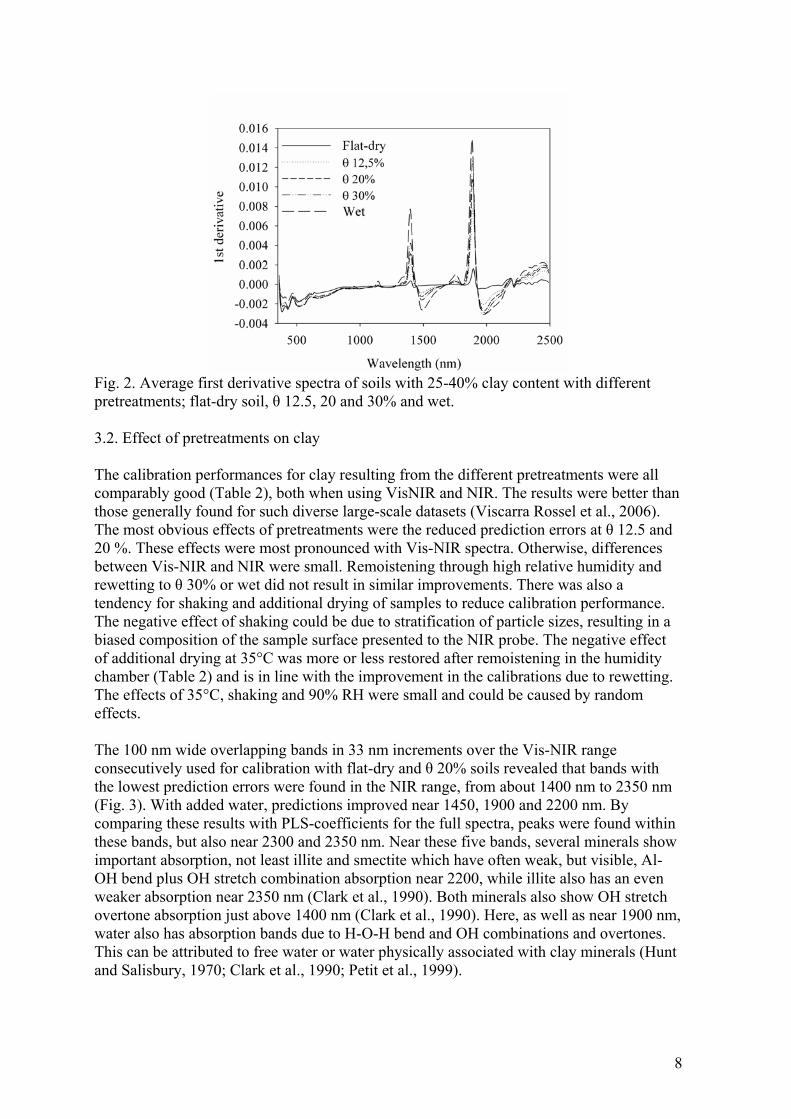
Fig. 2. Average first derivative spectra of soils with 25-40% clay content with different pretreatments; flat-dry soil, θ 12.5, 20 and 30% and wet. 3.2. Effect of pretreatments on clay The calibration performances for clay resulting from the different pretreatments were all comparably good (Table 2), both when using VisNIR and NIR. The results were better than those generally found for such diverse large-scale datasets (Viscarra Rossel et al., 2006). The most obvious effects of pretreatments were the reduced prediction errors at θ 12.5 and 20 %. These effects were most pronounced with Vis-NIR spectra. Otherwise, differences between Vis-NIR and NIR were small. Remoistening through high relative humidity and rewetting to θ 30% or wet did not result in similar improvements. There was also a tendency for shaking and additional drying of samples to reduce calibration performance. The negative effect of shaking could be due to stratification of particle sizes, resulting in a biased composition of the sample surface presented to the NIR probe. The negative effect of additional drying at 35°C was more or less restored after remoistening in the humidity chamber (Table 2) and is in line with the improvement in the calibrations due to rewetting. The effects of 35°C, shaking and 90% RH were small and could be caused by random effects. The 100 nm wide overlapping bands in 33 nm increments over the Vis-NIR range consecutively used for calibration with flat-dry and θ 20% soils revealed that bands with the lowest prediction errors were found in the NIR range, from about 1400 nm to 2350 nm (Fig. 3). With added water, predictions improved near 1450, 1900 and 2200 nm. By comparing these results with PLS-coefficients for the full spectra, peaks were found within these bands, but also near 2300 and 2350 nm. Near these five bands, several minerals show important absorption, not least illite and smectite which have often weak, but visible, Al-OH bend plus OH stretch combination absorption near 2200, while illite also has an even weaker absorption near 2350 nm (Clark et al., 1990). Both minerals also show OH stretch overtone absorption just above 1400 nm (Clark et al., 1990). Here, as well as near 1900 nm, water also has absorption bands due to H-O-H bend and OH combinations and overtones. This can be attributed to free water or water physically associated with clay minerals (Hunt and Salisbury, 1970; Clark et al., 1990; Petit et al., 1999).
8
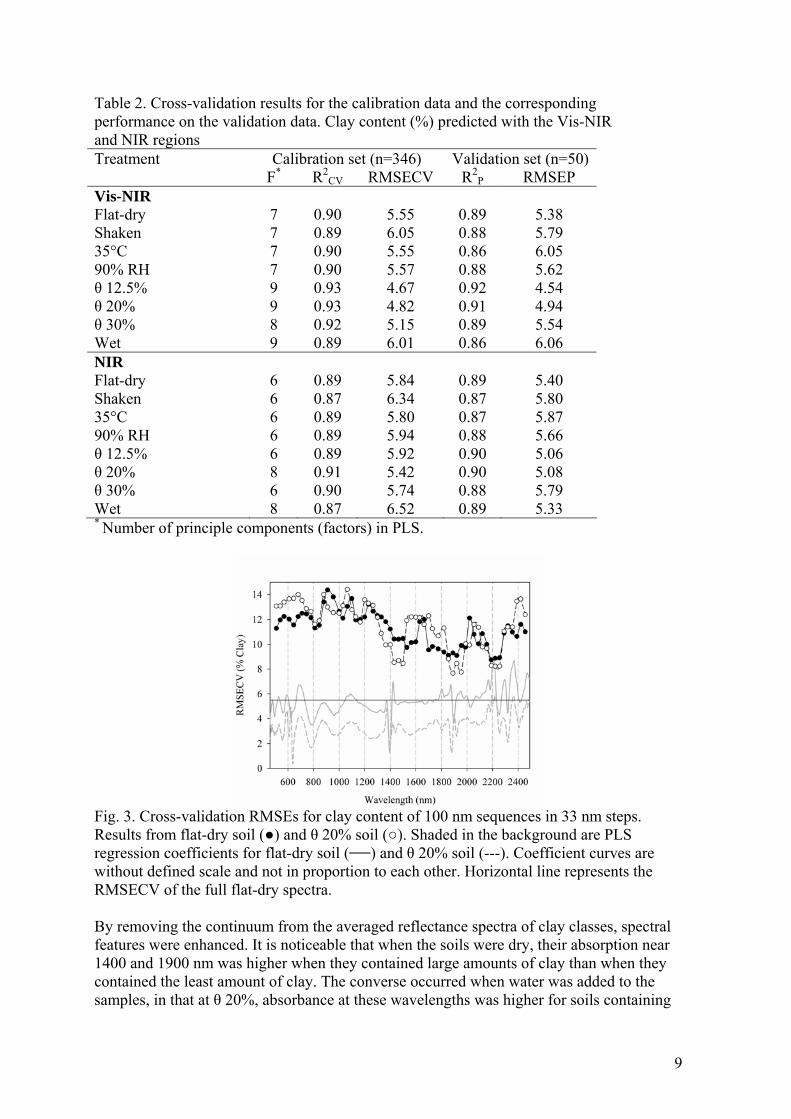
Table 2. Cross-validation results for the calibration data and the corresponding performance on the validation data. Clay content (%) predicted with the Vis-NIR and NIR regions Treatment Calibration set (n=346) Validation set (n=50) F* R2
CV RMSECV R2P RMSEP
Vis-NIR Flat-dry 7 0.90 5.55 0.89 5.38 Shaken 7 0.89 6.05 0.88 5.79 35°C 7 0.90 5.55 0.86 6.05 90% RH 7 0.90 5.57 0.88 5.62 θ 12.5% 9 0.93 4.67 0.92 4.54 θ 20% 9 0.93 4.82 0.91 4.94 θ 30% 8 0.92 5.15 0.89 5.54 Wet 9 0.89 6.01 0.86 6.06 NIR Flat-dry 6 0.89 5.84 0.89 5.40 Shaken 6 0.87 6.34 0.87 5.80 35°C 6 0.89 5.80 0.87 5.87 90% RH 6 0.89 5.94 0.88 5.66 θ 12.5% 6 0.89 5.92 0.90 5.06 θ 20% 8 0.91 5.42 0.90 5.08 θ 30% 6 0.90 5.74 0.88 5.79 Wet 8 0.87 6.52 0.89 5.33 * Number of principle components (factors) in PLS.
Fig. 3. Cross-validation RMSEs for clay content of 100 nm sequences in 33 nm steps. Results from flat-dry soil (●) and θ 20% soil (○). Shaded in the background are PLS regression coefficients for flat-dry soil ( ) and θ 20% soil (---). Coefficient curves are without defined scale and not in proportion to each other. Horizontal line represents the RMSECV of the full flat-dry spectra. By removing the continuum from the averaged reflectance spectra of clay classes, spectral features were enhanced. It is noticeable that when the soils were dry, their absorption near 1400 and 1900 nm was higher when they contained large amounts of clay than when they contained the least amount of clay. The converse occurred when water was added to the samples, in that at θ 20%, absorbance at these wavelengths was higher for soils containing
9
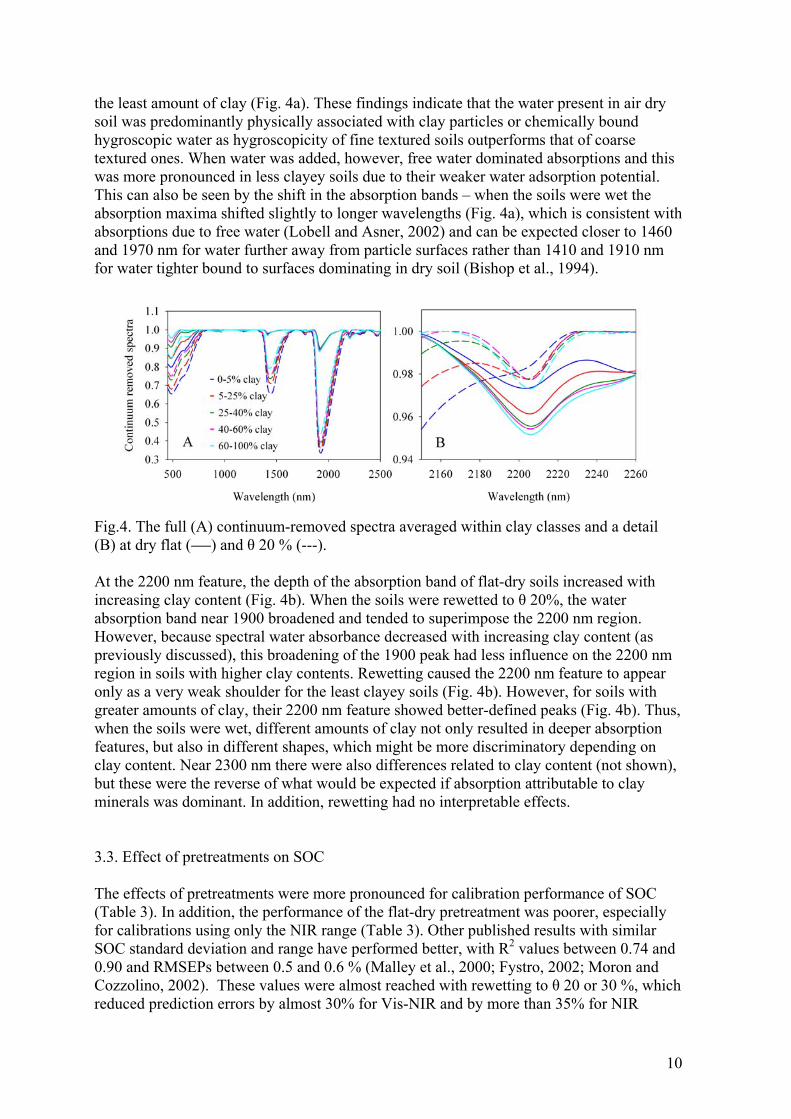
the least amount of clay (Fig. 4a). These findings indicate that the water present in air dry soil was predominantly physically associated with clay particles or chemically bound hygroscopic water as hygroscopicity of fine textured soils outperforms that of coarse textured ones. When water was added, however, free water dominated absorptions and this was more pronounced in less clayey soils due to their weaker water adsorption potential. This can also be seen by the shift in the absorption bands – when the soils were wet the absorption maxima shifted slightly to longer wavelengths (Fig. 4a), which is consistent with absorptions due to free water (Lobell and Asner, 2002) and can be expected closer to 1460 and 1970 nm for water further away from particle surfaces rather than 1410 and 1910 nm for water tighter bound to surfaces dominating in dry soil (Bishop et al., 1994).
Fig.4. The full (A) continuum-removed spectra averaged within clay classes and a detail (B) at dry flat ( ) and θ 20 % (---). At the 2200 nm feature, the depth of the absorption band of flat-dry soils increased with increasing clay content (Fig. 4b). When the soils were rewetted to θ 20%, the water absorption band near 1900 broadened and tended to superimpose the 2200 nm region. However, because spectral water absorbance decreased with increasing clay content (as previously discussed), this broadening of the 1900 peak had less influence on the 2200 nm region in soils with higher clay contents. Rewetting caused the 2200 nm feature to appear only as a very weak shoulder for the least clayey soils (Fig. 4b). However, for soils with greater amounts of clay, their 2200 nm feature showed better-defined peaks (Fig. 4b). Thus, when the soils were wet, different amounts of clay not only resulted in deeper absorption features, but also in different shapes, which might be more discriminatory depending on clay content. Near 2300 nm there were also differences related to clay content (not shown), but these were the reverse of what would be expected if absorption attributable to clay minerals was dominant. In addition, rewetting had no interpretable effects. 3.3. Effect of pretreatments on SOC The effects of pretreatments were more pronounced for calibration performance of SOC (Table 3). In addition, the performance of the flat-dry pretreatment was poorer, especially for calibrations using only the NIR range (Table 3). Other published results with similar SOC standard deviation and range have performed better, with R2 values between 0.74 and 0.90 and RMSEPs between 0.5 and 0.6 % (Malley et al., 2000; Fystro, 2002; Moron and Cozzolino, 2002). These values were almost reached with rewetting to θ 20 or 30 %, which reduced prediction errors by almost 30% for Vis-NIR and by more than 35% for NIR
10
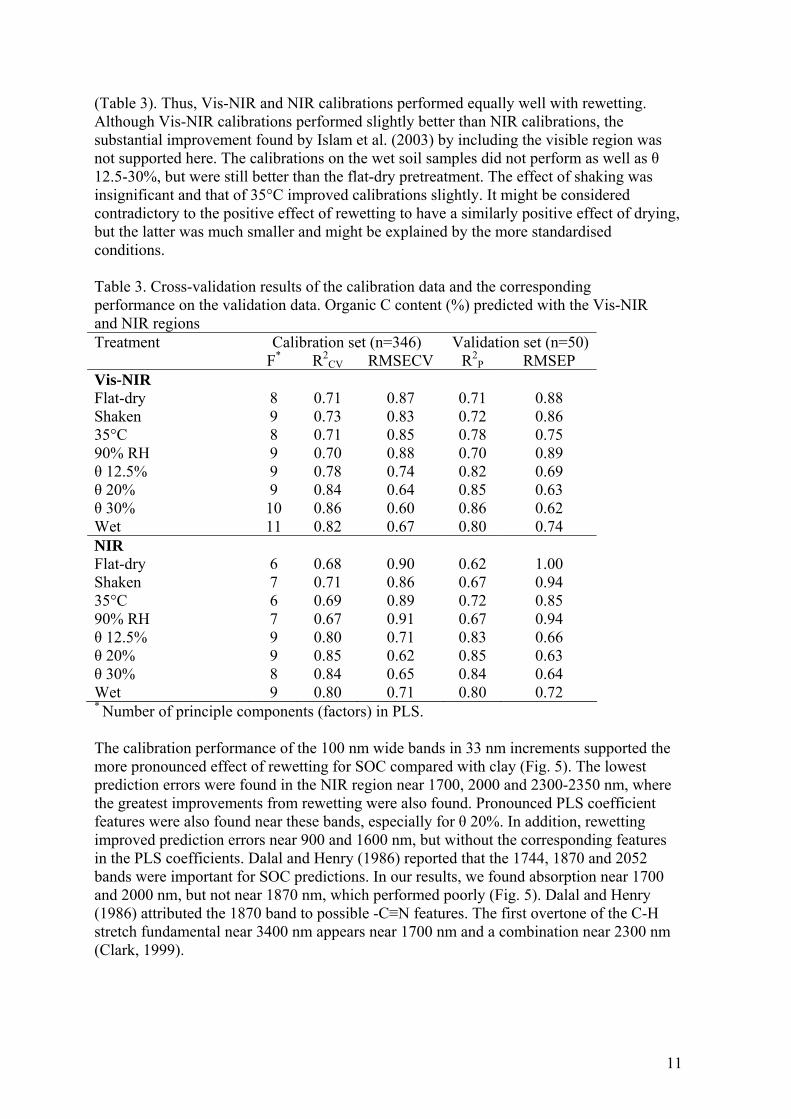
(Table 3). Thus, Vis-NIR and NIR calibrations performed equally well with rewetting. Although Vis-NIR calibrations performed slightly better than NIR calibrations, the substantial improvement found by Islam et al. (2003) by including the visible region was not supported here. The calibrations on the wet soil samples did not perform as well as θ 12.5-30%, but were still better than the flat-dry pretreatment. The effect of shaking was insignificant and that of 35°C improved calibrations slightly. It might be considered contradictory to the positive effect of rewetting to have a similarly positive effect of drying, but the latter was much smaller and might be explained by the more standardised conditions. Table 3. Cross-validation results of the calibration data and the corresponding performance on the validation data. Organic C content (%) predicted with the Vis-NIR and NIR regions Treatment Calibration set (n=346) Validation set (n=50) F* R2
CV RMSECV R2P RMSEP
Vis-NIR Flat-dry 8 0.71 0.87 0.71 0.88 Shaken 9 0.73 0.83 0.72 0.86 35°C 8 0.71 0.85 0.78 0.75 90% RH 9 0.70 0.88 0.70 0.89 θ 12.5% 9 0.78 0.74 0.82 0.69 θ 20% 9 0.84 0.64 0.85 0.63 θ 30% 10 0.86 0.60 0.86 0.62 Wet 11 0.82 0.67 0.80 0.74 NIR Flat-dry 6 0.68 0.90 0.62 1.00 Shaken 7 0.71 0.86 0.67 0.94 35°C 6 0.69 0.89 0.72 0.85 90% RH 7 0.67 0.91 0.67 0.94 θ 12.5% 9 0.80 0.71 0.83 0.66 θ 20% 9 0.85 0.62 0.85 0.63 θ 30% 8 0.84 0.65 0.84 0.64 Wet 9 0.80 0.71 0.80 0.72 * Number of principle components (factors) in PLS. The calibration performance of the 100 nm wide bands in 33 nm increments supported the more pronounced effect of rewetting for SOC compared with clay (Fig. 5). The lowest prediction errors were found in the NIR region near 1700, 2000 and 2300-2350 nm, where the greatest improvements from rewetting were also found. Pronounced PLS coefficient features were also found near these bands, especially for θ 20%. In addition, rewetting improved prediction errors near 900 and 1600 nm, but without the corresponding features in the PLS coefficients. Dalal and Henry (1986) reported that the 1744, 1870 and 2052 bands were important for SOC predictions. In our results, we found absorption near 1700 and 2000 nm, but not near 1870 nm, which performed poorly (Fig. 5). Dalal and Henry (1986) attributed the 1870 band to possible -C≡N features. The first overtone of the C-H stretch fundamental near 3400 nm appears near 1700 nm and a combination near 2300 nm (Clark, 1999).
11
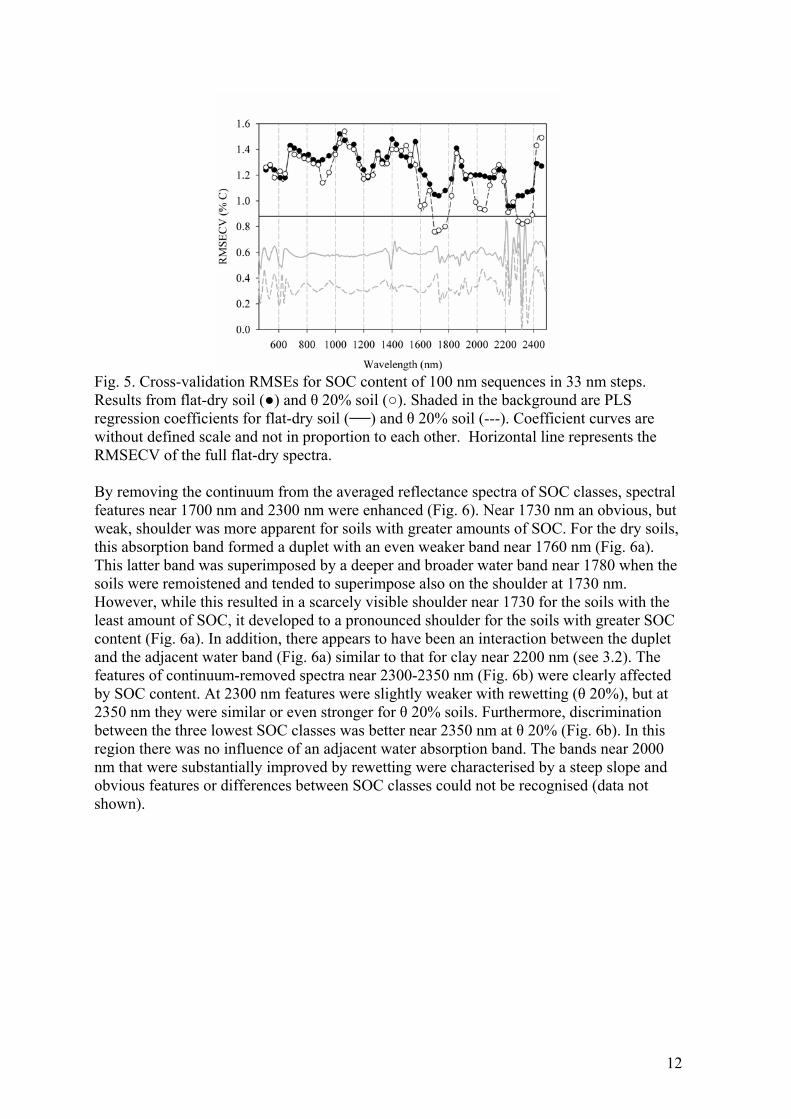
Fig. 5. Cross-validation RMSEs for SOC content of 100 nm sequences in 33 nm steps. Results from flat-dry soil (●) and θ 20% soil (○). Shaded in the background are PLS regression coefficients for flat-dry soil ( ) and θ 20% soil (---). Coefficient curves are without defined scale and not in proportion to each other. Horizontal line represents the RMSECV of the full flat-dry spectra.
By removing the continuum from the averaged reflectance spectra of SOC classes, spectral features near 1700 nm and 2300 nm were enhanced (Fig. 6). Near 1730 nm an obvious, but weak, shoulder was more apparent for soils with greater amounts of SOC. For the dry soils, this absorption band formed a duplet with an even weaker band near 1760 nm (Fig. 6a). This latter band was superimposed by a deeper and broader water band near 1780 when the soils were remoistened and tended to superimpose also on the shoulder at 1730 nm. However, while this resulted in a scarcely visible shoulder near 1730 for the soils with the least amount of SOC, it developed to a pronounced shoulder for the soils with greater SOC content (Fig. 6a). In addition, there appears to have been an interaction between the duplet and the adjacent water band (Fig. 6a) similar to that for clay near 2200 nm (see 3.2). The features of continuum-removed spectra near 2300-2350 nm (Fig. 6b) were clearly affected by SOC content. At 2300 nm features were slightly weaker with rewetting (θ 20%), but at 2350 nm they were similar or even stronger for θ 20% soils. Furthermore, discrimination between the three lowest SOC classes was better near 2350 nm at θ 20% (Fig. 6b). In this region there was no influence of an adjacent water absorption band. The bands near 2000 nm that were substantially improved by rewetting were characterised by a steep slope and obvious features or differences between SOC classes could not be recognised (data not shown).
12
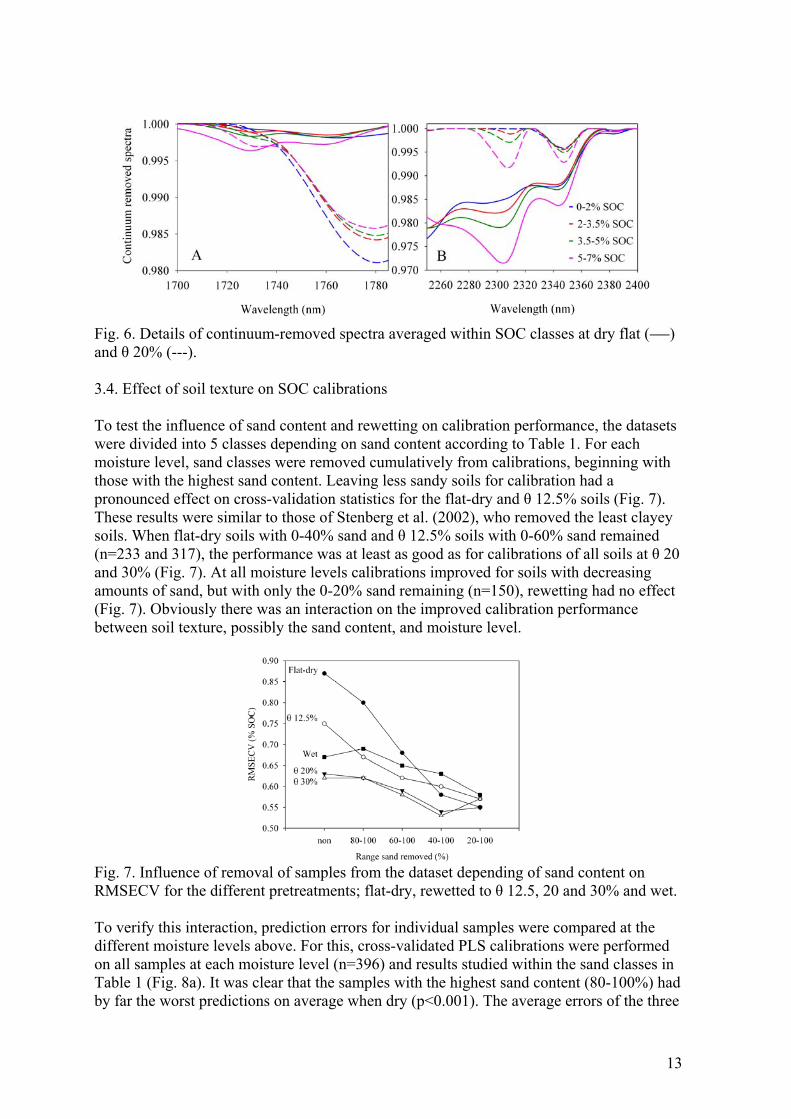
Fig. 6. Details of continuum-removed spectra averaged within SOC classes at dry flat ( ) and θ 20% (---). 3.4. Effect of soil texture on SOC calibrations To test the influence of sand content and rewetting on calibration performance, the datasets were divided into 5 classes depending on sand content according to Table 1. For each moisture level, sand classes were removed cumulatively from calibrations, beginning with those with the highest sand content. Leaving less sandy soils for calibration had a pronounced effect on cross-validation statistics for the flat-dry and θ 12.5% soils (Fig. 7). These results were similar to those of Stenberg et al. (2002), who removed the least clayey soils. When flat-dry soils with 0-40% sand and θ 12.5% soils with 0-60% sand remained (n=233 and 317), the performance was at least as good as for calibrations of all soils at θ 20 and 30% (Fig. 7). At all moisture levels calibrations improved for soils with decreasing amounts of sand, but with only the 0-20% sand remaining (n=150), rewetting had no effect (Fig. 7). Obviously there was an interaction on the improved calibration performance between soil texture, possibly the sand content, and moisture level.
Fig. 7. Influence of removal of samples from the dataset depending of sand content on RMSECV for the different pretreatments; flat-dry, rewetted to θ 12.5, 20 and 30% and wet.
To verify this interaction, prediction errors for individual samples were compared at the different moisture levels above. For this, cross-validated PLS calibrations were performed on all samples at each moisture level (n=396) and results studied within the sand classes in Table 1 (Fig. 8a). It was clear that the samples with the highest sand content (80-100%) had by far the worst predictions on average when dry (p<0.001). The average errors of the three
13
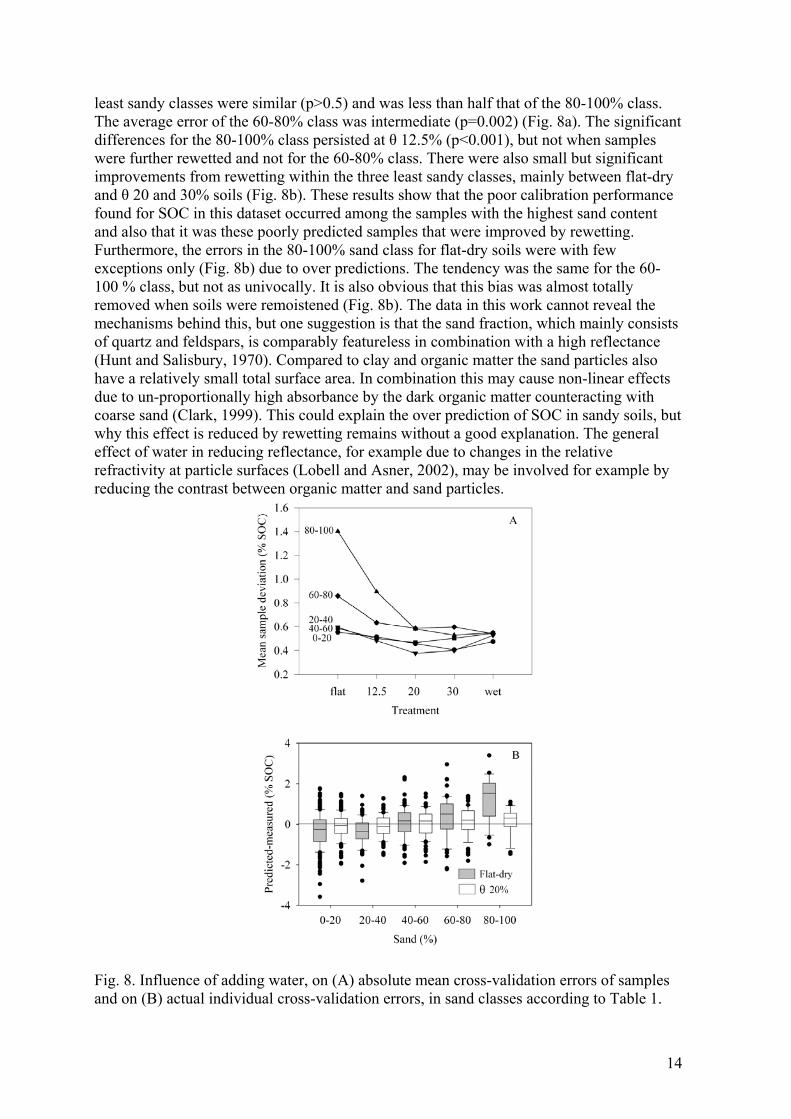
least sandy classes were similar (p>0.5) and was less than half that of the 80-100% class. The average error of the 60-80% class was intermediate (p=0.002) (Fig. 8a). The significant differences for the 80-100% class persisted at θ 12.5% (p<0.001), but not when samples were further rewetted and not for the 60-80% class. There were also small but significant improvements from rewetting within the three least sandy classes, mainly between flat-dry and θ 20 and 30% soils (Fig. 8b). These results show that the poor calibration performance found for SOC in this dataset occurred among the samples with the highest sand content and also that it was these poorly predicted samples that were improved by rewetting. Furthermore, the errors in the 80-100% sand class for flat-dry soils were with few exceptions only (Fig. 8b) due to over predictions. The tendency was the same for the 60-100 % class, but not as univocally. It is also obvious that this bias was almost totally removed when soils were remoistened (Fig. 8b). The data in this work cannot reveal the mechanisms behind this, but one suggestion is that the sand fraction, which mainly consists of quartz and feldspars, is comparably featureless in combination with a high reflectance (Hunt and Salisbury, 1970). Compared to clay and organic matter the sand particles also have a relatively small total surface area. In combination this may cause non-linear effects due to un-proportionally high absorbance by the dark organic matter counteracting with coarse sand (Clark, 1999). This could explain the over prediction of SOC in sandy soils, but why this effect is reduced by rewetting remains without a good explanation. The general effect of water in reducing reflectance, for example due to changes in the relative refractivity at particle surfaces (Lobell and Asner, 2002), may be involved for example by reducing the contrast between organic matter and sand particles.
Fig. 8. Influence of adding water, on (A) absolute mean cross-validation errors of samples and on (B) actual individual cross-validation errors, in sand classes according to Table 1.
14
4. Conclusions The results of this study show that rewetting soil samples to a volumetrically standardised level can improve Vis-NIR and NIR calibrations for SOC substantially. Calibrations for clay can also be improved, but not as much and maybe not sufficiently to justify the extra work of rewetting. However, as regards SOC, rewetting before spectra are collected should be taken into consideration, especially as a volumetrically-based addition is simple and only involves scoping a defined volume of soil and adding a defined amount of water. It should be emphasised that these results only refer to standardised laboratory conditions and cannot be directly applied in a discussion on the moisture problems in diffuse reflectance measurements with the variable moisture levels of fresh soil. The improved prediction performance was confirmed for SOC using the full Vis-NIR range compared with NIR only, but with rewetting there were no differences. For clay differences between using Vis-NIR and NIR were only small and inconsistent. The standardisation procedures evaluated for air-dry soils did not result in any major differences that would result in a need for extreme care before scanning. Mixing of samples and avoidance of stratification is recommended, but not crucial, for clay estimates. Effects of additional drying in conjunction with measurements are contradictory, as SOC calibrations obviously benefit slightly from it, while there is a tendency for the opposite for clay. The mechanisms behind the calibration improvements by rewetting samples largely remains unexplained, especially for SOC. The absorption bands near 1400, 1900 and 2200 nm, known for their clay mineral features, are the important ones for clay also when rewetted, but when water is added the prediction features near 1400 and 1900 nm changes. When moist it appears to be the ability of the soil, largely regulated by the clay content, to adsorb water and reduce the absorption at these bands that is influential. This feature may also interact with the adjacent 2200 band, allowing more clayey soils to curtail the superimposing effect of water near 2200 nm. For SOC on the other hand probable mechanisms are difficult to arrive at. Spectral features related to calibration improvements are apparently to be found at bands generally important for SOC predictions: above 1700 nm, near 2000 nm, but also at 2300-2350 nm. However, any potential straight-forward relationship with the general effect of water can not be suggested, as SOC is not as influential on the spectral features of water as clay, or at least not as obvious. The study revealed that the positive effect of rewetting on SOC calibrations was mainly by eliminating over prediction of the most sandysamples. This has important practical implications, as NIR calibrations can be ensured to be equally valid for all texture classes, substantially increasing the usefulness of NIR for SOC estimation. As this study was limited to a range of Swedish soils, its generality is not proven as universal. However, the soils included in the study covered a very wide distribution of the agricultural soils generally found in Sweden and probably Scandinavia. The only limitation was to soils with less than 7% SOC. As the dataset is characterised by geologically young soils with a low degree of weathering, limitations in generality related to mineralogy cannot be ruled out. Evaluating the effects of rewetting on datasets with different origins would therefore be valuable. I find the improvement of SOC predictions by rewetting especially
15
interesting, but also puzzling. Experiments dedicated to reveal the mechanisms of rewetting effects, physical or chemical, are needed. Supposedly explanations from such would involve the importance of mineralogy and texture. Then the potential for improvement by rewetting may be determined in each situation. As some of the advantages in rapidity with NIR spectroscopy are lost by rewetting, it should not be done unless benefits are expected. 5. Acknowledgements This research was supported by the Swedish Farmers' Foundation for Agricultural Research (SLF) and the Savings Bank Foundation in Skaraborg. I am also grateful to Dr. Raphael Viscarra Rossel (CSIRO) for performing the continuum removals and for valuable comments on the manuscript, to Dr. Jan Eriksson (SLU) for providing access to the soil library and to Anna Nyberg and Victor Nilsson (SLU) for performing the experimental work. 6. References Ben-Dor, E. and Banin, A., 1995. Near-infrared analysis as a rapid method to
simultaneously evaluate several soil properties. Soil Science Society of America Journal, 59(2): 364-372.
Bishop, J.L., Pieters, C.M. and Edwards, J.O., 1994. Infrared Spectroscopic Analyses on the Nature of Water in Montmorillonite. Clays and Clay Minerals, 42(6): 702-716.
Chang, C.W., Laird, D.A., Mausbach, M.J. and Hurburgh, C.R., 2001. Near-infrared reflectance spectroscopy-principal components regression analyses of soil properties. Soil Science Society of America Journal, 65(2): 480-490.
Clark, R.N., 1999. Spectroscopy of rocks and minerals and principles of spectroscopy. In: A.N. Rencz, Remote sensing for the earth sciences. Manual of remote sensing. John Wiley & Sons, Chichester, UK, pp. 3-58.
Clark, R.N., King, T.V.V., Klejwa, M., Swayze, G.A. and Vergo, N., 1990. High spectral resolution reflectance spectroscopy of minerals. Journal of Geophysical Research-Solid Earth and Planets, 95(B8): 12653-12680.
Clark, R.N. and Roush, T.L., 1984. Reflectance spectroscopy: Quantitative analysis techniques for remote sensing applications. Journal of Geophysical Research, 89(B7): 6329-6340.
Dalal, R.C. and Henry, R.J., 1986. Simultaneous determination of moisture, organic carbon, and total nitrogen by near infrared reflectance spectrophotometry. Soil Science Society of America Journal, 50: 120-123.
Dunn, B.W., Beecher, H.G., Batten, G.D. and Ciavarella, S., 2002. The potential of near-infrared reflectance spectroscopy for soil analysis - a case study from the Riverine Plain of south- eastern Australia. Australian Journal of Experimental Agriculture, 42(5): 607-614.
Eriksson, J., Andersson, A. and Andersson, R., 1997. Current Status of Swedish Arable Soils. 4778, Swedish EPA, Stockholm, 59 pp.
Eriksson, J., Nilsson, I. and Simonsson, M., 2005. Wiklanders Marklära. Studentliteratur, Uppsala, Sweden, 337 pp.
European Comission, 2005. Soil atlas of Europe, European soil bureau network. Office for official publications of the European communities, Luxembourg, 128 pp.
Fystro, G., 2002. The prediction of C and N content and their potential mineralisation in heterogeneous soil samples using Vis-NIR spectroscopy and comparative methods. Plant and Soil, 246(2): 139-149.
16
Gee, G.W. and Bauder, J.W., 1986. Particle-size analysis. A. Klute, Physical and mineralogical methods. Agronomy series. Soil Science Society of America, Madison, pp. 383-411.
Huang, X.W., Senthilkumar, S., Kravchenko, A., Thelen, K. and Qi, J.G., 2007. Total carbon mapping in glacial till soils using near-infrared spectroscopy, Landsat imagery and topographical information. Geoderma, 141(1/2): 34-42.
Hummel, J.W., Sudduth, K.A. and Hollinger, S.E., 2001. Soil moisture and organic matter prediction of surface and subsurface soils using an NIR soil sensor. Computers and Electronics in Agriculture, 32(2): 149-165.
Hunt, G.R. and Salisbury, J.W., 1970. Visible and near-infrared spectra of minerals and rocks. I. Silicate minerals. Modern Geology 1(4): 283-300.
Islam, K., Singh, B. and McBratney, A., 2003. Simultaneous estimation of several soil properties by ultra-violet, visible, and near-infrared reflectance spectroscopy. Australian Journal of Soil Research, 41(6): 1101-1114.
Lobell, D.B. and Asner, G.P., 2002. Moisture effects on soil reflectance. Soil Science Society of America Journal, 66(3): 722-727.
Malley, D.F., Martin P.D., McClintock L.M., Yesmin L., Eilers R.G. and Haluschak P. 2000. Feasibility of analysing archived Canadian prairie agricultural soils by near infrared reflectance spectroscopy. A.M.C. Davies and R. Giangiacomo, Near Infrared Spectroscopy, Proceedings of the 9th International Conference. NIR Publications, Chichester, UK. pp 579-585.
Martens, H. and Naes, T., 1989. Multivariate calibration. John Wiley & Sons, Chichester, UK, 419 pp.
Moron, A. and Cozzolino, D., 2002. Application of near infrared reflectance spectroscopy for the analysis of organic C, total N and pH in soils of Uruguay. Journal of near Infrared Spectroscopy, 10(3): 215-221.
Mouazen, A.M., De Baerdemaeker, J. and Ramon, H., 2005. Towards development of on-line soil moisture content sensor using a fibre-type NIR spectrophotometer. Soil & Tillage Research, 80(1-2): 171-183.
Mouazen, A.M., De Baerdemaeker, J. and Ramon, H., 2006. Effect of wavelength range on the measurement accuracy of some selected soil constituents using visual-near infrared spectroscopy. Journal of near Infrared Spectroscopy, 14(3): 189-199.
Petit, S., Madejova, J., Decarreau, A. and Martin, F., 1999. Characterization of octahedral substitutions in kaolinites using near infrared spectroscopy. Clays and Clay Minerals, 47(1): 103-108.
Savitzky, A. and Golay, M., 1964. Smoothing and differentiation of data by simplified least squares procedures. Analytical Chemistry, 36: 1627-1639.
Shepherd, K.D. and Walsh, M.G., 2007. Infrared spectroscopy - enabling an evidence-based diagnostic surveillance approach to agricultural and environmental management in developing countries. Journal of near Infrared Spectroscopy, 15(1): 1-20.
Stenberg, B., Jonsson, A. and Börjesson, T., 2002. Near infrared technology for soil analysis with implications for precision agriculture. A. Davies and R. Cho, Near Infrared Spectroscopy: Proceedings of the 10th International Conference. NIR Publications, Chichester, UK, pp. 279-284.
Stenberg, B. and Viscarra Rossel, R.A., 2009. Diffuse reflectance spectroscopy for high resolution soil sensing. R.A. Viscarra Rossel, High Resolution Digital Soil Sensing and Mapping. Developments in Soil Science. Elsevier, Sydney, Accepted.
Tsenkova, R., 2007. AquaPhotomics: water absorbance pattern as a biological marker for disease diagnosis and disease understanding. NIR news, 18(2): 14-16.
17

18
Udelhoven, T., Emmerling, C. and Jarmer, T., 2003. Quantitative analysis of soil chemical properties with diffuse reflectance spectrometry and partial least-square regression: A feasibility study. Plant and Soil, 251(2): 319-329.
Viscarra Rossel, R.A. and McBratney, A.B., 1998. Laboratory evaluation of a proximal sensing technique for simultaneous measurement of soil clay and water content. Geoderma, 85(1): 19-39.
Viscarra Rossel, R.A., Walvoort, D.J.J., McBratney, A.B., Janik, L.J. and Skjemstad, J.O., 2006. Visible, near infrared, mid infrared or combined diffuse reflectance spectroscopy for simultaneous assessment of various soil properties. Geoderma, 131(1-2): 59-75.
Wetterlind, J., Stenberg, B. and Söderström, M., 2008. The use of near infrared (NIR) spectroscopy to improve soil mapping at the farm scale. Precision Agriculture, 9(1-2): 57-69.