geochemistryofthe mafic rocks, delaware piedmont …
TRANSCRIPT
State of Delaware
DELAWARE GEOLOGICAL SURVEY
Robert R. Jordan, State Geologist
REPORT OF INVESTIGATIONS NO. 60
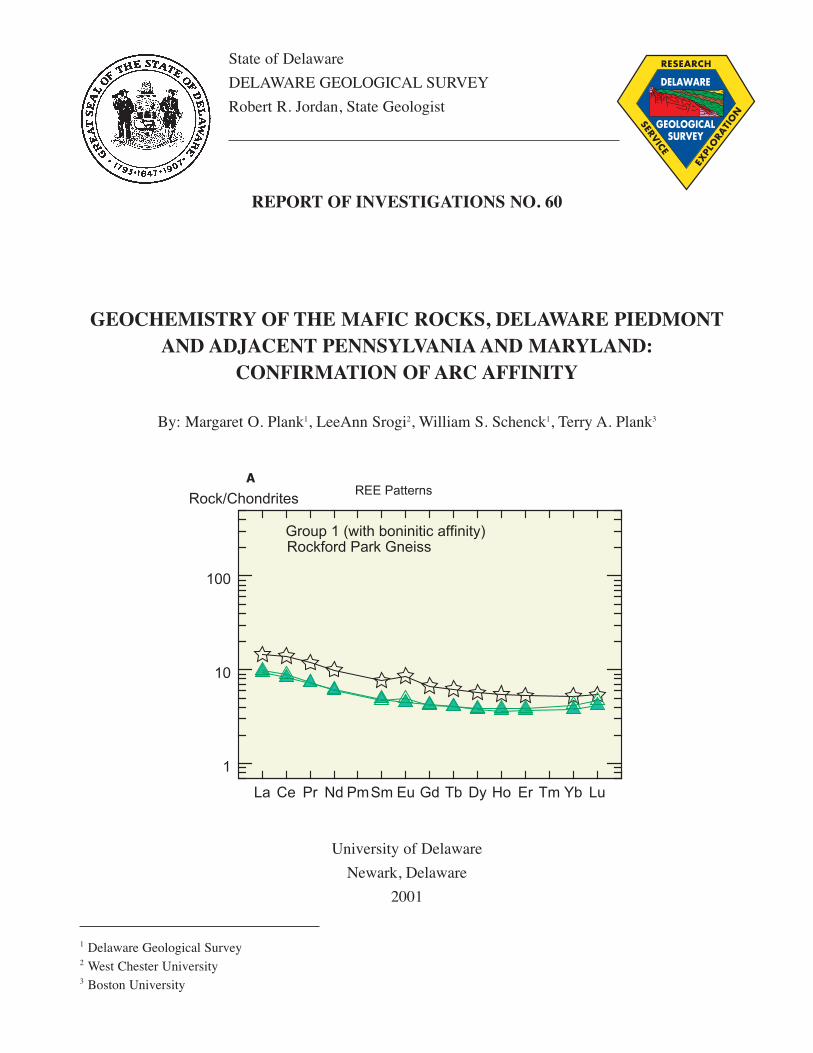
GEOCHEMISTRY OF THE MAFIC ROCKS, DELAWARE PIEDMONTAND ADJACENT PENNSYLVANIA AND MARYLAND:
CONFIRMATION OF ARC AFFINITY
By: Margaret O. Plank1, LeeAnn Srogi2, William S. Schenck1, Terry A. Plank3
University of Delaware
Newark, Delaware
2001
1 Delaware Geological Survey2 West Chester University3 Boston University
RESEARCH
DELAWARE
GEOLOGICALSURVEY
EXPL
ORA
TIO
N
SERVICE

RESEARCH
DELAWARE
GEOLOGICALSURVEY
EXPL
ORA
TIO
N
SERVICE
Delaware Geological SurveyUniversity of Delaware
Newark, Delaware 19716


INSIDE BACK COVERBLANK

State of Delaware
DELAWARE GEOLOGICAL SURVEY
Robert R. Jordan, State Geologist
REPORT OF INVESTIGATIONS NO. 60
GEOCHEMISTRY OF THE MAFIC ROCKS, DELAWARE PIEDMONTAND ADJACENT PENNSYLVANIA AND MARYLAND:
CONFIRMATION OF ARC AFFINITY
By: Margaret O. Plank1, LeeAnn Srogi2, William S. Schenck1, Terry A. Plank3
University of Delaware
Newark, Delaware
2001
1 Delaware Geological Survey2 West Chester University3 Boston University
ABSTRACT . . . . . . . . . . . . . . . . . . . . . . . . . . . . . . . . . . . . . 1
INTRODUCTION . . . . . . . . . . . . . . . . . . . . . . . . . . . . . . . . . .1Regional Geology . . . . . . . . . . . . . . . . . . . . . . . . . . . . . . 2Samples and Analytical Methods . . . . . . . . . . . . . . . . . . . 3Acknowledgments . . . . . . . . . . . . . . . . . . . . . . . . . . . . . . 9
RESULTS . . . . . . . . . . . . . . . . . . . . . . . . . . . . . . . . . . . . . . .10Wilmington Complex . . . . . . . . . . . . . . . . . . . . . . . . . . . 10
Major Element Chemistry . . . . . . . . . . . . . . . . . . . . . 10Trace Element Chemistry . . . . . . . . . . . . . . . . . . . . . 11
Groups I and II . . . . . . . . . . . . . . . . . . . . . . . . . . 12Interpretation . . . . . . . . . . . . . . . . . . . . . . . . . 14
Groups III and IV . . . . . . . . . . . . . . . . . . . . . . . . 15Interpretation . . . . . . . . . . . . . . . . . . . . . . . . . 18
Group V . . . . . . . . . . . . . . . . . . . . . . . . . . . . . . . 18Interpretation . . . . . . . . . . . . . . . . . . . . . . . . . 18
Group VI . . . . . . . . . . . . . . . . . . . . . . . . . . . . . . . 18Interpretation . . . . . . . . . . . . . . . . . . . . . . . . . 18
James Run Formation, Cecil County, Maryland . . . . . . . 18Amphibolites of the Wissahickon Formation . . . . . . . . . 19
Trace Element Chemistry . . . . . . . . . . . . . . . . . . . . . 19Interpretation . . . . . . . . . . . . . . . . . . . . . . . . . . . . 21
INTEGRATION . . . . . . . . . . . . . . . . . . . . . . . . . . . . . . . . . . .21Discrimination Diagrams . . . . . . . . . . . . . . . . . . . . . . . . 21TiO2 as Indicator of Location Within Arc . . . . . . . . . . . . 23Crustal Thickness . . . . . . . . . . . . . . . . . . . . . . . . . . . . . 24
CONCLUSIONS . . . . . . . . . . . . . . . . . . . . . . . . . . . . . . . . . . 25
REFERENCES CITED . . . . . . . . . . . . . . . . . . . . . . . . . . . . . 26
APPENDIXES . . . . . . . . . . . . . . . . . . . . . . . . . . . . . . . . . . . 29
CONTENTS
Page Page
Table Page
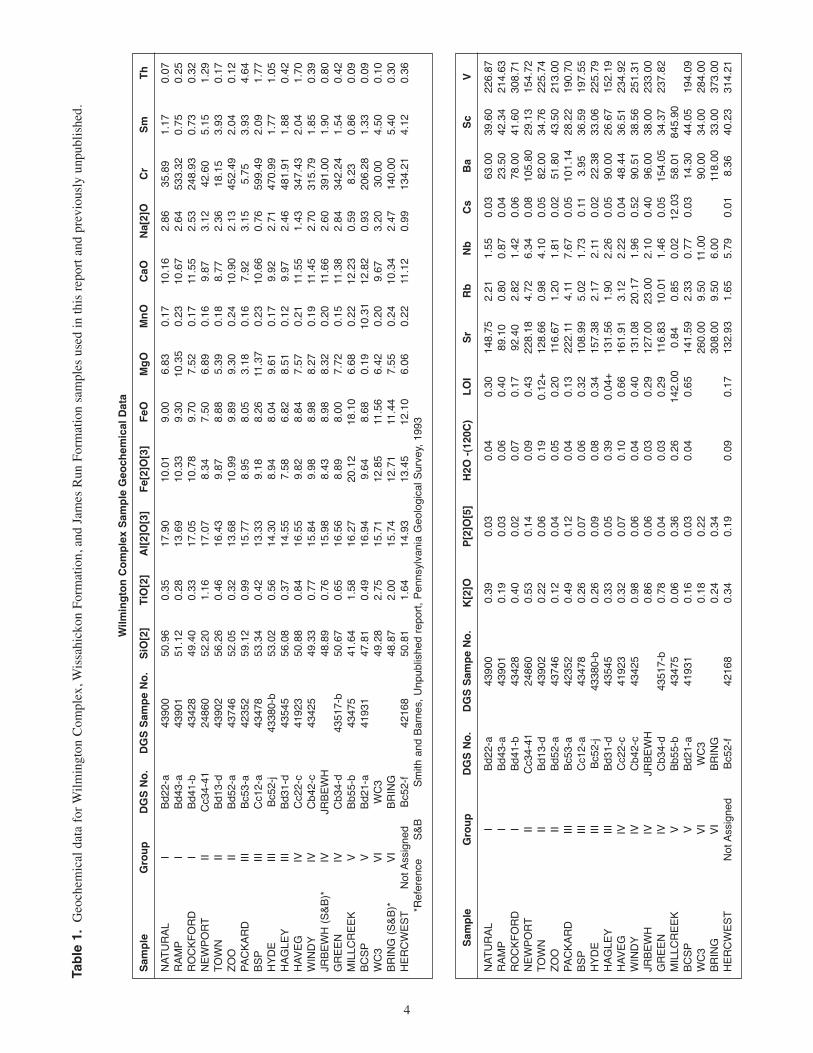
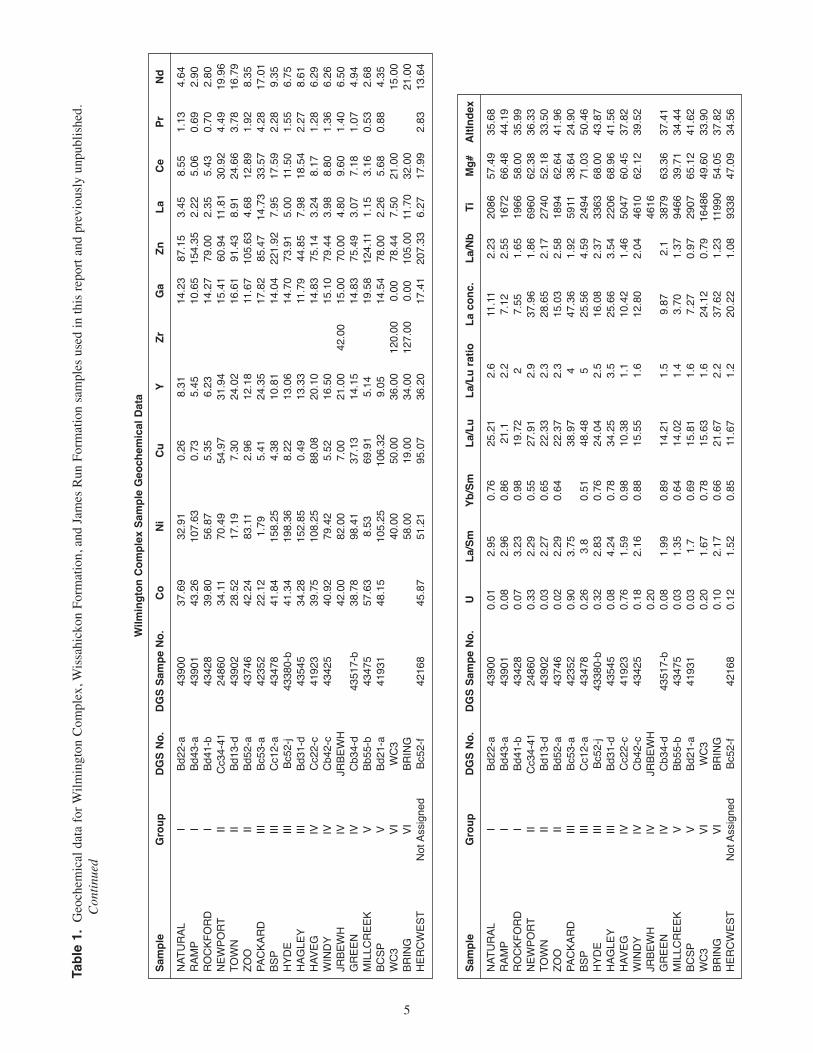
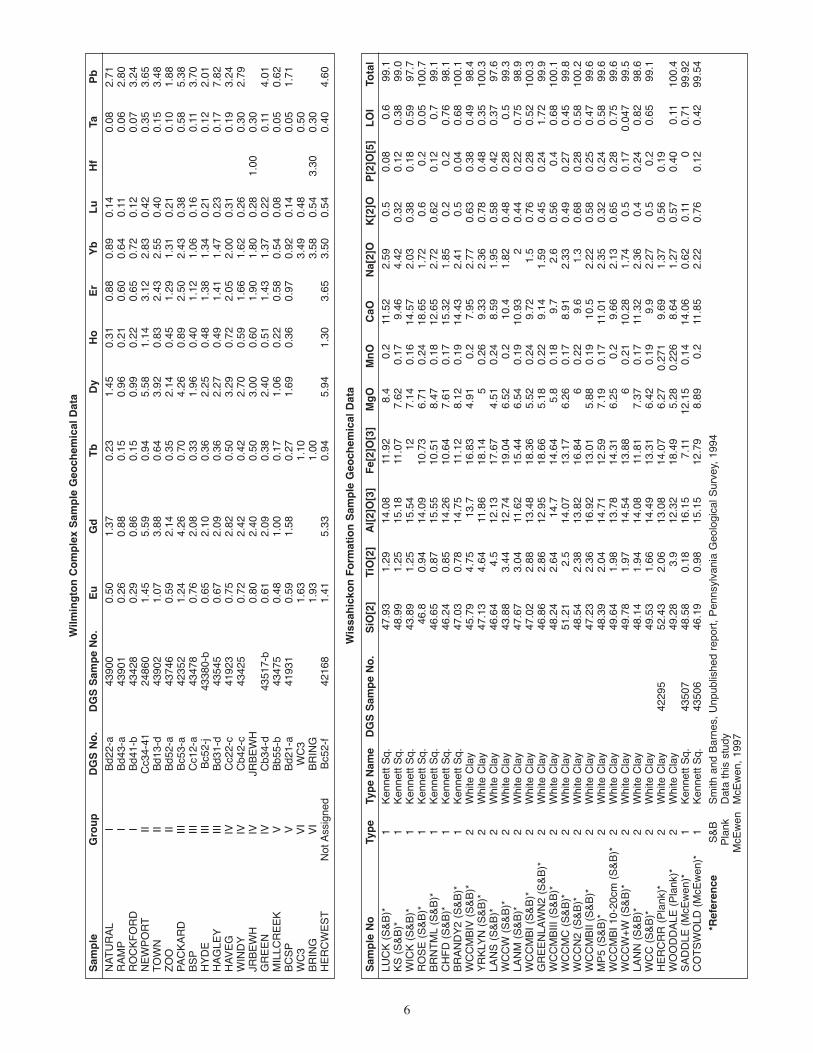
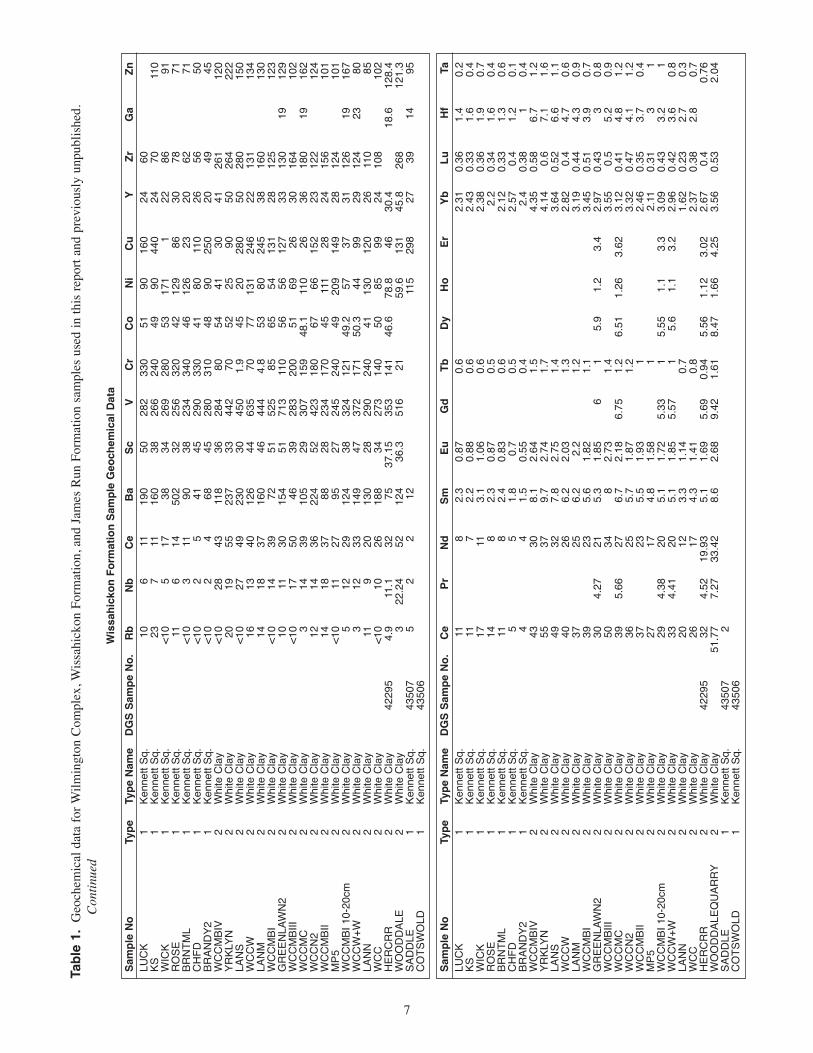
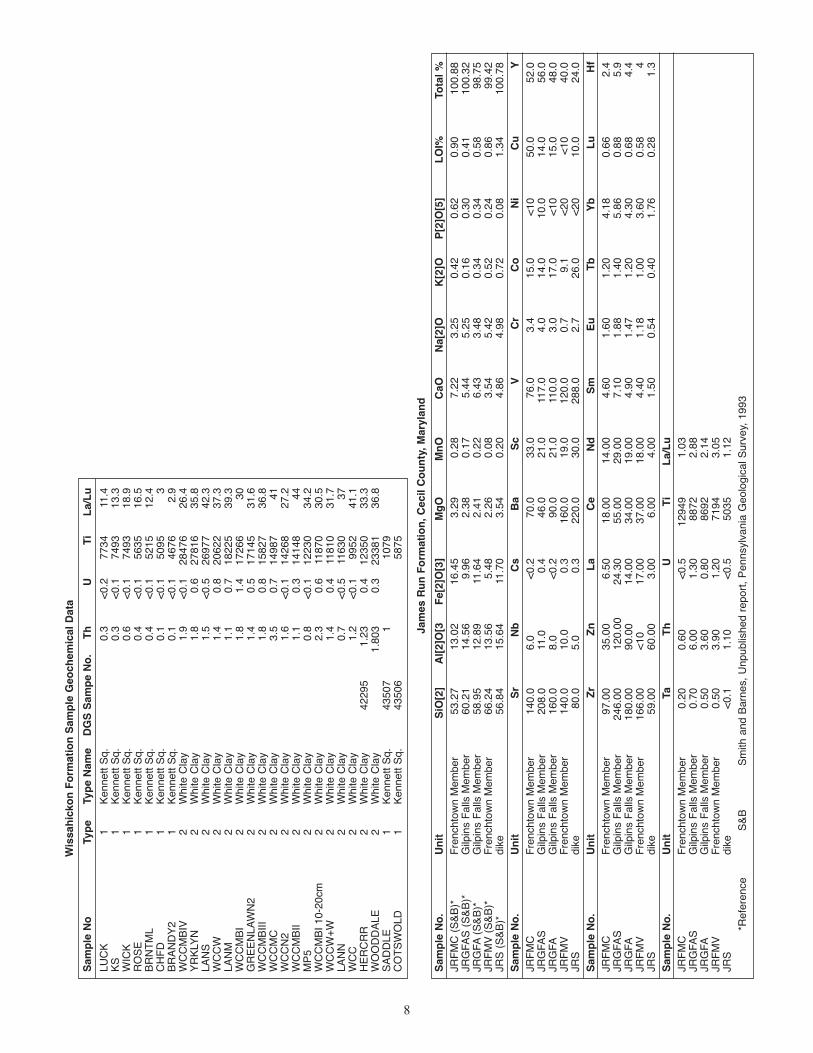
1. Geochemical data for all samples . . . . . . . . . . . . . . . . . . . . . . . . . . . . . . . . . . . . . . . . . . . . . . . . . . . . . . . . . . . . . . . . . . . . 4
2. Modal analyses of Wilmington Complex samples . . . . . . . . . . . . . . . . . . . . . . . . . . . . . . . . . . . . . . . . . . . . . . . . . . . . . . . 11
3. Ratios and abundances, Wilmington Complex and James RunFormation samples . . . . . . . . . . . . . . . . . . . . . . . . . . . . . . . . . . . . . . . . . . . . . . . . . . . . . . . . . . . . . . . . . . . . . 12
4. Estimates of crustal thickness based on parts per million (ppm)scandium . . . . . . . . . . . . . . . . . . . . . . . . . . . . . . . . . . . . . . . . . . . . . . . . . . . . . . . . . . . . . . . . . . . . . . . . . . . . . 25
TABLES

Figure Page
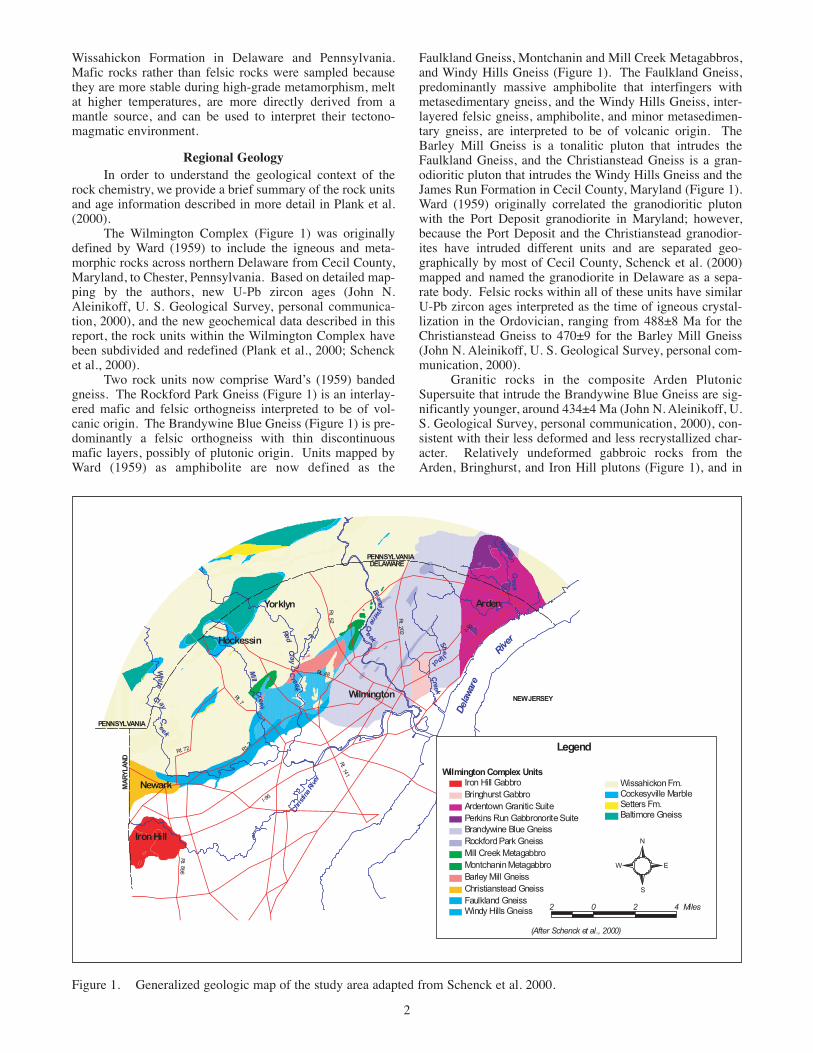
1. Generalized geologic map of the study area . . . . . . . . . . . . . . . . . . . . . . . . . . . . . . . . . . . . . . . . . . . . . . . . . . . . . . . . . . . . . 2
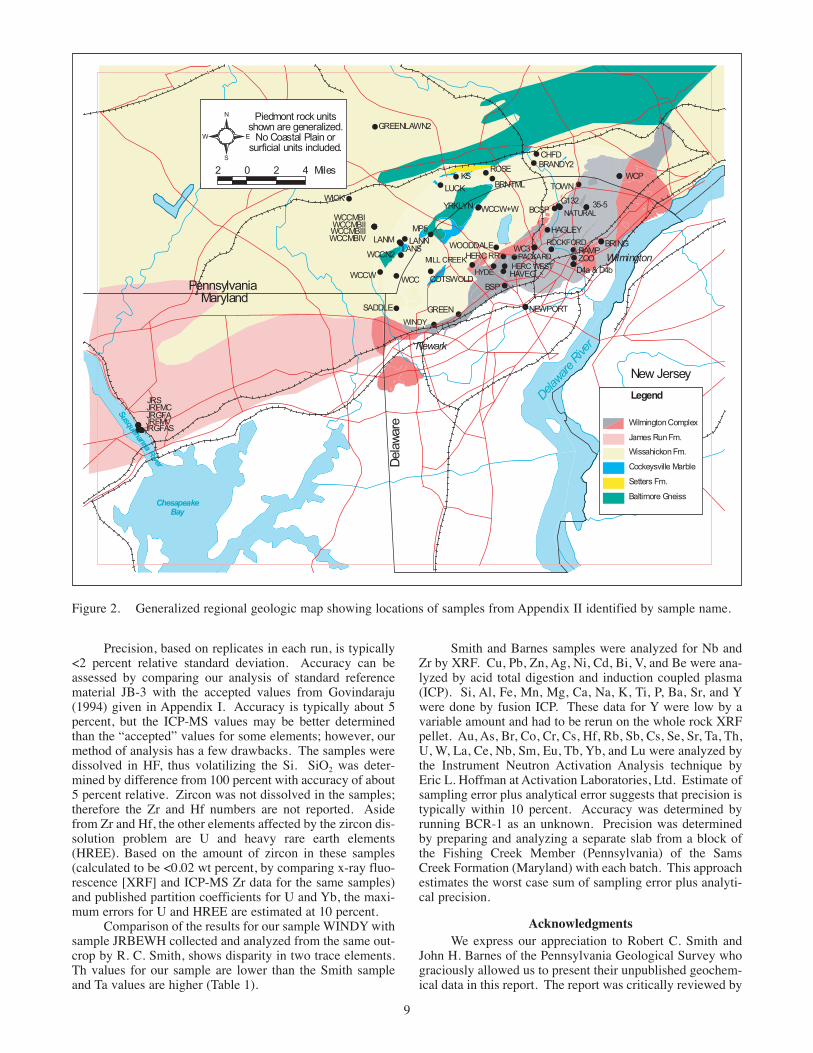
2. Generalized regional geologic map showing locations of samples . . . . . . . . . . . . . . . . . . . . . . . . . . . . . . . . . . . . . . . . . . . . 9
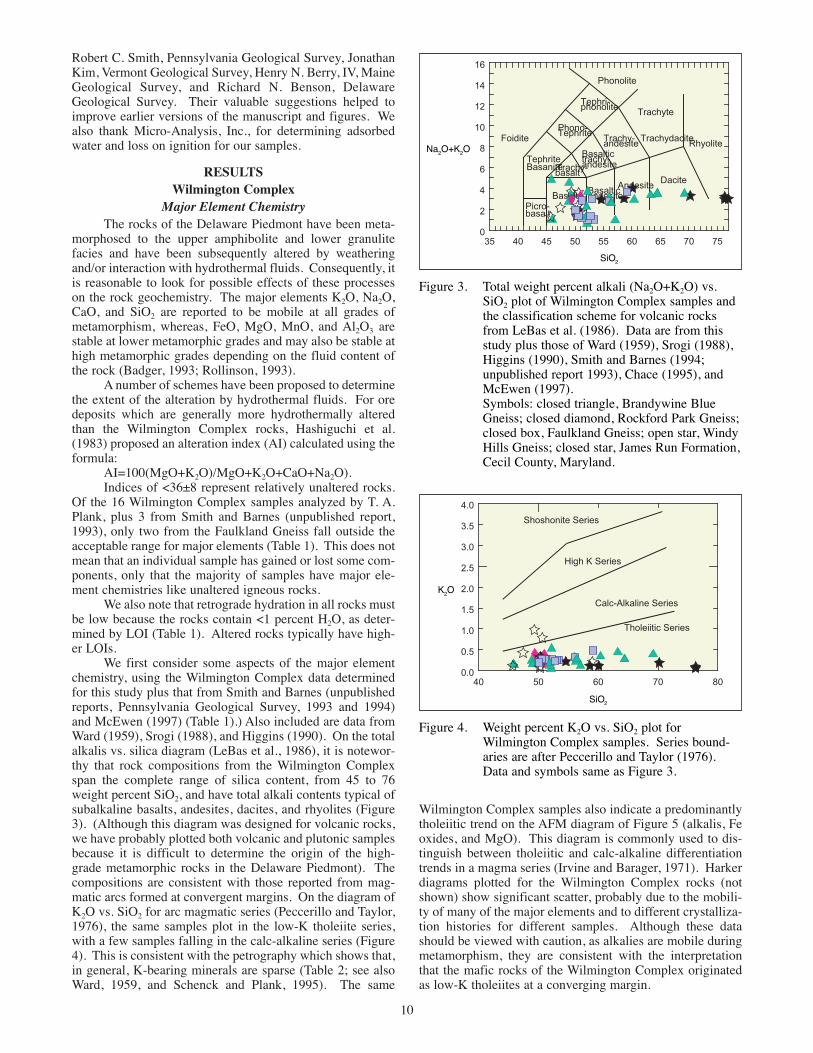
3. Total weight percent alkali vs. SiO2 plot of Wilmington Complexsamples and the classification scheme for volcanic rocks . . . . . . . . . . . . . . . . . . . . . . . . . . . . . . . . . . . . . . . . . 10
4. Weight percent K2O vs. SiO2 plot for Wilmington Complex samples . . . . . . . . . . . . . . . . . . . . . . . . . . . . . . . . . . . . . . . . . 10
5. AFM diagram illustrating tholeiitic trends in rocks of Wilmington Complex . . . . . . . . . . . . . . . . . . . . . . . . . . . . . . . . . . . 11
6. REE patterns for groups I & II Wilmington Complex samples . . . . . . . . . . . . . . . . . . . . . . . . . . . . . . . . . . . . . . . . . . . . . . 13
7. Spider diagrams for groups I & II Wilmington Complex samples . . . . . . . . . . . . . . . . . . . . . . . . . . . . . . . . . . . . . . . . . . . . 13
8. Pearce Spider diagrams for groups I & II Wilmington Complex samples . . . . . . . . . . . . . . . . . . . . . . . . . . . . . . . . . . . . . . 13
9. REE patterns for boninitic rocks from modern and ancient environmentscompared to the patterns for Wilmington Complex . . . . . . . . . . . . . . . . . . . . . . . . . . . . . . . . . . . . . . . . . . . . . . 14
10. Spider diagrams based on MORB from Eocene forearc basement samples . . . . . . . . . . . . . . . . . . . . . . . . . . . . . . . . . . . . . 15
11. REE patterns for groups III & IV Wilmington Complex samples . . . . . . . . . . . . . . . . . . . . . . . . . . . . . . . . . . . . . . . . . . . . 16
12. Spider diagrams for groups III & IV Wilmington Complex samples . . . . . . . . . . . . . . . . . . . . . . . . . . . . . . . . . . . . . . . . . . 16
13. REE patterns and spider diagram for sample HERCWEST from Faulkland Gneiss . . . . . . . . . . . . . . . . . . . . . . . . . . . . . . 16
14. REE patterns for groups V & VI Wilmington Complex samples . . . . . . . . . . . . . . . . . . . . . . . . . . . . . . . . . . . . . . . . . . . . . 17
15. Spider diagrams for groups V & VI Wilmington Complex samples . . . . . . . . . . . . . . . . . . . . . . . . . . . . . . . . . . . . . . . . . . 17
16. REE patterns for pillow lavas from the Gilpins Falls Member, JamesRun Formation compared to Windy Hills Gneiss . . . . . . . . . . . . . . . . . . . . . . . . . . . . . . . . . . . . . . . . . . . . . . . 17
17. REE patterns and spider diagram for 3 samples of James Run Formation . . . . . . . . . . . . . . . . . . . . . . . . . . . . . . . . . . . . . . 19
18. REE patterns for samples JRFMC and JRS identified as dikes in JamesRun Formation and compared to sample HERCWEST from Faulkland Gneiss . . . . . . . . . . . . . . . . . . . . . . . . . 20
19. REE diagrams for Wissahickon amphibolites . . . . . . . . . . . . . . . . . . . . . . . . . . . . . . . . . . . . . . . . . . . . . . . . . . . . . . . . . . . 20
20. Spider diagrams for Wissahickon amphibolites . . . . . . . . . . . . . . . . . . . . . . . . . . . . . . . . . . . . . . . . . . . . . . . . . . . . . . . . . 21
21. Discrimination diagrams based on Ti vs. V plots by Shervais (1982)of mafic rocks from the Wilmington Complex . . . . . . . . . . . . . . . . . . . . . . . . . . . . . . . . . . . . . . . . . . . . . . . . . 22
22. TiO2-MnO-P2O5 discrimination diagrams from Mullen (1983) plottedfor mafic rocks and amphibolites from the Wilmington Complex,James Run Formation, Cecil County, Maryland, and Wissahickon Formation amphibolites . . . . . . . . . . . . . . . 23
23. Tectonic discrimination diagram based on Zr, Ti, and Y from Pearce and Cann (1973)for type I and type II amphibolites from the Wissahickon Formation . . . . . . . . . . . . . . . . . . . . . . . . . . . . . . . . 24
24. Geochemical transect across the Cenozoic-Izu-Bonin arc system: TiO2
content vs. distance from the arc (Wallin and Metcalf, 1988)compared with the TiO2 content of rocks from the Wilmington Complex . . . . . . . . . . . . . . . . . . . . . . . . . . . . . 24
25. Correlation between Sc (6.0) and Na (6.0) and between Na (6.0) and depth to the MOHO in km . . . . . . . . . . . . . . . . . . . . 25
ILLUSTRATIONS
Appendices Page
I Data table for accuracy comparison from Govindaraju (1994) . . . . . . . . . . . . . . . . . . . . . . . . . . . . . . . . . . . . . . . . . . . . . . . . . . 29
II Sample locations and descriptions . . . . . . . . . . . . . . . . . . . . . . . . . . . . . . . . . . . . . . . . . . . . . . . . . . . . . . . . . . . . . . . . . . . . . . . 30
APPENDICES
INTRODUCTION
This report presents new geochemical data from maficrocks in the Delaware Piedmont, data from other geologistswho have worked in the area, and our detailed interpretationof the analyses. It supplements Delaware Geological SurveyReport of Investigations No. 59 and Geologic Map No.10(Plank et al., 2000; Schenck et al., 2000, respectively).
Mapping in the Delaware Piedmont confronted theproblems normally associated with mapping in highly meta-morphosed and intensely deformed rocks with complex rela-tionships in a densely populated area. Not only are rockexposures restricted to streambeds, artificial cuts, and rockcores, but it is often difficult to distinguish mafic, felsic, andpelitic gneisses in the field. During high grade metamor-phism the major elements, with the exception of Ti, are nor-mally mobile and cannot be reliably used to identify units;
GEOCHEMISTRY OF THE MAFIC ROCKS, DELAWARE PIEDMONTAND ADJACENT PENNSYLVANIA AND MARYLAND:
CONFIRMATION OF ARC AFFINITY
Margaret O. Plank1, LeeAnn Srogi2, William S. Schenck1, Terry A. Plank3
ABSTRACT
Geochemical data from Ordovician and Silurian mafic rocks in the Wilmington Complex in Delaware, the James RunFormation in Cecil County, Maryland, and the Wissahickon Formation in Delaware and Pennsylvania were collected in con-junction with preparation of a new geologic map of the Delaware-Pennsylvania Piedmont. Although concentrations of mostelements may have been disrupted by metamorphism, the more stable high field strength elements, including the rare earth ele-ments (REE), are consistent within mapped lithodemic units and are compared to modern basaltic magmas from relatively wellknown tectonomagmatic environments.
Analyzed mafic rocks of the Wilmington Complex are separated into six geochemical groups based on REE patterns andmantle-normalized spider diagrams. Group I rocks have boninitic affinities: They plot as boninites on discrimination dia-grams, have concave-upward REE patterns, overall REE depletion, and very low Ti. Group II rocks have concave-downwardREE patterns and light rare earth element (LREE) enrichments similar to arc tholeiites. Although penetrative deformation andgranulite facies metamorphism have obscured igneous fabrics and contact relationships, groups I and II can be distinguishedin the field. Group I rocks are mafic/felsic gneisses interlayered on a scale of inches, whereas group II rocks are thin discon-tinuous layers within massive felsic gneiss.
Groups III, IV, and V plus mafic samples from the James Run Formation in Cecil County are all amphibolites. SomeGroup III amphibolites contain quartz and possibly have a volcanic origin. The concave-downward REE patterns, LREEenrichment, and negative Nb and Ta anomalies suggest an arc affinity. Group IV amphibolites are thinly interlayered with fel-sic gneisses, have flat REE patterns, and negative Nb and Ta anomalies characteristic of island arc tholeiites. In the field bothGroups III and IV are also interlayered and interfingered with pelitic and psammitic gneisses and quartzites of probable sedi-mentary origin. Samples of pillow lavas from the Gilpins Falls Member of the James Run Formation in Cecil County haveflat REE patterns and negative Nb and Ta anomalies that are similar to Group IV. Group V amphibolites are gabbroic cumu-lates.
Group VI mafic rocks are apparently younger because igneous fabrics are preserved. REE patterns are similar to mid-ocean ridge basalts (MORB) or backarc basin basalts (BABB). Mingling of the mafic magmas with coeval granitic magmasand intrusion into felsic gneisses of Group II preclude an origin as MORB, and suggest these rocks are BABBs associated withlate extension within the arc.
Chemical analysis has identified two types of amphibolites in the Wissahickon Formation: type 1 Kennett Square amphi-bolite with flat REE patterns similar to ocean floor basalts, and type 2 White Clay Creek amphibolite with high Fe, moderateto high Ti, and trace element patterns that suggest within plate basalts. A marginal basin, possibly a forearc setting, is pro-posed for the Wissahickon Formation.
Our results are similar to those for other Appalachian mafic rocks and suggest a suprasubduction zone tectonic settingfor the Wilmington Complex and the James Run Formation in Cecil County, Maryland. Thus, the rocks of the WilmingtonComplex plus the James Run Formation in Cecil County may be stages in a continuum that records the temporal magmaticevolution of an arc complex.
however, trace elements are more stable, particularly theincompatible high field strength elements (HFSE), includingthe rare earth elements (REE). Thus, the trace elements inthe mafic rocks were used to geochemically group the rocksof the Wilmington Complex. By comparing the geochemicalgroups with their field and petrographic characteristics wefound a quantitative basis for identifying map units. In addi-tion, REE patterns, trace element spider diagrams, and vari-ous discrimination diagrams were used to interpret tectonicsettings.
We sampled 16 mafic rocks in the WilmingtonComplex and two in the Wissahickon Formation, and ana-lyzed them for abundances of major and trace elements. R.C. Smith and J. H. Barnes of the Pennsylvania GeologicalSurvey provided us with data from 31 samples: three fromthe Wilmington Complex, five from the James RunFormation in Cecil County, Maryland, and 23 from the
1Delaware Geological Survey
2West Chester University3Boston University
Wissahickon Formation in Delaware and Pennsylvania.Mafic rocks rather than felsic rocks were sampled becausethey are more stable during high-grade metamorphism, meltat higher temperatures, are more directly derived from amantle source, and can be used to interpret their tectono-magmatic environment.
Regional GeologyIn order to understand the geological context of the
rock chemistry, we provide a brief summary of the rock unitsand age information described in more detail in Plank et al.(2000).
The Wilmington Complex (Figure 1) was originallydefined by Ward (1959) to include the igneous and meta-morphic rocks across northern Delaware from Cecil County,Maryland, to Chester, Pennsylvania. Based on detailed map-ping by the authors, new U-Pb zircon ages (John N.Aleinikoff, U. S. Geological Survey, personal communica-tion, 2000), and the new geochemical data described in thisreport, the rock units within the Wilmington Complex havebeen subdivided and redefined (Plank et al., 2000; Schencket al., 2000).
Two rock units now comprise Ward’s (1959) bandedgneiss. The Rockford Park Gneiss (Figure 1) is an interlay-ered mafic and felsic orthogneiss interpreted to be of vol-canic origin. The Brandywine Blue Gneiss (Figure 1) is pre-dominantly a felsic orthogneiss with thin discontinuousmafic layers, possibly of plutonic origin. Units mapped byWard (1959) as amphibolite are now defined as the
2
Faulkland Gneiss, Montchanin and Mill Creek Metagabbros,and Windy Hills Gneiss (Figure 1). The Faulkland Gneiss,predominantly massive amphibolite that interfingers withmetasedimentary gneiss, and the Windy Hills Gneiss, inter-layered felsic gneiss, amphibolite, and minor metasedimen-tary gneiss, are interpreted to be of volcanic origin. TheBarley Mill Gneiss is a tonalitic pluton that intrudes theFaulkland Gneiss, and the Christianstead Gneiss is a gran-odioritic pluton that intrudes the Windy Hills Gneiss and theJames Run Formation in Cecil County, Maryland (Figure 1).Ward (1959) originally correlated the granodioritic plutonwith the Port Deposit granodiorite in Maryland; however,because the Port Deposit and the Christianstead granodior-ites have intruded different units and are separated geo-graphically by most of Cecil County, Schenck et al. (2000)mapped and named the granodiorite in Delaware as a sepa-rate body. Felsic rocks within all of these units have similarU-Pb zircon ages interpreted as the time of igneous crystal-lization in the Ordovician, ranging from 488±8 Ma for theChristianstead Gneiss to 470±9 for the Barley Mill Gneiss(John N. Aleinikoff, U. S. Geological Survey, personal com-munication, 2000).
Granitic rocks in the composite Arden PlutonicSupersuite that intrude the Brandywine Blue Gneiss are sig-nificantly younger, around 434±4 Ma (John N. Aleinikoff, U.S. Geological Survey, personal communication, 2000), con-sistent with their less deformed and less recrystallized char-acter. Relatively undeformed gabbroic rocks from theArden, Bringhurst, and Iron Hill plutons (Figure 1), and in
Figure 1. Generalized geologic map of the study area adapted from Schenck et al. 2000.
3
numerous stocks and dikes too small to map, are presumed tobe of similar age. The igneous crystallization age of theArden granitic rocks is essentially identical to the age of zir-cons grown during partial melting accompanying granulitefacies metamorphism of the Rockford Park and BrandywineBlue Gneiss, dated at 432±6 and 428±8 Ma, respectively(John N. Aleinikoff, U. S. Geological Survey, personal com-munication, 2000). This suggests that magmatism accompa-nied regional-scale metamorphism of the WilmingtonComplex in the Silurian, albeit with waning deformation.Following Ward (1959), Woodruff and Thompson (1972,1975), and subsequent workers, we include the Silurian plu-tonic rocks with the Ordovician units in the WilmingtonComplex.
The Wissahickon Formation, first named and studiedby Bascom (1902) and Bascom and Stose (1932), is anextensive sequence of pelitic and psammitic gneiss interlay-ered with amphibolite that borders the Wilmington Complexto the west, north, and east (Figure 1). For a detailed sum-mary of the history of the Wissahickon Formation inMaryland and Delaware see Schenck (1997). The relation-ship between the Wilmington Complex and the WissahickonFormation has been controversial; our new data demonstratethat these units shared a common history at least during theOrdovician and Silurian. Metavolcanic rocks of theFaulkland and Windy Hills Gneiss (482±4 and 481±4 Ma,respectively; John N. Aleinikoff, U. S. Geological Survey,personal communication, 2000) are interlayered and interfin-gered with metasedimentary rocks of the WissahickonFormation. Plutonic rocks of the Brandywine Blue Gneissand the Barley Mill Gneiss (476±6 and 470±9 Ma, respec-tively, John N. Aleinikoff, U. S. Geological Survey, personalcommunication, 2000) contain xenoliths of pelitic gneiss thatwere most likely derived from the Wissahickon Formation.In Pennsylvania north of the map area of Figure 1, a maficdike essentially identical in composition to the mafic layersof the Rockford Park Gneiss crosscuts an outcrop of both theWissahickon Formation and Brandywine Blue Gneiss(Bosbyshell et al., 1999). The Silurian Arden pluton intrudesboth the Brandywine Blue Gneiss and the WissahickonFormation (Figure 1). Metamorphic grade in the Wissa-hickon Formation decreases with distance from theWilmington Complex, suggesting its metamorphism iscoeval with the granulite facies metamorphism in theWilmington Complex. On the basis of these field relation-ships, we conclude that the emplacement of the WissahickonFormation is either coeval with or older than the WilmingtonComplex.
Many workers have suggested correlations betweenthe Wilmington Complex and the James Run Formation inMaryland. Southwick and Fisher (1967) originally definedthe James Run Gneiss as the interlayered quartz amphiboliteand biotite-quartz plagioclase gneiss exposed along JamesRun in Harford County, Maryland. Subsequently, Higgins(1971, 1972) formally defined the James Run Formation toinclude all the metavolcanic and metavolcaniclastic rocksthat crop out in the northeastern Maryland Piedmont, and heconsidered the layered rocks of the Wilmington Complex tobe correlative with the James Run Formation. Portions ofWard’s (1959) Wilmington Complex amphibolite units wereplaced in the James Run Formation by Pickett (1976), Hager(1976), and Thompson (1979). Higgins (1990) traced theBig Elk Member of the James Run Formation for over onehalf mile into Delaware. However, the U-Pb zircon ages of
the Windy Hills Gneiss and Faulkland Gneiss (481±4 and482±4) are significantly older than the ages for the type sec-tion of the James Run Formation in Baltimore, Maryland(454±5 to 464±5, Horton et al., 1998). Further, theChristianstead Gneiss obscures the relationships between theWindy Hills Gneiss in Delaware and the Big Elk Member inMaryland (Figure 1). Schenck et al. (2000), therefore,assigned the Christianstead, Windy Hills, and Faulklandgneisses to the Wilmington Complex. In this report, we com-pare the geochemistry of mafic units mapped as James RunFormation in Cecil County, Maryland, with units in theWilmington Complex to evaluate a possible correlation.
Samples and Analytical MethodsOf the 16 mafic samples collected from the
Wilmington Complex, 8 are from the unit shown on oldergeologic maps of the Delaware Piedmont as the bandedgneiss and 8 are from the unit described as amphibolite(Ward, 1959; Woodruff and Thompson, 1972, 1975). Withinthe granulite-grade banded gneiss we sampled the maficgneiss interlayered on a centimeter scale with felsic gneiss,the very thin bands of mafic rocks in the massive felsicgneiss, and the massive coarse-grained amphibolite thatoccurs along the contact between the banded gneiss and theamphibolite.
Data from R. C. Smith and J. H. Barnes were receivedfrom personal communication and from a series of unpub-lished reports entitled “Wilmington Complex metabasalts,Pennsylvania and Delaware 1993;” “James Run FormationMetabasalts, Cecil County, Maryland, 1993;” “White ClayCreek Amphibolites, Pennsylvania and Delaware, 1994 and2001;” and “Kennett Square Amphibolites, Pennsylvania andDelaware, 1994.” Smith and Barnes (1994) published someof these data in a field guide.
The geochemical data for all samples are listed inTable 1. An electronic version of the data in Table 1 is avail-able in the DGS Data Repository1. Sample locations areshown on a generalized regional geologic map (Figure 2) andare described in Appendix II.
The choice of samples for this study was partly con-trolled by availability of fresh samples. Rock cores and rocksblasted during construction and were preferred over weath-ered samples from natural exposures. After collection, thesamples were trimmed of weathered material, crushed,ground, and pulverized. To minimize contamination, thesamples were powdered in a ceramic mortar and pestle. Thepowders were analyzed by T. A. Plank at the University ofKansas Plasma Analytical Laboratory for whole-rock majorelements and selected trace elements. All trace elementswere determined by Inductively Coupled Plasma-MassSpectrometry (ICP-MS) following HF:HNO3 digestions.The analyses were calibrated using standard reference mate-rials W2, and in-house mid-ocean ridge basalt (MORB)(MAR) and Kilauea (K1919) standards digested using thesame procedure. Major elements were determined on thesame solutions using an Inductively Coupled Plasma-AtomicEmission Spectrometer. Further analytical details may befound in Johnson and Plank (1999). Adsorbed water and losson ignition (LOI) were determined gravimetically by Micro-Analysis, Inc., Wilmington, Delaware, following heating to120˚C overnight and 900˚C for 30 minutes respectively.
1Geochemistry data are in the form of an Excel spreadsheet called RI60 and are acces-sible through the DGS Data Repository located under Publications on the DGS web siteat http://www.udel.edu/dgs.
4
Tab
le 1
.G
eoch
emic
al d
ata
for
Wilm
ingt
on C
ompl
ex, W
issa
hick
on F
orm
atio
n, a
nd J
ames
Run
For
mat
ion
sam
ples
use
d in
this
rep
ort a
nd p
revi
ousl
y un
publ
ishe
d.
Wilm
ing
ton
Co
mp
lex
Sam
ple
Geo
chem
ical
Dat
a
Sam
ple
Gro
up
DG
S N
o.
DG
S S
amp
e N
o.
SiO
[2]
TiO
[2]
Al[
2]O
[3]
Fe[
2]O
[3]
FeO
Mg
OM
nO
CaO
Na[
2]O
Cr
Sm
Th
NA
TU
RA
LI
Bd2
2-a
4390
050
.96
0.35
17.9
010
.01
9.00
6.83
0.17
10.1
62.
8635
.89
1.17
0.07
RA
MP
IB
d43-
a43
901
51.1
20.
2813
.69
10.3
39.
3010
.35
0.23
10.6
72.
6453
3.32
0.75
0.25
RO
CK
FO
RD
IB
d41-
b43
428
49.4
00.
3317
.05
10.7
89.
707.
520.
1711
.55
2.53
248.
930.
730.
32N
EW
PO
RT
IIC
c34-
4124
860
52.2
01.
1617
.07
8.34
7.50
6.89
0.16
9.87
3.12
42.6
05.
151.
29T
OW
NII
Bd1
3-d
4390
256
.26
0.46
16.4
39.
878.
885.
390.
188.
772.
3618
.15
3.93
0.17
ZO
OII
Bd5
2-a
4374
652
.05
0.32
13.6
810
.99
9.89
9.30
0.24
10.9
02.
1345
2.49
2.04
0.12
PA
CK
AR
DIII
Bc5
3-a
4235
259
.12
0.99
15.7
78.
958.
053.
180.
167.
923.
155.
753.
934.
64B
SP
IIIC
c12-
a43
478
53.3
40.
4213
.33
9.18
8.26
11.3
70.
2310
.66
0.76
599.
492.
091.
77H
YD
EIII
Bc5
2-j
4338
0-b
53.0
20.
5614
.30
8.94
8.04
9.61
0.17
9.92
2.71
470.
991.
771.
05H
AG
LEY
IIIB
d31-
d43
545
56.0
80.
3714
.55
7.58
6.82
8.51
0.12
9.97
2.46
481.
911.
880.
42H
AV
EG
IVC
c22-
c41
923
50.8
80.
8416
.55
9.82
8.84
7.57
0.21
11.5
51.
4334
7.43
2.04
1.70
WIN
DY
IVC
b42-
c43
425
49.3
30.
7715
.84
9.98
8.98
8.27
0.19
11.4
52.
7031
5.79
1.85
0.39
JRB
EW
H (
S&
B)*
IVJR
BE
WH
48.8
90.
7615
.98
8.43
8.98
8.32
0.20
11.6
62.
6039
1.00
1.90
0.80
GR
EE
NIV
Cb3
4-d
4351
7-b
50.6
70.
6516
.56
8.89
8.00
7.72
0.15
11.3
82.
8434
2.24
1.54
0.42
MIL
LCR
EE
KV
Bb5
5-b
4347
541
.64
1.58
16.2
720
.12
18.1
06.
680.
2212
.23
0.59
8.23
0.86
0.09
BC
SP
VB
d21-
a41
931
47.8
10.
4916
.94
9.64
8.68
0.19
10.3
112
.82
0.93
206.
281.
330.
09W
C3
VI
WC
349
.28
2.75
15.7
112
.85
11.5
66.
420.
209.
673.
2030
.00
4.50
0.10
BR
ING
(S
&B
)*V
IB
RIN
G48
.87
2.00
15.7
412
.71
11.4
47.
550.
2410
.34
2.47
140.
005.
400.
30H
ER
CW
ES
TN
ot A
ssig
ned
Bc5
2-f
4216
850
.81
1.64
14.9
313
.45
12.1
06.
060.
2211
.12
0.99
134.
214.
120.
36*R
efer
ence
S&
BS
mith
and
Bar
nes,
Unp
ublis
hed
repo
rt,
Pen
nsyl
vani
a G
eolo
gica
l Sur
vey,
199
3
Sam
ple
Gro
up
DG
S N
o.
DG
S S
amp
e N
o.
K[2
]OP
[2]O
[5]
H2O
-(1
20C
)L
OI
Sr
Rb
Nb
Cs
Ba
Sc
V
NA
TU
RA
LI
Bd2
2-a
4390
00.
390.
030.
040.
3014
8.75
2.21
1.55
0.03
63.0
039
.60
226.
87R
AM
PI
Bd4
3-a
4390
10.
190.
030.
060.
4089
.10
0.80
0.87
0.04
23.5
042
.34
214.
63R
OC
KF
OR
DI
Bd4
1-b
4342
80.
400.
020.
070.
1792
.40
2.82
1.42
0.06
78.0
041
.60
308.
71N
EW
PO
RT
IIC
c34-
4124
860
0.53
0.14
0.09
0.43
228.
184.
726.
340.
0810
5.80
29.1
315
4.72
TO
WN
IIB
d13-
d43
902
0.22
0.06
0.19
0.12
+12
8.66
0.98
4.10
0.05
82.0
034
.76
225.
74Z
OO
IIB
d52-
a43
746
0.12
0.04
0.05
0.20
116.
671.
201.
810.
0251
.80
43.5
021
3.00
PA
CK
AR
DIII
Bc5
3-a
4235
20.
490.
120.
040.
1322
2.11
4.11
7.67
0.05
101.
1428
.22
190.
70B
SP
IIIC
c12-
a43
478
0.26
0.07
0.06
0.32
108.
995.
021.
730.
113.
9536
.59
197.
55H
YD
EIII
Bc5
2-j
4338
0-b
0.26
0.09
0.08
0.34
157.
382.
172.
110.
0222
.38
33.0
622
5.79
HA
GLE
YIII
Bd3
1-d
4354
50.
330.
050.
390.
04+
131.
561.
902.
260.
0590
.00
26.6
715
2.19
HA
VE
GIV
Cc2
2-c
4192
30.
320.
070.
100.
6616
1.91
3.12
2.22
0.04
48.4
436
.51
234.
92W
IND
YIV
Cb4
2-c
4342
50.
980.
060.
040.
4013
1.08
20.1
71.
960.
5290
.51
38.5
625
1.31
JRB
EW
HIV
JRB
EW
H0.
860.
060.
030.
2912
7.00
23.0
02.
100.
4096
.00
38.0
023
3.00
GR
EE
NIV
Cb3
4-d
4351
7-b
0.78
0.04
0.03
0.29
116.
8310
.01
1.46
0.05
154.
0534
.37
237.
82M
ILLC
RE
EK
VB
b55-
b43
475
0.06
0.36
0.26
142.
000.
840.
850.
0212
.03
58.0
184
5.90
BC
SP
VB
d21-
a41
931
0.16
0.03
0.04
0.65
141.
592.
330.
770.
0314
.30
44.0
519
4.09
WC
3V
IW
C3
0.18
0.22
260.
009.
5011
.00
90.0
034
.00
284.
00B
RIN
GV
IB
RIN
G0.
240.
3430
8.00
9.50
6.00
118.
0033
.00
373.
00H
ER
CW
ES
TN
ot A
ssig
ned
Bc5
2-f
4216
80.
340.
190.
090.
1713
2.93
1.65
5.79
0.01
8.36
40.2
331
4.21
5
Tab
le 1
.G
eoch
emic
al d
ata
for
Wilm
ingt
on C
ompl
ex, W
issa
hick
on F
orm
atio
n, a
nd J
ames
Run
For
mat
ion
sam
ples
use
d in
this
rep
ort a
nd p
revi
ousl
y un
publ
ishe
d.C
onti
nued
Wilm
ing
ton
Co
mp
lex
Sam
ple
Geo
chem
ical
Dat
a
Sam
ple
Gro
up
DG
S N
o.
DG
S S
amp
e N
o.
Co
Ni
Cu
YZ
rG
aZ
nL
aC
eP
rN
d
NA
TU
RA
LI
Bd2
2-a
4390
037
.69
32.9
10.
268.
3114
.23
87.1
53.
458.
551.
134.
64R
AM
PI
Bd4
3-a
4390
143
.26
107.
630.
735.
4510
.65
154.
352.
225.
060.
692.
90R
OC
KF
OR
DI
Bd4
1-b
4342
839
.80
56.8
75.
356.
2314
.27
79.0
02.
355.
430.
702.
80N
EW
PO
RT
IIC
c34-
4124
860
34.1
170
.49
54.9
731
.94
15.4
160
.94
11.8
130
.92
4.49
19.9
6T
OW
NII
Bd1
3-d
4390
228
.52
17.1
97.
3024
.02
16.6
191
.43
8.91
24.6
63.
7816
.79
ZO
OII
Bd5
2-a
4374
642
.24
83.1
12.
9612
.18
11.6
710
5.63
4.68
12.8
91.
928.
35P
AC
KA
RD
IIIB
c53-
a42
352
22.1
21.
795.
4124
.35
17.8
285
.47
14.7
333
.57
4.28
17.0
1B
SP
IIIC
c12-
a43
478
41.8
415
8.25
4.38
10.8
114
.04
221.
927.
9517
.59
2.28
9.35
HY
DE
IIIB
c52-
j43
380-
b41
.34
198.
368.
2213
.06
14.7
073
.91
5.00
11.5
01.
556.
75H
AG
LEY
IIIB
d31-
d43
545
34.2
815
2.85
0.49
13.3
311
.79
44.8
57.
9818
.54
2.27
8.61
HA
VE
GIV
Cc2
2-c
4192
339
.75
108.
2588
.08
20.1
014
.83
75.1
43.
248.
171.
286.
29W
IND
YIV
Cb4
2-c
4342
540
.92
79.4
25.
5216
.50
15.1
079
.44
3.98
8.80
1.36
6.26
JRB
EW
HIV
JRB
EW
H42
.00
82.0
07.
0021
.00
42.0
015
.00
70.0
04.
809.
601.
406.
50G
RE
EN
IVC
b34-
d43
517-
b38
.78
98.4
137
.13
14.1
514
.83
75.4
93.
077.
181.
074.
94M
ILLC
RE
EK
VB
b55-
b43
475
57.6
38.
5369
.91
5.14
19.5
812
4.11
1.15
3.16
0.53
2.68
BC
SP
VB
d21-
a41
931
48.1
510
5.25
106.
329.
0514
.54
78.0
02.
265.
680.
884.
35W
C3
VI
WC
340
.00
50.0
036
.00
120.
000.
0078
.44
7.50
21.0
015
.00
BR
ING
VI
BR
ING
58.0
019
.00
34.0
012
7.00
0.00
105.
0011
.70
32.0
021
.00
HE
RC
WE
ST
Not
Ass
igne
dB
c52-
f42
168
45.8
751
.21
95.0
736
.20
17.4
120
7.33
6.27
17.9
92.
8313
.64
Sam
ple
Gro
up
DG
S N
o.
DG
S S
amp
e N
o.
UL
a/S
mY
b/S
mL
a/L
uL
a/L
u r
atio
La
con
c.
La/
Nb
TiM
g#
Alt
Ind
ex
NA
TU
RA
LI
Bd2
2-a
4390
00.
012.
950.
7625
.21
2.6
11.1
12.
2320
8657
.49
35.6
8R
AM
PI
Bd4
3-a
4390
10.
082.
960.
8621
.12.
27.
122.
5516
7266
.48
44.1
9R
OC
KF
OR
DI
Bd4
1-b
4342
80.
073.
230.
9819
.72
27.
551.
6519
6658
.00
35.9
9N
EW
PO
RT
IIC
c34-
4124
860
0.33
2.29
0.55
27.9
12.
937
.96
1.86
6960
62.3
836
.33
TO
WN
IIB
d13-
d43
902
0.03
2.27
0.65
22.3
32.
328
.65
2.17
2740
52.1
833
.50
ZO
OII
Bd5
2-a
4374
60.
022.
290.
6422
.37
2.3
15.0
32.
5818
9462
.64
41.9
6P
AC
KA
RD
IIIB
c53-
a42
352
0.90
3.75
38.9
74
47.3
61.
9259
1138
.64
24.9
0B
SP
IIIC
c12-
a43
478
0.26
3.8
0.51
48.4
85
25.5
64.
5924
9471
.03
50.4
6H
YD
EIII
Bc5
2-j
4338
0-b
0.32
2.83
0.76
24.0
42.
516
.08
2.37
3363
68.0
043
.87
HA
GLE
YIII
Bd3
1-d
4354
50.
084.
240.
7834
.25
3.5
25.6
63.
5422
0668
.96
41.5
6H
AV
EG
IVC
c22-
c41
923
0.76
1.59
0.98
10.3
81.
110
.42
1.46
5047
60.4
537
.82
WIN
DY
IVC
b42-
c43
425
0.18
2.16
0.88
15.5
51.
612
.80
2.04
4610
62.1
239
.52
JRB
EW
HIV
JRB
EW
H0.
2046
16G
RE
EN
IVC
b34-
d43
517-
b0.
081.
990.
8914
.21
1.5
9.87
2.1
3879
63.3
637
.41
MIL
LCR
EE
KV
Bb5
5-b
4347
50.
031.
350.
6414
.02
1.4
3.70
1.37
9466
39.7
134
.44
BC
SP
VB
d21-
a41
931
0.03
1.7
0.69
15.8
11.
67.
270.
9729
0765
.12
41.6
2W
C3
VI
WC
30.
201.
670.
7815
.63
1.6
24.1
20.
7916
486
49.6
033
.90
BR
ING
VI
BR
ING
0.10
2.17
0.66
21.6
72.
237
.62
1.23
1199
054
.05
37.8
2H
ER
CW
ES
TN
ot A
ssig
ned
Bc5
2-f
4216
80.
121.
520.
8511
.67
1.2
20.2
21.
0893
3847
.09
34.5
6
6
Wilm
ing
ton
Co
mp
lex
Sam
ple
Geo
chem
ical
Dat
a
Sam
ple
Gro
up
DG
S N
o.
DG
S S
amp
e N
o.
Eu
Gd
Tb
Dy
Ho
Er
Yb
Lu
Hf
TaP
b
NA
TU
RA
LI
Bd2
2-a
4390
00.
501.
370.
231.
450.
310.
880.
890.
140.
082.
71R
AM
PI
Bd4
3-a
4390
10.
260.
880.
150.
960.
210.
600.
640.
110.
062.
80R
OC
KF
OR
DI
Bd4
1-b
4342
80.
290.
860.
150.
990.
220.
650.
720.
120.
073.
24N
EW
PO
RT
IIC
c34-
4124
860
1.45
5.59
0.94
5.58
1.14
3.12
2.83
0.42
0.35
3.65
TO
WN
IIB
d13-
d43
902
1.07
3.88
0.64
3.92
0.83
2.43
2.55
0.40
0.15
3.48
ZO
OII
Bd5
2-a
4374
60.
592.
140.
352.
140.
451.
291.
310.
210.
101.
88P
AC
KA
RD
IIIB
c53-
a42
352
1.24
4.26
0.70
4.26
0.89
2.50
2.43
0.38
0.58
5.38
BS
PIII
Cc1
2-a
4347
80.
762.
080.
331.
960.
401.
121.
060.
160.
113.
70H
YD
EIII
Bc5
2-j
4338
0-b
0.65
2.10
0.36
2.25
0.48
1.38
1.34
0.21
0.12
2.01
HA
GLE
YIII
Bd3
1-d
4354
50.
672.
090.
362.
270.
491.
411.
470.
230.
177.
82H
AV
EG
IVC
c22-
c41
923
0.75
2.82
0.50
3.29
0.72
2.05
2.00
0.31
0.19
3.24
WIN
DY
IVC
b42-
c43
425
0.72
2.42
0.42
2.70
0.59
1.66
1.62
0.26
0.30
2.79
JRB
EW
HIV
JRB
EW
H0.
802.
400.
503.
000.
601.
901.
800.
281.
000.
30G
RE
EN
IVC
b34-
d43
517-
b0.
612.
090.
382.
400.
511.
431.
370.
220.
114.
01M
ILLC
RE
EK
VB
b55-
b43
475
0.48
1.00
0.17
1.06
0.22
0.58
0.54
0.08
0.05
0.62
BC
SP
VB
d21-
a41
931
0.59
1.58
0.27
1.69
0.36
0.97
0.92
0.14
0.05
1.71
WC
3V
IW
C3
1.63
1.10
3.49
0.48
0.50
BR
ING
VI
BR
ING
1.93
1.00
3.58
0.54
3.30
0.30
HE
RC
WE
ST
Not
Ass
igne
dB
c52-
f42
168
1.41
5.33
0.94
5.94
1.30
3.65
3.50
0.54
0.40
4.60
Wis
sah
icko
n F
orm
atio
n S
amp
le G
eoch
emic
al D
ata
Sam
ple
No
Typ
eTy
pe
Nam
eD
GS
Sam
pe
No
.S
iO[2
]Ti
O[2
]A
l[2]
O[3
]F
e[2]
O[3
]M
gO
Mn
OC
aON
a[2]
OK
[2]O
P[2
]O[5
]L
OI
Tota
l
LUC
K (
S&
B)*
1K
enne
tt S
q.47
.93
1.29
14.0
811
.92
8.4
0.2
11.5
22.
590.
50.
080.
699
.1K
S (
S&
B)*
1K
enne
tt S
q.48
.99
1.25
15.1
811
.07
7.62
0.17
9.46
4.42
0.32
0.12
0.38
99.0
WIC
K (
S&
B)*
1K
enne
tt S
q.43
.89
1.25
15.5
412
7.14
0.16
14.5
72.
030.
380.
180.
5997
.7R
OS
E (
S&
B)*
1K
enne
tt S
q.46
.80.
9414
.09
10.7
36.
710.
2418
.65
1.72
0.6
0.2
0.05
100.
7B
RN
TM
L(S
&B
)*1
Ken
nett
Sq.
46.6
50.
8715
.55
10.5
18.
470.
1812
.65
2.72
0.62
0.12
0.7
99.1
CH
FD
(S
&B
)*1
Ken
nett
Sq.
46.2
40.
8514
.26
10.6
47.
610.
1715
.32
1.85
0.2
0.2
0.76
98.1
BR
AN
DY
2 (S
&B
)*1
Ken
nett
Sq.
47.0
30.
7814
.75
11.1
28.
120.
1914
.43
2.41
0.5
0.04
0.68
100.
1W
CC
MB
IV (
S&
B)*
2W
hite
Cla
y45
.79
4.75
13.7
16.8
34.
910.
27.
952.
770.
630.
380.
4998
.4Y
RK
LYN
(S
&B
)*2
Whi
te C
lay
47.1
34.
6411
.86
18.1
45
0.26
9.33
2.36
0.78
0.48
0.35
100.
3LA
NS
(S
&B
)*2
Whi
te C
lay
46.6
44.
512
.13
17.6
74.
510.
248.
591.
950.
580.
420.
3797
.6W
CC
W (
S&
B)*
2W
hite
Cla
y43
.88
3.44
12.7
419
.04
6.52
0.2
10.4
1.82
0.48
0.28
0.5
99.3
LAN
M (
S&
B)*
2W
hite
Cla
y47
.67
3.04
11.6
215
.44
6.54
0.19
10.9
32
0.44
0.22
0.75
98.9
WC
CM
BI
(S&
B)*
2W
hite
Cla
y47
.02
2.88
13.4
818
.36
5.52
0.24
9.72
1.5
0.76
0.28
0.52
100.
3G
RE
EN
LAW
N2
(S&
B)*
2W
hite
Cla
y46
.86
2.86
12.9
518
.66
5.18
0.22
9.14
1.59
0.45
0.24
1.72
99.9
WC
CM
BIII
(S
&B
)*2
Whi
te C
lay
48.2
42.
6414
.714
.64
5.8
0.18
9.7
2.6
0.56
0.4
0.68
100.
1W
CC
MC
(S
&B
)*2
Whi
te C
lay
51.2
12.
514
.07
13.1
76.
260.
178.
912.
330.
490.
270.
4599
.8W
CC
N2
(S&
B)*
2W
hite
Cla
y48
.54
2.38
13.8
216
.84
60.
229.
61.
30.
680.
280.
5810
0.2
WC
CM
BII
(S&
B)*
2W
hite
Cla
y47
.23
2.36
16.9
213
.01
5.88
0.19
10.5
2.22
0.58
0.25
0.47
99.6
MP
5 (S
&B
)*2
Whi
te C
lay
48.3
92.
0414
.71
12.5
97.
190.
1711
.01
2.35
0.32
0.24
0.58
99.6
WC
CM
BI
10-2
0cm
(S
&B
)*2
Whi
te C
lay
49.6
41.
9813
.78
14.3
16.
250.
29.
662.
130.
650.
280.
7599
.6W
CC
W+
W (
S&
B)*
2W
hite
Cla
y49
.78
1.97
14.5
413
.88
60.
2110
.28
1.74
0.5
0.17
0.04
799
.5LA
NN
(S
&B
)*2
Whi
te C
lay
48.1
41.
9414
.08
11.8
17.
370.
1711
.32
2.36
0.4
0.24
0.82
98.6
WC
C (
S&
B)*
2W
hite
Cla
y49
.53
1.66
14.4
913
.31
6.42
0.19
9.9
2.27
0.5
0.2
0.65
99.1
HE
RC
RR
(P
lank
)*2
Whi
te C
lay
4229
552
.43
2.06
13.0
814
.07
6.27
0.27
19.
691.
370.
560.
19W
OO
DD
ALE
(P
lank
)*2
Whi
te C
lay
49.2
83.
912
.32
18.4
95.
280.
226
8.64
1.27
0.57
0.40
0.11
100.
4S
AD
DLE
(M
cEw
en)*
1K
enne
tt S
q.43
507
48.5
80.
1816
.15
7.11
12.1
50.
1414
.06
0.62
0.11
00.
7199
.92
CO
TS
WO
LD (
McE
wen
)*1
Ken
nett
Sq.
4350
646
.19
0.98
15.1
512
.79
8.89
0.2
11.8
52.
220.
760.
120.
4299
.54
*Ref
eren
ceS
&B
Sm
ith a
nd B
arne
s, U
npub
lishe
d re
port
, P
enns
ylva
nia
Geo
logi
cal S
urve
y, 1
994
Pla
nkD
ata
this
stu
dyM
cEw
enM
cEw
en,
1997
7
Tab
le 1
.G
eoch
emic
al d
ata
for
Wilm
ingt
on C
ompl
ex, W
issa
hick
on F
orm
atio
n, a
nd J
ames
Run
For
mat
ion
sam
ples
use
d in
this
rep
ort a
nd p
revi
ousl
y un
publ
ishe
d.C
onti
nued
Wis
sah
icko
n F
orm
atio
n S
amp
le G
eoch
emic
al D
ata
Sam
ple
No
Typ
eTy
pe
Nam
eD
GS
Sam
pe
No
.R
bN
bC
eB
aS
cV
Cr
Co
Ni
Cu
YZ
rG
aZ
nLU
CK
1K
enne
tt S
q.10
611
190
5028
233
051
9016
024
60K
S1
Ken
nett
Sq.
237
1116
038
266
240
4990
440
2470
110
WIC
K1
Ken
nett
Sq.
<10
517
3834
269
280
5317
11
2286
91R
OS
E1
Ken
nett
Sq.
116
1450
232
256
320
4212
986
3078
71B
RN
TM
L1
Ken
nett
Sq.
<10
311
9038
234
340
4612
623
2062
71C
HF
D1
Ken
nett
Sq.
<10
25
4145
290
330
4180
110
2656
50B
RA
ND
Y2
1K
enne
tt S
q.<
102
468
4528
031
048
9025
020
4945
WC
CM
BIV
2W
hite
Cla
y<
1028
4311
836
284
8054
4130
4126
112
0Y
RK
LYN
2W
hite
Cla
y20
1955
237
3344
270
5225
9050
264
222
LAN
S2
Whi
te C
lay
<10
2749
230
3045
01.
945
2028
050
280
150
WC
CW
2W
hite
Cla
y16
1340
126
4463
570
7713
124
622
131
134
LAN
M2
Whi
te C
lay
1418
3716
046
444
4.8
5380
245
3816
013
0W
CC
MB
I2
Whi
te C
lay
<10
1439
7251
525
8565
5413
128
125
123
GR
EE
NLA
WN
22
Whi
te C
lay
1011
3015
451
713
110
5656
127
3313
019
129
WC
CM
BIII
2W
hite
Cla
y<
1017
5046
3928
320
051
6926
3016
410
2W
CC
MC
2W
hite
Cla
y3
1439
105
2930
715
948
.111
026
3618
019
162
WC
CN
22
Whi
te C
lay
1214
3622
452
423
180
6766
152
2312
212
4W
CC
MB
II2
Whi
te C
lay
1418
3788
2823
417
045
111
2824
156
101
MP
52
Whi
te C
lay
<10
1127
9527
245
240
4920
914
928
124
101
WC
CM
BI
10-2
0cm
2W
hite
Cla
y5
1229
124
3832
412
149
.257
3731
126
1916
7W
CC
W+
W2
Whi
te C
lay
312
3314
947
372
171
50.3
4499
2912
423
80LA
NN
2W
hite
Cla
y11
920
130
2829
024
041
130
120
2611
085
WC
C2
Whi
te C
lay
<10
1026
188
3427
314
050
8599
2410
810
2H
ER
CR
R2
Whi
te C
lay
4229
54.
911
.132
7537
.15
353
141
46.6
78.8
4630
.418
.612
8.4
WO
OD
DA
LE2
Whi
te C
lay
322
.24
5212
436
.351
621
59.6
131
45.8
268
121.
3S
AD
DLE
1K
enne
tt S
q.43
507
52
212
115
298
2739
1495
CO
TS
WO
LD1
Ken
nett
Sq.
4350
6
Sam
ple
No
Typ
eTy
pe
Nam
eD
GS
Sam
pe
No
.C
eP
rN
dS
mE
uG
dT
bD
yH
oE
rY
bL
uH
fTa
LUC
K1
Ken
nett
Sq.
118
2.3
0.87
0.6
2.31
0.36
1.4
0.2
KS
1K
enne
tt S
q.11
72.
20.
880.
62.
430.
331.
60.
4W
ICK
1K
enne
tt S
q.17
113.
11.
060.
62.
380.
361.
90.
7R
OS
E1
Ken
nett
Sq.
148
2.3
0.87
0.5
2.2
0.34
1.6
0.4
BR
NT
ML
1K
enne
tt S
q.11
82.
40.
830.
62.
120.
331.
30.
6C
HF
D1
Ken
nett
Sq.
55
1.8
0.7
0.5
2.57
0.4
1.2
0.1
BR
AN
DY
21
Ken
nett
Sq.
44
1.5
0.55
0.4
2.4
0.38
10.
4W
CC
MB
IV2
Whi
te C
lay
4330
8.1
2.64
1.5
4.35
0.58
6.7
1.2
YR
KLY
N2
Whi
te C
lay
5537
9.7
2.74
1.7
4.14
0.6
7.1
1.6
LAN
S2
Whi
te C
lay
4932
7.8
2.75
1.4
3.64
0.52
6.6
1.1
WC
CW
2W
hite
Cla
y40
266.
22.
031.
32.
820.
44.
70.
6LA
NM
2W
hite
Cla
y37
256.
22.
21.
23.
190.
444.
30.
9W
CC
MB
I2
Whi
te C
lay
3923
5.6
1.82
1.1
3.45
0.51
3.9
0.7
GR
EE
NLA
WN
22
Whi
te C
lay
304.
2721
5.3
1.85
61
5.9
1.2
3.4
2.97
0.43
30.
8W
CC
MB
III2
Whi
te C
lay
5034
82.
731.
43.
550.
55.
20.
9W
CC
MC
2W
hite
Cla
y39
5.66
276.
72.
186.
751.
26.
511.
263.
623.
120.
414.
81.
2W
CC
N2
2W
hite
Cla
y36
255.
71.
871.
23.
320.
474.
11.
2W
CC
MB
II2
Whi
te C
lay
3723
5.5
1.93
12.
460.
353.
70.
4M
P5
2W
hite
Cla
y27
174.
81.
581
2.11
0.31
31
WC
CM
BI
10-2
0cm
2W
hite
Cla
y29
4.38
205.
11.
725.
331
5.55
1.1
3.3
3.09
0.43
3.2
1W
CC
W+
W2
Whi
te C
lay
334.
4120
5.1
1.85
5.57
15.
61.
13.
22.
960.
423.
60.
8LA
NN
2W
hite
Cla
y20
123.
31.
140.
71.
620.
232.
70.
3W
CC
2W
hite
Cla
y26
174.
31.
410.
82.
370.
382.
80.
7H
ER
CR
R2
Whi
te C
lay
4229
532
4.52
19.9
35.
11.
695.
690.
945.
561.
123.
022.
670.
40.
76W
OO
DD
ALE
QU
AR
RY
2W
hite
Cla
y51
.77
7.27
33.4
28.
62.
689.
421.
618.
471.
664.
253.
560.
532.
04S
AD
DLE
1K
enne
tt S
q.43
507
2C
OT
SW
OLD
1K
enne
tt S
q.43
506
8
Wis
sah
icko
n F
orm
atio
n S
amp
le G
eoch
emic
al D
ata
Sam
ple
No
Typ
eTy
pe
Nam
eD
GS
Sam
pe
No
.T
hU
TiL
a/L
u
LUC
K1
Ken
nett
Sq.
0.3
<0.
277
3411
.4K
S1
Ken
nett
Sq.
0.3
<0.
174
9313
.3W
ICK
1K
enne
tt S
q.0.
6<
0.1
7493
18.9
RO
SE
1K
enne
tt S
q.0.
4<
0.1
5635
16.5
BR
NT
ML
1K
enne
tt S
q.0.
4<
0.1
5215
12.4
CH
FD
1K
enne
tt S
q.0.
1<
0.1
5095
3B
RA
ND
Y2
1K
enne
tt S
q.0.
1<
0.1
4676
2.9
WC
CM
BIV
2W
hite
Cla
y1.
9<
0.1
2847
626
.4Y
RK
LYN
2W
hite
Cla
y1.
80.
627
816
35.8
LAN
S2
Whi
te C
lay
1.5
<0.
526
977
42.3
WC
CW
2W
hite
Cla
y1.
40.
820
622
37.3
LAN
M2
Whi
te C
lay
1.1
0.7
1822
539
.3W
CC
MB
I2
Whi
te C
lay
1.8
1.4
1726
630
GR
EE
NLA
WN
22
Whi
te C
lay
1.4
0.5
1714
531
.6W
CC
MB
III2
Whi
te C
lay
1.8
0.8
1582
736
.8W
CC
MC
2W
hite
Cla
y3.
50.
714
987
41W
CC
N2
2W
hite
Cla
y1.
6<
0.1
1426
827
.2W
CC
MB
II2
Whi
te C
lay
1.1
0.3
1414
844
MP
52
Whi
te C
lay
0.8
<0.
112
230
34.2
WC
CM
BI
10-2
0cm
2W
hite
Cla
y2.
30.
611
870
30.5
WC
CW
+W
2W
hite
Cla
y1.
40.
411
810
31.7
LAN
N2
Whi
te C
lay
0.7
<0.
511
630
37W
CC
2W
hite
Cla
y1.
2<
0.1
9952
41.1
HE
RC
RR
2W
hite
Cla
y42
295
1.23
0.4
1235
033
.3W
OO
DD
ALE
2W
hite
Cla
y1.
803
0.3
2338
136
.8S
AD
DLE
1K
enne
tt S
q.43
507
110
79C
OT
SW
OLD
1K
enne
tt S
q.43
506
5875
Jam
es R
un
Fo
rmat
ion
, Cec
il C
ou
nty
, Mar
ylan
d
Sam
ple
No
.U
nit
SiO
[2]
Al[
2]O
[3F
e[2]
O[3
]M
gO
Mn
OC
aON
a[2]
OK
[2]O
P[2
]O[5
]L
OI%
Tota
l %JR
FM
C (
S&
B)*
Fre
ncht
own
Mem
ber
53.2
713
.02
16.4
53.
290.
287.
223.
250.
420.
620.
9010
0.88
JRG
FAS
(S
&B
)*G
ilpin
s F
alls
Mem
ber
60.2
114
.56
9.96
2.38
0.17
5.44
5.25
0.16
0.30
0.41
100.
32JR
GFA
(S&
B)*
Gilp
ins
Fal
ls M
embe
r58
.95
12.8
911
.64
2.41
0.22
6.43
3.48
0.34
0.34
0.58
98.7
5JR
FM
V (
S&
B)*
Fre
ncht
own
Mem
ber
66.2
413
.56
5.48
2.26
0.08
3.54
5.42
0.52
0.24
0.86
99.4
2JR
S (
S&
B)*
dike
56.8
415
.64
11.7
03.
540.
204.
864.
980.
720.
081.
3410
0.78
Sam
ple
No
.U
nit
Sr
Nb
Cs
Ba
Sc
VC
rC
oN
iC
uY
JRF
MC
Fre
ncht
own
Mem
ber
140.
06.
0<
0.2
70.0
33.0
76.0
3.4
15.0
<10
50.0
52.0
JRG
FAS
Gilp
ins
Fal
ls M
embe
r20
8.0
11.0
0.4
46.0
21.0
117.
04.
014
.010
.014
.056
.0JR
GFA
Gilp
ins
Fal
ls M
embe
r16
0.0
8.0
<0.
290
.021
.011
0.0
3.0
17.0
<10
15.0
48.0
JRF
MV
Fre
ncht
own
Mem
ber
140.
010
.00.
316
0.0
19.0
120.
00.
79.
1<
20<
1040
.0JR
Sdi
ke80
.05.
00.
322
0.0
30.0
288.
02.
726
.0<
2010
.024
.0S
amp
le N
o.
Un
itZ
rZ
nL
aC
eN
dS
mE
uT
bY
bL
uH
fJR
FM
CF
renc
htow
n M
embe
r97
.00
35.0
06.
5018
.00
14.0
04.
601.
601.
204.
180.
662.
4JR
GFA
SG
ilpin
s F
alls
Mem
ber
246.
0012
0.00
24.3
055
.00
29.0
07.
101.
881.
405.
860.
885.
9JR
GFA
Gilp
ins
Fal
ls M
embe
r18
0.00
90.0
014
.00
34.0
019
.00
4.90
1.47
1.20
4.30
0.68
4.4
JRF
MV
Fre
ncht
own
Mem
ber
166.
00<
1017
.00
37.0
018
.00
4.40
1.18
1.00
3.60
0.58
4JR
Sdi
ke59
.00
60.0
03.
006.
004.
001.
500.
540.
401.
760.
281.
3S
amp
le N
o.
Un
itTa
Th
UTi
La/
Lu
JRF
MC
Fre
ncht
own
Mem
ber
0.20
0.60
<0.
512
949
1.03
JRG
FAS
Gilp
ins
Fal
ls M
embe
r0.
706.
001.
3088
722.
88JR
GFA
Gilp
ins
Fal
ls M
embe
r0.
503.
600.
8086
922.
14JR
FM
VF
renc
htow
n M
embe
r0.
503.
901.
2071
943.
05JR
Sdi
ke<
0.1
1.10
<0.
550
351.
12*R
efer
ence
S&
BS
mith
and
Bar
nes,
Unp
ublis
hed
repo
rt,
Pen
nsyl
vani
a G
eolo
gica
l Sur
vey,
199
3
Precision, based on replicates in each run, is typically<2 percent relative standard deviation. Accuracy can beassessed by comparing our analysis of standard referencematerial JB-3 with the accepted values from Govindaraju(1994) given in Appendix I. Accuracy is typically about 5percent, but the ICP-MS values may be better determinedthan the “accepted” values for some elements; however, ourmethod of analysis has a few drawbacks. The samples weredissolved in HF, thus volatilizing the Si. SiO2 was deter-mined by difference from 100 percent with accuracy of about5 percent relative. Zircon was not dissolved in the samples;therefore the Zr and Hf numbers are not reported. Asidefrom Zr and Hf, the other elements affected by the zircon dis-solution problem are U and heavy rare earth elements(HREE). Based on the amount of zircon in these samples(calculated to be <0.02 wt percent, by comparing x-ray fluo-rescence [XRF] and ICP-MS Zr data for the same samples)and published partition coefficients for U and Yb, the maxi-mum errors for U and HREE are estimated at 10 percent.
Comparison of the results for our sample WINDY withsample JRBEWH collected and analyzed from the same out-crop by R. C. Smith, shows disparity in two trace elements.Th values for our sample are lower than the Smith sampleand Ta values are higher (Table 1).
9
Smith and Barnes samples were analyzed for Nb andZr by XRF. Cu, Pb, Zn, Ag, Ni, Cd, Bi, V, and Be were ana-lyzed by acid total digestion and induction coupled plasma(ICP). Si, Al, Fe, Mn, Mg, Ca, Na, K, Ti, P, Ba, Sr, and Ywere done by fusion ICP. These data for Y were low by avariable amount and had to be rerun on the whole rock XRFpellet. Au, As, Br, Co, Cr, Cs, Hf, Rb, Sb, Cs, Se, Sr, Ta, Th,U, W, La, Ce, Nb, Sm, Eu, Tb, Yb, and Lu were analyzed bythe Instrument Neutron Activation Analysis technique byEric L. Hoffman at Activation Laboratories, Ltd. Estimate ofsampling error plus analytical error suggests that precision istypically within 10 percent. Accuracy was determined byrunning BCR-1 as an unknown. Precision was determinedby preparing and analyzing a separate slab from a block ofthe Fishing Creek Member (Pennsylvania) of the SamsCreek Formation (Maryland) with each batch. This approachestimates the worst case sum of sampling error plus analyti-cal precision.
AcknowledgmentsWe express our appreciation to Robert C. Smith and
John H. Barnes of the Pennsylvania Geological Survey whograciously allowed us to present their unpublished geochem-ical data in this report. The report was critically reviewed by
Figure 2. Generalized regional geologic map showing locations of samples from Appendix II identified by sample name.
Robert C. Smith, Pennsylvania Geological Survey, JonathanKim, Vermont Geological Survey, Henry N. Berry, IV, MaineGeological Survey, and Richard N. Benson, DelawareGeological Survey. Their valuable suggestions helped toimprove earlier versions of the manuscript and figures. Wealso thank Micro-Analysis, Inc., for determining adsorbedwater and loss on ignition for our samples.
RESULTSWilmington Complex
Major Element ChemistryThe rocks of the Delaware Piedmont have been meta-
morphosed to the upper amphibolite and lower granulitefacies and have been subsequently altered by weatheringand/or interaction with hydrothermal fluids. Consequently, itis reasonable to look for possible effects of these processeson the rock geochemistry. The major elements K2O, Na2O,CaO, and SiO2 are reported to be mobile at all grades ofmetamorphism, whereas, FeO, MgO, MnO, and Al2O3 arestable at lower metamorphic grades and may also be stable athigh metamorphic grades depending on the fluid content ofthe rock (Badger, 1993; Rollinson, 1993).
A number of schemes have been proposed to determinethe extent of the alteration by hydrothermal fluids. For oredeposits which are generally more hydrothermally alteredthan the Wilmington Complex rocks, Hashiguchi et al.(1983) proposed an alteration index (AI) calculated using theformula:
AI=100(MgO+K2O)/MgO+K2O+CaO+Na2O).Indices of <36±8 represent relatively unaltered rocks.
Of the 16 Wilmington Complex samples analyzed by T. A.Plank, plus 3 from Smith and Barnes (unpublished report,1993), only two from the Faulkland Gneiss fall outside theacceptable range for major elements (Table 1). This does notmean that an individual sample has gained or lost some com-ponents, only that the majority of samples have major ele-ment chemistries like unaltered igneous rocks.
We also note that retrograde hydration in all rocks mustbe low because the rocks contain <1 percent H2O, as deter-mined by LOI (Table 1). Altered rocks typically have high-er LOIs.
We first consider some aspects of the major elementchemistry, using the Wilmington Complex data determinedfor this study plus that from Smith and Barnes (unpublishedreports, Pennsylvania Geological Survey, 1993 and 1994)and McEwen (1997) (Table 1).) Also included are data fromWard (1959), Srogi (1988), and Higgins (1990). On the totalalkalis vs. silica diagram (LeBas et al., 1986), it is notewor-thy that rock compositions from the Wilmington Complexspan the complete range of silica content, from 45 to 76weight percent SiO2, and have total alkali contents typical ofsubalkaline basalts, andesites, dacites, and rhyolites (Figure3). (Although this diagram was designed for volcanic rocks,we have probably plotted both volcanic and plutonic samplesbecause it is difficult to determine the origin of the high-grade metamorphic rocks in the Delaware Piedmont). Thecompositions are consistent with those reported from mag-matic arcs formed at convergent margins. On the diagram ofK2O vs. SiO2 for arc magmatic series (Peccerillo and Taylor,1976), the same samples plot in the low-K tholeiite series,with a few samples falling in the calc-alkaline series (Figure4). This is consistent with the petrography which shows that,in general, K-bearing minerals are sparse (Table 2; see alsoWard, 1959, and Schenck and Plank, 1995). The same
10
Wilmington Complex samples also indicate a predominantlytholeiitic trend on the AFM diagram of Figure 5 (alkalis, Feoxides, and MgO). This diagram is commonly used to dis-tinguish between tholeiitic and calc-alkaline differentiationtrends in a magma series (Irvine and Barager, 1971). Harkerdiagrams plotted for the Wilmington Complex rocks (notshown) show significant scatter, probably due to the mobili-ty of many of the major elements and to different crystalliza-tion histories for different samples. Although these datashould be viewed with caution, as alkalies are mobile duringmetamorphism, they are consistent with the interpretationthat the mafic rocks of the Wilmington Complex originatedas low-K tholeiites at a converging margin.
Figure 3. Total weight percent alkali (Na2O+K2O) vs.SiO2 plot of Wilmington Complex samples andthe classification scheme for volcanic rocksfrom LeBas et al. (1986). Data are from thisstudy plus those of Ward (1959), Srogi (1988),Higgins (1990), Smith and Barnes (1994;unpublished report 1993), Chace (1995), andMcEwen (1997).Symbols: closed triangle, Brandywine BlueGneiss; closed diamond, Rockford Park Gneiss;closed box, Faulkland Gneiss; open star, WindyHills Gneiss; closed star, James Run Formation,Cecil County, Maryland.
Figure 4. Weight percent K2O vs. SiO2 plot forWilmington Complex samples. Series bound-aries are after Peccerillo and Taylor (1976).Data and symbols same as Figure 3.
Na2O+K2O
SiO2
SiO2
K2O
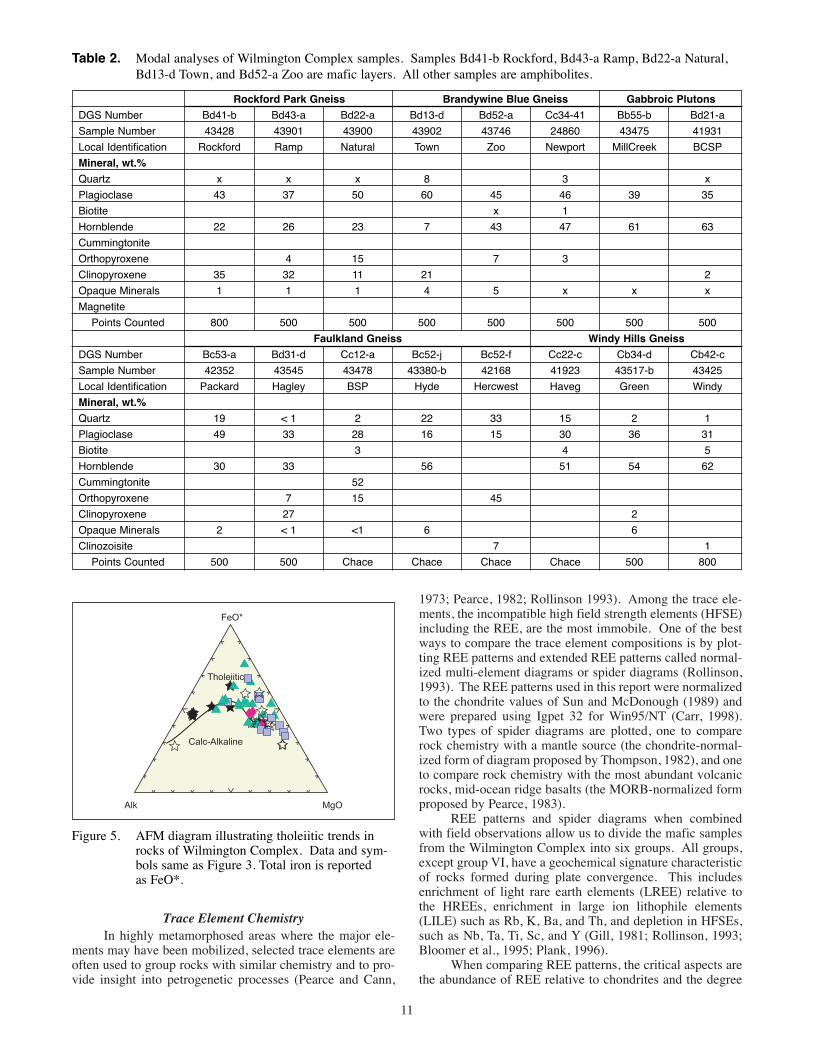
Trace Element ChemistryIn highly metamorphosed areas where the major ele-
ments may have been mobilized, selected trace elements areoften used to group rocks with similar chemistry and to pro-vide insight into petrogenetic processes (Pearce and Cann,
11
1973; Pearce, 1982; Rollinson 1993). Among the trace ele-ments, the incompatible high field strength elements (HFSE)including the REE, are the most immobile. One of the bestways to compare the trace element compositions is by plot-ting REE patterns and extended REE patterns called normal-ized multi-element diagrams or spider diagrams (Rollinson,1993). The REE patterns used in this report were normalizedto the chondrite values of Sun and McDonough (1989) andwere prepared using Igpet 32 for Win95/NT (Carr, 1998).Two types of spider diagrams are plotted, one to comparerock chemistry with a mantle source (the chondrite-normal-ized form of diagram proposed by Thompson, 1982), and oneto compare rock chemistry with the most abundant volcanicrocks, mid-ocean ridge basalts (the MORB-normalized formproposed by Pearce, 1983).
REE patterns and spider diagrams when combinedwith field observations allow us to divide the mafic samplesfrom the Wilmington Complex into six groups. All groups,except group VI, have a geochemical signature characteristicof rocks formed during plate convergence. This includesenrichment of light rare earth elements (LREE) relative tothe HREEs, enrichment in large ion lithophile elements(LILE) such as Rb, K, Ba, and Th, and depletion in HFSEs,such as Nb, Ta, Ti, Sc, and Y (Gill, 1981; Rollinson, 1993;Bloomer et al., 1995; Plank, 1996).
When comparing REE patterns, the critical aspects arethe abundance of REE relative to chondrites and the degree
Figure 5. AFM diagram illustrating tholeiitic trends inrocks of Wilmington Complex. Data and sym-bols same as Figure 3. Total iron is reportedas FeO*.
Rockford Park Gneiss Brandywine Blue Gneiss Gabbroic Plutons
DGS Number Bd41-b Bd43-a Bd22-a Bd13-d Bd52-a Cc34-41 Bb55-b Bd21-a
Sample Number 43428 43901 43900 43902 43746 24860 43475 41931
Local Identification Rockford Ramp Natural Town Zoo Newport MillCreek BCSP
Mineral, wt.%
Quartz x x x 8 3 x
Plagioclase 43 37 50 60 45 46 39 35
Biotite x 1
Hornblende 22 26 23 7 43 47 61 63
Cummingtonite
Orthopyroxene 4 15 7 3
Clinopyroxene 35 32 11 21 2
Opaque Minerals 1 1 1 4 5 x x x
Magnetite
Points Counted 800 500 500 500 500 500 500 500
Faulkland Gneiss Windy Hills Gneiss
DGS Number Bc53-a Bd31-d Cc12-a Bc52-j Bc52-f Cc22-c Cb34-d Cb42-c
Sample Number 42352 43545 43478 43380-b 42168 41923 43517-b 43425
Local Identification Packard Hagley BSP Hyde Hercwest Haveg Green Windy
Mineral, wt.%
Quartz 19 < 1 2 22 33 15 2 1
Plagioclase 49 33 28 16 15 30 36 31
Biotite 3 4 5
Hornblende 30 33 56 51 54 62
Cummingtonite 52
Orthopyroxene 7 15 45
Clinopyroxene 27 2
Opaque Minerals 2 < 1 <1 6 6
Clinozoisite 7 1
Points Counted 500 500 Chace Chace Chace Chace 500 800
Table 2. Modal analyses of Wilmington Complex samples. Samples Bd41-b Rockford, Bd43-a Ramp, Bd22-a Natural,Bd13-d Town, and Bd52-a Zoo are mafic layers. All other samples are amphibolites.
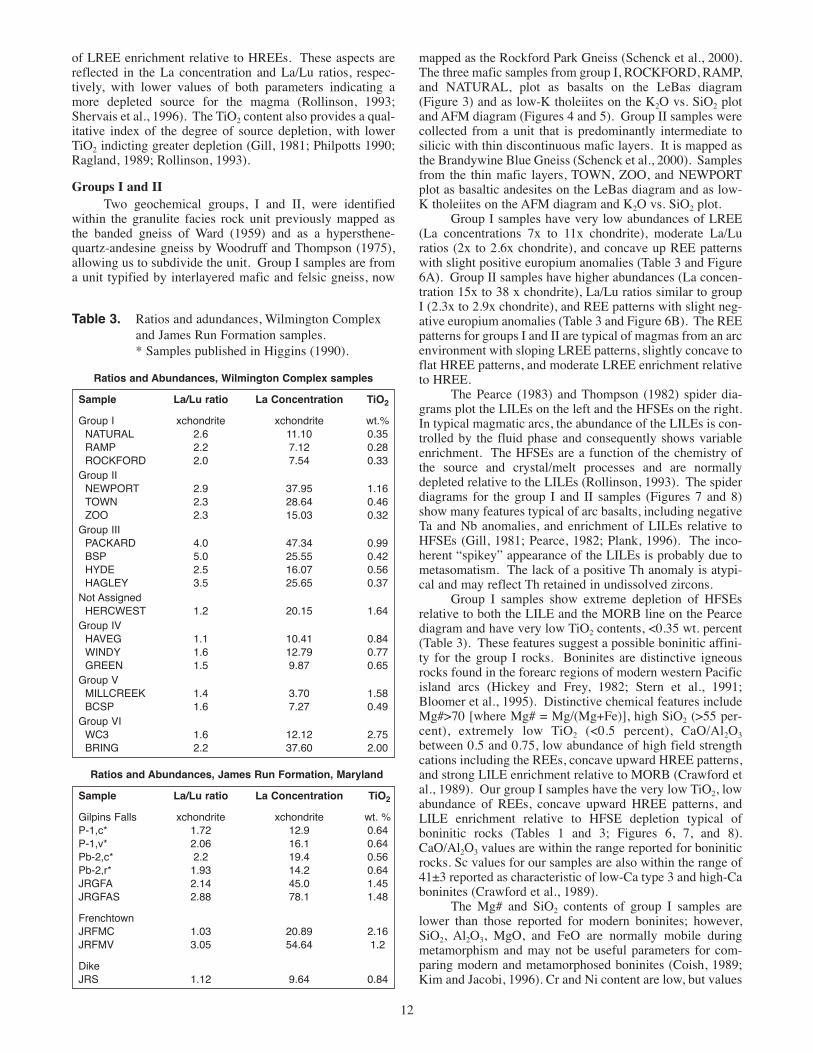
of LREE enrichment relative to HREEs. These aspects arereflected in the La concentration and La/Lu ratios, respec-tively, with lower values of both parameters indicating amore depleted source for the magma (Rollinson, 1993;Shervais et al., 1996). The TiO2 content also provides a qual-itative index of the degree of source depletion, with lowerTiO2 indicting greater depletion (Gill, 1981; Philpotts 1990;Ragland, 1989; Rollinson, 1993).
Groups I and IITwo geochemical groups, I and II, were identified
within the granulite facies rock unit previously mapped asthe banded gneiss of Ward (1959) and as a hypersthene-quartz-andesine gneiss by Woodruff and Thompson (1975),allowing us to subdivide the unit. Group I samples are froma unit typified by interlayered mafic and felsic gneiss, now
12
mapped as the Rockford Park Gneiss (Schenck et al., 2000).The three mafic samples from group I, ROCKFORD, RAMP,and NATURAL, plot as basalts on the LeBas diagram(Figure 3) and as low-K tholeiites on the K2O vs. SiO2 plotand AFM diagram (Figures 4 and 5). Group II samples werecollected from a unit that is predominantly intermediate tosilicic with thin discontinuous mafic layers. It is mapped asthe Brandywine Blue Gneiss (Schenck et al., 2000). Samplesfrom the thin mafic layers, TOWN, ZOO, and NEWPORTplot as basaltic andesites on the LeBas diagram and as low-K tholeiites on the AFM diagram and K2O vs. SiO2 plot.
Group I samples have very low abundances of LREE(La concentrations 7x to 11x chondrite), moderate La/Luratios (2x to 2.6x chondrite), and concave up REE patternswith slight positive europium anomalies (Table 3 and Figure6A). Group II samples have higher abundances (La concen-tration 15x to 38 x chondrite), La/Lu ratios similar to groupI (2.3x to 2.9x chondrite), and REE patterns with slight neg-ative europium anomalies (Table 3 and Figure 6B). The REEpatterns for groups I and II are typical of magmas from an arcenvironment with sloping LREE patterns, slightly concave toflat HREE patterns, and moderate LREE enrichment relativeto HREE.
The Pearce (1983) and Thompson (1982) spider dia-grams plot the LILEs on the left and the HFSEs on the right.In typical magmatic arcs, the abundance of the LILEs is con-trolled by the fluid phase and consequently shows variableenrichment. The HFSEs are a function of the chemistry ofthe source and crystal/melt processes and are normallydepleted relative to the LILEs (Rollinson, 1993). The spiderdiagrams for the group I and II samples (Figures 7 and 8)show many features typical of arc basalts, including negativeTa and Nb anomalies, and enrichment of LILEs relative toHFSEs (Gill, 1981; Pearce, 1982; Plank, 1996). The inco-herent “spikey” appearance of the LILEs is probably due tometasomatism. The lack of a positive Th anomaly is atypi-cal and may reflect Th retained in undissolved zircons.
Group I samples show extreme depletion of HFSEsrelative to both the LILE and the MORB line on the Pearcediagram and have very low TiO2 contents, <0.35 wt. percent(Table 3). These features suggest a possible boninitic affini-ty for the group I rocks. Boninites are distinctive igneousrocks found in the forearc regions of modern western Pacificisland arcs (Hickey and Frey, 1982; Stern et al., 1991;Bloomer et al., 1995). Distinctive chemical features includeMg#>70 [where Mg# = Mg/(Mg+Fe)], high SiO2 (>55 per-cent), extremely low TiO2 (<0.5 percent), CaO/Al2O3
between 0.5 and 0.75, low abundance of high field strengthcations including the REEs, concave upward HREE patterns,and strong LILE enrichment relative to MORB (Crawford etal., 1989). Our group I samples have the very low TiO2, lowabundance of REEs, concave upward HREE patterns, andLILE enrichment relative to HFSE depletion typical ofboninitic rocks (Tables 1 and 3; Figures 6, 7, and 8).CaO/Al2O3 values are within the range reported for boniniticrocks. Sc values for our samples are also within the range of41±3 reported as characteristic of low-Ca type 3 and high-Caboninites (Crawford et al., 1989).
The Mg# and SiO2 contents of group I samples arelower than those reported for modern boninites; however,SiO2, Al2O3, MgO, and FeO are normally mobile duringmetamorphism and may not be useful parameters for com-paring modern and metamorphosed boninites (Coish, 1989;Kim and Jacobi, 1996). Cr and Ni content are low, but values
Table 3. Ratios and adundances, Wilmington Complexand James Run Formation samples.* Samples published in Higgins (1990).
Ratios and Abundances, Wilmington Complex samples
Sample La/Lu ratio La Concentration TiO2
Group I xchondrite xchondrite wt.%NATURAL 2.6 11.10 0.35RAMP 2.2 7.12 0.28ROCKFORD 2.0 7.54 0.33
Group IINEWPORT 2.9 37.95 1.16TOWN 2.3 28.64 0.46ZOO 2.3 15.03 0.32
Group IIIPACKARD 4.0 47.34 0.99BSP 5.0 25.55 0.42HYDE 2.5 16.07 0.56HAGLEY 3.5 25.65 0.37
Not AssignedHERCWEST 1.2 20.15 1.64
Group IVHAVEG 1.1 10.41 0.84WINDY 1.6 12.79 0.77GREEN 1.5 9.87 0.65
Group VMILLCREEK 1.4 3.70 1.58BCSP 1.6 7.27 0.49
Group VIWC3 1.6 12.12 2.75BRING 2.2 37.60 2.00
Ratios and Abundances, James Run Formation, Maryland
Sample La/Lu ratio La Concentration TiO2
Gilpins Falls xchondrite xchondrite wt. %P-1,c* 1.72 12.9 0.64P-1,v* 2.06 16.1 0.64Pb-2,c* 2.2 19.4 0.56Pb-2,r* 1.93 14.2 0.64JRGFA 2.14 45.0 1.45JRGFAS 2.88 78.1 1.48
FrenchtownJRFMC 1.03 20.89 2.16JRFMV 3.05 54.64 1.2
DikeJRS 1.12 9.64 0.84
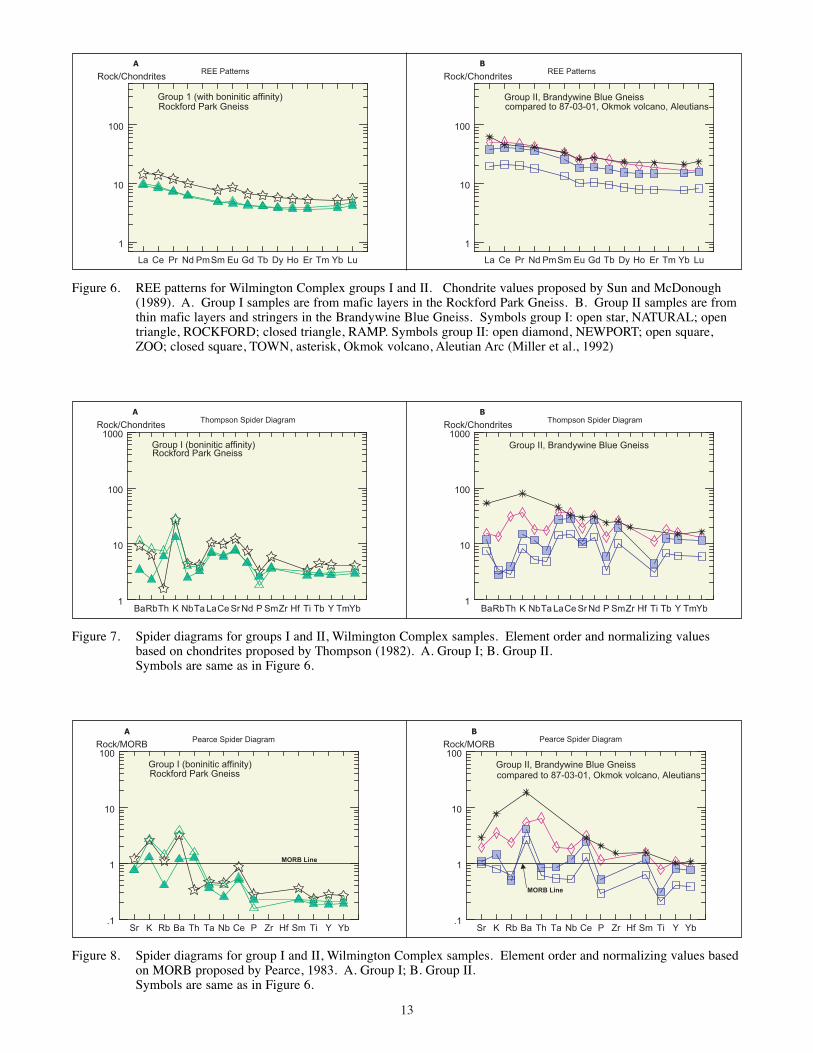
13
Figure 7. Spider diagrams for groups I and II, Wilmington Complex samples. Element order and normalizing valuesbased on chondrites proposed by Thompson (1982). A. Group I; B. Group II.Symbols are same as in Figure 6.
Figure 8. Spider diagrams for group I and II, Wilmington Complex samples. Element order and normalizing values basedon MORB proposed by Pearce, 1983. A. Group I; B. Group II.Symbols are same as in Figure 6.
Figure 6. REE patterns for Wilmington Complex groups I and II. Chondrite values proposed by Sun and McDonough(1989). A. Group I samples are from mafic layers in the Rockford Park Gneiss. B. Group II samples are fromthin mafic layers and stringers in the Brandywine Blue Gneiss. Symbols group I: open star, NATURAL; opentriangle, ROCKFORD; closed triangle, RAMP. Symbols group II: open diamond, NEWPORT; open square,ZOO; closed square, TOWN, asterisk, Okmok volcano, Aleutian Arc (Miller et al., 1992)

for two samples, RAMP and ROCKFORD, are consistentwith Cr and Ni reported for boninitic rocks from the ThetfordMines Ophiolite, Quebec, Canada (Coish, 1989). The Cr andNi contents of the NATURAL sample are unusually low.
Because it is possible for some cumulate gabbroicrocks to have trace element characteristics similar toboninitic rocks, it is important to evaluate a cumulate originfor the group I rocks. The lack of a strong positive Eu anom-aly and normal concentrations of Sr suggest the rocks are notcumulates (Gill, 1981). In addition, there is no petrographicor field evidence to suggest an origin as cumulate ormelanosome.
Interpretation. In recent years, metabasalts withboninitic affinities have been recognized in Ordovician vol-canic sequences from the northern Appalachians (Coish,1989; Kim and Jacobi, 1996; MacLachian and Dunning,1998). Figure 9 shows the REE patterns for group I samplesare similar to Eocene boninites from the modern Marianasforearc (Stern et al., 1991) and Ordovician boninitic rocksfrom the northern Appalachians; the Hawley Formation ofnorthwestern Massachusetts (Kim and Jacobi, 1996), theExploits Subzone, Newfoundland, Canada (MacLachian andDunning, 1998), and the Thetford Mines Ophiolite, Quebec,Canada (Coish, 1989). Boninitic metabasalts have been rec-ognized in the Pennsylvania Piedmont and are also associat-ed with an ophiolite complex, in this case, the BaltimoreMafic Complex (Smith and Barnes, 1994).
14
From the many recent studies of boninites, there is nowa consensus that boninite melts form from severely depletedmantle (harzbergite), whose bulk chemistry has been alteredby the introduction of LREE-rich, Ti-poor fluids. These flu-ids may be derived by dehydration of subducted basalticcrust or re-equilibration of fluids released from the dehydrat-ing slab with the overlying mantle wedge. Melting resultsfrom the combined effects of this fluid and an unusuallysteep geotherm. Consequently, boninite magmas generallyform at convergent margins during relatively short-livedevents that are not in thermal equilibrium (Hickey and Frey,1982; Coish, 1989; Stern et al., 1991; Stern and Bloomer,1992; Pearce et al., 1992; Bloomer et al., 1995). The modelsproposed for the origin of boninites include the “infant arc”model of Stern and Bloomer (1992), forearc spreading model(Hickey and Frey, 1982; Hawkins et al., 1984), and early-stage backarc spreading model (Crawford et al., 1989).
The boninitic rocks in Delaware are interlayered withfelsic rocks having compositions of metatonalites, meta-trondhjemites, or metadacites. The rapid rate of crust forma-tion proposed for subduction zone infancy (Stern andBloomer, 1992) provides an explanation for the formation oftonalites (and rhyolites) within several million years of thedepleted mafic sequence by melting of the depleted rocks atthe base of the thickened arc crust. Unfortunately, deforma-tion and metamorphism obscure the original thickness andthe relationship between the boninitic rocks and the felsic
Figure 9. A, B, C, and D are REE patterns for boninitic rocks from modern and ancient environments compared to thepatterns for Wilmington Complex, group I sample, RAMP.Symbols: closed triangle, RAMP; asterisk, Marianas Arc, Western Pacific; closed diamond, Thetford Ophiolite,Quebec Canada; closed box, Dunnage Zone, Newfoundland; closed circle Hawley Formation, Massachusetts.
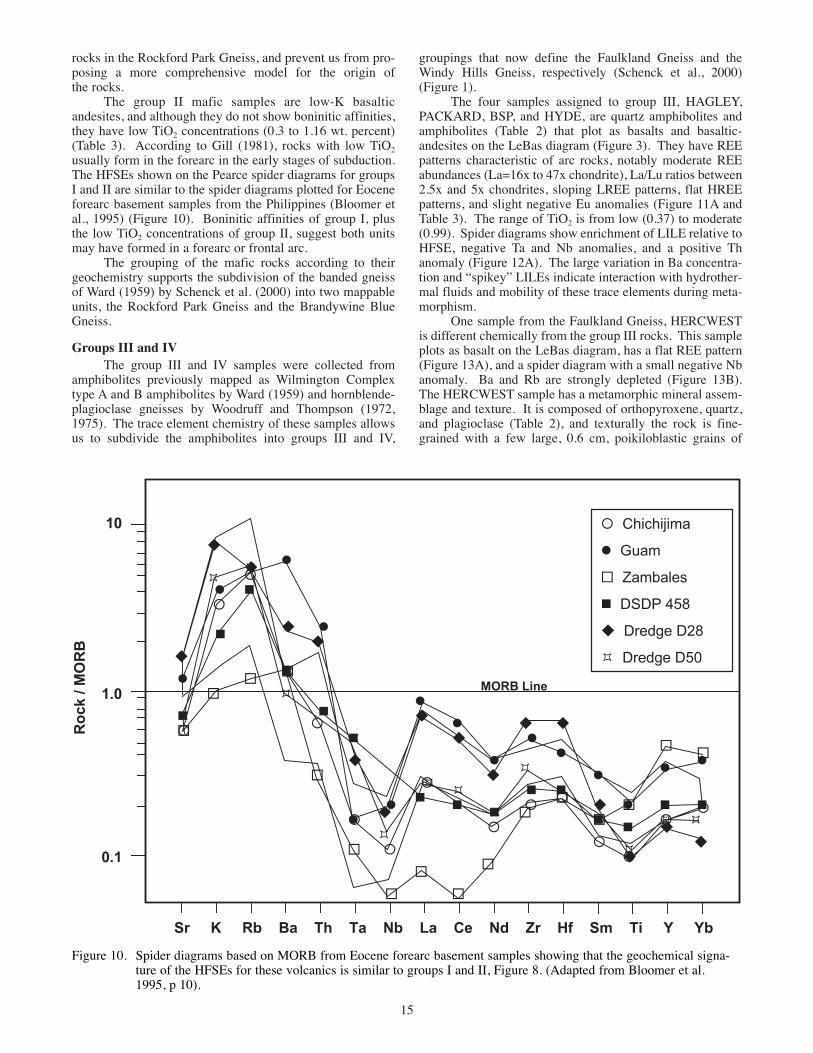
rocks in the Rockford Park Gneiss, and prevent us from pro-posing a more comprehensive model for the origin ofthe rocks.
The group II mafic samples are low-K basalticandesites, and although they do not show boninitic affinities,they have low TiO2 concentrations (0.3 to 1.16 wt. percent)(Table 3). According to Gill (1981), rocks with low TiO2
usually form in the forearc in the early stages of subduction.The HFSEs shown on the Pearce spider diagrams for groupsI and II are similar to the spider diagrams plotted for Eoceneforearc basement samples from the Philippines (Bloomer etal., 1995) (Figure 10). Boninitic affinities of group I, plusthe low TiO2 concentrations of group II, suggest both unitsmay have formed in a forearc or frontal arc.
The grouping of the mafic rocks according to theirgeochemistry supports the subdivision of the banded gneissof Ward (1959) by Schenck et al. (2000) into two mappableunits, the Rockford Park Gneiss and the Brandywine BlueGneiss.
Groups III and IVThe group III and IV samples were collected from
amphibolites previously mapped as Wilmington Complextype A and B amphibolites by Ward (1959) and hornblende-plagioclase gneisses by Woodruff and Thompson (1972,1975). The trace element chemistry of these samples allowsus to subdivide the amphibolites into groups III and IV,
15
groupings that now define the Faulkland Gneiss and theWindy Hills Gneiss, respectively (Schenck et al., 2000)(Figure 1).
The four samples assigned to group III, HAGLEY,PACKARD, BSP, and HYDE, are quartz amphibolites andamphibolites (Table 2) that plot as basalts and basaltic-andesites on the LeBas diagram (Figure 3). They have REEpatterns characteristic of arc rocks, notably moderate REEabundances (La=16x to 47x chondrite), La/Lu ratios between2.5x and 5x chondrites, sloping LREE patterns, flat HREEpatterns, and slight negative Eu anomalies (Figure 11A andTable 3). The range of TiO2 is from low (0.37) to moderate(0.99). Spider diagrams show enrichment of LILE relative toHFSE, negative Ta and Nb anomalies, and a positive Thanomaly (Figure 12A). The large variation in Ba concentra-tion and “spikey” LILEs indicate interaction with hydrother-mal fluids and mobility of these trace elements during meta-morphism.
One sample from the Faulkland Gneiss, HERCWESTis different chemically from the group III rocks. This sampleplots as basalt on the LeBas diagram, has a flat REE pattern(Figure 13A), and a spider diagram with a small negative Nbanomaly. Ba and Rb are strongly depleted (Figure 13B).The HERCWEST sample has a metamorphic mineral assem-blage and texture. It is composed of orthopyroxene, quartz,and plagioclase (Table 2), and texturally the rock is fine-grained with a few large, 0.6 cm, poikiloblastic grains of
Figure 10. Spider diagrams based on MORB from Eocene forearc basement samples showing that the geochemical signa-ture of the HFSEs for these volcanics is similar to groups I and II, Figure 8. (Adapted from Bloomer et al.1995, p 10).
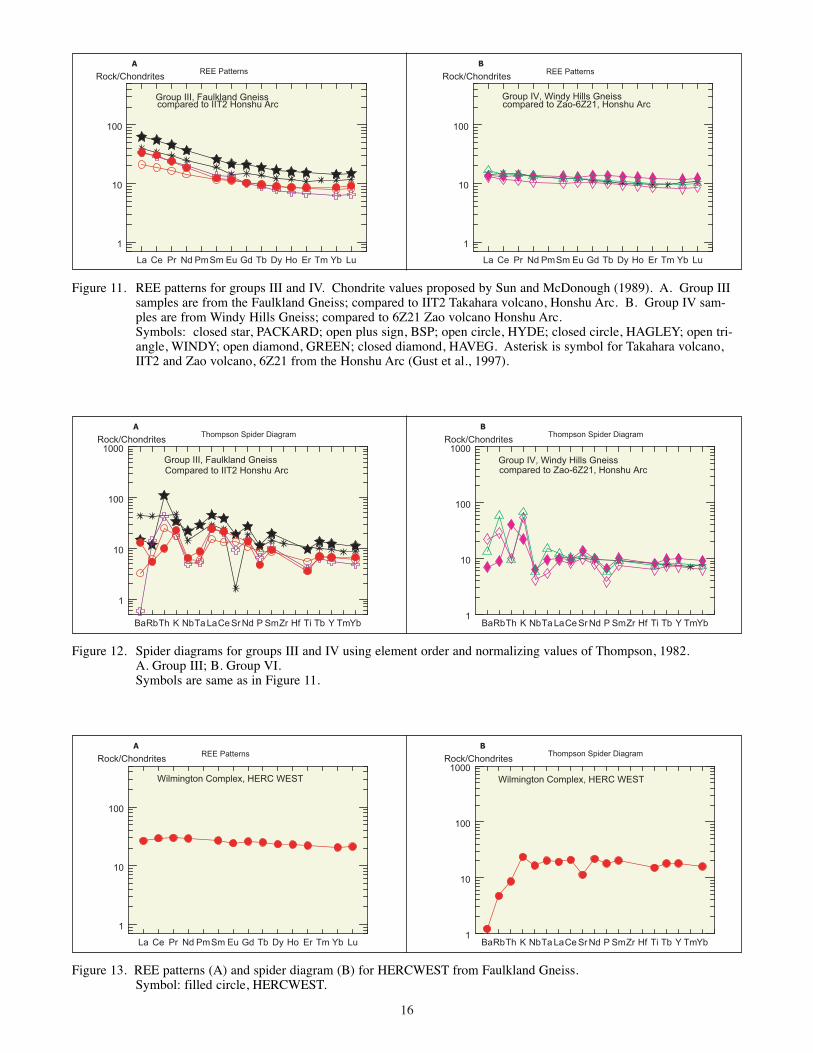
16
Figure 11. REE patterns for groups III and IV. Chondrite values proposed by Sun and McDonough (1989). A. Group IIIsamples are from the Faulkland Gneiss; compared to IIT2 Takahara volcano, Honshu Arc. B. Group IV sam-ples are from Windy Hills Gneiss; compared to 6Z21 Zao volcano Honshu Arc.Symbols: closed star, PACKARD; open plus sign, BSP; open circle, HYDE; closed circle, HAGLEY; open tri-angle, WINDY; open diamond, GREEN; closed diamond, HAVEG. Asterisk is symbol for Takahara volcano,IIT2 and Zao volcano, 6Z21 from the Honshu Arc (Gust et al., 1997).
Figure 12. Spider diagrams for groups III and IV using element order and normalizing values of Thompson, 1982.A. Group III; B. Group VI.Symbols are same as in Figure 11.
Figure 13. REE patterns (A) and spider diagram (B) for HERCWEST from Faulkland Gneiss.Symbol: filled circle, HERCWEST.

17
Figure 14. REE patterns for groups V and VI. Chondrite values proposed by Sun and McDonough (1989). Group V sam-ples are cumulates and group VI are undeformed mafic plutons. A. Group V; B. Group VI.Symbols: closed flower, Mill Creek Metagabbro, MILL CREEK; open flower, Montchanin Metagabbro, BCSP;closed box, unnamed mafic dike WC-3; closed triangle, Bringhurst Gabbro, BRING.
Figure 15. Spider diagrams for groups V and VI using element order and normalizing values of Thompson, 1982.A. Group V; B. Group VI.Symbols are same as in Figure 17.
Figure 16. A. REE patterns for pillow lavas from the Gilpins Falls Member*, James Run Formation, Cecil County,Maryland (Higgins, 1990) compared to Windy Hills Gneiss.B. Spider diagram for same samples*. The Tb enrichment in the Gilpins Falls REE patterns and spider dia-grams is an analytical problem (Higgins, 1990).Symbols: asterisk, Gilpins Falls pillow basalts; filled circle, group IV, WINDY.*Gilpins Falls pillow lava samples include P-1,vz; P-1,r; PB-2,c; PB3,c; RC-1; and PB-4 (Higgins, 1990).
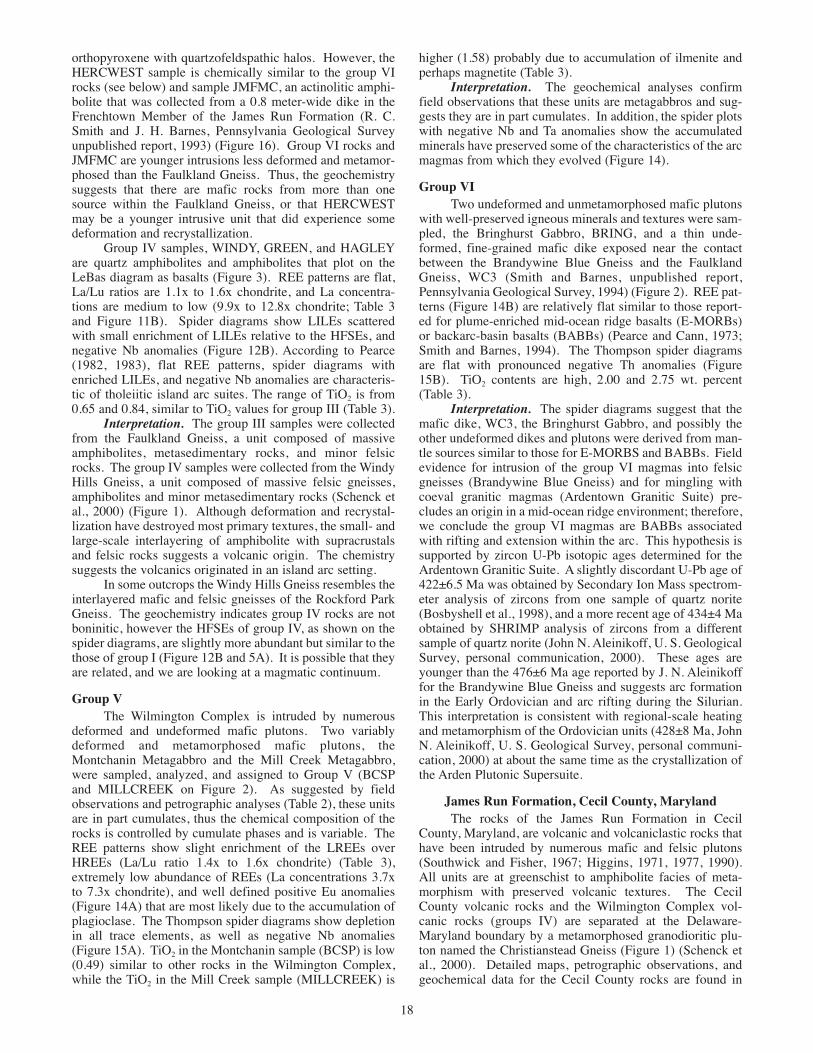
orthopyroxene with quartzofeldspathic halos. However, theHERCWEST sample is chemically similar to the group VIrocks (see below) and sample JMFMC, an actinolitic amphi-bolite that was collected from a 0.8 meter-wide dike in theFrenchtown Member of the James Run Formation (R. C.Smith and J. H. Barnes, Pennsylvania Geological Surveyunpublished report, 1993) (Figure 16). Group VI rocks andJMFMC are younger intrusions less deformed and metamor-phosed than the Faulkland Gneiss. Thus, the geochemistrysuggests that there are mafic rocks from more than onesource within the Faulkland Gneiss, or that HERCWESTmay be a younger intrusive unit that did experience somedeformation and recrystallization.
Group IV samples, WINDY, GREEN, and HAGLEYare quartz amphibolites and amphibolites that plot on theLeBas diagram as basalts (Figure 3). REE patterns are flat,La/Lu ratios are 1.1x to 1.6x chondrite, and La concentra-tions are medium to low (9.9x to 12.8x chondrite; Table 3and Figure 11B). Spider diagrams show LILEs scatteredwith small enrichment of LILEs relative to the HFSEs, andnegative Nb anomalies (Figure 12B). According to Pearce(1982, 1983), flat REE patterns, spider diagrams withenriched LILEs, and negative Nb anomalies are characteris-tic of tholeiitic island arc suites. The range of TiO2 is from0.65 and 0.84, similar to TiO2 values for group III (Table 3).
Interpretation. The group III samples were collectedfrom the Faulkland Gneiss, a unit composed of massiveamphibolites, metasedimentary rocks, and minor felsicrocks. The group IV samples were collected from the WindyHills Gneiss, a unit composed of massive felsic gneisses,amphibolites and minor metasedimentary rocks (Schenck etal., 2000) (Figure 1). Although deformation and recrystal-lization have destroyed most primary textures, the small- andlarge-scale interlayering of amphibolite with supracrustalsand felsic rocks suggests a volcanic origin. The chemistrysuggests the volcanics originated in an island arc setting.
In some outcrops the Windy Hills Gneiss resembles theinterlayered mafic and felsic gneisses of the Rockford ParkGneiss. The geochemistry indicates group IV rocks are notboninitic, however the HFSEs of group IV, as shown on thespider diagrams, are slightly more abundant but similar to thethose of group I (Figure 12B and 5A). It is possible that theyare related, and we are looking at a magmatic continuum.
Group VThe Wilmington Complex is intruded by numerous
deformed and undeformed mafic plutons. Two variablydeformed and metamorphosed mafic plutons, theMontchanin Metagabbro and the Mill Creek Metagabbro,were sampled, analyzed, and assigned to Group V (BCSPand MILLCREEK on Figure 2). As suggested by fieldobservations and petrographic analyses (Table 2), these unitsare in part cumulates, thus the chemical composition of therocks is controlled by cumulate phases and is variable. TheREE patterns show slight enrichment of the LREEs overHREEs (La/Lu ratio 1.4x to 1.6x chondrite) (Table 3),extremely low abundance of REEs (La concentrations 3.7xto 7.3x chondrite), and well defined positive Eu anomalies(Figure 14A) that are most likely due to the accumulation ofplagioclase. The Thompson spider diagrams show depletionin all trace elements, as well as negative Nb anomalies(Figure 15A). TiO2 in the Montchanin sample (BCSP) is low(0.49) similar to other rocks in the Wilmington Complex,while the TiO2 in the Mill Creek sample (MILLCREEK) is
18
higher (1.58) probably due to accumulation of ilmenite andperhaps magnetite (Table 3).
Interpretation. The geochemical analyses confirmfield observations that these units are metagabbros and sug-gests they are in part cumulates. In addition, the spider plotswith negative Nb and Ta anomalies show the accumulatedminerals have preserved some of the characteristics of the arcmagmas from which they evolved (Figure 14).
Group VITwo undeformed and unmetamorphosed mafic plutons
with well-preserved igneous minerals and textures were sam-pled, the Bringhurst Gabbro, BRING, and a thin unde-formed, fine-grained mafic dike exposed near the contactbetween the Brandywine Blue Gneiss and the FaulklandGneiss, WC3 (Smith and Barnes, unpublished report,Pennsylvania Geological Survey, 1994) (Figure 2). REE pat-terns (Figure 14B) are relatively flat similar to those report-ed for plume-enriched mid-ocean ridge basalts (E-MORBs)or backarc-basin basalts (BABBs) (Pearce and Cann, 1973;Smith and Barnes, 1994). The Thompson spider diagramsare flat with pronounced negative Th anomalies (Figure15B). TiO2 contents are high, 2.00 and 2.75 wt. percent(Table 3).
Interpretation. The spider diagrams suggest that themafic dike, WC3, the Bringhurst Gabbro, and possibly theother undeformed dikes and plutons were derived from man-tle sources similar to those for E-MORBS and BABBs. Fieldevidence for intrusion of the group VI magmas into felsicgneisses (Brandywine Blue Gneiss) and for mingling withcoeval granitic magmas (Ardentown Granitic Suite) pre-cludes an origin in a mid-ocean ridge environment; therefore,we conclude the group VI magmas are BABBs associatedwith rifting and extension within the arc. This hypothesis issupported by zircon U-Pb isotopic ages determined for theArdentown Granitic Suite. A slightly discordant U-Pb age of422±6.5 Ma was obtained by Secondary Ion Mass spectrom-eter analysis of zircons from one sample of quartz norite(Bosbyshell et al., 1998), and a more recent age of 434±4 Maobtained by SHRIMP analysis of zircons from a differentsample of quartz norite (John N. Aleinikoff, U. S. GeologicalSurvey, personal communication, 2000). These ages areyounger than the 476±6 Ma age reported by J. N. Aleinikofffor the Brandywine Blue Gneiss and suggests arc formationin the Early Ordovician and arc rifting during the Silurian.This interpretation is consistent with regional-scale heatingand metamorphism of the Ordovician units (428±8 Ma, JohnN. Aleinikoff, U. S. Geological Survey, personal communi-cation, 2000) at about the same time as the crystallization ofthe Arden Plutonic Supersuite.
James Run Formation, Cecil County, MarylandThe rocks of the James Run Formation in Cecil
County, Maryland, are volcanic and volcaniclastic rocks thathave been intruded by numerous mafic and felsic plutons(Southwick and Fisher, 1967; Higgins, 1971, 1977, 1990).All units are at greenschist to amphibolite facies of meta-morphism with preserved volcanic textures. The CecilCounty volcanic rocks and the Wilmington Complex vol-canic rocks (groups IV) are separated at the Delaware-Maryland boundary by a metamorphosed granodioritic plu-ton named the Christianstead Gneiss (Figure 1) (Schenck etal., 2000). Detailed maps, petrographic observations, andgeochemical data for the Cecil County rocks are found in
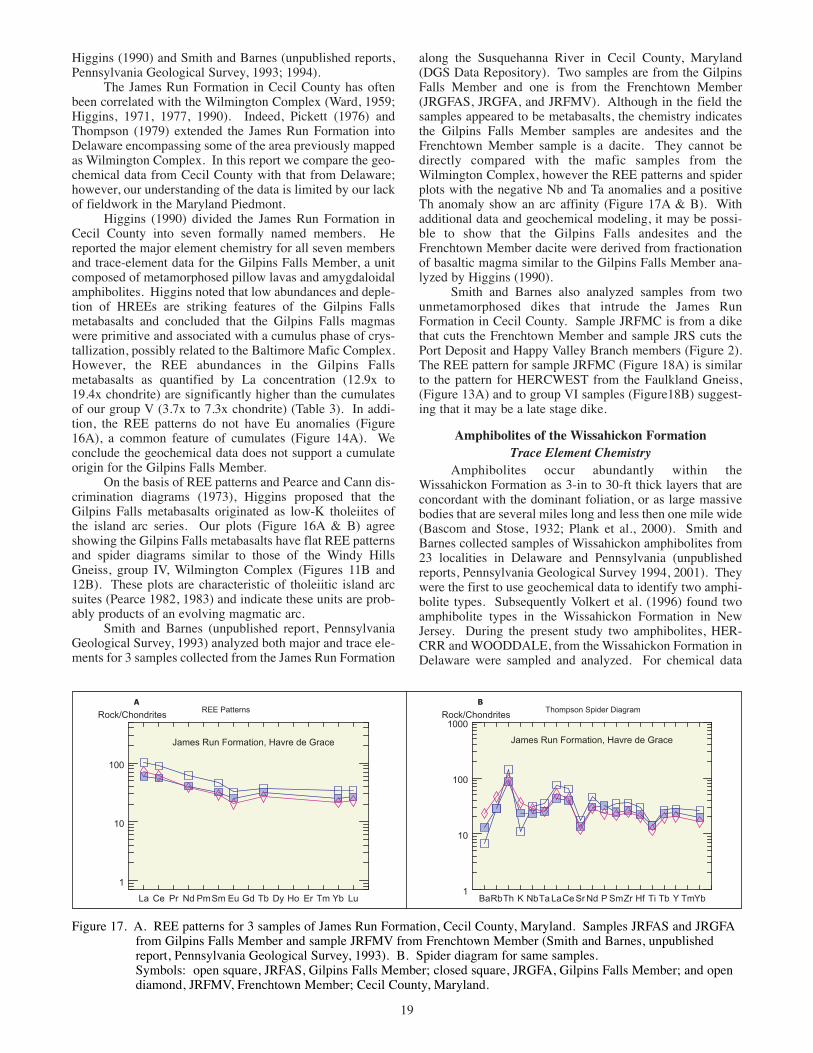
Higgins (1990) and Smith and Barnes (unpublished reports,Pennsylvania Geological Survey, 1993; 1994).
The James Run Formation in Cecil County has oftenbeen correlated with the Wilmington Complex (Ward, 1959;Higgins, 1971, 1977, 1990). Indeed, Pickett (1976) andThompson (1979) extended the James Run Formation intoDelaware encompassing some of the area previously mappedas Wilmington Complex. In this report we compare the geo-chemical data from Cecil County with that from Delaware;however, our understanding of the data is limited by our lackof fieldwork in the Maryland Piedmont.
Higgins (1990) divided the James Run Formation inCecil County into seven formally named members. Hereported the major element chemistry for all seven membersand trace-element data for the Gilpins Falls Member, a unitcomposed of metamorphosed pillow lavas and amygdaloidalamphibolites. Higgins noted that low abundances and deple-tion of HREEs are striking features of the Gilpins Fallsmetabasalts and concluded that the Gilpins Falls magmaswere primitive and associated with a cumulus phase of crys-tallization, possibly related to the Baltimore Mafic Complex.However, the REE abundances in the Gilpins Fallsmetabasalts as quantified by La concentration (12.9x to19.4x chondrite) are significantly higher than the cumulatesof our group V (3.7x to 7.3x chondrite) (Table 3). In addi-tion, the REE patterns do not have Eu anomalies (Figure16A), a common feature of cumulates (Figure 14A). Weconclude the geochemical data does not support a cumulateorigin for the Gilpins Falls Member.
On the basis of REE patterns and Pearce and Cann dis-crimination diagrams (1973), Higgins proposed that theGilpins Falls metabasalts originated as low-K tholeiites ofthe island arc series. Our plots (Figure 16A & B) agreeshowing the Gilpins Falls metabasalts have flat REE patternsand spider diagrams similar to those of the Windy HillsGneiss, group IV, Wilmington Complex (Figures 11B and12B). These plots are characteristic of tholeiitic island arcsuites (Pearce 1982, 1983) and indicate these units are prob-ably products of an evolving magmatic arc.
Smith and Barnes (unpublished report, PennsylvaniaGeological Survey, 1993) analyzed both major and trace ele-ments for 3 samples collected from the James Run Formation
19
along the Susquehanna River in Cecil County, Maryland(DGS Data Repository). Two samples are from the GilpinsFalls Member and one is from the Frenchtown Member(JRGFAS, JRGFA, and JRFMV). Although in the field thesamples appeared to be metabasalts, the chemistry indicatesthe Gilpins Falls Member samples are andesites and theFrenchtown Member sample is a dacite. They cannot bedirectly compared with the mafic samples from theWilmington Complex, however the REE patterns and spiderplots with the negative Nb and Ta anomalies and a positiveTh anomaly show an arc affinity (Figure 17A & B). Withadditional data and geochemical modeling, it may be possi-ble to show that the Gilpins Falls andesites and theFrenchtown Member dacite were derived from fractionationof basaltic magma similar to the Gilpins Falls Member ana-lyzed by Higgins (1990).
Smith and Barnes also analyzed samples from twounmetamorphosed dikes that intrude the James RunFormation in Cecil County. Sample JRFMC is from a dikethat cuts the Frenchtown Member and sample JRS cuts thePort Deposit and Happy Valley Branch members (Figure 2).The REE pattern for sample JRFMC (Figure 18A) is similarto the pattern for HERCWEST from the Faulkland Gneiss,(Figure 13A) and to group VI samples (Figure18B) suggest-ing that it may be a late stage dike.
Amphibolites of the Wissahickon FormationTrace Element Chemistry
Amphibolites occur abundantly within theWissahickon Formation as 3-in to 30-ft thick layers that areconcordant with the dominant foliation, or as large massivebodies that are several miles long and less then one mile wide(Bascom and Stose, 1932; Plank et al., 2000). Smith andBarnes collected samples of Wissahickon amphibolites from23 localities in Delaware and Pennsylvania (unpublishedreports, Pennsylvania Geological Survey 1994, 2001). Theywere the first to use geochemical data to identify two amphi-bolite types. Subsequently Volkert et al. (1996) found twoamphibolite types in the Wissahickon Formation in NewJersey. During the present study two amphibolites, HER-CRR and WOODDALE, from the Wissahickon Formation inDelaware were sampled and analyzed. For chemical data
Figure 17. A. REE patterns for 3 samples of James Run Formation, Cecil County, Maryland. Samples JRFAS and JRGFAfrom Gilpins Falls Member and sample JRFMV from Frenchtown Member (Smith and Barnes, unpublishedreport, Pennsylvania Geological Survey, 1993). B. Spider diagram for same samples.Symbols: open square, JRFAS, Gilpins Falls Member; closed square, JRGFA, Gilpins Falls Member; and opendiamond, JRFMV, Frenchtown Member; Cecil County, Maryland.

and sample locations for the two samples from this studyplus the Smith and Barnes samples see Table 1, Appendix II,and Figure 2.
Type 1 amphibolites, called the Kennett Square amphi-bolites by Smith and Barnes (1994; unpublished report,Pennsylvania Geological Survey, 1994 and 2001), have flatREE patterns with slight LREE depletion or enrichment thatare characteristic of MORBs (Figure 19A). Smith andBarnes correlate the variation with the map pattern and sug-gest that the depletion in the east and enrichment in the westrepresent a transition between normal ocean floor basalts (N-MORB) in the east and plume-enriched ocean floor basalts(E-MORB) in the west. The Thompson spider diagrams fortype 1 Kennett Square amphibolites are variably enriched inLILE and depleted in HFSE (Figure 20A). The lack of botha negative Ta-Nb anomaly and a positive Th anomaly sug-gests an ocean floor affinity (Pearce, 1983).
20
McEwen (1997) determined the major elements andsome trace elements for two Wissahickon amphibolites,Ca34-c from west of Newark (SADDLE, Figure 2), andCb12-c from near Pleasant Hill valley (COTSWOLD, Figure2). For a description of the sample locations, see AppendixII. McEwen reported wt. percent TiO2 and FeO* that are typ-ical of type 1 Kennett Square amphibolites (TiO2 = 0.18 and0.98 wt. percent and FeO* = 1.41 and 3.24 wt. percent)(Table 1). Her analyses indicate that the type 1 KennettSquare amphibolites in the study area are not restricted to thearea south of the Avondale Anticline but occur in other areaswithin the Wissahickon Formation.
Type 2 amphibolites, called the White Clay amphibo-lites by Smith and Barnes (1994), are characterized by highFeO* (12 to 19 wt. percent), moderate to high TiO2 (1.6 to4.75 wt. percent) (Table 1), high overall REE abundances,negatively sloped REE patterns (Figure 19B) and spider dia-
Figure 18. A. REE patterns for samples JRFMC and JRS identified as dikes in James Run Formation, Cecil County,Maryland by R. C. Smith and J. H. Barnes (unpublished report, Pennsylvania Geological Survey, 1993).B. REE patterns of JRFMC and JRS compared to HERCWEST from Faulkland Gneiss, and to BRING andWC-3, Group VI.Symbols: closed triangle, dike cutting Frenchtown Member, sample JRFMC; closed diamond, dike cutting PortDeposit and Happy Valley Branch Member, sample JRS; plus sign, HERCWEST; filled cross, BRING andWC-3, Group VI.
Figure 19. REE diagrams for Wissahickon amphibolites. A. Type 1 (Kennett Square amphibolite). B. Type 2 (WhiteClay amphibolite).Symbols: closed triangle, data from Pennsylvania (Smith and Barnes, 1994); filled square, data from NewJersey (Volkert et al., 1996); open circles, data from Delaware, this study.
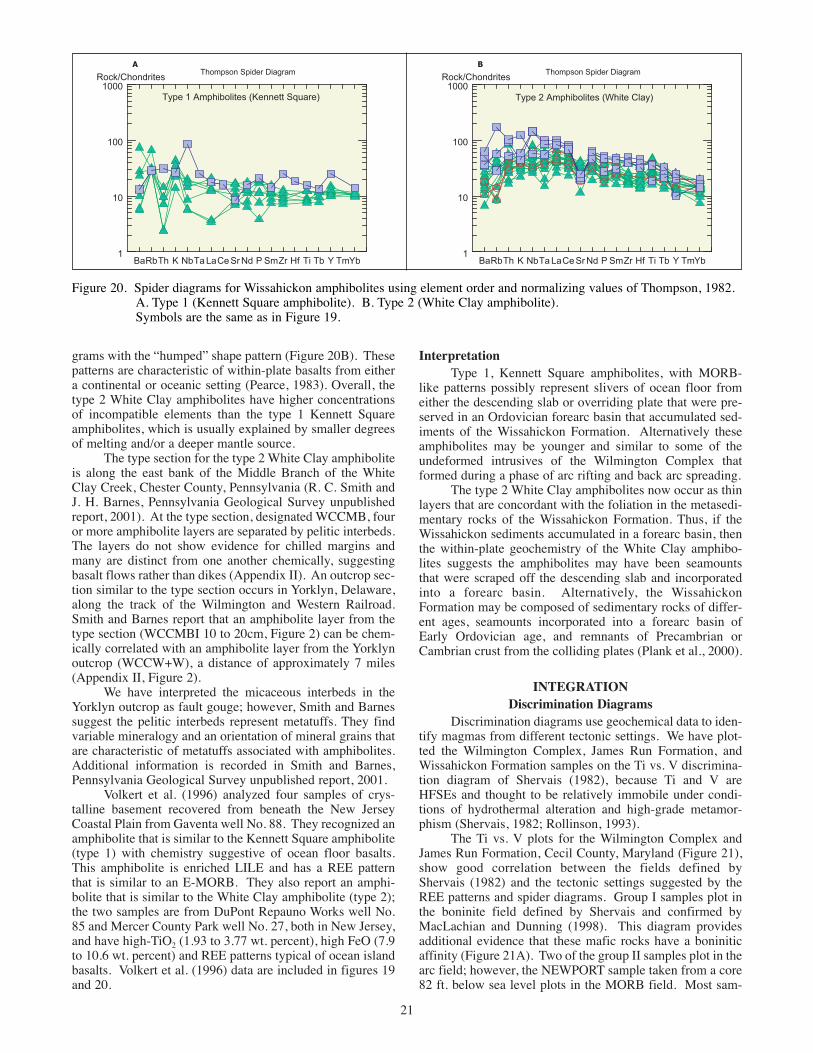
grams with the “humped” shape pattern (Figure 20B). Thesepatterns are characteristic of within-plate basalts from eithera continental or oceanic setting (Pearce, 1983). Overall, thetype 2 White Clay amphibolites have higher concentrationsof incompatible elements than the type 1 Kennett Squareamphibolites, which is usually explained by smaller degreesof melting and/or a deeper mantle source.
The type section for the type 2 White Clay amphiboliteis along the east bank of the Middle Branch of the WhiteClay Creek, Chester County, Pennsylvania (R. C. Smith andJ. H. Barnes, Pennsylvania Geological Survey unpublishedreport, 2001). At the type section, designated WCCMB, fouror more amphibolite layers are separated by pelitic interbeds.The layers do not show evidence for chilled margins andmany are distinct from one another chemically, suggestingbasalt flows rather than dikes (Appendix II). An outcrop sec-tion similar to the type section occurs in Yorklyn, Delaware,along the track of the Wilmington and Western Railroad.Smith and Barnes report that an amphibolite layer from thetype section (WCCMBI 10 to 20cm, Figure 2) can be chem-ically correlated with an amphibolite layer from the Yorklynoutcrop (WCCW+W), a distance of approximately 7 miles(Appendix II, Figure 2).
We have interpreted the micaceous interbeds in theYorklyn outcrop as fault gouge; however, Smith and Barnessuggest the pelitic interbeds represent metatuffs. They findvariable mineralogy and an orientation of mineral grains thatare characteristic of metatuffs associated with amphibolites.Additional information is recorded in Smith and Barnes,Pennsylvania Geological Survey unpublished report, 2001.
Volkert et al. (1996) analyzed four samples of crys-talline basement recovered from beneath the New JerseyCoastal Plain from Gaventa well No. 88. They recognized anamphibolite that is similar to the Kennett Square amphibolite(type 1) with chemistry suggestive of ocean floor basalts.This amphibolite is enriched LILE and has a REE patternthat is similar to an E-MORB. They also report an amphi-bolite that is similar to the White Clay amphibolite (type 2);the two samples are from DuPont Repauno Works well No.85 and Mercer County Park well No. 27, both in New Jersey,and have high-TiO2 (1.93 to 3.77 wt. percent), high FeO (7.9to 10.6 wt. percent) and REE patterns typical of ocean islandbasalts. Volkert et al. (1996) data are included in figures 19and 20.
21
InterpretationType 1, Kennett Square amphibolites, with MORB-
like patterns possibly represent slivers of ocean floor fromeither the descending slab or overriding plate that were pre-served in an Ordovician forearc basin that accumulated sed-iments of the Wissahickon Formation. Alternatively theseamphibolites may be younger and similar to some of theundeformed intrusives of the Wilmington Complex thatformed during a phase of arc rifting and back arc spreading.
The type 2 White Clay amphibolites now occur as thinlayers that are concordant with the foliation in the metasedi-mentary rocks of the Wissahickon Formation. Thus, if theWissahickon sediments accumulated in a forearc basin, thenthe within-plate geochemistry of the White Clay amphibo-lites suggests the amphibolites may have been seamountsthat were scraped off the descending slab and incorporatedinto a forearc basin. Alternatively, the WissahickonFormation may be composed of sedimentary rocks of differ-ent ages, seamounts incorporated into a forearc basin ofEarly Ordovician age, and remnants of Precambrian orCambrian crust from the colliding plates (Plank et al., 2000).
INTEGRATIONDiscrimination Diagrams
Discrimination diagrams use geochemical data to iden-tify magmas from different tectonic settings. We have plot-ted the Wilmington Complex, James Run Formation, andWissahickon Formation samples on the Ti vs. V discrimina-tion diagram of Shervais (1982), because Ti and V areHFSEs and thought to be relatively immobile under condi-tions of hydrothermal alteration and high-grade metamor-phism (Shervais, 1982; Rollinson, 1993).
The Ti vs. V plots for the Wilmington Complex andJames Run Formation, Cecil County, Maryland (Figure 21),show good correlation between the fields defined byShervais (1982) and the tectonic settings suggested by theREE patterns and spider diagrams. Group I samples plot inthe boninite field defined by Shervais and confirmed byMacLachian and Dunning (1998). This diagram providesadditional evidence that these mafic rocks have a boniniticaffinity (Figure 21A). Two of the group II samples plot in thearc field; however, the NEWPORT sample taken from a core82 ft. below sea level plots in the MORB field. Most sam-
Figure 20. Spider diagrams for Wissahickon amphibolites using element order and normalizing values of Thompson, 1982.A. Type 1 (Kennett Square amphibolite). B. Type 2 (White Clay amphibolite).Symbols are the same as in Figure 19.
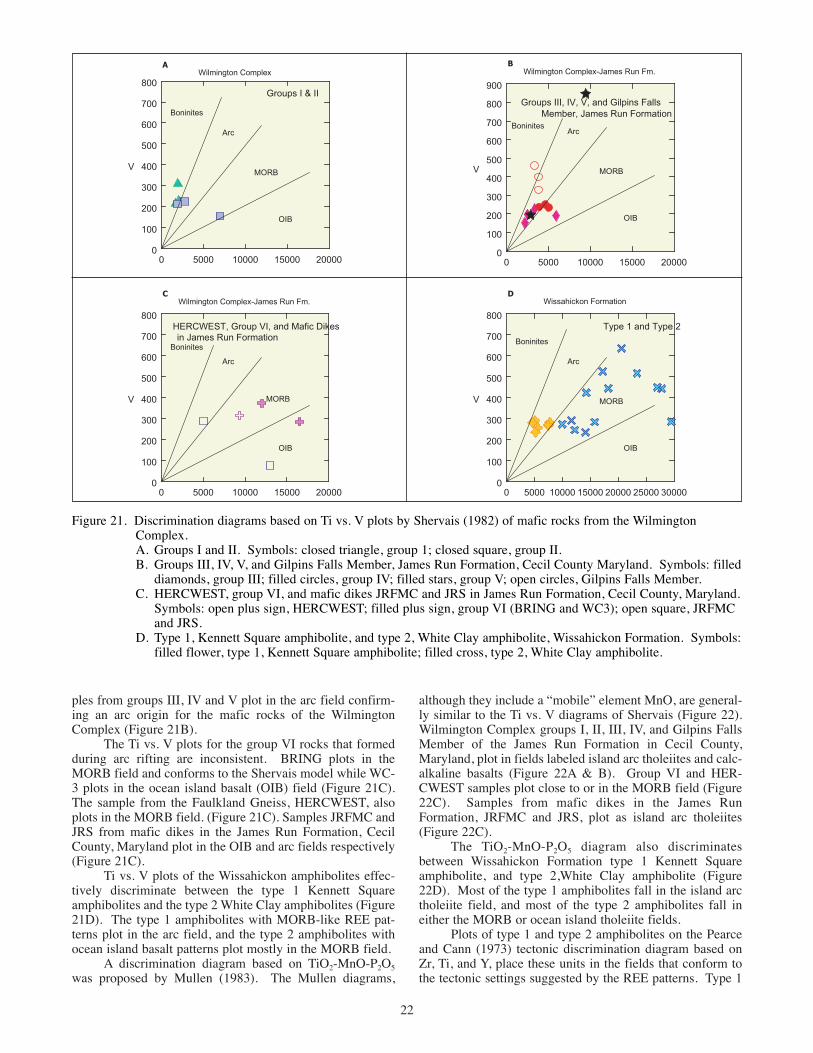
ples from groups III, IV and V plot in the arc field confirm-ing an arc origin for the mafic rocks of the WilmingtonComplex (Figure 21B).
The Ti vs. V plots for the group VI rocks that formedduring arc rifting are inconsistent. BRING plots in theMORB field and conforms to the Shervais model while WC-3 plots in the ocean island basalt (OIB) field (Figure 21C).The sample from the Faulkland Gneiss, HERCWEST, alsoplots in the MORB field. (Figure 21C). Samples JRFMC andJRS from mafic dikes in the James Run Formation, CecilCounty, Maryland plot in the OIB and arc fields respectively(Figure 21C).
Ti vs. V plots of the Wissahickon amphibolites effec-tively discriminate between the type 1 Kennett Squareamphibolites and the type 2 White Clay amphibolites (Figure21D). The type 1 amphibolites with MORB-like REE pat-terns plot in the arc field, and the type 2 amphibolites withocean island basalt patterns plot mostly in the MORB field.
A discrimination diagram based on TiO2-MnO-P2O5
was proposed by Mullen (1983). The Mullen diagrams,
22
although they include a “mobile” element MnO, are general-ly similar to the Ti vs. V diagrams of Shervais (Figure 22).Wilmington Complex groups I, II, III, IV, and Gilpins FallsMember of the James Run Formation in Cecil County,Maryland, plot in fields labeled island arc tholeiites and calc-alkaline basalts (Figure 22A & B). Group VI and HER-CWEST samples plot close to or in the MORB field (Figure22C). Samples from mafic dikes in the James RunFormation, JRFMC and JRS, plot as island arc tholeiites(Figure 22C).
The TiO2-MnO-P2O5 diagram also discriminatesbetween Wissahickon Formation type 1 Kennett Squareamphibolite, and type 2,White Clay amphibolite (Figure22D). Most of the type 1 amphibolites fall in the island arctholeiite field, and most of the type 2 amphibolites fall ineither the MORB or ocean island tholeiite fields.
Plots of type 1 and type 2 amphibolites on the Pearceand Cann (1973) tectonic discrimination diagram based onZr, Ti, and Y, place these units in the fields that conform tothe tectonic settings suggested by the REE patterns. Type 1
Figure 21. Discrimination diagrams based on Ti vs. V plots by Shervais (1982) of mafic rocks from the WilmingtonComplex.A. Groups I and II. Symbols: closed triangle, group 1; closed square, group II.B. Groups III, IV, V, and Gilpins Falls Member, James Run Formation, Cecil County Maryland. Symbols: filled
diamonds, group III; filled circles, group IV; filled stars, group V; open circles, Gilpins Falls Member.C. HERCWEST, group VI, and mafic dikes JRFMC and JRS in James Run Formation, Cecil County, Maryland.
Symbols: open plus sign, HERCWEST; filled plus sign, group VI (BRING and WC3); open square, JRFMCand JRS.
D. Type 1, Kennett Square amphibolite, and type 2, White Clay amphibolite, Wissahickon Formation. Symbols:filled flower, type 1, Kennett Square amphibolite; filled cross, type 2, White Clay amphibolite.
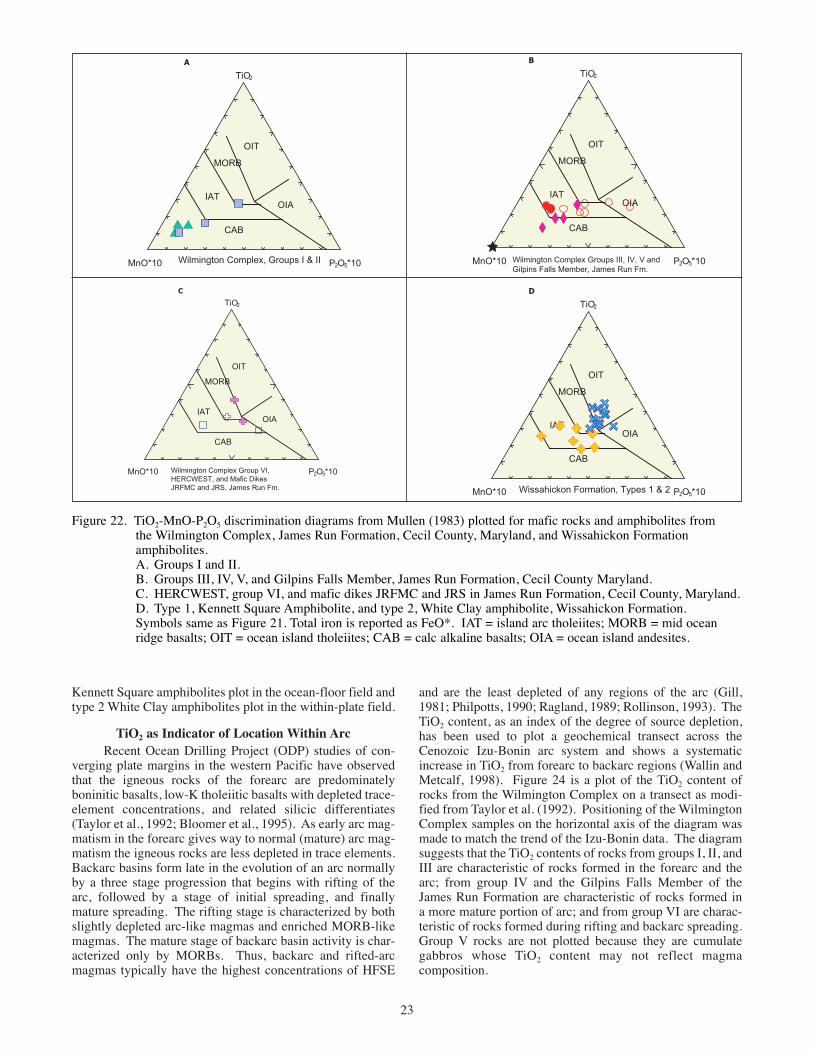
Kennett Square amphibolites plot in the ocean-floor field andtype 2 White Clay amphibolites plot in the within-plate field.
TiO2 as Indicator of Location Within ArcRecent Ocean Drilling Project (ODP) studies of con-
verging plate margins in the western Pacific have observedthat the igneous rocks of the forearc are predominatelyboninitic basalts, low-K tholeiitic basalts with depleted trace-element concentrations, and related silicic differentiates(Taylor et al., 1992; Bloomer et al., 1995). As early arc mag-matism in the forearc gives way to normal (mature) arc mag-matism the igneous rocks are less depleted in trace elements.Backarc basins form late in the evolution of an arc normallyby a three stage progression that begins with rifting of thearc, followed by a stage of initial spreading, and finallymature spreading. The rifting stage is characterized by bothslightly depleted arc-like magmas and enriched MORB-likemagmas. The mature stage of backarc basin activity is char-acterized only by MORBs. Thus, backarc and rifted-arcmagmas typically have the highest concentrations of HFSE
23
and are the least depleted of any regions of the arc (Gill,1981; Philpotts, 1990; Ragland, 1989; Rollinson, 1993). TheTiO2 content, as an index of the degree of source depletion,has been used to plot a geochemical transect across theCenozoic Izu-Bonin arc system and shows a systematicincrease in TiO2 from forearc to backarc regions (Wallin andMetcalf, 1998). Figure 24 is a plot of the TiO2 content ofrocks from the Wilmington Complex on a transect as modi-fied from Taylor et al. (1992). Positioning of the WilmingtonComplex samples on the horizontal axis of the diagram wasmade to match the trend of the Izu-Bonin data. The diagramsuggests that the TiO2 contents of rocks from groups I, II, andIII are characteristic of rocks formed in the forearc and thearc; from group IV and the Gilpins Falls Member of theJames Run Formation are characteristic of rocks formed ina more mature portion of arc; and from group VI are charac-teristic of rocks formed during rifting and backarc spreading.Group V rocks are not plotted because they are cumulategabbros whose TiO2 content may not reflect magmacomposition.
Figure 22. TiO2-MnO-P2O5 discrimination diagrams from Mullen (1983) plotted for mafic rocks and amphibolites fromthe Wilmington Complex, James Run Formation, Cecil County, Maryland, and Wissahickon Formationamphibolites. A. Groups I and II.B. Groups III, IV, V, and Gilpins Falls Member, James Run Formation, Cecil County Maryland.C. HERCWEST, group VI, and mafic dikes JRFMC and JRS in James Run Formation, Cecil County, Maryland.D. Type 1, Kennett Square Amphibolite, and type 2, White Clay amphibolite, Wissahickon Formation.Symbols same as Figure 21. Total iron is reported as FeO*. IAT = island arc tholeiites; MORB = mid oceanridge basalts; OIT = ocean island tholeiites; CAB = calc alkaline basalts; OIA = ocean island andesites.
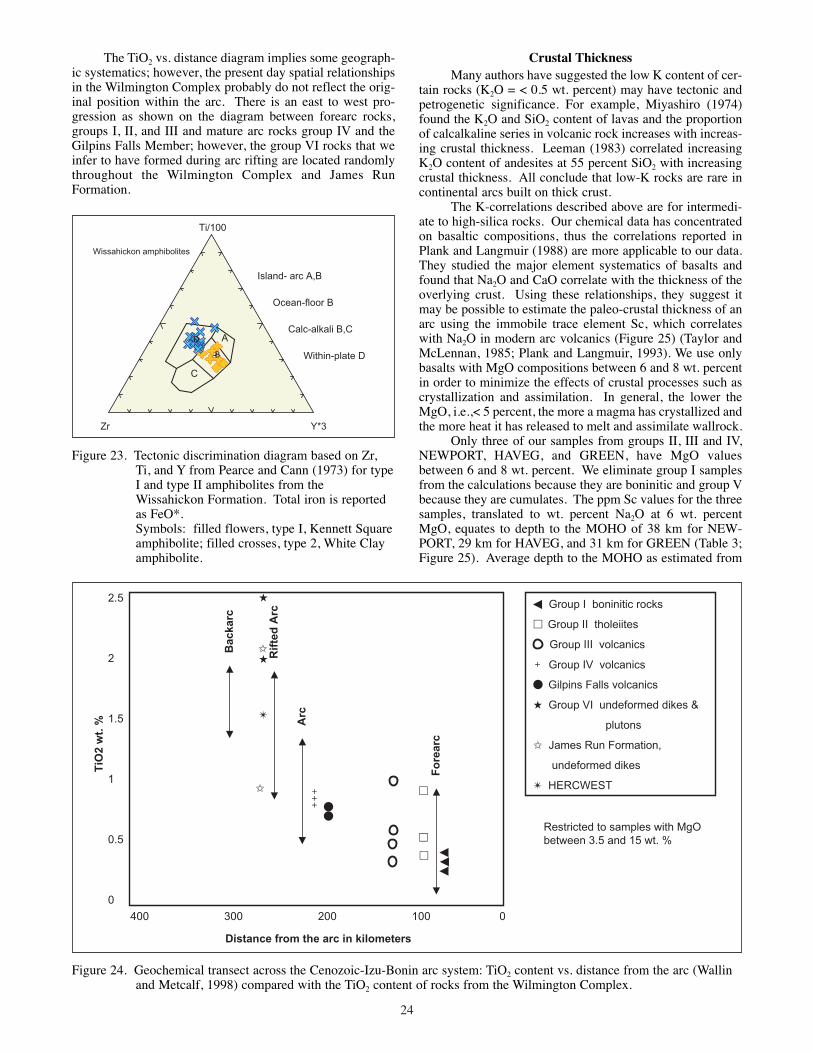
24
Figure 23. Tectonic discrimination diagram based on Zr,Ti, and Y from Pearce and Cann (1973) for typeI and type II amphibolites from theWissahickon Formation. Total iron is reportedas FeO*.Symbols: filled flowers, type I, Kennett Squareamphibolite; filled crosses, type 2, White Clayamphibolite.
Group I boninitic rocks
Group II tholeiites
Group III volcanics
Group IV volcanics
Gilpins Falls volcanics
� Group VI undeformed dikes &
plutons
✩ James Run Formation,
undeformed dikes
✴ HERCWEST
Restricted to samples with MgObetween 3.5 and 15 wt. %
Bac
karc
Rif
ted
Arc
Arc
Fo
rear
c
2.5
2
1.5
1
0.5
0
400 300 200 100 0
Distance from the arc in kilometers
TiO
2 w
t. %
✴
+++
��
�
�
✩
✩
�
□
□
□
□ ���
+�
Figure 24. Geochemical transect across the Cenozoic-Izu-Bonin arc system: TiO2 content vs. distance from the arc (Wallinand Metcalf, 1998) compared with the TiO2 content of rocks from the Wilmington Complex.
The TiO2 vs. distance diagram implies some geograph-ic systematics; however, the present day spatial relationshipsin the Wilmington Complex probably do not reflect the orig-inal position within the arc. There is an east to west pro-gression as shown on the diagram between forearc rocks,groups I, II, and III and mature arc rocks group IV and theGilpins Falls Member; however, the group VI rocks that weinfer to have formed during arc rifting are located randomlythroughout the Wilmington Complex and James RunFormation.
Crustal ThicknessMany authors have suggested the low K content of cer-
tain rocks (K2O = < 0.5 wt. percent) may have tectonic andpetrogenetic significance. For example, Miyashiro (1974)found the K2O and SiO2 content of lavas and the proportionof calcalkaline series in volcanic rock increases with increas-ing crustal thickness. Leeman (1983) correlated increasingK2O content of andesites at 55 percent SiO2 with increasingcrustal thickness. All conclude that low-K rocks are rare incontinental arcs built on thick crust.
The K-correlations described above are for intermedi-ate to high-silica rocks. Our chemical data has concentratedon basaltic compositions, thus the correlations reported inPlank and Langmuir (1988) are more applicable to our data.They studied the major element systematics of basalts andfound that Na2O and CaO correlate with the thickness of theoverlying crust. Using these relationships, they suggest itmay be possible to estimate the paleo-crustal thickness of anarc using the immobile trace element Sc, which correlateswith Na2O in modern arc volcanics (Figure 25) (Taylor andMcLennan, 1985; Plank and Langmuir, 1993). We use onlybasalts with MgO compositions between 6 and 8 wt. percentin order to minimize the effects of crustal processes such ascrystallization and assimilation. In general, the lower theMgO, i.e.,< 5 percent, the more a magma has crystallized andthe more heat it has released to melt and assimilate wallrock.
Only three of our samples from groups II, III and IV,NEWPORT, HAVEG, and GREEN, have MgO valuesbetween 6 and 8 wt. percent. We eliminate group I samplesfrom the calculations because they are boninitic and group Vbecause they are cumulates. The ppm Sc values for the threesamples, translated to wt. percent Na2O at 6 wt. percentMgO, equates to depth to the MOHO of 38 km for NEW-PORT, 29 km for HAVEG, and 31 km for GREEN (Table 3;Figure 25). Average depth to the MOHO as estimated from
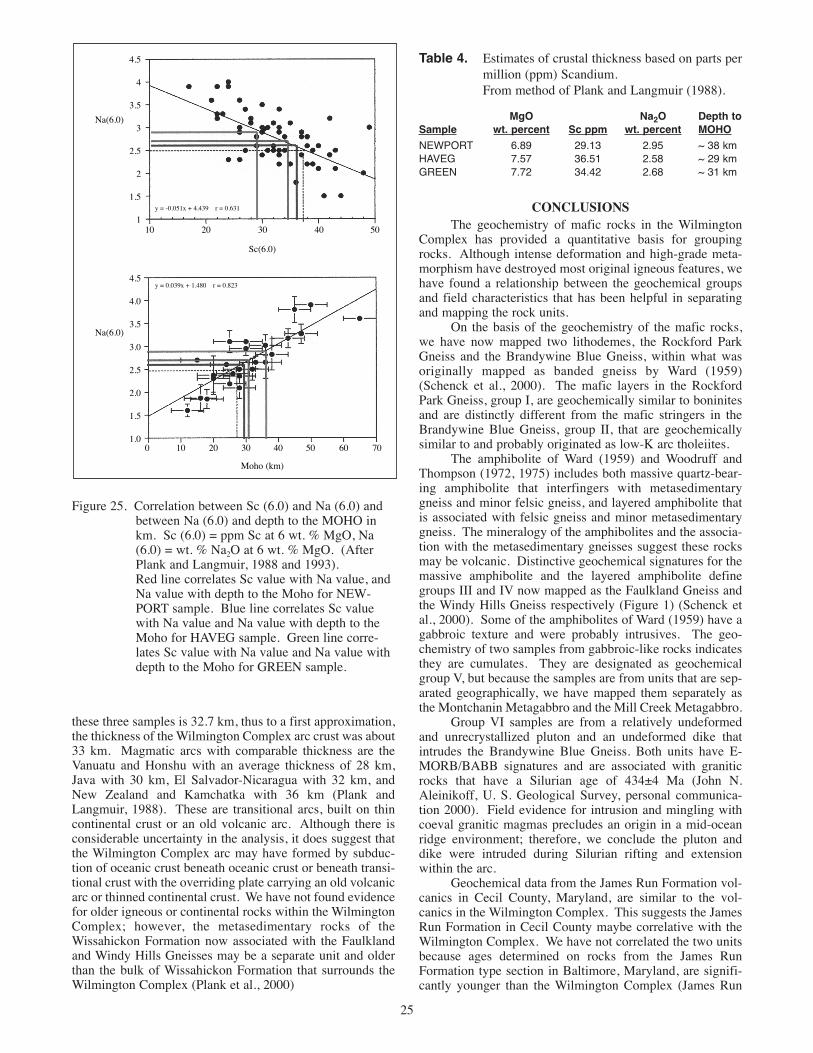
these three samples is 32.7 km, thus to a first approximation,the thickness of the Wilmington Complex arc crust was about33 km. Magmatic arcs with comparable thickness are theVanuatu and Honshu with an average thickness of 28 km,Java with 30 km, El Salvador-Nicaragua with 32 km, andNew Zealand and Kamchatka with 36 km (Plank andLangmuir, 1988). These are transitional arcs, built on thincontinental crust or an old volcanic arc. Although there isconsiderable uncertainty in the analysis, it does suggest thatthe Wilmington Complex arc may have formed by subduc-tion of oceanic crust beneath oceanic crust or beneath transi-tional crust with the overriding plate carrying an old volcanicarc or thinned continental crust. We have not found evidencefor older igneous or continental rocks within the WilmingtonComplex; however, the metasedimentary rocks of theWissahickon Formation now associated with the Faulklandand Windy Hills Gneisses may be a separate unit and olderthan the bulk of Wissahickon Formation that surrounds theWilmington Complex (Plank et al., 2000)
25
Table 4. Estimates of crustal thickness based on parts permillion (ppm) Scandium.From method of Plank and Langmuir (1988).
MgO Na2O Depth toSample wt. percent Sc ppm wt. percent MOHO
NEWPORT 6.89 29.13 2.95 ~ 38 kmHAVEG 7.57 36.51 2.58 ~ 29 kmGREEN 7.72 34.42 2.68 ~ 31 km
CONCLUSIONSThe geochemistry of mafic rocks in the Wilmington
Complex has provided a quantitative basis for groupingrocks. Although intense deformation and high-grade meta-morphism have destroyed most original igneous features, wehave found a relationship between the geochemical groupsand field characteristics that has been helpful in separatingand mapping the rock units.
On the basis of the geochemistry of the mafic rocks,we have now mapped two lithodemes, the Rockford ParkGneiss and the Brandywine Blue Gneiss, within what wasoriginally mapped as banded gneiss by Ward (1959)(Schenck et al., 2000). The mafic layers in the RockfordPark Gneiss, group I, are geochemically similar to boninitesand are distinctly different from the mafic stringers in theBrandywine Blue Gneiss, group II, that are geochemicallysimilar to and probably originated as low-K arc tholeiites.
The amphibolite of Ward (1959) and Woodruff andThompson (1972, 1975) includes both massive quartz-bear-ing amphibolite that interfingers with metasedimentarygneiss and minor felsic gneiss, and layered amphibolite thatis associated with felsic gneiss and minor metasedimentarygneiss. The mineralogy of the amphibolites and the associa-tion with the metasedimentary gneisses suggest these rocksmay be volcanic. Distinctive geochemical signatures for themassive amphibolite and the layered amphibolite definegroups III and IV now mapped as the Faulkland Gneiss andthe Windy Hills Gneiss respectively (Figure 1) (Schenck etal., 2000). Some of the amphibolites of Ward (1959) have agabbroic texture and were probably intrusives. The geo-chemistry of two samples from gabbroic-like rocks indicatesthey are cumulates. They are designated as geochemicalgroup V, but because the samples are from units that are sep-arated geographically, we have mapped them separately asthe Montchanin Metagabbro and the Mill Creek Metagabbro.
Group VI samples are from a relatively undeformedand unrecrystallized pluton and an undeformed dike thatintrudes the Brandywine Blue Gneiss. Both units have E-MORB/BABB signatures and are associated with graniticrocks that have a Silurian age of 434±4 Ma (John N.Aleinikoff, U. S. Geological Survey, personal communica-tion 2000). Field evidence for intrusion and mingling withcoeval granitic magmas precludes an origin in a mid-oceanridge environment; therefore, we conclude the pluton anddike were intruded during Silurian rifting and extensionwithin the arc.
Geochemical data from the James Run Formation vol-canics in Cecil County, Maryland, are similar to the vol-canics in the Wilmington Complex. This suggests the JamesRun Formation in Cecil County maybe correlative with theWilmington Complex. We have not correlated the two unitsbecause ages determined on rocks from the James RunFormation type section in Baltimore, Maryland, are signifi-cantly younger than the Wilmington Complex (James Run
Figure 25. Correlation between Sc (6.0) and Na (6.0) andbetween Na (6.0) and depth to the MOHO inkm. Sc (6.0) = ppm Sc at 6 wt. % MgO, Na(6.0) = wt. % Na2O at 6 wt. % MgO. (AfterPlank and Langmuir, 1988 and 1993).Red line correlates Sc value with Na value, andNa value with depth to the Moho for NEW-PORT sample. Blue line correlates Sc valuewith Na value and Na value with depth to theMoho for HAVEG sample. Green line corre-lates Sc value with Na value and Na value withdepth to the Moho for GREEN sample.
4.5
4
3.5
3
2.5
2
1.5
1
4.5
4.0
3.5
3.0
2.5
2.0
1.5
1.0
y = -0.051x + 4.439 r = 0.631
y = 0.039x + 1.480 r = 0.823
Na(6.0)
Na(6.0)
Sc(6.0)
Moho (km)
10 20 30 40 50
0 10 20 30 40 50 60 70

Formation in Baltimore, 454±5 to 464±5 Ma, Horton et al.,1998, compared to 481±4 and 482±4 Ma for the Windy HillsGneiss and the Faulkland Gneiss in Delaware, John N.Aleinikoff, U. S. Geological Survey, personal communica-tion, 2000).
Geochemical analyses of mafic rocks within theWilmington Complex and the Wissahickon Formation indi-cate the rocks formed in an evolving magmatic arc at a con-verging margin. We suggest a forearc setting for theRockford Park Gneiss and the Brandywine Blue Gneiss pri-marily because modern boninites have only been found insitu in forearcs, and as a general rule low-K tholeiitic rocksoccur in island arcs on the outward side near the trench(Ragland, 1989; Gill, 1981; Philpotts, 1990). On the basis ofthe field relationships of the Wissahickon Formation with theWilmington Complex such as interlayering and xenoliths ofWissahickon in Wilmington Complex metaplutons, we sug-gest that some of the metasediments of the WissahickonFormation may also have been deposited in a forearc basin.This forearc model is consistent with the observations thatmodern forearcs such as the Izu-Bonin-Mariana forearc dis-play considerable complexity consisting of volcanic flows(including boninites), pillow lavas, dikes, plutonic rocks,sediments, and serpentinized peridotite (Bloomer et al.,1995).
The chemical analyses of the volcanic rocks of GroupIII and IV, now the Windy Hills Gneiss and the FaulklandGneiss, constrain these rocks to an arc setting.
The undeformed dikes and plutons with MORB-likechemistry that intrude the Brandywine Blue Gneiss, pluspossibly the Wissahickon Formation type 1 Kennett Squareamphibolite formed during a phase of arc rifting and back arcspreading.
Recognizing that the geochemistry of the mafic rocksof the Wilmington Complex indicates a forearc-arc-backarcmodel confirms the long-held belief of Ward (1959),Thompson (1979), Crawford and Crawford (1980), Wagnerand Srogi (1987) and others that the Wilmington Complexrepresents the remnant of an evolving magmatic arc.
26
REFERENCES CITED
Badger, R. L., 1993, Fluid interaction and geochemical mobility inmetabasalts: An example from the central Appalachians:Journal of Geology, v. 101, p. 85-96.
Bascom, F., 1902, The geology of the crystalline rocks of CecilCounty: Maryland Geological Survey, Cecil County Report,p. 83-148.
Bascom, F., and Stose, G. W., 1932, Description of the Coatesvilleand West Chester quadrangles, Coatesville-West Chester Folio:U. S. Geological Survey Geologic Atlas of the United States,Folio 223, 15 p. with maps, scale 1:62,500.
Bloomer, S. H., Taylor, B., MacLeod, C. J., Stern, R. J., Fryer, P.,Hawkins, J. W., and Johnson, L. E., 1995, Early arc volcanismand the ophiolite problem: A perspective from drilling in thewestern Pacific, in Taylor, B. and Natland, J., eds., Active mar-gins and marginal basins of the western Pacific: GeophysicalMonograph 88, American Geophysical Union, p. 1-30.
Bosbyshell, H., Crawford, M. L., and Srogi, L., 1999, Distributionof overprinting metamorphic mineral assemblages in theWissahickon Group, southeastern Pennsylvania, in Valentino,D. W., and Gates, A. E., eds., The mid-Atlantic Piedmont:Tectonic missing link of the Appalachians: Boulder, Colorado,Geological Society of America Special Paper 330, p. 41-58.
Bosbyshell, H., Sinha, A. K., Crawford, M. L., Fleming, P., Srogi,L., Lutz, T. M., 1998, Thermal evolution of a convergent oro-gen: New U/Pb ages of monazite and zircon from the centralAppalachian Piedmont; Geological Society of AmericaAbstracts with Programs, Annual Meeting and Exposition,Toronto, Canada, p. 68.
Carr, M., 1988, Igpet32 for Win95/NT: Terra Softa Inc.,Somerset, NJ.
Chace, R. J., 1995, The chemistry and origin of the Ordovician (?)amphibolites of the Wilmington Complex along Red ClayCreek, Delaware: Bryn Mawr, Pennsylvania, Bryn MawrCollege, unpublished senior thesis, 41 p.
Crawford, M. L., and Crawford, W. A., 1980, Metamorphic and tec-tonic history of the Pennsylvania Piedmont: GeologicalSociety of London Journal, v. 137, p. 311-320.
Crawford, A. J., Falloon, T. J., and Green, D. G., 1989,Classification, petrogenesis and tectonic setting of boninites, inCrawford, A. J., editor, Boninites: Unwin Hyman, London,p. 1-49.
Coish, R. A., 1989, Boninitic lavas in Appalachian ophiolites: Areview, in Crawford, A. J., ed., Boninites: London, UnwinHyman, p. 264-287.
Gill, J. B, 1981, Orogenic andesites and plate tectonics: Springer-Verlag, Berlin, 390 p.
Govindaraju, K., 1994, Compliance of working value and sampledesignation for 383 geostandards: Geostandards News Letter,v. 18, p. 1-158.
Gust, D. A., Arculus, R. J., Kersting, A. B., 1997, Aspects of magmasources and processes in the Honshu Arc: The CanadianMineralogist, v. 35, p. 347-365.
Hager, G. M., 1976, Petrologic and structural relations of the crys-talline rocks in the Hoopes Reservoir area, Delaware: Newark,Delaware, University of Delaware, unpublished Masters thesis,79 p.
Hashiguchi, H., Yamada, R., and Inoue, T., 1983, Practical applica-tion of low Na2O anomalies in footwall acid lava for delimit-ing promising areas around the Kosaka and Fukazawa Kurokodeposits, Akita Prefectural, Japan, in Ohmoto, H., and Skinner,B. J., eds., The Kuroko massive sulfide deposits: EconomicGeology, Monograph 5, p. 387-394.
Hawkins, J. W., Bloomer, S. H., Evans, C. A., and Melchior, J. T.,1984, Evolution of intra-oceanic arc-trench systems:Tectonophysics, v. 102, p.175-205.
Hickey, R. L., and Frey, F. A., 1982, Geochemical characteristics ofboninite series volcanics: Implications for their source:Geochimica et Cosmochemica Acta, v. 46, p. 2099-2115.
Higgins, M. W., 1971, Depth of emplacement of the James RunFormation pillow basalts, and depth of deposition of part of theWissahickon Formation, Appalachian Piedmont, Maryland:American Journal of Science, p. 321-332.
1972, Age, origin, regional relations, and nomenclatureof the Glenarm Series, central Appalachian Piedmont: A rein-terpretation: Geological Society of America Bulletin, v. 83, p.989-1026.
1977, Six new members of the James Run Formation,Cecil County, northeastern Maryland, in Sohl, N. F., andWright, W. B., Changes in stratigraphic nomenclature by the U.S. Geological Survey, 1976: U.S. Geological Survey Bulletin1435-A, P. A122-A127.
1990, The crystalline rocks of Cecil County, Maryland,in The geology of Cecil County, Maryland: MarylandGeological Survey Bulletin 37, p. 3-116
Horton, J. W., Jr., Aleinikoff, J. N., Drake, A. A., Jr., and Fanning,C. J., 1998, Significance of Middle to Late Ordovician vol-canic-arc rocks in the central Appalachian Piedmont, Marylandand Virginia: Geological Society of America Abstracts withPrograms, v. 30, p. 125.
Irvine, T. N. and Barager, W. R. A., 1971, A guide to the chemicalclassification of the common volcanic rocks: Canadian Journalof Earth Science, v. 8, p 523-548.
Johnson, M. S., and Plank, T. A., 1999, Dehydration and meltingexperiments constrain the fate of subducted sediments,Geochemistry, Geophysics and Geosystems,1:1999GC000014, http://gcubed.magnet.fsu.edu/
Kim, J., and Jacobi, R. D., 1996, Geochemistry and tectonic impli-cations of Hawley Formation meta-igneous units: AmericanJournal of Science, v. 296, p. 1126-1174.
Le Bas, M. J., Le Maitre, R. W., Streckeisen, A., and Zanettin, B.,1986, A chemical classification of volcanic rocks based on thetotal alkali-silica diagram: Journal of Petrology, v. 27,p. 745-750.
Leeman, W. P., 1983, The influence of crustal structure on compo-sitions of subducted-related magmas: Journal of Volcanologyand Geothermal Research, v. 18, p. 561-588.
MacLachian, K., and Dunning, G., 1998, U-Pb ages and tectono-magmatic relationships of early Ordovician low-Ti tholeiites,boninites and related plutonic rocks in central Newfoundland,Canada: Contributions to Mineralogy and Petrology, v. 133,p. 235-258.
McEwen, M. M., 1997, The chemistry and origin of amphibolites ofthe James Run Formation in Delaware: Bryn Mawr,Pennsylvania, Bryn Mawr College, unpublished senior thesis,44 p.
27
Miller, D. M., Langmuir, C. H., Goldstein, S. L., and Franks, A. L.,1992, The importance of parental magma composition to calc-alkaline and tholeiitic evolution: Evidence from Umnak Islandin the Aleutians: Journal of Geophysical Research, v. 97,p. 321-343.
Miyashiro, A., 1974, Volcanic rock series in island arcs and activecontinental margins: American Journal of Science, v. 274,p. 321-355.
Mullen, E. D., 1983, MnO/TiO2/P2O5: A minor element discrimi-nant for basaltic rocks of oceanic environments and its impli-cations for petrogenesis: Earth and Planetary Science Letters, v.62, p. 53-62.
Pearce, J. A., 1982, Trace element characteristics of lavas fromdestructive plate boundaries, in Thorpe, R. S., ed., Andesites:New York, John Wiley and Sons, p. 525-548.
Pearce, J. A., 1983, Role of the sub-continental lithosphere inmagma genesis at active continental margins, in Hawkesworth,C. J. and Norry, M. J., eds., Continental basalts and mantlexenoliths: Shiva Publishers, Nantwich, United Kingdom,p. 230-249.
Pearce, J. A., and Cann, J. R., 1973, Tectonic setting of basic vol-canic rocks determined using trace element analysis: Earth andPlanetary Science Letters, v. 19, p. 290-300.
Pearce, J. A., van der Laan, S. R., Arculus, R. J., Murton, B. J., Ishii,T., Peate, D. W., and Parkinson, I. J., 1992, Boninite andharzbergite from Leg 125 (Bonin-Mariana forearc): A casestudy of magma genesis during the initial stages of subduction,in Proceedings ODP, Scientific Results, 125, Ocean DrillingProgram, College Station, Texas, p. 623-662.
Peccerillo, A. and Taylor, S. R., 1976, Geochemistry of Eocenecalc-alkaline volcanic rocks from the Kastamonu area, northernTurkey: Contributions to Mineralogy and Petrology, v. 58,p. 63-81.
Philpotts, A. R., 1990, Principles of igneous and metamorphicpetrology: Prentice Hall, Englewood Cliffs, New Jersey, 498 p.
Pickett, T. E., 1976, Generalized geologic map of Delaware(Revised): Delaware Geological Survey Special Publication 9,scale 1:633,600.
Plank, M. O., Schenck, W. S., and Srogi, L., 2000, Bedrock geolo-gy of the Piedmont of Delaware and adjacent Pennsylvania:Delaware Geological Survey Report of Investigations No. 59,52p.
Plank, T. A., 1996, The brine of the Earth: Nature, v. 380, p. 202-203.
Plank, T. A., and Langmuir, C. H., 1993, Tracing trace elementsfrom sediment input to volcanic output at subduction zones:Nature, v. 362, p. 739-742.
1988, An evaluation of the global variations in themajor element chemistry of arc basalts: Earth and PlanetaryScience Letters, v. 90, p. 349-370.
Ragland, P. C., 1989, Basic analytical petrology: Oxford UniversityPress, New York, 369 p.
Rollinson, H. R., 1993, Using geochemical data: Evaluation,presentation, interpretation: Longman Group UK Ltd., 352 p.
Schenck, W. S., 1997, Stratigraphic classification and nomenclatureof the rocks in the Delaware Piedmont: Newark, Delaware,University of Delaware, unpublished Masters thesis,106 p.
Schenck, W. S., and Plank, M. O., 1995, Data report on rock coresfrom Red Mill Road, Harmony Road, Prices Corner, andNewport, Delaware: Delaware Geological Survey Open FileReport No. 38, 42 p.
Schenck, W. S., Plank, M. O., and Srogi, L., 2000, Bedrock geo-logic map of the Piedmont of Delaware and adjacentPennsylvania: Delaware Geological Survey Geologic MapSeries No. 10, scale 1:36,000.
Shervais, J. W., 1982, Ti-V plots and the petrogenesis of modernand ophiolitic lavas: Earth and Planetary Science Letters, v. 57,p.101-118.
Shervais, J. W., Shelley, S. A., and Secor, D. T., 1996, Geochemistryof volcanic rocks of the Carolina and Augusta terranes incentral South Carolina: An exotic rifted volcanic arc?, inNance, R. D., and Thompson, M. D., eds., Avalonian andRelated Peri-Gondwanan terranes of the Circum-NorthAtlantic: Boulder, Colorado, Geological Society of AmericaSpecial Paper 304, p. 219-236.
Smith, R. C., and Barnes, J. H., 1994, Geochemistry and geology ofmetabasalt in southeastern Pennsylvania and adjacentMaryland, in Faill, R. T., and Sevon, W. D., eds., Variousaspects of Piedmont geology in Lancaster and Chester counties,Pennsylvania: Harrisburg, Pennsylvania, Guidebook for the59th Annual Field Conference of Pennsylvania Geologists,p. 45-72.
Southwick, D. L., and Fisher, G. W., 1967, Revision of the strati-graphic nomenclature of the Glenarm Series in Maryland:Maryland Geological Survey Report of Investigations No. 6,19 p.
Srogi, L., 1988, The petrogenesis of the igneous and metamorphicrocks in the Wilmington Complex, Pennsylvania-DelawarePiedmont: Philadelphia, Pennsylvania, University ofPennsylvania, unpublished Ph.D. thesis, 613 p.
Stern, R. J., and Bloomer, S. H., 1992, Subduction zone infancy:Examples from the Eocene Izu-Bonin-Mariana and JurassicCalifornia arcs: Geological Society of America Bulletin, v. 104,p. 1621-1636.
Stern, R. J., Morris, J., Bloomer, S. H., and Hawkins, J. W., 1991,The source of the subduction component in convergent marginmagmas: Trace element and radiogenic isotope evidence fromEocene boninites, Mariana forearc: Geochimica etCosmochimica Acta, v. 55, p. 1467-1481.
Sun, S.-S., and McDonough, W. F., 1989, Chemical and isotopicsystematics of oceanic basalts: Implications for mantle compo-sition and processes, in Saunders, A. D., and Norry, M. J., eds.,Magmatism in the ocean basins: London, England, GeologicalSociety of London Special Publication 42, p. 313-345.
Taylor, R. N., Murton, B. J., and Nesbitt, R. W., 1992, Chemicaltransects across intra-oceanic arcs: Implications for the tecton-ic setting of ophiolites: Geological Society London SpecialPublication 60, p. 117-132.
Taylor, S. R., McLennan, S. M., 1985, The continental crust:Its composition and evolution: Oxford, Blackwell Scientific,312 p.
Thompson, A. M., 1979, A summary of the geology of the Piedmontin Delaware, in Kraft, J. C., and Carey, W., eds., Selectedpapers on the geology of Delaware: Transactions of theDelaware Academy of Science, v. 7, p. 115-134.
28
Thompson, R. N., 1982, Magmatism of the British Tertiary volcanicprovince: Scottish Journal of Geology, v. 18, p. 49-107.
Volkert, R. A., Drake, A. A., and Sugarman, P. J., 1996, Geology,geochemistry, and tectonostratigraphic relations of the crys-talline basement beneath the Coastal Plain of New Jersey andcontiguous areas: U.S. Geological Survey Professional Paper1565-B, 48 p.
Wagner, M. E., and Srogi, L., 1987, Early Paleozoic metamorphismat two crustal levels and a tectonic model for the Pennsylvania-Delaware Piedmont: Geological Society of America Bulletin,v. 99, p. 113-126.
Wallin, E. T., and Metcalf, R. V., 1998, Supra-subduction zoneophiolite formed in an extensional forearc: Trinity Terrane,Klamath Mountains, California: Journal of Geology, v. 106,p. 591-608.
Ward, R. F., 1959, Petrology and metamorphism of the WilmingtonComplex, Delaware, Pennsylvania, and Maryland: GeologicalSociety of America Bulletin, v. 70, p. 1425-1458.
Woodruff, K. D., and Thompson, A. M., 1972, Geology of theNewark area, Delaware: Delaware Geological Survey GeologicMap Series No. 3, Scale 1:24,000.
Woodruff, K. D., and Thompson, A. M., 1975, Geology of theWilmington area, Delaware: Delaware Geological SurveyGeologic Map Series No. 4, Scale 1:24,000.

APPENDIX I
Data table for accuracy comparison of Wilmington Complex Samples to standardreference sample JB-3 from Govindaraju (1994)
Sample JB-3 WC-Amp-1 WC-Amp-2 JB ave %RSD %diff. fromGov
Rb 85 13 16.19 16.05 16.12 0.6 24%Nb 93 2.3 2.16 2.14 2.15 0.6 -6%
Cs 133 1.1 0.942 0.948 0.945 0.5 -14%La 139 8.89 8.15 8.13 8.14 0.2 -8%Ce 140 21.5 21.22 21.28 21.25 0.2 -1%Pr 141 3.39 3.32 3.33 3.32 0.3 -2%
Nd 146 15.4 15.81 15.75 15.78 0.3 2%Sm 147 4.27 4.25 4.19 4.22 1 -1%Eu 151 1.31 1.32 1.3 1.31 1.2 0%
Gd 160 corr 4.47 4.73 4.64 4.69 1.3 5%Tb 159 0.75 0.778 0.757 0.767 1.9 2%Dy 162 4.55 4.65 4.51 4.58 2.1 1%Ho 165 0.79 0.964 0.942 0.953 1.7 21%Er 166 2.61 2.66 2.6 2.63 1.6 1%
Yb 174 2.62 2.51 2.44 2.48 2 -5%Lu 175 0.39 0.391 0.376 0.383 2.7 -2%Hf 178 2.68 2.88 2.87 2.87 0.3 7%Ta 181 0.15 0.151 0.148 0.15 1.5 0%Pb 208 5.5 5.19 3.96 4.58 19 -17%Th 232 1.3 1.28 1.29 1.28 0.5 -1%U 238 0.46 0.48 0.47 0.47 1.4 3%
Mg 26 5.2 5.31 5.08 5.19 3.2 0%Ca 44 9.86 9.99 9.98 9.99 0 1%Sc 45 33.3 33.7 33.14 33.42 1.2 0%Ti 49 1.45 1.42 1.351 1.38 3.5 -4%V 51 383 386 361.11 373.55 4.7 -2%
Cr 52 60.4 57.37 55.53 56.45 2.3 -7%Mn 55 0.16 0.179 0.173 0.18 2.2 10%Fe 57 11.88 11.79 11.51 11.65 1.7 -2%Co 59 36.3 35.04 33.09 34.06 4 -6%Ni 60 38.8 32.08 34.34 33.21 4.8 -14%Cu 65 198 186.62 192.27 189.45 2.1 -4%Sr 88 395 412.58 413.812 413.2 0.2 5%Y 89 27 27 26.23 26.61 2 -1%
Zr 90 98.3 100.7 99.91 100.31 0.6 2%Ba 137 251 236.25 242.076 239.16 1.7 -5%Ga-corr 20.7 21.5 19.84 20.67 5.7 0%Zn-corr 106 103.01 96.13 99.57 4.9 -6%
P2O5 0.29 0.29 0.33 0.31 8.6 7%SiO2 51.04 50.56 50.62 50.59 0.1 -1%
MnO 0.16 0.18 0.17 0.17 0.9 9%Fe2O3 11.88 11.61 11.51 11.56 0.6 -3%MgO 5.2 5.18 5.08 5.13 1.5 -1%TiO2 1.45 1.38 1.35 1.37 1.7 -6%CaO 9.86 10.09 9.98 10.04 0.8 2%
Al2O3 16.89 17.21 17.35 17.28 0.6 2%Sr 395 402.59 413.6 408.1 1.9 3%Ba 251 242.03 240.28 241.16 0.5 -4%
Na2O 2.82 2.72 2.81 2.77 2.3 -2%K2O 0.78 0.77 0.79 0.78 1.2 0%
29

APPENDIX II
Sample locations and descriptionsNote- These location descriptions were taken from original sources verbatim. DGS descriptions
contain mostly English units while there is a mixture of English and metric units contained in the locationdescriptions of Smith and Barnes.
WILMINGTON COMPLEX
Group I
ROCKFORD, Bd41-b, Sample 43428 Wilmington North QuadrangleLatitude 39˚ 46′05″ Longitude 75˚ 34′27″
Sample from Rockford Park, east of the tower. Large outcrop on steep slope approximately 100 ft. above theBrandywine Creek. Interlayered mafic and felsic gneisses are 6- to 12-in thick and intensely boudinaged. Sample from maficlayer. A thin layer of coarse-grained pegmatite occurs in the outcrop. Banding strikes N40˚E and dips 60-70˚NW.
RAMP, Bd43-a, Sample 43901 Wilmington North QuadrangleLatitude 39˚ 46′01″ Longitude 75˚ 32′46″
Sample from Rt. 202 off-ramp going south onto Interstate-95. Large outcrops of bedrock exposed during constructionof the interstate highway. Mafic and felsic rock interlayered on a scale of 6- and 12-in Sample from mafic layer. Strike oflayering is N35˚E, dip 60-70˚NW.
NATURAL, Bd22-a, Sample 43900 Wilmington North QuadrangleLatitude 39˚ 48′40″ Longitude 75˚ 33′56″
Sample from a mafic layer in interlayered mafic and felsic gneisses outcropping on a steep slope east of the BrandywineCreek flood plain. This area is part of the Brandywine Creek State Park.
Group II
TOWN, Bd13-d, Sample 43902 Wilmington North QuadrangleLatitude 39˚ 49′57″ Longitude 75˚ 32′22″
Sample from a 12-in mafic layer in massive felsic gneiss. Sample recovered from boulders blasted from bedrock dur-ing construction of the Brandywine Town Center, intersection of Rt. 202 and Silverside Road.
ZOO, Bd52-a, Sample 43746 Wilmington North QuadrangleLatitude 39˚ 45′33″ Longitude 75˚ 33′05″
Sample from a single 10-in mafic layer in massive felsic gneiss that crops out on the east side of Park Drive. Park Driveextends along the Brandywine Creek north of the Wilmington Zoo. Outcrop at 50 ft above sea level.
NEWPORT, Cc34-41, Sample 24860, Wilmington South QuadrangleLatitude 39˚ 42′37″ Longitude 75˚ 36′27″
Amphibolite from a core recovered during drilling in Christina River, Newport, for construction of Rt. 141 northboundlanes. Sample from 82 ft below sea level. Hornblende grains define a weak foliation in a thick 10-ft amphibolite layer thatoccurs between 5-ft felsic layers.
30
Group III
HAGLEY, Bd31-d, Sample 43545 Wilmington North QuadrangleLatitude 39˚ 47′13″ Longitude 75˚ 34′47″
Rock sample taken from abandoned quarry located on Brandywine Creek below the Hagley Library at 55 ft above sealevel. Interlayered mafic and felsic rock with sharp boundaries between layers. Sample from an 8-in, boudinaged, mafic layer.Felsic layers, 2- to 3-in thick, are strongly deformed parallel to the layering and contain flattened 2-in pods of mafic rock. Anirregular layer of an undeformed quartzite with small pods of mafic rock occurs adjacent to the sampled mafic layer. A horn-blende-rich reaction rim formed between the quartz-rich rock and the mafic rock.
PACKARD, Bc53-a, Sample 42352 Wilmington North QuadrangleLatitude 39˚ 45′34″ Longitude 75˚ 37′08″
Massive quartz-bearing amphibolite with “bright eyes” (magnetite grains with halos of quartz and feldspar). Samplefrom large boulders excavated during construction of the Hewlett Packard building on Centreville Road. This sample was cho-sen as representative of the large mass of quartz-bearing amphibolites that occur west of Rt. 141 (Center Road) and south ofRt. 48 (Lancaster Pike).
BSP, Cc12-a, Sample 43478 Newark East QuadrangleLatitude 39˚ 44′43″ Longitude 75˚ 38′10″
Amphibolite interlayered and folded with layers of pelitic schist and garnet-bearing quartzite. Thickness of the layers isvariable and ranges between 2 and 15 ft. Axial planes of the folds strike N20˚E and dip 90˚. The hinge plunges 42˚NE.Sample collected from large outcrop along the east bank of the Red Clay Creek approximately 90 yards south of the railroadtrestle at an elevation of 120 ft in a development called Spice Mill. The development is adjacent to and across the creek fromBrandywine Springs Park. Sample BC-1 collected and powdered by R. Chace.
HYDE, Bc52-j, Sample 43380b Kennett Square QuadrangleLatitude 39˚ 45′03″ Longitude 75˚ 38′54″
Twelve-inch thick amphibolite layer interlayered and folded with layers of biotite gneiss and felsic gneiss. Strike of theaxial plane of the folds is N10˚E with 90˚ dip. Sample is from an outcrop on Hyde Run, south of Hercules Road, and east ofthe Sunnybrook School for the Blind at an elevation of 140 feet. Sample BC-13 collected and powdered by R. Chace.
HERCWEST, Bc52-f, Sample 42168 Kennett Square QuadrangleLatitude 39˚ 45′09″ Longitude 75˚ 38′07″
Coarse-grained massive amphibolite, with domains containing poikiloblastic grains of orthopyroxene, approximately0.5-in diameter, that are surrounded by halos of quartz and plagioclase. Rounded boulders, probable outcrop, at an elevationof 110 ft are exposed along the north side of a stream draw that drains into the Red Clay Creek. Unnamed stream draw is 0.3miles north of Faulkland Road. Sample BC-10 collected and powdered by R. Chace.
31
Group IV
GREEN, Plank, T. A., Cb34-d, Sample 43517b Newark East QuadrangleLatitude 39˚ 42′10″ Longitude 75˚ 41′33″
Felsic gneiss, fine-grained amphibolite and fine to medium-grained biotite gneiss in 5- to 10-ft layers. Strike of the lay-ering is N40˚E with a slight SE dip. Sample is from an amphibolite layer exposed during construction of Green Valley apart-ment buildings just south of Rt. 2 (Kirkwood Highway) and 0.1 mile east of the abandoned quarry at Choate. Elevation is 60ft above sea level. Psammitic gneiss of the Wissahickon Formation is exposed just north of Rt. 2 in the small tributary thatflows into Pike Creek suggesting the contact between the Wilmington Complex and the Wissahickon may be under Rt. 2.
WINDY, Cb42-c, Sample 43425 Newark East QuadrangleLatitude 39˚ 41′32″ Longitude75˚ 43′29″
Mafic and felsic rocks interlayered on a scale of 8 to 10 in. Evidence for partial melting along contacts between layers.Intrusive pegmatites and large-scale tight folds. Foliation that is parallel to the axial plane of the folds strikes N75˚E and dipssteeply to the southeast. The hinge of the fold plunges at 90˚. Sample collected from a 10-in layer of fine-grained amphibo-lite exposed along the south bank of the White Clay Creek under the Windy Hills Bridge, elevation of 50 ft. above sea level.
HAVEG, Cc22-c, Sample 41923 Newark East QuadrangleLatitude 39˚ 43′54″ Longitude 75˚ 38′02″
Coarse- and fine-grained amphibolites. Coarse-grained amphibolites appear to have intruded the finer-grained amphi-bolites. Features include “bright eyes,” garbenshiefer layers, and quartz-filled fractures. Sample collected from fine-grainedamphibolite layer. Rock is exposed along the track of the Wilmington & Western Railroad south of the Greenbank Station andapproximately 0.4 mile south of Rt. 41. The outcrop extends for several hundred ft at an elevation of 90-120 ft above sea level.Sample BC-4 collected and powdered by R. Chace.
Group V
BCSP, Bd21-a, Sample 41931 Wilmington North QuadrangleLatitude 39˚ 48′24″ Longitude 75˚ 34′39″
Sample from amphibolite outcrop in woods north of the upper parking lot in Brandywine Creek State Park. Outcropsare rounded from exfoliation and exhibit some relic gabbroic textures. Mafic grains are sometimes elongated parallel to thinbands of quartz. This weak foliation strikes east-west and dips steeply to the north.
MILLCREEK, Bd55-b, Sample 43475 Kennett Square QuadrangleLatitude 39˚ 43′06″ Longitude 75˚ 40′34″
Coarse- to medium-grained amphibolite with relict gabbroic texture. Amphibolite grains are sometimes aligned to forma weak foliation that strikes N45˚E with a 90˚ dip. Sample collected from a small quarry at the corner of Mill Creek and StoneyBatter roads at an elevation of 165 ft above sea level.
32
Group VI
WC3, Smith, R. C., and Barnes, J. H. Wilmington North QuadrangleLatitude 39˚ 46′10″ Longitude 75˚ 35′44″
Fresh, fine-grained gabbro containing fresh, lath-like plagioclase phenocrysts. Outcrop at elevation of 235 ft above sealevel on the southeast side of Delaware Rt. 141, approximately 0.2 km northeast of the Conrail (formerly Reading Railroad)overpass, District No. 7, New Castle County, Delaware.
BRING, Smith, R. C., and Barnes, J. H. Wilmington North QuadrangleLatitude 39˚ 46′32″ Longitude 75˚ 30′36″
Fresh, medium- to fine-grained orthopyroxene-bearing felsic (?) diabase (norite?) from outcrop on north side of ShellpotCreek, 35±4m east northeast of the powerline over the creek. Sample block collected 15 to 25 cm from contact with coarse-grained magnetite-rich felsic gneiss. The contact trends N10˚E, 45˚SE, the mafic unit being on top. The sample was collect-ed 0.5 km southwest of the bridge carrying Interstate-95 over Marsh Rd.
33
JAMES RUN FORMATION, CECIL COUNTY, MARYLAND
JRFMC, Smith, R. C., and Barnes, J. H. Havre de Grace QuadrangleLatitude 39˚ 35′04″ Longitude 76˚ 05′55″
Very dark green, fine-grained, actinolite amphibolite from the Frenchtown Member of the James Run Formation. Froman internal chilled zone in an asymmetric 0.8-meter-wide dike with only one chilled zone (equals one sheeted dike?) 6 metersnorth of benchmark A148 and 54 meters northwest of the centerline of the bridge carrying Rt. I-95 over the northeast bank ofthe Susquehanna River. The unsampled unit adjacent to JRFMC consists of a 5- to 6-meter-wide, medium-grained actinolite-chlorite-quartz-trace sulfide mafic zone trending N33˚E, 81˚SE, and containing minor epidote-bearing boudins or pillows.
JRGFAS, Smith, R. C., and Barnes, J. H. Havre de Grace QuadrangleLatitude 39˚ 35′20″ Longitude 76˚ 06′09″
Dark-gray, fractured and microveined, very fine-grained James Run Gilpins Falls amphibolite flow having common 1-to 2-mm amygdules. Sample collected from Conrail railroad cut on the northeast shore of the Susquehanna River, 285 ft south-east of the northwest end of this part of the railroad cut, 225 feet northwest of the southeast end of the outcrop, and approxi-mately 220 ft southeast of sample JRGFA, Cecil County, Maryland.
JRGFA, Smith, R. C., and Barnes, J. H. Havre de Grace QuadrangleLatitude 39˚ 35′21″ Longitude 76˚ 06′10″
Dark-gray, fractured, fine-grained amphibolite flow from the James Run Formation having common 2- to 5-mm amyg-dules filled with felsic minerals. Sample collected from the Conrail railroad cut on the northeast shore of the SusquehannaRiver. This sample is from near the northwest contact of the Gilpins Falls amphibolite, based on Higgins (1990) Cecil Countymap. It is 65 ft southeast of the northwest end of this part of the railroad cut and 325 ft southeast of a small, unnamed stream.This area is 0.64 km southeast of the Conrail bridge over Happy Valley Branch, Cecil County, Maryland.
JRFMV, Smith, R. C., and Barnes, J. H. Havre de Grace QuadrangleLatitude 39˚ 35′03″ Longitude 76˚ 06′10″
Gray, medium-grained, amygdaloidal metabasalt from the Frenchtown Member of the James Run Formation. Roundedfelsic amygdules range from 0.2 to 0.5 cm and flattened actinolite blebs from 0.5 to 1.5 cm, the latter outlined by disseminat-ed opaque oxides. This sample is from 25 to 50 cm below the top of a 2-m-thick amygdaloidal unit 1.05 m north of bench-mark A148, 48 m north of the centerline of the bridge carrying Interstate Route 95 over the northeast bank of the SusquehannaRiver, Cecil County, Maryland. (This is 6 m stratigraphically above the site from where sample JRFMC was collected).
JRS, Smith, R. C., and Barnes, J. H. Havre de Grace QuadrangleLatitude 39˚ 35′03″ Longitude 76˚ 05′54″
Very dark green, fine-grained, dense actinolite-chlorite-magnetite amphibolite dike from the James Run Formation con-taining fair cleavage. It is 0 to 2.5 cm northwest of a southeast contact of a 3.1-m-wide dike that trends approximately N28˚E,65˚SE, cutting the gradational contact of the Port Deposit Granite and the Happy Valley Branch Member of the James RunFormation. Sample collected from the northeast side of the Conrail railroad cut 1,085±25 ft. northwest of Happy ValleyBranch and 1,000±25 ft. southeast of the southwest projection of U. S. Route 222 onto the railroad, Cecil County, Maryland.
34
WISSAHICKON AMPHIBOLITES
Sample locations and descriptions
White Clay amphibolite
WOODDALE, Bc42-f Kennett Square QuadrangleLatitude 39˚ 46′16″ Longitude 75˚ 38′26″
Sample from back wall of Wooddale quarry, near large fold of amphibolite that is surrounded by pegmatites. Axial planeof the fold strikes N45˚E and dips 89-90˚NW. The fold axis plunges 60˚SW. Base of quarry is approximately 150 ft abovesea level.
HERCRR, Bc52-c, Sample 42295 Kennett Square QuadrangleLatitude 39˚ 45′38″ Longitude 75˚ 38′10″
Coarse-grained amphibolite interlayered and interfingered with felsic, psammitic, and pelitic layers. Folds with axialplanes striking N10˚E, dipping 15˚NW. The fold axis plunges 30˚SW. Sample is from outcrop on west side of the Wilmington& Western railroad track, 210 yards south of Rt. 48 (Lancaster Pike) at Hercules Research Center. Elevation is 125 ft abovesea level. Sample BC-14A collected and powdered by R. Chace.
WCCMB, Smith, R. C., and Barnes, J. H West Grove QuadrangleLatitude 39˚ 47′20″ Longitude 75˚ 48′09″
Medium-grained-greenish black amphibolite-mafic gneiss containing trace chalcopyrite and iron sulfide from 0 to 7 cm(1.5 to 6.5 cm freshest and analyzed) above the base of a 0.5-m-thick metabasalt, which is the lowest one observed at the site.Seven centimeters above the base, there is an unanalyzed 1-cm friable mica zone. Smith and Barnes suggest the micaceouslayers maybe metamorphosed tuffs. Mineral foliation in the outcrop is parallel to the flow (?) top and trends N72˚W, 30˚S.
WCCMB through WCCMBIV are samples of five metabasalt flows from a single exposure, with I stratigraphicallylowest and IV highest. Smith and Barnes have designated this outcrop as the type section for the White Clay amphibolite(unpublished report, Pennsylvania Geological Survey, 1994 and 2001). The WCCMB series is located on the east side ofMiddle Branch, White Clay Creek, where it makes the right angle bend from flowing east to south, 0.46 km east of the con-fluence with Indian Run. Location is 1.35 km northeast of Chesterville, Franklin Township, Chester County.
WCCMBI 10-20 cm, Smith, R. C., and Barnes, J. H. West Grove QuadrangleLatitude 39˚ 47′20″ Longitude 75˚ 48′09″
Fine- to medium-grained, dark greenish black amphibolite. Includes two 1-mm quartzose layers. Consists of somewhatcrenulated, blue-green hornblende, andesine, and quartz, as well as opaque oxides, titanite, and biotite and trace epidote-rimmed allanite, apatite, and zircon. Collected from 10 to 20 cm above the base of WCCMBI, or just above the approximately2-cm mica zone containing abundant primary allanite-cored euhedral epidote. Based on thin section, this micaceous layer isa crenulated albite-quartz-biotite schist containing minor hornblende, opaque oxides, allanite, epidote, and trace fluoroapatiteand zircon. The location is as the rest of the WCCMB type-locality samples.
WCCMBII, Smith, R. C., and Barnes, J. H West Grove QuadrangleLatitude 39˚ 47′20″ Longitude 75˚ 48′09″
Dark, medium fine-grained hornblende-plagioclase foliated metabasalt from 2.5 to 4.5 cm above the base of a 1.7±0.1-m-thick metabasalt, the sampled base of which is mafic. (This 1.7-m-thick unit occurs above a 4.5-m-thick micaceousmetasediment or meta-tuff. R. T. Faill sampled it 1.1±0.2 m below the top). The location is as the rest of the WCCMB type-locality samples.
35
WCCMBIII, Smith, R. C., and Barnes, J. H West Grove QuadrangleLatitude 39˚ 47′20″ Longitude 75˚ 48′09″
Medium-grained, dark gray amphibole-plagioclase gneiss containing a few 2-mm biotitic patches that could be flattenedamygdules. This sample is from 0 to 8 cm (1.5 to 7.0 freshest and analyzed) above the base of a higher 0.5-m-thick metabasalt.Beneath this sample is a 0.5-m micaceous layer, then 1.7 m of metabasalt, then 4.5m of metasediment, then the lowest 0.5-m-thick metabasalt from which WCCMBI was collected. Above the 0.5 m metabasalt from which WCCMBIII was collected is1.0 m of metasediment and then 4+ m of metabasalt. The location is as the rest of the WCCMB type-locality samples.
WCCMBIV, Smith, R. C., and Barnes, J. H West Grove QuadrangleLatitude 39˚ 47′20″ Longitude 75˚ 48′09″
Dark, medium fine-grained hornblende-plagioclase foliated metabasalt from 0.5 to 4.5 cm above the base of a >4m-thickmetabasalt that is the highest exposed and sampled unit in the section. The location is as the rest of the WCCMB type-locali-ty samples.
WCCW+W, Smith R. C., and Barnes, J. H. Kennett Square QuadrangleLatitude 39˚ 48′29″ Longitude 75˚ 40′16″
The amphibolite sample was collected from a large outcrop along the Wilmington and Western Railroad track approxi-mately 150 yards east of the NVF Plant in Yorklyn Delaware. The outcrop is adjacent to the contact between the CockeysvilleMarble and the Wissahickon Formation and the layering dips 30 to 45˚ SE off the southeast flank of the Mill Creek Nappe.The sample was collected approximately 55 m northeast of the southwest end of the railroad cut and approximately 7 m south-west of the northeast end, at an elevation of 200±10 ft above sea level, 1.20 km east southeast of arc marker 8 and 1.3 kmslightly west of south of arc marker 9, New Castle County, Delaware.
Medium-grained, greenish black, slightly pyritic amphibolite. Consists of olive hornblende, andesine, and quartz as wellas minor opaque oxides and trace apatite. Titanite, biotite and epidote appear to be absent, unlike the situation in the sameflow at the type locality. Collected from 13 to 19 cm below the top, or 3 to 9 cm above the base, of a 0.20-m thick basalt flow.The layer just below this basalt is 0.15 m thick and very rich in biotite and sucrosic feldspar.
The section in this road cut consists, from the top down, of 2.1 m of metabasalt having some micaceous interbeds, 0.08m micaceous layer, l.l m gneissic, 0.07 m micaceous layer, 0.30±0.05 m metabasalt, 0 to 0.12 m quartz boudins and micaceouslayers, 0.50 m metabasalt, 0.25 m micaceous layer, 0.2 metabasalt (sampled as WCCW+W), 0.15 m micaceous layer, 0.58 mmetabasalt, 0.01 to 0.02 m micaceous layer, 0.15 m gneiss, 0.3 m pegmatite. Gneiss 5 m to the southwest or 3±0.5 m lowerstratigraphically is sillimanite-bearing.
This outcrop containing five amphibolite beds is herein designated as the principal reference section of the White ClayCreek amphibolite lithodeme (R. C. Smith, J. H. Barnes, unpublished report, Pennsylvania Geological Survey, 2001).
YRKLYN, Smith, R. C., and Barnes, J. H. Kennett Square QuadrangleLatitude 39˚ 48′32″ Longitude 75˚ 40′05″
Coarse-grained hornblende gneiss with a somewhat gabbroic texture. Sparse large pyroxene grains containing roundedinclusions. Visual estimate of 1 percent pyroxene and 3 percent opaque oxides. Collected from a sulfide-bearing outcrop 0.3m above the level of Delaware Route 82 northeast of Yorklyn, on the north side of Red Clay Creek, 122±m west of Snuff MillRd., and 1.25 km southeast of the point at which Delaware Rt. 82 crosses the Pennsylvania-Delaware state line.
LANS, Smith, R. C., and Barnes, J. H West Grove QuadrangleLatitude 39˚ 46′21″ Longitude 75˚ 46′03″
Dark greenish hornblende-andesine gabbroic gneiss containing disseminated pyrite. The sampled outcrop is located onthe southwest side of the northwest end of the upper level railroad cut and on the east side of White Clay Creek at a point 0.68km south southeast of the intersection at Landenberg, London Britain Twp., Chester Co. Elevation is 235±10 ft abovesea level.
36
WCCW, Smith, R. C., and Barnes, J. H West Grove QuadrangleLatitude 39˚ 44′38″ Longitude 75˚ 47′38″
Medium-grained, dark greenish black hornblende-andesine gneiss collected from outcrop 0.2 m below natural surfaceon the southwest side of a 340-ft. knoll 13±0.5 m below the crest and 8±0.5 m above creek level. Mineral orientation maytrend N70˚W, 60˚S, but this is very uncertain because of wet stained surfaces. The sampled outcrop is 1.1 km north ofStrickersville and 2.95 km northwest of the Arc Corner, between Indiantown Rd. and Pennsylvania Rt. 896, London BritainTwp., Chester Co.
LANM, Smith, R. C., and Barnes, J. H West Grove QuadrangleLatitude 39˚ 46′36″ Longitude 75˚ 45′45″
Medium-grained hornblende-andesine (?) gabbroic gneiss, outcrop in cut on southwest side of Saw Mill Road at an ele-vation of 365±15 ft above sea level and a point 0.92 km east southeast of the crossroads at Landenberg, New Garden Twp.,Chester Co.
GREENLAWN2, Smith R. C., and Barnes, J. H. Coatesville QuadrangleLatitude 39˚ 53′16″ Longitude 75˚ 48′09″
Fine-to-medium-grained, slightly weathered, bluish-green crenulated amphibolite. Consists of bluish green hornblende,andesine, quartz, epidote, and biotite. Contains accessory opaque oxides and titanite. Foliation 9±1 m to the west trendsN22˚E, 20˚NW. Collected from weathered outcrop 0.3 m above road level on the north side of Green Lawn Road at an ele-vation of 45±10 ft This is 190±20 m west of Pennsylvania Route 841 through Green Lawn, West Marlborough Township,Chester County.
WCCN2, Smith, R. C., and Barnes, J. H. West Grove QuadrangleLatitude 39˚ 45′38″ Longitude 75˚ 46′04″
Medium-grained, dark greenish black hornblende-andesine-biotite gneiss collected from a slightly weathered and possi-bly slumped outcrop on the SW side of an abandoned railroad cut on the SW side of White Clay Creek. The sample was col-lected 3.5±0.5 m above creek level, where the cut trends N47˚W. This is 1.95 km S of the crossroads at Landenberg of 1.25km NW of Milepost 1 1/2 of the Mason and Dixon Line, London Britain Township, Chester County.
MP5, Smith, R. C., and Barnes, J. H Kennett Square QuadrangleLatitude 39˚ 46′55″ Longitude 75˚ 43′47″
Medium-grained hornblende-plagioclase gneiss with somewhat gabbroic texture. Collected from an outcrop on thesoutheast side of an abandoned railroad grade 132±8 m southwest of a tributary to Branch Run coming from the southeast, ata point 0.35 km southwest of Milepost 5 of the Mason and Dixon Line, or 0.6 km southwest of where Limestone Rd. crossesthe Delaware state line south of Kaolin. Sample collected about 20 m into Delaware.
LANN, Smith, R. C., and Barnes, J. H West Grove QuadrangleLatitude 39˚ 46′26″ Longitude 75˚ 46′11″
Dark greenish hornblende-andesine gabbroic gneiss from an outcrop about 10 m north of the north end of a small quar-ry on the west side of Penn Green Rd. The sample was collected from within 20 cm of road level, at an elevation of 180±10ft above sea level, on the maximum curvature of the road, 0.45 km south of the intersection at Landenberg, London BritainTownship, Chester County.
37
WCC, Smith, R. C., and Barnes, J. H Newark West QuadrangleLatitude 39˚ 44′24″ Longitude 75˚ 46′25″
Medium-grained hornblende gneiss that has a N55˚W(?) trending foliation near the sample site. Collected from outcrop0.8 m above rapidly rising creek level (five inches of rain from tail end of unforecast hurricane!) and about 2 m west of thebank of White Clay Creek at a point 55±5 m south of the confluence with a tributary from the west. The sampled outcrop is2.00 km N15˚E of the Arc Corner, London Britain Township, Chester County.
Kennett Square amphibolite
LUCK, Smith, R. C., and Barnes, J. H Kennett Square QuadrangleLatitude 39˚ 49′50″ Longitude 75˚ 43′03″
Fresh, medium-grained hornblende-plagioclase gabbroic gneiss containing accessory titanite. Foliation trends approxi-mately N20˚E, 25˚NW. Outcrop at an elevation of 330±10 ft above sea level on a new road on the south side of HillendaleRoad, 0.85 km west of Five Points, Kennett Township, Chester County.
KS, Smith, R. C., and Barnes, J. H Kennett Square QuadrangleLatitude 39˚ 50′21″ Longitude 75˚ 41′52″
Fresh, medium-grained hornblende-plagioclase gabbroic gneiss having foliation that trends N59˚E, 48˚SE. Accessoryopaque oxides are commonly rimmed with titanite. Collected from a small quarry at an elevation of 275±15 ft on the westside of Pennsylvania Route 82 (Creek Road) at a point 1.1 km northeast of Five Points, Kennett Township, Chester County.
WICK, Smith, R. C., and Barnes, J. H West Grove QuadrangleLatitude 39˚ 49′00″ Longitude 75˚ 50′05″
Banded medium-to coarse-grained hornblende-epidote-plagioclase gneiss containing possible minor chlorite. Some ofthe epidote is concentrated in <1-cm blebs that could be relict amygdules. Large, pleochroic clinopyroxene is concentratedin bands. Accessory opaque oxides and titanite are present. Sample from probable outcrop on the west side of South GurnseyRoad, 57±3 meters south of Avondale-New London Road, 0.9 km northwest of Wickerton, London Grove Township,Chester Co.
ROSE, Smith, R. C., and Barnes, J. H Kennett Square QuadrangleLatitude 39˚ 50′35″ Longitude 75˚ 39′32″
Fresh, medium- and coarse-grained hornblende-clinopyroxene-plagioclase gneiss from a boulder near the east end of anabout 150- m-long series of hornblende gneiss boulders and outcrops on the south rim of Hill 392. Abundant opaque oxidesand titanite are present. Joints and gneissic banding trend N59˚E, 68˚N, but the boulder could be rotated. Sample collectedfrom near the southeast corner of a 3 by 3-meter boulder at an elevation of 370±10 ft above sea level, 0.7-km southeast ofRosedale, Kennett Township, Delaware County.
BRNTML, Smith, R. C., and Barnes, J. H Kennett Square QuadrangleLatitude 39˚ 50′16″ Longitude 75˚ 39′04″
Medium- to coarse-grained hornblende-plagioclase-clinopyroxene gneiss containing sparse titanite and rare opaqueoxides from an outcrop about 0.2 meters above the level of Burnt Mill Road, on the east side of the road just south of whereit bends west toward Kennett Square. This outcrop is 1.35 km north of milepost 10 of the Mason-Dixon Line, KennettTownship, Chester County.
38
CHFD, Smith, R. C., and Barnes, J. H Wilmington North QuadrangleLatitude 39˚ 51′44″ Longitude 75˚ 35′40″
Medium-grained hornblende-plagioclase-clinopyroxene gneiss from a natural outcrop that contains 1-mm to 1-cm felsicbands and lenses that trend N42˚E, 52˚SE. Accessory opaque oxides, many rimmed with titanite. Sample collected at an ele-vation of 280±20 ft above sea level on the northwest side of a hill overlooking Brandywine Creek, 725±25 meters south of therailroad intersection at Chadds Ford Junction, Birmingham Township, Delaware County.
BRANDY2, Smith, R. C., and Barnes, J. H Wilmington North QuadrangleLatitude 39˚ 51′12″ Longitude 75˚ 35′50″
Dark, very fresh, medium-grained hornblende-plagioclase-clinopyroxene gneiss containing clusters of small, opaqueoxide grains and separate, sparse titanite. The sample is from the southwest side of a railroad cut where the foliation trendsN60˚E, 52˚SE. Sampled at the base of the outcrop 82 meters northwest of the bridge over the railroad at Brookfield, PennsburyTownship, Chester County.
COTSWOLD, McEwen, M., Cb12-c, Sample 43506 Newark East QuadrangleLatitude 39˚ 44′54″ Longitude 75˚ 33′08″
Amphibolite, massive to weakly foliated with narrow quartz veins paralleling the foliation. A new development north-west of Pleasant Hill valley called Cotswold Hills. Workman directed us to large area, approximately 500 x 300 yards, ofbluish amphibolite (8/25/93). Rock had been blasted and amphibolite float covered the area. Elevation 320 ft above sea level.Sample collected and analyzed by M. McEwen.
SADDLE, McEwen, M., Ca34-c, Sample 43507 Newark West QuadrangleLatitude 39˚ 42′02″ Longitude 75˚ 46′53″
Covered Bridge Farms, Saddle Circle. Small stream with many amphibolite boulders. Boulders described by thelandowners as the remains of a ledge of black rock that was blasted during the construction of Covered Bridge Farms.
39

