geochemistry 3 volume 6 geophysics 1 september 2005 ... - ncu
TRANSCRIPT

Observations of infragravity waves at the Monterey oceanbottom broadband station (MOBB)
David Dolenc and Barbara RomanowiczSeismological Laboratory, University of California, 215 McCone Hall, #4760, Berkeley, California 94720, USA([email protected])
Debra Stakes and Paul McGillMonterey Bay Aquarium Research Institute, 7700 Sandholdt Road, Moss Landing, California 95039, USA
Doug NeuhauserSeismological Laboratory, University of California, 215 McCone Hall, #4760, Berkeley, California 94720, USA
[1] Infragravity waves can be observed at the 1000 m deep ocean bottom broadband seismic station MOBBon stormy as well as quiet days. When compared to the energy of the short-period ocean waves recorded atthe local buoys, infragravity waves in the longer than 20 s period band are found to be mainly locallygenerated from shorter-period waves. Two types of modulation of the infragravity signal are observed.First, the entire infragravity band signal is modulated in-phase with tides, possibly as a result of thenonlinear exchange of energy between the short-period waves and tidal currents. Second, a longer-periodmodulation of the infragravity signal is observed and is best correlated with the energy of the 14 s periodocean waves. This correlation indicates that the mechanism of generation of double frequency microseismsand infragravity waves are likely strongly related. Previously recorded data during the Oregon ULF/VLFexperiment at 600 m water depth also indicate that infragravity waves are primarily locally generated.
Components: 6472 words, 10 figures.
Keywords: infragravity waves; long-period seismic noise; ocean bottom seismic observations.
Index Terms: 4299 Oceanography: General: General or miscellaneous; 4599 Oceanography: Physical: General or
miscellaneous; 7299 Seismology: General or miscellaneous.
Received 31 March 2005; Revised 5 July 2005; Accepted 13 July 2005; Published 1 September 2005.
Dolenc, D., B. Romanowicz, D. Stakes, P. McGill, and D. Neuhauser (2005), Observations of infragravity waves
at the Monterey ocean bottom broadband station (MOBB), Geochem. Geophys. Geosyst., 6, Q09002, doi:10.1029/
2005GC000988.
1. Introduction
[2] The Monterey ocean bottom broadband station(MOBB) is a collaborative effort between the Mon-terey Bay Aquarium Research Institute (MBARI)and the Berkeley Seismological Laboratory (BSL).The MOBB was installed in April 2002, 40 kmoffshore in the Monterey Bay, at a water depth of1000 m [McGill et al., 2002; Uhrhammer et al.,2002; Romanowicz et al., 2003, 2005]. It is locatedwest of the San Gregorio Fault, one of the major, yet
not well documented faults of the San AndreasFault System (Figure 1). The region is characterizedby a very diverse topography; a wide, gently slop-ing continental shelf is found to the north, 1500 mdeep Monterey Canyon is just south of MOBB, anda narrow shelf is present in Monterey Bay andfurther to the south. The MOBB is a continuouslyoperated broadband seismic station and is consid-ered the first step toward extending the BerkeleyDigital Seismic Network (BDSN) westward of thePacific-North America plate boundary. It follows
G3G3GeochemistryGeophysics
Geosystems
Published by AGU and the Geochemical Society
AN ELECTRONIC JOURNAL OF THE EARTH SCIENCES
GeochemistryGeophysics
Geosystems
Article
Volume 6, Number 9
1 September 2005
Q09002, doi:10.1029/2005GC000988
ISSN: 1525-2027
Copyright 2005 by the American Geophysical Union 1 of 13

from the experience gained previously during the3-monthlong MOISE deployment in 1997, whichwas located about 10 km to the west [Romanowicz etal., 1998; Stutzmann et al., 2001].
[3] The MOBB comprises a 3-component GuralpCMG-1T broadband seismometer buried in theocean floor, a recording and battery package, aswell as a collocated differential pressure gauge(DPG) [Cox et al., 1984] and current meter, whichmeasures ocean bottom current speed and direction[Romanowicz et al., 2005]. At present, the stationis autonomous and the data are on average retrievedevery three months using the MBARI’s remotely
operated vehicle Ventana. With a planned connec-tion to the MARS (Monterey Accelerated ResearchSystem; http://www.mbari.org/mars) fiber-opticcable, the data will be retrieved continuouslyand in real-time and will be publicly availablefrom the Northern California Earthquake DataCenter (NCEDC; http://quake.geo.berkeley.edu/ncedc).
[4] The MOBB as well as future BDSN oceanbottom stations will enable us to better determinelocations and mechanisms of offshore earthquakes,to learn more about the crustal structure at thecontinental edge, as well as to better understand the
Figure 1. Locations of the MOBB (yellow) and the BDSN seismic stations (blue) shown against the seafloor andland topography. Background seismicity (ANSS catalog, 1968–2004, M3.5+) is shown in black. Locations of theNOAA buoys closest to the MOBB are shown in red. Fault lines from the California Division of Mines and Geologydatabase are shown in red as well.
GeochemistryGeophysicsGeosystems G3G3
dolenc et al.: infragravity waves 10.1029/2005GC000988
2 of 13

plate-boundary processes and therefore better con-strain the seismic hazard along the west coast ofnorthern California. At the same time such perma-nent ocean bottom stations equippedwith broadbandseismometers will provide us new information onthe coupling between the ocean and the solidearth.
[5] The broadband seismometer installed atMOBB is sensitive over a wide frequency range,from 50 Hz to 2.8 mHz (360 s). This enabled us toalso observe the long-period signal which is largelydue to the ocean surface infragravity waves.
2. Infragravity Waves
[6] Infragravity waves are ocean surface waveswith periods longer than the wind-driven wavesand the swell. Their wave amplitudes in the deepwater are small (<1 cm) and they can be observedin the frequency band from 0.002 to 0.05 Hz. Theywere first observed near the shore by Munk [1949]and Tucker [1950]. The pressure fluctuations frominfragravity waves at the deep seafloor were firstmeasured by Sutton et al. [1965], and they were
first observed at the sea surface in the open oceanby Snodgrass et al. [1966]. Although high corre-lations have been observed between infragravityand shorter-period ocean waves (wind waves andswell) energy [e.g., Munk, 1949; Tucker, 1950;Elgar et al., 1992; Herbers et al., 1995a], theprecise generation mechanism for infragravitywaves is still not completely understood.
[7] In oceanography, infragravity waves are con-sidered important for harbor oscillations and near-shore processes, such as sediment transport. Inseismology, pressure fluctuations due to infragrav-ity waves have been identified as an importantsource of long-period noise at the ocean bottom[Webb et al., 1991; Webb, 1998]. Infragravitywaves have recently also been proposed as a sourceof the Earth’s continuous free oscillations [Rhieand Romanowicz, 2004; Tanimoto, 2005].
3. Power Spectral Density
[8] We first compared the power spectral density(PSD) at MOBB and three other stations of theBDSN network (Figure 2). Station SAO is the
Figure 2. Comparison of the power spectral density (PSD) at the stations MOBB, FARB, SAO, and YBHcalculated for a quiet day (2002, day 143) and for a stormy day (2002, day 350). Results obtained for the vertical (top)and for the horizontal components (E-W, bottom) are shown. The USGS high- and low-noise models for land stationsare shown in black [Peterson, 1993].
GeochemistryGeophysicsGeosystems G3G3
dolenc et al.: infragravity waves 10.1029/2005GC000988dolenc et al.: infragravity waves 10.1029/2005GC000988
3 of 13

closest land station (see Figure 1), and station YBHis one of the quietest BDSN stations, located560 km north of MOBB. Results obtained for aquiet day (2002, day 143) and for a stormy day(2002, day 350) are shown for the vertical (top)and for one horizontal component (E-W, bottom).Four hours of data (00–04 UTC) were used in thecalculation. The quiet and the stormy day wereselected on the basis of the spectral wave density(SWD) measured at the nearby NOAA buoy46042. There were no significant earthquakesrecorded during the two time periods.
[9] The MOBB vertical component data on a quietday show a noise ‘‘hump’’ for periods between 20and 200 s that is not present in the land station data.The observed peak at MOBB is even stronger andwider (periods 20–500 s) on a stormy day, when itcan also be observed at the Farallon Islands stationFARB. On the other hand, the noise at MOBBbetween 10 and 20 s is comparable to the quietestBDSN land stations. The results also show that thenoise observed at MOBB on a quiet day for periodslonger than 20 s is comparable to the noise observedat the island station on a stormy day. The sharpshort-period cutoff observed at 20 s in the spectrumfor the vertical MOBB component on a stormy dayis determined by the water depth, since only linearwaves with wave numbers comparable or smallerthan the inverse of the water depth can generate adetectable pressure signal at the seafloor [Webb,1998]. In the infragravity wave band, the differencebetween quiet and stormy period is larger at thelower frequencies than at the high-frequency end,with more low-frequency energy during storms.
[10] In the microseism band, the three peaks areevident between 1 and 10 s. They are often
observed in the spectra from the sites in the Pacificand are associated with the large storms in theSouthern Ocean for the low-frequency peak, withthe local storms in the North Pacific for the mainpeak, and with the local wind wave field for thehigh frequency peak [Webb, 1992, 1998]. On astormy day, a well pronounced peak is present inthe infragravity wave band between 20 and 30 s. Afew more subtle peaks seem to be also present atlonger periods within the infragravity wave band.
[11] The results for the two horizontal compo-nents were similar and therefore only one com-ponent (E-W) is shown in Figure 2. In this casethere is no peak observed at MOBB for periodslonger than 20 s on a quiet day. On the stormyday, the increased noise at MOBB is presentagain. The signal at the island station FARB iseven stronger than at MOBB and it extends all theway to 1000 s.
[12] The shape of the noise spectra in the infra-gravity wave band measured at MOBB is inagreement with observations from previousdeployments in which seismometers were buriedunder the ocean floor [Stephen et al., 2003; Arakiet al., 2004], as well as with theoretical predictions[Araki et al., 2004].
4. Generation of Infragravity Waves
[13] We computed PSD for 1-hour long segmentsfor all the available MOBB data until July 2004and compared the results to the SWD measured atthe nearby NOAA buoys. The SWD is computed atthe buoys once every hour and it measures energyof the ocean waves in m2/Hz in the 0.01 Hz widefrequency bins that cover the 0.03 to 0.4 Hz range.The location of the buoys considered is shown inFigure 3. Comparison spectrograms for a 7-dayperiod (12/9–16/2003) are presented in Figure 4.The infragravity peak can be observed in the PSDplot for the vertical MOBB channel throughout the7-day period (Figure 4, top panel). A rather suddenchange of the infragravity peak width is indicatedwith a black line. The second panel from top inFigure 4 shows the SWD measured at the westernmost buoy 46059, and the panels below the SWDat three other nearshore buoys ordered by longi-tude. The storm observed on day 344 wasapproaching from the WNW direction, as the meanwave direction corresponding to energy of thedominant period measured at buoy 46042 in thesecond half of day 344 ranged from 280� to 295�from North. Increased energy of the 10–20 s ocean
Figure 3. The location of some of the NOAA buoysclosest to the MOBB. Red color indicates buoys withdata available for the time period presented in Figure 4.
GeochemistryGeophysicsGeosystems G3G3
dolenc et al.: infragravity waves 10.1029/2005GC000988
4 of 13
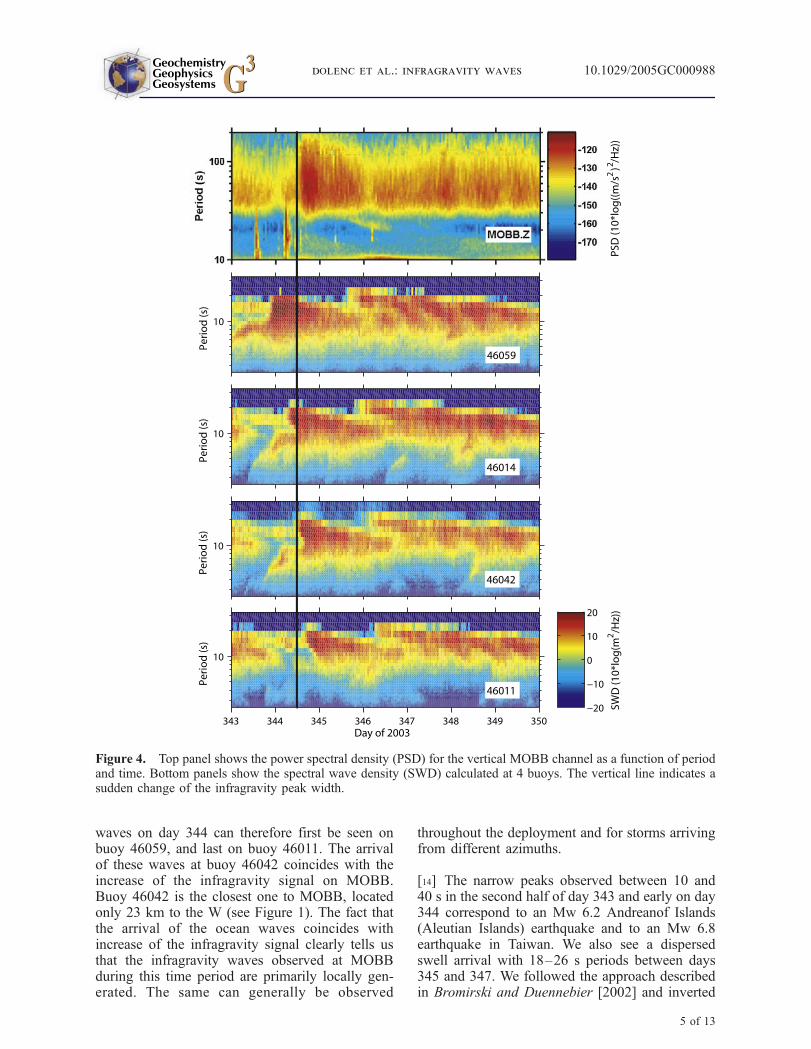
waves on day 344 can therefore first be seen onbuoy 46059, and last on buoy 46011. The arrivalof these waves at buoy 46042 coincides with theincrease of the infragravity signal on MOBB.Buoy 46042 is the closest one to MOBB, locatedonly 23 km to the W (see Figure 1). The fact thatthe arrival of the ocean waves coincides withincrease of the infragravity signal clearly tells usthat the infragravity waves observed at MOBBduring this time period are primarily locally gen-erated. The same can generally be observed
throughout the deployment and for storms arrivingfrom different azimuths.
[14] The narrow peaks observed between 10 and40 s in the second half of day 343 and early on day344 correspond to an Mw 6.2 Andreanof Islands(Aleutian Islands) earthquake and to an Mw 6.8earthquake in Taiwan. We also see a dispersedswell arrival with 18–26 s periods between days345 and 347. We followed the approach describedin Bromirski and Duennebier [2002] and inverted
Figure 4. Top panel shows the power spectral density (PSD) for the vertical MOBB channel as a function of periodand time. Bottom panels show the spectral wave density (SWD) calculated at 4 buoys. The vertical line indicates asudden change of the infragravity peak width.
GeochemistryGeophysicsGeosystems G3G3
dolenc et al.: infragravity waves 10.1029/2005GC000988
5 of 13

the dispersion trend to obtain the origin time anddistance to the swell source. We assumed a meanwater depth of 4500 m along the swell propagationpath and obtained a distance of 4800 km and forthe origin time, 01 UTC on day 343. By comparingthe SWD from the buoys in the Pacific Oceanaround the calculated origin time, we matched theswell source to a strong storm observed at the buoy46072, located in the central Aleutians, 4233 kmfrom MOBB. Similar dispersed swell arrivals canoften be observed at MOBB and most of the timetheir origin can be traced to the northern ornortheastern Pacific Ocean.
5. Modulation of Infragravity Signal
[15] The PSD for the vertical MOBB componentfor a 10-day period (01/17–27/2004) is shown inFigure 5b. As before, the strongest infragravitysignal (days 18–20) coincides with the increased
energy of 10–20 s ocean waves as recorded at thelocal buoy 46042 (Figure 5f), although the arrivalof the storm is not as sharp as in the previousexample. In addition, two types of modulation ofthe infragravity peak can be observed.
[16] The modulation with a period equal to thediurnal tide and to a lesser extent the semidiurnaltide is best seen at the short-period end of theinfragravity peak (30–40 s periods) as well asthroughout the entire infragravity band. It can beobserved for the entire 10-day period. In fact,modulation as described below is observedthroughout the deployment. This modulationclearly correlates with the amplitude of the oceantides at MOBB, shown in Figure 5a. Comparisonof the PSD and the tides shows that the infra-gravity waves have less energy at low tides. Thiscan best be seen for the strongest minima intides that occur close to the beginning of eachday for this time period. Additional small modula-
Figure 5. (a) Theoretical ocean tide at the MOBB location. (b) The power spectral density (PSD) for the verticalMOBB channel as a function of period and time. White lines indicate hours with some missing data. (c) The envelopeof the infragravity peak presented in Figure 5b, taken at the long-period end, at the PSD value of �136 dB. (d) Thesignificant wave height at the buoy 46042. (e) The spectral wave density (SWD) in the 14.3 s period bin at the buoy46042. (f) The SWD at the buoy 46042.
GeochemistryGeophysicsGeosystems G3G3
dolenc et al.: infragravity waves 10.1029/2005GC000988
6 of 13

tion can also be seen, particularly at the short-periodend of the infragravity peak. It coincides with thesecond strongest tides minima which occur close tothe middle of the day for this time period.
[17] Also observed is a low-frequency modulationwhich is best seen as the variation of the period onthe long-period side of the infragravity peak atwhich the infragravity peak rises above the noisefrom other sources (Figures 5b and 5c). Theenvelope of the observed infragravity peak on thelong-period side was taken at the PSD value of�136 dB. The infragravity peak extends to longestperiods during days 18 and 19, and then againslightly increases between days 22 and 26. First we
compare this to the significant wave height mea-sured at the local buoy 46042 (Figure 5d). Signif-icant wave height is the average of the highest 1/3of all of the wave heights during the 20-minutesampling period, calculated once every hour. Thetwo agree well in the first half of the 10-day period,but then significant wave height has a peak in thesecond half of the day 25. Comparison with theSWD plot (Figure 5f) reveals that at that time mostof the wave energy was in the waves with periodsshorter than 10 s. We therefore looked at thecorrelation between the period of the infragravitypeak envelope and the wave energy in individualfrequency bins as observed at the local buoy. Thebest correlation was observed with the ocean
Figure 6. (a–c) The period of the infragravity peak envelope, taken at the long-period end, at the PSD value of�136 dB, as a function of the SWD observed at buoy 46042 in the 12.5, 14.3, and 16.6 s period bins. (d) Thecorrelation coefficient between the period of the infragravity peak envelope and the SWD observed in the individualbins at buoy 46042, as a function of the SWD bin period. (e) The period of the infragravity peak envelope as afunction of the significant wave height as observed at the buoy 46042. Gray lines show best linear fits to the data.
GeochemistryGeophysicsGeosystems G3G3
dolenc et al.: infragravity waves 10.1029/2005GC000988
7 of 13
waves with 14.3 s period for which the SWD isshown in Figure 5e and Figure 6b. Correlationsbetween the period of the infragravity peak enve-lope and SWD of the ocean waves at two otherperiods (12.5 s and 16.6 s) as well as the significantwave height are also shown in Figure 6. Thecorrelation coefficient between the period of theinfragravity peak envelope and the SWD observedin the individual bins at buoy 46042, as a functionof the SWD bin period, is presented in Figure 6d,and confirms that the infragravity peak long-periodmodulation correlates the strongest with the oceanwave energy at �14 s.
6. Observation of Infragravity SignalDuring the Oregon ULF/VLFExperiment
[18] We have performed a similar analysis withthe seismic and buoy data recorded during the
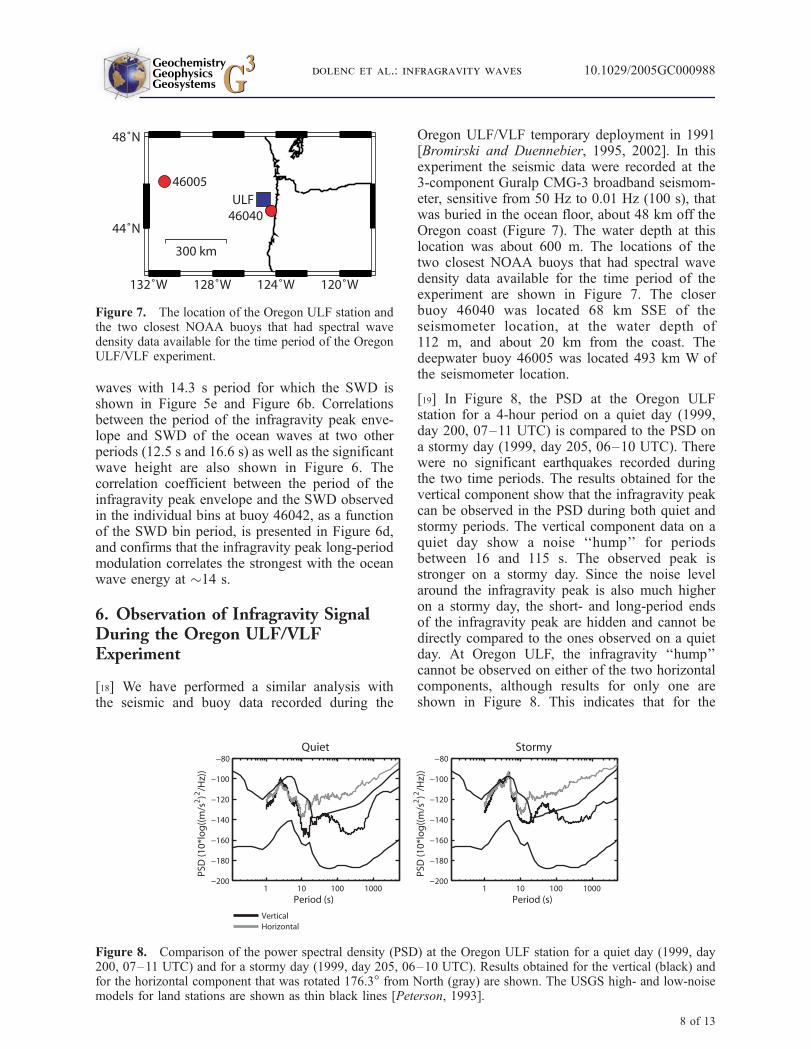
Oregon ULF/VLF temporary deployment in 1991[Bromirski and Duennebier, 1995, 2002]. In thisexperiment the seismic data were recorded at the3-component Guralp CMG-3 broadband seismom-eter, sensitive from 50 Hz to 0.01 Hz (100 s), thatwas buried in the ocean floor, about 48 km off theOregon coast (Figure 7). The water depth at thislocation was about 600 m. The locations of thetwo closest NOAA buoys that had spectral wavedensity data available for the time period of theexperiment are shown in Figure 7. The closerbuoy 46040 was located 68 km SSE of theseismometer location, at the water depth of112 m, and about 20 km from the coast. Thedeepwater buoy 46005 was located 493 km W ofthe seismometer location.
[19] In Figure 8, the PSD at the Oregon ULFstation for a 4-hour period on a quiet day (1999,day 200, 07–11 UTC) is compared to the PSD ona stormy day (1999, day 205, 06–10 UTC). Therewere no significant earthquakes recorded duringthe two time periods. The results obtained for thevertical component show that the infragravity peakcan be observed in the PSD during both quiet andstormy periods. The vertical component data on aquiet day show a noise ‘‘hump’’ for periodsbetween 16 and 115 s. The observed peak isstronger on a stormy day. Since the noise levelaround the infragravity peak is also much higheron a stormy day, the short- and long-period endsof the infragravity peak are hidden and cannot bedirectly compared to the ones observed on a quietday. At Oregon ULF, the infragravity ‘‘hump’’cannot be observed on either of the two horizontalcomponents, although results for only one areshown in Figure 8. This indicates that for the
Figure 7. The location of the Oregon ULF station andthe two closest NOAA buoys that had spectral wavedensity data available for the time period of the OregonULF/VLF experiment.
Figure 8. Comparison of the power spectral density (PSD) at the Oregon ULF station for a quiet day (1999, day200, 07–11 UTC) and for a stormy day (1999, day 205, 06–10 UTC). Results obtained for the vertical (black) andfor the horizontal component that was rotated 176.3� from North (gray) are shown. The USGS high- and low-noisemodels for land stations are shown as thin black lines [Peterson, 1993].
GeochemistryGeophysicsGeosystems G3G3
dolenc et al.: infragravity waves 10.1029/2005GC000988
8 of 13

horizontal components, noise sources other thaninfragravity waves are dominant at periods longerthan 10 s. Part of this noise is probably generatedby slight movements of the buried seismic pack-age [Bromirski and Duennebier, 1995].
[20] When compared to the result obtained withthe MOBB data, the short-period end of theinfragravity peak observed for the vertical compo-nent data extends to shorter periods. This isexpected as the Oregon ULF station was locatedat only 600 m water depth. The pressure signal atthe seafloor of depth H is related to the surfacewave height z by
Pbottom ¼ rgz= cosh kHð Þ � Psurfacee�kH ; ð1Þ
where k is the wave number and r is water density.Assuming that the pressure fluctuations are causedby freely traveling surface gravity waves the
dispersion relation can be used to determine thewave number
w2 ¼ gk tanh kHð Þ; ð2Þ
where w is angular frequency of the ocean gravitywave. For water depth at MOBB H = 1000 m andw = 2p/20s, which corresponds to the observedshort-period cutoff period at MOBB, we obtain thevalue for the product of the wave number andwater depth kH = 10.1. Using equation (2) forwater depth H = 600 m and kH = 10.1 from theabove MOBB example, we obtain the expectedshort-period cutoff period for the Oregon experi-ment to be 15.5 s. This agrees well with theobserved short-period cutoff value of 16 s.
[21] The seismic data from the Oregon experimentare noisier than the MOBB data presented above,but the infragravity signal can still easily be ob-
Figure 9. (a) The power spectral density (PSD) for the Oregon ULF vertical channel as a function of period andtime. White lines indicate hours with some missing data. (b) The envelope of the infragravity peak presented inFigure 9a, taken at the long-period end, at the PSD value of �136 dB. (c) The spectral wave density (SWD) in the12.5 s period bin at the buoy 46040. (d) The SWD at the buoy 46040. (e) The SWD at the buoy 46005.
GeochemistryGeophysicsGeosystems G3G3
dolenc et al.: infragravity waves 10.1029/2005GC000988
9 of 13

served during the 7-day deployment period (7/19–26/1991; Figure 9a). The SWD recorded at the twobuoys is shown in Figures 9d and 9e. The signalrecorded at the local buoy 46040 is again bettercorrelated with the seismic PSD. The increasedinfragravity signal observed between days 204 and206 matches the arrival of the 10–20 s oceanwaves as recorded on the local buoy 46040.
[22] The low-frequency modulation of the infra-gravity peak can again be seen as the variation ofthe period on the long-period side of the infragrav-ity peak at which the infragravity peak rises abovethe noise from other sources (Figures 9a and 9b).The envelope of the observed infragravity peak onthe long-period side was taken at the PSD value of�136 dB. The hours that had increased noisethroughout the 10–200 s period band were notused in the calculation. The correlation between theperiod of the infragravity peak envelope and thewave energy in individual frequency bins as ob-served at the local buoy 46040 is presented inFigure 10. The best correlation was observed withthe ocean waves with 12.5 s period for which theSWD is shown in Figure 9c and Figure 10b.Correlations between the period of the infragravitypeak envelope and SWD of the ocean waves at twoother periods (11.1 s and 14.3 s) are shown in
Figures 10a and 10c. The correlation coefficientbetween the period of the infragravity peak enve-lope and the SWD observed in the individual binsat buoy 46040, as a function of the SWD binperiod, is presented in Figure 10d, and confirmsthat the infragravity peak long-period modulationcorrelates the strongest with the ocean wave energyat �12.5 s.
7. Discussion
7.1. Tidal Modulation of theInfragravity Signal
[23] The fact that the observed modulated infra-gravity signal is weakest at low tides is just theopposite from what one would expect from hydro-dynamic filtering. The term ‘‘hydrodynamic filter-ing’’ is often used to describe that the pressuresignal from the ocean waves decays exponentiallywith water depth, depending on the wave numberof the waves [Kinsman, 1984]. Since only linearwaves with wave numbers comparable or smallerthan the inverse of the water depth can generatedetectable pressure fluctuations at the seafloor, onewould expect that the higher water column aboveMOBB at high tides would shield it against pres-
Figure 10. (a–c) The period of the infragravity peak envelope, taken at the long-period end, at the PSD value of�136 dB, as a function of the SWD observed at buoy 46040 in the 11.1, 12.5, and 14.3 s period bins. Gray lines showbest linear fits to the data. (d) The correlation coefficient between the period of the infragravity peak envelope and theSWD observed in the individual bins at buoy 46040, as a function of the SWD bin period.
GeochemistryGeophysicsGeosystems G3G3
dolenc et al.: infragravity waves 10.1029/2005GC000988
10 of 13

sure signal from the higher frequency infragravitywaves, which would result in weaker signal. Whatwe observe is just the opposite which indicates thatthe tides must play an important role in thegeneration of the infragravity waves rather thanjust weakening the pressure signal at the oceanbottom. Also, the effect of the hydrodynamicfiltering due to only a few meters high tides in a1000 m water depth is very small. Using equation(1), the relative change in the pressure variation atthe bottom due to 3 m water depth variation can beestimated to be only about 6% for k = 0.01/m (l =324 m). In addition, such changes in hydrodynamicfiltering should have stronger effect on the shorter-period infragravity waves. Our observations, on theother hand, show that strong modulation can beobserved throughout the entire infragravity band.
[24] Previous studies of the nonlinear interactionbetween short-period waves and currents [Longuet-Higgins and Stewart, 1960, 1961, 1964] found thatthe energy variations of the short-period wavescorrespond to work done by the currents againstthe radiation stress of the short-period waves. Themagnitude of the energy exchange between theshort-period waves and tidal current depends onthe pattern of the tidal currents, but in simplesituations, the energy of the short-period waves isin phase with the tidal elevations [Longuet-Higginsand Stewart, 1964]. This agrees with our observa-tions. At the moment, currents are not measured atthe nearby NOAA buoys, but the currents observedat the ocean bottom at MOBB clearly show thetidal pattern [Romanowicz et al., 2005, Figure 9;Uhrhammer et al., 2003]. Since the current direc-tion and speed at shallow water depths as well asdirection and amplitude of the incoming short-period waves all influence the efficiency of theenergy exchange during nonlinear interaction be-tween short-period waves and currents, futuremodeling of the observations at MOBB will helpus better understand the underlying processes. Forthis purpose a better knowledge of the surfacecurrents is needed.
[25] Another effect that the tides have on thegeneration of the infragravity waves is throughdifferent topography that is brought into play atthe same water depth during different tide heights.A study by Herbers et al. [1995b] observed that theenergy levels of the free infragravity waves on theshelf depend on the surrounding topography. Theysuggested that the shelf topography is important tothe propagation and trapping of free infragravitymotions and that generation and reflection of free
infragravity waves is sensitive to the shorelinemorphology. In our case the topography aroundMOBB is very complex (see Figure 1) and it ispossible that already a small water depth changecan significantly perturb the conditions for gener-ation and reflection of infragravity waves. Ourobservations seem to agree with observations byHerbers et al. [1995b], as we record strongerinfragravity signal at high tides, when the shelf isslightly wider. Since MOBB is located close to theedge of the shelf our results suggest that at hightides infragravity waves are more efficiently gen-erated on the shelf and/or can more efficiently leakfrom the shelf into the deeper water. Previousstudies that observed tidal modulation of the infra-gravity energy close to shore [e.g., Guza andThornton, 1982; Okihiro and Guza, 1995] sug-gested that tidal modulation could result eitherfrom the changes of the beach face slope with thetides or the changes of the surf zone width.
7.2. Short-Period (12–14 s) Ocean WaveEnergy Modulation of the InfragravitySignal
[26] The low-frequency modulation of the ob-served infragravity signal during a 10-day stormyperiod at MOBB is best correlated with the energyof the 14.3 s period ocean waves. A similar resultcan be obtained for other stormy periods at MOBB.Analysis of the data recorded during the OregonULF/VLF experiment shows best correlation withthe energy of the slightly shorter, 12.5 s periodocean waves. The data from the Oregon experi-ment only span over a 7-day period in which theenergy of the ocean waves was significantly lowerthan during the time period used for MOBB. Also,the sensor used in the Oregon experiment had ashorter long-period corner frequency. We believethat for a better understanding of the influence ofthe water depth and regional topography on theobserved correlation between the period of theocean waves and the low-frequency modulationof the infragravity peak, data from stationsdeployed simultaneously and in a relative proxim-ity of each other, as well as equipped with seis-mometers sensitive to longer than 100 s periods,should be used. Nevertheless, the results from bothdeployments are telling us that the modulation ofthe short-period (12–14 s) ocean wave energy canbe observed in the infragravity signal as well. Thissuggests that the short-period ocean waves areessential for the generation of the infragravitywaves. It is interesting to note that the same periodocean waves are also the source of the microseisms
GeochemistryGeophysicsGeosystems G3G3
dolenc et al.: infragravity waves 10.1029/2005GC000988
11 of 13

noise, observed at the double frequency, at 6–7 s.This suggests that the generation mechanisms ofinfragravity waves and double frequency micro-seisms are closely related, and originate from thenon-linear interaction of �14 s ocean waves, asalready well documented for the microseisms [e.g.,Longuet-Higgins, 1950].
7.3. Future Work
[27] In addition to the results presented in thispaper we have done a preliminary investigationof the data recorded at the station KEBB, locatedoffshore Washington, at a water depth of 2376 m.Station KEBB is part of the NEPTUNE projectwhose goal is to establish a regional ocean obser-vatory in the northeast Pacific Ocean. Preliminaryresults showed that infragravity waves observed atstation KEBB were mainly generated close to thenearby coast. A number of buoys as well asadditional ocean bottom broadband seismometersthat are already installed in the region, but forwhich the data are not available yet, will be usedto learn more about the directional properties of theobserved infragravity waves. This will be thesubject of our future study.
8. Conclusions
[28] The primary reason for installing ocean bot-tom broadband seismic stations is to record earth-quakes. Any other signal is often regarded as noiseand additional processing is required to remove it(D. Dolenc et al., manuscript in preparation, 2005).At the same time observations of non-seismicsignals, like infragravity waves, can help us learnmore about their generation and propagation. Suchobservations can also enable us to better under-stand the coupling between the ocean and the solidearth and learn more about the earth structure usingnon-seismic sources.
[29] Infragravity waves can be observed at thepermanent ocean bottom broadband seismic sta-tion MOBB on stormy as well as quiet days.When compared to the energy of the short-periodocean waves recorded at the local buoys, infra-gravity waves in the longer than 20 s period bandare found to be mainly locally generated fromshorter-period waves. Two types of modulation ofthe infragravity signal are observed. First, theentire infragravity band is modulated in-phasewith tides. It is possible that this is a result ofthe nonlinear exchange of energy between theshort-period waves and tidal currents. Second,
the low-frequency modulation of the observedinfragravity peak is best correlated with the energyof the 14.3 s period ocean waves, suggesting aclose relation of infragravity wave generation tothat of double frequency microseisms, which havemaximum energy at 6–7 s. Analysis of the datarecorded during the Oregon ULF/VLF experimentalso indicates that infragravity waves are primarilylocally generated. In this case, the low-frequencymodulation of the observed infragravity peak isbest correlated with the energy of the 12.5 s periodocean waves. To better understand the influence ofthe water depth and regional topography on theobserved correlation between the low-frequencymodulation of the infragravity peak and period ofthe ocean waves it would be important to use datafrom stations deployed simultaneously in a relativeproximity of each other.
[30] To better understand the coupling between theocean and the solid earth it will be important tocompare observations from different broadbandocean bottom stations and nearby buoys. Futureexperiments that will include a large array of oceanbottom broadband seismometers as well as datafrom a dense network of ocean buoys will help uslearn more about the directional distribution ofinfragravity waves and their generation.
Acknowledgments
[31] The MOBB instrumentation, deployment, and mainte-
nance were supported by the Lucile and David Packard Foun-
dation funds to MBARI, the NSF grant OCE9911392, and UC
Berkeley funds to BSL. The ocean wave data were obtained
from the National Data Buoy Center. The data from the Oregon
ULF/VLF experiment were kindly provided by P. Bromirski.
Preliminary data from the ocean bottom broadband station
KEBB were kindly shared with us by W. Wilcock. Theoretical
ocean tides were computed using the program package SPOTL
[Agnew, 1996]. We thank M. S. Longuet-Higgins for directing
our attention to the interaction between gravity waves and tidal
currents as a possible mechanism for the observed modulation
of the infragravity signal. This is contribution number 05-09 of
the UC Berkeley Seismological Laboratory.
References
Agnew, D. C. (1996), SPOTL: Some programs for ocean-tideloading, SIO Ref. Ser., 96-8, 35 pp., Scripps Inst. of Ocean-ogr., La Jolla, Calif.
Araki, E., M. Shinohara, S. Sacks, A. Linde, T. Kanazawa,H. Shiobara, H. Mikada, and K. Suyehiro (2004), Improve-ment of seismic observation in the ocean by use of seafloorboreholes, Bull. Seismol. Soc. Am., 94, 678–690.
Bromirski, P. D., and F. K. Duennebier (1995), Seismo-acoustic signals and noise in the near-shore environment,SOEST Rep. 95-03, 110 pp., Univ. of Hawaii, Honolulu.
GeochemistryGeophysicsGeosystems G3G3
dolenc et al.: infragravity waves 10.1029/2005GC000988
12 of 13
Bromirski, P. D., and F. K. Duennebier (2002), The near-coastal microseism spectrum: Spatial and temporal waveclimate relationships, J. Geophys. Res., 107(B8), 2166,doi:10.1029/2001JB000265.
Cox, C., T. Deaton, and S. Webb (1984), A deep-sea differentialpressure gauge, J. Atmos. Oceanic Technol., 1, 237–246.
Elgar, S., T. H. C. Herbers, M. Okihiro, J. Oltman-Shay, andR. T. Guza (1992), Observations of infragravity waves,J. Geophys. Res., 97, 15,573–15,577.
Guza, R. T., and E. B. Thornton (1982), Swash oscillations ona natural beach, J. Geophys. Res., 87, 483–492.
Herbers, T. H. C., S. Elgar, and R. T. Guza (1995a), Generationand propagation of infragravity waves, J. Geophys. Res.,100, 24,863–24,872.
Herbers, T. H. C., S. Elgar, R. T. Guza, and W. C. O’Reilly(1995b), Infragravity-frequency (0.005–0.05 Hz) motionson the shelf, Part II: Free waves, J. Phys. Oceanogr., 25,1063–1079.
Kinsman, B. (1984), Wind Waves: Their Generation and Pro-pagation on the Ocean Surface, 676 pp., Prentice-Hall,Upper Saddle River, N. J.
Longuet-Higgins, M. S. (1950), A theory of the origin ofmicroseisms, Philos. Trans. R. Soc. London, Ser. A, 243,1–35.
Longuet-Higgins, M. S., and R. W. Stewart (1960), Changes inthe form of short gravity waves on long waves and tidalcurrents, J. Fluid Mech., 8, 565–583.
Longuet-Higgins, M. S., and R. W. Stewart (1961), Thechanges in amplitude of short gravity waves on steadynon-uniform currents, J. Fluid Mech., 10, 529–549.
Longuet-Higgins, M. S., and R. W. Stewart (1964), Radiationstresses in water waves: A physical discussion, with applica-tions, Deep Sea Res. Oceanogr. Abstr., 11, 529–562.
McGill, P., D. Neuhauser, D. Stakes, B. Romanowicz,T. Ramirez, and R. Uhrhammer (2002), Deployment of along-term broadband seafloor observatory in MontereyBay, Eos Trans. AGU, 83(47), Fall Meet. Suppl., AbstractS71A-1049.
Munk, W. H. (1949), Surf beats, Eos Trans. AGU, 30, 849–854.
Okihiro, M., and R. T. Guza (1995), Infragravity energy mod-ulation by tides, J. Geophys. Res., 100, 16,143–16,148.
Peterson, J. (1993), Observation and modeling of seismic back-ground noise, U.S. Geol. Surv. Tech. Rep., 93-322, 95 pp.
Rhie, J., and B. Romanowicz (2004), Excitation of Earth’scontinuous free oscillations by atmosphere-ocean-seafloorcoupling, Nature, 431, 552–556.
Romanowicz, B., et al. (1998), MOISE: A pilot experimenttowards long term sea-floor geophysical observatories, EarthPlanets Space, 50, 927–937.
Romanowicz, B., D. Stakes, R. Uhrhammer, P. McGill,D. Neuhauser, T. Ramirez, and D. Dolenc (2003), TheMOBB Experiment: A prototype permanent off-shore oceanbottom broadband station, Eos Trans. AGU, 84(34), 331–332, 325.
Romanowicz, B., D. Stakes, D. Dolenc, D. Neuhauser,P. McGill, R. Uhrhammer, and T. Ramirez (2005), TheMonterey Bay broadband ocean bottom seismic observatory,Ann. Geophys., in press.
Snodgrass, F. E., G. W. Groves, K. F. Hasselmann, G. R.Miller, W. H. Munk, and W. H. Powers (1966), Propagationof ocean swell across the Pacific, Philos. Trans. R. Soc.London, Ser. A, 259, 431–497.
Stephen, R. A., F. N. Spiess, J. A. Collins, J. A. Hildebrand,J. A. Orcutt, K. R. Peal, F. L. Vernon, and F. B. Wooding(2003), Ocean Seismic Network Pilot Experiment,Geochem. Geophys. Geosyst., 4(10), 1092, doi:10.1029/2002GC000485.
Stutzmann, E., et al. (2001), MOISE: A prototype multipara-meter ocean-bottom station, Bull. Seismol. Soc. Am., 91,885–892.
Sutton, G. H., W. G. McDonald, D. D. Prentiss, and S. N.Thanos (1965), Ocean-bottom seismic observatories, Proc.IEEE, 53, 1909–1921.
Tanimoto, T. (2005), The oceanic excitation hypothesis for thecontinuous oscillation of the Earth, Geophys. J. Int., 160,276–288.
Tucker, M. J. (1950), Surf beats: Sea waves of 1 to 5 min.period, Proc. R. Soc. London, Ser. A, 202, 565–573.
Uhrhammer, R., B. Romanowicz, D. Neuhauser, D. Stakes,P. McGill, and T. Ramirez (2002), Instrument testing andfirst results from the MOBB Observatory, Eos Trans.AGU, 83(47), Fall Meet. Suppl., Abstract S71A-1048.
Uhrhammer, R. A., D. Dolenc, B. Romanowicz, D. Stakes,P. McGill, D. Neuhauser, and T. Ramirez (2003), MOBB:Data analysis from an ocean floor broadband seismic obser-vatory, Eos Trans. AGU, 84(46), Fall Meet. Suppl., AbstractS52D-0162.
Webb, S. C. (1992), The equilibrium microseism spectrum,J. Acoust. Soc. Am., 92, 2141–2158.
Webb, S. C. (1998), Broadband seismology and noise underthe ocean, Rev. Geophys., 36, 105–142.
Webb, S. C., X. Zhang, and W. Crawford (1991), Infragravitywaves in the deep ocean, J. Geophys. Res., 96, 2723–2736.
GeochemistryGeophysicsGeosystems G3G3
dolenc et al.: infragravity waves 10.1029/2005GC000988
13 of 13