geochemical baselines for surface waters and stream ...survey editorial standards and stratigraphic...
TRANSCRIPT
U. S. DEPARTMENT OF THE INTERIOR U.S. GEOLOGICAL SURVEY
Geochemical Baselines for Surface Waters and Stream Sediments and ProcessesControlling Element Mobility, Rough and Ready Creek and Oregon
Caves National Monument and Vicinity, Southwestern Oregon
by
William R. Miller, David B. Smith, Alien L. Meier, Paul H. Briggs, Peter M. Theodorakos, Richard F. Sanzolone, and Robert B. Vaughn
Open-File Report 98-201
This report is preliminary and has not been reviewed for conformity with the U.S. GeologicalSurvey editorial standards and stratigraphic nomenclature. Any use of trade product or firm
names is for descriptive purposes only and does not imply endorsement by the U.S. Government.
"U.S. Geological Survey, DFC, Box 25046, MS 973, Denver, CO 80225
Introduction
When precipitation falls within a drainage basin, water comes into contact with rock- forming minerals and chemical weathering is initiated. Chemical weathering within a basin involves the congruent dissolution of minerals such as calcite or the incongruent dissolution and transformation of minerals such as plagioclase to clay minerals. These processes release elements to the natural waters of a basin. Therefore, the chemical composition of natural waters evolved within a basin that has not been affected by human influence is determined primarily by the chemical composition of rocks within the basin. Climate (mainly precipitation and temperature) plays a role, particularly in determining the rates of water-rock reactions, but composition of the rocks is the fundamental control.
There are multiple methods for quantifying the composition of rocks within a drainage basin. The approximate major element composition of most rock types can generally be inferred from geologic maps, thereby giving a degree of insight into the expected major element composition of natural waters of the basin in question. However, this is not true for trace elements, which can vary by two or more orders of magnitude within the same rock type. Quantification of rock composition involves sampling and chemically analyzing the rocks themselves or the stream sediments within a drainage basin. Sediments provide a robust sample that is easy to collect and representative of the composition of the rocks, soils, and mechanical weathering products upstream from sampling sites (Plant and Hale, 1994).
The background geochemistry of natural waters is, by definition, the composition of the waters without any input from human activities. Unfortunately, there is probably no place in the world in which the background composition of waters has not been modified to some extent by anthropogenic activities such as agriculture, urbanization, or mining. This input is always superimposed on the natural background geochemistry. Relatively pristine areas, such as National Parks or National Forests, may contain areas which are only minimally affected by human influence. At these sites, geochemical baselines (defined as the chemical composition at a given point in time regardless of human input) can be determined for stream waters and may approximate the true background geochemistry. This information is useful for an understanding of the processes responsible for the chemical composition of waters within a drainage basin. In addition, because water geochemistry is sensitive to changes in the environment, the monitoring of water geochemistry allows us to recognize and quantify changes in the environment of the basin under study.
The purpose of this study is to determine the geochemical baseline for the time of sampling for a wide range of major, minor, and trace elements in selected stream and spring waters in the Rough and Ready Creek drainage basin within the Siskiyou National Forest,
1
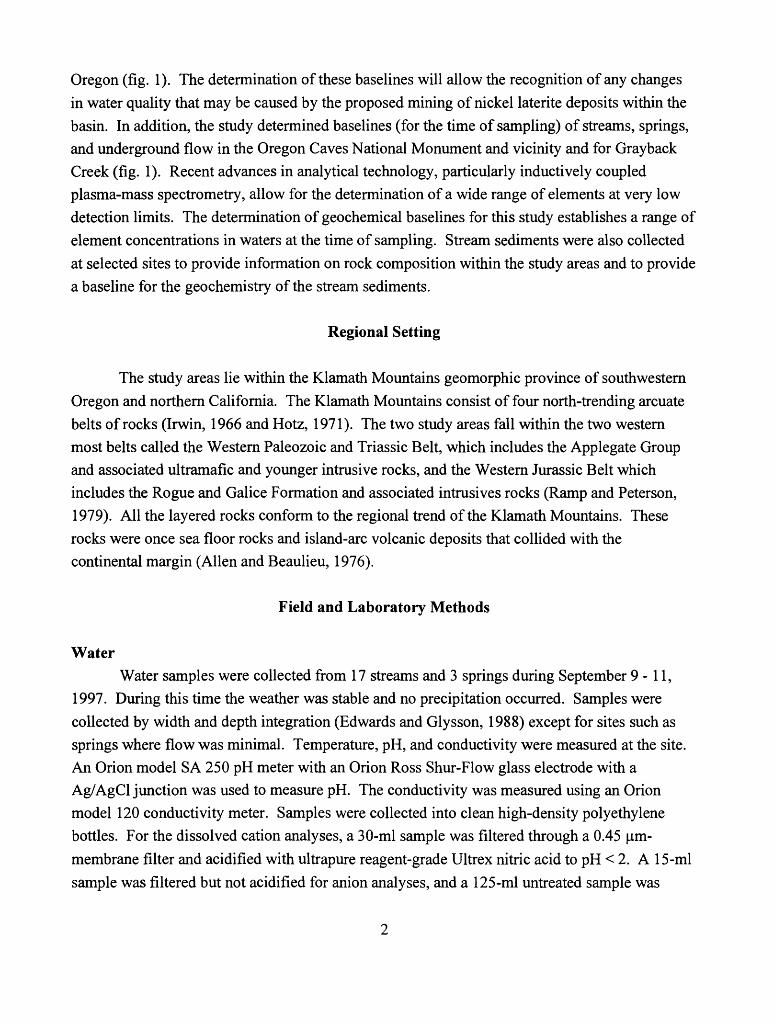
Oregon (fig. 1). The determination of these baselines will allow the recognition of any changes
in water quality that may be caused by the proposed mining of nickel laterite deposits within the basin. In addition, the study determined baselines (for the time of sampling) of streams, springs, and underground flow in the Oregon Caves National Monument and vicinity and for Grayback Creek (fig. 1). Recent advances in analytical technology, particularly inductively coupled plasma-mass spectrometry, allow for the determination of a wide range of elements at very low detection limits. The determination of geochemical baselines for this study establishes a range of element concentrations in waters at the time of sampling. Stream sediments were also collected
at selected sites to provide information on rock composition within the study areas and to provide a baseline for the geochemistry of the stream sediments.
Regional Setting
The study areas lie within the Klamath Mountains geomorphic province of southwestern
Oregon and northern California. The Klamath Mountains consist of four north-trending arcuate belts of rocks (Irwin, 1966 and Hotz, 1971). The two study areas fall within the two western most belts called the Western Paleozoic and Triassic Belt, which includes the Applegate Group and associated ultramafic and younger intrusive rocks, and the Western Jurassic Belt which includes the Rogue and Galice Formation and associated intrusives rocks (Ramp and Peterson, 1979). All the layered rocks conform to the regional trend of the Klamath Mountains. These rocks were once sea floor rocks and island-arc volcanic deposits that collided with the continental margin (Alien and Beaulieu, 1976).
Field and Laboratory Methods
WaterWater samples were collected from 17 streams and 3 springs during September 9-11,
1997. During this time the weather was stable and no precipitation occurred. Samples were
collected by width and depth integration (Edwards and Glysson, 1988) except for sites such as springs where flow was minimal. Temperature, pH, and conductivity were measured at the site. An Orion model SA 250 pH meter with an Orion Ross Shur-Flow glass electrode with a Ag/AgCl junction was used to measure pH. The conductivity was measured using an Orion model 120 conductivity meter. Samples were collected into clean high-density polyethylene bottles. For the dissolved cation analyses, a 30-ml sample was filtered through a 0.45 fim-
membrane filter and acidified with ultrapure reagent-grade Ultrex nitric acid to pH < 2. A 15-ml
sample was filtered but not acidified for anion analyses, and a 125-ml untreated sample was
Josephine County Grayback Creek
AreaRough and Ready Creek Area
Oregon Caves National Monument and vicinity Area
Figure 1. Location map showing the study areas, Southwestern Oregon
collected for alkalinity measurement. The samples were stored in an ice chest after collection and later in a refrigerator and kept cool until analyzed.
Upon return to the USGS laboratories, alkalinity as HCO3", was determined by titration
with H2 SO4 using an Orion Model 960 autochemistry system, Richard Sanzolone, analyst. The anions sulfate, chloride, nitrate, and fluoride were determined by ion chromatography (1C) (Fishman and Pyen, 1979), Peter Theodorakos, analyst. The cations Mg, Na, Fe, and P were analyzed by inductively coupled plasma - atomic emission spectrometry (ICP-AES) (Briggs and Fey, 1996). The remaining cations were analyzed by inductively coupled plasma - mass
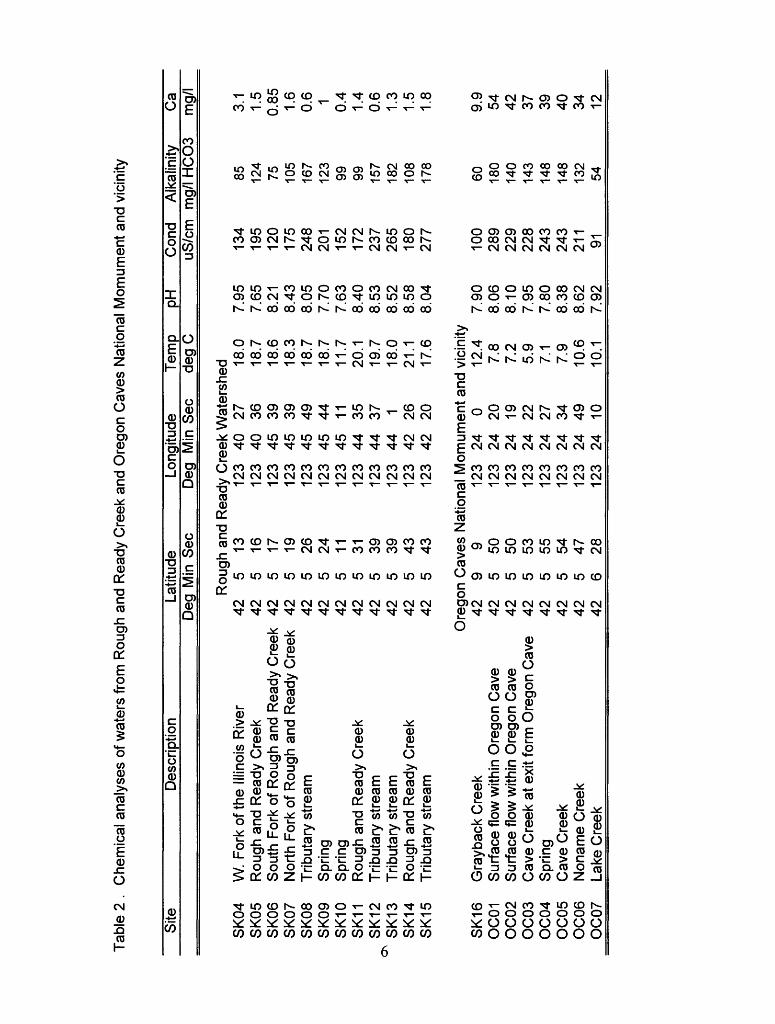
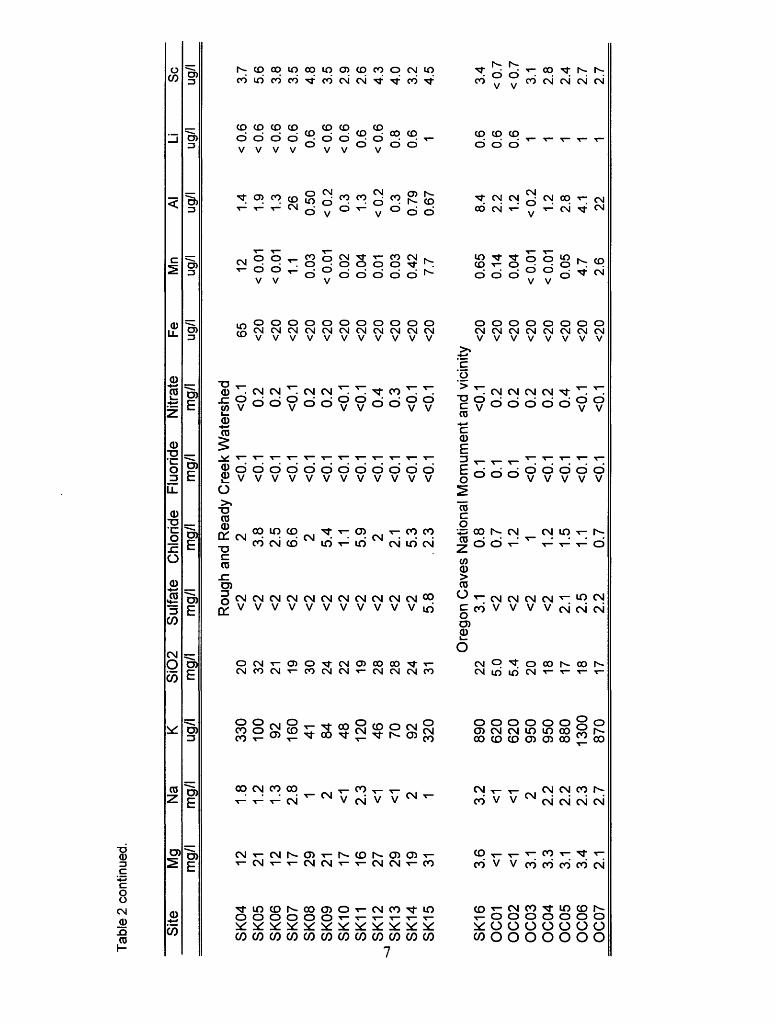
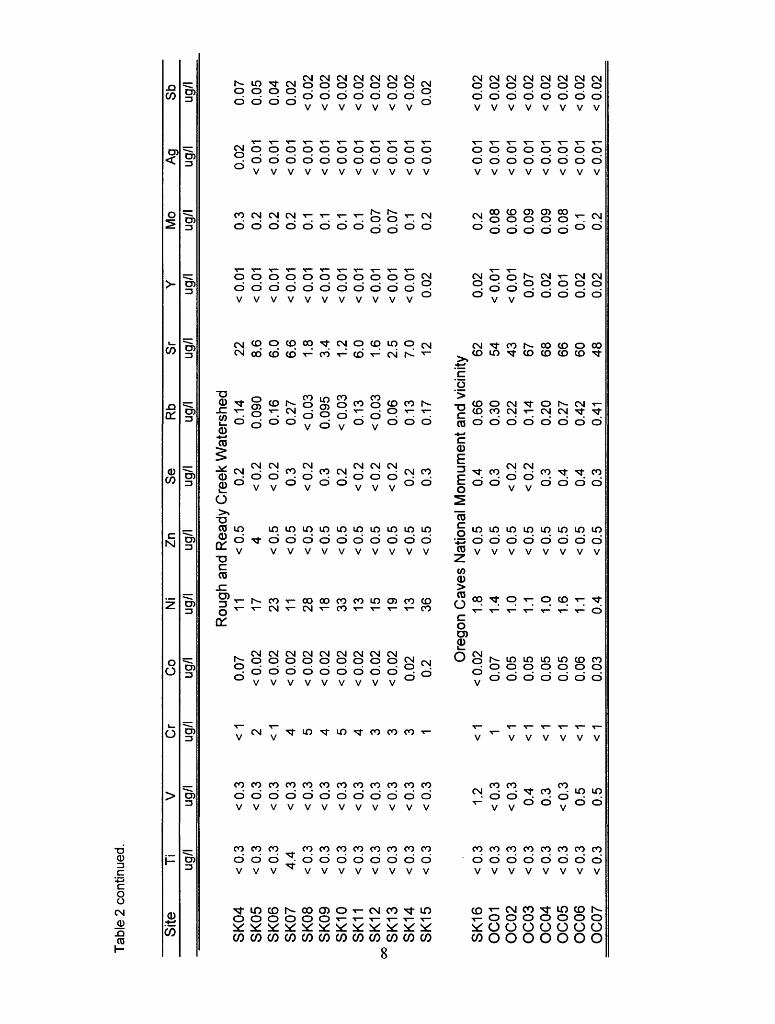
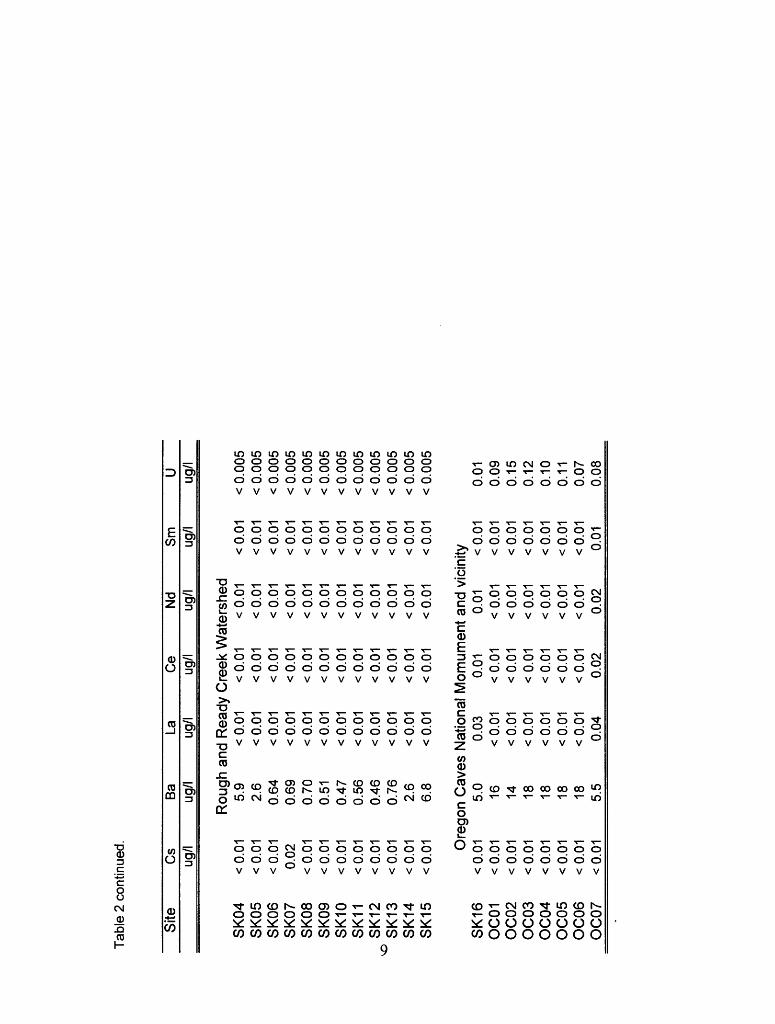
spectrometry (ICP-MS) (Meier and others, 1994). Duplicate water samples, blank samples, and USGS Water Resource Division standard reference waters were analyzed with each data set. Elements which were analyzed for, but were below analytical detection for all the samples are shown in Table 1. The chemical analyses of the water samples are shown in Table 2.
Stream SedimentsStream sediment samples were collected and chemically analyzed from eleven sites
within the study areas. The purpose of determining geochemical baselines for sediments was to
provide an estimate of the rock composition within the sampled basin. This information, in turn, was used to gain insight into the processes which affected water chemistry within the basin.
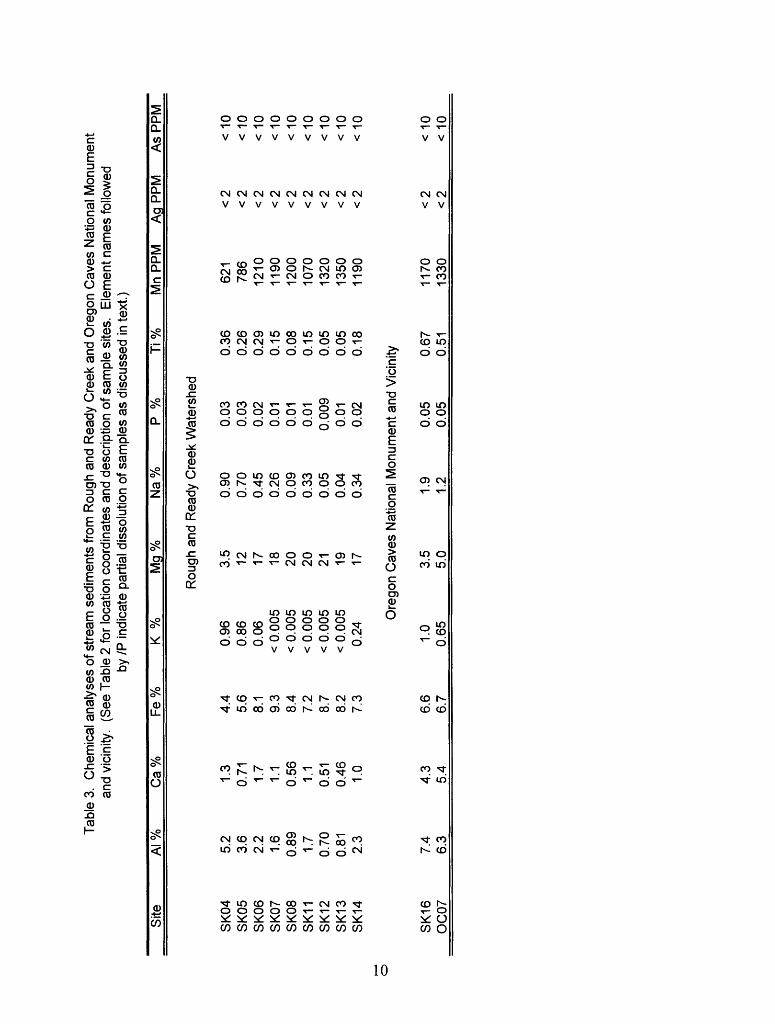
Each sediment sample was collected from approximately 100 meters of stream in the vicinity of the location shown on Figs. 2, 4, and 5. The sediment was passed through a 2-mm screen at the sample site, air dried, and transported to the U.S. Geological Survey in Denver, CO for preparation and analysis. In the lab, the samples were sieved to minus-0.18 mm (minus-80 mesh), ground to minus-0.15 mm (minus-100 mesh) and submitted for chemical analysis. The sediment analyses were performed by XRAL, Inc. under contract with the USGS.
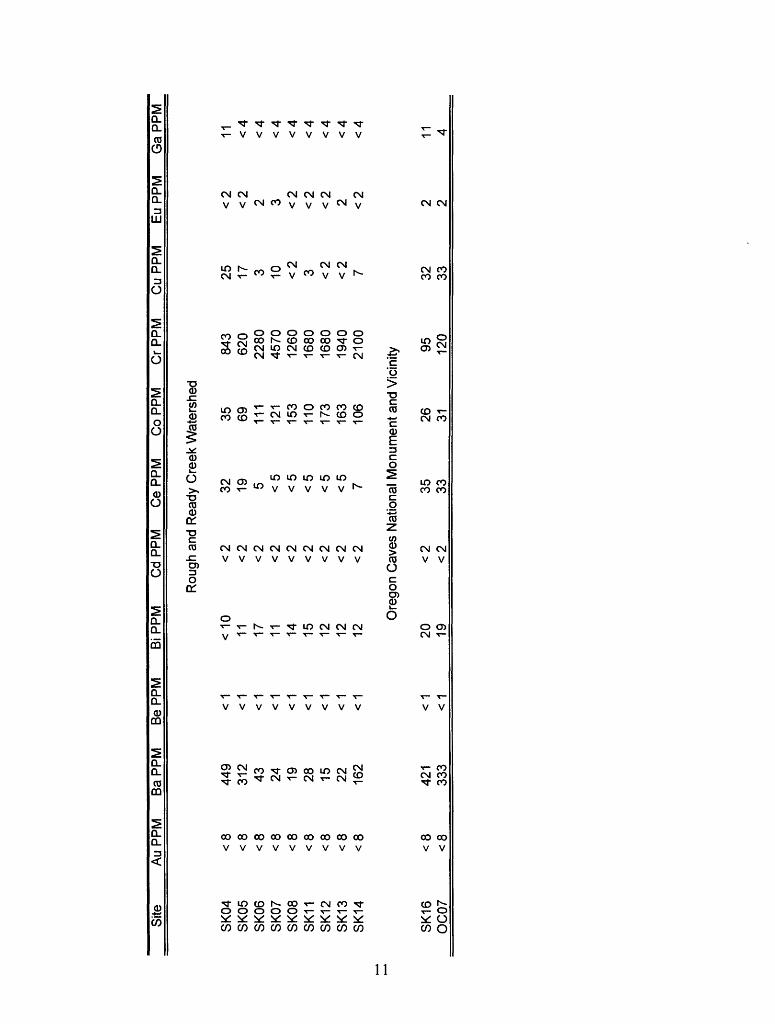
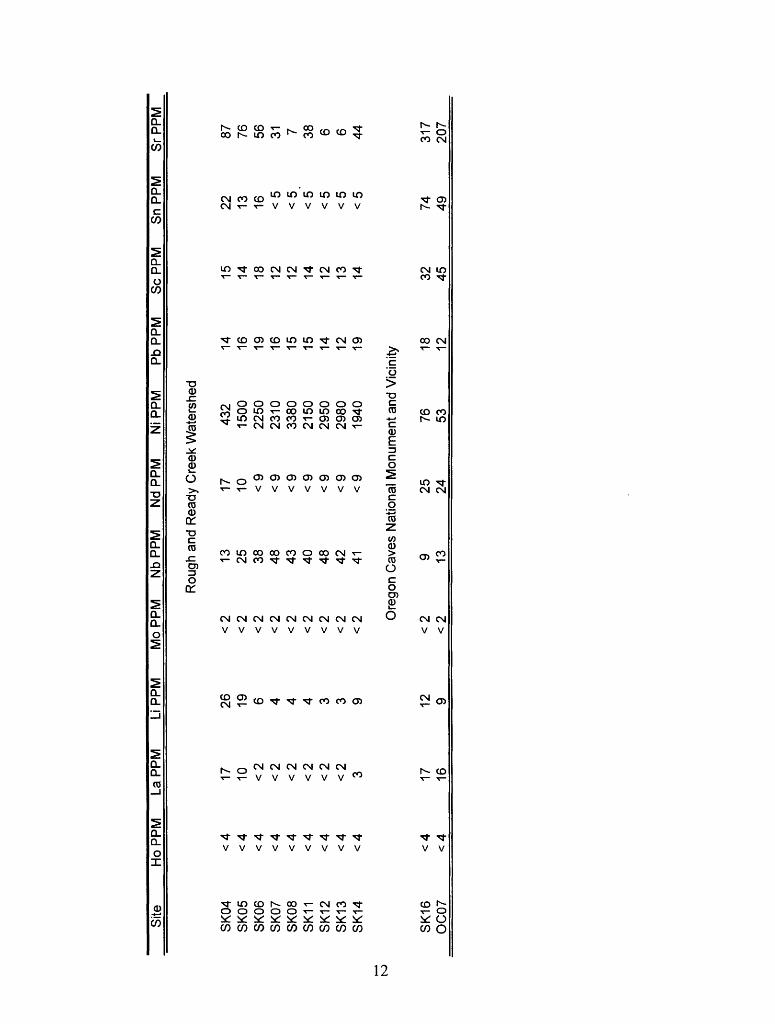
The samples were analyzed for forty elements by inductively coupled plasma-atomic emission spectrometry (ICP-AES) using for sample digestion a mixture of hydrochloric, nitric, perchloric, and hydrofluroic acids at low temperature to achieve a total decomposition of all mineral phases in the sample (Briggs, 1996). The samples were also analyzed by ICP-AES for ten elements using a hydrochloric acid-hydrogen peroxide digestion (Motooka, 1996). This digestion solubilizes metals not tightly bound within silicate minerals and, thus, constitutes only
a partial dissolution of the sample. The data for each of these methods is shown in Table 3.
Rough and Ready Creek Study Area
Most of the rocks (>90%) within the Rough and Ready Creek watershed consist of serpentinite and partly serpentinized peridotite which make up the Josephine ultramafic sheet.

Table 1. Elements in water samples that were all below level of detection, Rough and Ready Creek and Oregon Cave National Monument and vicinity, Oregon
Element Lower level of analytical detection in ppb
PBeCuGaGeAsZrNbCdInSnTePrEuTbGdDyHoEr
TmYbHfTaWReAuPbBiThTl
500.050.5
0.020.20.4
0.050.020.020.010.070.1
0.010.0050.0050.0050.0050.0050.0050.0050.010.050.020.1
0.020.010.050.010.010.05
Tab
le 2
. C
hem
ical
ana
lyse
s of
wat
ers
from
Rou
gh a
nd R
eady
Cre
ek a
nd O
rego
n C
aves
Nat
iona
l M
omum
ent
and
vici
nity
Site
Des
crip
tion
Latit
ude
Deg
Min
Long
itude
Sec
D
egM
in S
ecT
emp
degC
PHC
ond
Alk
alin
ityC
auS
/cm
m
g/l
HC
O3
mg/
l
Rou
gh a
nd R
eady
Cre
ek W
ater
shed
SK
04S
K05
SK
06S
K07
SK
08S
K09
SK
10S
K11
ON
^^
^ S
K13
SK
14S
K15
W.
For
k of
the
Illin
ois
Riv
erR
ough
and
Rea
dy C
reek
Sou
th F
ork
of R
ough
and
Rea
dy C
reek
Nor
th F
ork
of R
ough
and
Rea
dy C
reek
Trib
utar
y st
ream
Spr
ing
Spr
ing
Rou
gh a
nd R
eady
Cre
ekT
ribut
ary
stre
amT
ribut
ary
stre
amR
ough
and
Rea
dy C
reek
Trib
utar
y st
ream
42 42 42 42 42 42 42 42 42 42 42 42
Ore
gon
SK
16O
C01
OC
02O
C03
OC
04O
C05
OC
06O
C07
Gra
ybac
k C
reek
Sur
face
flo
w w
ithin
Ore
gon
Cav
eS
urfa
ce fl
ow w
ithin
Ore
gon
Cav
eC
ave
Cre
ek a
t ex
it fo
rm O
rego
n C
ave
Spr
ing
Cav
e C
reek
Non
ame
Cre
ekLa
ke C
reek
42 42 42 42 42 42 42 42
5 5 5 5 5 5 5 5 5 5 5 5
13 16 17 19 26 24 11 31 39 39 43 43
Cav
es9 5 5 5 5 5 5 6
9 50 50 53 55 54 47 28
123
123
123
123
123
123
123
123
123
123
123
123
40
2740
36
45
3945
39
45
4945
44
45
1144
35
44
3744
1
42
2642
20
Nat
iona
l M
omum
ent
123
123
123
123
123
123
123
123
24
024
20
24
1924
22
24
2724
34
24
4924
10
18.0
18.7
18.6
18.3
18.7
18.7
11.7
20.1
19.7
18.0
21.1
17.6
and
vici
nity
12.4
7.8
7.2
5.9
7.1
7.9
10.6
10.1
7.95
7.65
8.21
8.43
8.05
7.70
7.63
8.40
8.53
8.52
8.58
8.04
7.90
8.06
8.10
7.95
7.80
8.38
8.62
7.92
134
195
120
175
248
201
152
172
237
265
180
277
100
289
229
228
243
243
211
91
85 124
75 105
167
123
99 99 157
182
108
178
60 180
140
143
148
148
132
54
3.1
1.5
0.85 1.6
0.6 1 0.4
1.4
0.6
1.3
1.5
1.8
9.9
54 42 37 39 40 34 12
Tab
le 2
con
tinue
d.
Site
SK
04S
K05
SK
06S
K07
SK
08S
K09
SK
10S
K11
SK
12"S
K13
SK
14S
K15
Mg
mg/
l
12 21 12 17 29 21 17 16 27 29 19 31
Na
mg/
l
1.8
1.2
1.3
2.8 1 2 <1 2.3
<1 <1 2 1
K ug/l
330
100
92 160
41 84 48 120
46 70 92 320
SiO
2 S
ulfa
tem
g/l
20 32 21 19 30 24 22 19 28 28 24 31
mg/
l
Rou
gh<2 <2 <2 <2 <2 <2 <2 <2 <2 <2 <2 5.
8
Chl
orid
em
g/l
and
Rea
dy2 3.8
2.5
6.6 2 5.4
1.1
5.9 2 2.1
5.3
.2.3
Ore
gon
Cav
es N
atio
nal
SK
16O
C01
OC
02O
C03
OC
04O
C05
OC
06O
C07
3.6
<1 <1 3.1
3.3
3.1
3.4
2.1
3.2
<1 <1 2 2.2
2.2
2.3
2.7
890
620
620
950
950
880
1300
870
22 5.0
5.4
20 18 17 18 17
3.1
<2 <2 <2
<2 2.1
2.5
2.2
0.8
0.7
1.2 1 1.2
1.5
1.1
0.7
Flu
orid
e N
itrat
em
g/l
mg/
l
Cre
ek W
ater
shed
<0.1
<0
.1<0
.1
0.2
<0.1
0.
2<0
.1
<0.1
<0.1
0.
2<0
.1
0.2
<0.1
<0
.1<0
.1
<0.1
<0.1
0.
4<0
.1
0.3
<0.1
<0
.1<0
.1
<0.1
Mom
umen
t an
d vi
cini
ty0.
1 <0
.10.
1 0.
20.
1 0.
2<0
.1
0.2
<0.1
0.
2<0
.1
0.4
<0.1
<0
.1<0
.1
<0.1
Fe ug/l
65 <20
<20
<20
<20
<20
<20
<20
<20
<20
<20
<20
<20
<20
<20
<20
<20
<20
<20
<20
Mn
ug/l
12<
0.0
1<
0.0
11.
10.
03<
0.0
10.
020.
040.
010.
030.
42 7.7
0.65
0.14
0.04
<0
.01
<0
.01
0.05
4.7
2.6
Al
ug/l
1.4
1.9
1.3
26 0.50
<0.2
0.3
1.3
<0
.2
0.3
0.79
0.67 8.4
2.2
1.2
<0.2
1.2
2.8
4.1
22
Li ug/l
<0
.6<
0.6
<0
.6<
0.6
0.6
<0
.6<
0.6
0.6
<0
.6
0.8
0.6 1 0.6
0.6
0.6 1 1 1 1 1
Sc
ug/l
3.7
5.6
3.8
3.5
4.8
3.5
2.9
2.6
4.3
4.0
3.2
4.5
3.4
<0.7
<0.7
3.1
2.8
2.4
2.7
2.7
Tabl
e 2
cont
inue
d.
Site
SK
04S
K05
SK
06S
K07
SK
08S
K09
SK
10S
K11
SK
12oo
SK
13S
K14
SK
15
Ti ug/l
<0.3
<0
.3<
0.3
4.4
<0.3
<0.3
<0
.3<
0.3
<0.3
<0
.3<
0.3
<0.3
V ug/l
<0
.3<
0.3
<0.3
<0.3
<0.3
<0.3
<0
.3<
0.3
<0
.3<
0.3
<0.3
<0
.3
Cr
ug/l
<1 2 <1 4 5 4 5 4 3 3 3 1
Co
Ni
ug/l
ug/l
Rou
gh0.
07
11<
0.0
2
17<
0.02
23
<0
.02
11
< 0.
02
28<
0.0
2
18<
0.02
33
<0
.02
13
<0
.02
15
<0
.02
19
0.02
13
0.2
36
Zn
ug/l
and
Rea
dy<0
.5 4<
0.5
<0
.5<
0.5
<0.5
<0.5
<0
.5<
0.5
<0
.5<
0.5
<0.5
Ore
gon
Cav
es N
atio
nal
SK
16O
C01
OC
02O
C03
OC
04O
C05
OC
06O
C07
<0.3
<0.3
<0
.3<
0.3
<0
.3<
0.3
<0
.3<
0.3
1.2
<0.3
<0.3
0.4
0.3
<0.3
0.5
0.5
<1 1 <1
<1
<1
<1
<1
<1
<0
.02
1.
80.
07
1.4
0.05
1.
00.
05
1.1
0.05
1.
00.
05
1.6
0.06
1.
10.
03
0.4
<0
.5<
0.5
<0
.5<
0.5
<0.5
<0.5
<0.5
<0
.5
Se
ug/l
Rb
Sr
ug/l
ug/l
Y ug/l
Mo
ug/l
Ag ug/l
Sb
ug/l
Cre
ek W
ater
shed
0.2
<0.2
<0.
20.
3<
0.2
0.3
0.2
<0.2
<0
.2<
0.2
0.2
0.3
Mom
umen
t0.
40.
3<0
.2<
0.2
0.3
0.4
0.4
0.3
0.14
22
0.09
0 8.
60.
16
6.0
0.27
6.
6<
0.0
3
1.8
0.09
5 3.
4<
0.0
3
1.2
0.13
6.
0<
0.0
3
1.6
0.06
2.
50.
13
7.0
0.17
12
and
vici
nity
0.66
62
0.30
54
0.22
43
0.14
67
0.20
68
0.27
66
0.42
60
0.41
48
<0.0
1<0
.01
<0.0
1<0
.01
<0.0
1<0
.01
<0.0
1<0
.01
<0.0
1<0
.01
<0.0
10.
02
0.02
<0
.01
<0
.01
0.07
0.02
0.01
0.02
0.02
0.3
0.2
0.2
0.2
0.1
0.1
0.1
0.1
0.07
0.07 0.1
0.2
0.2
0.08
0.06
0.09
0.09
0.08 0.1
0.2
0.02
<0
.01
<0
.01
<0.0
1<
0.0
1<
0.0
1<
0.0
1<
0.0
1<
0.0
1<
0.0
1<
0.0
1<
0.0
1
<0
.01
<0.0
1<
0.0
1<
0.0
1<
0.0
1<
0.0
1<
0.0
1<
0.0
1
0.07
0.05
0.04
0.02
<0.0
2<
0.0
2<
0.0
2<
0.0
2<
0.0
2<
0.0
2<
0.0
20.
02
<0.0
2<
0.0
2<
0.0
2<
0.0
2<
0.0
2<
0.0
2<
0.0
2<
0.0
2
Tab
le 2
con
tinue
d.
Site
SK
04S
K05
SK
06S
K07
SK
08S
K09
SK
10S
K11
SK
12° S
K13
SK
14S
K15
Cs
ug/l
<0
.01
<0
.01
<0.0
10.
02<
0.0
1<
0.0
1<
0.0
1<
0.0
1<
0.0
1<
0.0
1<
0.0
1<
0.0
1
Ba
ug/l
Rou
gh5.
92.
60.
640.
690.
700.
510.
470.
560.
460.
762.
66.
8
La ug/l
and
Rea
dy<
0.0
1<
0.0
1<
0.0
1<
0.0
1<
0.0
1<
0.0
1<
0.0
1<
0.0
1<
0.0
1<
0.0
1<
0.0
1<
0.0
1
Ore
gon
Cav
es N
atio
nal
SK
16O
C01
OC
02O
C03
OC
04O
C05
OC
06O
C07
<0
.01
<0.0
1<
0.0
1<
0.0
1<
0.0
1<
0.0
1<
0.0
1<
0.0
1
5.0
16 14 18 18 18 18 5.5
0.03
<0
.01
<0.0
1<
0.0
1<
0.0
1<
0.0
1<
0.0
10.
04
Ce
ug/l
Nd
ug/l
Sm
ug/l
u ug/l
Cre
ek W
ater
shed
<0.0
1<0
.01
<0.0
1<
0.0
1<
0.0
1<
0.0
1<
0.0
1<
0.0
1<
0.0
1<
0.0
1<
0.0
1<
0.0
1
Mom
umen
t0.
01<
0.0
1<
0.0
1<
0.0
1<
0.0
1<
0.0
1<
0.0
10.
02
<0.0
1<0
.01
<0.0
1<
0.0
1<
0.0
1<
0.0
1<
0.0
1<
0.0
1<
0.0
1<
0.0
1<
0.0
1<
0.0
1
<0.0
1<
0.0
1<
0.0
1<
0.0
1<
0.0
1<
0.0
1<
0.0
1<
0.0
1<
0.0
1<
0.0
1<
0.0
1<
0.0
1
< 0.
005
< 0.
005
< 0.
005
< 0.
005
< 0.
005
< 0.
005
< 0.
005
< 0.
005
< 0.
005
< 0.
005
< 0.
005
< 0.
005
and
vici
nity
0.01
<0.0
1<
0.0
1<
0.0
1<
0.0
1<
0.0
1<
0.0
10.
02
<0.0
1<
0.0
1<
0.0
1<
0.0
1<
0.0
1<
0.0
1<
0.0
10.
01
0.01
0.09
0.15
0.12
0.10
0.11
0.07
0.08
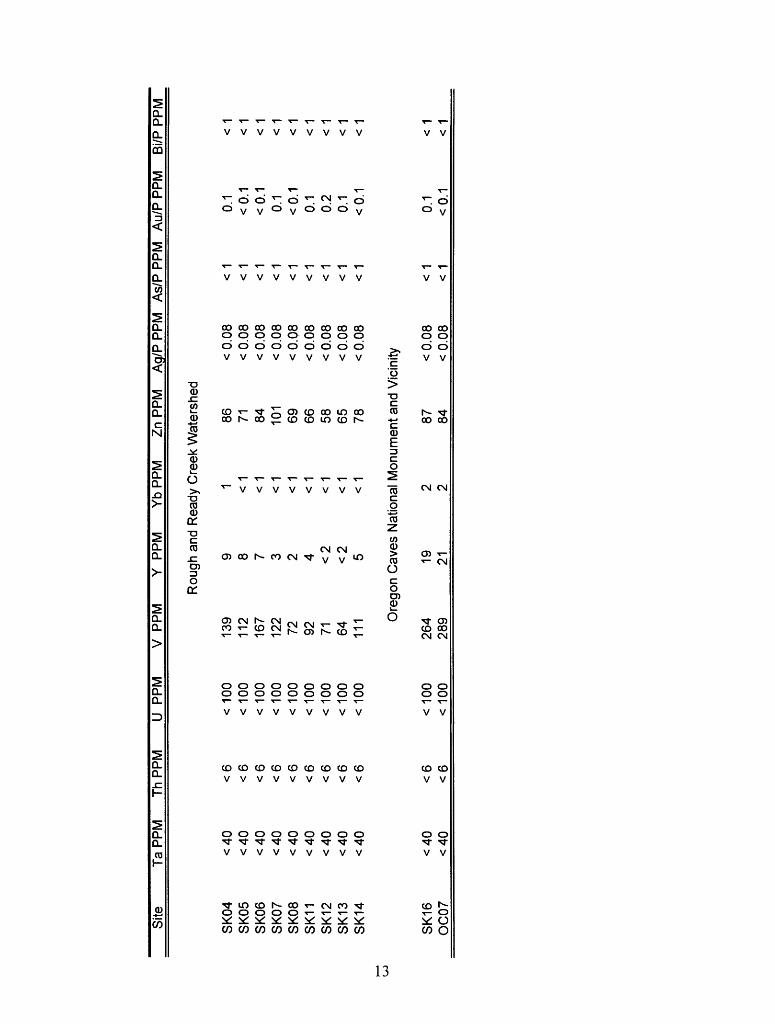
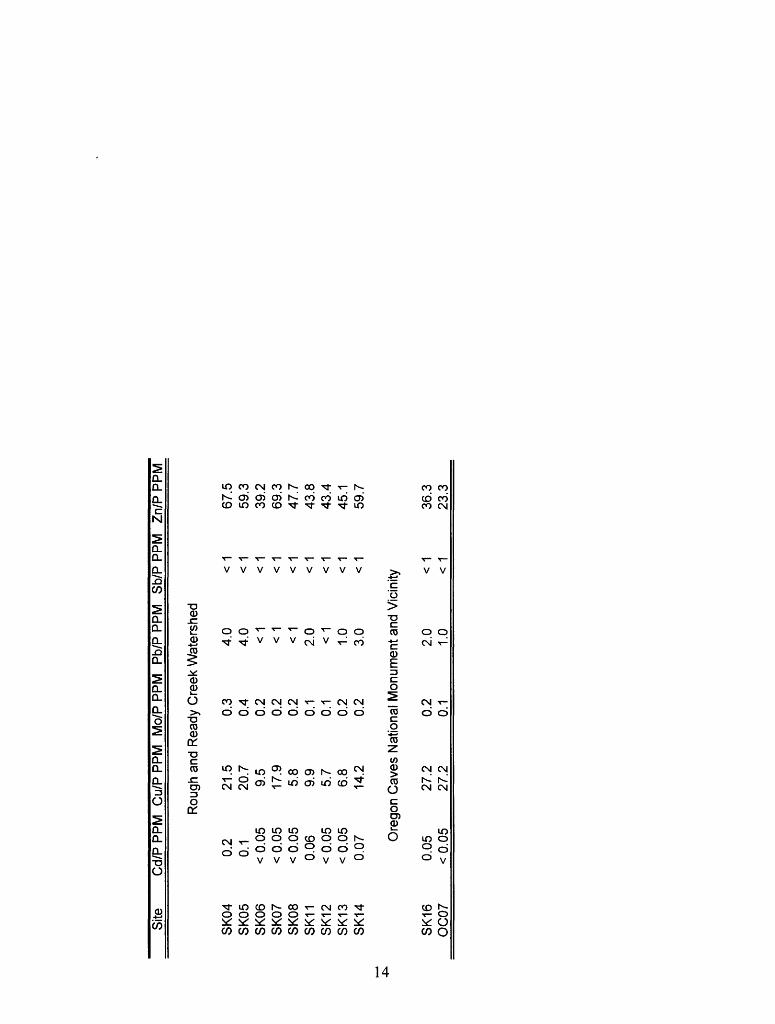
Tabl
e 3.
C
hem
ical
ana
lyse
s of
stre
am s
edim
ents
from
Rou
gh a
nd R
eady
Cre
ek a
nd O
rego
n C
aves
Nat
iona
l Mon
umen
tan
d vi
cini
ty.
(See
Tab
le 2
for
loca
tion
coor
dina
tes
and
desc
riptio
n of
sam
ple
site
s.
Ele
men
t nam
es fo
llow
edby
IP in
dica
te p
artia
l dis
solu
tion
of s
ampl
es a
s di
scus
sed
in te
xt.)
Site
Al%
Ca
%F
e%
K
%M
g%N
a%
P %
Ti%
Mn
PP
MA
g P
PM
A
s P
PM
Rou
gh a
nd R
eady
Cre
ek W
ater
shed
SK
04S
K05
SK
06S
K07
SK
08S
K11
SK
12S
K13
SK
14
SK
16O
C07
5.2
3.6
2.2
1.6
0.89 1.7
0.70
0.81 2.3
7.4
6.3
1.3
0.71 1.7
1.1
0.56 1.1
0.51
0.46 1.0
4.3
5.4
4.4
5.6
8.1
9.3
8.4
7.2
8.7
8.2
7.3
6.6
6.7
0.96
0.86
0.06
< 0.
005
< 0.
005
< 0.
005
< 0.
005
< 0.
005
0.24
Ore
gon
1.0
0.65
3.5
12 17 18 20 20 21 19 17 Cav
es
3.5
5.0
0.90
0.70
0.45
0.26
0.09
0.33
0.05
0.04
0.34
0.03
0.03
0.02
0.01
0.01
0.01
0.00
90.
010.
02
Nat
iona
l Mon
umen
t and
1.9
1.2
0.05
0.05
0.36
0.26
0.29
0.15
0.08
0.15
0.05
0.05
0.18
Vic
inity 0.
670.
51
621
786
1210
1190
1200
1070
1320
1350
1190
1170
1330
<2
< 10
< 2
< 10
<2
< 10
< 2
< 10
< 2
< 10
< 2
< 10
< 2
< 10
< 2
< 10
< 2
< 10
< 2
< 10
< 2
< 10
Site
AuP
PM
Ba
PP
M
Be
PP
MBi
PP
M
Cd
PP
M
Ce
PP
MC
o P
PM
C
r P
PM
CuP
PM
EuP
PM
Ga
PP
M
Rou
gh a
nd R
eady
Cre
ek W
ater
shed
SK
04S
K05
SK
06S
K07
SK
08S
K11
SK
12S
K13
SK
14
SK
16O
C07
<8
<8
<8
<8
<8
<8
<8
<8
<8
<8
<8
449
<1
312
<1
43
<1
24
<1
19
<1
28
<1
15
<1
22
<1
162
<1
421
<1
333
<1
<1
011 17 11 14 15 12 12 12
Ore
gon
20 19
<2
<2
<2
<2
<2
<2
<2
<2
<2
Cav
es
<2
<2
32 19 5 <5
<5
<5
<5
<5 7
35 69 111
121
153
110
173
163
106
Nat
iona
l Mon
umen
t and
35 3326 31
843
620
2280
4570
1260
1680
1680
1940
2100
Vic
inity
95 120
25 17 3 10 <2 3 <2
<2 7 32 33
<2
<2 2 3 <2
<2
<2 2 <2 2 2
11 <4
<4
<4
<4
<4
<4
<4
<4
11 4
to
Site
Ho
PP
MLa
PP
MLi
PP
MM
o P
PM
N
b P
PM
N
d P
PM
NiP
PM
PbP
PM
ScP
PM
SnP
PM
SrP
PM
Rou
gh a
nd R
eady
Cre
ek W
ater
shed
SK
04S
K05
SK
06S
K0
7S
K0
8S
K11
SK
12
SK
13
SK
14
SK
16
OC
07
<4
<4
<4
<4
<4
<4
<4
<4
<4
<4
<4
17 10 <2
<2
<2
<2
<2
<2 3 17 16
26 19 6 4 4 4 3 3 9 12 9
<2
<2
<2
<2
<2
<2
<2
<2
<2 O
rego
n
<2
<2
13 25 38 48
43
40
48
42
41
Cav
es
9 13
17 10 <9
<9
<9
<9
<9
<9
<9
432
1500
2250
2310
3380
2150
2950
2980
1940
Nat
iona
l M
onum
ent a
nd
25 2476 53
14 16 19 16 15 15 14 12 19
Vic
inity
18 12
15 14 18 12 12 14 12 13 14 32 45
22 13 16 <5
<5
<5
<5
<5
<5
74 49
87 76 56 31 7 38 6 6 44
317
20
7
Site
SK
04S
K05
SK
06S
K07
SK
08S
K11
SK
12S
K13
SK
14
Ta
PP
M
<4
0<
40
<4
0<
40
<4
0<
40
<4
0<
40
<4
0
Th
PP
M
<6
<6
<6
<6
<6
<6
<6
<6
<6
U
PP
M
<100
<100
<100
<100
<100
<1
00
<100
<100
<100
V
PP
M
139
112
167
122
72 92 71 64 111
Y
PP
M
Rou
gh a
nd
9 8 7 3 2 4 <2
<2 5
YbP
PM
Zn
PP
MA
g/P
PP
MA
s/P
PP
M
Au/
PP
PM
Bi/P
PP
M
Rea
dy C
reek
Wat
ersh
ed
1 < 1
< 1
< 1
< 1
< 1
< 1
< 1
<1
86 71 84 101
69 66 58 65 78
Ore
gon
Cav
es N
atio
nal
Mon
umen
t and
SK
16O
C07
<4
0<
40
<6
<6
<100
<100
264
289
19 212 2
87 84
<0.0
8<
0.0
8<
0.0
8<
0.0
8<O
.Q8
<0.0
8<
0.0
8<
0.0
8<
0.0
8
Vic
inity <
0.0
8<
0.0
8
<1
0.<
1 «
< 1
«<
1
0.<
1 <
(<
1
0.<
1
0.<
1 0.
< 1
<(
<1
0.<
1 <
(1 3.1
3.1 1 3.1 1 2 1 3.1 1 3.1
<1
< 1
< 1
< 1
< 1
< 1
< 1
< 1
<1
< 1
<1
Site
Cd/
PP
PM
C
u/P
PP
M
Mo/
PP
PM
Pb/
PP
PM
S
b/P
PP
MZ
n/P
PP
M
Rou
gh a
nd R
eady
Cre
ek W
ater
shed
SK
04S
K05
SK
06S
K07
SK
08S
K11
SK
12S
K13
SK
14
SK
16O
C07
0.2
0.1
<0.0
5<
0.0
5<
0.0
50.
06<
0.0
5<
0.0
50.
07
Ore
gon
0.05
<0.0
5
21.5
20.7
9.5
17.9
5.8
9.9
5.7
6.8
14.2
Cav
es
27.2
27.2
0.3
0.4
0.2
0.2
0.2
0.1
0.1
0.2
0.2
4.0
<1
4.0
<1
<1
< 1
< 1
< 1
< 1
< 1
2.0
<1
< 1
< 1
1.0
< 1
3.0
<1
67.5
59.3
39.2
69.3
47.7
43.8
43.4
45.1
59.7
Nat
iona
l M
onum
ent a
nd V
icin
ity
0.2
0.1
2.0
<1
1.0
<1
36.3
23.3
The ultramafic rocks were originally mostly peridotite which varied in composition from pyroxenite to dunite (Ramp and Peterson, 1979). The remaining rocks are quartz diorite and
related rocks, which occur in the southwestern part of the South Fork of Rough and Ready Creek
drainage basin (Ramp and Peterson, 1979). Most of the ultramafic rocks are serpentinized and highly sheared near fault boundaries. Iron and nickel-rich red lateritic soils are developed on the ultramafic rocks. These deposits formed by chemical weathering of peridotite and possibly serpentinite (Hotz, 1964). Olivine and orthopyroxene minerals are readily weathered to hydrated ferric oxides and clays. The lateritic soils occur on nearly flat lying to gently slopping surfaces
on broad ridgecrests, in saddles and on lower shoulders, terraces, and benches (Hotz, 1964).
Accumulations of lateritic soils range from a few feet to a few 10's of feet thick and have an
average Ni content of <1%. The age of the lateritic soils is probably Miocene or younger (Hotz, 1964). The rugged terrain, which makes it difficult to transport the ore, the low grade of the nickel content, and the low volume of the reserves imply that the iron- and nickel-rich lateritic soils within the Rough and Ready Creek drainage are probably marginal in value for ore deposits compared to world-wide averages for nickel ore deposits (see figs. 189 and 190, p. 254, Singer, 1986).
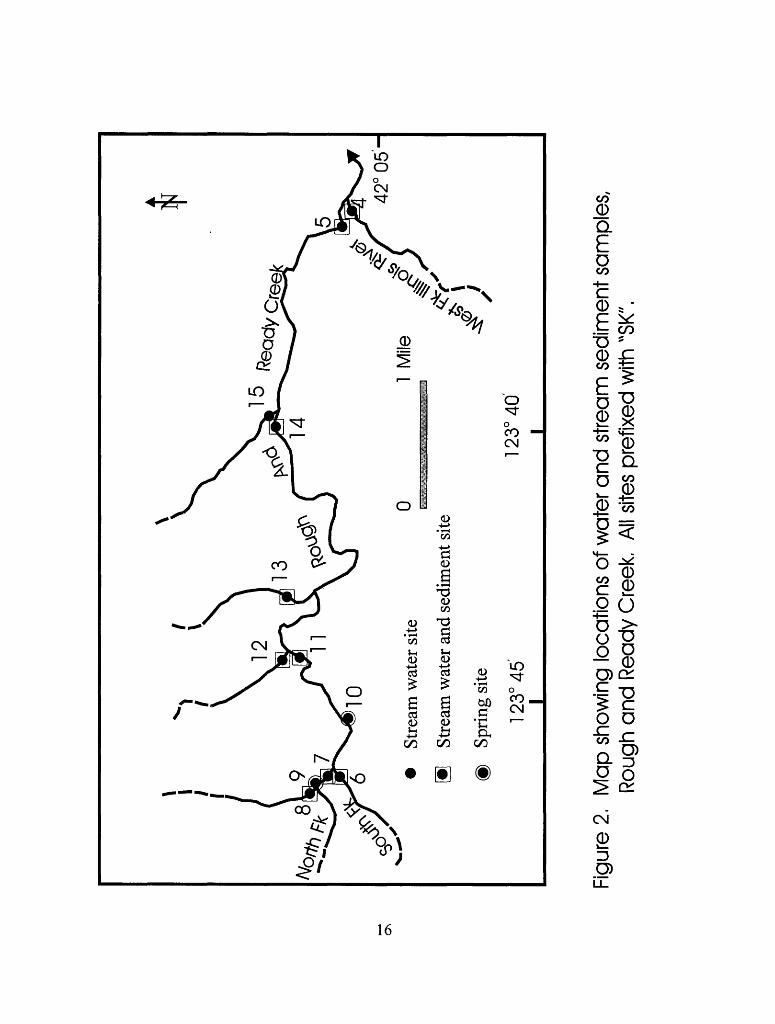
Samples of 9 stream waters, 2 spring waters, and 8 stream sediments were collected within the Rough and Ready Creek watershed (fig. 2). The West Fork of the Illinois River above the junction with Rough and Ready Creek was also sampled for both stream water and sediments (fig. 2). The samples were collected September 9 and 10, 1997. During this time, the weather was stable and no precipitation occurred. The streams were in low flow, near the lowest flow of the season, and all waters were clear.
The waters can be classified as to dominant cation and anion. All the sites are Mg-HCO3 "
dominant waters, mainly because of the peridotite and sepentinite rocks that underlie the watershed. The rock composition determines the geochemistry of the waters that evolve in the watershed. The minerals that compose the rocks are mainly serpentine, olivine, and pyroxene. Serpentine is a stable mineral but olivine and pyroxene will readily weather to serpentine, clay and hydrated iron or aluminum oxides, releasing elements, particularly Mg, Fe, Si, and trace metals Ni and Cr to the waters of the basin.
The pH values of waters ranged form 7.63 to 8.58 with a mean of 8.16 and conductivity
ranged from 120 to 277 /zS/cm with a geometric mean of 196 /zS/cm (Table 2). Alkalinity, which indicates the capacity of the waters to buffer acid from sources such as acid-mine drainage or acid rain, ranged from 75 to 182 ppm as HCO3 " with a geometric mean of 124 ppm, indicating that the waters within the watershed have good buffering capacity.
Rock composition is the fundamental control determining the geochemistry of the waters in the watershed. The concentrations of elements that may be a concern for aquatic and public
15
£>St
ream
wat
er s
ite
u
Stre
am w
ater
and
sed
imen
t site
Spri
ng s
ite
123°
45
I_____________
123°
40'
I
Figu
re 2
, M
ap s
how
ing
loca
tions
of w
ater
and
stre
am s
edim
ent s
ampl
es,
Rou
gh a
nd R
eady
Cre
ek,
All s
ites
pref
ixed
with
WSK
",
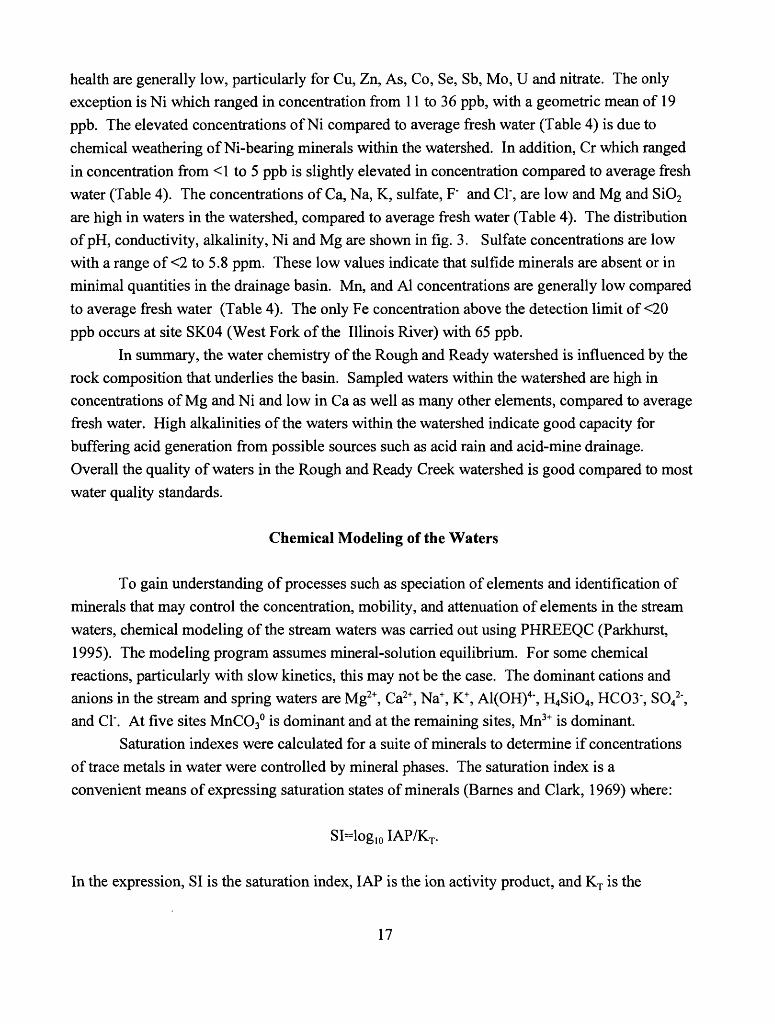
health are generally low, particularly for Cu, Zn, As, Co, Se, Sb, Mo, U and nitrate. The only exception is Ni which ranged in concentration from 11 to 36 ppb, with a geometric mean of 19 ppb. The elevated concentrations of Ni compared to average fresh water (Table 4) is due to
chemical weathering of Ni-bearing minerals within the watershed. In addition, Cr which ranged
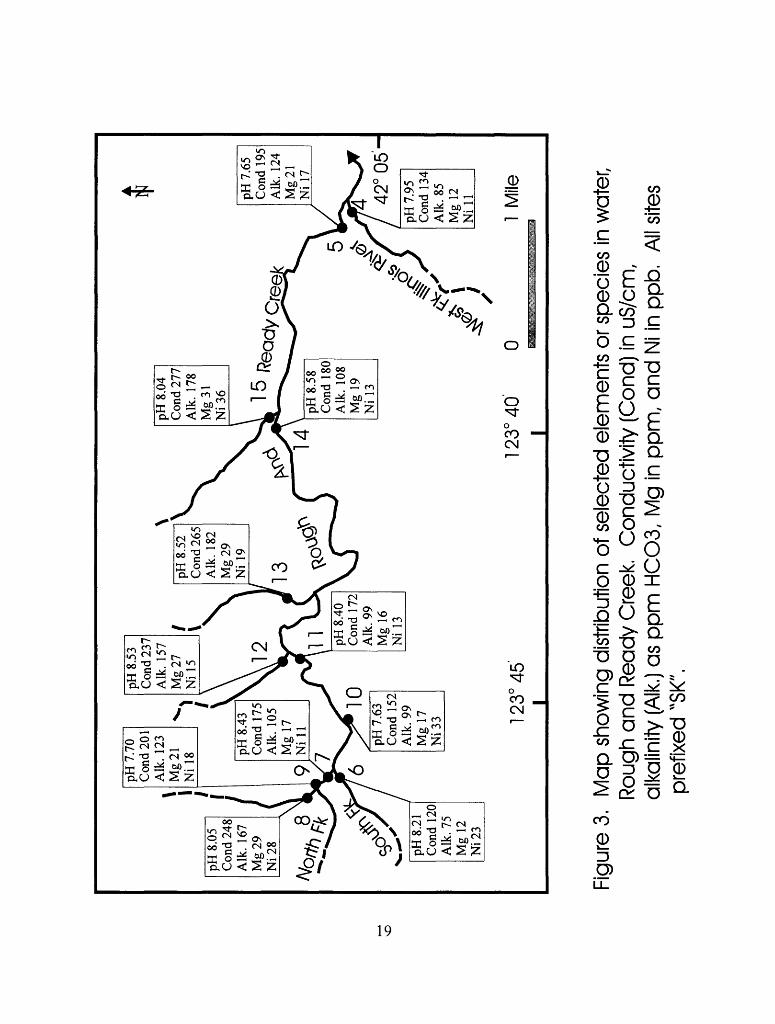
in concentration from <1 to 5 ppb is slightly elevated in concentration compared to average fresh water (Table 4). The concentrations of Ca, Na, K, sulfate, F" and Cl", are low and Mg and SiO2 are high in waters in the watershed, compared to average fresh water (Table 4). The distribution of pH, conductivity, alkalinity, Ni and Mg are shown in fig. 3. Sulfate concentrations are low with a range of <2 to 5.8 ppm. These low values indicate that sulfide minerals are absent or in
minimal quantities in the drainage basin. Mn, and Al concentrations are generally low compared
to average fresh water (Table 4). The only Fe concentration above the detection limit of <20 ppb occurs at site SK04 (West Fork of the Illinois River) with 65 ppb.
In summary, the water chemistry of the Rough and Ready watershed is influenced by the rock composition that underlies the basin. Sampled waters within the watershed are high in concentrations of Mg and Ni and low in Ca as well as many other elements, compared to average fresh water. High alkalinities of the waters within the watershed indicate good capacity for
buffering acid generation from possible sources such as acid rain and acid-mine drainage. Overall the quality of waters in the Rough and Ready Creek watershed is good compared to most water quality standards.
Chemical Modeling of the Waters
To gain understanding of processes such as speciation of elements and identification of minerals that may control the concentration, mobility, and attenuation of elements in the stream
waters, chemical modeling of the stream waters was carried out using PHREEQC (Parkhurst, 1995). The modeling program assumes mineral-solution equilibrium. For some chemical reactions, particularly with slow kinetics, this may not be the case. The dominant cations and anions in the stream and spring waters are Mg2+, Ca2+, Na+ , K+ , Al(OH)4', H4SiO4 , HCO3', SO42-, and Cl". At five sites MnCO3° is dominant and at the remaining sites, Mn3+ is dominant.
Saturation indexes were calculated for a suite of minerals to determine if concentrations of trace metals in water were controlled by mineral phases. The saturation index is a convenient means of expressing saturation states of minerals (Barnes and Clark, 1969) where:
SI=log, 0 IAP/KT .
In the expression, SI is the saturation index, IAP is the ion activity product, and KT is the
17
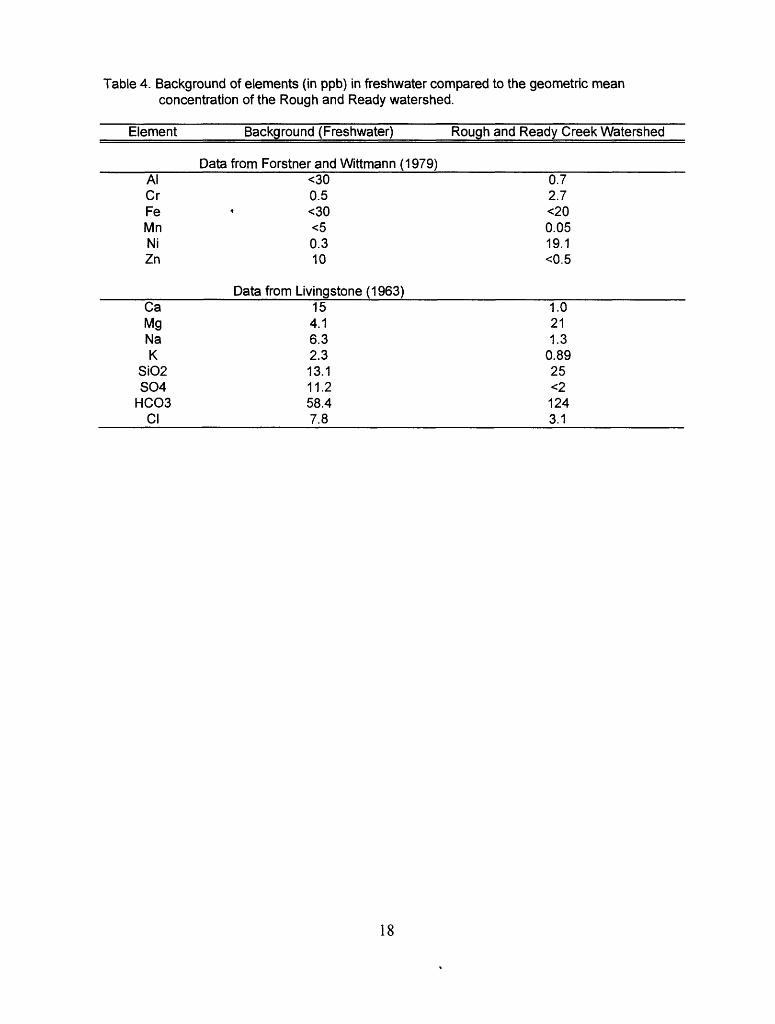
Table 4. Background of elements (in ppb) in freshwater compared to the geometric mean concentration of the Rough and Ready watershed.
Element Background (Freshwater) Rough and Ready Creek Watershed
_________Data from Forstner and Wittmann (1979)____________________Al <30 0.7Cr 0.5 2.7Fe * <30 <20Mn <5 0.05Ni 0.3 19.1Zn 10 <0.5
____________Data from Livingstone (1963)________________________Ca 15 1.0Mg 4.1 21Na 6.3 1.3K 2.3 0.89
Si02 13.1 25SO4 11.2 <2
HCO3 58.4 124Cl 7.8 3.1
18
pH 7
.70
Con
d201
A
lk.
123
Mg2
1 N
i 18
pH 8
.04
Con
d 27
7 A
lk.
178
Mg3
1 N
i36
pH 8
.52
Con
d 26
5 A
lk.
182
Mg2
9 N
il9
pH 8
.58
Con
d 18
0 A
lk.
108
Mg
19N
i 13
pH 8
.40
Con
d 17
2 A
lk. 9
9 M
gl6
Ni
13pH
7.9
5 C
ond
134
Alk
. 85
Mgl
2 N
ill
123°
45
I
123°
40'
I
01
Mile
Figu
re 3
, M
ap s
how
ing
dist
ribut
ion
of s
elec
ted
elem
ents
or s
peci
es in
wat
er,
Rou
gh a
nd R
eady
Cre
ek,
Con
duct
ivity
(C
ond)
in u
S/c
m,
alka
linity
(Alk,
) as
ppm
HC
O3,
Mg
in p
pm,
and
Ni in
ppb
, Al
l site
s pr
efix
ed tt
SK",

equilibrium constant of the dissolution reaction at the temperature in question. Mineral phases are supersaturated at SI>0, saturated at SI=0, and undersaturated at SI<0.
All the waters are undersaturated with respect to calcite (CaCO3) and dolomite (CaMg(CO3)2), except for sites SKI3 and 14 which are saturated or slightly supersaturated with respect to dolomite (Table 5). At sites SKI3 and 14, waters are slightly supersaturated with respect to sepiolite (Mg4 Si6O 15(OH)2 6H2O). At these two sites, either dolomite or sepiolite may
control the Mg concentration of the waters. Sepiolite is commonly found as a secondary mineral in the vicinity of serpentinite masses. All the waters are slightly undersaturated with respect to
chalcedoney (SiO2), suggesting that chalcedoney is controlling the concentration of silica concentrations in the waters. Gibbsite (A1(OH)3) is undersaturated at most of the sites, except sites SK07 and 5. This suggests that the alteration of silicate minerals to gibbsite is continuing in much of the watershed.
Possible Impact on Water Quality on Rough and Ready Creek Due to Mining
A proposal has been made to mine Ni-bearing laterite from the Rough and Ready Creek watershed. Laterite is usually a reddish material composed of secondary oxides of iron and aluminum, which is a residual or the end product of weathering. Therefore, the material is chemically stable. The mining of the laterite should present no problem to the chemical quality of waters within the watershed.
If mining occurs within the watershed, access roads will be constructed and serpentinite may be used as a road material. Serpentinite is a rock consisting of chemically-stable serpentine-
group minerals with minor chlorite and talc. The use of serpentinite as road material will not have significant effect on the chemical quality of the waters within the watershed. It is possible that the minerals will break down to smaller sizes, and the potential exists to transport this fine material to streams within the basin during rainstorms.
If possible, the use of peridotite as road material should be avoided. Peridotite contains minerals such as olivine that are not chemically stable and will alter and release elements such as
Ni to the waters of the watershed. Crushing of the perdiodite for road material will expose fresh surfaces to oxidation and dissolution and increase the release of Mg, Si, Fe, Ni, and other elements to the waters of the basin. The type of elements that will be released to the waters of the basin will be similar to what is currently being released by normal chemical weathering, but the amount will be significantly increased, particularly in the first several years after the road material is first exposed to the surface environment. Even if peridotite is used as road material,
the concentrations of these elements in the watershed should not exceed water quality standards.
20
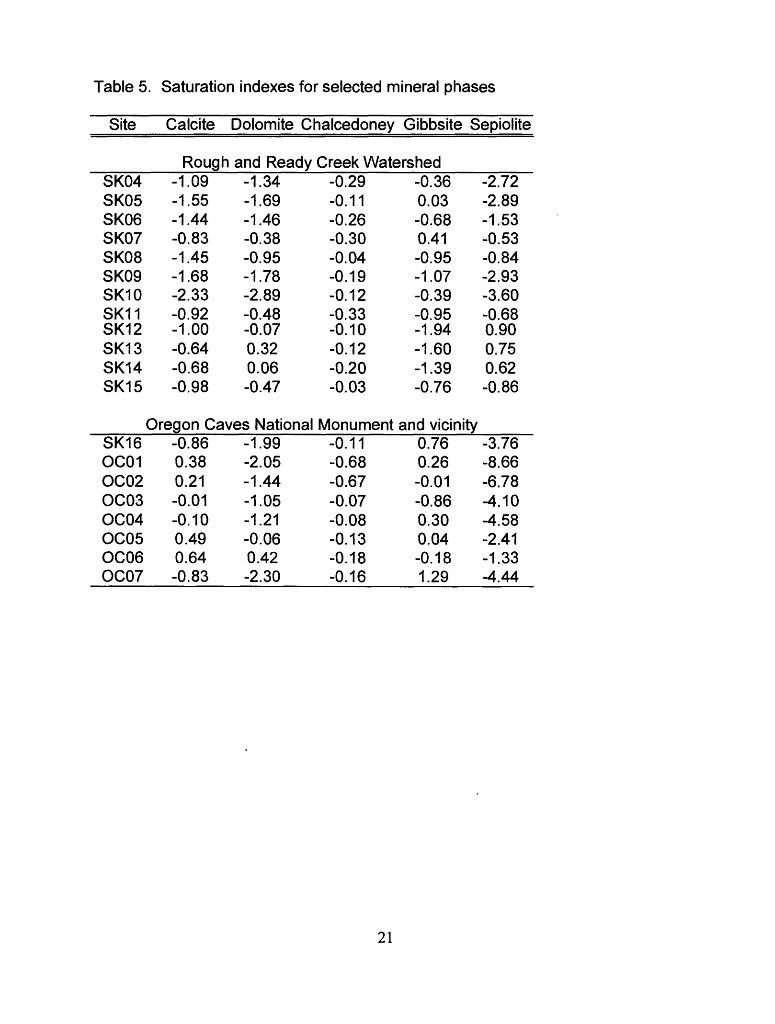
Table 5. Saturation indexes for selected mineral phases
Site
SK04SK05SK06SK07SK08SK09SK10SK11SK12SK13SK14SK15
Calcite
Rough-1.09-1.55-1.44-0.83-1.45-1.68-2.33-0.92-1.00-0.64-0.68-0.98
Dolomite Chalcedoney
and Ready-1.34-1.69-1.46-0.38-0.95-1.78-2.89-0.48-0.070.320.06-0.47
Oregon Caves NationalSK16OC01OC02OC03OC04OC05OC06OC07
-0.860.380.21-0.01-0.100.490.64-0.83
-1.99-2.05-1.44-1.05-1.21-0.060.42-2.30
Gibbsite Sepiolite
Creek Watershed-0.29-0.11-0.26-0.30-0.04-0.19-0.12-0.33-0.10-0.12-0.20-0.03
Monument-0.11-0.68-0.67-0.07-0.08-0.13-0.18-0.16
-0.360.03-0.680.41-0.95-1.07-0.39-0.95-1.94-1.60-1.39-0.76
-2.72-2.89-1.53-0.53-0.84-2.93-3.60-0.680.900.750.62-0.86
and vicinity0.760.26-0.01-0.860.300.04-0.181.29
-3.76-8.66-6.78-4.10-4.58-2.41-1.33-4.44
21
Oregon Caves National Monument and Vicinity
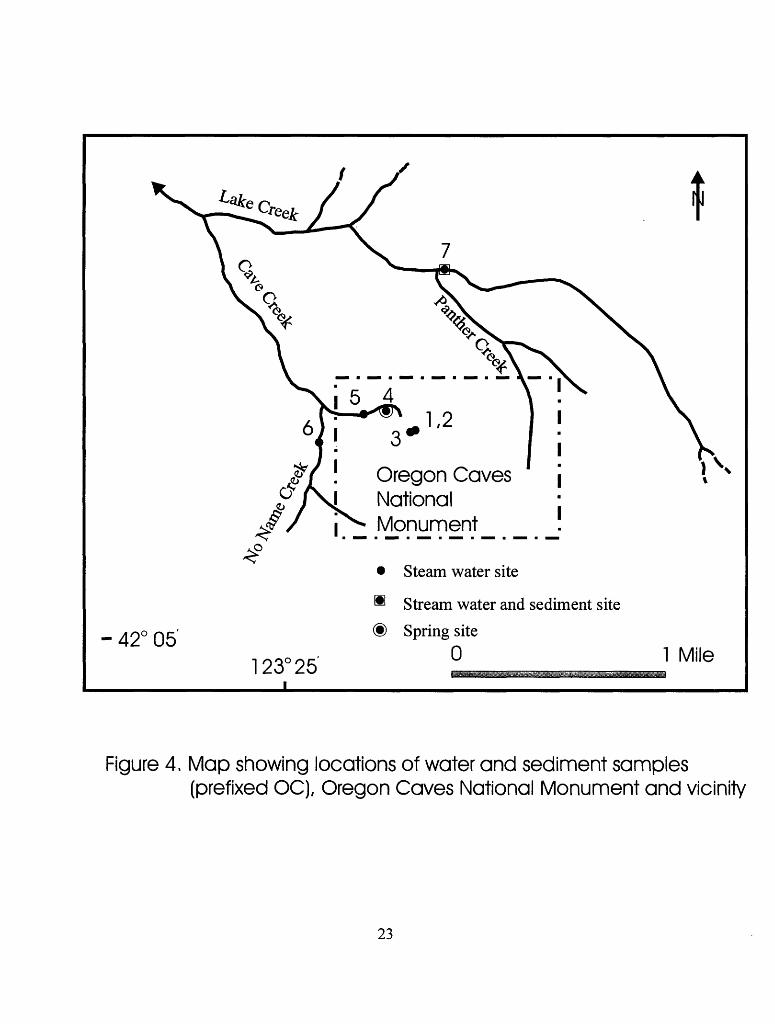
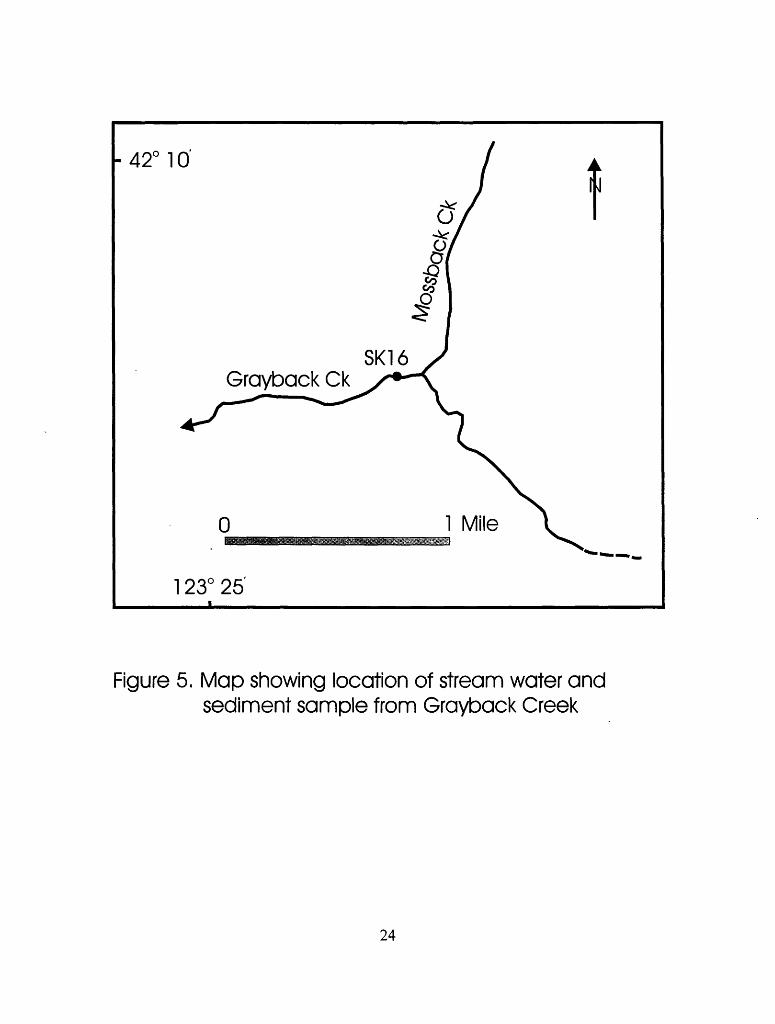
Water samples were collected from 7 streams and 1 spring in the Oregon Caves National Monument and vicinity and Grayback Creek (fig. 4 and 5). Stream sediments were collected from Lake Creek (OC07) and Grayback Creek (SKI6). Samples at site SKI6 were collected on September 10, 1997. The remaining samples were collected on September 11, 1997. During this
period, the weather was stable and no precipitation occurred. All the streams were in low flow stage.
Most of the rocks in the Oregon Caves National Monument and vicinity are Triassic Applegate Group metavolcanics and metasediments (Ramp and Peterson, 1979). The metavolcanics consist of pillow lavas, flow breccias, and tuffs which were intruded by diabase and gabbro dikes (Ramp and Peterson, 1979). The metasedments include argillite, slaty siltstone,
chert, tuffaceous sediment, quartzite conglomerate, and marble (Ramp and Peterson, 1979). The caves occur in marble lenses. Sites OC01 and OC02 are from within and near the back of the
cave where flowing water enters the cave. Site OC03 is from Cave Creek at the exit of the cave. Site OC04 is a spring along Cave Creek near the contact of the marble with other metasediments and metavolcanics. Site OC05 is Cave Creek below the Oregon Caves Chateau, a historic hotel located within the drainage of Cave Creek, below the exit from the cave. Site OC06 is along No
Name Creek, a tributary to Cave Creek. The No Name Creek watershed is underlain by Applegate Group metavolcanics and metasediments. Site OC07 is Lake Creek above the junction with Panther Creek. The Lake Creek watershed is underlain mainly by a granodiorite pluton and provides the water supply for Oregon Caves National Monument. Site SKI6 is Grayback Creek below the junction with Mossback Creek. Grayback Creek watershed is underlain by metasediments and metavolcanics of the Applegate Group and by younger intrusive rocks which range in composition of quartz diorite to more mafic rocks.
The chemical analyses of the waters from the Oregon Caves National Monument and vicinity are shown in Table 2. The geochemistry of the waters demonstrate the effect of rock composition on the type of water that will evolve within a watershed. This can be shown by comparing the chemical composition of waters at various sites. Comparing sites OC01 and OC02, waters collected within Oregon Caves, to site OC03, Cave Creek at the cave exit, elements that increase in concentrations at the exit are Mg, Na, K, SiO2 , Li, Sc, V, Sr, and Y. Elements that decrease in concentrations at the exit are Mn, Al, Rb, and Ca. Conductivity and pH also decrease. Waters at sites OC01 and OC02, are mainly in contact with carbonate rocks. Cave Creek at the exit contains a mixture of waters in contact with both carbonate and other
types of rocks. These other rock types are probably Applegate Group metavolcanics and metasediments. Chemical modeling shows that sites OC01 and OC02 are supersaturated with
22
Oregon Caves \National
- 42° 05'
Monument
123° 25
Steam water site
Stream water and sediment site
Spring siteo 1 Mile
Figure 4, Map showing locations of water and sediment samples(prefixed OC), Oregon Caves National Monument and vicinity
23
42° 10
123° 25
Figure 5, Map showing location of stream water and sediment sample from Grayback Creek
24
respect to calcite (Table 5). Calcite should precipitate at these sites. The mixed water at site OC03, at the exit of the cave, is near saturation with respect to calcite, which should not dissolve or precipitate at this site. Chalcedony (amorphous silica) is undersaturated at sites OC01 and
OC02, but near saturation at site OC03, further suggesting that site OC03 contains water that was
in contact with silicate rocks.Water from site OC04, a spring, is similar to Cave Creek at site OC03, suggesting that the
water at the spring is a mixture of waters in contact with marble and metavolcanics and metasediments. The water at the spring is slightly undersaturated with respect to calcite and chalcedony (Table 5).
The water from Cave Creek site OC05, below the Oregon Caves Chateau, compared to
OC03 or OC04, contains slightly greater concentrations of Ca, alkalinity, nitrate, Mn, Al, Ni, Rb and slightly less concentrations of SiO2 , Sc, V, and Y. Values of pH are also slightly higher at
site OC05 (Table 2). The water at site OC05 has been in contact with marble along the streambed after leaving the cave, and probably has dissolved minor calcite, which increases the pH and accounts for the differences in many of the other species. The water of site OC05 is supersaturated with respect to calcite (Table 5). The increase in concentrations of nitrate, Mn,
and Al below the Oregon Cave Chateau may be due to the presence of the chateau's leach field
above site OC05.
The water from No Name Creek, OC06, compared to Cave Creek, contains greater concentrations of K, SO4 , Mn, Al, and Rb and less concentrations of alkalinity, Ca, Sr, and nitrate. No Name Creek contains a mixture of waters in contact with both marble and more silicious metasediments and metavolcanics. The water at this site is supersaturated with respect to calcite and dolomite and near saturation with respect to chalcedony (Table 5).
The water from Lake Creek, site OC07, is higher in concentrations of Al, La, Nd, and Sm and lower in concentration of alkalinity, Ca, Mg, Ni, Sr, Ba, nitrate, and conductivity, compared to Cave Creek or No Name Creek. The chemistry of the water, in particular La, Nd, and Sm, suggests that the water is in contact with more felsic intrusive rocks compared to other sites in the study area. The Lake Creek watershed is underlain by granodiorite, and the sediment data show elevated concentrations of Ca, K, Na, La, Nd, and Sn, typically high in areas underlain by felsic rocks. The water is undersaturated with respect to calcite, suggesting the absence of marble in the watershed, and slightly undersaturated with respect to chalcedony (Table 4). The
watershed provides the water supply for the Oregon Caves National Monument. The water
quality of the inorganic chemistry of the watershed is excellent. The alkalinity is lower compared to Cave Creek. The lower alkalinity, which is a measure of buffering capacity of the water, indicates that if the watershed is impacted by processes which generate acid, such as acid- rain, the waters of the watershed could deteriorate and quickly become acidic.
25
The water from Grayback Creek, site SKI6, has low pH and conductivity values and is low in concentrations of alkalinity and Ca and highest in Mg, Na, SiO2 , SO4 , V, Ni, and Rb
compared to the other waters in the study area. The water chemistry indicates that the waters are in contact with mixed rocks ranging from intermediate composition to mafic rocks. The stream
sediment data is similar to that of Lake Creek. The waters at this site are undersaturated with respect to calcite, suggesting an absence of marble in the watershed, and slightly undersaturated with respect to chalcedony (Table 5).
Conclusions and Summary
Temperature, pH, conductivity, alkalinity, and 65 elements or species were determined for waters collected from 17 streams and 3 springs in southwestern Oregon. Because of the low sensitivity of the ICP-MS analyses, these results provide a geochemical baseline, for the time of sampling, for a wide range of elements at low sensitivities, many documented for the first time for this area. Stream sediments were collected and chemically analyzed from 11 of the water sampling sites to provide an estimate of the composition of rocks upstream from the sites. The
water chemistry of these sites demonstrate the importance of rock composition in the type of waters that will evolve in a watershed. In the Rough and Ready Creek watershed, the waters in contact with the underlying ultramafic rocks are high in Mg and Ni and low in most other cations. In Oregon Caves National Monument, waters in contact with marble are high in Ca and alkalinity and low in most other cations. Other waters in the vicinity are mixtures of waters in contact with marble, metasediments, metavolcanics, and younger intrusive rocks. The water
chemistry at these sites reflects these mixtures of rocks within the watershed..In most cases, the water chemistry in both study areas indicates that there is minimal
input from anthropogenic sources. One exception is Cave Creek, site OC05, which is below Oregon Caves Chateau. Nitrate at this site is elevated in concentration above that at site OC03, Cave Creek above the Chateau, probably because of the leach field for the chateau. The concentration of nitrate at site OC05 is still low and does not pose a health concern.
Mining of Ni-bearing laterite and the building of access roads in the Rough and Ready Creek watershed should not pose a water quality problem to the watershed, particularly if
peridotite rocks are not greatly disturbed. Disturbing peridotite rocks will increase chemical weathering and increase the amounts of Mg and Ni released to the watershed.
Because of the minimal input from anthropogenic sources in the two study areas, the geochemical baselines establish an approximation of background geochemistry of stream and spring waters for the time of year in which the sampling was done, mainly low flow period.
Because water chemistry is sensitive to changes in the environment, these results can be used to
26
compare with future water chemistry in order to determine if change has taken place in the watersheds.
Acknowledgments
We would like to thank Judy McHugh, Diana Perez, and Rochelle Desser of the U.S. Forest Service, and John Roth and Laurie Jusme of the National Park Service. In addition, discussions of the Rough and Ready Creek watershed with Barbara Ullian and Hans Rilling were appreciate.
27
References Cited
Alien, J. E. and Beaulieu, J.D., 1976, Plate tectonic structures in Oregon: Oregon Dept. of
Geology and Mineral Industries, Ore Bin, v. 38, no. 6, p. 87-99.
Barnes, I. and Clark, F. E., 1969, Chemical properties of ground water and their corrosion and encrustation effects on wells: U.S. Geol. Survey Prof. Paper 498-D, 58 p.
Briggs, P. H., 1996, Forty elements by inductively coupled plasma-atomic emission
spectrometry: in, Arbogast, B.F., ed., Analytical methods manual for the Mineral Resource Surveys Program, U.S. Geological Survey, U.S. Geological Survey Open-File Report 96-525, p. 77-94.
Briggs, P. H., Fey, D. L., 1996, Twenty-four elements in natural and acid mine waters byinductively coupled plasma-atomic atomic emission spectrometry, in, Arbogast, B.F., ed., Analytical methods manual for the Mineral Resource Surveys Program, U.S. Geological Survey, U.S. Geological Survey Open-File Report 96-525, p. 95-102.
Edwards, T. K. and Glysson, G. D., 1988, Field methods for measurement of fluvial sediment: U.S. Geological Survey Open-File Report 86-531, 118 p.
Fishman, M.J. and Pyen, G., 1979, Determination of selected anions in water by ion chromatography: U.S. Geol. Survey Water Resources Invest. 79-101, 30 p.
Forstner, U. and Wittmann, G. T. W., 1979, Metal pollution in the aquatic environment: Springer Verlag, 486 p.
Hotz, P.E., 1964, Nickeliferous laterites in southwestern Oregon and northwestern California: Economic Geology, v. 59, no. 3, p. 355-396.
Hotz, P. E, 1971, Plutonic rocks of the Klamath Mountains, California and Oregon: U.S. Geological Survey Professional Paper 684-B, 20 p.
Irwin, W.P., 1966, Geology of the Klamath Mountains province, in Bailey, E.H., ed., Geology of northern California: California Division of Mines and Geology Bulletin 190, p. 19-38.
28
Livingstone, D. A,, 1963, Chemical composition of rivers and lakes, in Fliescher, M., ed., Data of Geochemistry, Sixth Edition, Chapter G: U.S. Geological Survey Professional Paper 400-G, 64 p.
Meier, A. L., Grimes, D. J., and Ficklin, W. H., 1994, Inductively coupled plasma massspectrometry; a powerful analytical tool for mineral resource and environmental studies:
U.S. Geological Survey Circular 1103-A, p. 67-68.
Motooka, Jerry, 1996, Organometallic halide extraction for 10 elements by inductivelycoupled plasma-atomic emission spectrometry: in, Arbogast, B.F., ed., Analytical methods manual for the Mineral Resource Surveys Program, U.S. Geological Survey, U.S. Geological Survey Open File Report 96-525, p. 102-108.
Parkhurst, D.L., 1995, User's guide to PHREEQC - a computer program for speciation, reaction- path, advective-transport, and inverse geochemical calculations: U.S. Geological Survey Water-Resources Investigations Report 95-4227, 143 p.
Plant, J. A., and Hale, Martin, 1994, Introduction: The foundations of modern drainage
geochemistry: in, Hale, M., and Plant, J.A., eds, Drainage Geochemistry, Handbook of Exploration Geochemistry, vol. 6, Elsevier, Amsterdam, p. 3-9.
Ramp, L. and Peterson, N.V., 1979, Geology and mineral resources of Josephine County, Oregon: Dept. of Geology and Mineral Industries Bulletin 100, 45 p
Ramp, Len, 1978, Investigations of nickel in Oregon: Oregon Department of Geology and Mineral Industries, Miscellaneous Paper 20, 68 p.
Singer, D.A., 1986, Descriptive model of lateritic Ni, in Cox, D.P. and Singer, D.A., ed., Mineral
deposit models: U.S. Geological Survey Bulletin 1693, p.252-254.
29