geochemical and isotopic composition of ground water, … · of carbonate mineral dissolution. some...
TRANSCRIPT
U.S. GEOLOGICAL SURVEY
Water-Resources Investigations Report 9
Geochemical and Isotopic Composition of Ground Water, with Emphasis on Sources of Sulfate, in the Upper Floridan Aquifer and Intermediate Aquifer System in Southwest Florida
Prepared in cooperation with theSOUTHWEST FLORIDA WATER MANAGEMENT DISTRICT
6-4146
By Laura A. Sacks and Ann B. Tihansky
Tallahassee, Florida1996
U.S. DEPARTMENT OF THE INTERIOR
BRUCE BABBITT, Secretary
U.S. GEOLOGICAL SURVEY
Gordon P. Eaton, Director
Any use of trade, product, or firm names in this publication is for descriptive purposes onlyand does not imply endorsement by the U.S. Geological Survey.
For additional information write to: Copies of this report can be purchased from:
District Chief U.S. Geological SurveyU.S. Geological Survey Branch of Information Center227 North Bronough Street, Suite 3015 Box 25286Tallahassee, Florida 32301 Denver, CO 80225-0286
Contents iii
CONTENTS
Abstract ............................................................................................................................................................................. 1Introduction ....................................................................................................................................................................... 2
Purpose and Scope....................................................................................................................................................... 5Acknowledgments ....................................................................................................................................................... 5
Geologic and Hydrogeologic Framework ......................................................................................................................... 5Hydrogeology .............................................................................................................................................................. 5
Intermediate Aquifer System............................................................................................................................. 6Floridan Aquifer System ................................................................................................................................... 7
Upper Floridan Aquifer ........................................................................................................................... 7Middle Confining Unit ............................................................................................................................ 7Lower Floridan Aquifer........................................................................................................................... 8Ground-Water Flow and Circulation ....................................................................................................... 8
Mineralogical Data from Aquifers .............................................................................................................................. 9Carbonate Minerals............................................................................................................................................ 10Gypsum.............................................................................................................................................................. 13
Geochemical and Isotopic Composition of Ground Water ............................................................................................... 14Sampling Methods ....................................................................................................................................................... 14
Determining Flow Zones for Wells with Large Open Hole Intervals ............................................................... 15Sample Collection.............................................................................................................................................. 17Quality Assurance Samples ............................................................................................................................... 19
Chemical Composition of Ground Water .................................................................................................................... 19Saturation State of Water with Respect to Minerals.......................................................................................... 23Water from the Upper Floridan Aquifer ............................................................................................................ 25
Brackish and Saline Ground Waters in Coastal Areas............................................................................. 27Warm Mineral Springs................................................................................................................... 29
Evaluating Water from the Middle Confining Unit as a Source of Sulfate ............................................. 30Water from the Intermediate Aquifer System.................................................................................................... 31
Isotopic Composition of Ground Water....................................................................................................................... 34Deuterium and Oxygen-18 ................................................................................................................................ 34Carbon-13 .......................................................................................................................................................... 36Sulfur-34 ............................................................................................................................................................ 37
Sulfate...................................................................................................................................................... 37Sulfide...................................................................................................................................................... 39
Strontium-87/Strontium-86 ............................................................................................................................... 40Geochemical Modeling ..................................................................................................................................................... 41
Model Description ....................................................................................................................................................... 42Shallow Upper Floridan Aquifer Models .................................................................................................................... 43Upwelling Models ....................................................................................................................................................... 45
Summary And Conclusions............................................................................................................................................... 48References ......................................................................................................................................................................... 50Appendix ........................................................................................................................................................................... 55
iv Contents
FIGURES
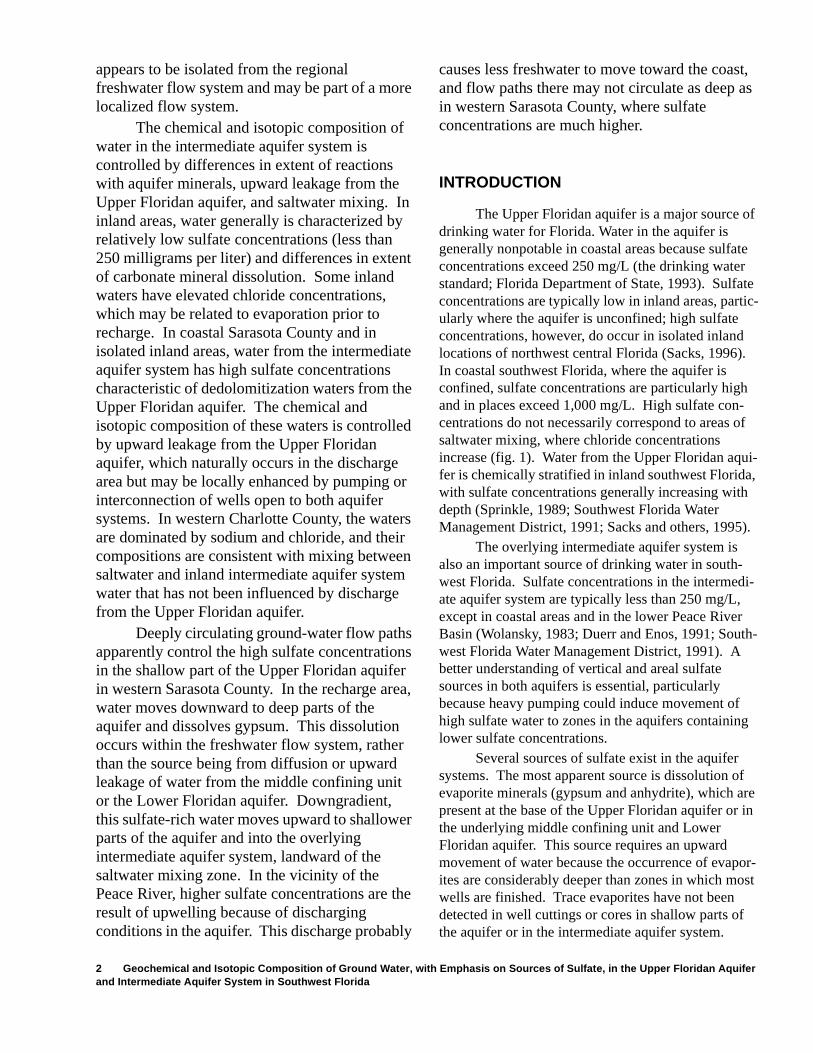
1. Map showing generalized distribution of sulfate and chloride concentrations in water from the Upper Floridan aquifer. ........................................................................................................................................... 3
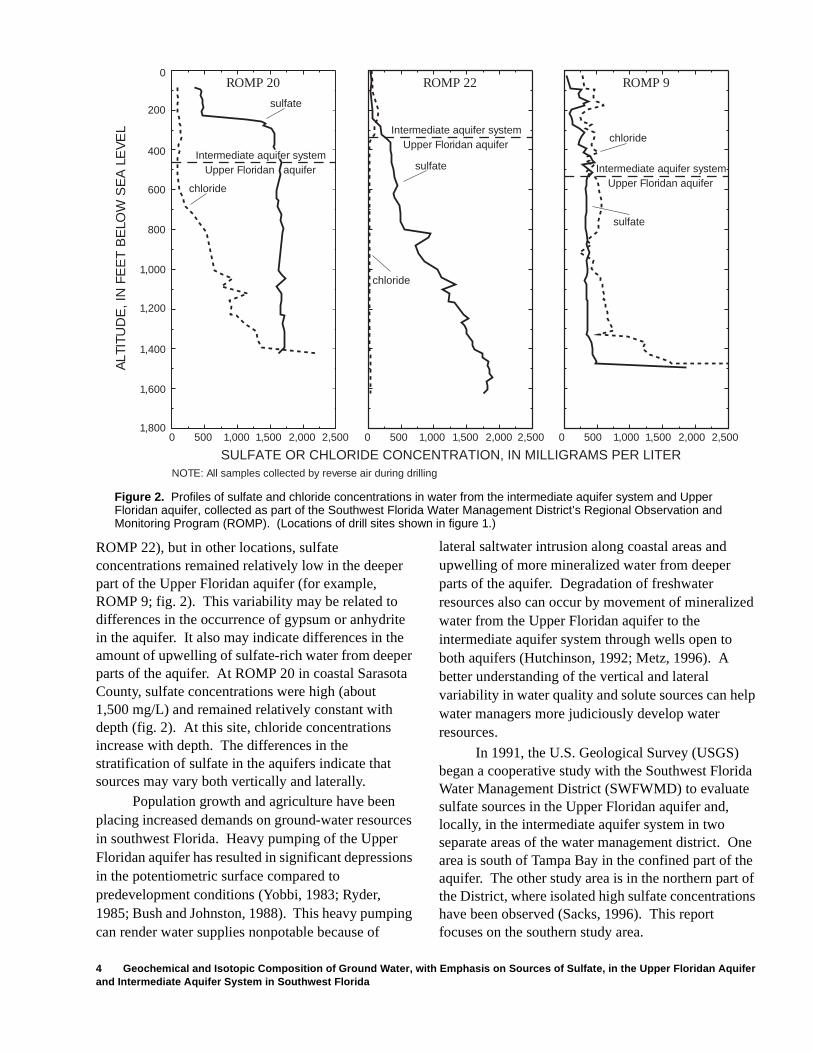
2. Graph showing profiles of sulfate and chloride concentrations in water from the intermediate aquifer system and Upper Floridan aquifer, collected as part of the Southwest Florida Water Management District’s Regional Observation and Monitoring Program (ROMP) ...................................................................... 4
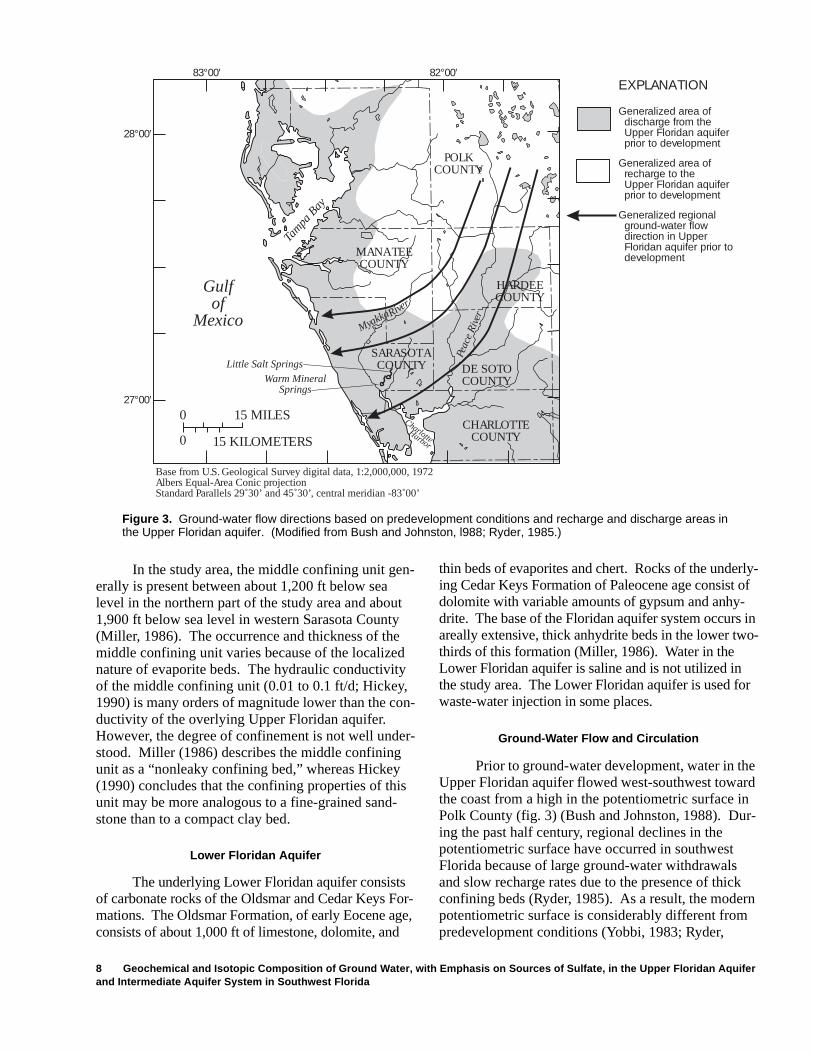
3. Map showing ground-water flow directions based on predevelopment conditions and recharge and discharge areas in the Upper Floridan aquifer ........................................................................................................................ 8
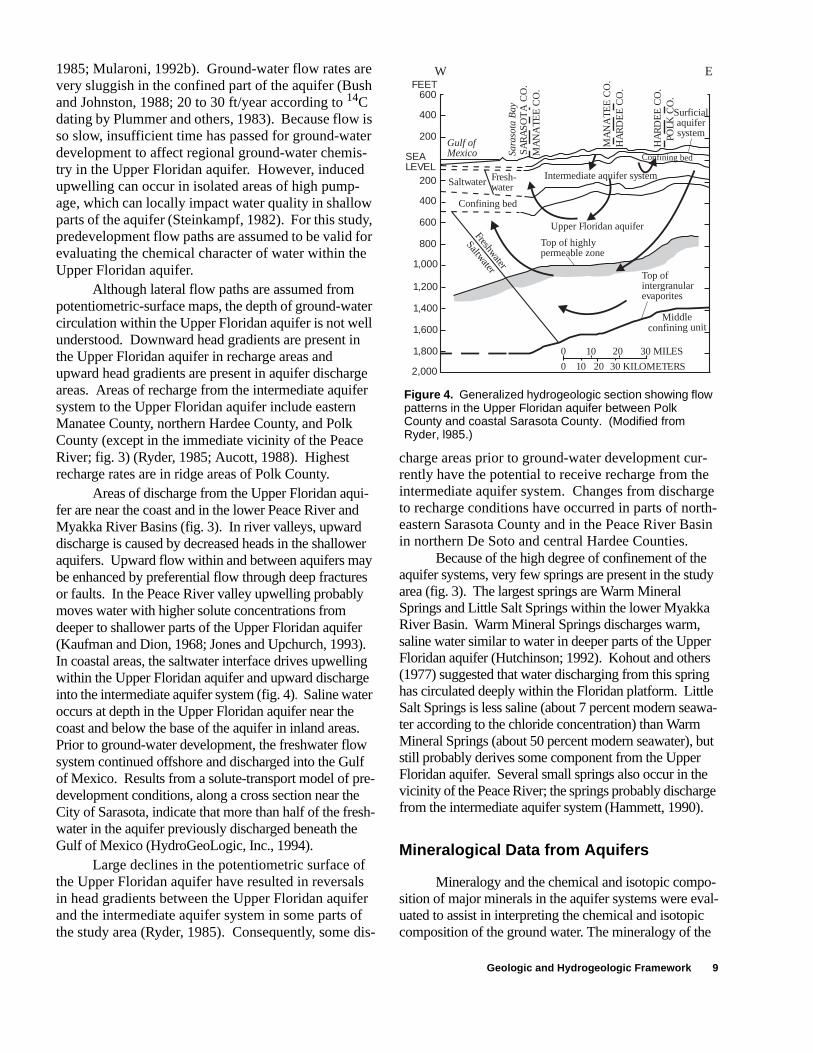
4. Generalized hydrogeologic section showing flow patterns in the Upper Floridan aquifer between Polk County and coastal Sarasota County....................................................................................................................... 9
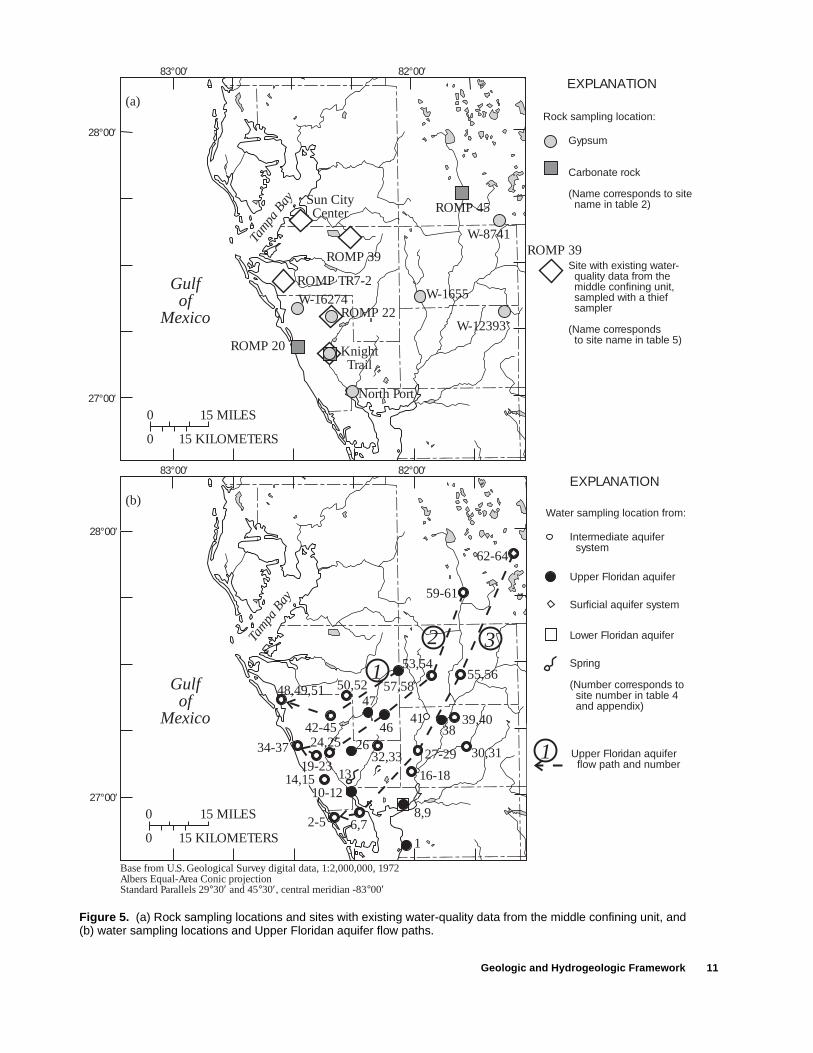
5. Map showing rock sampling locations and sites with existing water-quality data from the middle confining unit, and water sampling locations and Upper Floridan aquifer flow paths........................................... 11
6. Graph showing the ratio of strontium-87 to strontium-86 in rock samples from the Hawthorn Group, Suwannee Limestone, and Avon Park Formation, compared to the ratio of strontium-87 to strontium-86 in seawater during the time of deposition ................................................................................................................... 12
7. Cross sections along flow paths, showing open hole intervals of wells and lithologic and hydrogeologicunits......................................................................................................................................................................... 15
8. Graph showing profiles of vertical borehole flow under static conditions using the heat-pulse flow meter in wells 39, 53, and 55, which have large open hole intervals and are open exclusively to the Upper Floridan aquifer ..................................................................................................................................................................... 18
9-10. Maps showing:9. Sulfate concentrations in water from the shallowest sampling interval of the Upper Floridan aquifer,
and the intermediate aquifer system, including areas where sulfate is significantly in excess of seawater mixing.............................................................................................................................................................. 20
10. Sulfide concentration in water from the shallowest sampling interval of the Upper Floridan aquifer, and the intermediate aquifer system................................................................................................................ 21
11. Cross sections along flow paths, showing approximate areas where sulfate and chloride concentrations exceed 250 milligrams per liter in water from the Upper Floridan aquifer and intermediate aquifer system........ 22
12-13. Graphs showing:12. Relation between chloride concentration and concentrations of sulfate, calcium, magnesium, strontium
and sodium in water from the Upper Floridan aquifer and intermediate aquifer system................................ 2313. Relation between gypsum and celestite saturation index and sulfate concentration in water from the
Upper Floridan aquifer and intermediate aquifer system................................................................................ 2414. Trilinear diagram illustrating chemical composition of water from the Upper Floridan aquifer ........................... 25
15-17. Graphs showing:15. Changes in major ion concentrations in water from the shallowest sampling interval in the Upper
Floridan aquifer along the flow paths.............................................................................................................. 2616. Changes in strontium concentration and strontium-to-sulfate molar ratio in water from the shallowest
sampling interval in the Upper Floridan aquifer along the flow paths............................................................ 2717. Relation between enrichment or depletion of sulfate and calcium, sodium and calcium after
gypsum dissolution, and magnesium and calcium after gypsum dissolution, in water from the Upper Floridan aquifer with chloride concentration greater than or equal to 250 milligrams per liter, and water from the Lower Floridan aquifer, Warm Mineral Springs, and the middle confining unit............. 29
18. Trilinear diagram illustrating chemical composition of water from the intermediate aquifer system.................... 3119. Map showing major-ion water types from the intermediate aquifer system........................................................... 32
20-27. Graphs showing:20. Relation between bicarbonate concentration and calcium-plus-magnesium concentration in water from
the intermediate aquifer system, illustrating waters dominated by carbonate mineral dissolution compared to dedolomitization reactions and saltwater mixing........................................................................................ 32
21. Relation between delta deuterium and delta oxygen-18 in water from the Upper Floridan aquifer and intermediate aquifer system............................................................................................................................. 35
22. Relation between delta deuterium and chloride concentration in water from the Upper Floridan aquifer and intermediate aquifer system...................................................................................................................... 35
Contents v
23. Relation between delta carbon-13 and enrichment or depletion of magnesium relative to conservative saltwater mixing in water from the Upper Floridan aquifer............................................................................ 36
24. Relation between delta sulfur-34 of sulfate and sulfate concentration, and delta sulfur-34 of sulfide and sulfate concentration in water from the Upper Floridan aquifer and intermediate aquifer system................. 37
25. Relation between delta sulfur-34 of total sulfer and chloride concentration in water from the Upper Floridan aquifer and intermediate aquifer system with chloride concentration greater than 200 milligrams per liter ................................................................................................................................... 38
26. Relation between the ratio of strontium-87 to strontium-86 and strontium concentration in water from the Upper Floridan aquifer and intermediate aquifer system, plotted with the range of strontium-87 to strontium-86 in seawater from the Miocene, Oligocene, and Eocene epochs................................................. 40
27. Gypsum, dolomite, and calcite mass transfer computed with NETPATH between sections of flow paths,representing reactions in water from the shallowest sampling interval in the Upper Floridan aquifer........... 44
28. Map showing amount of upwelling of sulfate-rich water computed with NETPATH along flow paths in the shallow part of the Upper Floridan aquifer, and inferred areas where upwelling significantly influences sulfate concentrations......................................................................................................... ..................................... 47
TABLES
1. Relation between stratigraphic and hydrogeologic units........................................................................................ 62. Isotopic composition of rock samples .................................................................................................................... 123. Concentration of selected constituents in gypsum.................................................................................................. 144. Information about sampled wells and spring......................................................................................................... 165. Water-quality data from the middle confining unit ................................................................................................ 306. NETPATH models between the shallowest Upper Floridan aquifer waters along the three flow paths ................ 437. NETPATH models between the shallowest Upper Floridan aquifer waters along the three flow paths,
including upwelling of deep, sulfate-rich ground water......................................................................................... 46
ALTITUDE DATUM
Sea level: In this report, “sea level” refers to the National Geodetic Vertical Datum of 1929 (NGVD of 1929) -- a geodetic datum derived from a general adjustment of the first-order level nets of the United States and Canada, formerly called Sea Level Datum of 1929.
ACRONYMS AND ABBREVIATIONS USED IN THIS REPORT:
mg/L milligrams per literµg/L micrograms per litermmol/L millimoles per literPCO2
partial pressure of carbon dioxideSI saturation indexd dayft feetft2 square feetft3 cubic feetmL milliliterppm parts per millionmin minutesDO dissolved oxygenDOC dissolved organic carbonµm micrometerδ delta34S sulfur-3413C carbon-13D deuterium18O oxygen-18SWFWMD Southwest Florida Water Management DistrictUSGS United States Geological SurveyL liter
Abstract 1
Geochemical and Isotopic Composition of Ground Water, with Emphasis on Sources of Sulfate, in the Upper Floridan Aquifer and Intermediate Aquifer System in Southwest Florida
By Laura A. Sacks and Ann B. Tihansky
Abstract
In southwest Florida, sulfate concentrations in water from the Upper Floridan aquifer and overlying intermediate aquifer system are commonly above 250 milligrams per liter (the drinking water standard), particularly in coastal areas. Possible sources of sulfate include dissolution of gypsum from the deeper part of the Upper Floridan aquifer or the middle confining unit, saltwater in the aquifer, and saline waters from the middle confining unit and Lower Floridan aquifer. The sources of sulfate and geochemical processes controlling ground-water composition were evaluated for the Peace and Myakka River Basins and adjacent coastal areas of southwest Florida. Samples were collected from 63 wells and a saline spring, including wells finished at different depth intervals of the Upper Floridan aquifer and intermediate aquifer system at about 25 locations. Sampling focused along three ground-water flow paths (selected based on a predevelopment potentiometric-surface map). Ground water was analyzed for major ions, selected trace constituents, dissolved organic carbon, and stable isotopes (delta deuterium, oxygen-18, carbon-13 of inorganic carbon, and sulfur-34 of sulfate and sulfide); the ratio of strontium-87 to strontium-86 was analyzed for waters along one of the flow paths.
Chemical and isotopic data indicate that dedolomitization reactions (gypsum and dolomite dissolution and calcite precipitation) control the chemical composition of water in the Upper Floridan aquifer in inland areas. This is confirmed by mass-balance modeling between wells in the shallowest interval in the aquifer along the flow paths. However, gypsum occurs deeper in the aquifer than these wells. Upwelling of sulfate-rich water that previously dissolved gypsum in deeper parts of the aquifer is a more likely source of sulfate than gypsum dissolution in shallow parts of the aquifer. This deep ground water moves to shallower zones in the aquifer discharge area.
Saltwater from the Upper Floridan aquifer has not dissolved significant amounts of gypsum compared to fresher water in the aquifer. This is consistent with a shallow seawater source for the saltwater, rather than a deeper source from the underlying middle confining unit or Lower Floridan aquifer, which would have elevated sulfate concentrations. Ion exchange and dolomitization may be important reactions for saltwater in the aquifer. According to geochemical modeling, the freshwater end member for water in the saltwater mixing zone in the southwestern part of the study area is not upgradient water from the Upper Floridan aquifer that dissolved gypsum. Instead, this water
2 Geochemical and Isotopic Composition of Ground Water, with Emphasis on Sources of Sulfate, in the Upper Floridan Aquifer and Intermediate Aquifer System in Southwest Florida
appears to be isolated from the regional freshwater flow system and may be part of a more localized flow system.
The chemical and isotopic composition of water in the intermediate aquifer system is controlled by differences in extent of reactions with aquifer minerals, upward leakage from the Upper Floridan aquifer, and saltwater mixing. In inland areas, water generally is characterized by relatively low sulfate concentrations (less than 250 milligrams per liter) and differences in extent of carbonate mineral dissolution. Some inland waters have elevated chloride concentrations, which may be related to evaporation prior to recharge. In coastal Sarasota County and in isolated inland areas, water from the intermediate aquifer system has high sulfate concentrations characteristic of dedolomitization waters from the Upper Floridan aquifer. The chemical and isotopic composition of these waters is controlled by upward leakage from the Upper Floridan aquifer, which naturally occurs in the discharge area but may be locally enhanced by pumping or interconnection of wells open to both aquifer systems. In western Charlotte County, the waters are dominated by sodium and chloride, and their compositions are consistent with mixing between saltwater and inland intermediate aquifer system water that has not been influenced by discharge from the Upper Floridan aquifer.
Deeply circulating ground-water flow paths apparently control the high sulfate concentrations in the shallow part of the Upper Floridan aquifer in western Sarasota County. In the recharge area, water moves downward to deep parts of the aquifer and dissolves gypsum. This dissolution occurs within the freshwater flow system, rather than the source being from diffusion or upward leakage of water from the middle confining unit or the Lower Floridan aquifer. Downgradient, this sulfate-rich water moves upward to shallower parts of the aquifer and into the overlying intermediate aquifer system, landward of the saltwater mixing zone. In the vicinity of the Peace River, higher sulfate concentrations are the result of upwelling because of discharging conditions in the aquifer. This discharge probably
causes less freshwater to move toward the coast, and flow paths there may not circulate as deep as in western Sarasota County, where sulfate concentrations are much higher.
INTRODUCTION
The Upper Floridan aquifer is a major source of drinking water for Florida. Water in the aquifer is generally nonpotable in coastal areas because sulfate concentrations exceed 250 mg/L (the drinking water standard; Florida Department of State, 1993). Sulfate concentrations are typically low in inland areas, partic-ularly where the aquifer is unconfined; high sulfate concentrations, however, do occur in isolated inland locations of northwest central Florida (Sacks, 1996). In coastal southwest Florida, where the aquifer is confined, sulfate concentrations are particularly high and in places exceed 1,000 mg/L. High sulfate con-centrations do not necessarily correspond to areas of saltwater mixing, where chloride concentrations increase (fig. 1). Water from the Upper Floridan aqui-fer is chemically stratified in inland southwest Florida, with sulfate concentrations generally increasing with depth (Sprinkle, 1989; Southwest Florida Water Management District, 1991; Sacks and others, 1995).
The overlying intermediate aquifer system is also an important source of drinking water in south-west Florida. Sulfate concentrations in the intermedi-ate aquifer system are typically less than 250 mg/L, except in coastal areas and in the lower Peace River Basin (Wolansky, 1983; Duerr and Enos, 1991; South-west Florida Water Management District, 1991). A better understanding of vertical and areal sulfate sources in both aquifers is essential, particularly because heavy pumping could induce movement of high sulfate water to zones in the aquifers containing lower sulfate concentrations.
Several sources of sulfate exist in the aquifer systems. The most apparent source is dissolution of evaporite minerals (gypsum and anhydrite), which are present at the base of the Upper Floridan aquifer or in the underlying middle confining unit and Lower Floridan aquifer. This source requires an upward movement of water because the occurrence of evapor-ites are considerably deeper than zones in which most wells are finished. Trace evaporites have not been detected in well cuttings or cores in shallow parts of the aquifer or in the intermediate aquifer system.
Introduction 3
Saltwater mixing is another source of sulfate in coastal areas. Other possible sources include diffusion of sul-fate from pore waters in the middle confining unit, oxidation of sulfide minerals, such as pyrite, oxidation of organic sulfur from peat beds, and diffusion of sul-fate from clays in overlying beds. Surficial sources of sulfate include meteoric rainwater that contains sul-fate, oxidation of organic sulfur, and anthropogenic sources such as fertilizers applied in the form of sul-fate salts.
Sulfur isotope data collected in a regional study of the Upper Floridan aquifer were used successfully to delineate sulfate sources on a regional scale (Right-mire and others, 1974; Rye and others, 1981). For the most part, low sulfate concentrations (less than 100 mg/L) and isotopically light sulfate (less than 18 per mil) were detected in the aquifer recharge area and were attributed to atmospheric precipitation. Down-gradient and in confined parts of the aquifer, isotopi-cally heavier sulfate (greater than 22 per mil) was attributed to gypsum dissolution and marine sulfate. These regional studies, however, did not examine ver-tical variability of sulfate concentrations and sources
ROMP 20
EXPLANATION
Base from U.S. Geological Survey digital data, 1:2,000,000, 1972Albers Equal-Area Conic projection
83°00′ 82°00′
28°00′
27°00′0 15 MILES
15 KILOMETERS0
ROMP 22
ROMP 20
ROMP 9
DE SOTOCOUNTY
HARDEECOUNTY
POLKCOUNTY
MANATEECOUNTY
SARASOTACOUNTY
CHARLOTTECOUNTY
AreaShown
Gulfof
Mexico Tam
pa B
ay
Standard Parallels 29°30′ and 45°30′, central meridian -83°00′
Area where sulfateconcentrations aregenerally greater than250 milligrams per literin water from the Upper Floridan aquifer
Area where chloride andsulfate concentrationsare generally greaterthan 250 milligrams perliter in water from theUpper Floridan aquifer
Location and name ofsite with profiles ofchloride and sulfateconcentrations shownin figure 2
Figure 1. Generalized distribution of sulfate and chloride concentrations in water from the Upper Floridan aquifer. (Modified from Sprinkle, 1989; Southwest Florida Water Management District, 1991; and Katz, 1992.)
in the chemically stratified water of the Upper Flori-dan aquifer.
Vertical variability in the composition of ground water may be an indicator of upward flow (or upwelling) from deeper parts of the aquifer. Upwelling may be caused by temperature and density gradients in deep, saline parts of the Floridan aquifer system (Kohout, 1967; Kohout and others, 1977). Upwelling also is associated with upward discharge at the end of deeply circulating, regional flow paths (Jones and others, 1993; Sacks and others, 1995). Upward flow within the aquifer may be accelerated by preferential flow through subsurface fractures (Kauf-man and Dion, 1967; Jones and Upchurch, 1993).
The degree of stratification of sulfate in waters from the Upper Floridan aquifer and intermediate aquifer system varies in southwest Florida. Water-quality data collected during coring and drilling of several sites by Southwest Florida Water Management District (written commun., 1995) demonstrate how variable the increase in sulfate with depth is in this region (fig. 2). In some locations, sulfate concentrations increased with depth (for example,
4 Geochemical and Isotopic Composition of Ground Water, with Emphasis on Sources of Sulfate, in the Upper Floridan Aquifer and Intermediate Aquifer System in Southwest Florida
ROMP 22), but in other locations, sulfate concentrations remained relatively low in the deeper part of the Upper Floridan aquifer (for example, ROMP 9; fig. 2). This variability may be related to differences in the occurrence of gypsum or anhydrite in the aquifer. It also may indicate differences in the amount of upwelling of sulfate-rich water from deeper parts of the aquifer. At ROMP 20 in coastal Sarasota County, sulfate concentrations were high (about 1,500 mg/L) and remained relatively constant with depth (fig. 2). At this site, chloride concentrations increase with depth. The differences in the stratification of sulfate in the aquifers indicate that sources may vary both vertically and laterally.
Population growth and agriculture have been placing increased demands on ground-water resources in southwest Florida. Heavy pumping of the Upper Floridan aquifer has resulted in significant depressions in the potentiometric surface compared to predevelopment conditions (Yobbi, 1983; Ryder, 1985; Bush and Johnston, 1988). This heavy pumping can render water supplies nonpotable because of
chloride
sulfate
SULFATE OR CHLORIDE CONCENTRATION, IN MILLIGRAMS PER LITER
0
200
600
800
1,200
1,400
1,800
1,600
1,000
400
ALT
ITU
DE
, IN
FE
ET
BE
LOW
SE
A L
EV
EL
0 0
chloride
sulfate
0500 500 5001,000 1,000 1,0001,500 1,500 1,5002,000 2,000 2,0002,500 2,500 2,500
chloride
sulfate
Upper Floridan aquifer
Upper Floridan aquifer
Upper Floridan aquifer
Intermediate aquifer system
Intermediate aquifer system
NOTE: All samples collected by reverse air during drilling
Intermediate aquifer system
ROMP 20 ROMP 22 ROMP 9
Figure 2. Profiles of sulfate and chloride concentrations in water from the intermediate aquifer system and Upper Floridan aquifer, collected as part of the Southwest Florida Water Management District’s Regional Observation and Monitoring Program (ROMP). (Locations of drill sites shown in figure 1.)
lateral saltwater intrusion along coastal areas and upwelling of more mineralized water from deeper parts of the aquifer. Degradation of freshwater resources also can occur by movement of mineralized water from the Upper Floridan aquifer to the intermediate aquifer system through wells open to both aquifers (Hutchinson, 1992; Metz, 1996). A better understanding of the vertical and lateral variability in water quality and solute sources can help water managers more judiciously develop water resources.
In 1991, the U.S. Geological Survey (USGS) began a cooperative study with the Southwest Florida Water Management District (SWFWMD) to evaluate sulfate sources in the Upper Floridan aquifer and, locally, in the intermediate aquifer system in two separate areas of the water management district. One area is south of Tampa Bay in the confined part of the aquifer. The other study area is in the northern part of the District, where isolated high sulfate concentrations have been observed (Sacks, 1996). This report focuses on the southern study area.
Geologic and Hydrogeologic Framework 5
Purpose and Scope
The purpose of this report is to evaluate sources of sulfate in the Upper Floridan aquifer and intermedi-ate aquifer system in southwest Florida, specifically in the Peace and Myakka River Basins and adjacent coastal areas. In addition, processes controlling the geochemical and isotopic composition of the ground water are described, and hypotheses about reactions occurring in the Upper Floridan aquifer are examined using geochemical mass-balance modeling. Water samples were collected at 63 wells from various depth intervals in the Upper Floridan aquifer and intermedi-ate aquifer system at about 25 separate locations in parts of Sarasota, Charlotte, De Soto, Hardee, Mana-tee, and Polk Counties. Samples also were collected from a saline spring (Warm Mineral Springs) and from the Lower Floridan aquifer. Existing chemical data were compiled from the middle confining unit.
The sampling focused along three flow paths in the Upper Floridan aquifer, from the recharge area, where sulfate concentrations are low, to the coastal discharge area, where sulfate concentrations are greater than the drinking water standard. Flow paths were derived from a map estimating the potentiomet-ric surface for predevelopment conditions (Bush and Johnston, 1988). Samples were collected at other locations for better areal coverage and to better define saline waters. Water was sampled for major ions, selected trace elements, dissolved organic carbon, field parameters (temperature, pH, specific conduc-tance, alkalinity, sulfide), and stable isotopes (sulfur-34, deuterium, oxygen-18, and carbon-13). The ratio of strontium-87 to strontium-86 was analyzed for waters along one of the flow paths. Limited chemical and isotopic analysis of minerals present in the aquifer was necessary for geochemical modeling and to iden-tify sources of sulfate and carbon in the aquifer sys-tems.
Acknowledgments
Well selection and sampling efforts depended upon the generous assistance of many individuals at the Southwest Florida Water Management District, including personnel from the Ambient Ground-Water Quality Monitoring Program (with particular thanks to Eric DeHaven and Gregg Jones), Regional Observation and Monitoring Program (ROMP) (with particular thanks to David DeWitt), and Resource Data
Department. The authors also would like to extend thanks to well owners and local water utility departments for allowing us to sample and for providing us with specific information about the wells. Rock core and cuttings analyzed for this study were provided by the Florida Geological Survey, Law Environmental, Inc., David Budd (University of Colorado), and the Southwest Florida Water Management District. Shelley Kauffman, University of Virginia, volunteered her time to assist in field efforts.
GEOLOGIC AND HYDROGEOLOGIC FRAMEWORK
The study area is underlain by thick sequences of carbonate rocks that comprise the Florida carbonate platform. The limestones, dolomites and minor evaporites (gypsum and anhydrite) which make up the Florida carbonate platform range in age from Creta-ceous to late Oligocene or early Miocene. These rocks overlie deeper volcanic, metamorphic, and Mesozoic sedimentary rocks (Applin and Applin, 1965; Smith, 1982). The Floridan aquifer system is within the verti-cally continuous carbonate rocks of Tertiary age. These carbonate rocks are overlain by interbedded clastic and carbonate rocks, which are primarily Miocene in age and make up the intermediate aquifer system. The geology and hydrogeology of the Flori-dan aquifer system are summarized in detail in numer-ous reports (for example, Chen, 1965; Ryder, 1985; Miller, 1986; Bush and Johnston, 1988). The geology of the Hawthorn Group, which comprises most of the intermediate aquifer system, is described in detail by Scott (1988). Localized studies of the hydrogeology of the intermediate aquifer system include Wolansky (1983), Duerr and Wolansky (1986), Duerr and Enos (1991) and Barr (1996). Aquifer and confining unit classifications used in this report correspond to those of the Southeast Geological Society (1986). Strati-graphic classifications are based on Miller (1986) and Scott (1988).
Hydrogeology
A multilayered ground-water flow system exists in southwest Florida (table 1). The shallowest aquifer is the unconfined surficial aquifer system, generally occurring within Pleistocene to Holocene deposits.
6 Geochemical and Isotopic Composition of Ground Water, with Emphasis on Sources of Sulfate, in the Upper Floridan Aquifer and Intermediate Aquifer System in Southwest Florida
The surficial aquifer system typically ranges from 25 to 100 ft in thickness and consists of varying propor-tions of sand, shell, clay, reworked phosphate grains, and very localized carbonate beds. The surficial aqui-fer system is not usually a large producer of water; however, in coastal areas, well fields commonly have wells that tap the surficial aquifer system. Numerous privately owned wells also tap this aquifer system. Clays in the lower part of the deposits separate the surficial aquifer system from the intermediate aquifer system.
Intermediate Aquifer System
The intermediate aquifer system has multiple permeable zones that correspond to carbonate units and coarser clastic deposits of the Hawthorn Group and locally the Tamiami Formation (Wolansky, 1983; Duerr and Enos, 1991; Barr, 1996). Interbedded clays and finer grained clastics separate these permeable zones. The degree of connection between permeable zones and the areal extent of permeable zones is not well understood because of the heterogeneous nature of the Hawthorn Group.
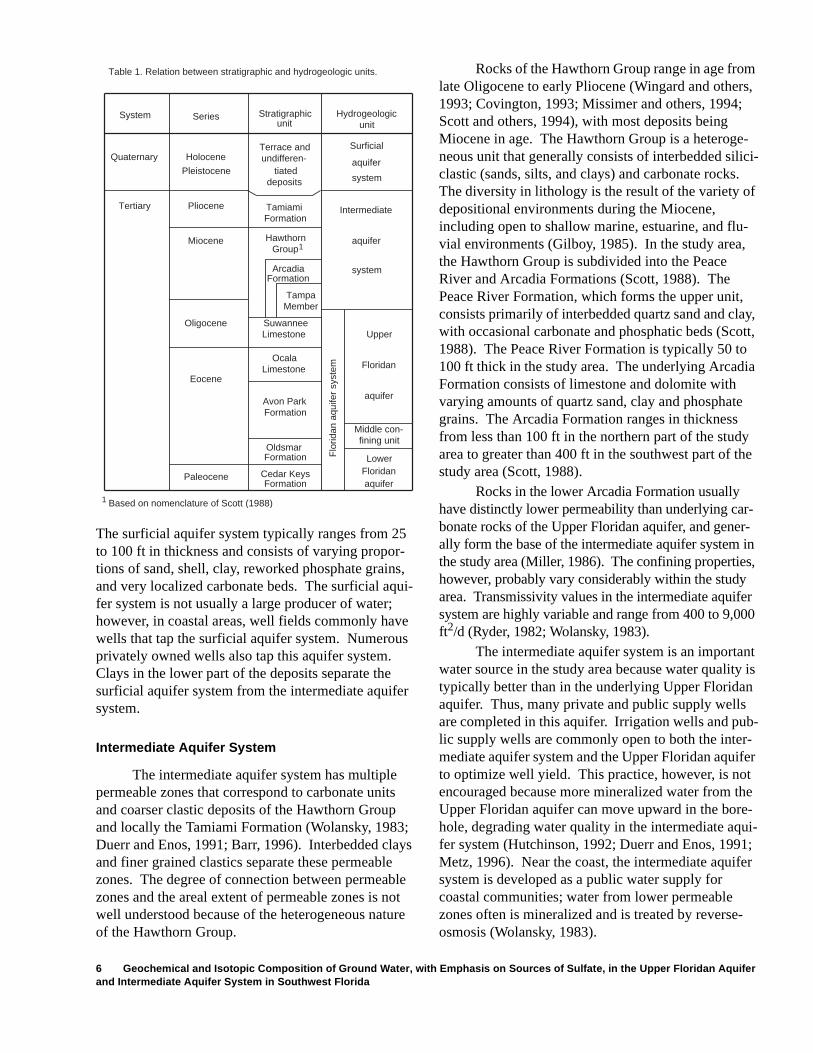
Rocks of the Hawthorn Group range in age from late Oligocene to early Pliocene (Wingard and others, 1993; Covington, 1993; Missimer and others, 1994; Scott and others, 1994), with most deposits being Miocene in age. The Hawthorn Group is a heteroge-neous unit that generally consists of interbedded silici-clastic (sands, silts, and clays) and carbonate rocks. The diversity in lithology is the result of the variety of depositional environments during the Miocene, including open to shallow marine, estuarine, and flu-vial environments (Gilboy, 1985). In the study area, the Hawthorn Group is subdivided into the Peace River and Arcadia Formations (Scott, 1988). The Peace River Formation, which forms the upper unit, consists primarily of interbedded quartz sand and clay, with occasional carbonate and phosphatic beds (Scott, 1988). The Peace River Formation is typically 50 to 100 ft thick in the study area. The underlying Arcadia Formation consists of limestone and dolomite with varying amounts of quartz sand, clay and phosphate grains. The Arcadia Formation ranges in thickness from less than 100 ft in the northern part of the study area to greater than 400 ft in the southwest part of the study area (Scott, 1988).
Rocks in the lower Arcadia Formation usually have distinctly lower permeability than underlying car-bonate rocks of the Upper Floridan aquifer, and gener-ally form the base of the intermediate aquifer system in the study area (Miller, 1986). The confining properties, however, probably vary considerably within the study area. Transmissivity values in the intermediate aquifer system are highly variable and range from 400 to 9,000 ft2/d (Ryder, 1982; Wolansky, 1983).
The intermediate aquifer system is an important water source in the study area because water quality is typically better than in the underlying Upper Floridan aquifer. Thus, many private and public supply wells are completed in this aquifer. Irrigation wells and pub-lic supply wells are commonly open to both the inter-mediate aquifer system and the Upper Floridan aquifer to optimize well yield. This practice, however, is not encouraged because more mineralized water from the Upper Floridan aquifer can move upward in the bore-hole, degrading water quality in the intermediate aqui-fer system (Hutchinson, 1992; Duerr and Enos, 1991; Metz, 1996). Near the coast, the intermediate aquifer system is developed as a public water supply for coastal communities; water from lower permeable zones often is mineralized and is treated by reverse-osmosis (Wolansky, 1983).
System
Quaternary
Tertiary
Series
Holocene
Pleistocene
Pliocene
Miocene
Oligocene
Eocene
Paleocene
Oldsmar
Cedar KeysFormation
Avon ParkFormation
OcalaLimestone
SuwanneeLimestone
ArcadiaFormation
TampaMember
HawthornGroup
TamiamiFormation
tiateddeposits
Terrace andundifferen-
LowerFloridanaquifer
Middle con-fining unit
Upper
Floridan
aquifer
Intermediate
aquifer
system
Surficial
aquifer
system
Flo
ridan
aqu
ifer
syst
em
Stratigraphicunit
Hydrogeologicunit
Table 1. Relation between stratigraphic and hydrogeologic units.
Formation
1
1 Based on nomenclature of Scott (1988)
Geologic and Hydrogeologic Framework 7
Flow in the intermediate aquifer system is usually west or southwest toward the coast, except in the north-ern Hardee and southern Polk Counties, where flow is toward the Peace River (Wolansky, 1983; Duerr and Enos, 1991; Mularoni, 1992a). In much of the study area, water is recharged to the intermediate aquifer sys-tem from the surficial aquifer system. However, the intermediate aquifer system locally discharges in the vicinity of the Peace and Myakka Rivers and in coastal areas, where heads in the intermediate aquifer system are higher than in the overlying surficial aquifer system (Wolansky, 1983). Throughout much of Sarasota County and most of De Soto and Hardee Counties, water also enters the intermediate aquifer system through upward leakage from the Upper Floridan aquifer.
Floridan Aquifer System
The Floridan aquifer system is a vertically con-tinuous sequence of carbonate rocks of generally high permeability that are hydraulically connected in varying degrees (Miller, 1986). In the study area, the aquifer system is separated by the less-permeable middle con-fining unit into an Upper and Lower Floridan aquifer.
Upper Floridan Aquifer
The Upper Floridan aquifer typically consists of limestone and dolomite of the Suwannee Limestone, the Ocala Limestone, and the Avon Park Formation (table 1). (Where permeability at the bottom of the Hawthorn Group is high, usually in the carbonate-rich Tampa Member of the Arcadia Formation, this unit also is considered part of the aquifer.) The Suwannee Limestone, of early Oligocene age, consists primarily of fine to medium-grained pelletal limestone, with trace amounts of sand and clay in the upper portions. The Suwannee Limestone is not present in northern and eastern Polk County, where the limestone presum-ably has been eroded; its maximum thickness is about 400 ft in Sarasota County (Miller, 1986). The underly-ing Ocala Limestone, of late Eocene age, is typically 200 to 400 ft thick in the study area and generally is composed of soft, fossiliferous to micritic limestone (Miller, 1986). Lower parts of the Ocala may be locally dolomitized. Both the Suwannee and Ocala Limestones were deposited in open to marginal marine environments, and evaporite minerals are not present (Miller, 1986; Randazzo and others, 1990). The underlying Avon Park Formation of middle Eocene age is typically 1,200 to 1,500 ft thick in the study area. The upper part of the Avon Park is usually dolo-mitized, although sometimes it consists of limestone; evaporites are not typically present in the upper part of
this formation. The lower part of the Avon Park For-mation (formerly the Lake City Limestone; Miller, 1986) consists primarily of dolomite, with intergranu-lar gypsum and beds of anhydrite and peat occurring in some locations. The uppermost gypsiferous bed typically forms the base of the Upper Floridan aquifer.
Significant permeable zones occur in the upper part of the Suwannee Limestone and from the lower part of the Ocala Limestone to the upper part of the Avon Park Formation. In the upper limestone sections, poros-ity is generally intergranular, whereas in the more crys-talline dolomite rocks of the Avon Park Formation, porosity is dominated by fractures. Transmissivity val-ues are typically 100,000 to 200,000 ft2/d (Ryder, 1985).
In inland parts of the study area, water from the highly productive Upper Floridan aquifer has been heavily developed for agriculture and public water sup-ply, and wells commonly are drilled into the upper part of the Avon Park Formation. Closer to the coast, chlo-ride and sulfate concentrations are generally higher than regulations permit for potable water supplies; conse-quently, water from the Upper Floridan aquifer typically is treated by reverse osmosis and mixed with water from the intermediate aquifer system to supplement public water supplies. Near the coast, the lower part of the Upper Floridan aquifer (which corresponds to the Avon Park highly permeable zone and contains saline water) is sometimes used for injection of effluent from sewage treatment plants and reverse osmosis desaliniza-tion plants (Hutchinson, 1992).
Middle Confining Unit
The base of the Upper Floridan aquifer and the top of the middle confining unit occurs in a zone of low per-meability gypsiferous dolomite and dolomitic lime-stone. This zone usually corresponds to the middle to lower part of the Avon Park Formation (Miller, 1986; Hickey, 1990). The Avon Park Formation was deposited in a peritidal warm-water carbonate bank, and evaporite deposition occurred in an extensive sabkha or tidal flat environment analogous to the modern Persian Gulf (Miller, 1986; Randazzo and others 1990; Cander, 1991). Gypsum and anhydrite deposits are not continuous and probably were formed in isolated evaporative basins on a carbonate bank separated from the shallow sea. Gypsum typically occurs as nodules within the carbonate rock, but the gypsum is sometimes massive and layered (Hickey, 1990; Cander, 1991). Some of the nodules have a central core of anhydrite. Secondary gypsum also infills preex-isting pore spaces in the rock, resulting in reduced perme-ability of the rock.
8 Geochemical and Isotopic Composition of Ground Water, with Emphasis on Sources of Sulfate, in the Upper Floridan Aquifer and Intermediate Aquifer System in Southwest Florida
In the study area, the middle confining unit gen-erally is present between about 1,200 ft below sea level in the northern part of the study area and about 1,900 ft below sea level in western Sarasota County (Miller, 1986). The occurrence and thickness of the middle confining unit varies because of the localized nature of evaporite beds. The hydraulic conductivity of the middle confining unit (0.01 to 0.1 ft/d; Hickey, 1990) is many orders of magnitude lower than the con-ductivity of the overlying Upper Floridan aquifer. However, the degree of confinement is not well under-stood. Miller (1986) describes the middle confining unit as a “nonleaky confining bed,” whereas Hickey (1990) concludes that the confining properties of this unit may be more analogous to a fine-grained sand-stone than to a compact clay bed.
Lower Floridan Aquifer
The underlying Lower Floridan aquifer consists of carbonate rocks of the Oldsmar and Cedar Keys For-mations. The Oldsmar Formation, of early Eocene age, consists of about 1,000 ft of limestone, dolomite, and
Base from U.S. Geological Survey digital data, 1:2,000,000, 1972Albers Equal-Area Conic projectionStandard Parallels 29˚30’ and 45˚30’, central meridian -83˚00’
Generalized area of discharge from theUpper Floridan aquiferprior to development
Generalized area of recharge to theUpper Floridan aquifer prior to development
Generalized regionalground-water flowdirection in UpperFloridan aquifer prior todevelopment
83°00′ 82°00′
28°00′
27°00′0 15 MILES
15 KILOMETERS0
DE SOTOCOUNTY
HARDEECOUNTY
POLKCOUNTY
MANATEECOUNTY
SARASOTACOUNTY
Warm MineralSprings
Little Salt Springs
CHARLOTTECOUNTY
EXPLANATION
Gulfof
Mexico
Peac
e R
iver
MyakkaRiver
Tam
pa B
ay
CharlotteHarbor
Figure 3. Ground-water flow directions based on predevelopment conditions and recharge and discharge areas in the Upper Floridan aquifer. (Modified from Bush and Johnston, l988; Ryder, 1985.)
thin beds of evaporites and chert. Rocks of the underly-ing Cedar Keys Formation of Paleocene age consist of dolomite with variable amounts of gypsum and anhy-drite. The base of the Floridan aquifer system occurs in areally extensive, thick anhydrite beds in the lower two-thirds of this formation (Miller, 1986). Water in the Lower Floridan aquifer is saline and is not utilized in the study area. The Lower Floridan aquifer is used for waste-water injection in some places.
Ground-Water Flow and Circulation
Prior to ground-water development, water in the Upper Floridan aquifer flowed west-southwest toward the coast from a high in the potentiometric surface in Polk County (fig. 3) (Bush and Johnston, 1988). Dur-ing the past half century, regional declines in the potentiometric surface have occurred in southwest Florida because of large ground-water withdrawals and slow recharge rates due to the presence of thick confining beds (Ryder, 1985). As a result, the modern potentiometric surface is considerably different from predevelopment conditions (Yobbi, 1983; Ryder,
Geologic and Hydrogeologic Framework 9
1985; Mularoni, 1992b). Ground-water flow rates are very sluggish in the confined part of the aquifer (Bush and Johnston, 1988; 20 to 30 ft/year according to 14C dating by Plummer and others, 1983). Because flow is so slow, insufficient time has passed for ground-water development to affect regional ground-water chemis-try in the Upper Floridan aquifer. However, induced upwelling can occur in isolated areas of high pump-age, which can locally impact water quality in shallow parts of the aquifer (Steinkampf, 1982). For this study, predevelopment flow paths are assumed to be valid for evaluating the chemical character of water within the Upper Floridan aquifer.
Although lateral flow paths are assumed from potentiometric-surface maps, the depth of ground-water circulation within the Upper Floridan aquifer is not well understood. Downward head gradients are present in the Upper Floridan aquifer in recharge areas and upward head gradients are present in aquifer discharge areas. Areas of recharge from the intermediate aquifer system to the Upper Floridan aquifer include eastern Manatee County, northern Hardee County, and Polk County (except in the immediate vicinity of the Peace River; fig. 3) (Ryder, 1985; Aucott, 1988). Highest recharge rates are in ridge areas of Polk County.
Areas of discharge from the Upper Floridan aqui-fer are near the coast and in the lower Peace River and Myakka River Basins (fig. 3). In river valleys, upward discharge is caused by decreased heads in the shallower aquifers. Upward flow within and between aquifers may be enhanced by preferential flow through deep fractures or faults. In the Peace River valley upwelling probably moves water with higher solute concentrations from deeper to shallower parts of the Upper Floridan aquifer (Kaufman and Dion, 1968; Jones and Upchurch, 1993). In coastal areas, the saltwater interface drives upwelling within the Upper Floridan aquifer and upward discharge into the intermediate aquifer system (fig. 4). Saline water occurs at depth in the Upper Floridan aquifer near the coast and below the base of the aquifer in inland areas. Prior to ground-water development, the freshwater flow system continued offshore and discharged into the Gulf of Mexico. Results from a solute-transport model of pre-development conditions, along a cross section near the City of Sarasota, indicate that more than half of the fresh-water in the aquifer previously discharged beneath the Gulf of Mexico (HydroGeoLogic, Inc., 1994).
Large declines in the potentiometric surface of the Upper Floridan aquifer have resulted in reversals in head gradients between the Upper Floridan aquifer and the intermediate aquifer system in some parts of the study area (Ryder, 1985). Consequently, some dis-
charge areas prior to ground-water development cur-rently have the potential to receive recharge from the intermediate aquifer system. Changes from discharge to recharge conditions have occurred in parts of north-eastern Sarasota County and in the Peace River Basin in northern De Soto and central Hardee Counties.
Because of the high degree of confinement of the aquifer systems, very few springs are present in the study area (fig. 3). The largest springs are Warm Mineral Springs and Little Salt Springs within the lower Myakka River Basin. Warm Mineral Springs discharges warm, saline water similar to water in deeper parts of the Upper Floridan aquifer (Hutchinson; 1992). Kohout and others (1977) suggested that water discharging from this spring has circulated deeply within the Floridan platform. Little Salt Springs is less saline (about 7 percent modern seawa-ter according to the chloride concentration) than Warm Mineral Springs (about 50 percent modern seawater), but still probably derives some component from the Upper Floridan aquifer. Several small springs also occur in the vicinity of the Peace River; the springs probably discharge from the intermediate aquifer system (Hammett, 1990).
Mineralogical Data from Aquifers
Mineralogy and the chemical and isotopic compo-sition of major minerals in the aquifer systems were eval-uated to assist in interpreting the chemical and isotopic composition of the ground water. The mineralogy of the
WFEET
600
400
200
SEALEVEL
200
400
600
800
1,000
1,200
1,400
1,600
1,800
2,000
Gulf ofMexico S
ara
sota
Ba
yS
AR
AS
OT
A C
O.
MAN
ATE
E C
O.
MAN
ATE
E C
O.
HA
RD
EE
CO
.
HA
RD
EE
CO
.P
OLK
CO
.
Confining bed
Surficialaquifersystem
Intermediate aquifer systemFresh-waterSaltwater
Saltwater
Upper Floridan aquifer
Top of highlypermeable zone
Freshwater
Top of intergranularevaporites
Middle confining unit
0 10 20 30 MILES
0 10 20 30 KILOMETERS
Confining bed
E
Figure 4. Generalized hydrogeologic section showing flow patterns in the Upper Floridan aquifer between Polk County and coastal Sarasota County. (Modified from Ryder, l985.)
10 Geochemical and Isotopic Composition of Ground Water, with Emphasis on Sources of Sulfate, in the Upper Floridan Aquifer and Intermediate Aquifer System in Southwest Florida
Floridan aquifer system has been defined in previous studies, with a thorough summary by Sprinkle (1989). Calcite and dolomite are, by far, the dominant minerals in the aquifer system. Most of the calcite ranges from pure CaCO3 to low magnesian calcite (less than 2 mole per-cent magnesium; Hanshaw and others, 1971). Dolomites range in composition from stoichiometric dolomite (CaMg(CO3)2) to Ca1.12Mg0.88(CO3)2 (Hanshaw and others, 1971; Randazzo and Hickey, 1978). It is gener-ally thought that dolomites of the Avon Park Formation were formed not long after deposition during the middle Eocene by a platform-wide influx of normal to hypersa-line seawater (Cander, 1991). Multiple dolomitization episodes, however, probably occurred. Some dolomites probably formed in saltwater mixing zones at later times (Hanshaw and Back, 1972; Randazzo and Hickey, 1978; Cander, 1991). This variability in origin probably affects the composition of dolomites and influences the solubil-ity of dolomite in ground water (Sprinkle, 1989).
Gypsum (CaSO4·2H2O) and anhydrite (CaSO4) occur in deeper parts of the aquifer system (the Avon Park Formation and deeper units). Halite and other hypersaline evaporite minerals are not present in these deposits. Evaporite minerals have not been noted in for-mations overlying the Avon Park Formation, which cor-responds to shallow parts of the Upper Floridan aquifer.
Other minor minerals include quartz and chert, apatite, clay minerals (kaolinite, glauconite, and possi-bly montmorillonite), potassium feldspar, and metallic oxides and sulfides (for example, goethite and pyrite); localized thin beds of peat and carbonaceous material also occur within the aquifer system (Hanshaw and oth-ers, 1971; Sprinkle, 1989; Katz and others, 1995b). Celestite (SrSO4) has been observed in small quantities in the Suwannee Limestone and upper part of the Avon Park Formation in well cuttings from Hardee and De Soto Counties; these cuttings did not contain any gyp-sum (McCartan and others, 1992b). Celestite also has been observed in core from a site in northwest central Florida, in association with gypsum in deeper parts of the Avon Park Formation (Cook and others, 1985).
The intermediate aquifer system has a more complex hydrogeology and mineralogy and is consid-erably more heterogeneous than the Upper Floridan aquifer. Other than calcite and dolomite in carbonate sections, quartz is abundant in siliciclastic deposits in the intermediate aquifer system. Other common minerals include clays (illite, smectite, sepiolite, palygorskite, and kaolinite), phosphatic minerals (apatite [Ca5(PO4)3(F,Cl,OH)], francolite [(Ca,Na)5(PO4,CO3)3(F,OH)], and amorphous phos-phate), and pyrite (FeS2) (Scott, 1988; McCartan and others, 1992a; Florida Geological Survey, written
commun., 1993; Kauffman, 1994; Katz and others, 1995b). Celestite has been observed in small quanti-ties in the Hawthorn Group in Hardee and De Soto Counties (McCartan and others, 1992b). Gypsum has not been reported in the intermediate aquifer system.
Carbonate Minerals
To elucidate geochemical processes in the ground water, it is necessary to define the stable carbon isotopic composition (13C) of the carbonate minerals that inter-act with the water. Isotopic data are reported as ratios of the heavy to the light isotope (for example, 13C/12C), relative to a standard, in delta (δ) notation:
(1)
where Rsample and Rstd are the ratio of the heavy to the light isotope in the sample and in the standard, respectively. Standards used in this report are Pee Dee belemnite (PDB) for carbon (δ13C), Cañon Diablo troilite (CDT) for sulfur (δ34S), and Standard Mean Ocean Water (SMOW) for hydrogen (δD) and oxygen (δ18O). Units are in parts per thousand, which is denoted as per mil.
The δ13C composition of calcite and dolomite in the Floridan aquifer system has been determined in previous studies to evaluate geochemical reactions and to better understand dolomitization and diagenetic processes (Hanshaw and Back, 1972; Cander, 1991). Values near 0 per mil indicate little change from sea-water composition. Most reported δ13C values for calcite are near 0 per mil, and range between -0.4 and 3.1 per mil in the aquifer (Hanshaw and Back 1972; Sprinkle, 1989; Cander, 1991). The range of reported δ13C for dolomite is between -7.5 and 1.0 per mil, which is considerably greater than the range for calcite (Hanshaw and Back 1972; Sprinkle, 1989; Cander, 1991). Hanshaw and Back (1972) noted two group-ings of dolomite based on isotopic composition, one which was near seawater composition and the other which was isotopically lighter than seawater (between -7.5 and -2.8 per mil). They hypothesized that lighter dolomites formed in the saltwater mixing zone.
Eight additional carbonate rock samples were ana-lyzed for this study in order to obtain specific information from the study area. These included three limestone sam-ples from carbonate sections of the Hawthorn Group, two limestone samples from the Suwannee Limestone, and three dolomite samples from the Avon Park Formation (fig. 5a). For most dolomite samples, x-ray diffraction analysis verified that dolomite was the only carbonate mineral present (John M. Neil, U.S. Geological Survey, written commun., 1994). The δ13C values for calcite
δsample 1 000Rsample
Rstd----------------- 1–
,=
Geologic and Hydrogeologic Framework 11
Figure 5. (a) Rock sampling locations and sites with existing water-quality data from the middle confining unit, and (b) water sampling locations and Upper Floridan aquifer flow paths.
Base from U.S. Geological Survey digital data, 1:2,000,000, 1972Albers Equal-Area Conic projectionStandard Parallels 29°30′ and 45°30′, central meridian -83°00′
EXPLANATION
EXPLANATION
Rock sampling location:
Water sampling location from:
Gypsum
Site with existing water-quality data from the middle confining unit,sampled with a thief sampler
(Name corresponds to site name in table 5)
Carbonate rock
(Name corresponds to site name in table 2)
83°00′
83°00′
82°00′
82°00′
28°00′
27°00′0 15 MILES
15 KILOMETERS0
Gulfof
Mexico
Tam
pa B
ay
Tam
pa B
ay
KnightTrail
North Port
ROMP 20
ROMP 22W-16274 W-1655
W-12393
W-8741
ROMP 45Sun CityCenter
ROMP 39 ROMP 39
ROMP TR7-2
Intermediate aquifer system
Surficial aquifer system
Spring
(Number corresponds tosite number in table 4and appendix)
Upper Floridan aquifer flow path and number
Lower Floridan aquifer
1
28°00′
27°00′0 15 MILES
15 KILOMETERS0
Gulfof
Mexico
1
8,96,72-5
16-181319-23
24,25 2632,33 27-29 30,31
3839,4041
46
47
34-37
42-45
48,49,51 50,52 57,58
53,5455,56
59-61
62-64
1
2 3
14,1510-12
(a)
(b)
Upper Floridan aquifer
12 Geochemical and Isotopic Composition of Ground Water, with Emphasis on Sources of Sulfate, in the Upper Floridan Aquifer and Intermediate Aquifer System in Southwest Florida
ranged from 1.9 to -7.1 per mil (table 2). The lighter values may be from caliche, which is deposited in root zones during periods when carbonate rocks are exposed above sea level (D. Budd, University of Colorado; oral commun., 1994). The δ13C values for dolomite ranged from 0.9 to 3.1 per mil (table 2). These values are dis-tinctly different from the values for isotopically light dolomites observed by Hanshaw and Back (1972).
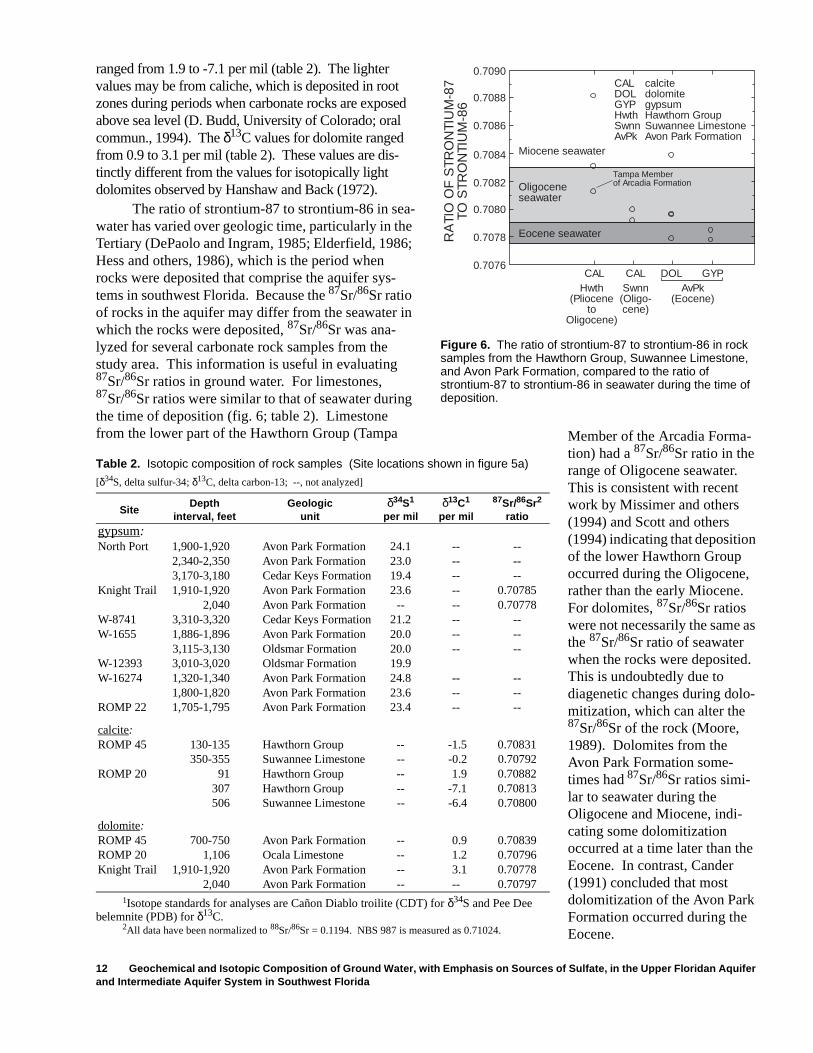
The ratio of strontium-87 to strontium-86 in sea-water has varied over geologic time, particularly in the Tertiary (DePaolo and Ingram, 1985; Elderfield, 1986; Hess and others, 1986), which is the period when rocks were deposited that comprise the aquifer sys-tems in southwest Florida. Because the 87Sr/86Sr ratio of rocks in the aquifer may differ from the seawater in which the rocks were deposited, 87Sr/86Sr was ana-lyzed for several carbonate rock samples from the study area. This information is useful in evaluating 87Sr/86Sr ratios in ground water. For limestones, 87Sr/86Sr ratios were similar to that of seawater during the time of deposition (fig. 6; table 2). Limestone from the lower part of the Hawthorn Group (Tampa Table 2. Isotopic composition of rock samples (Site locations shown in figure 5a)
[δ34S, delta sulfur-34; δ13C, delta carbon-13; --, not analyzed]
SiteDepth
interval, feetGeologic
unitδ34S1
per mil
1Isotope standards for analyses are Cañon Diablo troilite (CDT) for δ34S and Pee Dee belemnite (PDB) for δ13C.
δ13C1
per mil
87Sr/86Sr2
ratio
2All data have been normalized to 88Sr/86Sr = 0.1194. NBS 987 is measured as 0.71024.
gypsum:North Port 1,900-1,920 Avon Park Formation 24.1 -- --
2,340-2,350 Avon Park Formation 23.0 -- --3,170-3,180 Cedar Keys Formation 19.4 -- --
Knight Trail 1,910-1,920 Avon Park Formation 23.6 -- 0.707852,040 Avon Park Formation -- -- 0.70778
W-8741 3,310-3,320 Cedar Keys Formation 21.2 -- --W-1655 1,886-1,896 Avon Park Formation 20.0 -- --
3,115-3,130 Oldsmar Formation 20.0 -- --W-12393 3,010-3,020 Oldsmar Formation 19.9W-16274 1,320-1,340 Avon Park Formation 24.8 -- --
1,800-1,820 Avon Park Formation 23.6 -- --ROMP 22 1,705-1,795 Avon Park Formation 23.4 -- --
calcite:ROMP 45 130-135 Hawthorn Group -- -1.5 0.70831
350-355 Suwannee Limestone -- -0.2 0.70792ROMP 20 91 Hawthorn Group -- 1.9 0.70882
307 Hawthorn Group -- -7.1 0.70813506 Suwannee Limestone -- -6.4 0.70800
dolomite:ROMP 45 700-750 Avon Park Formation -- 0.9 0.70839ROMP 20 1,106 Ocala Limestone -- 1.2 0.70796Knight Trail 1,910-1,920 Avon Park Formation -- 3.1 0.70778
2,040 Avon Park Formation -- -- 0.70797
0.7090
RA
TIO
OF
STR
ON
TIU
M-8
7 TO
STR
ON
TIU
M-8
6
0.7088
0.7086
0.7084
0.7082
0.7080
0.7078
0.7076
Miocene seawater
Eocene seawater
Oligoceneseawater
Tampa Memberof Arcadia Formation
CAL CAL DOL GYPAvPk
(Eocene)Hwth
(Plioceneto
Oligocene)
Swnn(Oligo-cene)
CALDOLGYPHwthSwnnAvPk
calcitedolomitegypsumHawthorn GroupSuwannee LimestoneAvon Park Formation
Figure 6. The ratio of strontium-87 to strontium-86 in rock samples from the Hawthorn Group, Suwannee Limestone, and Avon Park Formation, compared to the ratio of strontium-87 to strontium-86 in seawater during the time of deposition.
Member of the Arcadia Forma-tion) had a 87Sr/86Sr ratio in the range of Oligocene seawater. This is consistent with recent work by Missimer and others (1994) and Scott and others (1994) indicating that deposition of the lower Hawthorn Group occurred during the Oligocene, rather than the early Miocene. For dolomites, 87Sr/86Sr ratios were not necessarily the same as the 87Sr/86Sr ratio of seawater when the rocks were deposited. This is undoubtedly due to diagenetic changes during dolo-mitization, which can alter the 87Sr/86Sr of the rock (Moore, 1989). Dolomites from the Avon Park Formation some-times had 87Sr/86Sr ratios simi-lar to seawater during the Oligocene and Miocene, indi-cating some dolomitization occurred at a time later than the Eocene. In contrast, Cander (1991) concluded that most dolomitization of the Avon Park Formation occurred during the Eocene.
Geologic and Hydrogeologic Framework 13
Trace element concentrations in carbonate min-erals in the Upper Floridan aquifer have been analyzed in previous studies to better understand processes con-trolling dolomitization and the diagenetic history of the rock (for example, Randazzo and Bloom, 1985; Cander, 1991). Elements present in trace levels in cal-cite and dolomite include strontium, sodium, iron, and manganese (Sprinkle, 1989). The average concentra-tion of strontium in calcite is usually less than 500 ppm and in dolomite is less than 250 ppm (Randazzo and Hickey, 1978; Sprinkle, 1989; Cander, 1991; Budd and others, 1993). Calcite and dolomite in the Avon Park Formation have average iron and man-ganese concentrations that are less than 200 ppm and less than 20 ppm, respectively (Cander, 1991). Sodium concentrations in calcite are less than 500 ppm and in dolomite range from less than 500 ppm to 2,000 ppm (Randazzo and Bloom, 1985).
Gypsum
Gypsum and anhydrite have not been reported from the intermediate aquifer system or the upper part of the Upper Floridan aquifer (within the Suwannee and Ocala Limestones). However, gypsum is more abundant at the base of the aquifer and within the mid-dle confining unit, which corresponds to the middle to lower part of the Avon Park Formation. Because gyp-sum is a likely source for sulfate in the ground water, the isotopic and trace element composition of gypsum from the middle confining unit and the Lower Floridan aquifer was evaluated.
Limited data are available for the sulfur isotope composition of gypsum from the Floridan aquifer system (Rye and others, 1981; Sprinkle, 1989; Sacks, 1996), with δ34S values ranging from 18.9 to 24.5 per mil. From within the study area, additional gypsum samples from the Floridan aquifer system were ana-lyzed for δ34S, including seven samples from the Avon Park Formation, two from the Oldsmar Formation, and two from the Cedar Keys Formation. Locations of samples are shown in figure 5a, and results are listed in table 2. The sulfur isotope composition of gypsum from the Avon Park Formation (usually in the middle confining unit) ranged from 20.0 to 24.8 per mil. Val-ues heavier than those reported by Rye and others (1981) (greater than 24 per mil) may be due to changes in extraction procedures and calibration standards since the early 1980’s (W.C. Shanks, U.S. Geological Survey, written commun., 1995; Rees and others, 1978). Deeper samples from the underlying Oldsmar and Cedar Keys Formations (Lower Floridan aquifer
and lower confining unit of the Floridan aquifer sys-tem) were slightly lighter, ranging from 19.4 to 21.2 per mil. (Analytical uncertainty according to the labo-ratory is about 0.5 per mil.)
The δ34S of Eocene-age gypsum from the Avon Park Formation is isotopically heavier than expected for evaporites deposited from Eocene seawater (about 20 per mil; Claypool and others, 1980). Gypsum that is isotopically heavier than seawater probably is the result of localized sulfate reduction in brines from which the gypsum precipitated. Sulfur is fractionated during sulfate reduction. The reduced sulfur is enriched in the lighter isotope (sulfur-32), and isotopi-cally heavier sulfate remains in solution. In core descriptions, zones of pyrite, organic material, and plant remains are often reported in similar or adjacent depth intervals as evaporites (Southwest Florida Water Management District, written commun., 1995). This indicates that anaerobic conditions were present, although it is not known if these sediments were anaerobic at the time gypsum precipitated. Attempts to analyze the isotopic composition of sulfur in pyrite and peat were unsuccessful because sample size was too small (W.C. Shanks, U.S. Geological Survey, written commun., 1994).
The ratio of 87Sr/86Sr was analyzed for two gypsum samples from the Avon Park Formation (corresponding to the middle confining unit). These two samples had very similar strontium isotope ratios, within the range of seawater during the middle Eocene (0.7077 to 0.7079) (fig. 6; table 2).
Gypsum often contains trace amounts of ions that can substitute for calcium in normal lattice sites or reside in interstitial positions (Kushnir, 1980). Data were not previously available on trace element con-centrations in gypsum and anhydrite from the Floridan aquifer system (Sprinkle, 1989). Thus, trace element concentrations were estimated for six samples from the Floridan aquifer system. Two duplicate samples were also analyzed. A visually pure sample of gypsum was crushed with a mortal and pestle, dried in a desiccator, and precisely weighed. The sample was then dissolved with a known volume of deionized water, acidified with 1 mL of 70 percent hydrochloric acid, and analyzed for selected dissolved cations and trace elements. An unacidified sample was analyzed for sulfate concentration to compare with the theoreti-cal weight percent expected for gypsum and anhydrite. This can be used as an indicator of sample purity. The concentrations of dissolved constituents were related to ppm based on the original sample weight. Stron-tium was the most abundant trace element, with a
14 Geochemical and Isotopic Composition of Ground Water, with Emphasis on Sources of Sulfate, in the Upper Floridan Aquifer and Intermediate Aquifer System in Southwest Florida
Table 3. Concentration of selected constituents in gypsum
[ppm, parts per million; %, percent; concentrations determined by dissolving visually pure sample of known weight into known volume of deionized water and analyzing water sample at laboratory using standard methods of Fishman and Friedman (1989); potassium, silica, and manganese all less than detection limit of 90, 9, and 1 ppm, respectively]
ConstituentReporting
unit
Range of chemicalconstituents1
1Six gypsum samples from Floridan aquifer system: W-16274 (1,800-1,820 ft), Knight Trail (1,910-1,920 ft), ROMP 22 (1,705-1,795 ft), North Port (3,170-3,180 ft), W-12393 (3,010-3,040 ft), and W-1655 (1,886-1,896 ft); site locations shown in figure 5a.
MedianDetection
limit
Mean differ-ence between
duplicateanalyses2
2For two sets of duplicate analyses.
Minimum Maximum
Magnesium ppm 120 1,400 570 90 28Sodium ppm 90 380 150 90 21Barium ppm 7 58 42 2 32Iron ppm 5 32 17 4 6Strontium ppm 480 2,000 1,200 1 310Aluminum ppm 43 200 83 18 51Lithium ppm 5 40 25 4 18
Calcium3
3Theoretical weight percent is 23 for gypsum (CaSO4·H2O) and 29 for anhydrite (CaSO4).
weight % 9 31 15 .01 2.0
Sulfate4
4Theoretical weight percent is 56 for gypsum and 71 for anhydrite.
weight % 56 75 70 .01 1.6
median concentration of 1,200 ppm (table 3). Other minor (usually less than 500 ppm) trace elements detected in gypsum included magnesium, sodium, bar-ium, aluminum, lithium, and iron.
GEOCHEMICAL AND ISOTOPIC COMPOSITION OF GROUND WATER
Waters from the Upper Floridan aquifer and intermediate aquifer system were sampled for chemical and isotopic analysis. This information was used to evaluate sources of sulfate in the aquifers and other geochemical processes influencing the chemical and isotopic composition of ground water in the study area.
Sampling Methods
Sampling focused along three flow paths in the Upper Floridan aquifer (fig. 5b); these flow paths were based on predevelopment potentiometric-surface con-ditions. Additional samples were collected outside the flow paths for better spatial coverage and to better sample saltwater end members. Water was collected from wells completed at different depth intervals in the Upper Floridan aquifer and intermediate aquifer sys-tem. Precise depth intervals of sampled wells varied according to well availability. Whenever possible
wells with discrete open intervals were sampled. Sam-ples were collected in both the recharge and discharge areas of the Upper Floridan aquifer, including samples in the saltwater mixing zone. In addition, saline water was sampled from the Lower Floridan aquifer and from a spring (Warm Mineral Springs); a sample also was collected from the surficial aquifer system in the recharge area of the Upper Floridan aquifer. Wells were not available from the middle confining unit, but existing water-quality data were compiled from this unit (fig. 5a). Sampling locations are shown in figure 5b. Open hole intervals of wells along flow paths are illustrated on figure 7; information about sampled wells is listed in table 4.
Purging methods varied depending upon the type of well. Most of the wells sampled were monitor-ing wells, but some wells were used for private or public water supply or irrigation. For monitoring wells, at least three volumes of water were pumped prior to sampling, while field parameters (temperature, pH, and specific conductance) were being measured. Supply and irrigation wells had high yielding pumps that were used routinely. For these wells, sampling commenced after field parameters stabilized. Samples were collected from as close to the well head as possi-ble, prior to the holding tank. A submersible pump was used for sampling most wells. Exceptions are noted in the appendix.
Geochemical and Isotopic Composition of Ground Water 15
For well 23, which is completed in a saline interval of the aquifer, purging of the well was not pos-sible because of regulations regarding discharge of saline waters. Samples were collected using a thief sampler from a depth of 1,650 ft (within the open borehole). The thief sampler was an electronically activated, 2-L sealed container that sampled at a specific depth. Because of the limited volume of sample, only selected chemical and isotopic analyses were done for this water.
For Warm Mineral Springs, a sample was collected from a 200 ft depth in the spring vent by
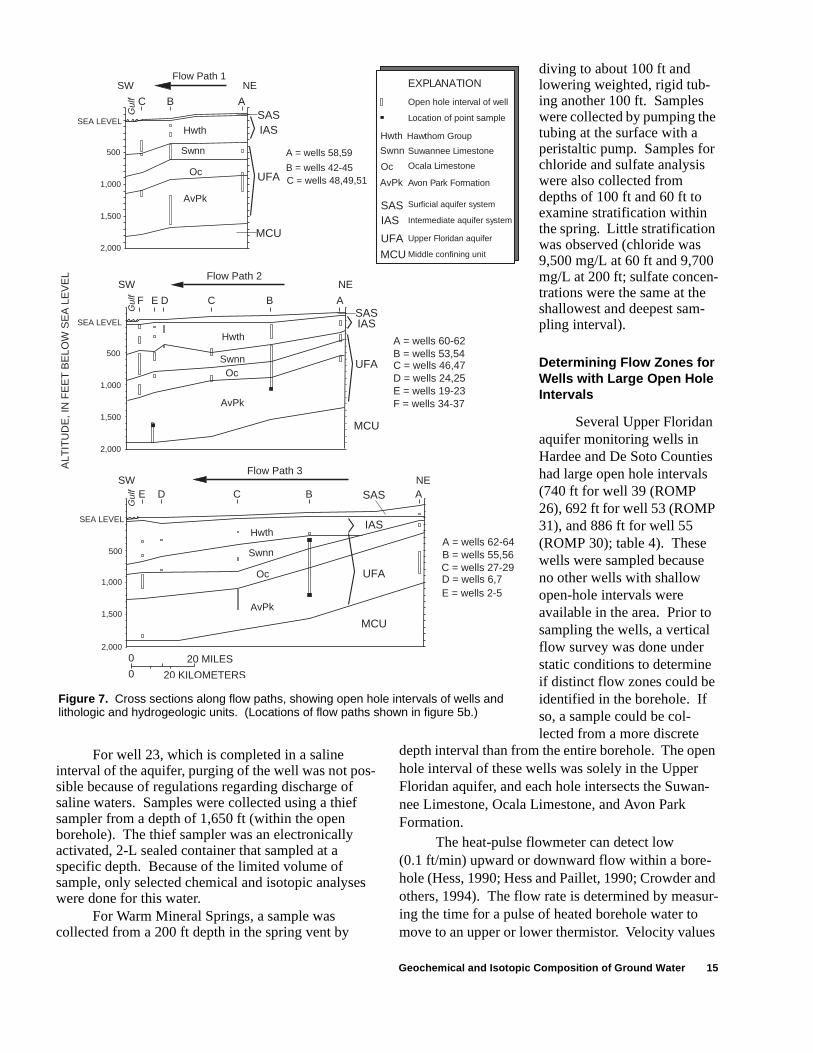
Figure 7. Cross sections along flow paths, showing open hole intervals of wells and lithologic and hydrogeologic units. (Locations of flow paths shown in figure 5b.)
B = wells 42-45C = wells 48,49,51
SEA LEVEL
2,000
500
1,500
A = wells 58,59
Flow Path 1NESW
SEA LEVEL
2,000
500
1,000
1,500
ABCDEF
A = wells 60-62B = wells 53,54C = wells 46,47D = wells 24,25E = wells 19-23F = wells 34-37
Flow Path 2NESW
SEA LEVEL
2,000
500
1,000
1,500
ACDE
B = wells 55,56A = wells 62-64
C = wells 27-29D = wells 6,7E = wells 2-5
Flow Path 3NESW
ALT
ITU
DE
, IN
FE
ET
BE
LOW
SE
A L
EV
EL
MCU
UFA
IASSAS
SAS
SAS
SAS
MCU
UFA
IAS
MCU
UFA
IAS
0
020 MILES
20 KILOMETERS
1,000Oc
Swnn
AvPk
Hwth
ABC
Swnn
Hwth
Oc
AvPk
Oc
Hwth
AvPk
Swnn
Hwth
Oc
AvPk
IAS
UFAMCU
EXPLANATION
Ocala Limestone
Open hole interval of well
Avon Park Formation
Intermediate aquifer system
Surficial aquifer system
Upper Floridan aquifer
Middle confining unit
Swnn Suwannee Limestone
B
Gul
fG
ulf
Gul
fLocation of point sample
Hawthorn Group
diving to about 100 ft and lowering weighted, rigid tub-ing another 100 ft. Samples were collected by pumping the tubing at the surface with a peristaltic pump. Samples for chloride and sulfate analysis were also collected from depths of 100 ft and 60 ft to examine stratification within the spring. Little stratification was observed (chloride was 9,500 mg/L at 60 ft and 9,700 mg/L at 200 ft; sulfate concen-trations were the same at the shallowest and deepest sam-pling interval).
Determining Flow Zones for Wells with Large Open Hole Intervals
Several Upper Floridan aquifer monitoring wells in Hardee and De Soto Counties had large open hole intervals (740 ft for well 39 (ROMP 26), 692 ft for well 53 (ROMP 31), and 886 ft for well 55 (ROMP 30); table 4). These wells were sampled because no other wells with shallow open-hole intervals were available in the area. Prior to sampling the wells, a vertical flow survey was done under static conditions to determine if distinct flow zones could be identified in the borehole. If so, a sample could be col-lected from a more discrete
depth interval than from the entire borehole. The open hole interval of these wells was solely in the Upper Floridan aquifer, and each hole intersects the Suwan-nee Limestone, Ocala Limestone, and Avon Park Formation.
The heat-pulse flowmeter can detect low (0.1 ft/min) upward or downward flow within a bore-hole (Hess, 1990; Hess and Paillet, 1990; Crowder and others, 1994). The flow rate is determined by measur-ing the time for a pulse of heated borehole water to move to an upper or lower thermistor. Velocity values
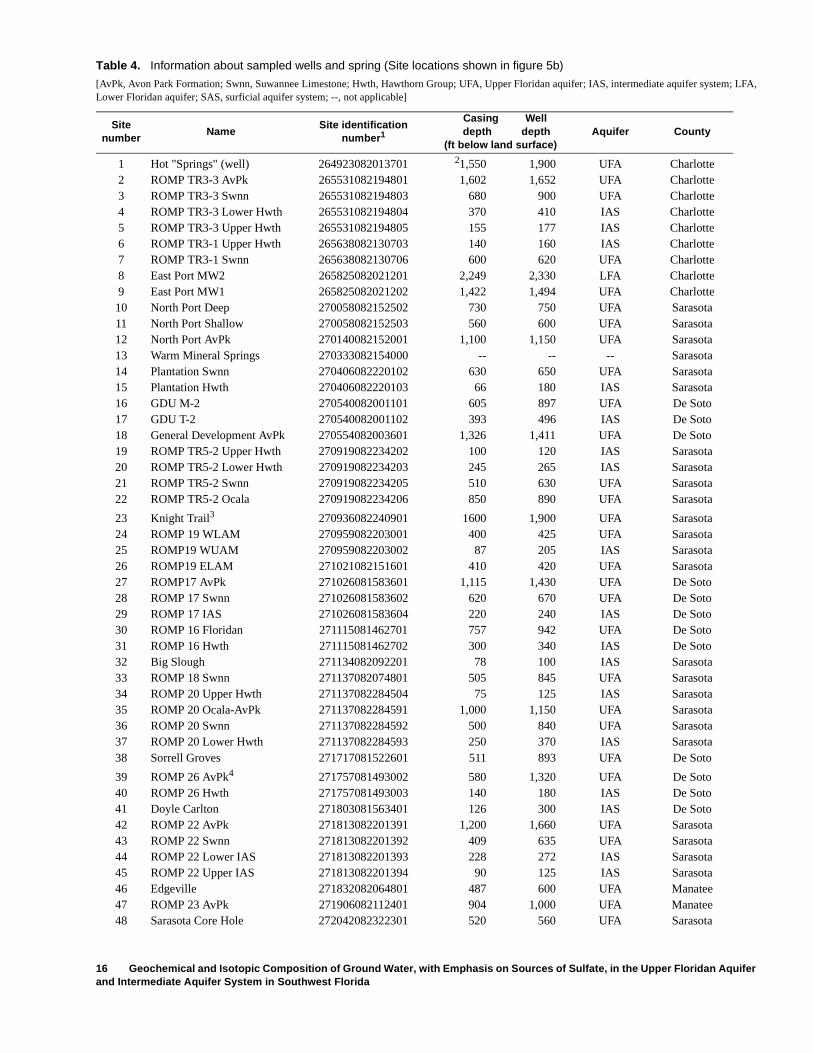
16 Geochemical and Isotopic Composition of Ground Water, with Emphasis on Sources of Sulfate, in the Upper Floridan Aquifer and Intermediate Aquifer System in Southwest Florida
Table 4. Information about sampled wells and spring (Site locations shown in figure 5b)
[AvPk, Avon Park Formation; Swnn, Suwannee Limestone; Hwth, Hawthorn Group; UFA, Upper Floridan aquifer; IAS, intermediate aquifer system; LFA, Lower Floridan aquifer; SAS, surficial aquifer system; --, not applicable]
Sitenumber
NameSite identification
number1
Casing Well depth depth
(ft below land surface)Aquifer County
1 Hot "Springs" (well) 264923082013701 21,550 1,900 UFA Charlotte2 ROMP TR3-3 AvPk 265531082194801 1,602 1,652 UFA Charlotte3 ROMP TR3-3 Swnn 265531082194803 680 900 UFA Charlotte4 ROMP TR3-3 Lower Hwth 265531082194804 370 410 IAS Charlotte5 ROMP TR3-3 Upper Hwth 265531082194805 155 177 IAS Charlotte6 ROMP TR3-1 Upper Hwth 265638082130703 140 160 IAS Charlotte7 ROMP TR3-1 Swnn 265638082130706 600 620 UFA Charlotte8 East Port MW2 265825082021201 2,249 2,330 LFA Charlotte9 East Port MW1 265825082021202 1,422 1,494 UFA Charlotte
10 North Port Deep 270058082152502 730 750 UFA Sarasota11 North Port Shallow 270058082152503 560 600 UFA Sarasota12 North Port AvPk 270140082152001 1,100 1,150 UFA Sarasota13 Warm Mineral Springs 270333082154000 -- -- -- Sarasota14 Plantation Swnn 270406082220102 630 650 UFA Sarasota15 Plantation Hwth 270406082220103 66 180 IAS Sarasota16 GDU M-2 270540082001101 605 897 UFA De Soto17 GDU T-2 270540082001102 393 496 IAS De Soto18 General Development AvPk 270554082003601 1,326 1,411 UFA De Soto19 ROMP TR5-2 Upper Hwth 270919082234202 100 120 IAS Sarasota20 ROMP TR5-2 Lower Hwth 270919082234203 245 265 IAS Sarasota21 ROMP TR5-2 Swnn 270919082234205 510 630 UFA Sarasota22 ROMP TR5-2 Ocala 270919082234206 850 890 UFA Sarasota
23 Knight Trail3 270936082240901 1600 1,900 UFA Sarasota24 ROMP 19 WLAM 270959082203001 400 425 UFA Sarasota25 ROMP19 WUAM 270959082203002 87 205 IAS Sarasota26 ROMP19 ELAM 271021082151601 410 420 UFA Sarasota27 ROMP17 AvPk 271026081583601 1,115 1,430 UFA De Soto28 ROMP 17 Swnn 271026081583602 620 670 UFA De Soto29 ROMP 17 IAS 271026081583604 220 240 IAS De Soto30 ROMP 16 Floridan 271115081462701 757 942 UFA De Soto31 ROMP 16 Hwth 271115081462702 300 340 IAS De Soto32 Big Slough 271134082092201 78 100 IAS Sarasota33 ROMP 18 Swnn 271137082074801 505 845 UFA Sarasota34 ROMP 20 Upper Hwth 271137082284504 75 125 IAS Sarasota35 ROMP 20 Ocala-AvPk 271137082284591 1,000 1,150 UFA Sarasota36 ROMP 20 Swnn 271137082284592 500 840 UFA Sarasota37 ROMP 20 Lower Hwth 271137082284593 250 370 IAS Sarasota38 Sorrell Groves 271717081522601 511 893 UFA De Soto
39 ROMP 26 AvPk4 271757081493002 580 1,320 UFA De Soto40 ROMP 26 Hwth 271757081493003 140 180 IAS De Soto41 Doyle Carlton 271803081563401 126 300 IAS De Soto42 ROMP 22 AvPk 271813082201391 1,200 1,660 UFA Sarasota43 ROMP 22 Swnn 271813082201392 409 635 UFA Sarasota44 ROMP 22 Lower IAS 271813082201393 228 272 IAS Sarasota45 ROMP 22 Upper IAS 271813082201394 90 125 IAS Sarasota46 Edgeville 271832082064801 487 600 UFA Manatee47 ROMP 23 AvPk 271906082112401 904 1,000 UFA Manatee48 Sarasota Core Hole 272042082322301 520 560 UFA Sarasota
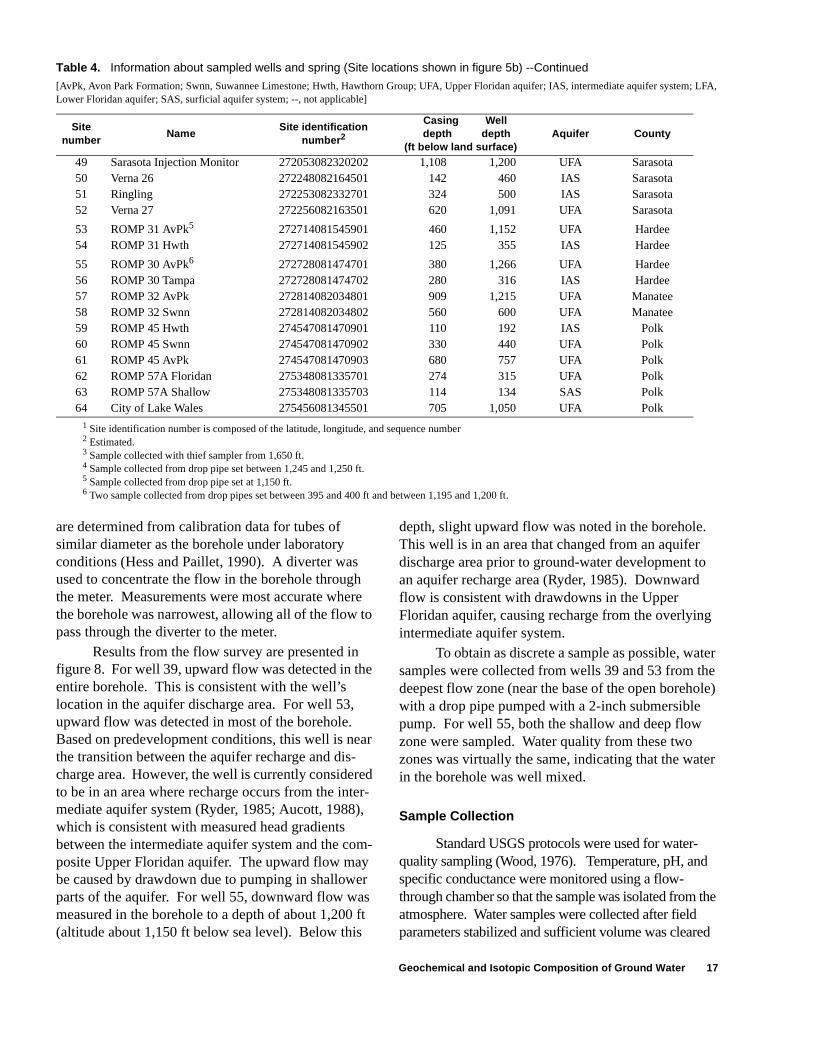
Geochemical and Isotopic Composition of Ground Water 17
Sitenumber
NameSite identification
number2
Casing Well depth depth
(ft below land surface)Aquifer County
49 Sarasota Injection Monitor 272053082320202 1,108 1,200 UFA Sarasota50 Verna 26 272248082164501 142 460 IAS Sarasota51 Ringling 272253082332701 324 500 IAS Sarasota52 Verna 27 272256082163501 620 1,091 UFA Sarasota
53 ROMP 31 AvPk5 272714081545901 460 1,152 UFA Hardee54 ROMP 31 Hwth 272714081545902 125 355 IAS Hardee
55 ROMP 30 AvPk6 272728081474701 380 1,266 UFA Hardee56 ROMP 30 Tampa 272728081474702 280 316 IAS Hardee57 ROMP 32 AvPk 272814082034801 909 1,215 UFA Manatee58 ROMP 32 Swnn 272814082034802 560 600 UFA Manatee59 ROMP 45 Hwth 274547081470901 110 192 IAS Polk60 ROMP 45 Swnn 274547081470902 330 440 UFA Polk61 ROMP 45 AvPk 274547081470903 680 757 UFA Polk62 ROMP 57A Floridan 275348081335701 274 315 UFA Polk63 ROMP 57A Shallow 275348081335703 114 134 SAS Polk64 City of Lake Wales 275456081345501 705 1,050 UFA Polk
1 Site identification number is composed of the latitude, longitude, and sequence number2 Estimated.3 Sample collected with thief sampler from 1,650 ft.4 Sample collected from drop pipe set between 1,245 and 1,250 ft.5 Sample collected from drop pipe set at 1,150 ft.6 Two sample collected from drop pipes set between 395 and 400 ft and between 1,195 and 1,200 ft.
Table 4. Information about sampled wells and spring (Site locations shown in figure 5b) --Continued
[AvPk, Avon Park Formation; Swnn, Suwannee Limestone; Hwth, Hawthorn Group; UFA, Upper Floridan aquifer; IAS, intermediate aquifer system; LFA, Lower Floridan aquifer; SAS, surficial aquifer system; --, not applicable]
are determined from calibration data for tubes of similar diameter as the borehole under laboratory conditions (Hess and Paillet, 1990). A diverter was used to concentrate the flow in the borehole through the meter. Measurements were most accurate where the borehole was narrowest, allowing all of the flow to pass through the diverter to the meter.
Results from the flow survey are presented in figure 8. For well 39, upward flow was detected in the entire borehole. This is consistent with the well’s location in the aquifer discharge area. For well 53, upward flow was detected in most of the borehole. Based on predevelopment conditions, this well is near the transition between the aquifer recharge and dis-charge area. However, the well is currently considered to be in an area where recharge occurs from the inter-mediate aquifer system (Ryder, 1985; Aucott, 1988), which is consistent with measured head gradients between the intermediate aquifer system and the com-posite Upper Floridan aquifer. The upward flow may be caused by drawdown due to pumping in shallower parts of the aquifer. For well 55, downward flow was measured in the borehole to a depth of about 1,200 ft (altitude about 1,150 ft below sea level). Below this
depth, slight upward flow was noted in the borehole. This well is in an area that changed from an aquifer discharge area prior to ground-water development to an aquifer recharge area (Ryder, 1985). Downward flow is consistent with drawdowns in the Upper Floridan aquifer, causing recharge from the overlying intermediate aquifer system.
To obtain as discrete a sample as possible, water samples were collected from wells 39 and 53 from the deepest flow zone (near the base of the open borehole) with a drop pipe pumped with a 2-inch submersible pump. For well 55, both the shallow and deep flow zone were sampled. Water quality from these two zones was virtually the same, indicating that the water in the borehole was well mixed.
Sample Collection
Standard USGS protocols were used for water-quality sampling (Wood, 1976). Temperature, pH, and specific conductance were monitored using a flow-through chamber so that the sample was isolated from the atmosphere. Water samples were collected after field parameters stabilized and sufficient volume was cleared
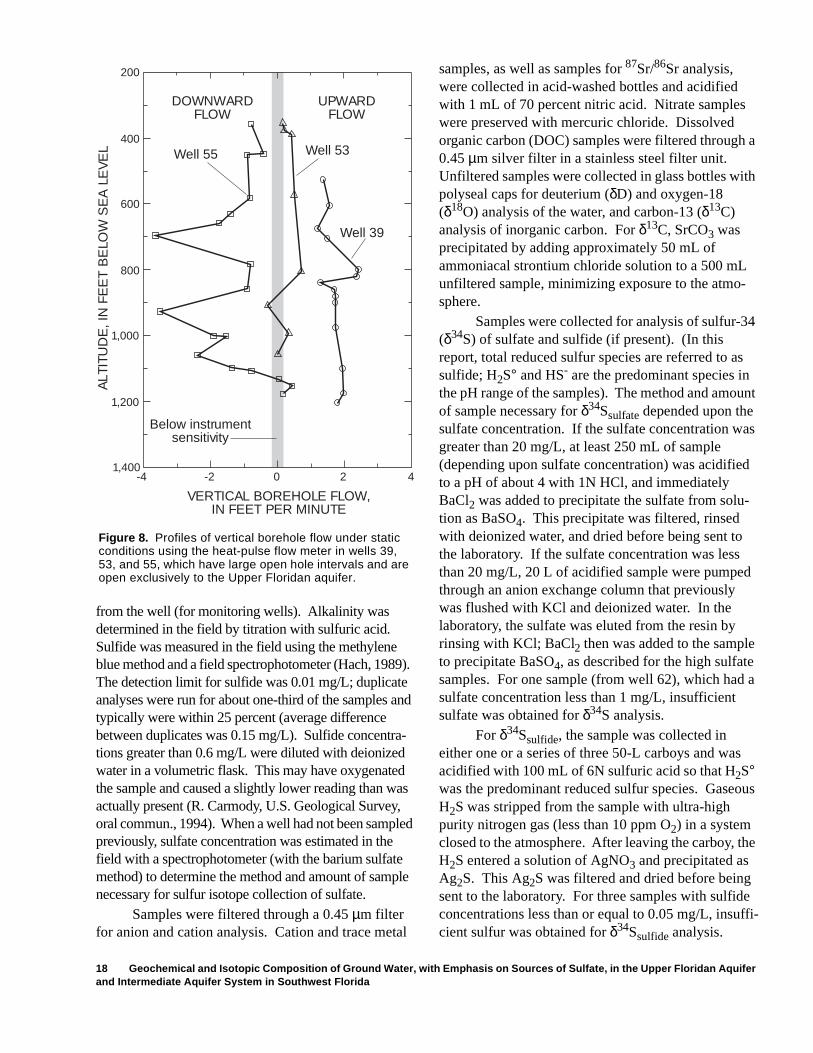
18 Geochemical and Isotopic Composition of Ground Water, with Emphasis on Sources of Sulfate, in the Upper Floridan Aquifer and Intermediate Aquifer System in Southwest Florida
from the well (for monitoring wells). Alkalinity was determined in the field by titration with sulfuric acid. Sulfide was measured in the field using the methylene blue method and a field spectrophotometer (Hach, 1989). The detection limit for sulfide was 0.01 mg/L; duplicate analyses were run for about one-third of the samples and typically were within 25 percent (average difference between duplicates was 0.15 mg/L). Sulfide concentra-tions greater than 0.6 mg/L were diluted with deionized water in a volumetric flask. This may have oxygenated the sample and caused a slightly lower reading than was actually present (R. Carmody, U.S. Geological Survey, oral commun., 1994). When a well had not been sampled previously, sulfate concentration was estimated in the field with a spectrophotometer (with the barium sulfate method) to determine the method and amount of sample necessary for sulfur isotope collection of sulfate.
Samples were filtered through a 0.45 µm filter for anion and cation analysis. Cation and trace metal
samples, as well as samples for 87Sr/86Sr analysis, were collected in acid-washed bottles and acidified with 1 mL of 70 percent nitric acid. Nitrate samples were preserved with mercuric chloride. Dissolved organic carbon (DOC) samples were filtered through a 0.45 µm silver filter in a stainless steel filter unit. Unfiltered samples were collected in glass bottles with polyseal caps for deuterium (δD) and oxygen-18 (δ18O) analysis of the water, and carbon-13 (δ13C) analysis of inorganic carbon. For δ13C, SrCO3 was precipitated by adding approximately 50 mL of ammoniacal strontium chloride solution to a 500 mL unfiltered sample, minimizing exposure to the atmo-sphere.
Samples were collected for analysis of sulfur-34 (δ34S) of sulfate and sulfide (if present). (In this report, total reduced sulfur species are referred to as sulfide; H2S° and HS- are the predominant species in the pH range of the samples). The method and amount of sample necessary for δ34Ssulfate depended upon the sulfate concentration. If the sulfate concentration was greater than 20 mg/L, at least 250 mL of sample (depending upon sulfate concentration) was acidified to a pH of about 4 with 1N HCl, and immediately BaCl2 was added to precipitate the sulfate from solu-tion as BaSO4. This precipitate was filtered, rinsed with deionized water, and dried before being sent to the laboratory. If the sulfate concentration was less than 20 mg/L, 20 L of acidified sample were pumped through an anion exchange column that previously was flushed with KCl and deionized water. In the laboratory, the sulfate was eluted from the resin by rinsing with KCl; BaCl2 then was added to the sample to precipitate BaSO4, as described for the high sulfate samples. For one sample (from well 62), which had a sulfate concentration less than 1 mg/L, insufficient sulfate was obtained for δ34S analysis.
For δ34Ssulfide, the sample was collected in either one or a series of three 50-L carboys and was acidified with 100 mL of 6N sulfuric acid so that H2S° was the predominant reduced sulfur species. Gaseous H2S was stripped from the sample with ultra-high purity nitrogen gas (less than 10 ppm O2) in a system closed to the atmosphere. After leaving the carboy, the H2S entered a solution of AgNO3 and precipitated as Ag2S. This Ag2S was filtered and dried before being sent to the laboratory. For three samples with sulfide concentrations less than or equal to 0.05 mg/L, insuffi-cient sulfur was obtained for δ34Ssulfide analysis.
-4 -2 0 2 4
200
400
600
800
1,000
1,200
1,400
ALT
ITU
DE
, IN
FE
ET
BE
LOW
SE
A L
EV
EL
Well 39
Well 55 Well 53
DOWNWARDFLOW
UPWARDFLOW
VERTICAL BOREHOLE FLOW, IN FEET PER MINUTE
Below instrumentsensitivity
Figure 8. Profiles of vertical borehole flow under static conditions using the heat-pulse flow meter in wells 39, 53, and 55, which have large open hole intervals and are open exclusively to the Upper Floridan aquifer.
Geochemical and Isotopic Composition of Ground Water 19
Quality Assurance Samples
For quality assurance purposes, duplicate sam-ples were collected from four wells (see appendix), and four deionized water equipment blanks were collected. For duplicate samples, there was generally less than 7 percent difference between major ion con-centrations and less than 30 percent difference between trace element concentrations (except for several analyses that had very low concentrations near the detection limit). For waters with high salinities, bromide had high analytical errors because of interfer-ences with chloride. Ionic charge balances for all analyses were within 5 percent. For the isotopes, pre-cision according to duplicate analyses was 0.15 per mil for δ18O, 1.5 per mil for δD, 0.3 per mil for δ13C, 0.3 per mil for δ34Ssulfate, and 0.4 per mil δ34Ssulfide (see appendix).
Deionized water equipment blanks were col-lected through field equipment in contact with sample water (peristaltic or submersible pump, filter unit, and tubing). The deionized water was also analyzed directly from its source in the laboratory. Most con-stituents were below detection limits for both types of samples. Constituents that were detected in the equip-ment blank were always near the detection limit, indicating that minimal contamination was introduced by the field equipment.
Chemical Composition of Ground Water
Sulfate concentrations varied widely over the study area. Water in the shallowest part of the Upper Floridan aquifer had sulfate concentrations ranging from 0.5 mg/L in the recharge area of Polk County to 1,800 mg/L near the coast in Sarasota County (see appendix; fig. 9a). Sulfate concentrations from the shallow part of the aquifer were above the drinking water standard of 250 mg/L in most of Sarasota and De Soto Counties, but concentrations were below the drinking water standard to the north in eastern Mana-tee, Hardee, and Polk Counties. Sulfate concentra-tions typically were higher in deeper parts of the aquifer, and ranged from 6.0 to 2,800 mg/L. Waters with highest sulfate concentrations (greater than 1,800 mg/L) were in coastal areas, where chloride concentrations were also high (greater than 1,000 mg/L), indicating mixing with saltwater. At each sampling location, sulfate concentrations were lower in the intermediate aquifer than in the Upper
Floridan aquifer. In the intermediate aquifer system, sulfate concentrations ranged from 6.3 mg/L in Polk County to 1,700 mg/L near the coast in Sarasota County. Sulfate concentrations were less than 250 mg/L in the intermediate aquifer system in most of the study area, except near the coast in Sarasota County and in isolated inland locations (fig. 9b).
All ground waters contained measurable sulfide except for one upgradient sample (well 64 in the Upper Floridan aquifer). This water also did not have measurable dissolved oxygen. Microbially mediated sulfate reduction is the probable source for sulfide (Rye and others, 1981). Sulfide concentrations in the Upper Floridan aquifer ranged from less than 0.01 mg/L to 2.5 mg/L (fig. 10a). The highest sulfide con-centrations were in the Peace River Basin and in coastal areas of Sarasota County (west of the Myakka River). Sulfide concentrations typically were lower in the most saline ground water. The range and distribu-tion of sulfide in the intermediate aquifer system (0.05 to 2.7 mg/L) were similar to those in the Upper Flori-dan aquifer (fig. 10b).
Along the three flow paths, sulfate and chloride concentrations generally increased in a downgradient direction and with depth (fig. 11). Sulfate concentrations in the Upper Floridan aquifer increased above the drink-ing water standard before chloride (which also has a 250 mg/L standard). For flow paths 1 and 2, sulfate attained higher concentrations (often greater than 1,000 mg/L) upgradient of the saltwater mixing zone than for flow path 3. (For this report, the saltwater mixing zone is defined as the region where chloride concentrations are greater than or equal to 250 mg/L, or about 1 percent modern seawater, and less than 19,000 mg/L, the concen-tration in seawater.) The saltwater mixing zone for flow paths 1 and 2 was relatively distinct, and chloride concen-trations increased rapidly with depth and proximity to the coast. In contrast, the zone of elevated chloride for the more southern flow path 3 was much larger. In the over-lying intermediate aquifer system, sulfate concentrations increased rapidly near the end of flow paths 1 and 2. In the lower permeable zone in these areas, sulfate concen-trations were similar to those in the Upper Floridan aqui-fer. In comparison, sulfate concentrations remained low in the intermediate aquifer system for flow path 3 until the saltwater mixing zone. Chloride concentrations in inland areas were generally higher in the intermediate aquifer system (between 25 and 100 mg/L) than in the Upper Floridan aquifer (less than 25 mg/L). Near the coast and further to the south, chloride concentrations typically were higher in the Upper Floridan aquifer and increased with depth in both aquifers.
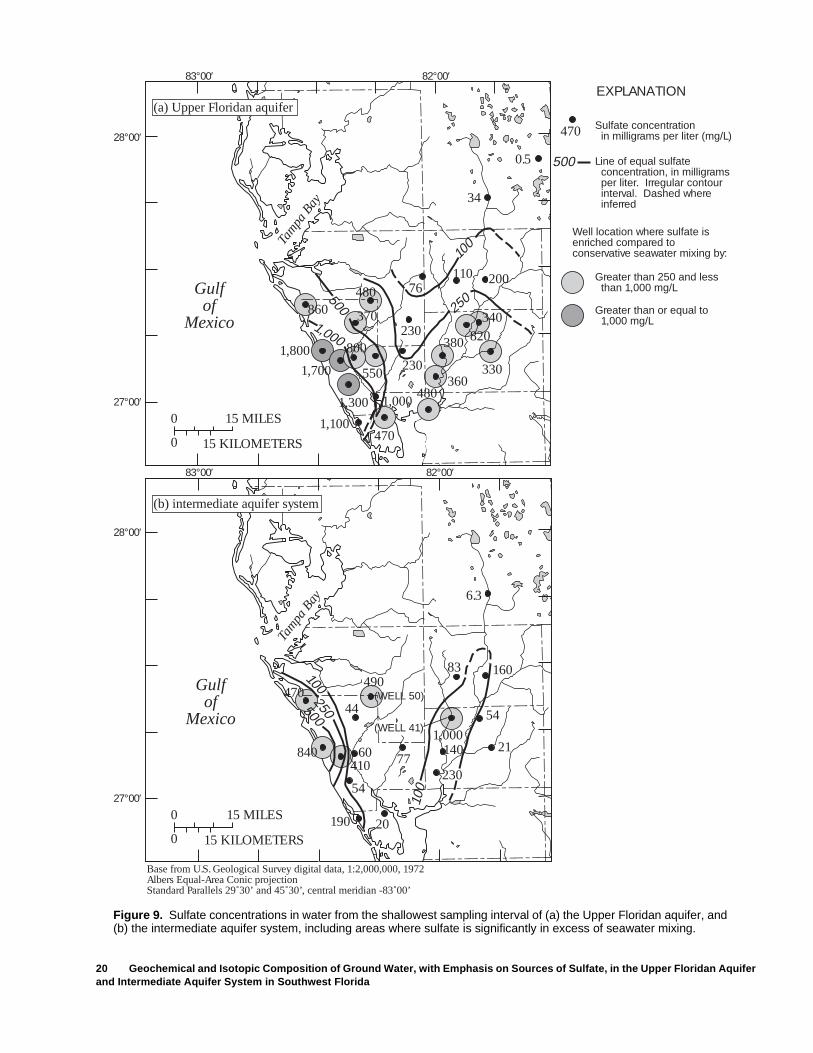
20 Geochemical and Isotopic Composition of Ground Water, with Emphasis on Sources of Sulfate, in the Upper Floridan Aquifer and Intermediate Aquifer System in Southwest Florida
Figure 9. Sulfate concentrations in water from the shallowest sampling interval of (a) the Upper Floridan aquifer, and (b) the intermediate aquifer system, including areas where sulfate is significantly in excess of seawater mixing.
Tam
pa B
ay
Tam
pa B
ay
Base from U.S. Geological Survey digital data, 1:2,000,000, 1972Albers Equal-Area Conic projectionStandard Parallels 29˚30’ and 45˚30’, central meridian -83˚00’
28°00′
27°00′0 15 MILES
15 KILOMETERS0
Gulfof
Mexico
20190
230
100
100
54
60 77140 21
5444
83 160
6.3
83°00′
83°00′
82°00′
82°00′
28°00′
27°00′0 15 MILES
15 KILOMETERS0
Gulfof
Mexico
EXPLANATION
Well location where sulfate is enriched compared to conservative seawater mixing by:
Greater than 250 and less than 1,000 mg/L
Greater than or equal to 1,000 mg/L
Line of equal sulfateconcentration, in milligrams per liter. Irregular contour interval. Dashed where inferred
Sulfate concentrationin milligrams per liter (mg/L)470
500
1,100
1,000
230
230
76110 200
34
0.5
250
100
1,000
480
370
500
550
800
860340
820
330
380
360480
470
1,300
1,700
1,800
840
470
410
500
250
(WELL 50)
(WELL 41)
490
1,000
(a) Upper Floridan aquifer
(b) intermediate aquifer system
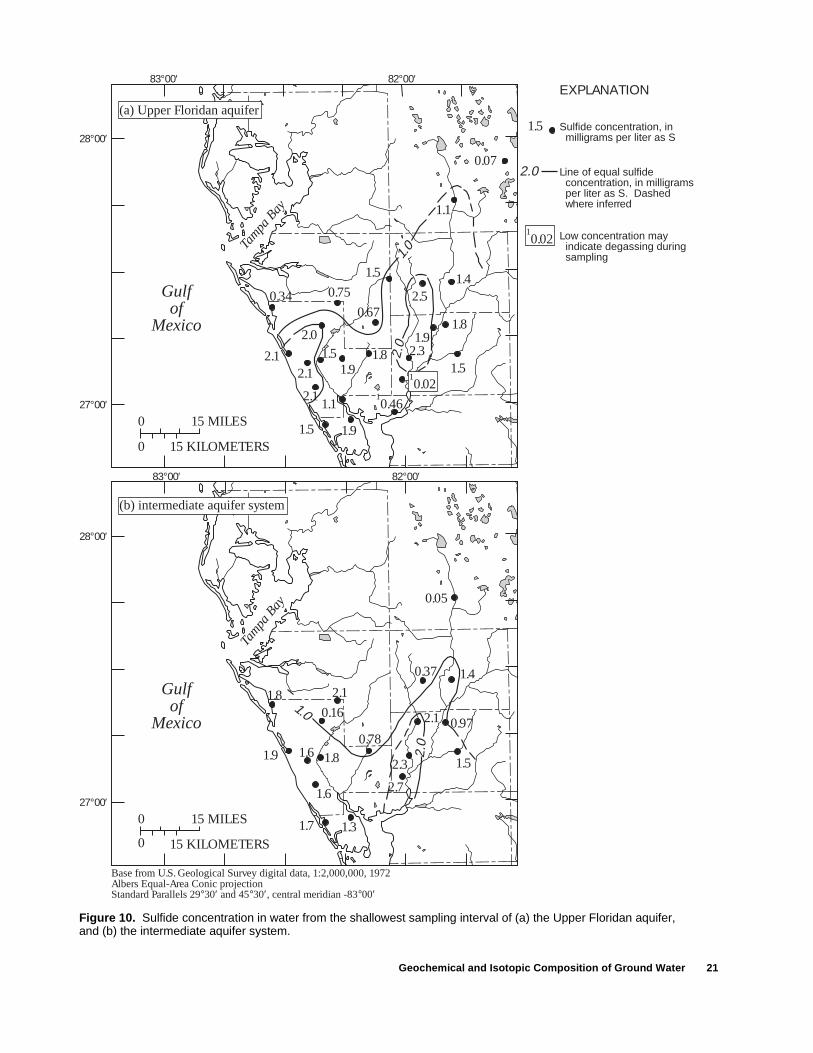
Geochemical and Isotopic Composition of Ground Water 21
Figure 10. Sulfide concentration in water from the shallowest sampling interval of (a) the Upper Floridan aquifer, and (b) the intermediate aquifer system.
Base from U.S. Geological Survey digital data, 1:2,000,000, 1972Albers Equal-Area Conic projectionStandard Parallels 29°30′ and 45°30′, central meridian -83°00′
EXPLANATION
Line of equal sulfideconcentration, in milligramsper liter as S. Dashed where inferred
Sulfide concentration, in milligrams per liter as S
Low concentration mayindicate degassing duringsampling
1.5
2.0
1.0
2.0
83°00′
83°00′
82°00′
82°00′
28°00′
27°00′0 15 MILES
15 KILOMETERS0
Gulfof
Mexico
Tam
pa B
ay
10.46
1.91.5
1.12.1
2.1
1.51.9
1.8 2.31.5
1.91.8
0.67
2.1
2.0
0.34 0.75
1.5
2.51.4
1.1
0.07
28°00′
27°00′0 15 MILES
15 KILOMETERS0
Gulfof
Mexico
Tam
pa B
ay
1.31.7
1.6
1.6 1.80.78
2.3 1.5
0.972.1
1.9
0.161.8 2.1
0.37 1.4
0.05
2.0
2.7
(a) Upper Floridan aquifer
(b) intermediate aquifer system
10.02
10.02
1.0
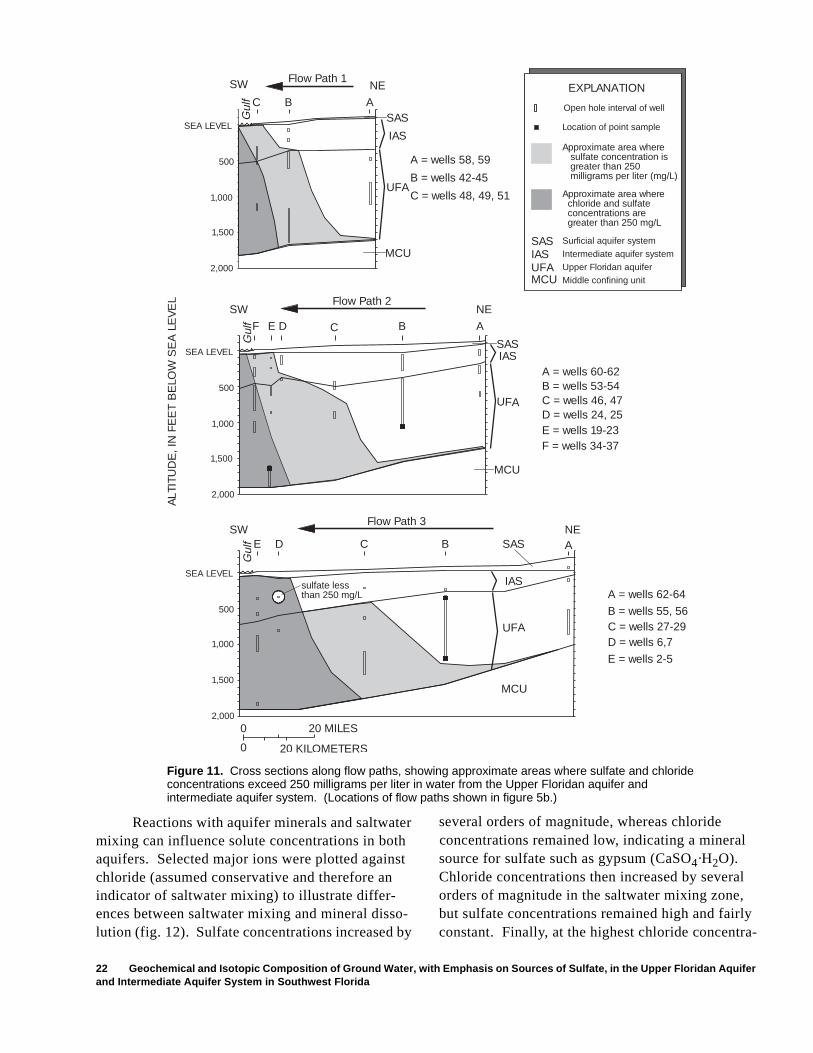
22 Geochemical and Isotopic Composition of Ground Water, with Emphasis on Sources of Sulfate, in the Upper Floridan Aquifer and Intermediate Aquifer System in Southwest Florida
Reactions with aquifer minerals and saltwater mixing can influence solute concentrations in both aquifers. Selected major ions were plotted against chloride (assumed conservative and therefore an indicator of saltwater mixing) to illustrate differ-ences between saltwater mixing and mineral disso-lution (fig. 12). Sulfate concentrations increased by
Figure 11. Cross sections along flow paths, showing approximate areas where sulfate and chloride concentrations exceed 250 milligrams per liter in water from the Upper Floridan aquifer and intermediate aquifer system. (Locations of flow paths shown in figure 5b.)
Gul
fG
ulf
Flow Path 1SW NE
ABC
Gul
fMCU
UFA
IAS
SAS
SAS
SAS
A = wells 58, 59
B = wells 42-45
C = wells 48, 49, 51
SEA LEVEL
500
1,000
1,500
2,000
SEA LEVEL
500
1,000
1,500
2,000
SWFlow Path 2
NE
F E D C B A
MCU
UFA
IASA = wells 60-62B = wells 53-54C = wells 46, 47D = wells 24, 25E = wells 19-23F = wells 34-37
SEA LEVEL
500
1,000
1,500
2,000
SWFlow Path 3
E D C B ANE
MCU
UFA
IAS
20 MILES
0
0
20 KILOMETERS
ALT
ITU
DE
, IN
FE
ET
BE
LOW
SE
A L
EV
EL
A = wells 62-64
B = wells 55, 56C = wells 27-29D = wells 6,7
E = wells 2-5
EXPLANATION
Open hole interval of well
Location of point sample
Approximate area wheresulfate concentration is greater than 250milligrams per liter (mg/L)
Approximate area wherechloride and sulfate concentrations aregreater than 250 mg/L
IAS Intermediate aquifer system
Surficial aquifer system
UFA Upper Floridan aquifer
MCU Middle confining unit
sulfate lessthan 250 mg/L
SAS
several orders of magnitude, whereas chloride concentrations remained low, indicating a mineral source for sulfate such as gypsum (CaSO4·H2O). Chloride concentrations then increased by several orders of magnitude in the saltwater mixing zone, but sulfate concentrations remained high and fairly constant. Finally, at the highest chloride concentra-
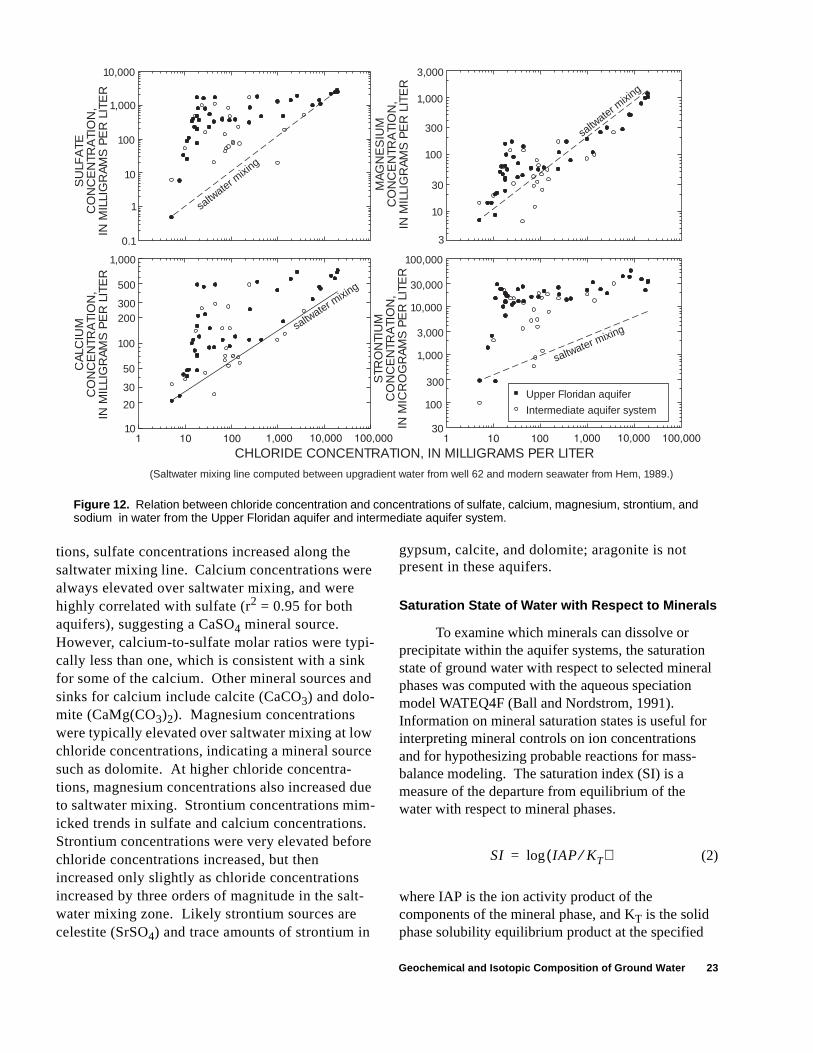
Geochemical and Isotopic Composition of Ground Water 23
tions, sulfate concentrations increased along the saltwater mixing line. Calcium concentrations were always elevated over saltwater mixing, and were highly correlated with sulfate (r2 = 0.95 for both aquifers), suggesting a CaSO4 mineral source. However, calcium-to-sulfate molar ratios were typi-cally less than one, which is consistent with a sink for some of the calcium. Other mineral sources and sinks for calcium include calcite (CaCO3) and dolo-mite (CaMg(CO3)2). Magnesium concentrations were typically elevated over saltwater mixing at low chloride concentrations, indicating a mineral source such as dolomite. At higher chloride concentra-tions, magnesium concentrations also increased due to saltwater mixing. Strontium concentrations mim-icked trends in sulfate and calcium concentrations. Strontium concentrations were very elevated before chloride concentrations increased, but then increased only slightly as chloride concentrations increased by three orders of magnitude in the salt-water mixing zone. Likely strontium sources are celestite (SrSO4) and trace amounts of strontium in
SU
LFA
TE
CO
NC
EN
TRA
TIO
N,
IN M
ILLI
GR
AM
S P
ER
LIT
ER
CA
LCIU
M
CO
NC
EN
TRA
TIO
N,
IN M
ILLI
GR
AM
S P
ER
LIT
ER
STR
ON
TIU
M
CO
NC
EN
TRA
TIO
N,
IN M
ICR
OG
RA
MS
PE
R L
ITE
R
MA
GN
ES
IUM
C
ON
CE
NTR
ATI
ON
,IN
MIL
LIG
RA
MS
PE
R L
ITE
R
CHLORIDE CONCENTRATION, IN MILLIGRAMS PER LITER
10,000
1,000
100
10
1
0.1
1,000
500
300200
100
50
30
20
10
3,000
1,000
300
100
30
10
3
100,000
30,000
10,000
3,000
1,000
300
100
30
saltw
ater mixi
ng
saltwater m
ixing
saltw
ater mixi
ng
saltwater mixing
Upper Floridan aquifer
Intermediate aquifer system
(Saltwater mixing line computed between upgradient water from well 62 and modern seawater from Hem, 1989.)
Figure 12. Relation between chloride concentration and concentrations of sulfate, calcium, magnesium, strontium, and sodium in water from the Upper Floridan aquifer and intermediate aquifer system.
gypsum, calcite, and dolomite; aragonite is not present in these aquifers.
Saturation State of Water with Respect to Minerals
To examine which minerals can dissolve or precipitate within the aquifer systems, the saturation state of ground water with respect to selected mineral phases was computed with the aqueous speciation model WATEQ4F (Ball and Nordstrom, 1991). Information on mineral saturation states is useful for interpreting mineral controls on ion concentrations and for hypothesizing probable reactions for mass-balance modeling. The saturation index (SI) is a measure of the departure from equilibrium of the water with respect to mineral phases.
(2)
where IAP is the ion activity product of the components of the mineral phase, and KT is the solid phase solubility equilibrium product at the specified
SI IAP KT⁄( )log=

24 Geochemical and Isotopic Composition of Ground Water, with Emphasis on Sources of Sulfate, in the Upper Floridan Aquifer and Intermediate Aquifer System in Southwest Florida
temperature. An SI value of zero, with an associated range of uncertainty, indicates the water is in equilibrium or saturated with respect to the mineral phase, a value less than zero indicates undersaturation (mineral dissolution is possible), and a value greater than zero indicates supersaturation (mineral precipitation is possible). Distribution of species that are sensitive to the oxidation state of the water were computed using the Eh value determined from sulfate and sulfide concentrations.
Calculation of equilibrium for carbonate miner-als is dependent upon the accuracy of the chemical analysis and pH measurement. For calcite, equilib-rium is assumed for SI values between -0.15 and 0.15; for dolomite, equilibrium is assumed for SI values between -0.3 and 0.3. Most of the waters were satu-rated to supersaturated with respect to calcite (see appendix). For dolomite, the exact value for the equi-librium reaction constant (Kr) is uncertain (Hsu, 1963). Thus, SI values are reported for both “disor-dered” dolomite (log Kr of -16.54) and “crystalline” dolomite (log Kr of -17.09; Nordstrom and others, 1990). Most of the ground waters were undersaturated to saturated with respect to “disordered” dolomite and saturated to supersaturated with respect to “crystal-line” dolomite (see appendix). Ground-water geochemistry and geochemical modeling studies have concluded that the Kr for dolomite in the Floridan aquifer system is probably more similar to disordered dolomite than to crystalline dolomite (log Kr between -16.6 and -16.7; Hsu, 1963; Hanshaw and others 1971; Plummer, 1977). This greater Kr value is supported by data from this study because magnesium concentra-tions increase along flow paths in the Upper Floridan aquifer upgradient of the saltwater mixing zone, sup-porting dolomite dissolution and undersaturation. No information is available on specific Kr values for the intermediate aquifer system.
All of the waters in the Upper Floridan aquifer and intermediate aquifer system were undersaturated with respect to gypsum (equilibrium is assumed for SI values between -0.03 and +0.03) (fig. 13). Waters with high sulfate concentrations (greater than 1,500 mg/L) and low chloride concentrations (less than 100 mg/L) from western Sarasota County were closest to equilibrium with gypsum (SI value of about -0.1). Waters with high sulfate and chloride concen-trations from the southern part of the study area were more undersaturated (SI value of about -0.5; fig. 13) because of their higher salinity and ionic strength.
Gypsum is more soluble in waters with ionic strengths similar to seawater, compared to fresher waters, because activity coefficients are lower (the ionic strength effect; Pankow, 1991). Thus, even though the saline waters had higher sulfate concentrations, the waters were more undersaturated with respect to gyp-sum than inland high sulfate waters.
Most ground waters with sulfate concentrations greater than 250 mg/L were near equilibrium with respect to celestite (SrSO4) (fig. 13). At higher sulfate and strontium concentrations, waters remained near saturation with respect to celestite because of higher ionic strengths. Saline waters also were near equilib-rium with celestite. The constancy of the celestite sat-uration index indicates that mineral equilibrium may control the concentration of strontium. McCartan and others (1992b) concluded that celestite dissolution and precipitation control strontium concentrations in Hardee and De Soto Counties, and that waters influ-enced by gypsum dissolution were saturated with respect to celestite.
GY
PS
UM
S
ATU
RA
TIO
N IN
DE
XC
ELE
STI
TE
SA
TUR
ATI
ON
IND
EX
0
-1
-2
-3
-4
-51
0
-1
-2
-3
-4
-50 500 1,000 1,500 2,000 2,500 3,000
equilibrium
saline waters(chloride concentration greater than
5,000 milligrams per liter)
equilibrium
Upper Floridan aquifer
Intermediate aquifer system
SULFATE CONCENTRATION,IN MILLIGRAMS PER LITER
Figure 13. Relation between gypsum and celestite saturation index and sulfate concentration in water from the Upper Floridan aquifer and intermediate aquifer system.
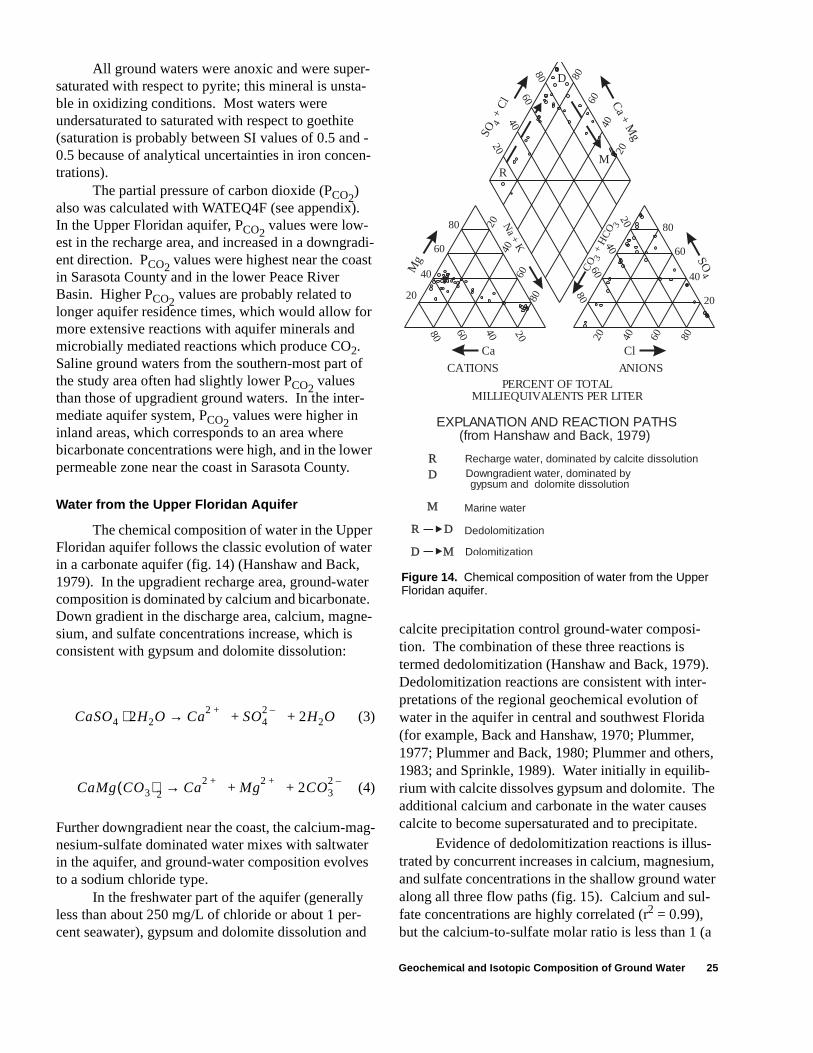
Geochemical and Isotopic Composition of Ground Water 25
All ground waters were anoxic and were super-saturated with respect to pyrite; this mineral is unsta-ble in oxidizing conditions. Most waters were undersaturated to saturated with respect to goethite (saturation is probably between SI values of 0.5 and -0.5 because of analytical uncertainties in iron concen-trations).
The partial pressure of carbon dioxide (PCO2)
also was calculated with WATEQ4F (see appendix). In the Upper Floridan aquifer, PCO2
values were low-est in the recharge area, and increased in a downgradi-ent direction. PCO2
values were highest near the coast in Sarasota County and in the lower Peace River Basin. Higher PCO2
values are probably related to longer aquifer residence times, which would allow for more extensive reactions with aquifer minerals and microbially mediated reactions which produce CO2. Saline ground waters from the southern-most part of the study area often had slightly lower PCO2
values than those of upgradient ground waters. In the inter-mediate aquifer system, PCO2
values were higher in inland areas, which corresponds to an area where bicarbonate concentrations were high, and in the lower permeable zone near the coast in Sarasota County.
Water from the Upper Floridan Aquifer
The chemical composition of water in the Upper Floridan aquifer follows the classic evolution of water in a carbonate aquifer (fig. 14) (Hanshaw and Back, 1979). In the upgradient recharge area, ground-water composition is dominated by calcium and bicarbonate. Down gradient in the discharge area, calcium, magne-sium, and sulfate concentrations increase, which is consistent with gypsum and dolomite dissolution:
(3)
(4)
Further downgradient near the coast, the calcium-mag-nesium-sulfate dominated water mixes with saltwater in the aquifer, and ground-water composition evolves to a sodium chloride type.
In the freshwater part of the aquifer (generally less than about 250 mg/L of chloride or about 1 per-cent seawater), gypsum and dolomite dissolution and
calcite precipitation control ground-water composi-tion. The combination of these three reactions is termed dedolomitization (Hanshaw and Back, 1979). Dedolomitization reactions are consistent with inter-pretations of the regional geochemical evolution of water in the aquifer in central and southwest Florida (for example, Back and Hanshaw, 1970; Plummer, 1977; Plummer and Back, 1980; Plummer and others, 1983; and Sprinkle, 1989). Water initially in equilib-rium with calcite dissolves gypsum and dolomite. The additional calcium and carbonate in the water causes calcite to become supersaturated and to precipitate.
Evidence of dedolomitization reactions is illus-trated by concurrent increases in calcium, magnesium, and sulfate concentrations in the shallow ground water along all three flow paths (fig. 15). Calcium and sul-fate concentrations are highly correlated (r2 = 0.99), but the calcium-to-sulfate molar ratio is less than 1 (a
CaSO4 2H2O⋅ Ca2 + SO42 – 2H2O+ +→
CaMg CO3( )2 Ca2 +
Mg2 +
2CO32 –
+ +→
CATIONS ANIONSPERCENT OF TOTAL
MILLIEQUIVALENTS PER LITER
80
60
40
2020
40
60
80 20
80
40
60
60
40
80
20
SO 4
+ C
l
Mg
CO 3
+ H
CO 3
20
80
40
Na + K
Ca + M
g
SO
4
60
60
40
80
20
20 40 60 80
20
406080
Ca Cl
R
D
M
D M
M
R
R
D
D
Marine water
Downgradient water, dominated by gypsum and dolomite dissolution
Recharge water, dominated by calcite dissolution
EXPLANATION AND REACTION PATHS(from Hanshaw and Back, 1979)
Dedolomitization
Dolomitization
Figure 14. Chemical composition of water from the Upper Floridan aquifer.
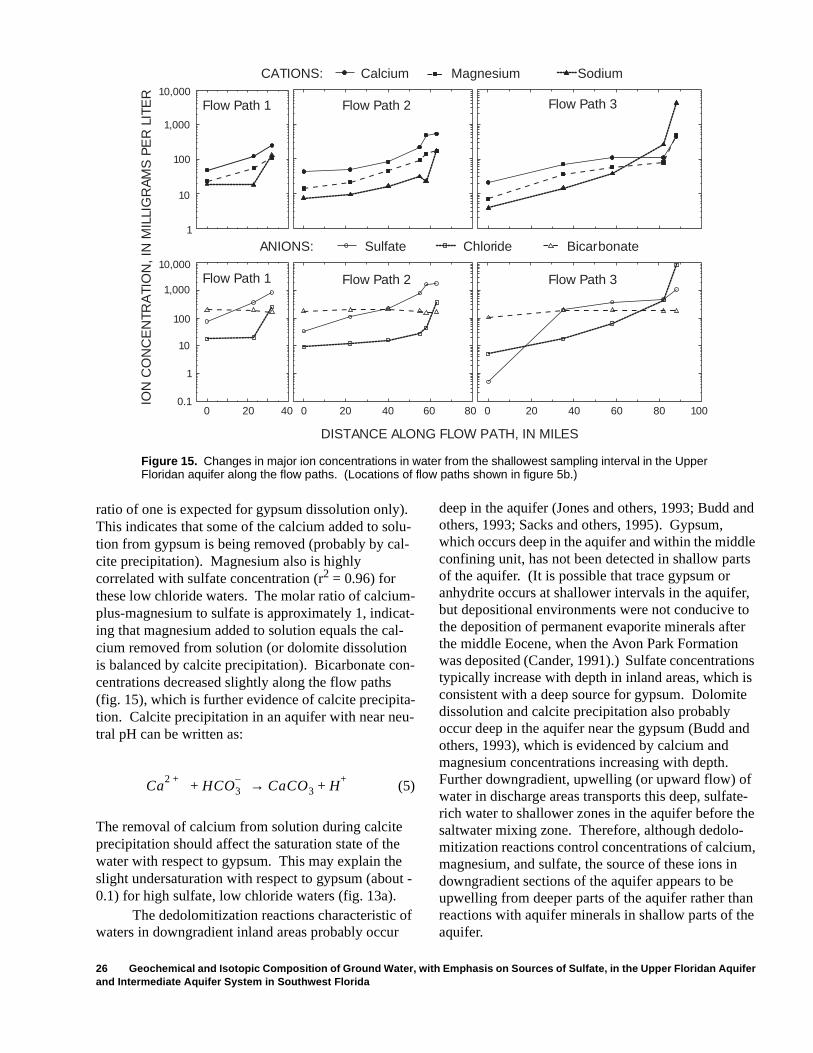
26 Geochemical and Isotopic Composition of Ground Water, with Emphasis on Sources of Sulfate, in the Upper Floridan Aquifer and Intermediate Aquifer System in Southwest Florida
ratio of one is expected for gypsum dissolution only). This indicates that some of the calcium added to solu-tion from gypsum is being removed (probably by cal-cite precipitation). Magnesium also is highly correlated with sulfate concentration (r2 = 0.96) for these low chloride waters. The molar ratio of calcium-plus-magnesium to sulfate is approximately 1, indicat-ing that magnesium added to solution equals the cal-cium removed from solution (or dolomite dissolution is balanced by calcite precipitation). Bicarbonate con-centrations decreased slightly along the flow paths (fig. 15), which is further evidence of calcite precipita-tion. Calcite precipitation in an aquifer with near neu-tral pH can be written as:
(5)
The removal of calcium from solution during calcite precipitation should affect the saturation state of the water with respect to gypsum. This may explain the slight undersaturation with respect to gypsum (about -0.1) for high sulfate, low chloride waters (fig. 13a).
The dedolomitization reactions characteristic of waters in downgradient inland areas probably occur
Figure 15. Changes in major ion concentrations in water from the shallowest sampling interval in the Upper Floridan aquifer along the flow paths. (Locations of flow paths shown in figure 5b.)
ION
CO
NC
EN
TRA
TIO
N, I
N M
ILLI
GR
AM
S P
ER
LIT
ER
Flow Path 1
Flow Path 1
Flow Path 2
Flow Path 2
Flow Path 3
Flow Path 3
CATIONS:
ANIONS:
DISTANCE ALONG FLOW PATH, IN MILES
10,000
1,000
100
10
1
10,000
1,000
100
10
1
0.10 20 40 0 20 40 60 80 0 20 40 60 80 100
MagnesiumCalcium
Sulfate Chloride
Sodium
Bicarbonate
Ca2 +
HCO3–
CaCO3 H+
+→+
deep in the aquifer (Jones and others, 1993; Budd and others, 1993; Sacks and others, 1995). Gypsum, which occurs deep in the aquifer and within the middle confining unit, has not been detected in shallow parts of the aquifer. (It is possible that trace gypsum or anhydrite occurs at shallower intervals in the aquifer, but depositional environments were not conducive to the deposition of permanent evaporite minerals after the middle Eocene, when the Avon Park Formation was deposited (Cander, 1991).) Sulfate concentrations typically increase with depth in inland areas, which is consistent with a deep source for gypsum. Dolomite dissolution and calcite precipitation also probably occur deep in the aquifer near the gypsum (Budd and others, 1993), which is evidenced by calcium and magnesium concentrations increasing with depth. Further downgradient, upwelling (or upward flow) of water in discharge areas transports this deep, sulfate-rich water to shallower zones in the aquifer before the saltwater mixing zone. Therefore, although dedolo-mitization reactions control concentrations of calcium, magnesium, and sulfate, the source of these ions in downgradient sections of the aquifer appears to be upwelling from deeper parts of the aquifer rather than reactions with aquifer minerals in shallow parts of the aquifer.
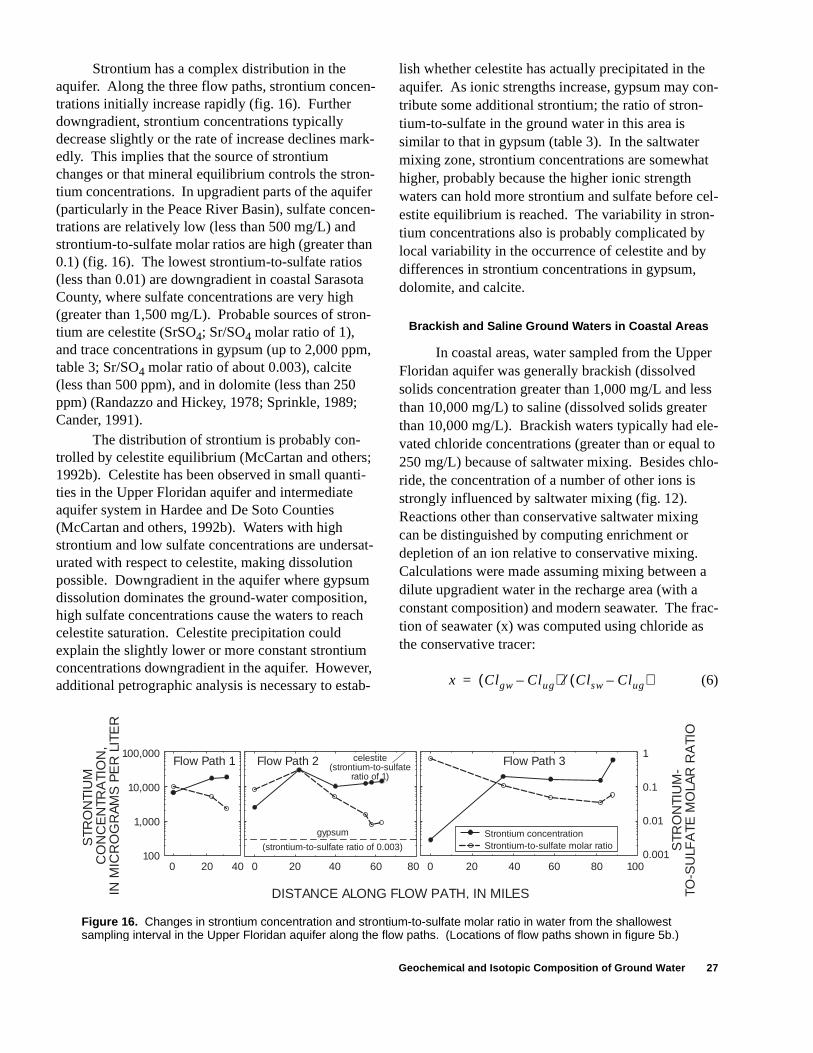
Geochemical and Isotopic Composition of Ground Water 27
Strontium has a complex distribution in the aquifer. Along the three flow paths, strontium concen-trations initially increase rapidly (fig. 16). Further downgradient, strontium concentrations typically decrease slightly or the rate of increase declines mark-edly. This implies that the source of strontium changes or that mineral equilibrium controls the stron-tium concentrations. In upgradient parts of the aquifer (particularly in the Peace River Basin), sulfate concen-trations are relatively low (less than 500 mg/L) and strontium-to-sulfate molar ratios are high (greater than 0.1) (fig. 16). The lowest strontium-to-sulfate ratios (less than 0.01) are downgradient in coastal Sarasota County, where sulfate concentrations are very high (greater than 1,500 mg/L). Probable sources of stron-tium are celestite (SrSO4; Sr/SO4 molar ratio of 1), and trace concentrations in gypsum (up to 2,000 ppm, table 3; Sr/SO4 molar ratio of about 0.003), calcite (less than 500 ppm), and in dolomite (less than 250 ppm) (Randazzo and Hickey, 1978; Sprinkle, 1989; Cander, 1991).
The distribution of strontium is probably con-trolled by celestite equilibrium (McCartan and others; 1992b). Celestite has been observed in small quanti-ties in the Upper Floridan aquifer and intermediate aquifer system in Hardee and De Soto Counties (McCartan and others, 1992b). Waters with high strontium and low sulfate concentrations are undersat-urated with respect to celestite, making dissolution possible. Downgradient in the aquifer where gypsum dissolution dominates the ground-water composition, high sulfate concentrations cause the waters to reach celestite saturation. Celestite precipitation could explain the slightly lower or more constant strontium concentrations downgradient in the aquifer. However, additional petrographic analysis is necessary to estab-
STR
ON
TIU
MC
ON
CE
NTR
ATI
ON
,IN
MIC
RO
GR
AM
S P
ER
LIT
ER
STR
ON
TIU
M-
TO-S
ULF
ATE
MO
LAR
RA
TIO
DISTANCE ALONG FLOW PATH, IN MILES
Flow Path 1
0 20 40
Flow Path 2 celestite(strontium-to-sulfate
ratio of 1)
gypsum
(strontium-to-sulfate ratio of 0.003)
0 20 40 60 80 0 20 40 60 80 100
Flow Path 3
Strontium concentrationStrontium-to-sulfate molar ratio
1
0.1
0.01
0.001
100,000
10,000
1,000
100
Figure 16. Changes in strontium concentration and strontium-to-sulfate molar ratio in water from the shallowest sampling interval in the Upper Floridan aquifer along the flow paths. (Locations of flow paths shown in figure 5b.)
lish whether celestite has actually precipitated in the aquifer. As ionic strengths increase, gypsum may con-tribute some additional strontium; the ratio of stron-tium-to-sulfate in the ground water in this area is similar to that in gypsum (table 3). In the saltwater mixing zone, strontium concentrations are somewhat higher, probably because the higher ionic strength waters can hold more strontium and sulfate before cel-estite equilibrium is reached. The variability in stron-tium concentrations also is probably complicated by local variability in the occurrence of celestite and by differences in strontium concentrations in gypsum, dolomite, and calcite.
Brackish and Saline Ground Waters in Coastal Areas
In coastal areas, water sampled from the Upper Floridan aquifer was generally brackish (dissolved solids concentration greater than 1,000 mg/L and less than 10,000 mg/L) to saline (dissolved solids greater than 10,000 mg/L). Brackish waters typically had ele-vated chloride concentrations (greater than or equal to 250 mg/L) because of saltwater mixing. Besides chlo-ride, the concentration of a number of other ions is strongly influenced by saltwater mixing (fig. 12). Reactions other than conservative saltwater mixing can be distinguished by computing enrichment or depletion of an ion relative to conservative mixing. Calculations were made assuming mixing between a dilute upgradient water in the recharge area (with a constant composition) and modern seawater. The frac-tion of seawater (x) was computed using chloride as the conservative tracer:
(6)x Clgw Clug–( ) Clsw Clug–( )⁄=
28 Geochemical and Isotopic Composition of Ground Water, with Emphasis on Sources of Sulfate, in the Upper Floridan Aquifer and Intermediate Aquifer System in Southwest Florida
where Cl is the chloride concentration of the ground-water sample (gw), upgradient ground water (ug), and seawater (sw). Water from well 62 was used as the freshwater end member. An expected ion concentra-tion was computed based on conservative mixing of the two end-member waters. In order to give insight into processes that deplete or enrich ions in the saltwa-ter mixing zone and saline part of the aquifer, observed ion concentrations (iobs) were then compared to the expected ion concentration, given conservative mixing and the ion concentrations in modern seawater (isw) (Hem, 1989) and the upgradient ground water (iug):
(7)
where ie is ion enrichment if positive and ion depletion if negative.
Sulfate is enriched in the Upper Floridan aquifer compared to conservative saltwater mixing in most of the study area (fig. 9a). The amount of sulfate enrich-ment increases with depth in the aquifer and toward the coast, which is consistent with gypsum dissolution at depth and coastal upwelling from these deeper parts of the aquifer. Sulfate is significantly enriched in coastal Sarasota County and in the lower Peace River Basin. Sulfate is less enriched in the most saline ground waters, particularly in the southwestern part of the study area. Seawater (of an unknown age) is the primary source of sulfate for these saline waters, which dissolved minimal amounts of gypsum. This is consistent with a shallow marine source because saline water from deep gypsum-bearing zones in the middle confining unit or the Lower Floridan aquifer should contribute additional sulfate to the water. Saline waters from the Upper Floridan aquifer had significantly lower sulfate concentrations (about 2,600 mg/L) than that expected for saline water in equilibrium with gyp-sum (about 4,300 mg/L).
Calcium is enriched in waters from the saltwater mixing zone, compared to conservative saltwater mix-ing. At lower chloride concentrations (less than 5,000 mg/L or about 25 percent modern seawater), calcium enrichment is related to sulfate enrichment (fig. 17a), indicating a gypsum source. However, at higher chlo-ride concentrations, calcium enrichment is not related to sulfate enrichment (fig. 17a), which points to another source of calcium other than gypsum. To evaluate other sources and sinks of calcium in the aquifer, the calcium assumed to come from gypsum dissolution (which is equivalent to the amount of sul-
fate enrichment in millimoles per liter (mmol/L)) was subtracted from the total calcium enrichment. These saline waters also are depleted in magnesium and sodium. Cation exchange is a process that can result in the addition of calcium and depletion of sodium. Seawater has significantly higher sodium than calcium concentrations (10,500 mg/L and 410 mg/L, respec-tively). As sodium-rich seawater moves through the aquifer, it mixes with fresh, calcium-rich ground water. Because of the concentration difference, two sodium ions can replace one calcium ion on exchange sites (X) in the aquifer:
(8)
The depletion of sodium and enrichment of calcium (after subtracting gypsum dissolution) follow trends similar to those expected for cation exchange (fig. 17b). Clay minerals that occur in minor amounts in the Floridan aquifer system are probable exchange sites; abundant exchange sites also are present in the overlying clays of the Hawthorn Group.
Magnesium usually is enriched compared to conservative saltwater mixing for lower chloride waters, and depleted relative to saltwater mixing for higher chloride waters (greater than about 25 percent modern seawater). Lower chloride waters also are enriched in sulfate and calcium, which is consistent with dedolomitization reactions (gypsum and dolomite dissolution and calcite precipitation; equations 3, 4, and 5). After subtracting the influence of gypsum dis-solution for these waters, calcium is depleted and mag-nesium is enriched, as expected for dolomite dissolution and calcite precipitation (fig. 17c). For higher chloride waters, the trend in reversed: magne-sium is depleted and calcium is enriched. Cal-cium/magnesium exchange is a probable reaction because magnesium concentrations are elevated over calcium concentrations in seawater but not in freshwa-ter parts of the aquifer. Alternatively, magnesium could be lost from saline waters through dolomitiza-tion of calcite. In this reaction, calcium is added to solution in the same amount that magnesium is removed:
(9)
Calcium enrichment (after subtracting gypsum disso-lution) and magnesium depletion generally follow this expected 1:1 molar relation (fig. 17c). These waters
ie iobs iswx( ) iug 1 x–( )( )+[ ]–= CaX 2Na+
Ca2+
Na2X+→+
Mg2+
2CaCO3 CaMg CO3( )2 Ca2 +
+→+
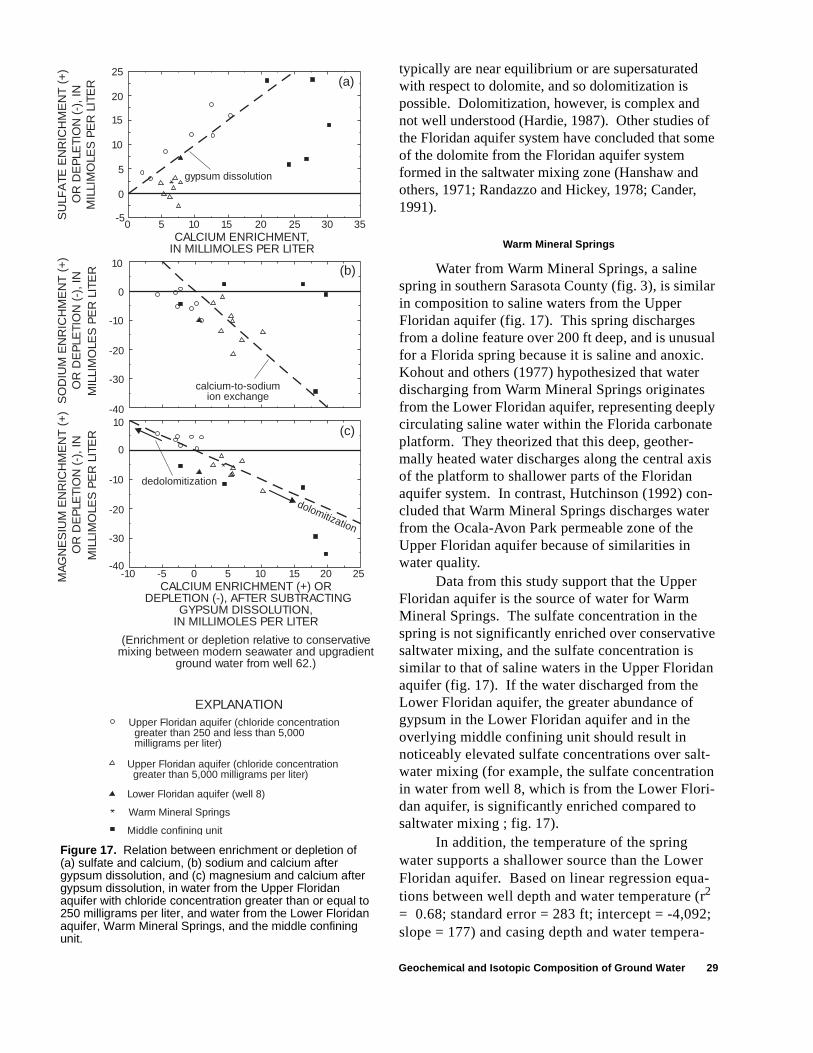
Geochemical and Isotopic Composition of Ground Water 29
typically are near equilibrium or are supersaturated with respect to dolomite, and so dolomitization is possible. Dolomitization, however, is complex and not well understood (Hardie, 1987). Other studies of the Floridan aquifer system have concluded that some of the dolomite from the Floridan aquifer system formed in the saltwater mixing zone (Hanshaw and others, 1971; Randazzo and Hickey, 1978; Cander, 1991).
Warm Mineral Springs
Water from Warm Mineral Springs, a saline spring in southern Sarasota County (fig. 3), is similar in composition to saline waters from the Upper Floridan aquifer (fig. 17). This spring discharges from a doline feature over 200 ft deep, and is unusual for a Florida spring because it is saline and anoxic. Kohout and others (1977) hypothesized that water discharging from Warm Mineral Springs originates from the Lower Floridan aquifer, representing deeply circulating saline water within the Florida carbonate platform. They theorized that this deep, geother-mally heated water discharges along the central axis of the platform to shallower parts of the Floridan aquifer system. In contrast, Hutchinson (1992) con-cluded that Warm Mineral Springs discharges water from the Ocala-Avon Park permeable zone of the Upper Floridan aquifer because of similarities in water quality.
Data from this study support that the Upper Floridan aquifer is the source of water for Warm Mineral Springs. The sulfate concentration in the spring is not significantly enriched over conservative saltwater mixing, and the sulfate concentration is similar to that of saline waters in the Upper Floridan aquifer (fig. 17). If the water discharged from the Lower Floridan aquifer, the greater abundance of gypsum in the Lower Floridan aquifer and in the overlying middle confining unit should result in noticeably elevated sulfate concentrations over salt-water mixing (for example, the sulfate concentration in water from well 8, which is from the Lower Flori-dan aquifer, is significantly enriched compared to saltwater mixing ; fig. 17).
In addition, the temperature of the spring water supports a shallower source than the Lower Floridan aquifer. Based on linear regression equa-tions between well depth and water temperature (r2 = 0.68; standard error = 283 ft; intercept = -4,092; slope = 177) and casing depth and water tempera-
25
20
15
10
5
0
-50 5 10 15 20 25 30 35
SU
LFA
TE E
NR
ICH
ME
NT
(+
)O
R D
EP
LETI
ON
(-)
, IN
MIL
LIM
OLE
S P
ER
LIT
ER
SO
DIU
M E
NR
ICH
ME
NT
(+
)O
R D
EP
LETI
ON
(-)
, IN
MIL
LIM
OLE
S P
ER
LIT
ER
MA
GN
ES
IUM
EN
RIC
HM
EN
T (
+)
OR
DE
PLE
TIO
N (
-), I
NM
ILLI
MO
LES
PE
R L
ITE
R
(b)
(c)
CALCIUM ENRICHMENT, IN MILLIMOLES PER LITER
(a)
gypsum dissolution
10
0
-10
-20
-30
-40
-10 -5 0 5 10 15 20 25
calcium-to-sodiumion exchange
10
0
-10
-20
-30
-40
dolomitization
dedolomitization
CALCIUM ENRICHMENT (+) OR DEPLETION (-), AFTER SUBTRACTING
GYPSUM DISSOLUTION,IN MILLIMOLES PER LITER
(Enrichment or depletion relative to conservativemixing between modern seawater and upgradient
ground water from well 62.)
EXPLANATIONUpper Floridan aquifer (chloride concentration
greater than 250 and less than 5,000milligrams per liter)
Upper Floridan aquifer (chloride concentration greater than 5,000 milligrams per liter)
Lower Floridan aquifer (well 8)
Warm Mineral Springs
Middle confining unit
Figure 17. Relation between enrichment or depletion of (a) sulfate and calcium, (b) sodium and calcium after gypsum dissolution, and (c) magnesium and calcium after gypsum dissolution, in water from the Upper Floridan aquifer with chloride concentration greater than or equal to 250 milligrams per liter, and water from the Lower Floridan aquifer, Warm Mineral Springs, and the middle confining unit.
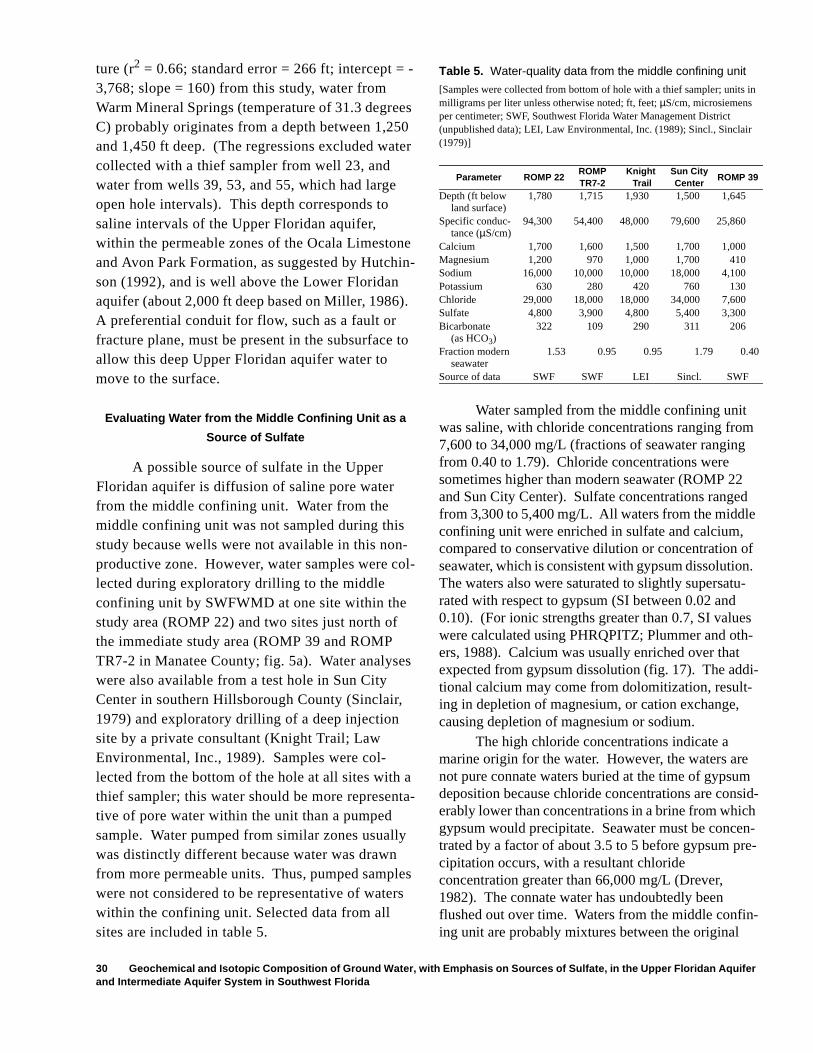
30 Geochemical and Isotopic Composition of Ground Water, with Emphasis on Sources of Sulfate, in the Upper Floridan Aquifer and Intermediate Aquifer System in Southwest Florida
ture (r2 = 0.66; standard error = 266 ft; intercept = -3,768; slope = 160) from this study, water from Warm Mineral Springs (temperature of 31.3 degrees C) probably originates from a depth between 1,250 and 1,450 ft deep. (The regressions excluded water collected with a thief sampler from well 23, and water from wells 39, 53, and 55, which had large open hole intervals). This depth corresponds to saline intervals of the Upper Floridan aquifer, within the permeable zones of the Ocala Limestone and Avon Park Formation, as suggested by Hutchin-son (1992), and is well above the Lower Floridan aquifer (about 2,000 ft deep based on Miller, 1986). A preferential conduit for flow, such as a fault or fracture plane, must be present in the subsurface to allow this deep Upper Floridan aquifer water to move to the surface.
Evaluating Water from the Middle Confining Unit as a
Source of Sulfate
A possible source of sulfate in the Upper Floridan aquifer is diffusion of saline pore water from the middle confining unit. Water from the middle confining unit was not sampled during this study because wells were not available in this non-productive zone. However, water samples were col-lected during exploratory drilling to the middle confining unit by SWFWMD at one site within the study area (ROMP 22) and two sites just north of the immediate study area (ROMP 39 and ROMP TR7-2 in Manatee County; fig. 5a). Water analyses were also available from a test hole in Sun City Center in southern Hillsborough County (Sinclair, 1979) and exploratory drilling of a deep injection site by a private consultant (Knight Trail; Law Environmental, Inc., 1989). Samples were col-lected from the bottom of the hole at all sites with a thief sampler; this water should be more representa-tive of pore water within the unit than a pumped sample. Water pumped from similar zones usually was distinctly different because water was drawn from more permeable units. Thus, pumped samples were not considered to be representative of waters within the confining unit. Selected data from all sites are included in table 5.
Water sampled from the middle confining unit was saline, with chloride concentrations ranging from 7,600 to 34,000 mg/L (fractions of seawater ranging from 0.40 to 1.79). Chloride concentrations were sometimes higher than modern seawater (ROMP 22 and Sun City Center). Sulfate concentrations ranged from 3,300 to 5,400 mg/L. All waters from the middle confining unit were enriched in sulfate and calcium, compared to conservative dilution or concentration of seawater, which is consistent with gypsum dissolution. The waters also were saturated to slightly supersatu-rated with respect to gypsum (SI between 0.02 and 0.10). (For ionic strengths greater than 0.7, SI values were calculated using PHRQPITZ; Plummer and oth-ers, 1988). Calcium was usually enriched over that expected from gypsum dissolution (fig. 17). The addi-tional calcium may come from dolomitization, result-ing in depletion of magnesium, or cation exchange, causing depletion of magnesium or sodium.
The high chloride concentrations indicate a marine origin for the water. However, the waters are not pure connate waters buried at the time of gypsum deposition because chloride concentrations are consid-erably lower than concentrations in a brine from which gypsum would precipitate. Seawater must be concen-trated by a factor of about 3.5 to 5 before gypsum pre-cipitation occurs, with a resultant chloride concentration greater than 66,000 mg/L (Drever, 1982). The connate water has undoubtedly been flushed out over time. Waters from the middle confin-ing unit are probably mixtures between the original
Table 5. Water-quality data from the middle confining unit
[Samples were collected from bottom of hole with a thief sampler; units in milligrams per liter unless otherwise noted; ft, feet; µS/cm, microsiemens per centimeter; SWF, Southwest Florida Water Management District (unpublished data); LEI, Law Environmental, Inc. (1989); Sincl., Sinclair (1979)]
Parameter ROMP 22ROMP TR7-2
Knight Trail
Sun City Center
ROMP 39
Depth (ft below land surface)
1,780 1,715 1,930 1,500 1,645
Specific conduc-tance (µS/cm)
94,300 54,400 48,000 79,600 25,860
Calcium 1,700 1,600 1,500 1,700 1,000Magnesium 1,200 970 1,000 1,700 410Sodium 16,000 10,000 10,000 18,000 4,100Potassium 630 280 420 760 130Chloride 29,000 18,000 18,000 34,000 7,600Sulfate 4,800 3,900 4,800 5,400 3,300Bicarbonate
(as HCO3)322 109 290 311 206
Fraction modern seawater
1.53 0.95 0.95 1.79 0.40
Source of data SWF SWF LEI Sincl. SWF
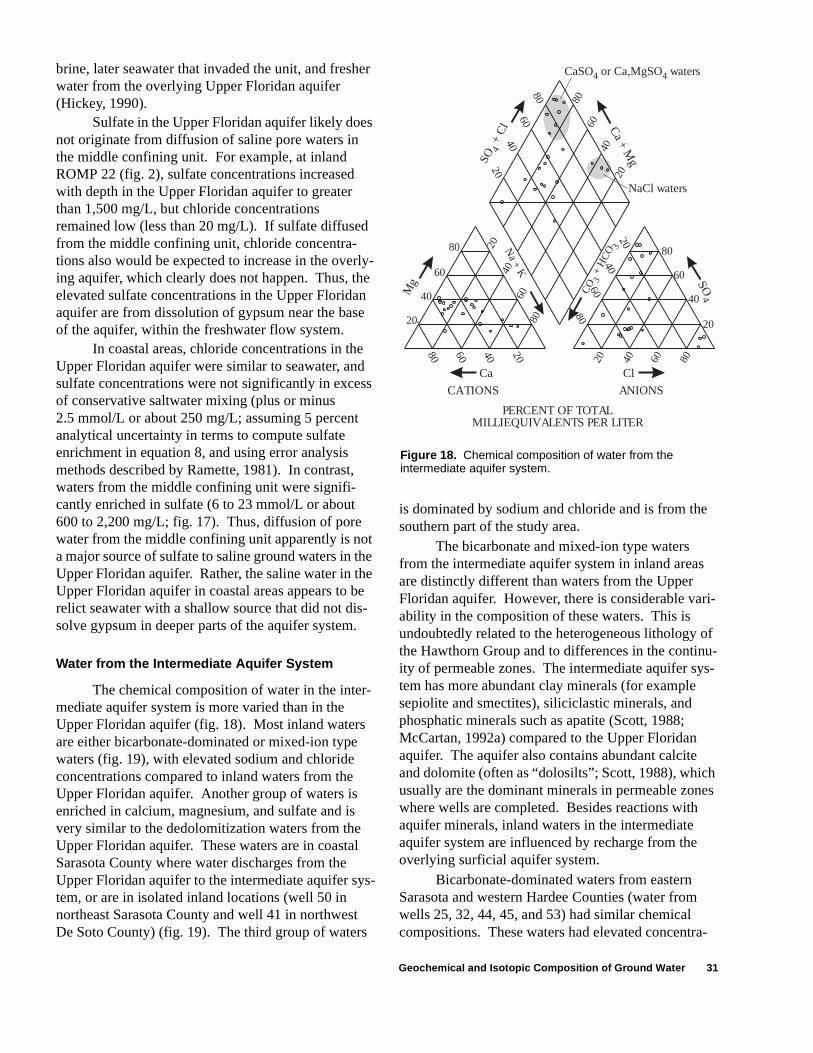
Geochemical and Isotopic Composition of Ground Water 31
brine, later seawater that invaded the unit, and fresher water from the overlying Upper Floridan aquifer (Hickey, 1990).
Sulfate in the Upper Floridan aquifer likely does not originate from diffusion of saline pore waters in the middle confining unit. For example, at inland ROMP 22 (fig. 2), sulfate concentrations increased with depth in the Upper Floridan aquifer to greater than 1,500 mg/L, but chloride concentrations remained low (less than 20 mg/L). If sulfate diffused from the middle confining unit, chloride concentra-tions also would be expected to increase in the overly-ing aquifer, which clearly does not happen. Thus, the elevated sulfate concentrations in the Upper Floridan aquifer are from dissolution of gypsum near the base of the aquifer, within the freshwater flow system.
In coastal areas, chloride concentrations in the Upper Floridan aquifer were similar to seawater, and sulfate concentrations were not significantly in excess of conservative saltwater mixing (plus or minus 2.5 mmol/L or about 250 mg/L; assuming 5 percent analytical uncertainty in terms to compute sulfate enrichment in equation 8, and using error analysis methods described by Ramette, 1981). In contrast, waters from the middle confining unit were signifi-cantly enriched in sulfate (6 to 23 mmol/L or about 600 to 2,200 mg/L; fig. 17). Thus, diffusion of pore water from the middle confining unit apparently is not a major source of sulfate to saline ground waters in the Upper Floridan aquifer. Rather, the saline water in the Upper Floridan aquifer in coastal areas appears to be relict seawater with a shallow source that did not dis-solve gypsum in deeper parts of the aquifer system.
Water from the Intermediate Aquifer System
The chemical composition of water in the inter-mediate aquifer system is more varied than in the Upper Floridan aquifer (fig. 18). Most inland waters are either bicarbonate-dominated or mixed-ion type waters (fig. 19), with elevated sodium and chloride concentrations compared to inland waters from the Upper Floridan aquifer. Another group of waters is enriched in calcium, magnesium, and sulfate and is very similar to the dedolomitization waters from the Upper Floridan aquifer. These waters are in coastal Sarasota County where water discharges from the Upper Floridan aquifer to the intermediate aquifer sys-tem, or are in isolated inland locations (well 50 in northeast Sarasota County and well 41 in northwest De Soto County) (fig. 19). The third group of waters
is dominated by sodium and chloride and is from the southern part of the study area.
The bicarbonate and mixed-ion type waters from the intermediate aquifer system in inland areas are distinctly different than waters from the Upper Floridan aquifer. However, there is considerable vari-ability in the composition of these waters. This is undoubtedly related to the heterogeneous lithology of the Hawthorn Group and to differences in the continu-ity of permeable zones. The intermediate aquifer sys-tem has more abundant clay minerals (for example sepiolite and smectites), siliciclastic minerals, and phosphatic minerals such as apatite (Scott, 1988; McCartan, 1992a) compared to the Upper Floridan aquifer. The aquifer also contains abundant calcite and dolomite (often as “dolosilts”; Scott, 1988), which usually are the dominant minerals in permeable zones where wells are completed. Besides reactions with aquifer minerals, inland waters in the intermediate aquifer system are influenced by recharge from the overlying surficial aquifer system.
Bicarbonate-dominated waters from eastern Sarasota and western Hardee Counties (water from wells 25, 32, 44, 45, and 53) had similar chemical compositions. These waters had elevated concentra-
CATIONS ANIONS
PERCENT OF TOTALMILLIEQUIVALENTS PER LITER
80
60
40
2020
40
60
80 20
80
40
60
60
40
80
20
SO 4
+ C
l
Mg
CO 3
+ H
CO 3
80
Na + K
Ca + M
g
SO
4
60
40
20
40
60
80
20
20 40 60 80
20406080Ca Cl
CaSO4 or Ca,MgSO4 waters
NaCl waters
Figure 18. Chemical composition of water from the intermediate aquifer system.
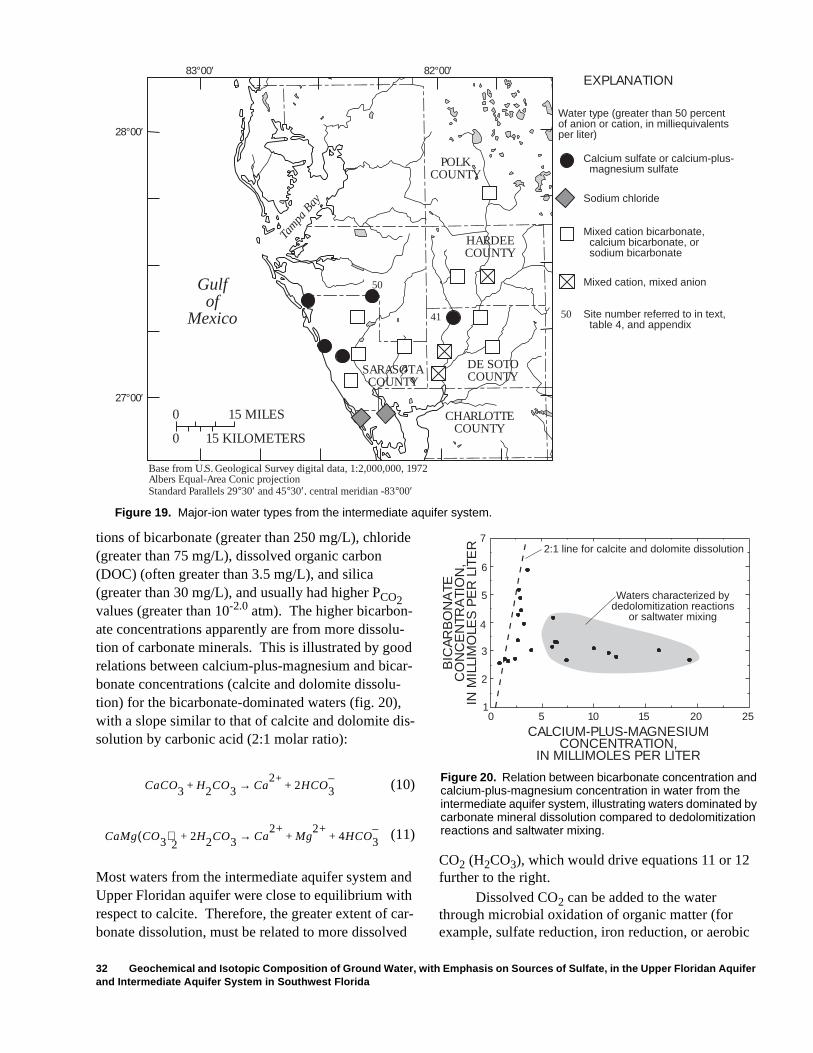
32 Geochemical and Isotopic Composition of Ground Water, with Emphasis on Sources of Sulfate, in the Upper Floridan Aquifer and Intermediate Aquifer System in Southwest Florida
tions of bicarbonate (greater than 250 mg/L), chloride (greater than 75 mg/L), dissolved organic carbon (DOC) (often greater than 3.5 mg/L), and silica (greater than 30 mg/L), and usually had higher PCO2
values (greater than 10-2.0 atm). The higher bicarbon-ate concentrations apparently are from more dissolu-tion of carbonate minerals. This is illustrated by good relations between calcium-plus-magnesium and bicar-bonate concentrations (calcite and dolomite dissolu-tion) for the bicarbonate-dominated waters (fig. 20), with a slope similar to that of calcite and dolomite dis-solution by carbonic acid (2:1 molar ratio):
(10)
(11)
Most waters from the intermediate aquifer system and Upper Floridan aquifer were close to equilibrium with respect to calcite. Therefore, the greater extent of car-bonate dissolution, must be related to more dissolved
Base from U.S. Geological Survey digital data, 1:2,000,000, 1972Albers Equal-Area Conic projectionStandard Parallels 29°30′ and 45°30′, central meridian -83°00′
Calcium sulfate or calcium-plus-magnesium sulfate
Sodium chloride
Mixed cation bicarbonate,calcium bicarbonate, or sodium bicarbonate
Mixed cation, mixed anion
Site number referred to in text,table 4, and appendix
50
50
41
EXPLANATION
DE SOTOCOUNTY
HARDEECOUNTY
POLKCOUNTY
SARASOTACOUNTY
CHARLOTTECOUNTY
83°00′ 82°00′
28°00′
27°00′0 15 MILES
15 KILOMETERS0
Gulfof
Mexico
Tam
pa B
ay
Water type (greater than 50 percent of anion or cation, in milliequivalents per liter)
Figure 19. Major-ion water types from the intermediate aquifer system.
CaCO3 H2CO3 Ca2+
2HCO3–
+→+
CaMg CO3( )2
2H2CO3 Ca2+
Mg2+
4HCO3–
+ +→+
CO2 (H2CO3), which would drive equations 11 or 12 further to the right.
Dissolved CO2 can be added to the water through microbial oxidation of organic matter (for example, sulfate reduction, iron reduction, or aerobic
7
6
5
4
3
2
10 5 10 15 20 25
Waters characterized by dedolomitization reactions
or saltwater mixing
2:1 line for calcite and dolomite dissolution
BIC
AR
BO
NA
TEC
ON
CE
NTR
ATI
ON
,IN
MIL
LIM
OLE
S P
ER
LIT
ER
CALCIUM-PLUS-MAGNESIUM CONCENTRATION,
IN MILLIMOLES PER LITER
Figure 20. Relation between bicarbonate concentration and calcium-plus-magnesium concentration in water from the intermediate aquifer system, illustrating waters dominated by carbonate mineral dissolution compared to dedolomitization reactions and saltwater mixing.
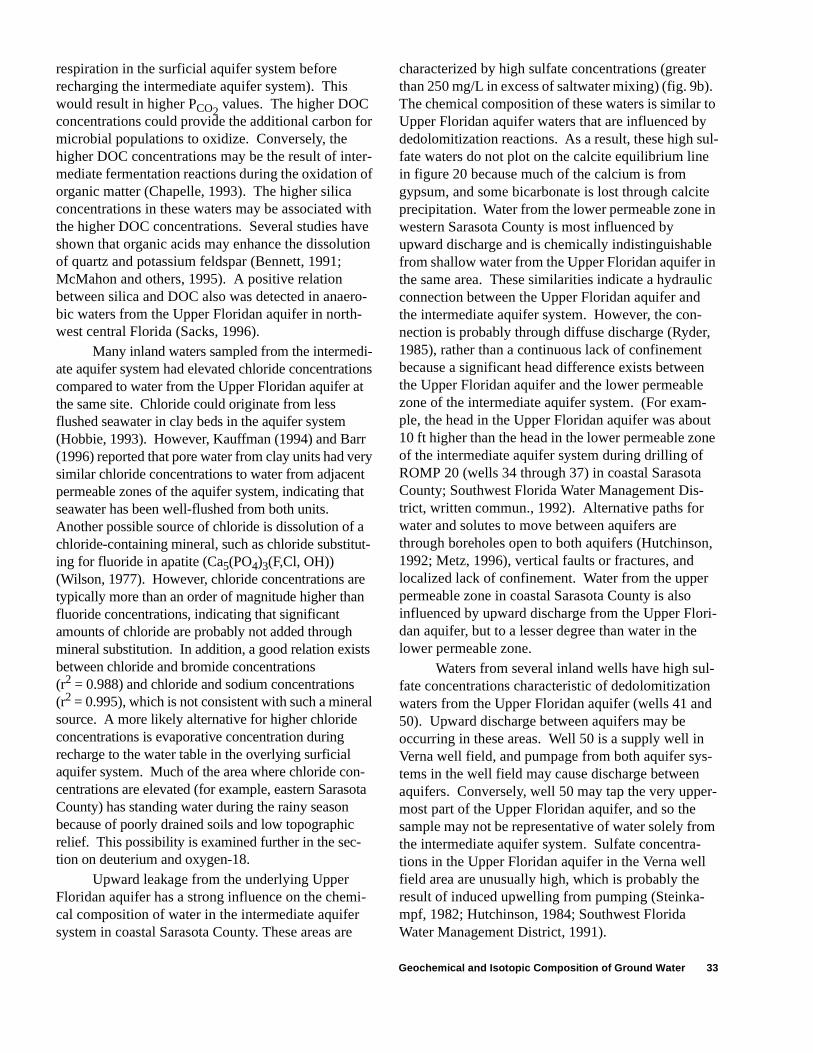
Geochemical and Isotopic Composition of Ground Water 33
respiration in the surficial aquifer system before recharging the intermediate aquifer system). This would result in higher PCO2
values. The higher DOC concentrations could provide the additional carbon for microbial populations to oxidize. Conversely, the higher DOC concentrations may be the result of inter-mediate fermentation reactions during the oxidation of organic matter (Chapelle, 1993). The higher silica concentrations in these waters may be associated with the higher DOC concentrations. Several studies have shown that organic acids may enhance the dissolution of quartz and potassium feldspar (Bennett, 1991; McMahon and others, 1995). A positive relation between silica and DOC also was detected in anaero-bic waters from the Upper Floridan aquifer in north-west central Florida (Sacks, 1996).
Many inland waters sampled from the intermedi-ate aquifer system had elevated chloride concentrations compared to water from the Upper Floridan aquifer at the same site. Chloride could originate from less flushed seawater in clay beds in the aquifer system (Hobbie, 1993). However, Kauffman (1994) and Barr (1996) reported that pore water from clay units had very similar chloride concentrations to water from adjacent permeable zones of the aquifer system, indicating that seawater has been well-flushed from both units. Another possible source of chloride is dissolution of a chloride-containing mineral, such as chloride substitut-ing for fluoride in apatite (Ca5(PO4)3(F,Cl, OH)) (Wilson, 1977). However, chloride concentrations are typically more than an order of magnitude higher than fluoride concentrations, indicating that significant amounts of chloride are probably not added through mineral substitution. In addition, a good relation exists between chloride and bromide concentrations (r2 = 0.988) and chloride and sodium concentrations (r2 = 0.995), which is not consistent with such a mineral source. A more likely alternative for higher chloride concentrations is evaporative concentration during recharge to the water table in the overlying surficial aquifer system. Much of the area where chloride con-centrations are elevated (for example, eastern Sarasota County) has standing water during the rainy season because of poorly drained soils and low topographic relief. This possibility is examined further in the sec-tion on deuterium and oxygen-18.
Upward leakage from the underlying Upper Floridan aquifer has a strong influence on the chemi-cal composition of water in the intermediate aquifer system in coastal Sarasota County. These areas are
characterized by high sulfate concentrations (greater than 250 mg/L in excess of saltwater mixing) (fig. 9b). The chemical composition of these waters is similar to Upper Floridan aquifer waters that are influenced by dedolomitization reactions. As a result, these high sul-fate waters do not plot on the calcite equilibrium line in figure 20 because much of the calcium is from gypsum, and some bicarbonate is lost through calcite precipitation. Water from the lower permeable zone in western Sarasota County is most influenced by upward discharge and is chemically indistinguishable from shallow water from the Upper Floridan aquifer in the same area. These similarities indicate a hydraulic connection between the Upper Floridan aquifer and the intermediate aquifer system. However, the con-nection is probably through diffuse discharge (Ryder, 1985), rather than a continuous lack of confinement because a significant head difference exists between the Upper Floridan aquifer and the lower permeable zone of the intermediate aquifer system. (For exam-ple, the head in the Upper Floridan aquifer was about 10 ft higher than the head in the lower permeable zone of the intermediate aquifer system during drilling of ROMP 20 (wells 34 through 37) in coastal Sarasota County; Southwest Florida Water Management Dis-trict, written commun., 1992). Alternative paths for water and solutes to move between aquifers are through boreholes open to both aquifers (Hutchinson, 1992; Metz, 1996), vertical faults or fractures, and localized lack of confinement. Water from the upper permeable zone in coastal Sarasota County is also influenced by upward discharge from the Upper Flori-dan aquifer, but to a lesser degree than water in the lower permeable zone.
Waters from several inland wells have high sul-fate concentrations characteristic of dedolomitization waters from the Upper Floridan aquifer (wells 41 and 50). Upward discharge between aquifers may be occurring in these areas. Well 50 is a supply well in Verna well field, and pumpage from both aquifer sys-tems in the well field may cause discharge between aquifers. Conversely, well 50 may tap the very upper-most part of the Upper Floridan aquifer, and so the sample may not be representative of water solely from the intermediate aquifer system. Sulfate concentra-tions in the Upper Floridan aquifer in the Verna well field area are unusually high, which is probably the result of induced upwelling from pumping (Steinka-mpf, 1982; Hutchinson, 1984; Southwest Florida Water Management District, 1991).
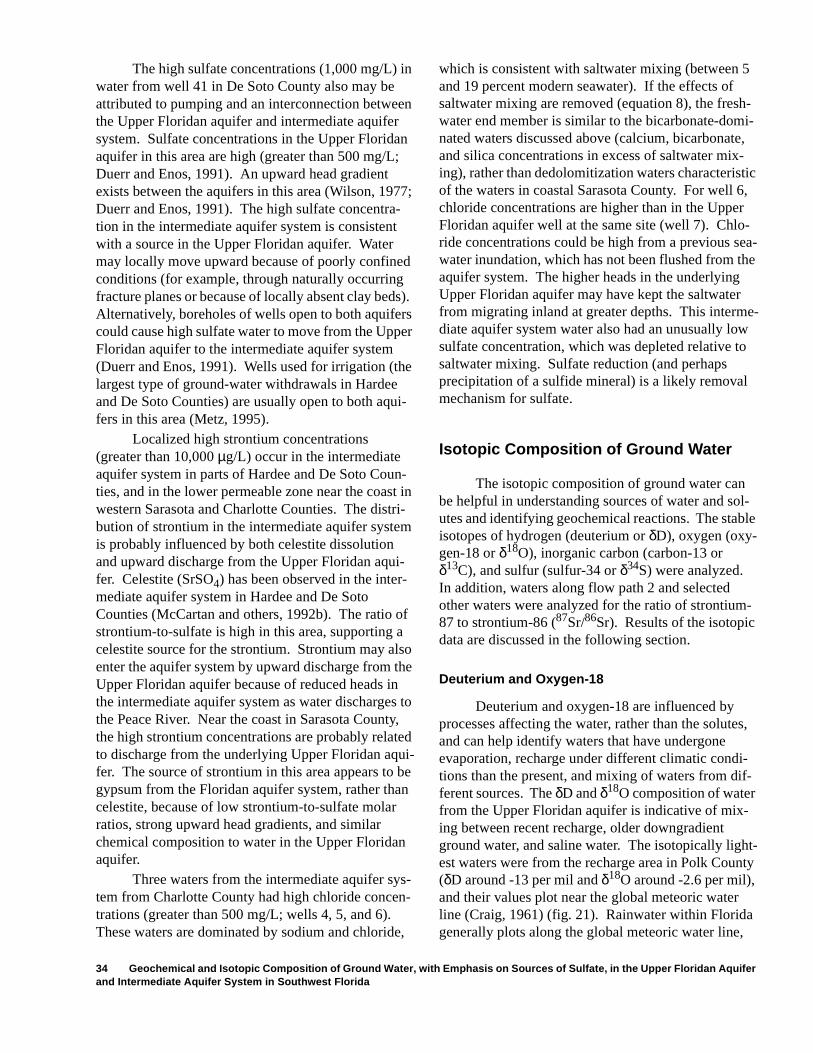
34 Geochemical and Isotopic Composition of Ground Water, with Emphasis on Sources of Sulfate, in the Upper Floridan Aquifer and Intermediate Aquifer System in Southwest Florida
The high sulfate concentrations (1,000 mg/L) in water from well 41 in De Soto County also may be attributed to pumping and an interconnection between the Upper Floridan aquifer and intermediate aquifer system. Sulfate concentrations in the Upper Floridan aquifer in this area are high (greater than 500 mg/L; Duerr and Enos, 1991). An upward head gradient exists between the aquifers in this area (Wilson, 1977; Duerr and Enos, 1991). The high sulfate concentra-tion in the intermediate aquifer system is consistent with a source in the Upper Floridan aquifer. Water may locally move upward because of poorly confined conditions (for example, through naturally occurring fracture planes or because of locally absent clay beds). Alternatively, boreholes of wells open to both aquifers could cause high sulfate water to move from the Upper Floridan aquifer to the intermediate aquifer system (Duerr and Enos, 1991). Wells used for irrigation (the largest type of ground-water withdrawals in Hardee and De Soto Counties) are usually open to both aqui-fers in this area (Metz, 1995).
Localized high strontium concentrations (greater than 10,000 µg/L) occur in the intermediate aquifer system in parts of Hardee and De Soto Coun-ties, and in the lower permeable zone near the coast in western Sarasota and Charlotte Counties. The distri-bution of strontium in the intermediate aquifer system is probably influenced by both celestite dissolution and upward discharge from the Upper Floridan aqui-fer. Celestite (SrSO4) has been observed in the inter-mediate aquifer system in Hardee and De Soto Counties (McCartan and others, 1992b). The ratio of strontium-to-sulfate is high in this area, supporting a celestite source for the strontium. Strontium may also enter the aquifer system by upward discharge from the Upper Floridan aquifer because of reduced heads in the intermediate aquifer system as water discharges to the Peace River. Near the coast in Sarasota County, the high strontium concentrations are probably related to discharge from the underlying Upper Floridan aqui-fer. The source of strontium in this area appears to be gypsum from the Floridan aquifer system, rather than celestite, because of low strontium-to-sulfate molar ratios, strong upward head gradients, and similar chemical composition to water in the Upper Floridan aquifer.
Three waters from the intermediate aquifer sys-tem from Charlotte County had high chloride concen-trations (greater than 500 mg/L; wells 4, 5, and 6). These waters are dominated by sodium and chloride,
which is consistent with saltwater mixing (between 5 and 19 percent modern seawater). If the effects of saltwater mixing are removed (equation 8), the fresh-water end member is similar to the bicarbonate-domi-nated waters discussed above (calcium, bicarbonate, and silica concentrations in excess of saltwater mix-ing), rather than dedolomitization waters characteristic of the waters in coastal Sarasota County. For well 6, chloride concentrations are higher than in the Upper Floridan aquifer well at the same site (well 7). Chlo-ride concentrations could be high from a previous sea-water inundation, which has not been flushed from the aquifer system. The higher heads in the underlying Upper Floridan aquifer may have kept the saltwater from migrating inland at greater depths. This interme-diate aquifer system water also had an unusually low sulfate concentration, which was depleted relative to saltwater mixing. Sulfate reduction (and perhaps precipitation of a sulfide mineral) is a likely removal mechanism for sulfate.
Isotopic Composition of Ground Water
The isotopic composition of ground water can be helpful in understanding sources of water and sol-utes and identifying geochemical reactions. The stable isotopes of hydrogen (deuterium or δD), oxygen (oxy-gen-18 or δ18O), inorganic carbon (carbon-13 or δ13C), and sulfur (sulfur-34 or δ34S) were analyzed. In addition, waters along flow path 2 and selected other waters were analyzed for the ratio of strontium-87 to strontium-86 (87Sr/86Sr). Results of the isotopic data are discussed in the following section.
Deuterium and Oxygen-18
Deuterium and oxygen-18 are influenced by processes affecting the water, rather than the solutes, and can help identify waters that have undergone evaporation, recharge under different climatic condi-tions than the present, and mixing of waters from dif-ferent sources. The δD and δ18O composition of water from the Upper Floridan aquifer is indicative of mix-ing between recent recharge, older downgradient ground water, and saline water. The isotopically light-est waters were from the recharge area in Polk County (δD around -13 per mil and δ18O around -2.6 per mil), and their values plot near the global meteoric water line (Craig, 1961) (fig. 21). Rainwater within Florida generally plots along the global meteoric water line,
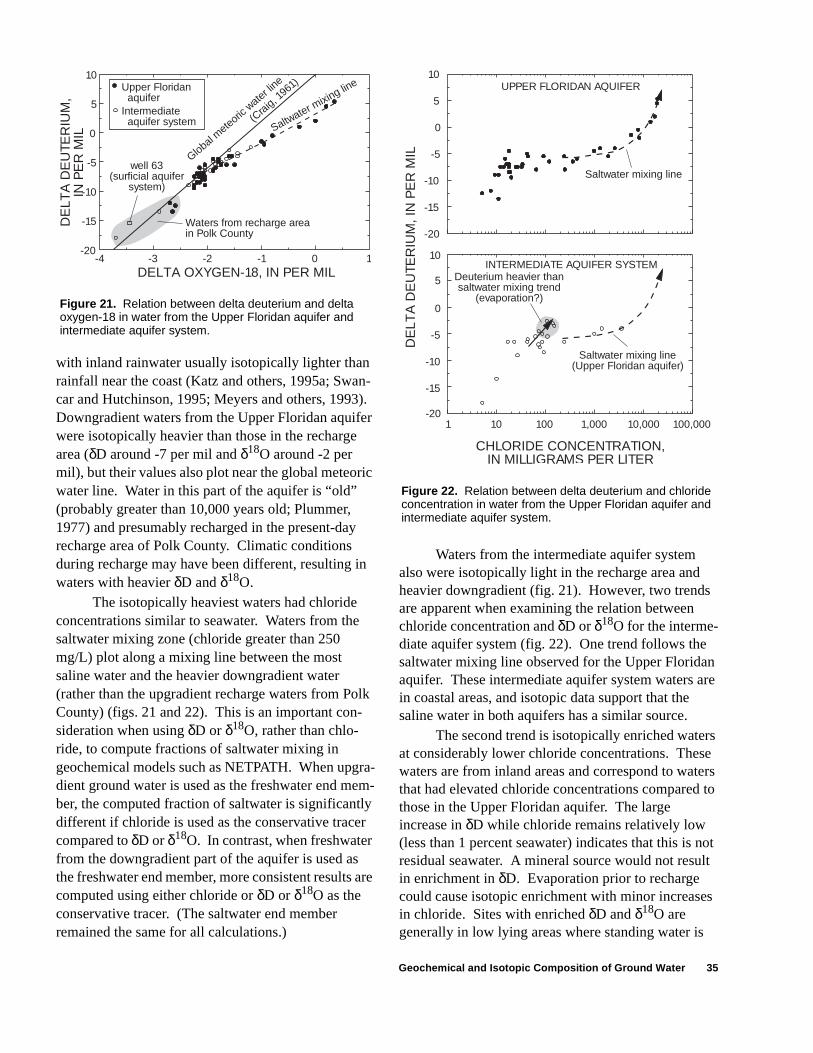
Geochemical and Isotopic Composition of Ground Water 35
with inland rainwater usually isotopically lighter than rainfall near the coast (Katz and others, 1995a; Swan-car and Hutchinson, 1995; Meyers and others, 1993). Downgradient waters from the Upper Floridan aquifer were isotopically heavier than those in the recharge area (δD around -7 per mil and δ18O around -2 per mil), but their values also plot near the global meteoric water line. Water in this part of the aquifer is “old” (probably greater than 10,000 years old; Plummer, 1977) and presumably recharged in the present-day recharge area of Polk County. Climatic conditions during recharge may have been different, resulting in waters with heavier δD and δ18O.
The isotopically heaviest waters had chloride concentrations similar to seawater. Waters from the saltwater mixing zone (chloride greater than 250 mg/L) plot along a mixing line between the most saline water and the heavier downgradient water (rather than the upgradient recharge waters from Polk County) (figs. 21 and 22). This is an important con-sideration when using δD or δ18O, rather than chlo-ride, to compute fractions of saltwater mixing in geochemical models such as NETPATH. When upgra-dient ground water is used as the freshwater end mem-ber, the computed fraction of saltwater is significantly different if chloride is used as the conservative tracer compared to δD or δ18O. In contrast, when freshwater from the downgradient part of the aquifer is used as the freshwater end member, more consistent results are computed using either chloride or δD or δ18O as the conservative tracer. (The saltwater end member remained the same for all calculations.)
Waters from the intermediate aquifer system also were isotopically light in the recharge area and heavier downgradient (fig. 21). However, two trends are apparent when examining the relation between chloride concentration and δD or δ18O for the interme-diate aquifer system (fig. 22). One trend follows the saltwater mixing line observed for the Upper Floridan aquifer. These intermediate aquifer system waters are in coastal areas, and isotopic data support that the saline water in both aquifers has a similar source.
The second trend is isotopically enriched waters at considerably lower chloride concentrations. These waters are from inland areas and correspond to waters that had elevated chloride concentrations compared to those in the Upper Floridan aquifer. The large increase in δD while chloride remains relatively low (less than 1 percent seawater) indicates that this is not residual seawater. A mineral source would not result in enrichment in δD. Evaporation prior to recharge could cause isotopic enrichment with minor increases in chloride. Sites with enriched δD and δ18O are generally in low lying areas where standing water is
10
5
0
-5
-10
-15
-20-4 -3 -2 -1 0 1
DE
LTA
DE
UTE
RIU
M,
IN P
ER
MIL
DELTA OXYGEN-18, IN PER MIL
well 63(surficial aquifer
system)
Waters from recharge areain Polk County
Upper Floridanaquifer
Intermediateaquifer system
Saltwater mixing lin
e
(Craig, 1
961)
Global meteoric
water li
ne
Figure 21. Relation between delta deuterium and delta oxygen-18 in water from the Upper Floridan aquifer and intermediate aquifer system.
10
10
5
5
0
0
-5
-5
-10
-10
-15
-15
-20
-201 10 100 1,000 10,000 100,000
Saltwater mixing line
UPPER FLORIDAN AQUIFER
INTERMEDIATE AQUIFER SYSTEM
DE
LTA
DE
UTE
RIU
M, I
N P
ER
MIL
Deuterium heavier than saltwater mixing trend
(evaporation?)
CHLORIDE CONCENTRATION, IN MILLIGRAMS PER LITER
Saltwater mixing line(Upper Floridan aquifer)
Figure 22. Relation between delta deuterium and chloride concentration in water from the Upper Floridan aquifer and intermediate aquifer system.
36 Geochemical and Isotopic Composition of Ground Water, with Emphasis on Sources of Sulfate, in the Upper Floridan Aquifer and Intermediate Aquifer System in Southwest Florida
common after heavy rains. As this ponded water evaporates, δD and δ18O fractionate at different rates resulting in heavier isotopes in solution and an offset from the global meteoric line. Evaporation also con-centrates the amount of conservative ions in the water. This water eventually recharges the surficial aquifer system. Water from the surficial aquifer system in undeveloped inland Sarasota County has a wide range of chloride concentrations (chloride concentrations commonly exceed 50 mg/L; Duerr and Wolansky, 1986). This water eventually recharges the intermedi-ate aquifer system. Over long periods of time (proba-bly on the order of 1,000’s of years) this water presumably could result in elevated chloride concen-trations and isotopically enriched waters in the inter-mediate aquifer system. However, this is undoubtedly a complex process because of the different permeable zones within the intermediate aquifer system and dif-ferences in the extent of interconnection between these permeable zones.
Water in the intermediate aquifer system that is characterized by high excess sulfate concentrations, indicative of upward leakage from the Upper Floridan aquifer, had relatively uniform δD and δ18O composi-tions (δD values between -6.0 and -6.5 per mil for δ18O values between -1.9 and -2.1 per mil). These values are similar to downgradient freshwaters from the Upper Floridan aquifer, which further supports upward leakage from the Upper Floridan aquifer.
Carbon-13
Processes affecting the stable carbon isotope composition (δ13C) of inorganic carbon in ground water include carbonate mineral dissolution and pre-cipitation, microbially mediated processes that oxidize organic carbon and generate CO2, and mixing of waters. In the Upper Floridan aquifer, δ13C was light-est in the recharge area (less than -8 per mil) and heaviest in discharge areas of coastal Sarasota County and the lower Peace River Basin (greater than -5 per mil). Carbon-13 values usually increased with depth in the Upper Floridan aquifer. The heavier δ13C val-ues indicate dissolution of dolomite (mean δ13C of dolomite measured for this study was 1.7 per mil; table 2), which is more common deeper in the aquifer. In discharge areas, this isotopically heavy carbon moves upward to shallower parts of the aquifer. The influ-ence of dolomite dissolution is illustrated by an increase in magnesium over that expected for saltwa-ter mixing and an accompanied enrichment in δ13C
(dedolomitization trend in fig. 23). Calcite precipita-tion, which is a reaction that accompanies dolomite dissolution, removes some of the isotopically heavy carbon from solution and probably accounts for why the δ13C values in ground water are isotopically lighter than those of dolomite.
The opposite relation is seen for the most saline waters from the Upper Floridan aquifer (chloride con-centrations greater than about 5,000 mg/L or about 25 percent seawater). For these waters magnesium was depleted relative to conservative saltwater mixing. As magnesium becomes more depleted, δ13C values tend to become isotopically lighter (fig. 23). This is consis-tent with dolomitization removing isotopically heavy carbon, resulting in isotopically lighter carbon in solu-tion.
In water from the intermediate aquifer system, δ13C values in ground water typically were lighter compared to δ13C values in the Upper Floridan aquifer (less than -8 per mil for most of the study area). Val-ues of δ13C increase toward the coast and within the Peace River Basin, which corresponds to areas of
-2
-4
-6
-8
-10
-12-15 -10 -5 0 5 10
dolomitizatio
n
dedo
lom
itiza
tion
Chloride concentration greater than 250 and less than 5,000milligrams per liter
Chloride concentration greaterthan 5,000 milligrams per liter
EXPLANATION
ENRICHMENT (+) OR DEPLETION (-) OF MAGNESIUM, IN MILLIMOLES PER LITER
DE
LTA
CA
RB
ON
-13,
IN P
ER
MIL
(Enrichment or depletion relative to conservativemixing between modern seawater and upgradient
ground water from well 62.)
Figure 23. Relation between delta carbon-13 and enrichment or depletion of magnesium relative to conservative saltwater mixing in water from the Upper Floridan aquifer.
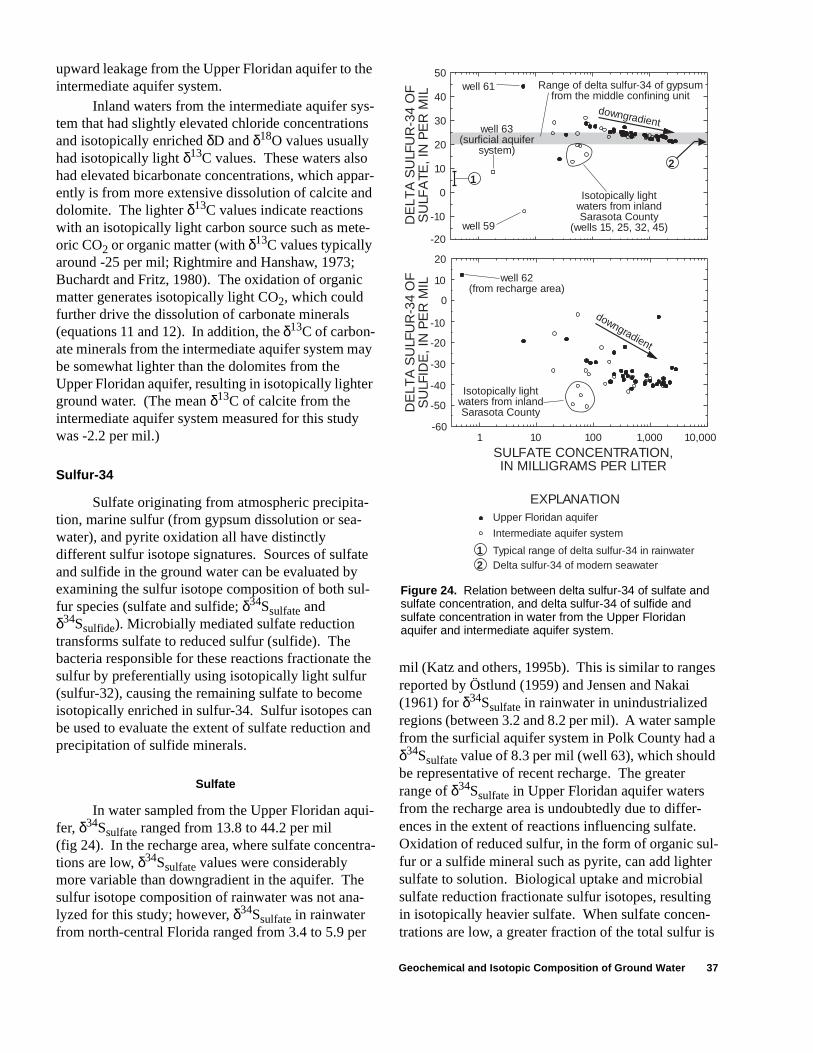
Geochemical and Isotopic Composition of Ground Water 37
upward leakage from the Upper Floridan aquifer to the intermediate aquifer system.
Inland waters from the intermediate aquifer sys-tem that had slightly elevated chloride concentrations and isotopically enriched δD and δ18O values usually had isotopically light δ13C values. These waters also had elevated bicarbonate concentrations, which appar-ently is from more extensive dissolution of calcite and dolomite. The lighter δ13C values indicate reactions with an isotopically light carbon source such as mete-oric CO2 or organic matter (with δ13C values typically around -25 per mil; Rightmire and Hanshaw, 1973; Buchardt and Fritz, 1980). The oxidation of organic matter generates isotopically light CO2, which could further drive the dissolution of carbonate minerals (equations 11 and 12). In addition, the δ13C of carbon-ate minerals from the intermediate aquifer system may be somewhat lighter than the dolomites from the Upper Floridan aquifer, resulting in isotopically lighter ground water. (The mean δ13C of calcite from the intermediate aquifer system measured for this study was -2.2 per mil.)
Sulfur-34
Sulfate originating from atmospheric precipita-tion, marine sulfur (from gypsum dissolution or sea-water), and pyrite oxidation all have distinctly different sulfur isotope signatures. Sources of sulfate and sulfide in the ground water can be evaluated by examining the sulfur isotope composition of both sul-fur species (sulfate and sulfide; δ34Ssulfate and δ34Ssulfide). Microbially mediated sulfate reduction transforms sulfate to reduced sulfur (sulfide). The bacteria responsible for these reactions fractionate the sulfur by preferentially using isotopically light sulfur (sulfur-32), causing the remaining sulfate to become isotopically enriched in sulfur-34. Sulfur isotopes can be used to evaluate the extent of sulfate reduction and precipitation of sulfide minerals.
Sulfate
In water sampled from the Upper Floridan aqui-fer, δ34Ssulfate ranged from 13.8 to 44.2 per mil (fig 24). In the recharge area, where sulfate concentra-tions are low, δ34Ssulfate values were considerably more variable than downgradient in the aquifer. The sulfur isotope composition of rainwater was not ana-lyzed for this study; however, δ34Ssulfate in rainwater from north-central Florida ranged from 3.4 to 5.9 per
mil (Katz and others, 1995b). This is similar to ranges reported by Östlund (1959) and Jensen and Nakai (1961) for δ34Ssulfate in rainwater in unindustrialized regions (between 3.2 and 8.2 per mil). A water sample from the surficial aquifer system in Polk County had a δ34Ssulfate value of 8.3 per mil (well 63), which should be representative of recent recharge. The greater range of δ34Ssulfate in Upper Floridan aquifer waters from the recharge area is undoubtedly due to differ-ences in the extent of reactions influencing sulfate. Oxidation of reduced sulfur, in the form of organic sul-fur or a sulfide mineral such as pyrite, can add lighter sulfate to solution. Biological uptake and microbial sulfate reduction fractionate sulfur isotopes, resulting in isotopically heavier sulfate. When sulfate concen-trations are low, a greater fraction of the total sulfur is
1
1
50
40
30
20
10
0
2
2
-10
-20
DE
LTA
SU
LFU
R-3
4 O
F
SU
LFA
TE, I
N P
ER
MIL
DE
LTA
SU
LFU
R-3
4 O
F
SU
LFID
E, I
N P
ER
MIL
well 61
well 63(surficial aquifer
system)
well 59
Isotopically lightwaters from inlandSarasota County
(wells 15, 25, 32, 45)
downgradient
well 62(from recharge area)
20
10
0
-10
-20
-30
-40
-50
-601 10 100 1,000 10,000
Upper Floridan aquifer
Delta sulfur-34 of modern seawater
downgradient
Isotopically lightwaters from inlandSarasota County
SULFATE CONCENTRATION, IN MILLIGRAMS PER LITER
EXPLANATION
Intermediate aquifer system
Typical range of delta sulfur-34 in rainwater
Range of delta sulfur-34 of gypsumfrom the middle confining unit
Figure 24. Relation between delta sulfur-34 of sulfate and sulfate concentration, and delta sulfur-34 of sulfide and sulfate concentration in water from the Upper Floridan aquifer and intermediate aquifer system.
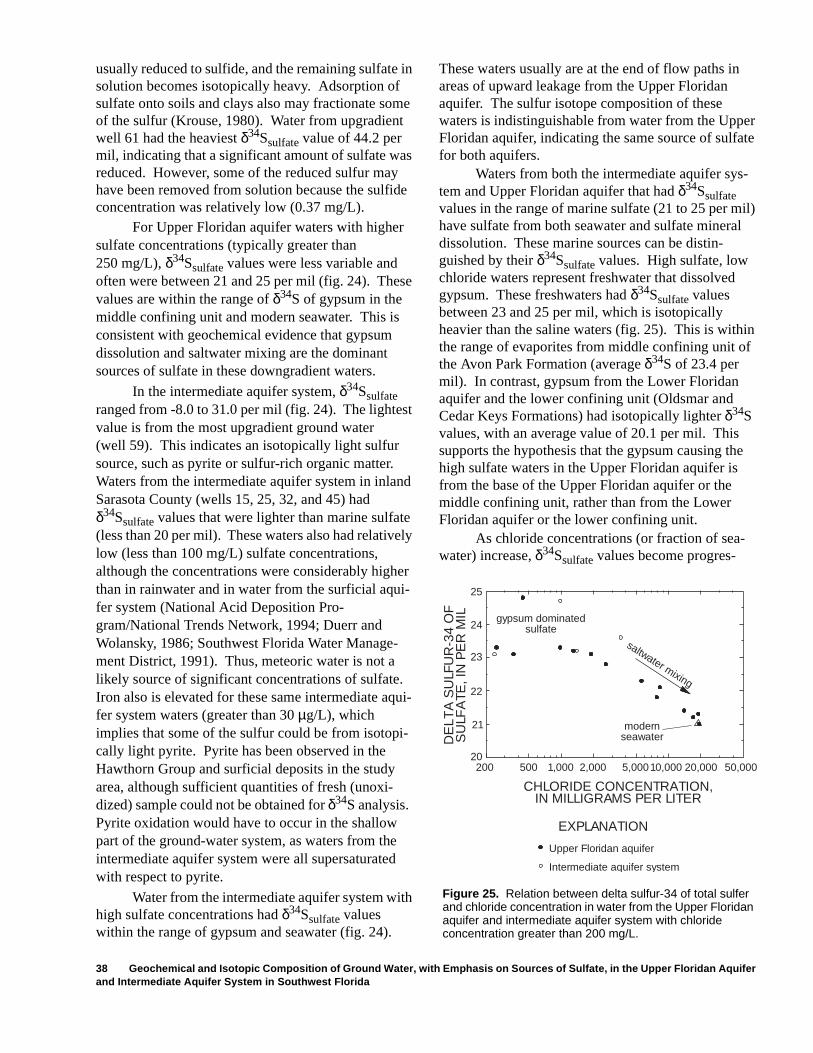
38 Geochemical and Isotopic Composition of Ground Water, with Emphasis on Sources of Sulfate, in the Upper Floridan Aquifer and Intermediate Aquifer System in Southwest Florida
usually reduced to sulfide, and the remaining sulfate in solution becomes isotopically heavy. Adsorption of sulfate onto soils and clays also may fractionate some of the sulfur (Krouse, 1980). Water from upgradient well 61 had the heaviest δ34Ssulfate value of 44.2 per mil, indicating that a significant amount of sulfate was reduced. However, some of the reduced sulfur may have been removed from solution because the sulfide concentration was relatively low (0.37 mg/L).
For Upper Floridan aquifer waters with higher sulfate concentrations (typically greater than 250 mg/L), δ34Ssulfate values were less variable and often were between 21 and 25 per mil (fig. 24). These values are within the range of δ34S of gypsum in the middle confining unit and modern seawater. This is consistent with geochemical evidence that gypsum dissolution and saltwater mixing are the dominant sources of sulfate in these downgradient waters.
In the intermediate aquifer system, δ34Ssulfate ranged from -8.0 to 31.0 per mil (fig. 24). The lightest value is from the most upgradient ground water (well 59). This indicates an isotopically light sulfur source, such as pyrite or sulfur-rich organic matter. Waters from the intermediate aquifer system in inland Sarasota County (wells 15, 25, 32, and 45) had δ34Ssulfate values that were lighter than marine sulfate (less than 20 per mil). These waters also had relatively low (less than 100 mg/L) sulfate concentrations, although the concentrations were considerably higher than in rainwater and in water from the surficial aqui-fer system (National Acid Deposition Pro-gram/National Trends Network, 1994; Duerr and Wolansky, 1986; Southwest Florida Water Manage-ment District, 1991). Thus, meteoric water is not a likely source of significant concentrations of sulfate. Iron also is elevated for these same intermediate aqui-fer system waters (greater than 30 µg/L), which implies that some of the sulfur could be from isotopi-cally light pyrite. Pyrite has been observed in the Hawthorn Group and surficial deposits in the study area, although sufficient quantities of fresh (unoxi-dized) sample could not be obtained for δ34S analysis. Pyrite oxidation would have to occur in the shallow part of the ground-water system, as waters from the intermediate aquifer system were all supersaturated with respect to pyrite.
Water from the intermediate aquifer system with high sulfate concentrations had δ34Ssulfate values within the range of gypsum and seawater (fig. 24).
These waters usually are at the end of flow paths in areas of upward leakage from the Upper Floridan aquifer. The sulfur isotope composition of these waters is indistinguishable from water from the Upper Floridan aquifer, indicating the same source of sulfate for both aquifers.
Waters from both the intermediate aquifer sys-tem and Upper Floridan aquifer that had δ34Ssulfate values in the range of marine sulfate (21 to 25 per mil) have sulfate from both seawater and sulfate mineral dissolution. These marine sources can be distin-guished by their δ34Ssulfate values. High sulfate, low chloride waters represent freshwater that dissolved gypsum. These freshwaters had δ34Ssulfate values between 23 and 25 per mil, which is isotopically heavier than the saline waters (fig. 25). This is within the range of evaporites from middle confining unit of the Avon Park Formation (average δ34S of 23.4 per mil). In contrast, gypsum from the Lower Floridan aquifer and the lower confining unit (Oldsmar and Cedar Keys Formations) had isotopically lighter δ34S values, with an average value of 20.1 per mil. This supports the hypothesis that the gypsum causing the high sulfate waters in the Upper Floridan aquifer is from the base of the Upper Floridan aquifer or the middle confining unit, rather than from the Lower Floridan aquifer or the lower confining unit.
As chloride concentrations (or fraction of sea-water) increase, δ34Ssulfate values become progres-
25
24
23
22
21
20200 500 1,000 2,000 5,00010,000 20,000 50,000
DE
LTA
SU
LFU
R-3
4 O
F
SU
LFA
TE, I
N P
ER
MIL gypsum dominated
sulfatesaltwater mixing
modernseawater
CHLORIDE CONCENTRATION,IN MILLIGRAMS PER LITER
EXPLANATION
Upper Floridan aquifer
Intermediate aquifer system
Figure 25. Relation between delta sulfur-34 of total sulfer and chloride concentration in water from the Upper Floridan aquifer and intermediate aquifer system with chloride concentration greater than 200 mg/L.
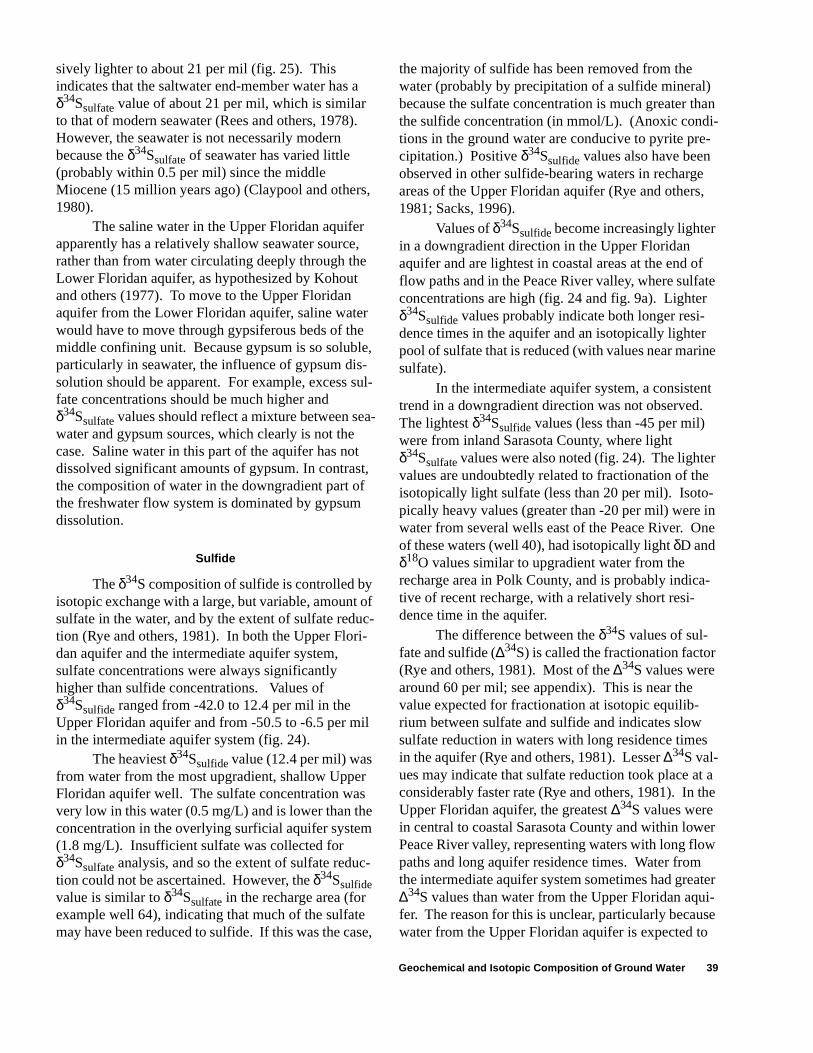
Geochemical and Isotopic Composition of Ground Water 39
sively lighter to about 21 per mil (fig. 25). This indicates that the saltwater end-member water has a δ34Ssulfate value of about 21 per mil, which is similar to that of modern seawater (Rees and others, 1978). However, the seawater is not necessarily modern because the δ34Ssulfate of seawater has varied little (probably within 0.5 per mil) since the middle Miocene (15 million years ago) (Claypool and others, 1980).
The saline water in the Upper Floridan aquifer apparently has a relatively shallow seawater source, rather than from water circulating deeply through the Lower Floridan aquifer, as hypothesized by Kohout and others (1977). To move to the Upper Floridan aquifer from the Lower Floridan aquifer, saline water would have to move through gypsiferous beds of the middle confining unit. Because gypsum is so soluble, particularly in seawater, the influence of gypsum dis-solution should be apparent. For example, excess sul-fate concentrations should be much higher and δ34Ssulfate values should reflect a mixture between sea-water and gypsum sources, which clearly is not the case. Saline water in this part of the aquifer has not dissolved significant amounts of gypsum. In contrast, the composition of water in the downgradient part of the freshwater flow system is dominated by gypsum dissolution.
Sulfide
The δ34S composition of sulfide is controlled by isotopic exchange with a large, but variable, amount of sulfate in the water, and by the extent of sulfate reduc-tion (Rye and others, 1981). In both the Upper Flori-dan aquifer and the intermediate aquifer system, sulfate concentrations were always significantly higher than sulfide concentrations. Values of δ34Ssulfide ranged from -42.0 to 12.4 per mil in the Upper Floridan aquifer and from -50.5 to -6.5 per mil in the intermediate aquifer system (fig. 24).
The heaviest δ34Ssulfide value (12.4 per mil) was from water from the most upgradient, shallow Upper Floridan aquifer well. The sulfate concentration was very low in this water (0.5 mg/L) and is lower than the concentration in the overlying surficial aquifer system (1.8 mg/L). Insufficient sulfate was collected for δ34Ssulfate analysis, and so the extent of sulfate reduc-tion could not be ascertained. However, the δ34Ssulfide value is similar to δ34Ssulfate in the recharge area (for example well 64), indicating that much of the sulfate may have been reduced to sulfide. If this was the case,
the majority of sulfide has been removed from the water (probably by precipitation of a sulfide mineral) because the sulfate concentration is much greater than the sulfide concentration (in mmol/L). (Anoxic condi-tions in the ground water are conducive to pyrite pre-cipitation.) Positive δ34Ssulfide values also have been observed in other sulfide-bearing waters in recharge areas of the Upper Floridan aquifer (Rye and others, 1981; Sacks, 1996).
Values of δ34Ssulfide become increasingly lighter in a downgradient direction in the Upper Floridan aquifer and are lightest in coastal areas at the end of flow paths and in the Peace River valley, where sulfate concentrations are high (fig. 24 and fig. 9a). Lighter δ34Ssulfide values probably indicate both longer resi-dence times in the aquifer and an isotopically lighter pool of sulfate that is reduced (with values near marine sulfate).
In the intermediate aquifer system, a consistent trend in a downgradient direction was not observed. The lightest δ34Ssulfide values (less than -45 per mil) were from inland Sarasota County, where light δ34Ssulfate values were also noted (fig. 24). The lighter values are undoubtedly related to fractionation of the isotopically light sulfate (less than 20 per mil). Isoto-pically heavy values (greater than -20 per mil) were in water from several wells east of the Peace River. One of these waters (well 40), had isotopically light δD and δ18O values similar to upgradient water from the recharge area in Polk County, and is probably indica-tive of recent recharge, with a relatively short resi-dence time in the aquifer.
The difference between the δ34S values of sul-fate and sulfide (∆34S) is called the fractionation factor (Rye and others, 1981). Most of the ∆34S values were around 60 per mil; see appendix). This is near the value expected for fractionation at isotopic equilib-rium between sulfate and sulfide and indicates slow sulfate reduction in waters with long residence times in the aquifer (Rye and others, 1981). Lesser ∆34S val-ues may indicate that sulfate reduction took place at a considerably faster rate (Rye and others, 1981). In the Upper Floridan aquifer, the greatest ∆34S values were in central to coastal Sarasota County and within lower Peace River valley, representing waters with long flow paths and long aquifer residence times. Water from the intermediate aquifer system sometimes had greater ∆34S values than water from the Upper Floridan aqui-fer. The reason for this is unclear, particularly because water from the Upper Floridan aquifer is expected to
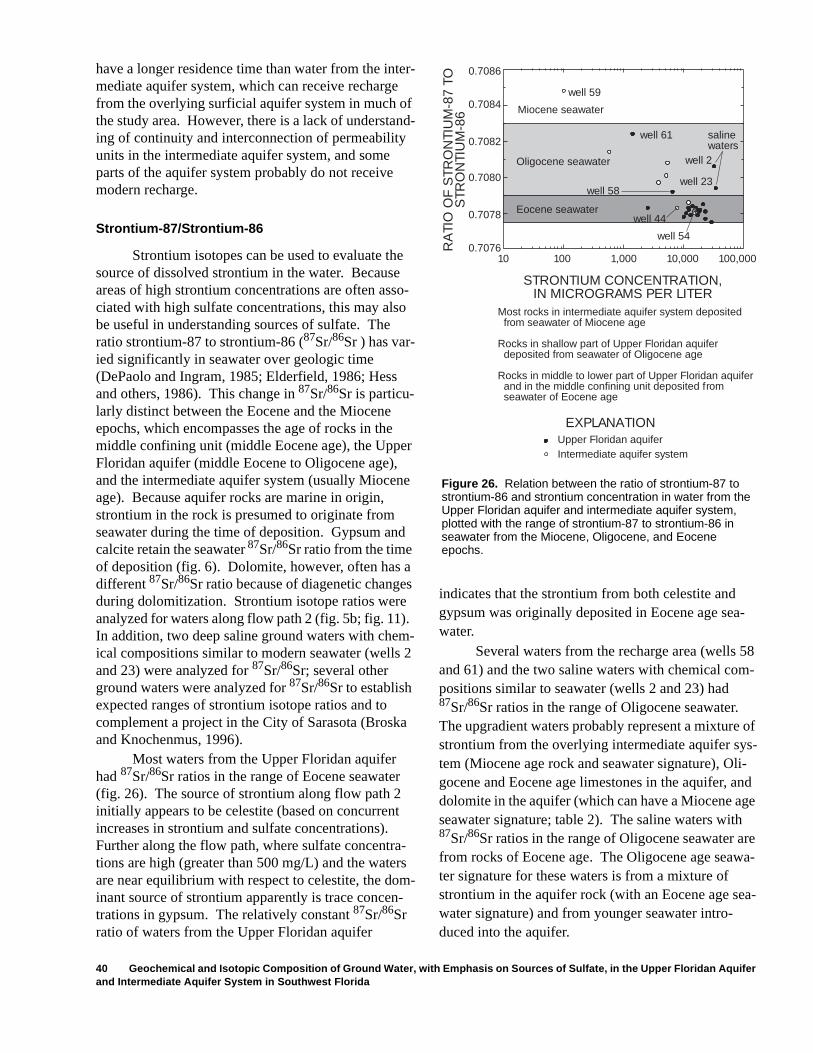
40 Geochemical and Isotopic Composition of Ground Water, with Emphasis on Sources of Sulfate, in the Upper Floridan Aquifer and Intermediate Aquifer System in Southwest Florida
have a longer residence time than water from the inter-mediate aquifer system, which can receive recharge from the overlying surficial aquifer system in much of the study area. However, there is a lack of understand-ing of continuity and interconnection of permeability units in the intermediate aquifer system, and some parts of the aquifer system probably do not receive modern recharge.
Strontium-87/Strontium-86
Strontium isotopes can be used to evaluate the source of dissolved strontium in the water. Because areas of high strontium concentrations are often asso-ciated with high sulfate concentrations, this may also be useful in understanding sources of sulfate. The ratio strontium-87 to strontium-86 (87Sr/86Sr ) has var-ied significantly in seawater over geologic time (DePaolo and Ingram, 1985; Elderfield, 1986; Hess and others, 1986). This change in 87Sr/86Sr is particu-larly distinct between the Eocene and the Miocene epochs, which encompasses the age of rocks in the middle confining unit (middle Eocene age), the Upper Floridan aquifer (middle Eocene to Oligocene age), and the intermediate aquifer system (usually Miocene age). Because aquifer rocks are marine in origin, strontium in the rock is presumed to originate from seawater during the time of deposition. Gypsum and calcite retain the seawater 87Sr/86Sr ratio from the time of deposition (fig. 6). Dolomite, however, often has a different 87Sr/86Sr ratio because of diagenetic changes during dolomitization. Strontium isotope ratios were analyzed for waters along flow path 2 (fig. 5b; fig. 11). In addition, two deep saline ground waters with chem-ical compositions similar to modern seawater (wells 2 and 23) were analyzed for 87Sr/86Sr; several other ground waters were analyzed for 87Sr/86Sr to establish expected ranges of strontium isotope ratios and to complement a project in the City of Sarasota (Broska and Knochenmus, 1996).
Most waters from the Upper Floridan aquifer had 87Sr/86Sr ratios in the range of Eocene seawater (fig. 26). The source of strontium along flow path 2 initially appears to be celestite (based on concurrent increases in strontium and sulfate concentrations). Further along the flow path, where sulfate concentra-tions are high (greater than 500 mg/L) and the waters are near equilibrium with respect to celestite, the dom-inant source of strontium apparently is trace concen-trations in gypsum. The relatively constant 87Sr/86Sr ratio of waters from the Upper Floridan aquifer
indicates that the strontium from both celestite and gypsum was originally deposited in Eocene age sea-water.
Several waters from the recharge area (wells 58 and 61) and the two saline waters with chemical com-positions similar to seawater (wells 2 and 23) had 87Sr/86Sr ratios in the range of Oligocene seawater. The upgradient waters probably represent a mixture of strontium from the overlying intermediate aquifer sys-tem (Miocene age rock and seawater signature), Oli-gocene and Eocene age limestones in the aquifer, and dolomite in the aquifer (which can have a Miocene age seawater signature; table 2). The saline waters with 87Sr/86Sr ratios in the range of Oligocene seawater are from rocks of Eocene age. The Oligocene age seawa-ter signature for these waters is from a mixture of strontium in the aquifer rock (with an Eocene age sea-water signature) and from younger seawater intro-duced into the aquifer.
Figure 26. Relation between the ratio of strontium-87 to strontium-86 and strontium concentration in water from the Upper Floridan aquifer and intermediate aquifer system, plotted with the range of strontium-87 to strontium-86 in seawater from the Miocene, Oligocene, and Eocene epochs.
0.7086
0.7084
0.7082
0.7080
0.7078
0.707610 100 1,000 10,000 100,000
RA
TIO
OF
STR
ON
TIU
M-8
7 TO
S
TRO
NTI
UM
-86
STRONTIUM CONCENTRATION,IN MICROGRAMS PER LITER
Eocene seawater
Oligocene seawater
Miocene seawater
well 59
well 61
well 58
well 2
well 23
salinewaters
well 44
well 54
Most rocks in intermediate aquifer system depositedfrom seawater of Miocene age
Rocks in shallow part of Upper Floridan aquifer deposited from seawater of Oligocene age
Rocks in middle to lower part of Upper Floridan aquiferand in the middle confining unit deposited fromseawater of Eocene age
EXPLANATIONUpper Floridan aquiferIntermediate aquifer system
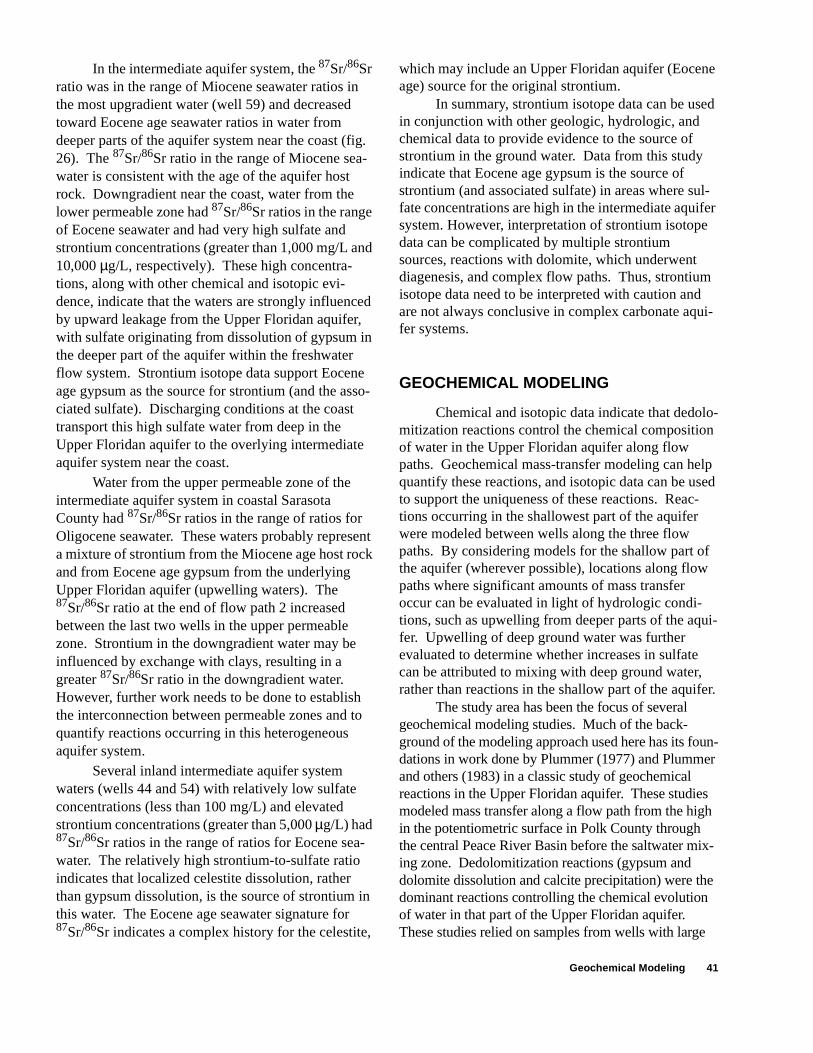
Geochemical Modeling 41
In the intermediate aquifer system, the 87Sr/86Sr ratio was in the range of Miocene seawater ratios in the most upgradient water (well 59) and decreased toward Eocene age seawater ratios in water from deeper parts of the aquifer system near the coast (fig. 26). The 87Sr/86Sr ratio in the range of Miocene sea-water is consistent with the age of the aquifer host rock. Downgradient near the coast, water from the lower permeable zone had 87Sr/86Sr ratios in the range of Eocene seawater and had very high sulfate and strontium concentrations (greater than 1,000 mg/L and 10,000 µg/L, respectively). These high concentra-tions, along with other chemical and isotopic evi-dence, indicate that the waters are strongly influenced by upward leakage from the Upper Floridan aquifer, with sulfate originating from dissolution of gypsum in the deeper part of the aquifer within the freshwater flow system. Strontium isotope data support Eocene age gypsum as the source for strontium (and the asso-ciated sulfate). Discharging conditions at the coast transport this high sulfate water from deep in the Upper Floridan aquifer to the overlying intermediate aquifer system near the coast.
Water from the upper permeable zone of the intermediate aquifer system in coastal Sarasota County had 87Sr/86Sr ratios in the range of ratios for Oligocene seawater. These waters probably represent a mixture of strontium from the Miocene age host rock and from Eocene age gypsum from the underlying Upper Floridan aquifer (upwelling waters). The 87Sr/86Sr ratio at the end of flow path 2 increased between the last two wells in the upper permeable zone. Strontium in the downgradient water may be influenced by exchange with clays, resulting in a greater 87Sr/86Sr ratio in the downgradient water. However, further work needs to be done to establish the interconnection between permeable zones and to quantify reactions occurring in this heterogeneous aquifer system.
Several inland intermediate aquifer system waters (wells 44 and 54) with relatively low sulfate concentrations (less than 100 mg/L) and elevated strontium concentrations (greater than 5,000 µg/L) had 87Sr/86Sr ratios in the range of ratios for Eocene sea-water. The relatively high strontium-to-sulfate ratio indicates that localized celestite dissolution, rather than gypsum dissolution, is the source of strontium in this water. The Eocene age seawater signature for 87Sr/86Sr indicates a complex history for the celestite,
which may include an Upper Floridan aquifer (Eocene age) source for the original strontium.
In summary, strontium isotope data can be used in conjunction with other geologic, hydrologic, and chemical data to provide evidence to the source of strontium in the ground water. Data from this study indicate that Eocene age gypsum is the source of strontium (and associated sulfate) in areas where sul-fate concentrations are high in the intermediate aquifer system. However, interpretation of strontium isotope data can be complicated by multiple strontium sources, reactions with dolomite, which underwent diagenesis, and complex flow paths. Thus, strontium isotope data need to be interpreted with caution and are not always conclusive in complex carbonate aqui-fer systems.
GEOCHEMICAL MODELING
Chemical and isotopic data indicate that dedolo-mitization reactions control the chemical composition of water in the Upper Floridan aquifer along flow paths. Geochemical mass-transfer modeling can help quantify these reactions, and isotopic data can be used to support the uniqueness of these reactions. Reac-tions occurring in the shallowest part of the aquifer were modeled between wells along the three flow paths. By considering models for the shallow part of the aquifer (wherever possible), locations along flow paths where significant amounts of mass transfer occur can be evaluated in light of hydrologic condi-tions, such as upwelling from deeper parts of the aqui-fer. Upwelling of deep ground water was further evaluated to determine whether increases in sulfate can be attributed to mixing with deep ground water, rather than reactions in the shallow part of the aquifer.
The study area has been the focus of several geochemical modeling studies. Much of the back-ground of the modeling approach used here has its foun-dations in work done by Plummer (1977) and Plummer and others (1983) in a classic study of geochemical reactions in the Upper Floridan aquifer. These studies modeled mass transfer along a flow path from the high in the potentiometric surface in Polk County through the central Peace River Basin before the saltwater mix-ing zone. Dedolomitization reactions (gypsum and dolomite dissolution and calcite precipitation) were the dominant reactions controlling the chemical evolution of water in that part of the Upper Floridan aquifer. These studies relied on samples from wells with large
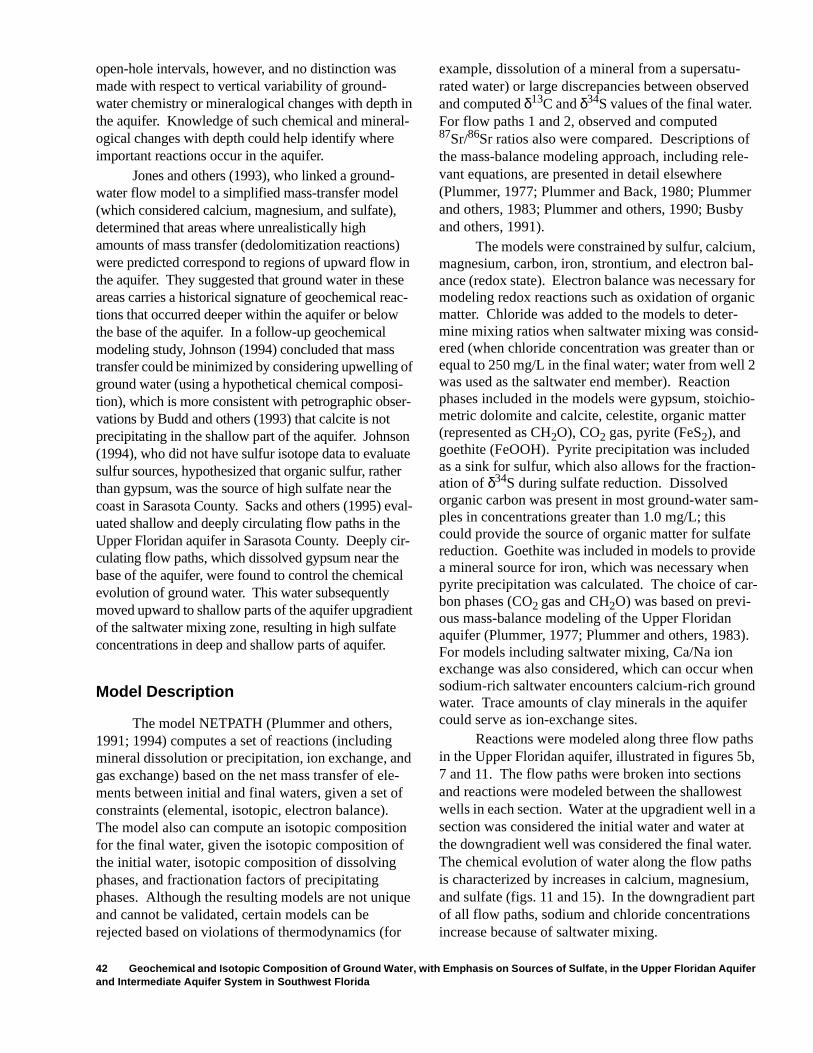
42 Geochemical and Isotopic Composition of Ground Water, with Emphasis on Sources of Sulfate, in the Upper Floridan Aquifer and Intermediate Aquifer System in Southwest Florida
open-hole intervals, however, and no distinction was made with respect to vertical variability of ground-water chemistry or mineralogical changes with depth in the aquifer. Knowledge of such chemical and mineral-ogical changes with depth could help identify where important reactions occur in the aquifer.
Jones and others (1993), who linked a ground-water flow model to a simplified mass-transfer model (which considered calcium, magnesium, and sulfate), determined that areas where unrealistically high amounts of mass transfer (dedolomitization reactions) were predicted correspond to regions of upward flow in the aquifer. They suggested that ground water in these areas carries a historical signature of geochemical reac-tions that occurred deeper within the aquifer or below the base of the aquifer. In a follow-up geochemical modeling study, Johnson (1994) concluded that mass transfer could be minimized by considering upwelling of ground water (using a hypothetical chemical composi-tion), which is more consistent with petrographic obser-vations by Budd and others (1993) that calcite is not precipitating in the shallow part of the aquifer. Johnson (1994), who did not have sulfur isotope data to evaluate sulfur sources, hypothesized that organic sulfur, rather than gypsum, was the source of high sulfate near the coast in Sarasota County. Sacks and others (1995) eval-uated shallow and deeply circulating flow paths in the Upper Floridan aquifer in Sarasota County. Deeply cir-culating flow paths, which dissolved gypsum near the base of the aquifer, were found to control the chemical evolution of ground water. This water subsequently moved upward to shallow parts of the aquifer upgradient of the saltwater mixing zone, resulting in high sulfate concentrations in deep and shallow parts of aquifer.
Model Description
The model NETPATH (Plummer and others, 1991; 1994) computes a set of reactions (including mineral dissolution or precipitation, ion exchange, and gas exchange) based on the net mass transfer of ele-ments between initial and final waters, given a set of constraints (elemental, isotopic, electron balance). The model also can compute an isotopic composition for the final water, given the isotopic composition of the initial water, isotopic composition of dissolving phases, and fractionation factors of precipitating phases. Although the resulting models are not unique and cannot be validated, certain models can be rejected based on violations of thermodynamics (for
example, dissolution of a mineral from a supersatu-rated water) or large discrepancies between observed and computed δ13C and δ34S values of the final water. For flow paths 1 and 2, observed and computed 87Sr/86Sr ratios also were compared. Descriptions of the mass-balance modeling approach, including rele-vant equations, are presented in detail elsewhere (Plummer, 1977; Plummer and Back, 1980; Plummer and others, 1983; Plummer and others, 1990; Busby and others, 1991).
The models were constrained by sulfur, calcium, magnesium, carbon, iron, strontium, and electron bal-ance (redox state). Electron balance was necessary for modeling redox reactions such as oxidation of organic matter. Chloride was added to the models to deter-mine mixing ratios when saltwater mixing was consid-ered (when chloride concentration was greater than or equal to 250 mg/L in the final water; water from well 2 was used as the saltwater end member). Reaction phases included in the models were gypsum, stoichio-metric dolomite and calcite, celestite, organic matter (represented as CH2O), CO2 gas, pyrite (FeS2), and goethite (FeOOH). Pyrite precipitation was included as a sink for sulfur, which also allows for the fraction-ation of δ34S during sulfate reduction. Dissolved organic carbon was present in most ground-water sam-ples in concentrations greater than 1.0 mg/L; this could provide the source of organic matter for sulfate reduction. Goethite was included in models to provide a mineral source for iron, which was necessary when pyrite precipitation was calculated. The choice of car-bon phases (CO2 gas and CH2O) was based on previ-ous mass-balance modeling of the Upper Floridan aquifer (Plummer, 1977; Plummer and others, 1983). For models including saltwater mixing, Ca/Na ion exchange was also considered, which can occur when sodium-rich saltwater encounters calcium-rich ground water. Trace amounts of clay minerals in the aquifer could serve as ion-exchange sites.
Reactions were modeled along three flow paths in the Upper Floridan aquifer, illustrated in figures 5b, 7 and 11. The flow paths were broken into sections and reactions were modeled between the shallowest wells in each section. Water at the upgradient well in a section was considered the initial water and water at the downgradient well was considered the final water. The chemical evolution of water along the flow paths is characterized by increases in calcium, magnesium, and sulfate (figs. 11 and 15). In the downgradient part of all flow paths, sodium and chloride concentrations increase because of saltwater mixing.
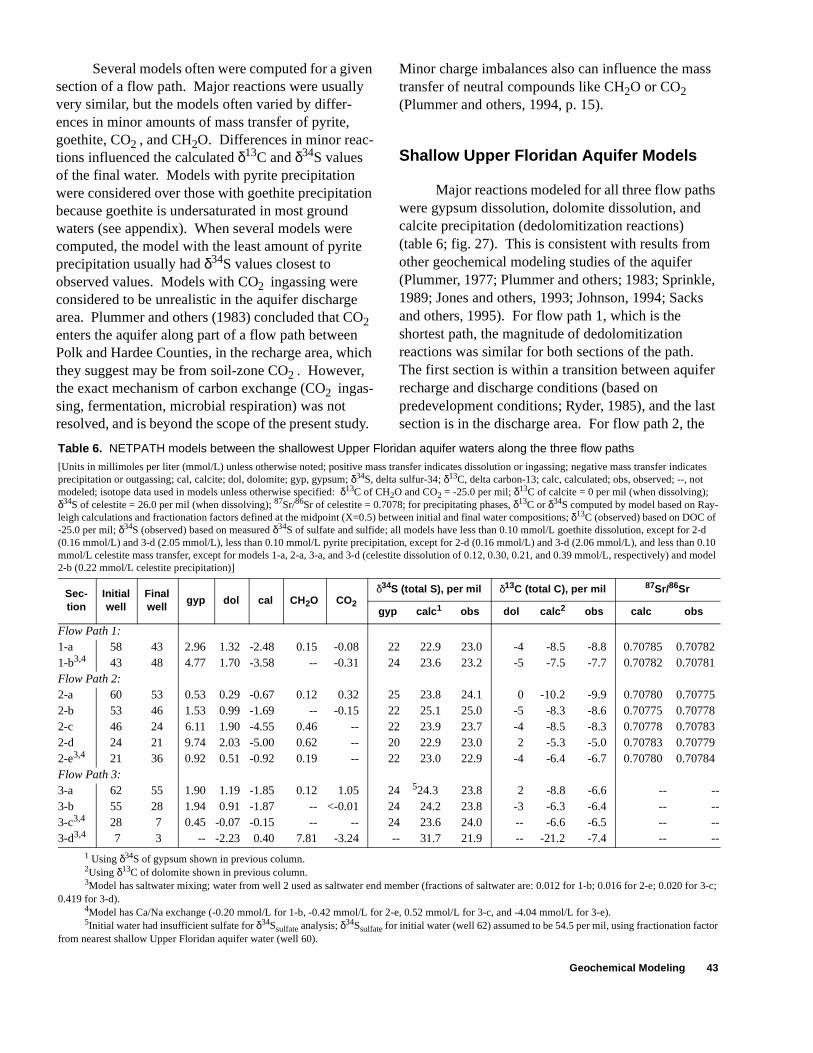
Geochemical Modeling 43
Several models often were computed for a given section of a flow path. Major reactions were usually very similar, but the models often varied by differ-ences in minor amounts of mass transfer of pyrite, goethite, CO2 , and CH2O. Differences in minor reac-tions influenced the calculated δ13C and δ34S values of the final water. Models with pyrite precipitation were considered over those with goethite precipitation because goethite is undersaturated in most ground waters (see appendix). When several models were computed, the model with the least amount of pyrite precipitation usually had δ34S values closest to observed values. Models with CO2 ingassing were considered to be unrealistic in the aquifer discharge area. Plummer and others (1983) concluded that CO2 enters the aquifer along part of a flow path between Polk and Hardee Counties, in the recharge area, which they suggest may be from soil-zone CO2 . However, the exact mechanism of carbon exchange (CO2 ingas-sing, fermentation, microbial respiration) was not resolved, and is beyond the scope of the present study.
Minor charge imbalances also can influence the mass transfer of neutral compounds like CH2O or CO2 (Plummer and others, 1994, p. 15).
Shallow Upper Floridan Aquifer Models
Major reactions modeled for all three flow paths were gypsum dissolution, dolomite dissolution, and calcite precipitation (dedolomitization reactions) (table 6; fig. 27). This is consistent with results from other geochemical modeling studies of the aquifer (Plummer, 1977; Plummer and others; 1983; Sprinkle, 1989; Jones and others, 1993; Johnson, 1994; Sacks and others, 1995). For flow path 1, which is the shortest path, the magnitude of dedolomitization reactions was similar for both sections of the path. The first section is within a transition between aquifer recharge and discharge conditions (based on predevelopment conditions; Ryder, 1985), and the last section is in the discharge area. For flow path 2, the
Table 6. NETPATH models between the shallowest Upper Floridan aquifer waters along the three flow paths
[Units in millimoles per liter (mmol/L) unless otherwise noted; positive mass transfer indicates dissolution or ingassing; negative mass transfer indicates precipitation or outgassing; cal, calcite; dol, dolomite; gyp, gypsum; δ34S, delta sulfur-34; δ13C, delta carbon-13; calc, calculated; obs, observed; --, not modeled; isotope data used in models unless otherwise specified: δ13C of CH2O and CO2 = -25.0 per mil; δ13C of calcite = 0 per mil (when dissolving); δ34S of celestite = 26.0 per mil (when dissolving); 87Sr/86Sr of celestite = 0.7078; for precipitating phases, δ13C or δ34S computed by model based on Ray-leigh calculations and fractionation factors defined at the midpoint (X=0.5) between initial and final water compositions; δ13C (observed) based on DOC of -25.0 per mil; δ34S (observed) based on measured δ34S of sulfate and sulfide; all models have less than 0.10 mmol/L goethite dissolution, except for 2-d (0.16 mmol/L) and 3-d (2.05 mmol/L), less than 0.10 mmol/L pyrite precipitation, except for 2-d (0.16 mmol/L) and 3-d (2.06 mmol/L), and less than 0.10 mmol/L celestite mass transfer, except for models 1-a, 2-a, 3-a, and 3-d (celestite dissolution of 0.12, 0.30, 0.21, and 0.39 mmol/L, respectively) and model 2-b (0.22 mmol/L celestite precipitation)]
Sec-tion
Initialwell
Finalwell
gyp dol cal CH2O CO2
δ34S (total S), per mil δ13C (total C), per mil 87Sr/86Sr
gyp calc1
1 Using δ34S of gypsum shown in previous column.
obs dol calc2
2Using δ13C of dolomite shown in previous column.
obs calc obs
Flow Path 1:1-a 58 43 2.96 1.32 -2.48 0.15 -0.08 22 22.9 23.0 -4 -8.5 -8.8 0.70785 0.707821-b3,4
3Model has saltwater mixing; water from well 2 used as saltwater end member (fractions of saltwater are: 0.012 for 1-b; 0.016 for 2-e; 0.020 for 3-c; 0.419 for 3-d).
4Model has Ca/Na exchange (-0.20 mmol/L for 1-b, -0.42 mmol/L for 2-e, 0.52 mmol/L for 3-c, and -4.04 mmol/L for 3-e).
43 48 4.77 1.70 -3.58 -- -0.31 24 23.6 23.2 -5 -7.5 -7.7 0.70782 0.70781Flow Path 2:2-a 60 53 0.53 0.29 -0.67 0.12 0.32 25 23.8 24.1 0 -10.2 -9.9 0.70780 0.707752-b 53 46 1.53 0.99 -1.69 -- -0.15 22 25.1 25.0 -5 -8.3 -8.6 0.70775 0.707782-c 46 24 6.11 1.90 -4.55 0.46 -- 22 23.9 23.7 -4 -8.5 -8.3 0.70778 0.707832-d 24 21 9.74 2.03 -5.00 0.62 -- 20 22.9 23.0 2 -5.3 -5.0 0.70783 0.707792-e3,4 21 36 0.92 0.51 -0.92 0.19 -- 22 23.0 22.9 -4 -6.4 -6.7 0.70780 0.70784Flow Path 3:3-a 62 55 1.90 1.19 -1.85 0.12 1.05 24 524.3
5Initial water had insufficient sulfate for δ34Ssulfate analysis; δ34Ssulfate for initial water (well 62) assumed to be 54.5 per mil, using fractionation factor from nearest shallow Upper Floridan aquifer water (well 60).
23.8 2 -8.8 -6.6 -- --3-b 55 28 1.94 0.91 -1.87 -- <-0.01 24 24.2 23.8 -3 -6.3 -6.4 -- --3-c3,4 28 7 0.45 -0.07 -0.15 -- -- 24 23.6 24.0 -- -6.6 -6.5 -- --3-d3,4 7 3 -- -2.23 0.40 7.81 -3.24 -- 31.7 21.9 -- -21.2 -7.4 -- --
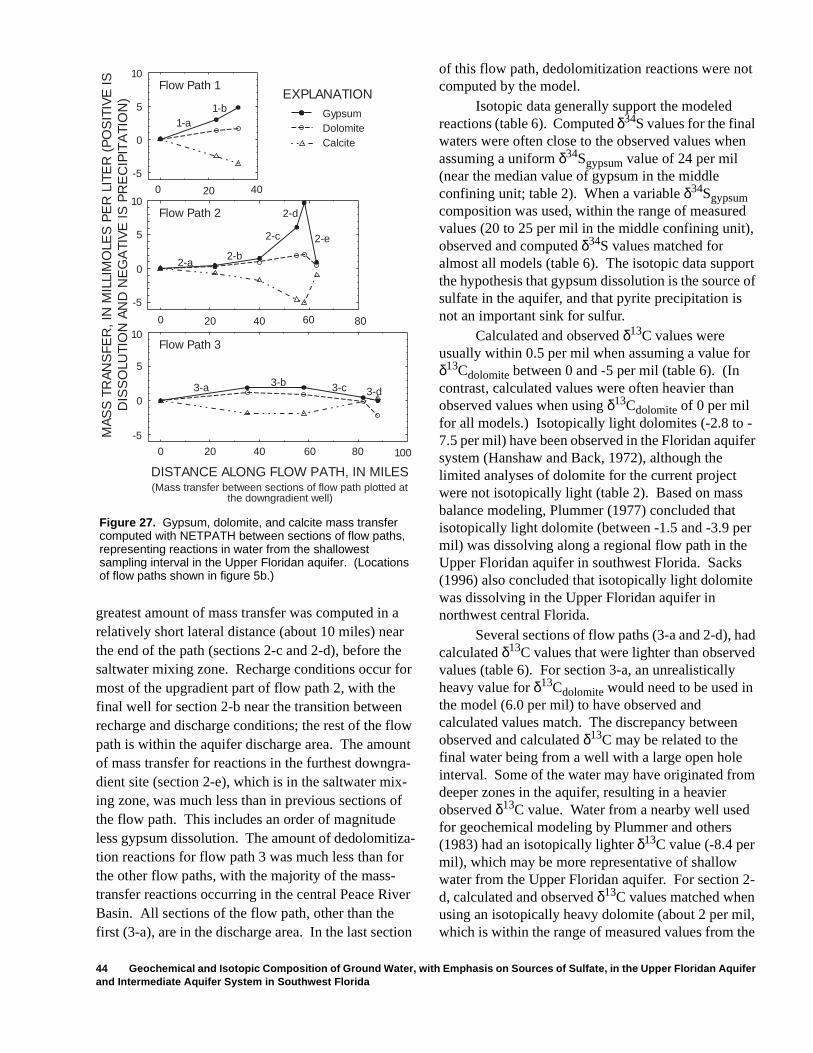
44 Geochemical and Isotopic Composition of Ground Water, with Emphasis on Sources of Sulfate, in the Upper Floridan Aquifer and Intermediate Aquifer System in Southwest Florida
greatest amount of mass transfer was computed in a relatively short lateral distance (about 10 miles) near the end of the path (sections 2-c and 2-d), before the saltwater mixing zone. Recharge conditions occur for most of the upgradient part of flow path 2, with the final well for section 2-b near the transition between recharge and discharge conditions; the rest of the flow path is within the aquifer discharge area. The amount of mass transfer for reactions in the furthest downgra-dient site (section 2-e), which is in the saltwater mix-ing zone, was much less than in previous sections of the flow path. This includes an order of magnitude less gypsum dissolution. The amount of dedolomitiza-tion reactions for flow path 3 was much less than for the other flow paths, with the majority of the mass-transfer reactions occurring in the central Peace River Basin. All sections of the flow path, other than the first (3-a), are in the discharge area. In the last section
of this flow path, dedolomitization reactions were not computed by the model.
Isotopic data generally support the modeled reactions (table 6). Computed δ34S values for the final waters were often close to the observed values when assuming a uniform δ34Sgypsum value of 24 per mil (near the median value of gypsum in the middle confining unit; table 2). When a variable δ34Sgypsum composition was used, within the range of measured values (20 to 25 per mil in the middle confining unit), observed and computed δ34S values matched for almost all models (table 6). The isotopic data support the hypothesis that gypsum dissolution is the source of sulfate in the aquifer, and that pyrite precipitation is not an important sink for sulfur.
Calculated and observed δ13C values were usually within 0.5 per mil when assuming a value for δ13Cdolomite between 0 and -5 per mil (table 6). (In contrast, calculated values were often heavier than observed values when using δ13Cdolomite of 0 per mil for all models.) Isotopically light dolomites (-2.8 to -7.5 per mil) have been observed in the Floridan aquifer system (Hanshaw and Back, 1972), although the limited analyses of dolomite for the current project were not isotopically light (table 2). Based on mass balance modeling, Plummer (1977) concluded that isotopically light dolomite (between -1.5 and -3.9 per mil) was dissolving along a regional flow path in the Upper Floridan aquifer in southwest Florida. Sacks (1996) also concluded that isotopically light dolomite was dissolving in the Upper Floridan aquifer in northwest central Florida.
Several sections of flow paths (3-a and 2-d), had calculated δ13C values that were lighter than observed values (table 6). For section 3-a, an unrealistically heavy value for δ13Cdolomite would need to be used in the model (6.0 per mil) to have observed and calculated values match. The discrepancy between observed and calculated δ13C may be related to the final water being from a well with a large open hole interval. Some of the water may have originated from deeper zones in the aquifer, resulting in a heavier observed δ13C value. Water from a nearby well used for geochemical modeling by Plummer and others (1983) had an isotopically lighter δ13C value (-8.4 per mil), which may be more representative of shallow water from the Upper Floridan aquifer. For section 2-d, calculated and observed δ13C values matched when using an isotopically heavy dolomite (about 2 per mil, which is within the range of measured values from the
10
5
0
-5
0 20 40
Flow Path 1
1-a1-b
10
5
0
-5
Flow Path 2
2-a2-b
2-c
2-d
2-e
0 20 40 60 8010
5
0
-5
0 20 40 60 80
Flow Path 3
3-a 3-b 3-c 3-d
100
MA
SS
TR
AN
SFE
R, I
N M
ILLI
MO
LES
PE
R L
ITE
R (
PO
SIT
IVE
ISD
ISS
OLU
TIO
N A
ND
NE
GA
TIV
E IS
PR
EC
IPIT
ATI
ON
)
DISTANCE ALONG FLOW PATH, IN MILES(Mass transfer between sections of flow path plotted at
the downgradient well)
GypsumDolomiteCalcite
EXPLANATION
Figure 27. Gypsum, dolomite, and calcite mass transfer computed with NETPATH between sections of flow paths, representing reactions in water from the shallowest sampling interval in the Upper Floridan aquifer. (Locations of flow paths shown in figure 5b.)
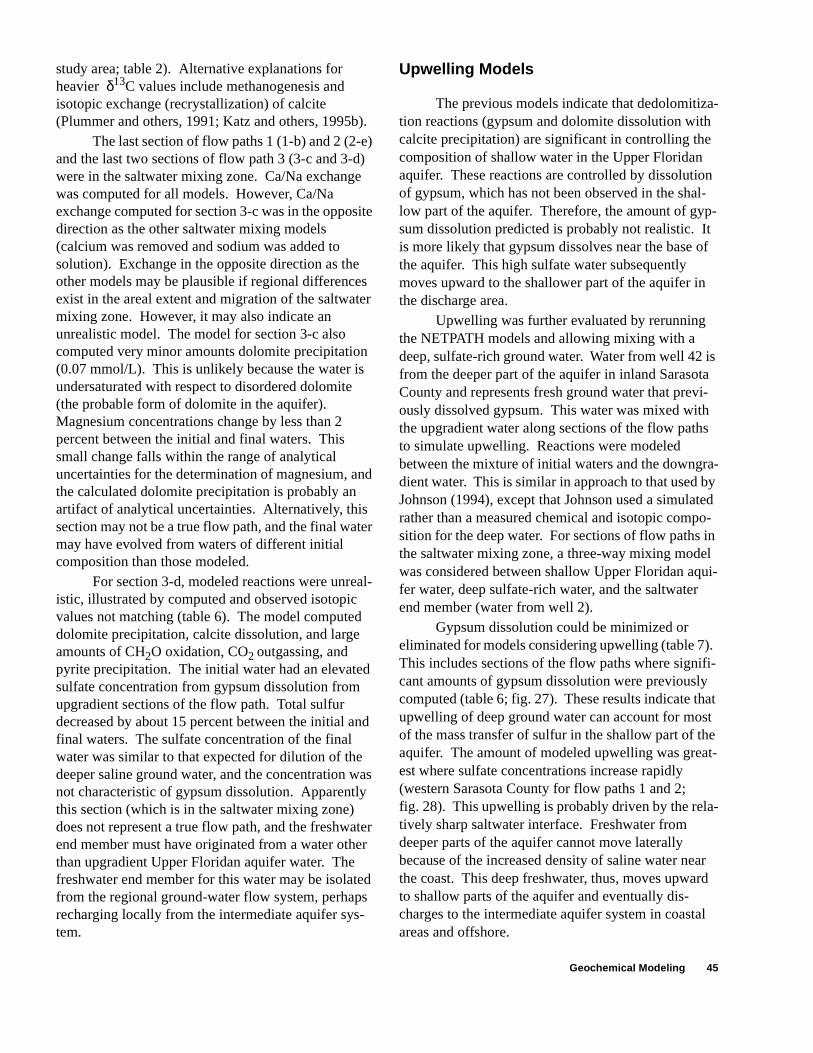
Geochemical Modeling 45
study area; table 2). Alternative explanations for heavier δ13C values include methanogenesis and isotopic exchange (recrystallization) of calcite (Plummer and others, 1991; Katz and others, 1995b).
The last section of flow paths 1 (1-b) and 2 (2-e) and the last two sections of flow path 3 (3-c and 3-d) were in the saltwater mixing zone. Ca/Na exchange was computed for all models. However, Ca/Na exchange computed for section 3-c was in the opposite direction as the other saltwater mixing models (calcium was removed and sodium was added to solution). Exchange in the opposite direction as the other models may be plausible if regional differences exist in the areal extent and migration of the saltwater mixing zone. However, it may also indicate an unrealistic model. The model for section 3-c also computed very minor amounts dolomite precipitation (0.07 mmol/L). This is unlikely because the water is undersaturated with respect to disordered dolomite (the probable form of dolomite in the aquifer). Magnesium concentrations change by less than 2 percent between the initial and final waters. This small change falls within the range of analytical uncertainties for the determination of magnesium, and the calculated dolomite precipitation is probably an artifact of analytical uncertainties. Alternatively, this section may not be a true flow path, and the final water may have evolved from waters of different initial composition than those modeled.
For section 3-d, modeled reactions were unreal-istic, illustrated by computed and observed isotopic values not matching (table 6). The model computed dolomite precipitation, calcite dissolution, and large amounts of CH2O oxidation, CO2 outgassing, and pyrite precipitation. The initial water had an elevated sulfate concentration from gypsum dissolution from upgradient sections of the flow path. Total sulfur decreased by about 15 percent between the initial and final waters. The sulfate concentration of the final water was similar to that expected for dilution of the deeper saline ground water, and the concentration was not characteristic of gypsum dissolution. Apparently this section (which is in the saltwater mixing zone) does not represent a true flow path, and the freshwater end member must have originated from a water other than upgradient Upper Floridan aquifer water. The freshwater end member for this water may be isolated from the regional ground-water flow system, perhaps recharging locally from the intermediate aquifer sys-tem.
Upwelling Models
The previous models indicate that dedolomitiza-tion reactions (gypsum and dolomite dissolution with calcite precipitation) are significant in controlling the composition of shallow water in the Upper Floridan aquifer. These reactions are controlled by dissolution of gypsum, which has not been observed in the shal-low part of the aquifer. Therefore, the amount of gyp-sum dissolution predicted is probably not realistic. It is more likely that gypsum dissolves near the base of the aquifer. This high sulfate water subsequently moves upward to the shallower part of the aquifer in the discharge area.
Upwelling was further evaluated by rerunning the NETPATH models and allowing mixing with a deep, sulfate-rich ground water. Water from well 42 is from the deeper part of the aquifer in inland Sarasota County and represents fresh ground water that previ-ously dissolved gypsum. This water was mixed with the upgradient water along sections of the flow paths to simulate upwelling. Reactions were modeled between the mixture of initial waters and the downgra-dient water. This is similar in approach to that used by Johnson (1994), except that Johnson used a simulated rather than a measured chemical and isotopic compo-sition for the deep water. For sections of flow paths in the saltwater mixing zone, a three-way mixing model was considered between shallow Upper Floridan aqui-fer water, deep sulfate-rich water, and the saltwater end member (water from well 2).
Gypsum dissolution could be minimized or eliminated for models considering upwelling (table 7). This includes sections of the flow paths where signifi-cant amounts of gypsum dissolution were previously computed (table 6; fig. 27). These results indicate that upwelling of deep ground water can account for most of the mass transfer of sulfur in the shallow part of the aquifer. The amount of modeled upwelling was great-est where sulfate concentrations increase rapidly (western Sarasota County for flow paths 1 and 2; fig. 28). This upwelling is probably driven by the rela-tively sharp saltwater interface. Freshwater from deeper parts of the aquifer cannot move laterally because of the increased density of saline water near the coast. This deep freshwater, thus, moves upward to shallow parts of the aquifer and eventually dis-charges to the intermediate aquifer system in coastal areas and offshore.
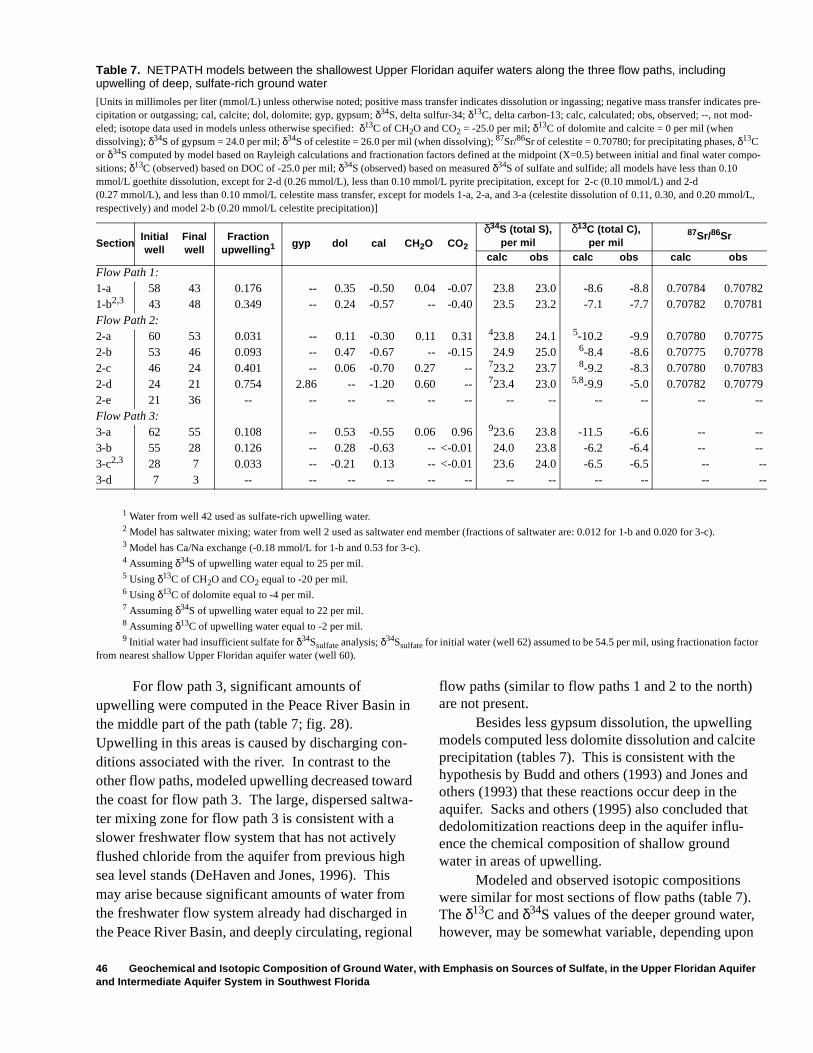
46 Geochemical and Isotopic Composition of Ground Water, with Emphasis on Sources of Sulfate, in the Upper Floridan Aquifer and Intermediate Aquifer System in Southwest Florida
1 Water from well 42 used as sulfate-rich upwelling water.2 Model has saltwater mixing; water from well 2 used as saltwater end member (fractions of saltwater are: 0.012 for 1-b and 0.020 for 3-c).3 Model has Ca/Na exchange (-0.18 mmol/L for 1-b and 0.53 for 3-c).4 Assuming δ34S of upwelling water equal to 25 per mil.5 Using δ13C of CH2O and CO2 equal to -20 per mil.6 Using δ13C of dolomite equal to -4 per mil.7 Assuming δ34S of upwelling water equal to 22 per mil.8 Assuming δ13C of upwelling water equal to -2 per mil.9 Initial water had insufficient sulfate for δ34Ssulfate analysis; δ34Ssulfate for initial water (well 62) assumed to be 54.5 per mil, using fractionation factor
from nearest shallow Upper Floridan aquifer water (well 60).
Table 7. NETPATH models between the shallowest Upper Floridan aquifer waters along the three flow paths, including upwelling of deep, sulfate-rich ground water
[Units in millimoles per liter (mmol/L) unless otherwise noted; positive mass transfer indicates dissolution or ingassing; negative mass transfer indicates pre-cipitation or outgassing; cal, calcite; dol, dolomite; gyp, gypsum; δ34S, delta sulfur-34; δ13C, delta carbon-13; calc, calculated; obs, observed; --, not mod-eled; isotope data used in models unless otherwise specified: δ13C of CH2O and CO2 = -25.0 per mil; δ13C of dolomite and calcite = 0 per mil (when dissolving); δ34S of gypsum = 24.0 per mil; δ34S of celestite = 26.0 per mil (when dissolving); 87Sr/86Sr of celestite = 0.70780; for precipitating phases, δ13C or δ34S computed by model based on Rayleigh calculations and fractionation factors defined at the midpoint (X=0.5) between initial and final water compo-sitions; δ13C (observed) based on DOC of -25.0 per mil; δ34S (observed) based on measured δ34S of sulfate and sulfide; all models have less than 0.10 mmol/L goethite dissolution, except for 2-d (0.26 mmol/L), less than 0.10 mmol/L pyrite precipitation, except for 2-c (0.10 mmol/L) and 2-d(0.27 mmol/L), and less than 0.10 mmol/L celestite mass transfer, except for models 1-a, 2-a, and 3-a (celestite dissolution of 0.11, 0.30, and 0.20 mmol/L, respectively) and model 2-b (0.20 mmol/L celestite precipitation)]
SectionInitialwell
Finalwell
Fraction upwelling1 gyp dol cal CH2O CO2
δ34S (total S), per mil
δ13C (total C), per mil
87Sr/86Sr
calc obs calc obs calc obsFlow Path 1:1-a 58 43 0.176 -- 0.35 -0.50 0.04 -0.07 23.8 23.0 -8.6 -8.8 0.70784 0.707821-b2,3 43 48 0.349 -- 0.24 -0.57 -- -0.40 23.5 23.2 -7.1 -7.7 0.70782 0.70781Flow Path 2:2-a 60 53 0.031 -- 0.11 -0.30 0.11 0.31 423.8 24.1 5-10.2 -9.9 0.70780 0.707752-b 53 46 0.093 -- 0.47 -0.67 -- -0.15 24.9 25.0 6-8.4 -8.6 0.70775 0.707782-c 46 24 0.401 -- 0.06 -0.70 0.27 -- 723.2 23.7 8-9.2 -8.3 0.70780 0.707832-d 24 21 0.754 2.86 -- -1.20 0.60 -- 723.4 23.0 5,8-9.9 -5.0 0.70782 0.707792-e 21 36 -- -- -- -- -- -- -- -- -- -- -- --Flow Path 3:3-a 62 55 0.108 -- 0.53 -0.55 0.06 0.96 923.6 23.8 -11.5 -6.6 -- --3-b 55 28 0.126 -- 0.28 -0.63 -- <-0.01 24.0 23.8 -6.2 -6.4 -- --3-c2,3 28 7 0.033 -- -0.21 0.13 -- <-0.01 23.6 24.0 -6.5 -6.5 -- --3-d 7 3 -- -- -- -- -- -- -- -- -- -- -- --
For flow path 3, significant amounts of upwelling were computed in the Peace River Basin in the middle part of the path (table 7; fig. 28). Upwelling in this areas is caused by discharging con-ditions associated with the river. In contrast to the other flow paths, modeled upwelling decreased toward the coast for flow path 3. The large, dispersed saltwa-ter mixing zone for flow path 3 is consistent with a slower freshwater flow system that has not actively flushed chloride from the aquifer from previous high sea level stands (DeHaven and Jones, 1996). This may arise because significant amounts of water from the freshwater flow system already had discharged in the Peace River Basin, and deeply circulating, regional
flow paths (similar to flow paths 1 and 2 to the north) are not present.
Besides less gypsum dissolution, the upwelling models computed less dolomite dissolution and calcite precipitation (tables 7). This is consistent with the hypothesis by Budd and others (1993) and Jones and others (1993) that these reactions occur deep in the aquifer. Sacks and others (1995) also concluded that dedolomitization reactions deep in the aquifer influ-ence the chemical composition of shallow ground water in areas of upwelling.
Modeled and observed isotopic compositions were similar for most sections of flow paths (table 7). The δ13C and δ34S values of the deeper ground water, however, may be somewhat variable, depending upon
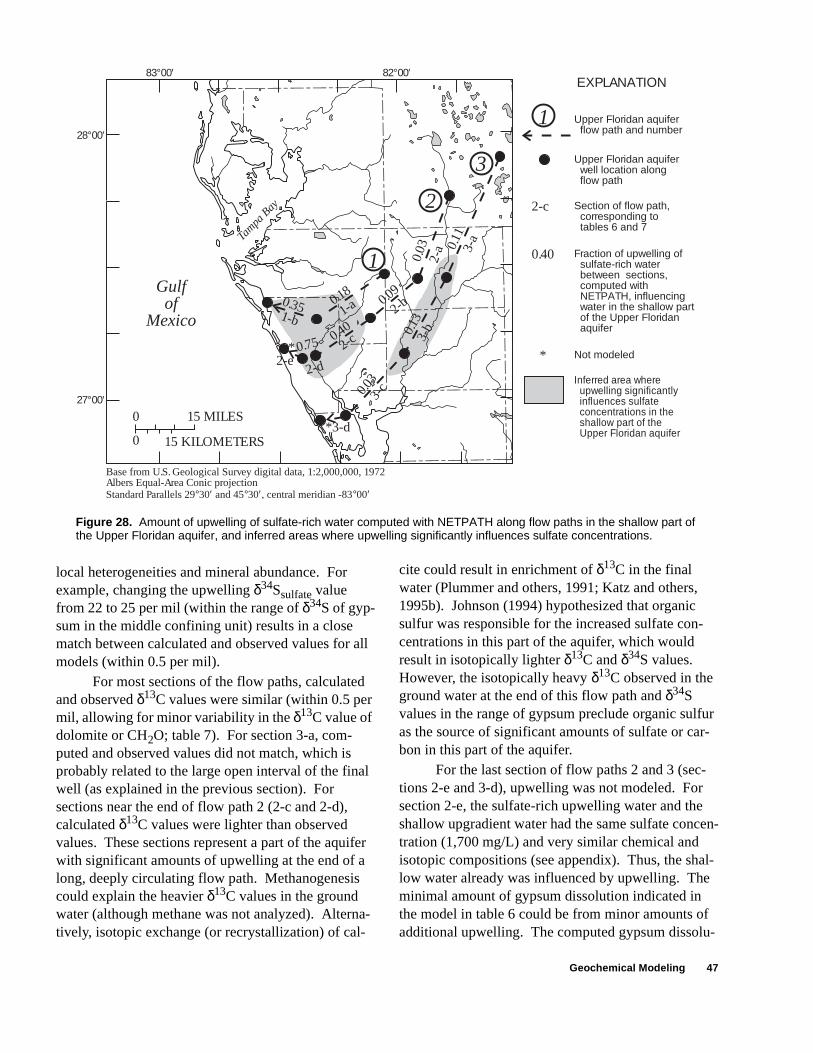
Geochemical Modeling 47
local heterogeneities and mineral abundance. For example, changing the upwelling δ34Ssulfate value from 22 to 25 per mil (within the range of δ34S of gyp-sum in the middle confining unit) results in a close match between calculated and observed values for all models (within 0.5 per mil).
For most sections of the flow paths, calculated and observed δ13C values were similar (within 0.5 per mil, allowing for minor variability in the δ13C value of dolomite or CH2O; table 7). For section 3-a, com-puted and observed values did not match, which is probably related to the large open interval of the final well (as explained in the previous section). For sections near the end of flow path 2 (2-c and 2-d), calculated δ13C values were lighter than observed values. These sections represent a part of the aquifer with significant amounts of upwelling at the end of a long, deeply circulating flow path. Methanogenesis could explain the heavier δ13C values in the ground water (although methane was not analyzed). Alterna-tively, isotopic exchange (or recrystallization) of cal-
Figure 28. Amount of upwelling of sulfate-rich water computed with NETPATH along flow paths in the shallow part of the Upper Floridan aquifer, and inferred areas where upwelling significantly influences sulfate concentrations.
Base from U.S. Geological Survey digital data, 1:2,000,000, 1972Albers Equal-Area Conic projectionStandard Parallels 29°30′ and 45°30′, central meridian -83°00′
EXPLANATION
Upper Floridan aquifer well location along flow path
83°00′ 82°00′
28°00′
27°00′0 15 MILES
15 KILOMETERS0
Gulfof
Mexico
Tam
pa B
ay
*
3-c0.03
3-b0.13
2-a
0.03
1-a0.18
1-b0.35 2-b0.09
2-c0.40
2-d
0.752-e
2-c
0.40
**
3-a
0.11
Upper Floridan aquifer flow path and number
Section of flow path,corresponding to tables 6 and 7
Not modeled
Fraction of upwelling ofsulfate-rich water between sections,computed withNETPATH, influencingwater in the shallow partof the Upper Floridanaquifer
Inferred area whereupwelling significantlyinfluences sulfateconcentrations in the shallow part of theUpper Floridan aquifer
1
1
2
3
3-d
cite could result in enrichment of δ13C in the final water (Plummer and others, 1991; Katz and others, 1995b). Johnson (1994) hypothesized that organic sulfur was responsible for the increased sulfate con-centrations in this part of the aquifer, which would result in isotopically lighter δ13C and δ34S values. However, the isotopically heavy δ13C observed in the ground water at the end of this flow path and δ34S values in the range of gypsum preclude organic sulfur as the source of significant amounts of sulfate or car-bon in this part of the aquifer.
For the last section of flow paths 2 and 3 (sec-tions 2-e and 3-d), upwelling was not modeled. For section 2-e, the sulfate-rich upwelling water and the shallow upgradient water had the same sulfate concen-tration (1,700 mg/L) and very similar chemical and isotopic compositions (see appendix). Thus, the shal-low water already was influenced by upwelling. The minimal amount of gypsum dissolution indicated in the model in table 6 could be from minor amounts of additional upwelling. The computed gypsum dissolu-
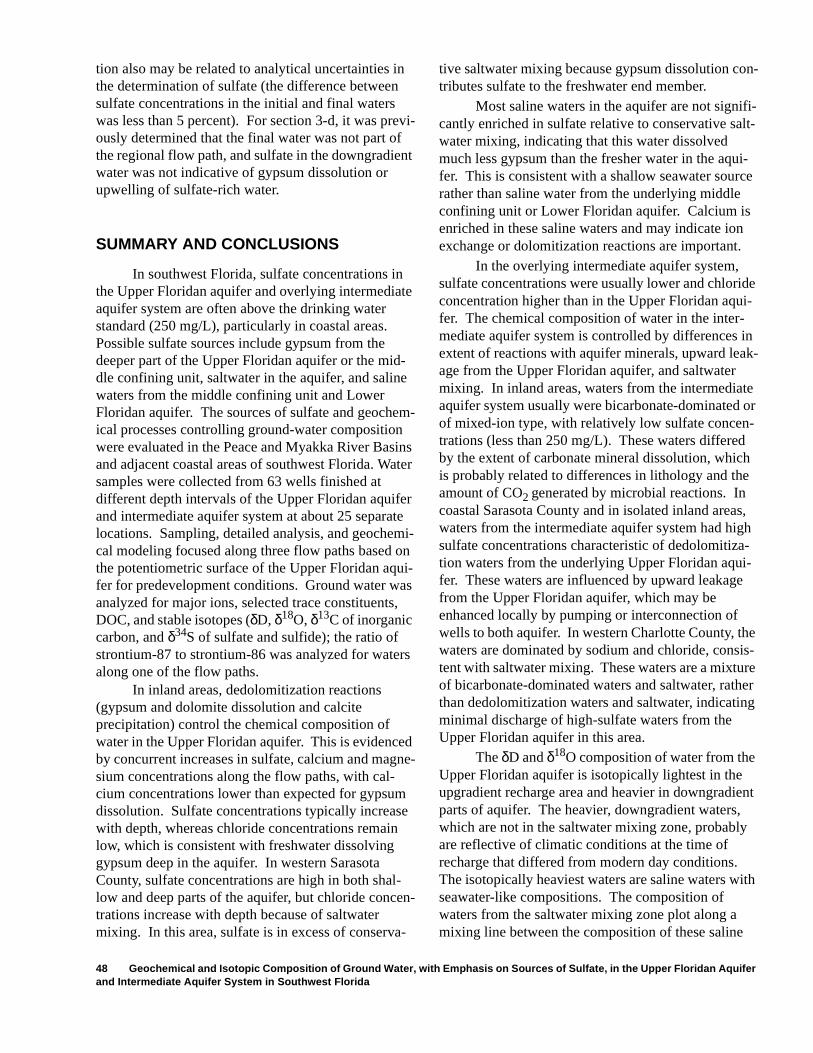
48 Geochemical and Isotopic Composition of Ground Water, with Emphasis on Sources of Sulfate, in the Upper Floridan Aquifer and Intermediate Aquifer System in Southwest Florida
tion also may be related to analytical uncertainties in the determination of sulfate (the difference between sulfate concentrations in the initial and final waters was less than 5 percent). For section 3-d, it was previ-ously determined that the final water was not part of the regional flow path, and sulfate in the downgradient water was not indicative of gypsum dissolution or upwelling of sulfate-rich water.
SUMMARY AND CONCLUSIONS
In southwest Florida, sulfate concentrations in the Upper Floridan aquifer and overlying intermediate aquifer system are often above the drinking water standard (250 mg/L), particularly in coastal areas. Possible sulfate sources include gypsum from the deeper part of the Upper Floridan aquifer or the mid-dle confining unit, saltwater in the aquifer, and saline waters from the middle confining unit and Lower Floridan aquifer. The sources of sulfate and geochem-ical processes controlling ground-water composition were evaluated in the Peace and Myakka River Basins and adjacent coastal areas of southwest Florida. Water samples were collected from 63 wells finished at different depth intervals of the Upper Floridan aquifer and intermediate aquifer system at about 25 separate locations. Sampling, detailed analysis, and geochemi-cal modeling focused along three flow paths based on the potentiometric surface of the Upper Floridan aqui-fer for predevelopment conditions. Ground water was analyzed for major ions, selected trace constituents, DOC, and stable isotopes (δD, δ18O, δ13C of inorganic carbon, and δ34S of sulfate and sulfide); the ratio of strontium-87 to strontium-86 was analyzed for waters along one of the flow paths.
In inland areas, dedolomitization reactions (gypsum and dolomite dissolution and calcite precipitation) control the chemical composition of water in the Upper Floridan aquifer. This is evidenced by concurrent increases in sulfate, calcium and magne-sium concentrations along the flow paths, with cal-cium concentrations lower than expected for gypsum dissolution. Sulfate concentrations typically increase with depth, whereas chloride concentrations remain low, which is consistent with freshwater dissolving gypsum deep in the aquifer. In western Sarasota County, sulfate concentrations are high in both shal-low and deep parts of the aquifer, but chloride concen-trations increase with depth because of saltwater mixing. In this area, sulfate is in excess of conserva-
tive saltwater mixing because gypsum dissolution con-tributes sulfate to the freshwater end member.
Most saline waters in the aquifer are not signifi-cantly enriched in sulfate relative to conservative salt-water mixing, indicating that this water dissolved much less gypsum than the fresher water in the aqui-fer. This is consistent with a shallow seawater source rather than saline water from the underlying middle confining unit or Lower Floridan aquifer. Calcium is enriched in these saline waters and may indicate ion exchange or dolomitization reactions are important.
In the overlying intermediate aquifer system, sulfate concentrations were usually lower and chloride concentration higher than in the Upper Floridan aqui-fer. The chemical composition of water in the inter-mediate aquifer system is controlled by differences in extent of reactions with aquifer minerals, upward leak-age from the Upper Floridan aquifer, and saltwater mixing. In inland areas, waters from the intermediate aquifer system usually were bicarbonate-dominated or of mixed-ion type, with relatively low sulfate concen-trations (less than 250 mg/L). These waters differed by the extent of carbonate mineral dissolution, which is probably related to differences in lithology and the amount of CO2 generated by microbial reactions. In coastal Sarasota County and in isolated inland areas, waters from the intermediate aquifer system had high sulfate concentrations characteristic of dedolomitiza-tion waters from the underlying Upper Floridan aqui-fer. These waters are influenced by upward leakage from the Upper Floridan aquifer, which may be enhanced locally by pumping or interconnection of wells to both aquifer. In western Charlotte County, the waters are dominated by sodium and chloride, consis-tent with saltwater mixing. These waters are a mixture of bicarbonate-dominated waters and saltwater, rather than dedolomitization waters and saltwater, indicating minimal discharge of high-sulfate waters from the Upper Floridan aquifer in this area.
The δD and δ18O composition of water from the Upper Floridan aquifer is isotopically lightest in the upgradient recharge area and heavier in downgradient parts of aquifer. The heavier, downgradient waters, which are not in the saltwater mixing zone, probably are reflective of climatic conditions at the time of recharge that differed from modern day conditions. The isotopically heaviest waters are saline waters with seawater-like compositions. The composition of waters from the saltwater mixing zone plot along a mixing line between the composition of these saline
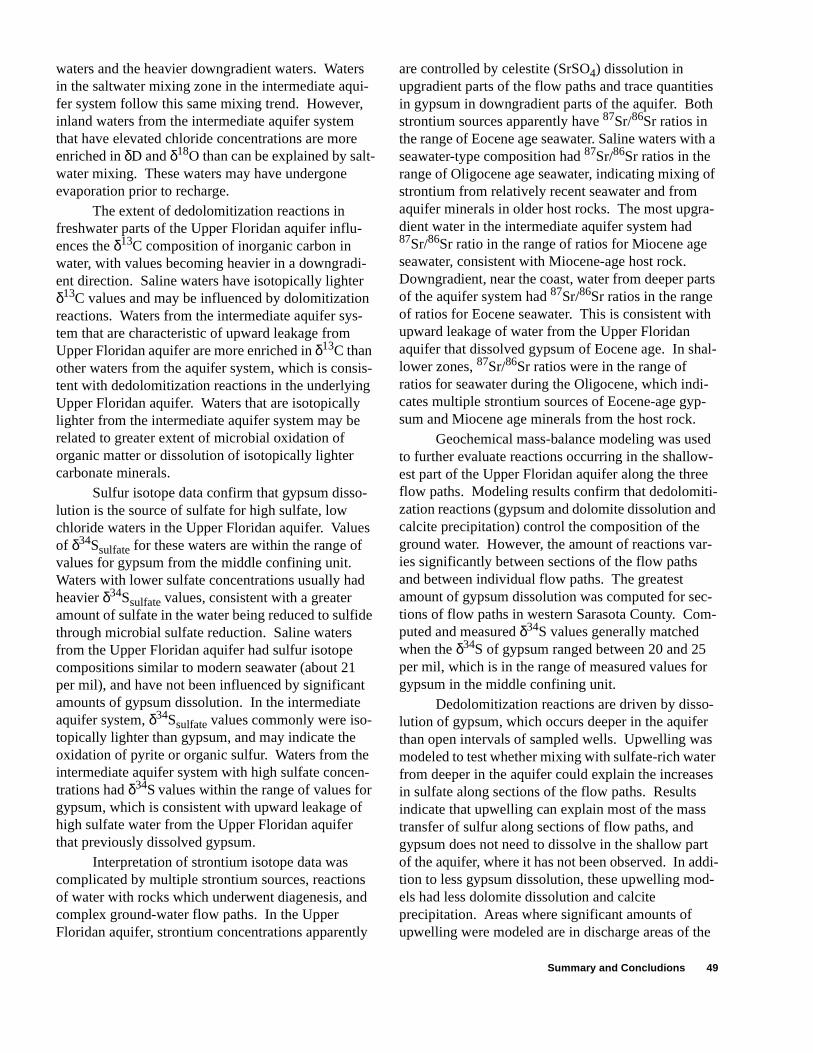
Summary and Concludions 49
waters and the heavier downgradient waters. Waters in the saltwater mixing zone in the intermediate aqui-fer system follow this same mixing trend. However, inland waters from the intermediate aquifer system that have elevated chloride concentrations are more enriched in δD and δ18O than can be explained by salt-water mixing. These waters may have undergone evaporation prior to recharge.
The extent of dedolomitization reactions in freshwater parts of the Upper Floridan aquifer influ-ences the δ13C composition of inorganic carbon in water, with values becoming heavier in a downgradi-ent direction. Saline waters have isotopically lighter δ13C values and may be influenced by dolomitization reactions. Waters from the intermediate aquifer sys-tem that are characteristic of upward leakage from Upper Floridan aquifer are more enriched in δ13C than other waters from the aquifer system, which is consis-tent with dedolomitization reactions in the underlying Upper Floridan aquifer. Waters that are isotopically lighter from the intermediate aquifer system may be related to greater extent of microbial oxidation of organic matter or dissolution of isotopically lighter carbonate minerals.
Sulfur isotope data confirm that gypsum disso-lution is the source of sulfate for high sulfate, low chloride waters in the Upper Floridan aquifer. Values of δ34Ssulfate for these waters are within the range of values for gypsum from the middle confining unit. Waters with lower sulfate concentrations usually had heavier δ34Ssulfate values, consistent with a greater amount of sulfate in the water being reduced to sulfide through microbial sulfate reduction. Saline waters from the Upper Floridan aquifer had sulfur isotope compositions similar to modern seawater (about 21 per mil), and have not been influenced by significant amounts of gypsum dissolution. In the intermediate aquifer system, δ34Ssulfate values commonly were iso-topically lighter than gypsum, and may indicate the oxidation of pyrite or organic sulfur. Waters from the intermediate aquifer system with high sulfate concen-trations had δ34S values within the range of values for gypsum, which is consistent with upward leakage of high sulfate water from the Upper Floridan aquifer that previously dissolved gypsum.
Interpretation of strontium isotope data was complicated by multiple strontium sources, reactions of water with rocks which underwent diagenesis, and complex ground-water flow paths. In the Upper Floridan aquifer, strontium concentrations apparently
are controlled by celestite (SrSO4) dissolution in upgradient parts of the flow paths and trace quantities in gypsum in downgradient parts of the aquifer. Both strontium sources apparently have 87Sr/86Sr ratios in the range of Eocene age seawater. Saline waters with a seawater-type composition had 87Sr/86Sr ratios in the range of Oligocene age seawater, indicating mixing of strontium from relatively recent seawater and from aquifer minerals in older host rocks. The most upgra-dient water in the intermediate aquifer system had 87Sr/86Sr ratio in the range of ratios for Miocene age seawater, consistent with Miocene-age host rock. Downgradient, near the coast, water from deeper parts of the aquifer system had 87Sr/86Sr ratios in the range of ratios for Eocene seawater. This is consistent with upward leakage of water from the Upper Floridan aquifer that dissolved gypsum of Eocene age. In shal-lower zones, 87Sr/86Sr ratios were in the range of ratios for seawater during the Oligocene, which indi-cates multiple strontium sources of Eocene-age gyp-sum and Miocene age minerals from the host rock.
Geochemical mass-balance modeling was used to further evaluate reactions occurring in the shallow-est part of the Upper Floridan aquifer along the three flow paths. Modeling results confirm that dedolomiti-zation reactions (gypsum and dolomite dissolution and calcite precipitation) control the composition of the ground water. However, the amount of reactions var-ies significantly between sections of the flow paths and between individual flow paths. The greatest amount of gypsum dissolution was computed for sec-tions of flow paths in western Sarasota County. Com-puted and measured δ34S values generally matched when the δ34S of gypsum ranged between 20 and 25 per mil, which is in the range of measured values for gypsum in the middle confining unit.
Dedolomitization reactions are driven by disso-lution of gypsum, which occurs deeper in the aquifer than open intervals of sampled wells. Upwelling was modeled to test whether mixing with sulfate-rich water from deeper in the aquifer could explain the increases in sulfate along sections of the flow paths. Results indicate that upwelling can explain most of the mass transfer of sulfur along sections of flow paths, and gypsum does not need to dissolve in the shallow part of the aquifer, where it has not been observed. In addi-tion to less gypsum dissolution, these upwelling mod-els had less dolomite dissolution and calcite precipitation. Areas where significant amounts of upwelling were modeled are in discharge areas of the
50 Geochemical and Isotopic Composition of Ground Water, with Emphasis on Sources of Sulfate, in the Upper Floridan Aquifer and Intermediate Aquifer System in Southwest Florida
Upper Floridan aquifer, where heads increase with depth making upward flow likely. The isotopic com-position of the upwelling water may vary slightly in the study area, and additional reactions involving car-bon may be occurring in some locations (recrystalliza-tion of calcite or methanogenesis).
Deeply circulating ground-water flow paths apparently control the high sulfate concentrations in the shallow part of the Upper Floridan aquifer in west-ern Sarasota County. In the recharge area, water moves downward to deep parts of the aquifer and dis-solves gypsum. This dissolution occurs within the freshwater flow system, rather than as diffusion or upward leakage of saline water from the middle con-fining unit or the Lower Floridan aquifer. Downgradi-ent, this sulfate-rich water moves upward to shallower parts of the aquifer and into the overlying intermediate aquifer system, prior to the saltwater mixing zone. In the vicinity of the Peace River, higher sulfate concen-trations are caused by upwelling because of discharg-ing conditions in the Upper Floridan aquifer. This discharge probably causes less freshwater to move toward the coast, and flow paths may not be as deep as in western Sarasota County, where sulfate concentra-tions are much higher. The freshwater end member for waters in the saltwater mixing zone in coastal Char-lotte County is not upgradient water from the Upper Floridan aquifer that dissolved gypsum. Instead, these waters appear to be isolated from the regional fresh-water flow system and may be part of a more localized flow system, with relict seawater from a past inunda-tion.
REFERENCES
Applin, P.L., and Applin, E.R., 1965, The Comanche Series and associated rocks in the subsurface in central and south Florida: U.S. Geological Survey Professional Paper 447, 84 p.
Aucott, W.R., 1988, Areal variation in recharge to and discharge from the Floridan aquifer system in Florida: U.S. Geological Survey Water-Resources Investigations Report 88-4057, 1 sheet.
Back, William, and Hanshaw, B.B., 1970, Comparison of chemical hydrogeology of the carbonate peninsulas of Florida and Yucatan: Journal of Hydrology, v. 10, p. 330-368.
Ball, J.W., and Nordstrom, D.K., 1991, User’s manual for WATEQ4F, with revised thermodynamic data base and test cases for calculating speciation of major, trace, and
redox elements in natural water: U.S. Geological Survey Open-File Report 91-183, 189 p.
Barr, G.L., 1996, Hydrogeology of the surficial and intermediate aquifer systems in Sarasota and adjacent Counties, Florida: U.S. Geological Survey Water Resources Investigations Report 96-4063.
Bennett, P., 1991, Quartz dissolution in organic-rich aqueous solutions: Geochimica Cosmochimica Acta, v. 5, p. 1781-1797.
Broska, J.C., and Knochenmus, L.A.,1996, Assessment of the hydrogeology and water quality in a near-shore wellfield, Sarasota, Florida: U.S. Geological Survey Water-Resources Investigations Report 96-4036, 64 p.
Buchardt, B. and Fritz, P., 1980, Environmental isotopes as environmental and climatological indicators, in Fritz, P. and Fontes, J.C., eds., Handbook of Environmental Isotope Geochemistry: Elsevier Scientific Publishing Company, Amsterdam, p. 473-504.
Budd, D.A., Hammes, Ursula, and Vacher, H.L., 1993, Calcite cementation in the Upper Floridan aquifer: A modern example for confined-aquifer cementation models?: Geology, v. 21, p. 33-36.
Busby, J.F., Plummer, L.N., Lee, R.W., and Hanshaw, B.B., 1991, Geochemical evolution of water in the Madison aquifer in parts of Montana, South Dakota, and Wyoming: U.S. Geological Survey Professional Paper 1273-F, 89 p.
Bush, P.W., and Johnston, R.H., 1988, Ground-water hydraulics, regional flow, and ground-water development of the Floridan aquifer system in Florida and in parts of Georgia, South Carolina, and Alabama: U.S. Geological Survey Professional Paper 1403-C, 80 p.
Cander, H.S., 1991, Dolomitization and water-rock interaction in the middle Eocene Avon Park Formation, Floridan aquifer: Ph.D. Dissertation, The University of Texas at Austin, 172 p.
Chapelle, F.H., 1993, Ground-water microbiology and geochemistry: John Wiley and Sons, Inc., New York, 424 p.
Chen, C.S., 1965, The regional lithostratigraphic analysis of Paleocene and Eocene rocks of Florida: Florida Geological Survey Bulletin 45, 105 p.
Claypool, G.E., Holser, W.T., Kaplan, I.R., Sakai, H., and Zak, I., 1980, The age curves of sulfur and oxygen isotopes in marine sulfate and their mutual interpretation: Chemical Geology, v. 27, p. 199-260.
Cook, D.J., Randazzo, A.F., and Sprinkle, C.L., 1985, Authigenic fluorite in dolomitic rocks of the Floridan aquifer: Geology, v. 13, p. 390-391.
Covington, J.M, 1993, Neogene nannofossils of Florida, in Sullo, V.A. and others, eds., The Neogene of Florida and adjacent regions: Florida Geological Survey Special Publication 37, 112 p.
References 51
Craig, Harmon, 1961, Standard for reporting concentrations of deuterium and oxygen-18 in natural water: Science, v. 133, p. 1833-1834.
Crowder, R.E., Paillet, F.L., and Hess, A.E., 1994, High resolution flowmeter logging - a unique combination of borehole geophysics and hydraulics; Part I. Flowmeter techniques and equipment development: Proceedings of the Symposium on the Application of Geophysics to Environmental and Engineering Problems, March 26-30, 1994, Boston, Mass., Environmental and Engineering Geophysical Society, p. 361-380.
DeHaven, E.C., and Jones, G.W., 1996, Origin of chlorides in Floridan aquifer ground water in the southern water-use caution area: Ambient Ground-Water Quality Monitoring Program, Southwest Florida Water Management District, Brooksville, Fla., 26 p.
DePaolo, D.J,. and Ingram, B.L., 1985, High-resolution stratigraphy with strontium isotopes: Science, v. 227, p. 938-941.
Drever, J.I., 1982, The geochemistry of natural waters: Prentice-Hall, Inc., Englewood Cliffs, N.J., 388 p.
Duerr, A.D., and Enos, G.M., 1991, Hydrogeology of the intermediate aquifer system and Upper Floridan aquifer, Hardee and De Soto Counties, Florida: U.S. Geological Survey Water-Resources Investigations Report 90-4104, 46 p.
Duerr, A.D., and Wolansky, R.M., 1986, Hydrogeology of the surficial and intermediate aquifers of central Sarasota County, Florida: U.S. Geological Survey Water-Resources Investigations Report 86-4068, 48 p.
Elderfield, H., 1986, Strontium isotope stratigraphy: Paleogeography, Paleoclimatology, Paleoecology, v. 57, p. 71-90.
Fishman, M.J., and Friedman, L.C., eds., 1989, Methods for determination of inorganic substances in water and flavial sediment: U.S. Geological Survey Techniques of Water-Resources Investigations, book 5, chap. A1, 545 p.
Florida Department of State, 1993, Rules of the Department of Environmental Regulation, Drinking water standards, monitoring, and reporting: Florida Administrative Code, Chapter 17-550, p. 13-22.
Gilboy, A.E., 1985, Hydrogeology of the Southwest Florida Water Management District: Southwest Florida Water Management District Report, 18 p.
Hach Company, 1989, Water analysis handbook: Loveland, Colo., 689 p.
Hammett, K.M., 1990, Land use, water use, streamflow characteristics, and water-quality characteristics of the Charlotte Harbor inflow area, Florida: U.S. Geological Survey Water-Supply Paper 2359-A, 64 p.
Hanshaw, B.B., and Back, William, 1972, On the origin of dolomites in the Tertiary aquifer of Florida, in Puri, H.S., ed., Proceeding of the Seventh Forum on Geology of Industrial Minerals: Florida Bureau of Geology Special Publication no. 17, p. 139-153.
Hanshaw, B.B., and Back, William, 1979, Major geochemical processes in the evolution of carbonate-aquifer systems: Journal of Hydrology, v. 43, p. 287-312.
Hanshaw, B.B., Back, William, and Deike, R.G., 1971, A geochemical hypothesis for dolomitization by ground water: Economic Geology, v. 66, p. 710-724.
Hardie, L.A., 1987, Dolomitization: a critical view of some current views: Journal of Sedimentary Petrology, v. 57, p. 166-183.
Hem, J.D., 1989, Study and interpretation of the chemical characteristics of natural water (3rd ed.): U.S. Geological Survey Water-Supply Paper 2254, 263 p.
Hess, A.E., 1990, Thermal pulse flowmeter for measuring slow water velocities in boreholes: U.S. Geological Survey Open-File Report 87-121, 70 p.
Hess, A.E., and Paillet, F.L., 1990, Application of the thermal-pulse flowmeter in the hydraulic characterization of fractured rocks: Geophysical Applications for Geotechnical Investigations, American Society for Testing and Materials, Standard Technical Publication 1101, p. 99-112.
Hess, J., Bender, M.L., and Schilling, J.G., 1986, Seawater 87Sr/86Sr evolution from Cretaceous to present: Science, v. 231, p. 979-984.
Hickey, J.J., 1990, An assessment of flow of the variable-salinity ground water in the middle confining unit of the Floridan aquifer system, west-central Florida: U.S. Geological Survey Water-Resources Investigations Report 89-4142, 13 p.
Hobbie, A.E., 1993, Chemical variation in groundwater composition with depth through a lithologically heterogeneous carbonate aquifer system: M.S. Thesis, University of Virginia, Charlottesville, 170 p.
Hsu, K.J., 1963, Solubility of dolomite and composition of Florida ground waters: Journal of Hydrology, v. 1, p. 288-310.
Hutchinson, C.B., 1984, Hydrogeology of the Verna well-field area and management alternatives for improving yield and quality of water, Sarasota County, Florida: U.S. Geological Survey Water-Resources Investigations Report 84-4016, 26 p.
Hutchinson, C.B., 1992, Assessment of hydrogeologic conditions with emphasis on water quality and wastewater injection, southwest Sarasota and west Charlotte Counties, Florida: U.S. Geological Survey Water-Supply Paper 2371, 74 p,.
52 Geochemical and Isotopic Composition of Ground Water, with Emphasis on Sources of Sulfate, in the Upper Floridan Aquifer and Intermediate Aquifer System in Southwest Florida
HydroGeoLogic, Inc., 1994, DSTRAM-based cross-sectional modeling of saltwater intrusion in the Eastern Tampa Bay Water Use Caution Area: Consultant’s report to the Southwest Florida Water Management District, Brooksville, Fla., p. 4-19.
Jensen, M.L., and Nakai, N., 1961, Sources and isotopic composition of atmospheric sulfur: Science, v. 134, p. 2102-2104.
Johnson, B.C., 1994, Chemical stratification, mixing, and water-rock interaction in the Upper Floridan aquifer: M.S. Thesis, University of Colorado, Boulder, 219 p.
Jones, G.W., and Upchurch, S.B., 1993, Structural controls on ground-water quality in southwest Florida and implications for water management, in Upchurch, S.B., Moore, J.E., and Zaporozec, A., eds., Proceedings of the 10th Annual Conference of the AIH Meeting in Orlando, Florida, Nov. 3-7, 1991: American Institute of Hydrology, Minneapolis, Minn., p. 149-155.
Jones, I.C., Vacher, H.L, and Budd, D.A., 1993, Transport of calcium, magnesium, and SO4 in the Floridan aquifer, west-central Florida: implications to cementation rates: Journal of Hydrology, v. 143, p. 455-480.
Katz, B.G., 1992, Hydrogeochemistry of the Upper Floridan aquifer, Florida: U.S. Geological Survey Water-Resources Investigations Report 91-4196, 37 p.
Katz, B.G., Lee, T.M., Plummer, L.N., and Busenberg, Eurybiades, 1995a, Chemical evolution of groundwater near a sinkhole lake, northern Florida, 1. Flow patterns, age of groundwater and influence of lakewater leakage: Water Resources Research, v. 31, p. 1549-1564.
Katz, B.G., Plummer, L.N., and Busenberg, Eurybiades, Revesz, K.M., Jones, B.F., and Lee, T.M., 1995b, Chemical evolution of groundwater near a sinkhole lake, northern Florida, 2. Chemical patterns, mass-transfer modeling, and rates of chemical reactions: Water Resources Research, v. 31, p. 1564-1584.
Kauffman, S.J., 1994, The geochemical effects of confining units on the groundwater evolution of a lithologically heterogeneous carbonate aquifer: M.S. Thesis, University of Virginia, Charlottesville, 113 p.
Kaufman, M.I., and Dion, N.P., 1967, Chemical character of water in the Floridan aquifer in southern Peace River Basin, Florida: Florida Bureau of Geology Map Series Report no. 27, 1 sheet.
Kohout, F.A., 1967, Ground-water flow and the geothermal regime of the Floridan Plateau, in Symposium on Geological History of the Gulf of Mexico Caribbean Antigen Basin: Gulf Coast Association of Geological Societies, Transactions, v. 17, p. 339-354.
Kohout, F.A., Henry, H.R., and Banks, J.E., 1977, Hydrogeology related to geothermal conditions of the Floridan plateau, in Smith, D.L., and Griffin, G.M., eds., The geothermal nature of the Floridan Plateau: Florida Bureau of Geology Special Publication no. 21, p. 1-39..
Krouse, H.R., 1980, Sulphur isotopes in our environment, in Fritz, P. and Fontes, J.Ch., eds., Handbook of environmental isotope geochemistry: Elsevier Scientific Publishing Co., New York, p. 227-258.
Kushnir, Jacob, 1980, The coprecipitation of strontium, magnesium, sodium, potassium, and chloride ions with gypsum, an experimental study: Geochimica et Cosmochimica Acta, v. 44, p. 1471-1482.
Law Environmental, Inc., 1989, Results of exploratory/monitor well construction and testing, Knight Trail Park: Consultant’s report to the Florida Department of Environmental Regulation, file no. UC58-125241, Tallahassee, Fla.
McCartan, Lucy, Duerr, A.D., and Hawkins, R.M., 1992a, Magnesium-rich clay minerals in Tertiary carbonate rocks of southwestern Florida, in Gohn, G.S., ed., Proceedings of the 1988 U.S. Geological Survey Workshop on the Geology and Geohydrology of the Atlantic Coastal Plain: U.S. Geological Survey Circular 1059, p. 121-128.
McCartan, Lucy, Plummer, L.N., Hosterman, J.W., Busenburg, E., Dwornik, E.J., Duerr, A.D., Miller, R.L., and Kiesler, J.L, 1992b, Celestine (SrSO4) in Hardee and De Soto Counties, Florida, in Gohn, G.S., ed., Proceedings of the 1988 U.S. Geological Survey Workshop on the Geology and Geohydrology of the Atlantic Coastal Plain: U.S. Geological Survey Circular 1059, p. 129-138.
McMahon, P.B., Vroblesky, D.A., Bradley, P.M., Chapelle, F.H., and Gulley, C.D., 1995, Evidence for enhanced mineral dissolution in organic acid-rich shallow ground water: Ground Water, v. 22, no. 2, p. 207-216.
Metz, P.A., 1995, Hydrogeology and simulated effects of ground-water withdrawals for citrus irrigation, Hardee and De Soto Counties, Florida: U.S. Geological Survey Water-Resources Investigations 83-4158, 83 p.
Metz, P.A., 1996, The potential for water-quality degradation of interconnected aquifers in west-central Florida: U.S. Geological Survey Water-Resources Investigations Report 96-4030, 54 p.
Meyers, J.B., Swart, P.K., Meyers, J.L., 1993, Geochemical evidence for groundwater behavior in an unconfined aquifer, south Florida: Journal of Hydrology, v. 148, p. 249-272.
Miller, J.A., 1986, Hydrogeologic framework of the Floridan aquifer system in Florida and parts of Georgia, South Carolina, and Alabama: U.S. Geological Survey Professional Paper 1403-B, 91 p.
References 53
Missimer, T.M., McNeill, D.F., Ginsburg, R.N, 1994, Cenozoic record of global sea level events in the Hawthorn Group and Tamiami Formation of the Florida Platform: Geological Society of America Abstracts with Programs, v. 26, no. 7, p. A-151.
Moore, C.H., 1989, Carbonate diagenesis and porosity: Elsevier Science Publishers, B.V., Amsterdam, 338 p.
Mularoni, R.A., 1992a, Potentiometric surfaces of the intermediate aquifer system, west-central Florida, May 1992: U.S. Geological Survey Open File Report 92-471, 1 plate.
Mularoni, R.A., 1992b, Potentiometric surface of the Upper Floridan aquifer, west-central Florida, May 1992: U.S. Geological Survey Open File Report 92-472, 1 plate.
National Acid Deposition Program/National Trends Network, 1994, Annual data summary, Precipitation chemistry in the United States 1993: NADP/NTN, Colorado State University, Fort Collins.
Nordstrom, D.K., Plummer, L.N., Langmuir, D., Busenberg, Eurybiades., May, H.M., Jones, B.F., and Parkhurst, D.L., 1990, Revised chemical equilibrium data for major water-mineral reactions and their limitation, in Melchior, D.C., and Basset, R.L., eds., Chemical modeling of aqueous systems II: American Chemical Society Symposium Series 416, p. 398-413.
Östlund, G., 1959, Isotopic composition of sulfur in precipitation and sea-water: Tellus, v. 11, p. 478-480.
Pankow, J.F., 1991, Aquatic chemistry concepts: Lewis Publishers, Chelsea, Mich., 683 p.
Plummer, L.N., 1977, Defining reactions and mass transfer in part of the Floridan aquifer: Water Resources Research, v. 13, no. 5, p. 801-812.
Plummer, L.N., and Back, William, 1980, The mass balance approach: application to interpreting the chemical evolution of hydrologic systems: American Journal of Science, v. 280, p. 130-142.
Plummer, L.N., Busby, J.F., Lee, R.W., and Hanshaw, B.B., 1990, Geochemical modeling of the Madison aquifer in parts of Montana, Wyoming, and South Dakota: Water Resources Research, v. 26, no. 9., p. 1981-2014.
Plummer, L.N., Parkhurst, D.L., Fleming, G.F., and Dunkle, S.A., 1988, A computer program incorportating the Pitzer’s equations for calculations of geochemical reactions in brines: U.S. Geological Survey Water-Resources Investigations Report 88-4153, 310 p.
Plummer, L.N., Parkhurst, D.L., and Thorstenson, D.C., 1983, Development of reaction models for ground water systems: Geochimica et Cosmochimica Acta, v. 47, p. 665-686.
Plummer, L.N., Prestemon, E.C., and Parkhurst, D.L., 1991, An interactive code (NETPATH) for modeling net geochemical reactions along a flow path: U.S. Geological Survey Water-Resources Investigations Report 91-4078, 227 p.
Plummer, L.N., Prestemon, E.C., and Parkhurst, D.L., 1994, An interactive code (NETPATH) for modeling net geochemical reactions along a flow path, version 2.0: U.S. Geological Survey Water-Resources Investigations Report 94-4169, 130 p.
Ramette, R.W., 1981, Limitations of experimental measurements in chemical equilibrium and analysis: Addison-Wesley, Reading, Mass., p. 49-82.
Randazzo, A.F., and Bloom, J.I., 1985, Mineralogical changes along the freshwater/saltwater interface of a modern aquifer: Sedimentary Geology, v. 43, p. 219-239.
Randazzo, A.F., and Hickey, E.W., 1978, Dolomitization in the Floridan aquifer: American Journal of Science, v. 278, p. 1177-1184.
Randazzo, A.F., Koster, Mieke, Jones, D.S., and Portell, R.W., 1990, Paleoecology of shallow-marine carbonate environments, middle Eocene of peninsular Florida: Sedimentary Geology, v. 66, p. 1-11.
Rees, C.E., Jenkins, W.J., and Monster, J., 1978, The sulphur isotope geochemistry of ocean water sulphate: Geochemica Cosmochimica Acta, v. 42, p. 377-382.
Rightmire, C.T., and Hanshaw, B.B., 1973, Relationship between carbon isotope composition of soil CO2 and dissolved carbonate species in ground water: Water Resources Research, v. 9, no. 4, p. 958-967.
Rightmire, C.T., Pearson, F.J., Jr., Back, William, Rye, R.O., and Hanshaw, B.B., 1974, Distribution of sulfur isotopes in ground waters from the principal artesian aquifer of Florida and the Edwards aquifer of Texas, United States of America: Isotope Techniques in Groundwater Hydrology, v. 2, International Atomic Energy Agency, Vienna, p. 191-207.
Ryder, P.D., 1982, Digital model of predevelopment flow in the Tertiary limestone (Floridan) aquifer system in west-central Florida: U.S. Geological Survey Water-Resources Investigations Report 81-54, 61 p.
Ryder, P.D., 1985, Hydrology of the Floridan aquifer system in west-central Florida: U.S. Geological Survey Professional Paper 1403-F, 63 p.
Rye, R.O., Back, William, Hanshaw, B.B., Rightmire, C.T., and Pearson, F.J. Jr., 1981, The origin and isotopic composition of dissolved sulfide in ground water from carbonate aquifers in Florida and Texas: Geochimica et Cosmochimica Acta, v. 45, p. 1941-1950.
Sacks, L.A., 1996, Geochemical and isotopic composition of ground water with emphasis on sources of sulfate in the Upper Floridan aquifer in parts of Marion, Sumter, and Citrus Counties, Florida: U.S. Geological Survey Water-Resources Investigations Report, 47 p.
Sacks, L.A., Herman, J.S., and Kauffman, S.J, 1995, Controls on high sulfate concentrations in the Upper Floridan aquifer in southwest Florida: Water Resources Research, v. 31, p. 2541-2551.
54 Geochemical and Isotopic Composition of Ground Water, with Emphasis on Sources of Sulfate, in the Upper Floridan Aquifer and Intermediate Aquifer System in Southwest Florida
Scott, T.M., 1988, The lithostratigraphy of the Hawthorn Group (Miocene) of Florida: Florida Geological Survey Bulletin no. 59, 148 p.
Scott, T.M., Wingard, G.L, Weedman, S.D., and Ewards, L.E., 1994, Reinterpretation of the peninsular Florida Oligocene: a multidisciplinary view: Geological Society of America Abstracts with Programs, v. 26, no. 7, p. A-151.
Sinclair, W.C., 1979, Test data from the chloride-monitor well at Sun City Center, Hillsborough County, Florida: U.S. Geological Survey Open-File Report 79-1030, 20 p.
Smith, D.L. 1982, Review of the tectonic history of the Florida basement: Tectonophysics, v. 88. p. 1-22.
Southeastern Geological Society, 1986, Hydrogeological units of Florida: Florida Bureau of Geology Special Publications no. 8, 8 p.
Southwest Florida Water Management District, 1991, Ground-water quality of the Southwest Florida Water Management District, southern region, section 2: Ambient Ground-Water Quality Monitoring Program, Southwest Florida Water Management District, Brooksville, Fla., 275 p.
Sprinkle, C.R., 1989, Geochemistry of the Floridan aquifer system in Florida and in parts of Georgia, South Carolina, and Alabama: U.S. Geological Survey Professional Paper 1403-I, 105 p.
Steinkampf, W.C., 1982, Origins and distribution of saline ground waters in the Floridan aquifer in coastal southwest Florida: U.S. Geological Survey Water-Resources Investigations Report 82-4052, 34 p.
Swancar, Amy, and Hutchinson, C.B., 1995, Chemical and
isotopic composition and potential for contamination
of water in the Upper Floridan aquifer, west-central
Florida, 1986-89: U.S. Geological Survey Water-
Supply Paper 2409, 70 p.
Wilson, W.E., 1977, Ground-water resources of De Soto
and Hardee Counties, Florida: Florida Bureau of
Geology Report of Investigations no. 83, 102 p.
Wingard, G.L., Sugarman, P.J., Edwards, L.E., McMartan,
Lucy, and Feigenson, M.D., 1993, Biostratigraphy and
chronostratigraphy of the area between Sarasota and
Lake Okeechobee, southern Florida - an intergrated
approach: Geological Society of America Abstracts
with Programs, v. 25, no. 4, p. 78.
Wolansky, R.M., 1983, Hydrogeology of the Sarasota-Port
Charlotte area, Florida: U.S. Geological Survey Water-
Resources Investigations Report 82-4089, 48 p.
Wood, W.W., 1976, Guidelines for collection and field
analysis of ground-water samples for selected unstable
constituents: U.S. Geological Survey Techniques of
Water-Resources Investigations, book 1, chap. D2,
24 p.
Yobbi, D.K., 1983, Trends and fluctuations in the
potentiometric surface of the Floridan aquifer, west-
central Florida, 1961-80: U.S. Geological Survey
Water-Resources Investigations Report 82-4086,
1 sheet.
APPENDIX[Chemical and isotopic data from water samples and calculated saturation indexes and partial pressure of carbon dioxide]
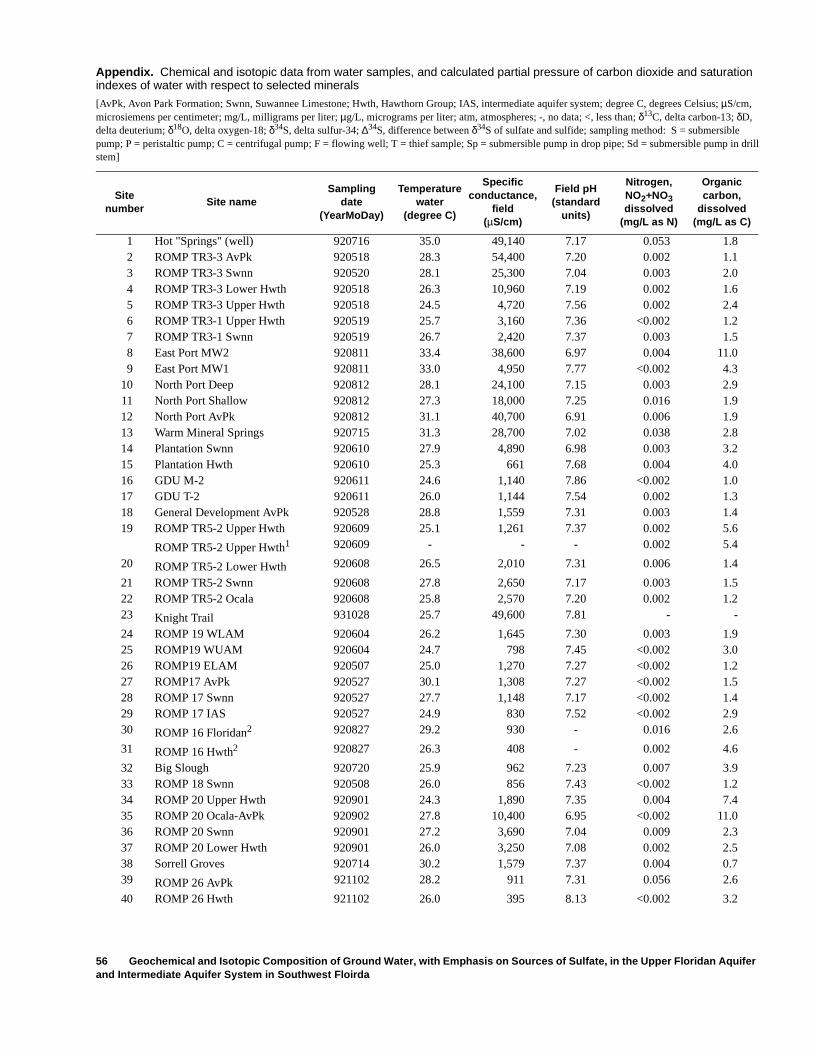
56 Geochemical and Isotopic Composition of Ground Water, with Emphasis on Sources of Sulfate, in the Upper Floridan Aquifer and Intermediate Aquifer System in Southwest Floirda
Appendix. Chemical and isotopic data from water samples, and calculated partial pressure of carbon dioxide and saturation indexes of water with respect to selected minerals
[AvPk, Avon Park Formation; Swnn, Suwannee Limestone; Hwth, Hawthorn Group; IAS, intermediate aquifer system; degree C, degrees Celsius; µS/cm, microsiemens per centimeter; mg/L, milligrams per liter; µg/L, micrograms per liter; atm, atmospheres; -, no data; <, less than; δ13C, delta carbon-13; δD, delta deuterium; δ18O, delta oxygen-18; δ34S, delta sulfur-34; ∆34S, difference between δ34S of sulfate and sulfide; sampling method: S = submersible pump; P = peristaltic pump; C = centrifugal pump; F = flowing well; T = thief sample; Sp = submersible pump in drop pipe; Sd = submersible pump in drill stem]
Sitenumber
Site nameSampling
date(YearMoDay)
Temperaturewater
(degree C)
Specificconductance,
field(µS/cm)
Field pH(standard
units)
Nitrogen,NO2+NO3dissolved
(mg/L as N)
Organiccarbon,
dissolved(mg/L as C)
1 Hot "Springs" (well) 920716 35.0 49,140 7.17 0.053 1.82 ROMP TR3-3 AvPk 920518 28.3 54,400 7.20 0.002 1.13 ROMP TR3-3 Swnn 920520 28.1 25,300 7.04 0.003 2.04 ROMP TR3-3 Lower Hwth 920518 26.3 10,960 7.19 0.002 1.65 ROMP TR3-3 Upper Hwth 920518 24.5 4,720 7.56 0.002 2.46 ROMP TR3-1 Upper Hwth 920519 25.7 3,160 7.36 <0.002 1.27 ROMP TR3-1 Swnn 920519 26.7 2,420 7.37 0.003 1.58 East Port MW2 920811 33.4 38,600 6.97 0.004 11.09 East Port MW1 920811 33.0 4,950 7.77 <0.002 4.3
10 North Port Deep 920812 28.1 24,100 7.15 0.003 2.911 North Port Shallow 920812 27.3 18,000 7.25 0.016 1.912 North Port AvPk 920812 31.1 40,700 6.91 0.006 1.913 Warm Mineral Springs 920715 31.3 28,700 7.02 0.038 2.814 Plantation Swnn 920610 27.9 4,890 6.98 0.003 3.215 Plantation Hwth 920610 25.3 661 7.68 0.004 4.016 GDU M-2 920611 24.6 1,140 7.86 <0.002 1.017 GDU T-2 920611 26.0 1,144 7.54 0.002 1.318 General Development AvPk 920528 28.8 1,559 7.31 0.003 1.419 ROMP TR5-2 Upper Hwth 920609 25.1 1,261 7.37 0.002 5.6
ROMP TR5-2 Upper Hwth1 920609 - - - 0.002 5.4
20 ROMP TR5-2 Lower Hwth 920608 26.5 2,010 7.31 0.006 1.4
21 ROMP TR5-2 Swnn 920608 27.8 2,650 7.17 0.003 1.522 ROMP TR5-2 Ocala 920608 25.8 2,570 7.20 0.002 1.223 Knight Trail 931028 25.7 49,600 7.81 - -
24 ROMP 19 WLAM 920604 26.2 1,645 7.30 0.003 1.925 ROMP19 WUAM 920604 24.7 798 7.45 <0.002 3.026 ROMP19 ELAM 920507 25.0 1,270 7.27 <0.002 1.227 ROMP17 AvPk 920527 30.1 1,308 7.27 <0.002 1.528 ROMP 17 Swnn 920527 27.7 1,148 7.17 <0.002 1.429 ROMP 17 IAS 920527 24.9 830 7.52 <0.002 2.930 ROMP 16 Floridan2 920827 29.2 930 - 0.016 2.6
31 ROMP 16 Hwth2 920827 26.3 408 - 0.002 4.6
32 Big Slough 920720 25.9 962 7.23 0.007 3.933 ROMP 18 Swnn 920508 26.0 856 7.43 <0.002 1.234 ROMP 20 Upper Hwth 920901 24.3 1,890 7.35 0.004 7.435 ROMP 20 Ocala-AvPk 920902 27.8 10,400 6.95 <0.002 11.036 ROMP 20 Swnn 920901 27.2 3,690 7.04 0.009 2.337 ROMP 20 Lower Hwth 920901 26.0 3,250 7.08 0.002 2.538 Sorrell Groves 920714 30.2 1,579 7.37 0.004 0.739 ROMP 26 AvPk 921102 28.2 911 7.31 0.056 2.6
40 ROMP 26 Hwth 921102 26.0 395 8.13 <0.002 3.2
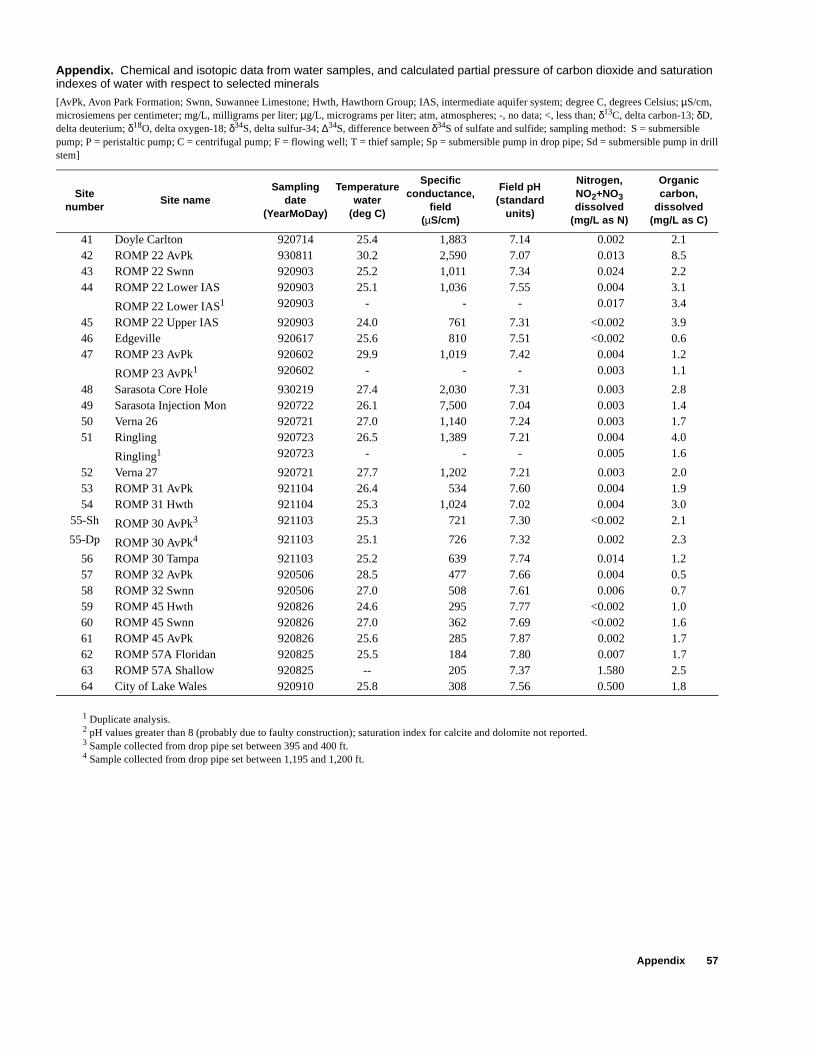
Appendix 57
1 Duplicate analysis.2 pH values greater than 8 (probably due to faulty construction); saturation index for calcite and dolomite not reported.3 Sample collected from drop pipe set between 395 and 400 ft.4 Sample collected from drop pipe set between 1,195 and 1,200 ft.
Appendix. Chemical and isotopic data from water samples, and calculated partial pressure of carbon dioxide and saturation indexes of water with respect to selected minerals
[AvPk, Avon Park Formation; Swnn, Suwannee Limestone; Hwth, Hawthorn Group; IAS, intermediate aquifer system; degree C, degrees Celsius; µS/cm, microsiemens per centimeter; mg/L, milligrams per liter; µg/L, micrograms per liter; atm, atmospheres; -, no data; <, less than; δ13C, delta carbon-13; δD, delta deuterium; δ18O, delta oxygen-18; δ34S, delta sulfur-34; ∆34S, difference between δ34S of sulfate and sulfide; sampling method: S = submersible pump; P = peristaltic pump; C = centrifugal pump; F = flowing well; T = thief sample; Sp = submersible pump in drop pipe; Sd = submersible pump in drill stem]
Sitenumber
Site nameSampling
date(YearMoDay)
Temperaturewater
(deg C)
Specificconductance,
field(µS/cm)
Field pH(standard
units)
Nitrogen,NO2+NO3dissolved
(mg/L as N)
Organiccarbon,
dissolved(mg/L as C)
41 Doyle Carlton 920714 25.4 1,883 7.14 0.002 2.1 42 ROMP 22 AvPk 930811 30.2 2,590 7.07 0.013 8.5 43 ROMP 22 Swnn 920903 25.2 1,011 7.34 0.024 2.2 44 ROMP 22 Lower IAS 920903 25.1 1,036 7.55 0.004 3.1
ROMP 22 Lower IAS1 920903 - - - 0.017 3.4
45 ROMP 22 Upper IAS 920903 24.0 761 7.31 <0.002 3.9 46 Edgeville 920617 25.6 810 7.51 <0.002 0.6 47 ROMP 23 AvPk 920602 29.9 1,019 7.42 0.004 1.2
ROMP 23 AvPk1 920602 - - - 0.003 1.1
48 Sarasota Core Hole 930219 27.4 2,030 7.31 0.003 2.8 49 Sarasota Injection Mon 920722 26.1 7,500 7.04 0.003 1.4 50 Verna 26 920721 27.0 1,140 7.24 0.003 1.7 51 Ringling 920723 26.5 1,389 7.21 0.004 4.0
Ringling1 920723 - - - 0.005 1.6
52 Verna 27 920721 27.7 1,202 7.21 0.003 2.0 53 ROMP 31 AvPk 921104 26.4 534 7.60 0.004 1.9 54 ROMP 31 Hwth 921104 25.3 1,024 7.02 0.004 3.0
55-Sh ROMP 30 AvPk3 921103 25.3 721 7.30 <0.002 2.1
55-Dp ROMP 30 AvPk4 921103 25.1 726 7.32 0.002 2.3
56 ROMP 30 Tampa 921103 25.2 639 7.74 0.014 1.2 57 ROMP 32 AvPk 920506 28.5 477 7.66 0.004 0.5 58 ROMP 32 Swnn 920506 27.0 508 7.61 0.006 0.7 59 ROMP 45 Hwth 920826 24.6 295 7.77 <0.002 1.0 60 ROMP 45 Swnn 920826 27.0 362 7.69 <0.002 1.6 61 ROMP 45 AvPk 920826 25.6 285 7.87 0.002 1.7 62 ROMP 57A Floridan 920825 25.5 184 7.80 0.007 1.7 63 ROMP 57A Shallow 920825 -- 205 7.37 1.580 2.5 64 City of Lake Wales 920910 25.8 308 7.56 0.500 1.8
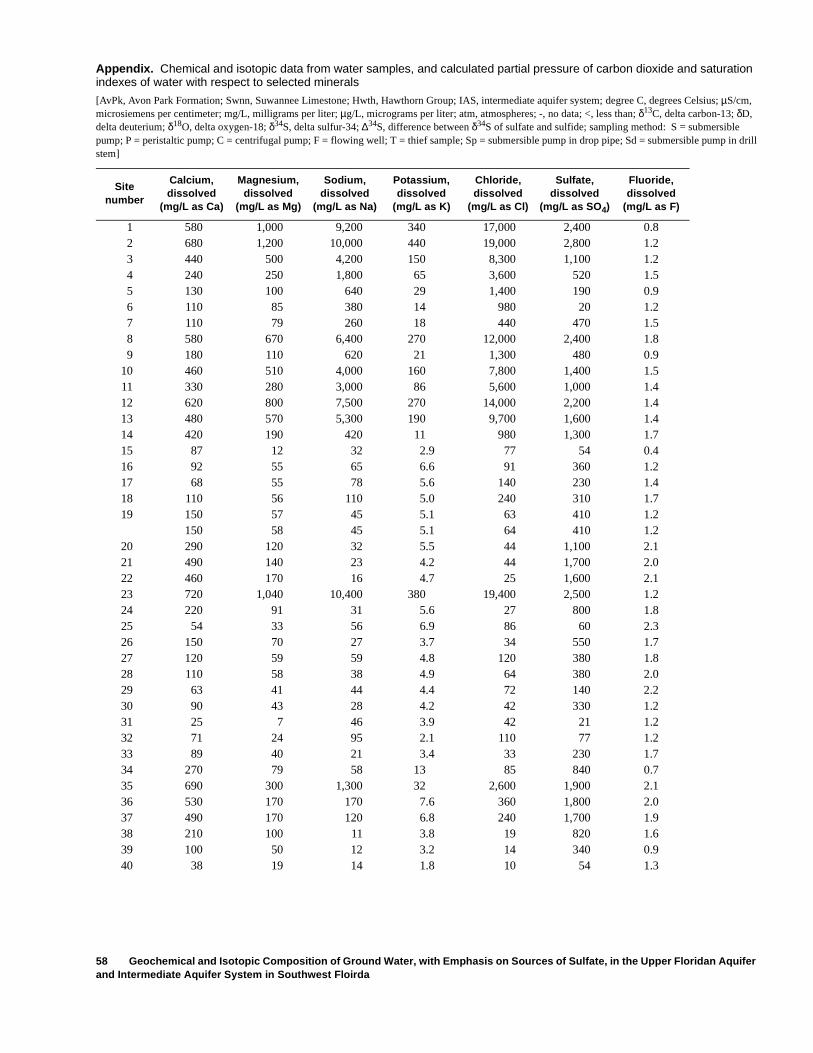
58 Geochemical and Isotopic Composition of Ground Water, with Emphasis on Sources of Sulfate, in the Upper Floridan Aquifer and Intermediate Aquifer System in Southwest Floirda
Appendix. Chemical and isotopic data from water samples, and calculated partial pressure of carbon dioxide and saturation indexes of water with respect to selected minerals
[AvPk, Avon Park Formation; Swnn, Suwannee Limestone; Hwth, Hawthorn Group; IAS, intermediate aquifer system; degree C, degrees Celsius; µS/cm, microsiemens per centimeter; mg/L, milligrams per liter; µg/L, micrograms per liter; atm, atmospheres; -, no data; <, less than; δ13C, delta carbon-13; δD, delta deuterium; δ18O, delta oxygen-18; δ34S, delta sulfur-34; ∆34S, difference between δ34S of sulfate and sulfide; sampling method: S = submersible pump; P = peristaltic pump; C = centrifugal pump; F = flowing well; T = thief sample; Sp = submersible pump in drop pipe; Sd = submersible pump in drill stem]
Sitenumber
Calcium,dissolved
(mg/L as Ca)
Magnesium,dissolved
(mg/L as Mg)
Sodium,dissolved
(mg/L as Na)
Potassium,dissolved
(mg/L as K)
Chloride,dissolved
(mg/L as Cl)
Sulfate,dissolved
(mg/L as SO4)
Fluoride,dissolved
(mg/L as F)
1 580 1,000 9,200 340 17,000 2,400 0.8 2 680 1,200 10,000 440 19,000 2,800 1.2 3 440 500 4,200 150 8,300 1,100 1.2 4 240 250 1,800 65 3,600 520 1.5 5 130 100 640 29 1,400 190 0.9 6 110 85 380 14 980 20 1.2 7 110 79 260 18 440 470 1.5 8 580 670 6,400 270 12,000 2,400 1.8 9 180 110 620 21 1,300 480 0.9
10 460 510 4,000 160 7,800 1,400 1.5 11 330 280 3,000 86 5,600 1,000 1.4 12 620 800 7,500 270 14,000 2,200 1.4 13 480 570 5,300 190 9,700 1,600 1.4 14 420 190 420 11 980 1,300 1.7 15 87 12 32 2.9 77 54 0.4 16 92 55 65 6.6 91 360 1.2 17 68 55 78 5.6 140 230 1.4 18 110 56 110 5.0 240 310 1.7 19 150 57 45 5.1 63 410 1.2
150 58 45 5.1 64 410 1.2 20 290 120 32 5.5 44 1,100 2.1 21 490 140 23 4.2 44 1,700 2.0 22 460 170 16 4.7 25 1,600 2.1 23 720 1,040 10,400 380 19,400 2,500 1.2 24 220 91 31 5.6 27 800 1.8 25 54 33 56 6.9 86 60 2.3 26 150 70 27 3.7 34 550 1.7 27 120 59 59 4.8 120 380 1.8 28 110 58 38 4.9 64 380 2.0 29 63 41 44 4.4 72 140 2.2 30 90 43 28 4.2 42 330 1.2 31 25 7 46 3.9 42 21 1.2 32 71 24 95 2.1 110 77 1.2 33 89 40 21 3.4 33 230 1.7 34 270 79 58 13 85 840 0.7 35 690 300 1,300 32 2,600 1,900 2.1 36 530 170 170 7.6 360 1,800 2.0 37 490 170 120 6.8 240 1,700 1.9 38 210 100 11 3.8 19 820 1.6 39 100 50 12 3.2 14 340 0.9 40 38 19 14 1.8 10 54 1.3
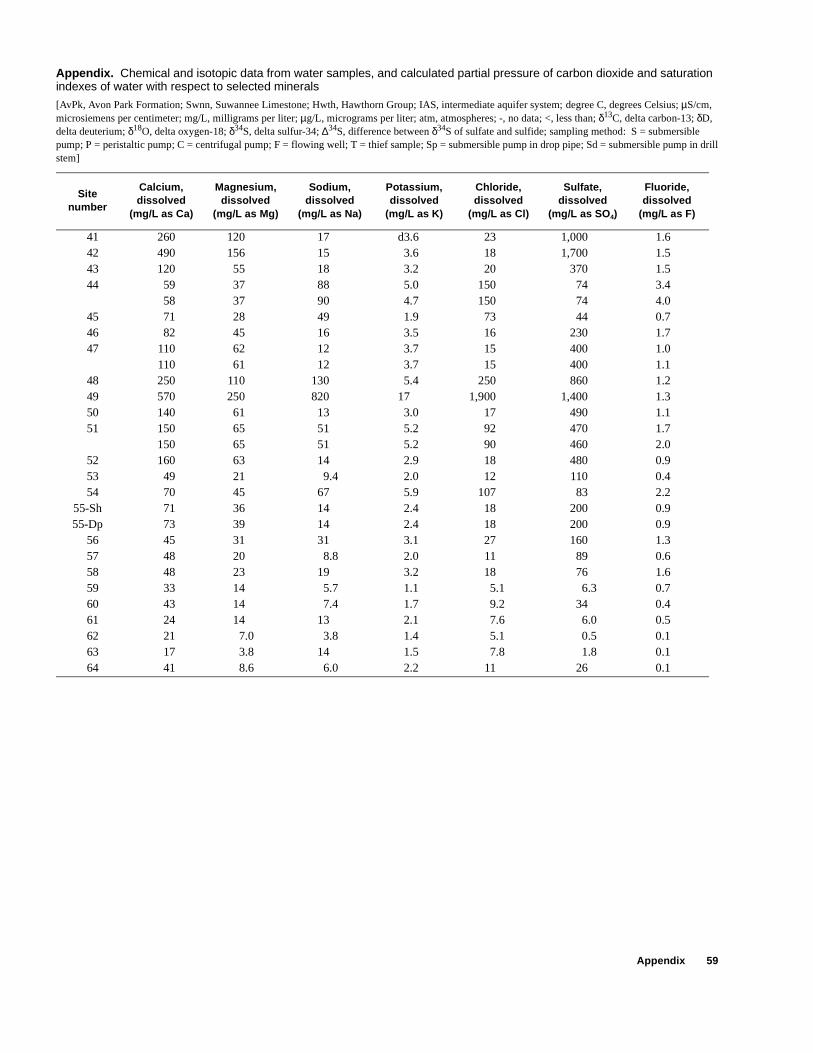
Appendix 59
Appendix. Chemical and isotopic data from water samples, and calculated partial pressure of carbon dioxide and saturation indexes of water with respect to selected minerals
[AvPk, Avon Park Formation; Swnn, Suwannee Limestone; Hwth, Hawthorn Group; IAS, intermediate aquifer system; degree C, degrees Celsius; µS/cm, microsiemens per centimeter; mg/L, milligrams per liter; µg/L, micrograms per liter; atm, atmospheres; -, no data; <, less than; δ13C, delta carbon-13; δD, delta deuterium; δ18O, delta oxygen-18; δ34S, delta sulfur-34; ∆34S, difference between δ34S of sulfate and sulfide; sampling method: S = submersible pump; P = peristaltic pump; C = centrifugal pump; F = flowing well; T = thief sample; Sp = submersible pump in drop pipe; Sd = submersible pump in drill stem]
Sitenumber
Calcium,dissolved
(mg/L as Ca)
Magnesium,dissolved
(mg/L as Mg)
Sodium,dissolved
(mg/L as Na)
Potassium,dissolved
(mg/L as K)
Chloride,dissolved
(mg/L as Cl)
Sulfate,dissolved
(mg/L as SO4)
Fluoride,dissolved
(mg/L as F)
41 260 120 17 d3.6 23 1,000 1.642 490 156 15 3.6 18 1,700 1.543 120 55 18 3.2 20 370 1.544 59 37 88 5.0 150 74 3.4
58 37 90 4.7 150 74 4.045 71 28 49 1.9 73 44 0.746 82 45 16 3.5 16 230 1.747 110 62 12 3.7 15 400 1.0
110 61 12 3.7 15 400 1.148 250 110 130 5.4 250 860 1.249 570 250 820 17 1,900 1,400 1.350 140 61 13 3.0 17 490 1.151 150 65 51 5.2 92 470 1.7
150 65 51 5.2 90 460 2.052 160 63 14 2.9 18 480 0.953 49 21 9.4 2.0 12 110 0.454 70 45 67 5.9 107 83 2.2
55-Sh 71 36 14 2.4 18 200 0.955-Dp 73 39 14 2.4 18 200 0.9
56 45 31 31 3.1 27 160 1.357 48 20 8.8 2.0 11 89 0.658 48 23 19 3.2 18 76 1.659 33 14 5.7 1.1 5.1 6.3 0.760 43 14 7.4 1.7 9.2 34 0.461 24 14 13 2.1 7.6 6.0 0.562 21 7.0 3.8 1.4 5.1 0.5 0.163 17 3.8 14 1.5 7.8 1.8 0.164 41 8.6 6.0 2.2 11 26 0.1
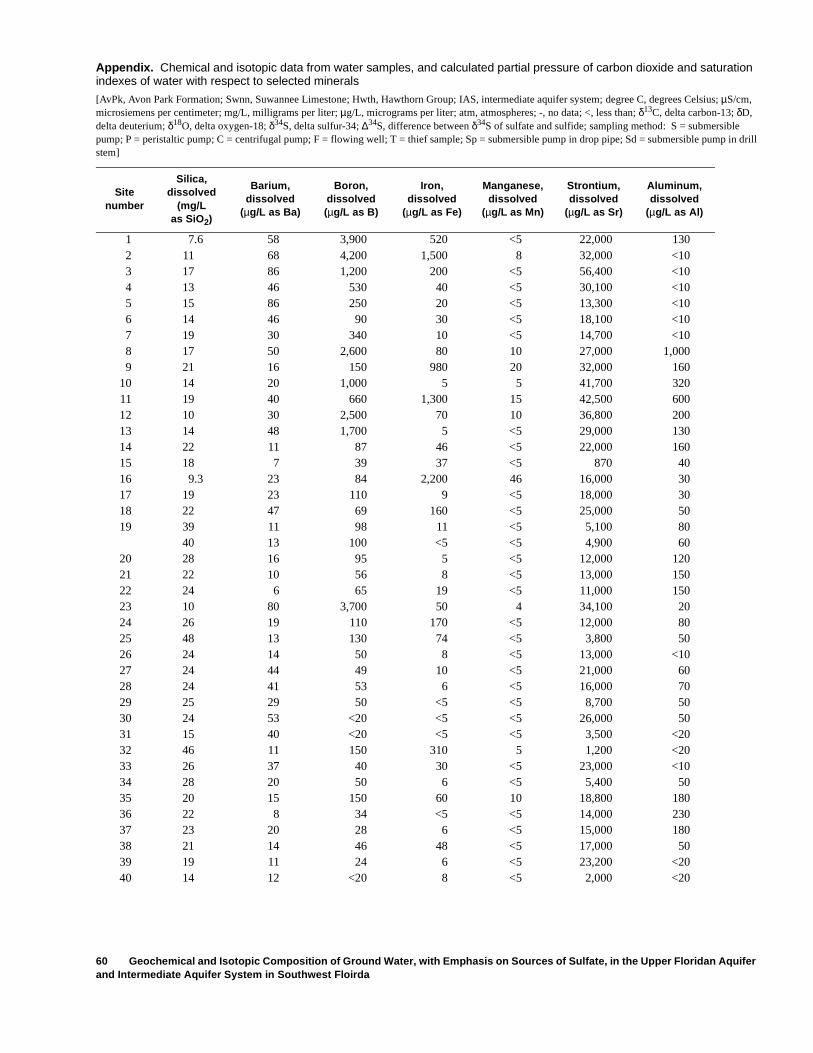
60 Geochemical and Isotopic Composition of Ground Water, with Emphasis on Sources of Sulfate, in the Upper Floridan Aquifer and Intermediate Aquifer System in Southwest Floirda
Appendix. Chemical and isotopic data from water samples, and calculated partial pressure of carbon dioxide and saturation indexes of water with respect to selected minerals
[AvPk, Avon Park Formation; Swnn, Suwannee Limestone; Hwth, Hawthorn Group; IAS, intermediate aquifer system; degree C, degrees Celsius; µS/cm, microsiemens per centimeter; mg/L, milligrams per liter; µg/L, micrograms per liter; atm, atmospheres; -, no data; <, less than; δ13C, delta carbon-13; δD, delta deuterium; δ18O, delta oxygen-18; δ34S, delta sulfur-34; ∆34S, difference between δ34S of sulfate and sulfide; sampling method: S = submersible pump; P = peristaltic pump; C = centrifugal pump; F = flowing well; T = thief sample; Sp = submersible pump in drop pipe; Sd = submersible pump in drill stem]
Sitenumber
Silica,dissolved
(mg/Las SiO2)
Barium,dissolved
(µg/L as Ba)
Boron,dissolved(µg/L as B)
Iron,dissolved
(µg/L as Fe)
Manganese,dissolved
(µg/L as Mn)
Strontium,dissolved
(µg/L as Sr)
Aluminum,dissolved
(µg/L as Al)
1 7.6 58 3,900 520 <5 22,000 1302 11 68 4,200 1,500 8 32,000 <103 17 86 1,200 200 <5 56,400 <104 13 46 530 40 <5 30,100 <105 15 86 250 20 <5 13,300 <106 14 46 90 30 <5 18,100 <107 19 30 340 10 <5 14,700 <108 17 50 2,600 80 10 27,000 1,0009 21 16 150 980 20 32,000 160
10 14 20 1,000 5 5 41,700 32011 19 40 660 1,300 15 42,500 60012 10 30 2,500 70 10 36,800 20013 14 48 1,700 5 <5 29,000 13014 22 11 87 46 <5 22,000 16015 18 7 39 37 <5 870 4016 9.3 23 84 2,200 46 16,000 3017 19 23 110 9 <5 18,000 3018 22 47 69 160 <5 25,000 5019 39 11 98 11 <5 5,100 80
40 13 100 <5 <5 4,900 6020 28 16 95 5 <5 12,000 12021 22 10 56 8 <5 13,000 15022 24 6 65 19 <5 11,000 15023 10 80 3,700 50 4 34,100 2024 26 19 110 170 <5 12,000 8025 48 13 130 74 <5 3,800 5026 24 14 50 8 <5 13,000 <1027 24 44 49 10 <5 21,000 6028 24 41 53 6 <5 16,000 7029 25 29 50 <5 <5 8,700 5030 24 53 <20 <5 <5 26,000 5031 15 40 <20 <5 <5 3,500 <2032 46 11 150 310 5 1,200 <2033 26 37 40 30 <5 23,000 <1034 28 20 50 6 <5 5,400 5035 20 15 150 60 10 18,800 18036 22 8 34 <5 <5 14,000 23037 23 20 28 6 <5 15,000 18038 21 14 46 48 <5 17,000 5039 19 11 24 6 <5 23,200 <2040 14 12 <20 8 <5 2,000 <20
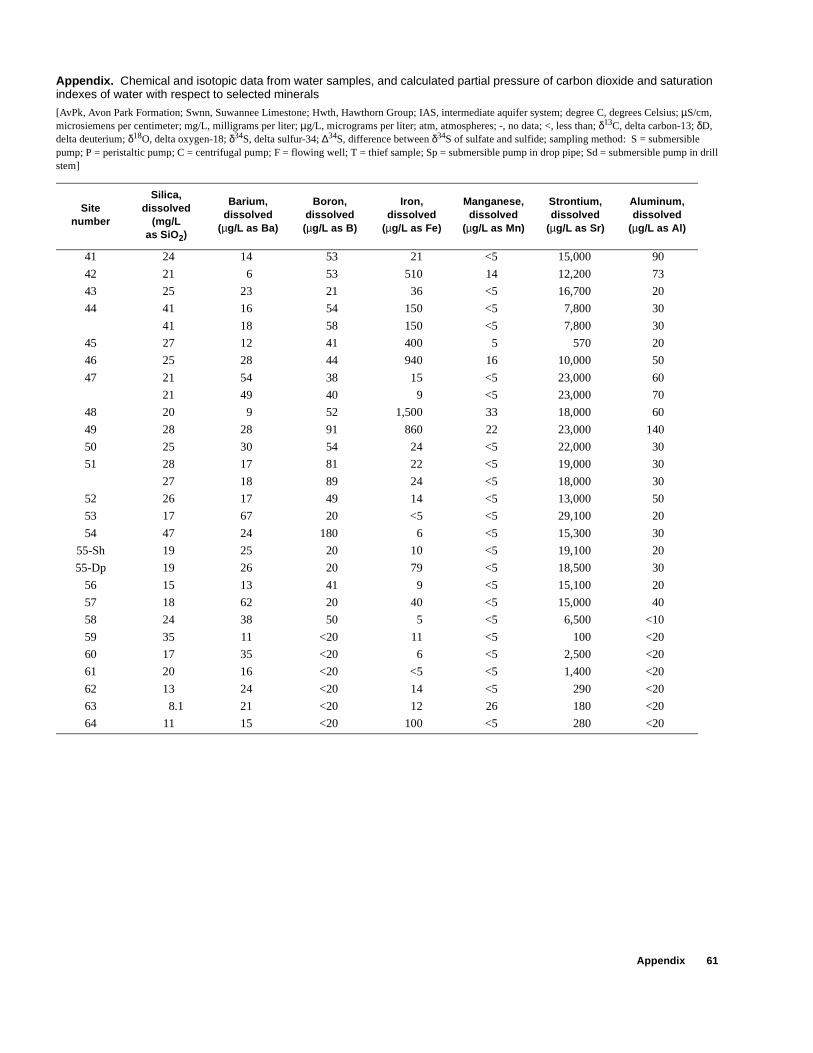
Appendix 61
Appendix. Chemical and isotopic data from water samples, and calculated partial pressure of carbon dioxide and saturation indexes of water with respect to selected minerals
[AvPk, Avon Park Formation; Swnn, Suwannee Limestone; Hwth, Hawthorn Group; IAS, intermediate aquifer system; degree C, degrees Celsius; µS/cm, microsiemens per centimeter; mg/L, milligrams per liter; µg/L, micrograms per liter; atm, atmospheres; -, no data; <, less than; δ13C, delta carbon-13; δD, delta deuterium; δ18O, delta oxygen-18; δ34S, delta sulfur-34; ∆34S, difference between δ34S of sulfate and sulfide; sampling method: S = submersible pump; P = peristaltic pump; C = centrifugal pump; F = flowing well; T = thief sample; Sp = submersible pump in drop pipe; Sd = submersible pump in drill stem]
Sitenumber
Silica,dissolved
(mg/Las SiO2)
Barium,dissolved
(µg/L as Ba)
Boron,dissolved(µg/L as B)
Iron,dissolved
(µg/L as Fe)
Manganese,dissolved
(µg/L as Mn)
Strontium,dissolved
(µg/L as Sr)
Aluminum,dissolved
(µg/L as Al)
41 24 14 53 21 <5 15,000 90
42 21 6 53 510 14 12,200 73
43 25 23 21 36 <5 16,700 20
44 41 16 54 150 <5 7,800 30
41 18 58 150 <5 7,800 30
45 27 12 41 400 5 570 20
46 25 28 44 940 16 10,000 50
47 21 54 38 15 <5 23,000 60
21 49 40 9 <5 23,000 70
48 20 9 52 1,500 33 18,000 60
49 28 28 91 860 22 23,000 140
50 25 30 54 24 <5 22,000 30
51 28 17 81 22 <5 19,000 30
27 18 89 24 <5 18,000 30
52 26 17 49 14 <5 13,000 50
53 17 67 20 <5 <5 29,100 20
54 47 24 180 6 <5 15,300 30
55-Sh 19 25 20 10 <5 19,100 20
55-Dp 19 26 20 79 <5 18,500 30
56 15 13 41 9 <5 15,100 20
57 18 62 20 40 <5 15,000 40
58 24 38 50 5 <5 6,500 <10
59 35 11 <20 11 <5 100 <20
60 17 35 <20 6 <5 2,500 <20
61 20 16 <20 <5 <5 1,400 <20
62 13 24 <20 14 <5 290 <20
63 8.1 21 <20 12 26 180 <20
64 11 15 <20 100 <5 280 <20
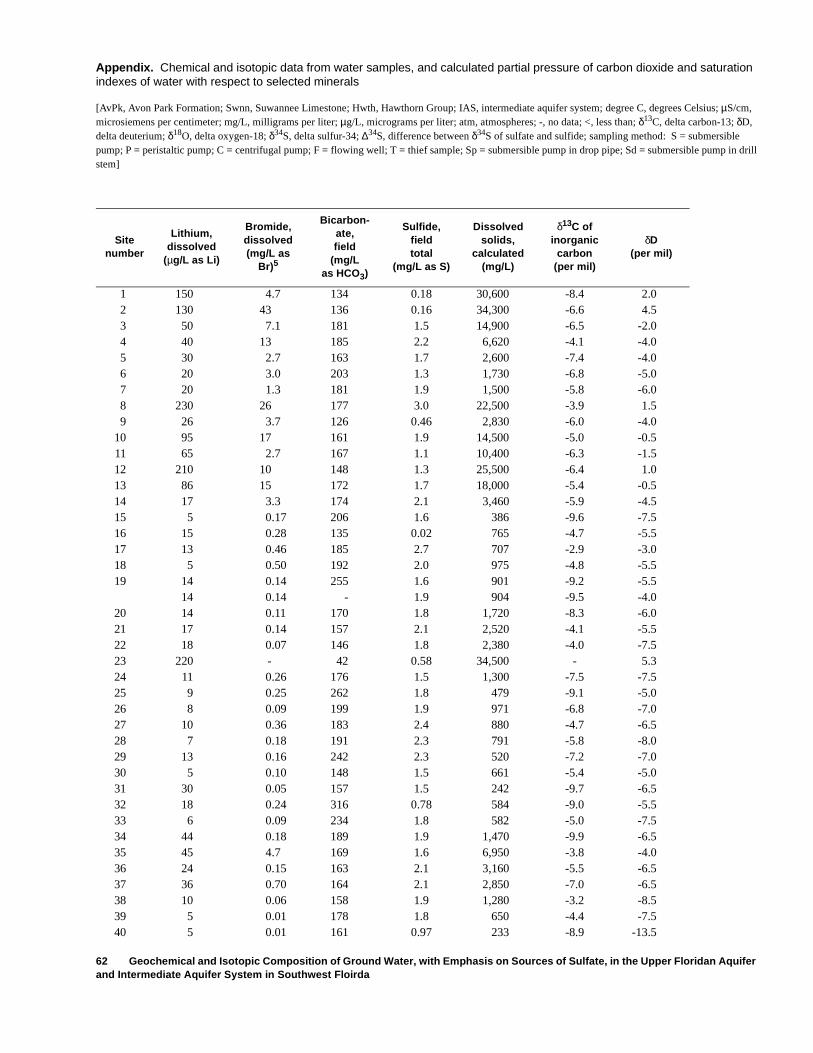
62 Geochemical and Isotopic Composition of Ground Water, with Emphasis on Sources of Sulfate, in the Upper Floridan Aquifer and Intermediate Aquifer System in Southwest Floirda
Appendix. Chemical and isotopic data from water samples, and calculated partial pressure of carbon dioxide and saturation indexes of water with respect to selected minerals
[AvPk, Avon Park Formation; Swnn, Suwannee Limestone; Hwth, Hawthorn Group; IAS, intermediate aquifer system; degree C, degrees Celsius; µS/cm, microsiemens per centimeter; mg/L, milligrams per liter; µg/L, micrograms per liter; atm, atmospheres; -, no data; <, less than; δ13C, delta carbon-13; δD, delta deuterium; δ18O, delta oxygen-18; δ34S, delta sulfur-34; ∆34S, difference between δ34S of sulfate and sulfide; sampling method: S = submersible pump; P = peristaltic pump; C = centrifugal pump; F = flowing well; T = thief sample; Sp = submersible pump in drop pipe; Sd = submersible pump in drill stem]
Sitenumber
Lithium,dissolved
(µg/L as Li)
Bromide,dissolved(mg/L as
Br)5
Bicarbon-ate,field
(mg/Las HCO3)
Sulfide,fieldtotal
(mg/L as S)
Dissolvedsolids,
calculated(mg/L)
δ13C ofinorganic
carbon(per mil)
δD (per mil)
1 150 4.7 134 0.18 30,600 -8.4 2.02 130 43 136 0.16 34,300 -6.6 4.53 50 7.1 181 1.5 14,900 -6.5 -2.04 40 13 185 2.2 6,620 -4.1 -4.05 30 2.7 163 1.7 2,600 -7.4 -4.06 20 3.0 203 1.3 1,730 -6.8 -5.07 20 1.3 181 1.9 1,500 -5.8 -6.08 230 26 177 3.0 22,500 -3.9 1.59 26 3.7 126 0.46 2,830 -6.0 -4.0
10 95 17 161 1.9 14,500 -5.0 -0.511 65 2.7 167 1.1 10,400 -6.3 -1.512 210 10 148 1.3 25,500 -6.4 1.013 86 15 172 1.7 18,000 -5.4 -0.514 17 3.3 174 2.1 3,460 -5.9 -4.515 5 0.17 206 1.6 386 -9.6 -7.516 15 0.28 135 0.02 765 -4.7 -5.517 13 0.46 185 2.7 707 -2.9 -3.018 5 0.50 192 2.0 975 -4.8 -5.519 14 0.14 255 1.6 901 -9.2 -5.5
14 0.14 - 1.9 904 -9.5 -4.020 14 0.11 170 1.8 1,720 -8.3 -6.021 17 0.14 157 2.1 2,520 -4.1 -5.522 18 0.07 146 1.8 2,380 -4.0 -7.523 220 - 42 0.58 34,500 - 5.324 11 0.26 176 1.5 1,300 -7.5 -7.525 9 0.25 262 1.8 479 -9.1 -5.026 8 0.09 199 1.9 971 -6.8 -7.027 10 0.36 183 2.4 880 -4.7 -6.528 7 0.18 191 2.3 791 -5.8 -8.029 13 0.16 242 2.3 520 -7.2 -7.030 5 0.10 148 1.5 661 -5.4 -5.031 30 0.05 157 1.5 242 -9.7 -6.532 18 0.24 316 0.78 584 -9.0 -5.533 6 0.09 234 1.8 582 -5.0 -7.534 44 0.18 189 1.9 1,470 -9.9 -6.535 45 4.7 169 1.6 6,950 -3.8 -4.036 24 0.15 163 2.1 3,160 -5.5 -6.537 36 0.70 164 2.1 2,850 -7.0 -6.538 10 0.06 158 1.9 1,280 -3.2 -8.539 5 0.01 178 1.8 650 -4.4 -7.540 5 0.01 161 0.97 233 -8.9 -13.5
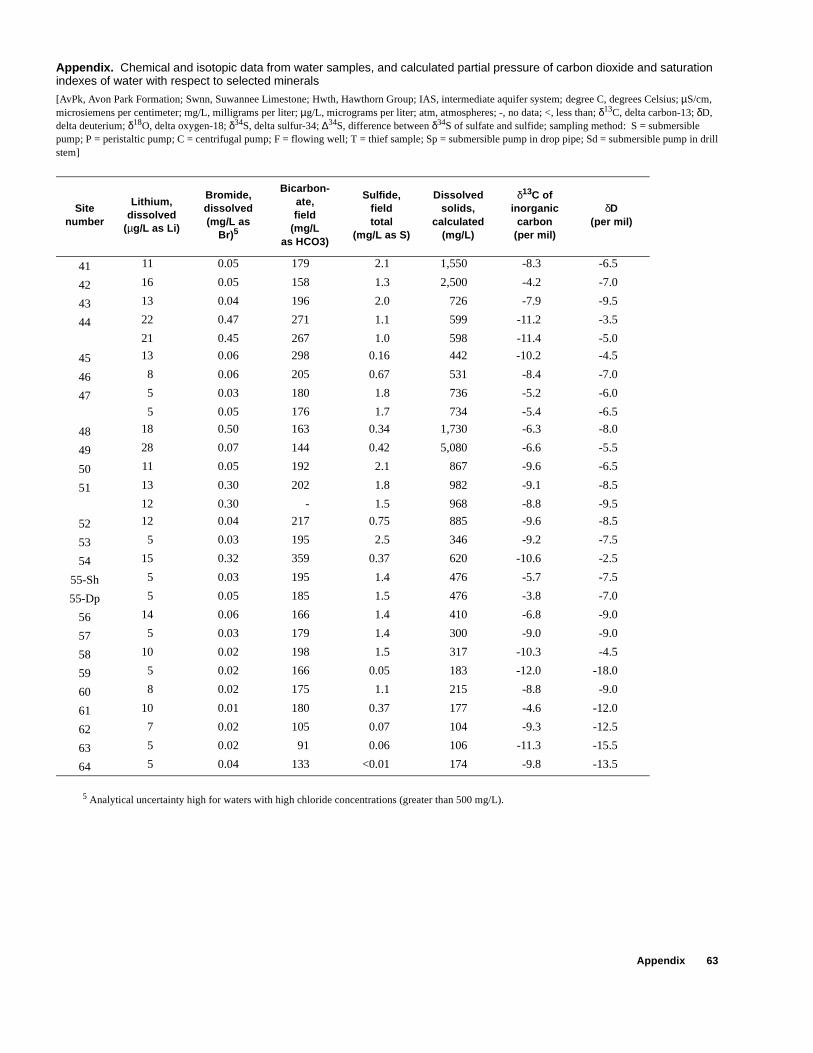
Appendix 63
Appendix. Chemical and isotopic data from water samples, and calculated partial pressure of carbon dioxide and saturation indexes of water with respect to selected minerals
[AvPk, Avon Park Formation; Swnn, Suwannee Limestone; Hwth, Hawthorn Group; IAS, intermediate aquifer system; degree C, degrees Celsius; µS/cm, microsiemens per centimeter; mg/L, milligrams per liter; µg/L, micrograms per liter; atm, atmospheres; -, no data; <, less than; δ13C, delta carbon-13; δD, delta deuterium; δ18O, delta oxygen-18; δ34S, delta sulfur-34; ∆34S, difference between δ34S of sulfate and sulfide; sampling method: S = submersible pump; P = peristaltic pump; C = centrifugal pump; F = flowing well; T = thief sample; Sp = submersible pump in drop pipe; Sd = submersible pump in drill stem]
5 Analytical uncertainty high for waters with high chloride concentrations (greater than 500 mg/L).
Sitenumber
Lithium,dissolved
(µg/L as Li)
Bromide,dissolved(mg/L as
Br)5
Bicarbon-ate,field
(mg/Las HCO3)
Sulfide,fieldtotal
(mg/L as S)
Dissolvedsolids,
calculated(mg/L)
δ13C ofinorganic
carbon(per mil)
δD (per mil)
41 11 0.05 179 2.1 1,550 -8.3 -6.5
42 16 0.05 158 1.3 2,500 -4.2 -7.0
43 13 0.04 196 2.0 726 -7.9 -9.5
44 22 0.47 271 1.1 599 -11.2 -3.5
21 0.45 267 1.0 598 -11.4 -5.0
45 13 0.06 298 0.16 442 -10.2 -4.5
46 8 0.06 205 0.67 531 -8.4 -7.0
47 5 0.03 180 1.8 736 -5.2 -6.0
5 0.05 176 1.7 734 -5.4 -6.5
48 18 0.50 163 0.34 1,730 -6.3 -8.0
49 28 0.07 144 0.42 5,080 -6.6 -5.5
50 11 0.05 192 2.1 867 -9.6 -6.5
51 13 0.30 202 1.8 982 -9.1 -8.5
12 0.30 - 1.5 968 -8.8 -9.5
52 12 0.04 217 0.75 885 -9.6 -8.5
53 5 0.03 195 2.5 346 -9.2 -7.5
54 15 0.32 359 0.37 620 -10.6 -2.5
55-Sh 5 0.03 195 1.4 476 -5.7 -7.5
55-Dp 5 0.05 185 1.5 476 -3.8 -7.0
56 14 0.06 166 1.4 410 -6.8 -9.0
57 5 0.03 179 1.4 300 -9.0 -9.0
58 10 0.02 198 1.5 317 -10.3 -4.5
59 5 0.02 166 0.05 183 -12.0 -18.0
60 8 0.02 175 1.1 215 -8.8 -9.0
61 10 0.01 180 0.37 177 -4.6 -12.0
62 7 0.02 105 0.07 104 -9.3 -12.5
63 5 0.02 91 0.06 106 -11.3 -15.5
64 5 0.04 133 <0.01 174 -9.8 -13.5
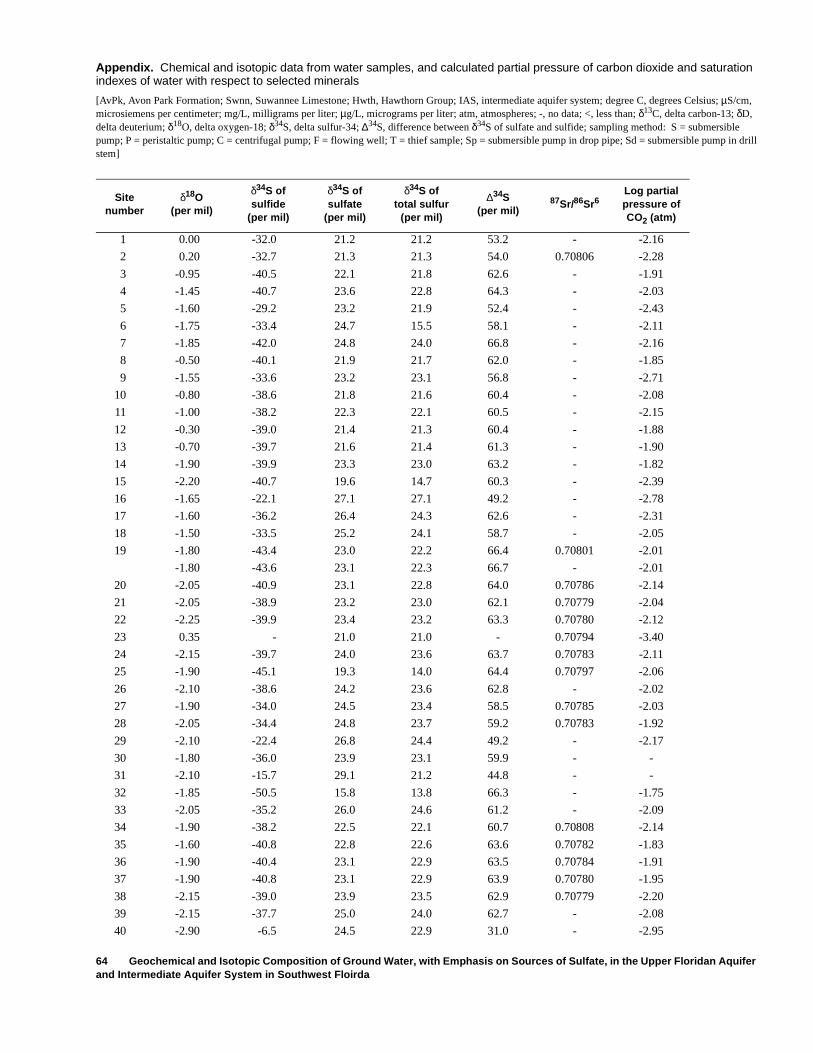
64 Geochemical and Isotopic Composition of Ground Water, with Emphasis on Sources of Sulfate, in the Upper Floridan Aquifer and Intermediate Aquifer System in Southwest Floirda
Appendix. Chemical and isotopic data from water samples, and calculated partial pressure of carbon dioxide and saturation indexes of water with respect to selected minerals
[AvPk, Avon Park Formation; Swnn, Suwannee Limestone; Hwth, Hawthorn Group; IAS, intermediate aquifer system; degree C, degrees Celsius; µS/cm, microsiemens per centimeter; mg/L, milligrams per liter; µg/L, micrograms per liter; atm, atmospheres; -, no data; <, less than; δ13C, delta carbon-13; δD, delta deuterium; δ18O, delta oxygen-18; δ34S, delta sulfur-34; ∆34S, difference between δ34S of sulfate and sulfide; sampling method: S = submersible pump; P = peristaltic pump; C = centrifugal pump; F = flowing well; T = thief sample; Sp = submersible pump in drop pipe; Sd = submersible pump in drill stem]
Sitenumber
δ18O (per mil)
δ34S ofsulfide
(per mil)
δ34S ofsulfate
(per mil)
δ34S oftotal sulfur
(per mil)
∆34S(per mil)
87Sr/86Sr6 Log partialpressure ofCO2 (atm)
1 0.00 -32.0 21.2 21.2 53.2 - -2.16
2 0.20 -32.7 21.3 21.3 54.0 0.70806 -2.28
3 -0.95 -40.5 22.1 21.8 62.6 - -1.91
4 -1.45 -40.7 23.6 22.8 64.3 - -2.03
5 -1.60 -29.2 23.2 21.9 52.4 - -2.43
6 -1.75 -33.4 24.7 15.5 58.1 - -2.11
7 -1.85 -42.0 24.8 24.0 66.8 - -2.16
8 -0.50 -40.1 21.9 21.7 62.0 - -1.85
9 -1.55 -33.6 23.2 23.1 56.8 - -2.71
10 -0.80 -38.6 21.8 21.6 60.4 - -2.08
11 -1.00 -38.2 22.3 22.1 60.5 - -2.15
12 -0.30 -39.0 21.4 21.3 60.4 - -1.88
13 -0.70 -39.7 21.6 21.4 61.3 - -1.90
14 -1.90 -39.9 23.3 23.0 63.2 - -1.82
15 -2.20 -40.7 19.6 14.7 60.3 - -2.39
16 -1.65 -22.1 27.1 27.1 49.2 - -2.78
17 -1.60 -36.2 26.4 24.3 62.6 - -2.31
18 -1.50 -33.5 25.2 24.1 58.7 - -2.05
19 -1.80 -43.4 23.0 22.2 66.4 0.70801 -2.01
-1.80 -43.6 23.1 22.3 66.7 - -2.01
20 -2.05 -40.9 23.1 22.8 64.0 0.70786 -2.14
21 -2.05 -38.9 23.2 23.0 62.1 0.70779 -2.04
22 -2.25 -39.9 23.4 23.2 63.3 0.70780 -2.12
23 0.35 - 21.0 21.0 - 0.70794 -3.40
24 -2.15 -39.7 24.0 23.6 63.7 0.70783 -2.11
25 -1.90 -45.1 19.3 14.0 64.4 0.70797 -2.06
26 -2.10 -38.6 24.2 23.6 62.8 - -2.02
27 -1.90 -34.0 24.5 23.4 58.5 0.70785 -2.03
28 -2.05 -34.4 24.8 23.7 59.2 0.70783 -1.92
29 -2.10 -22.4 26.8 24.4 49.2 - -2.17
30 -1.80 -36.0 23.9 23.1 59.9 - -
31 -2.10 -15.7 29.1 21.2 44.8 - -
32 -1.85 -50.5 15.8 13.8 66.3 - -1.75
33 -2.05 -35.2 26.0 24.6 61.2 - -2.09
34 -1.90 -38.2 22.5 22.1 60.7 0.70808 -2.14
35 -1.60 -40.8 22.8 22.6 63.6 0.70782 -1.83
36 -1.90 -40.4 23.1 22.9 63.5 0.70784 -1.91
37 -1.90 -40.8 23.1 22.9 63.9 0.70780 -1.95
38 -2.15 -39.0 23.9 23.5 62.9 0.70779 -2.20
39 -2.15 -37.7 25.0 24.0 62.7 - -2.08
40 -2.90 -6.5 24.5 22.9 31.0 - -2.95
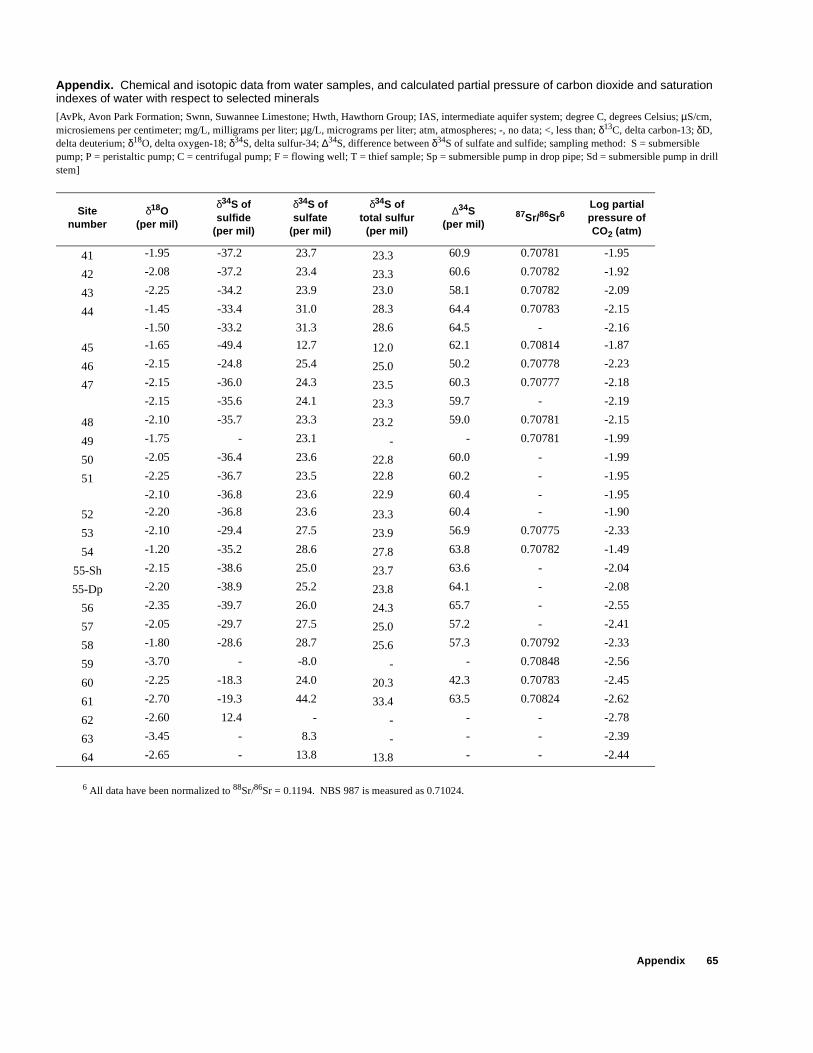
Appendix 65
Appendix. Chemical and isotopic data from water samples, and calculated partial pressure of carbon dioxide and saturation indexes of water with respect to selected minerals
[AvPk, Avon Park Formation; Swnn, Suwannee Limestone; Hwth, Hawthorn Group; IAS, intermediate aquifer system; degree C, degrees Celsius; µS/cm, microsiemens per centimeter; mg/L, milligrams per liter; µg/L, micrograms per liter; atm, atmospheres; -, no data; <, less than; δ13C, delta carbon-13; δD, delta deuterium; δ18O, delta oxygen-18; δ34S, delta sulfur-34; ∆34S, difference between δ34S of sulfate and sulfide; sampling method: S = submersible pump; P = peristaltic pump; C = centrifugal pump; F = flowing well; T = thief sample; Sp = submersible pump in drop pipe; Sd = submersible pump in drill stem]
6 All data have been normalized to 88Sr/86Sr = 0.1194. NBS 987 is measured as 0.71024.
Sitenumber
δ18O (per mil)
δ34S ofsulfide
(per mil)
δ34S ofsulfate
(per mil)
δ34S oftotal sulfur
(per mil)
∆34S(per mil)
87Sr/86Sr6 Log partialpressure ofCO2 (atm)
41 -1.95 -37.2 23.7 23.3 60.9 0.70781 -1.95
42 -2.08 -37.2 23.4 23.3 60.6 0.70782 -1.92
43 -2.25 -34.2 23.9 23.0 58.1 0.70782 -2.09
44 -1.45 -33.4 31.0 28.3 64.4 0.70783 -2.15
-1.50 -33.2 31.3 28.6 64.5 - -2.16
45 -1.65 -49.4 12.7 12.0 62.1 0.70814 -1.87
46 -2.15 -24.8 25.4 25.0 50.2 0.70778 -2.23
47 -2.15 -36.0 24.3 23.5 60.3 0.70777 -2.18
-2.15 -35.6 24.1 23.3 59.7 - -2.19
48 -2.10 -35.7 23.3 23.2 59.0 0.70781 -2.15
49 -1.75 - 23.1 - - 0.70781 -1.99
50 -2.05 -36.4 23.6 22.8 60.0 - -1.99
51 -2.25 -36.7 23.5 22.8 60.2 - -1.95
-2.10 -36.8 23.6 22.9 60.4 - -1.95
52 -2.20 -36.8 23.6 23.3 60.4 - -1.90
53 -2.10 -29.4 27.5 23.9 56.9 0.70775 -2.33
54 -1.20 -35.2 28.6 27.8 63.8 0.70782 -1.49
55-Sh -2.15 -38.6 25.0 23.7 63.6 - -2.04
55-Dp -2.20 -38.9 25.2 23.8 64.1 - -2.08
56 -2.35 -39.7 26.0 24.3 65.7 - -2.55
57 -2.05 -29.7 27.5 25.0 57.2 - -2.41
58 -1.80 -28.6 28.7 25.6 57.3 0.70792 -2.33
59 -3.70 - -8.0 - - 0.70848 -2.56
60 -2.25 -18.3 24.0 20.3 42.3 0.70783 -2.45
61 -2.70 -19.3 44.2 33.4 63.5 0.70824 -2.62
62 -2.60 12.4 - - - - -2.78
63 -3.45 - 8.3 - - - -2.39
64 -2.65 - 13.8 13.8 - - -2.44
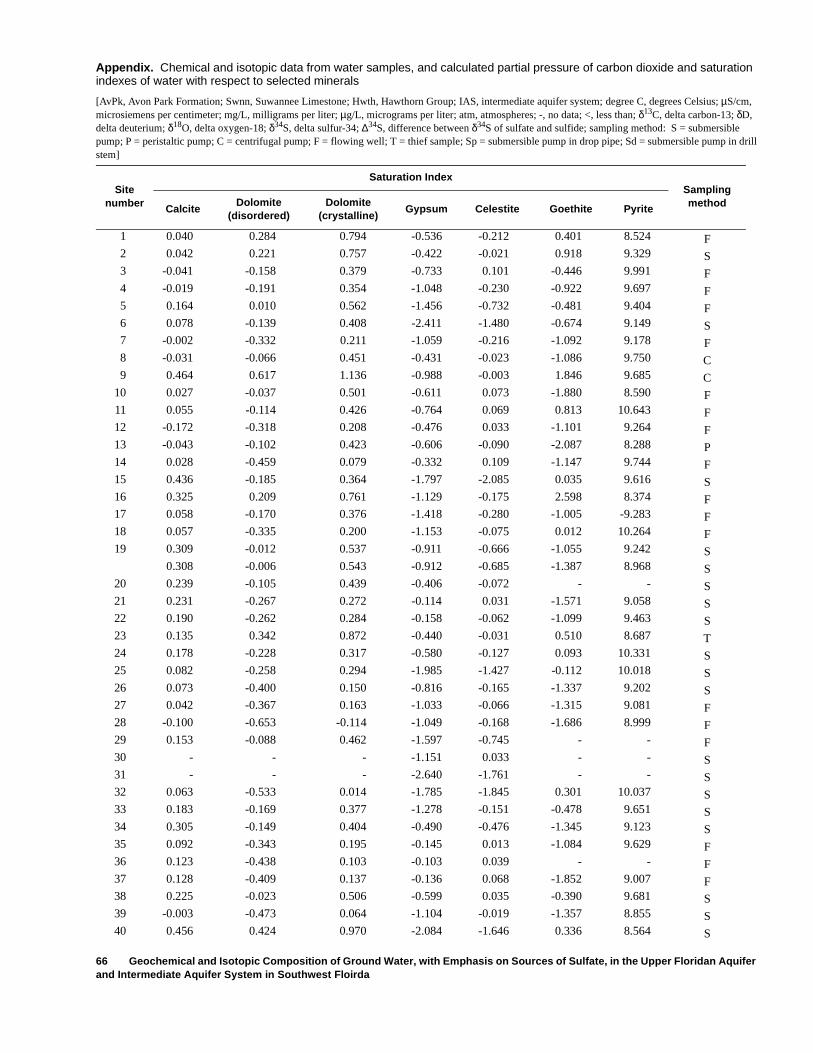
66 Geochemical and Isotopic Composition of Ground Water, with Emphasis on Sources of Sulfate, in the Upper Floridan Aquifer and Intermediate Aquifer System in Southwest Floirda
Appendix. Chemical and isotopic data from water samples, and calculated partial pressure of carbon dioxide and saturation indexes of water with respect to selected minerals
[AvPk, Avon Park Formation; Swnn, Suwannee Limestone; Hwth, Hawthorn Group; IAS, intermediate aquifer system; degree C, degrees Celsius; µS/cm, microsiemens per centimeter; mg/L, milligrams per liter; µg/L, micrograms per liter; atm, atmospheres; -, no data; <, less than; δ13C, delta carbon-13; δD, delta deuterium; δ18O, delta oxygen-18; δ34S, delta sulfur-34; ∆34S, difference between δ34S of sulfate and sulfide; sampling method: S = submersible pump; P = peristaltic pump; C = centrifugal pump; F = flowing well; T = thief sample; Sp = submersible pump in drop pipe; Sd = submersible pump in drill stem]
Sitenumber
Saturation IndexSamplingmethodCalcite
Dolomite(disordered)
Dolomite(crystalline)
Gypsum Celestite Goethite Pyrite
1 0.040 0.284 0.794 -0.536 -0.212 0.401 8.524 F2 0.042 0.221 0.757 -0.422 -0.021 0.918 9.329 S3 -0.041 -0.158 0.379 -0.733 0.101 -0.446 9.991 F4 -0.019 -0.191 0.354 -1.048 -0.230 -0.922 9.697 F5 0.164 0.010 0.562 -1.456 -0.732 -0.481 9.404 F6 0.078 -0.139 0.408 -2.411 -1.480 -0.674 9.149 S7 -0.002 -0.332 0.211 -1.059 -0.216 -1.092 9.178 F8 -0.031 -0.066 0.451 -0.431 -0.023 -1.086 9.750 C9 0.464 0.617 1.136 -0.988 -0.003 1.846 9.685 C
10 0.027 -0.037 0.501 -0.611 0.073 -1.880 8.590 F11 0.055 -0.114 0.426 -0.764 0.069 0.813 10.643 F12 -0.172 -0.318 0.208 -0.476 0.033 -1.101 9.264 F13 -0.043 -0.102 0.423 -0.606 -0.090 -2.087 8.288 P14 0.028 -0.459 0.079 -0.332 0.109 -1.147 9.744 F15 0.436 -0.185 0.364 -1.797 -2.085 0.035 9.616 S16 0.325 0.209 0.761 -1.129 -0.175 2.598 8.374 F17 0.058 -0.170 0.376 -1.418 -0.280 -1.005 -9.283 F18 0.057 -0.335 0.200 -1.153 -0.075 0.012 10.264 F19 0.309 -0.012 0.537 -0.911 -0.666 -1.055 9.242 S
0.308 -0.006 0.543 -0.912 -0.685 -1.387 8.968 S20 0.239 -0.105 0.439 -0.406 -0.072 - - S21 0.231 -0.267 0.272 -0.114 0.031 -1.571 9.058 S22 0.190 -0.262 0.284 -0.158 -0.062 -1.099 9.463 S23 0.135 0.342 0.872 -0.440 -0.031 0.510 8.687 T24 0.178 -0.228 0.317 -0.580 -0.127 0.093 10.331 S25 0.082 -0.258 0.294 -1.985 -1.427 -0.112 10.018 S26 0.073 -0.400 0.150 -0.816 -0.165 -1.337 9.202 S27 0.042 -0.367 0.163 -1.033 -0.066 -1.315 9.081 F28 -0.100 -0.653 -0.114 -1.049 -0.168 -1.686 8.999 F29 0.153 -0.088 0.462 -1.597 -0.745 - - F30 - - - -1.151 0.033 - - S31 - - - -2.640 -1.761 - - S32 0.063 -0.533 0.014 -1.785 -1.845 0.301 10.037 S33 0.183 -0.169 0.377 -1.278 -0.151 -0.478 9.651 S34 0.305 -0.149 0.404 -0.490 -0.476 -1.345 9.123 S35 0.092 -0.343 0.195 -0.145 0.013 -1.084 9.629 F36 0.123 -0.438 0.103 -0.103 0.039 - - F37 0.128 -0.409 0.137 -0.136 0.068 -1.852 9.007 F38 0.225 -0.023 0.506 -0.599 0.035 -0.390 9.681 S39 -0.003 -0.473 0.064 -1.104 -0.019 -1.357 8.855 S40 0.456 0.424 0.970 -2.084 -1.646 0.336 8.564 S
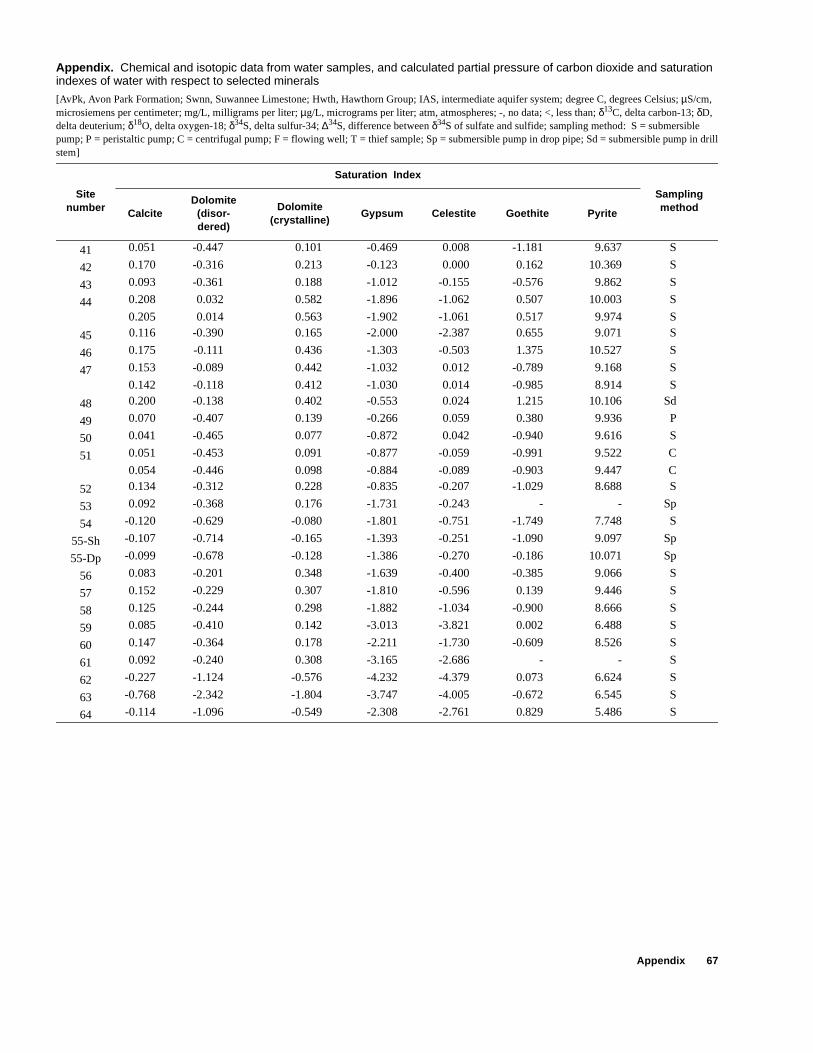
Appendix 67
Appendix. Chemical and isotopic data from water samples, and calculated partial pressure of carbon dioxide and saturation indexes of water with respect to selected minerals
[AvPk, Avon Park Formation; Swnn, Suwannee Limestone; Hwth, Hawthorn Group; IAS, intermediate aquifer system; degree C, degrees Celsius; µS/cm, microsiemens per centimeter; mg/L, milligrams per liter; µg/L, micrograms per liter; atm, atmospheres; -, no data; <, less than; δ13C, delta carbon-13; δD, delta deuterium; δ18O, delta oxygen-18; δ34S, delta sulfur-34; ∆34S, difference between δ34S of sulfate and sulfide; sampling method: S = submersible pump; P = peristaltic pump; C = centrifugal pump; F = flowing well; T = thief sample; Sp = submersible pump in drop pipe; Sd = submersible pump in drill stem]
Sitenumber
Saturation Index
SamplingmethodCalcite
Dolomite(disor-dered)
Dolomite(crystalline)
Gypsum Celestite Goethite Pyrite
41 0.051 -0.447 0.101 -0.469 0.008 -1.181 9.637 S
42 0.170 -0.316 0.213 -0.123 0.000 0.162 10.369 S
43 0.093 -0.361 0.188 -1.012 -0.155 -0.576 9.862 S
44 0.208 0.032 0.582 -1.896 -1.062 0.507 10.003 S
0.205 0.014 0.563 -1.902 -1.061 0.517 9.974 S
45 0.116 -0.390 0.165 -2.000 -2.387 0.655 9.071 S
46 0.175 -0.111 0.436 -1.303 -0.503 1.375 10.527 S
47 0.153 -0.089 0.442 -1.032 0.012 -0.789 9.168 S
0.142 -0.118 0.412 -1.030 0.014 -0.985 8.914 S
48 0.200 -0.138 0.402 -0.553 0.024 1.215 10.106 Sd
49 0.070 -0.407 0.139 -0.266 0.059 0.380 9.936 P
50 0.041 -0.465 0.077 -0.872 0.042 -0.940 9.616 S
51 0.051 -0.453 0.091 -0.877 -0.059 -0.991 9.522 C
0.054 -0.446 0.098 -0.884 -0.089 -0.903 9.447 C
52 0.134 -0.312 0.228 -0.835 -0.207 -1.029 8.688 S
53 0.092 -0.368 0.176 -1.731 -0.243 - - Sp
54 -0.120 -0.629 -0.080 -1.801 -0.751 -1.749 7.748 S
55-Sh -0.107 -0.714 -0.165 -1.393 -0.251 -1.090 9.097 Sp
55-Dp -0.099 -0.678 -0.128 -1.386 -0.270 -0.186 10.071 Sp
56 0.083 -0.201 0.348 -1.639 -0.400 -0.385 9.066 S
57 0.152 -0.229 0.307 -1.810 -0.596 0.139 9.446 S
58 0.125 -0.244 0.298 -1.882 -1.034 -0.900 8.666 S
59 0.085 -0.410 0.142 -3.013 -3.821 0.002 6.488 S
60 0.147 -0.364 0.178 -2.211 -1.730 -0.609 8.526 S
61 0.092 -0.240 0.308 -3.165 -2.686 - - S
62 -0.227 -1.124 -0.576 -4.232 -4.379 0.073 6.624 S
63 -0.768 -2.342 -1.804 -3.747 -4.005 -0.672 6.545 S
64 -0.114 -1.096 -0.549 -2.308 -2.761 0.829 5.486 S