geocens presentation on angelo coast range reserve environmental sensor observatory by collin bode...
TRANSCRIPT

Angelo Coast Range Reserve
Environmental Sensor Observatory
Collin BodeProject Manager,
Desktop Watersheds Integrative Program,
National Center for Earth-surface Dynamics
& Specialist, Integrative Biology, UC Berkeley

Angelo Coast Range Reserve
• Banff
• NCED primary field site• UC Natural Reserve System• Rapidly eroding upland watershed• South Fork Eel River• Vegetation:
• Douglas Fir, Redwood• Oak, Madrone• Chaparral

Environmental Observatory Research Value
“Mapping, Tracing, and Wireless Sensor technologies may do for ecology in the 21st century what DNA sequencing did for genetics in the 20th century.” – Beth Burnside, molecular biologist
and Vice Chancellor for Research at UCB
Spatial extents & frequency from 52 Articles from Ecology Journal 2003 -2004 (Porter, BioScience, 2005).
Definition: An environmental sensor observatory is a distributed array of sensors connected by a network that is aggregated into a single dataset.
It becomes an observatory when the combination of sensors provides information not possible to achieve by individual sensors.
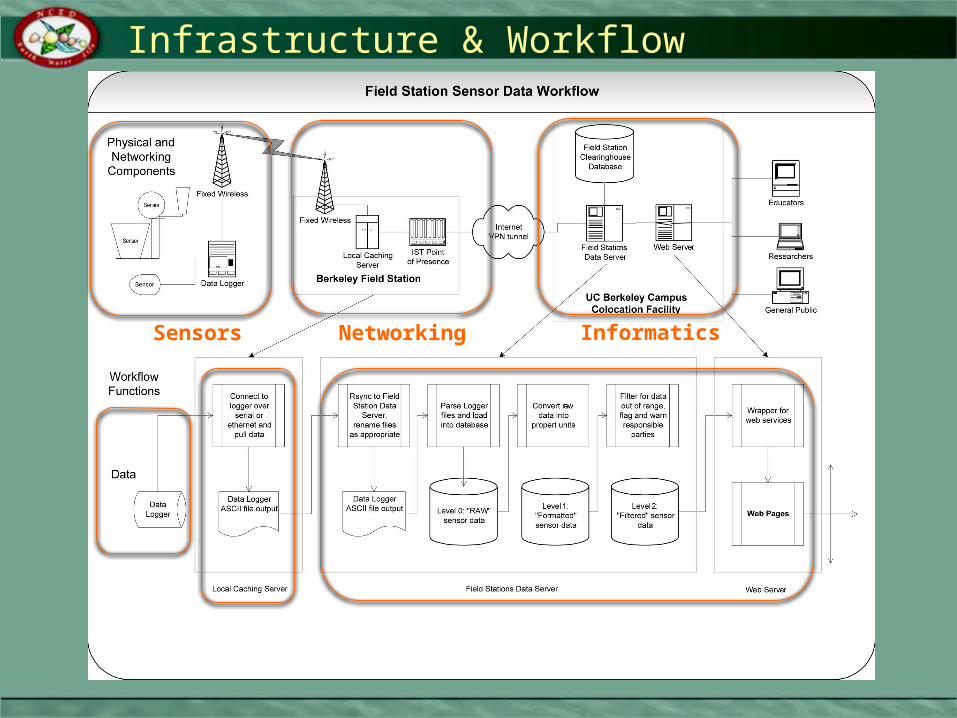
Infrastructure & Workflow
NetworkingSensors Informatics

Sensor Deployment
Sensors

Sensors: Keck HydroWatch Project
PI: Inez Fung, Atmospheric Scientist, Climate modeler
Co-PI’s:– Bill Dietrich, Geomorphologist – Todd Dawson, Tree physiology– David Culler, Computer Science
• Motes, TinyOS, CENS
Purpose: Trace and understand water movement between atmosphere to subsurface mediated by vegetation.
Field Site: Rivendell – 130 x 30 meter north facing micro-watershed– Dominated by Douglas Fir– Elder Creek at base

Angelo Coast Range Reserve
Rivendell: Keck HydroWatch Project Study Site

Sensors: Keck HydroWatch, Rivendell Study Site
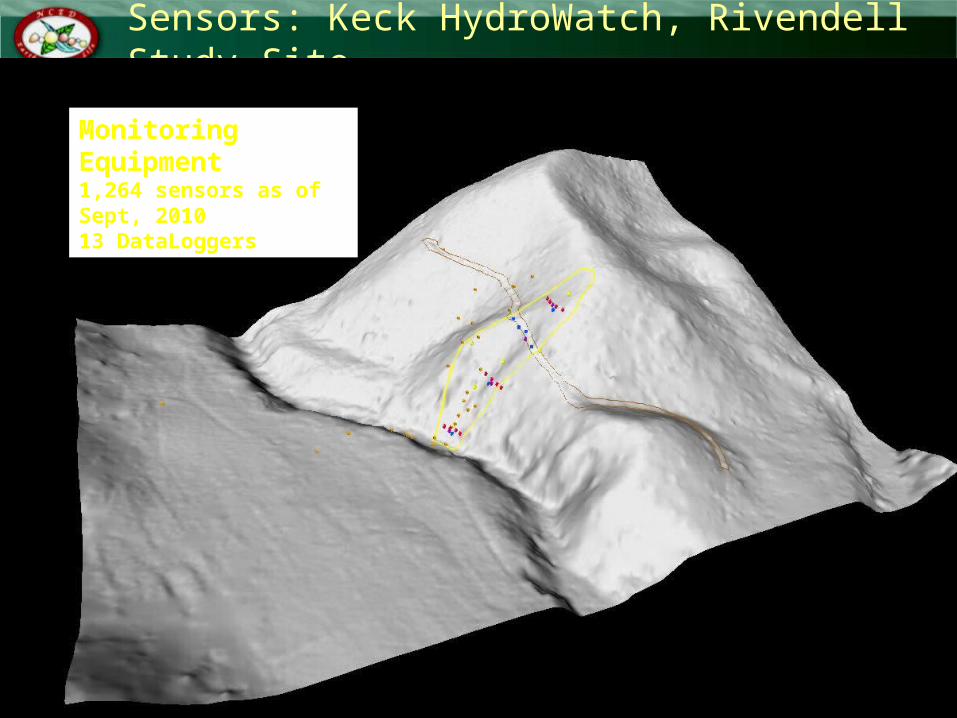
Sensors: Keck HydroWatch, Rivendell Study Site
Monitoring Equipment1,264 sensors as of Sept, 201013 DataLoggers

Sensor Deployment: Rivendell & Weather Stations July, 2010
Parameter Monitored Campbell Mote Others* TotalsBarometric Pressure mb 10 10Air Temp C 30 29 32 91Logger internal Temp c 11 29 40Soil Temperature 69 69Soil moisture TDR (dialectric) 100 100Soil moisture ERP (resistance) 192 192Soil Moisture SM200 30 30Water Temp C 2 1 3Gage Height meters 11 1 12Turbidity NTU 1 1Water Samples 2 2Rainfall mm 12 1 13Hail Cumulative mm 2 2Hail Intensity mmh 2 2Rel Humidity Perc 55 29 31 110Snow Depth Meters 1 1Total Solar Radiation W/m2 4 29 30** 63PAR 29 35 64Wind Direction Degrees 12 1 13Wind Speed Avg MS 18 1 19Sap Flow velocity 154 154Battery Voltage 24 29 1 54Totals 575 174 290 1039* Sap Flow Loggers, OWL logger, HOBO pendants, Isco Samplers ** HOBO pendants offline

Sensor Deployment: Rivendell

Wireless Network Architecture
Networking

Power Tree: Ursula
Power Tree: Ingrid
PowerTree: Ilean
Tree: FlattopNo solar power
Power Tree: Brandywine:
Power Tree: Treebeard
Sensors
Networks: Rivendell Study Site
BackboneNetwork
4 Wireless networks
Network Architectures1. Backbone
1. Heirarchical tree structure
2. Eion VIP110-243. 2.4ghz, 5 watts 4. VINES protocol
2. Campbell PakBus• Manually defined
relays• 900mhz, 1watt • Pakbus protocol
3. Motes• Mesh structure • 2.4ghz, extremely low
power• Single base station to
Backbone• 802.15 protocol

Cahto PeakInternetAccess Point
RivendellKeck HydroWatchResearch Site
Backbone Network (VINES)
Mote & Campbell Network
Wifi (802.11n) Network
Wilderness LodgeBuilding
Steel ResidenceBuilding Science Center
Caching ServerAC power
Networks: Wireless Backbone
REBBackbone relay
UBERBackbone relay
BOBBackbone relay
FORBBackbone relay

Peter Steel, Reserve Steward,Setting up radio and antenna
Collin Bode, configuring at 35 meters
Networks: Wireless Backbone, REB Construction

• Redwood height: 40 meters• Solar System total weight: 80kilos• Arms: very sore
Networks: REB Construction

Informatics: Berkeley Sensor Database
Informatics
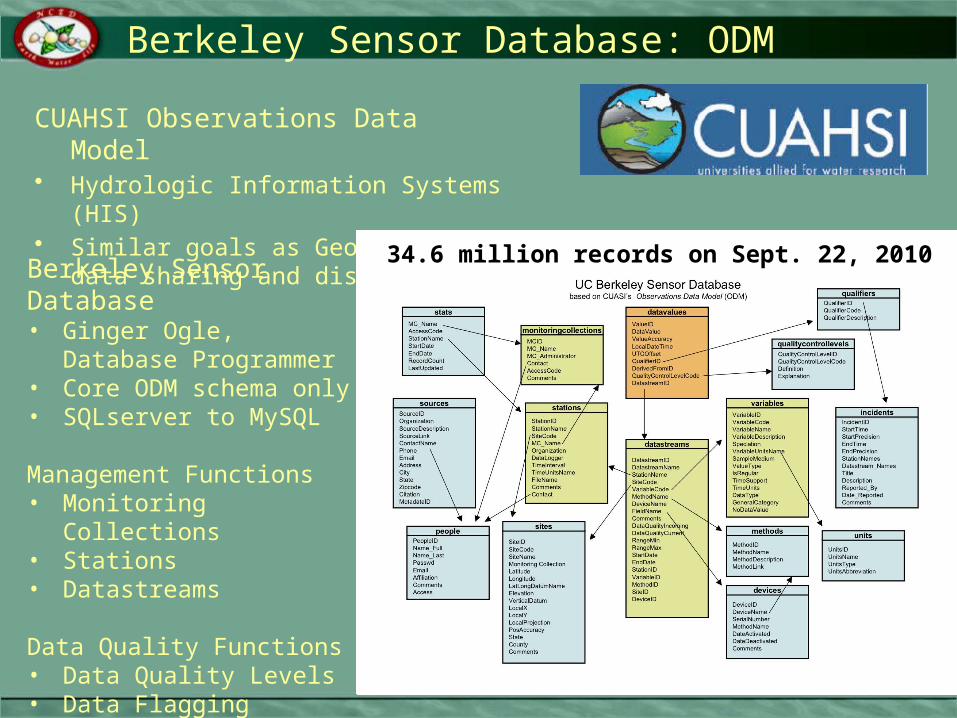
Berkeley Sensor Database: ODM
CUAHSI Observations Data Model• Hydrologic Information Systems (HIS)• Similar goals as GeoCENS in data
sharing and discovery
Berkeley Sensor Database • Ginger Ogle, Database
Programmer• Core ODM schema only• SQLserver to MySQL
Management Functions• Monitoring Collections• Stations• Datastreams
Data Quality Functions• Data Quality Levels• Data Flagging• Incident Reports
34.6 million records on Sept. 22, 2010

Berkeley Sensor Database: Researcher Use of Data
Type of Access Requirements Data Format
Web Access Web browser & valid project login
Graph & CSV download
Direct MySQL Access Knowledge of SQL SQL output
Matlab Matlab MysQL connector or Mathworks Database Toolbox
Matlab matrix format
Bulk Data Dumps Valid project login Zipped, CSV, weekly refresh
http://sensor.berkeley.edu
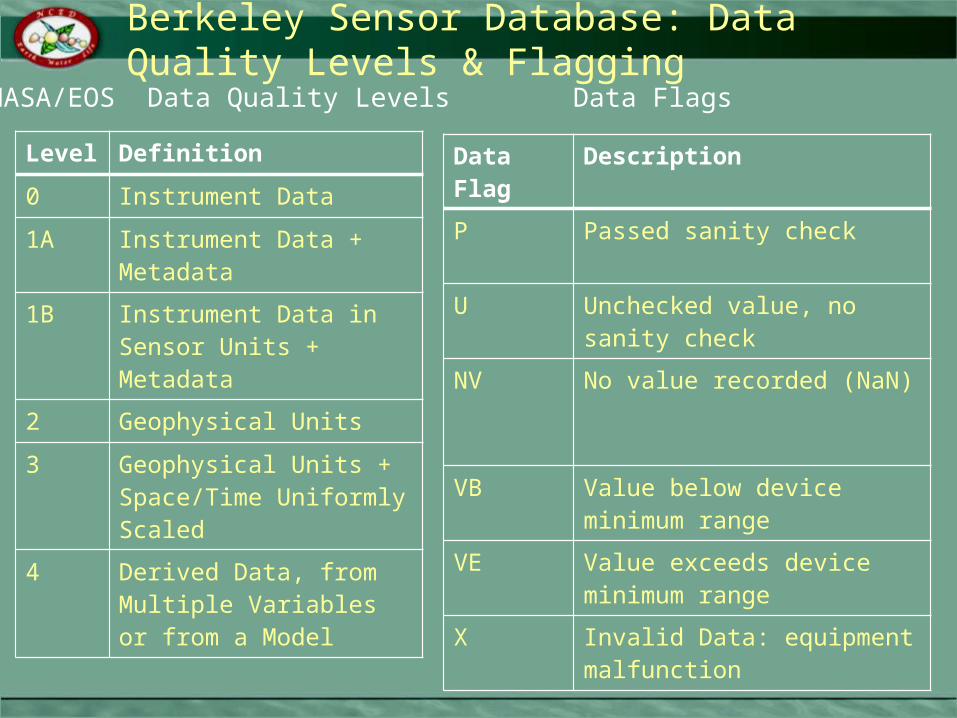
Berkeley Sensor Database: Data Quality Levels & Flagging
Data Flag Description
P Passed sanity check
U Unchecked value, no sanity check
NV No value recorded (NaN)
VB Value below device minimum range
VE Value exceeds device minimum range
X Invalid Data: equipment malfunction
Level Definition
0 Instrument Data
1A Instrument Data + Metadata
1B Instrument Data in Sensor Units + Metadata
2 Geophysical Units
3 Geophysical Units + Space/Time Uniformly Scaled
4 Derived Data, from Multiple Variables or from a Model
NASA/EOS Data Quality Levels Data Flags

Berkeley Sensor Database: Incident Reports
Incident ID 1
Title: Bear damageStation Name(s): Riv Level 1_1, Riv Level 1_2,
Riv Level 2_1, Riv Level 2_2,Riv Level 3_1, Riv Level 3_2, Riv Level 4_1
Datastream(s): resistance probes, rain collectorwells
Data Flagged: ERPs: 290,304 values Well 6: 3,024 valuesWell 7: 3,024 values
StartTime: 2009-09-24 (+/- 1 months)EndTime: 2009-10-24 (+/- 1 days)Reported By: Bill Dietrich (2009-10-26 00:00:00)
Description: Daniella, Jasper and I visited the site this past weekend. Unfortunately a bear did some damage recently. It systematically knocked over and chewed on everyone of the plastic bag covered resistance probes. They were each snapped at the soil boundary. I haven't had a chance to check to see when this might have happened according to the online record. The bear also knocked over the rainfall collector (James says he has found teeth marks in it before). It broke the extended plastic tube on well 7 and the wooden stake holding up the plastic tarp. and it knocked off the cap of well 6. We didn't detect other damage-- but there could be some. I encourage you all to check your favorite on line device. We put the cap back on 6, propped up well 7 tube and put back a stake. and reset up the rain collector.
