genworth financial letter - federal reserve system · genworth financial inc, . ... study concep...
TRANSCRIPT

Communication Between Federal Reserve Board Staff and Genworth Financial, Inc. (Genworth)
November 9, 2010
Participants: Matthew Eichner, Maureen Yap, and William Treacy (Federal Reserve Board)
Carol Bouchner, James Bennison, and Anthony Guarino (Genworth)
Summary: Staff of the Federal Reserve Board received from Genworth a joint letter, with attachments, from the Community Mortgage Banking Project, the Community Mortgage Lenders of America, Essent Guaranty, Inc., Genworth, Mortgage Guaranty Insurance Corporation, Radian Guaranty Inc., Republic Mortgage Insurance Company and The PMI Group, Inc. regarding the definition of "qualified residential mortgage." A copy of the joint letter, with attachments, provided by Genworth is attached below.

November 8, 2010
The Honorable Shaun Donovan
Secretary U.S. Department of Housing and Urban Development
The Honorable Ben S. Bernanke Chairman of the Board of Governors, Federal Reserve Board
The Honorable Sheila C. Bair Chairman, Federal Deposit Insurance Corporation
The Honorable Mary L. Shapiro Chairman, Securities and Exchange Commission
John Walsh
Acting Comptroller of the Currency, Office of the Comptroller of the Currency
Edward DeMarco Acting Director, Federal Housing Finance Agency
Re: Definition of Qualified Residential Mortgage Pursuant to Section 941 of the Dodd-Frank Wall Street Reform and Consumer Protection Act of 2010
Ladies and Gentlemen:
The undersigned organizations represent large and small mortgage lenders and mortgage insurers. As your agencies prepare to develop the definition of a "qualified residential mortgage" ("QRM") (required by Sec. 941 of the Dodd-Frank Wall Street Reform and Consumer Protection Act of 2010 (the "Dodd-Frank Act")), we urge you to consider the attached empirical analysis of more than 35 million mortgage loans. This analysis recommends a QRM definition that is firmly based on each of the elements of the statutory framework, and is supported by a robust default analysis that demonstrates a substantially lower default rate for these loans (as required by the Dodd-Frank Act).
Section 941(b) of the Dodd-Frank Act directs your agencies to jointly define a QRM which will be exempt from the risk retention requirements of the Act, taking into consideration an enumerated list of underwriting and product features that historical data indicate result in a lower risk of default. The QRM exemption was a critically important addition to the risk retention requirements of the Act. While risk retention can serve as a strong deterrent to some of the excessive risk taking that led to the housing crisis, if applied across-the-board it would impose significant costs that would reduce liquidity and boost mortgage rates by as much as 3 percentage points, according to some analyst estimates.1 (Foot note :JP Morgan Securities,
Securitization Outlook, December 11, 2009.)

By establishing clear, statutory standards for certain mortgages that would be exempt from risk retention, the QRM standard creates strong incentives for the origination and securitization of lower risk loans with proven underwriting and product features. Loans not meeting that standard would be subject to varying levels of risk retention. Higher risk lending is not prohibited, but must be done in portfolio (and thus be subject to bank capital requirements) or through securitization structures that require risk retention. This balanced approach to risk retention strengthens underwriting and sound lending behavior within the primary market while attracting responsible liquidity back to the conventional secondary mortgage market.
Attachment A provides a default analysis of more than 35 million conventional (non-FHA/VA) mortgages originated between 2002 and 2008. It covers loans held in portfolio, as well as loans originated and sold into both agency and private label securitizations. Using eight basic product and underwriting criteria to define a Qualified Residential Mortgage (see page 3 of Attachment A), the analysis compared default rates on mortgages that met all eight of these standards (QRMs) with those that did not meet all of these standards (non-QRMs). The default performance of each annual cohort is calculated through March 2010. The results show that non-QRMs defaulted at a rate that was over twice the rate of QRMs. Moreover, this performance benefit was remarkably steady throughout the entire boom-bust cycle.
Consistent with the direction to your agencies in Section 941(b) that mortgage insurance or other credit enhancement be considered as an element of a QRM, we have also included an analysis of the Core Logic data that compares the performance of loans with insurance to comparable high combined loan to value ratio loans that were originated using a simultaneous second lien in lieu of mortgage insurance (see Attachment B). Again, the data is clear. Loans with MI experience significantly lower rates of default and higher cure rates than loans with simultaneous seconds. Incentives for private credit enhancement are critical to re-establishing the primacy of private capital in our housing finance system.
Together, these analyses demonstrate that loans that satisfy the QRM definition will perform well without imposing additional restrictions such as minimum down payments or reliance on FICO scores that would severely limit access to credit for low-to-moderate income borrowers, borrowers with non traditional credit and other traditionally under served markets. We believe the framework provided for using the CoreLogic data provides a strong foundation for the agencies to develop a QRM definition that meets the statutory intent for the exemption. We will be conducting additional analysis on this data to identify ways to provide flexibility to these standards through traditional underwriting methodologies that includes examination of compensating factors, while maintaining appropriate limits on the layering of risks. Moreover, we believe the QRM should not be a static definition. As additional data and analysis is provided,

we would support efforts to include additional products and features in the QRM definition whenever data demonstrate sound underwriting performance. We urge the agencies to draw the QRM definition broadly enough to support the nascent housing recovery and ensure access to mortgage credit in underserved markets, while remaining true to high quality, empirically sound underwriting and product standards.
As you are aware, Title XIV of the Dodd-Frank Act also sets forth a definition of a "qualified mortgage" that shares some common features with the QRM related to reducing the risk of default. We believe that where overlap exists between the two terms, regulators should strive to use common definitions and standards. By relying on common standards whenever possible, compliance risks are reduced and processing efficiencies are improved, resulting in cost savings that will benefit borrowers, originators and investors. We urge the agencies and the Bureau of Consumer Financial Protection to coordinate during the Title XIV rulemaking process to ensure this result.
We recognize that the time frame in which you are operating is extremely tight. We welcome the opportunity to address any questions or comments that you might have on the analyses we have provided. The work you are undertaking is of the utmost importance to restoring a strong and stable housing market, and we would be pleased to contribute our experience and insights throughout the process. On behalf of the undersigned, please contact either Glen Corso (phone: 571-357-1036) or Pete Mills (phone: 571- 357-1034) if we may be of further assistance.
Very truly yours, (Signed by)
Community Mortgage Banking Project Community Mortgage Lenders of America Essent Guaranty, Inc. Genworth Financial, Inc. Mortgage Guaranty Insurance Corporation Radian Guaranty Inc. Republic Mortgage Insurance Company The PMI Group, Inc.
cc: The Honorable Timothy F. Geithner Secretary of the Treasury

Attachment B
Performance of Insured vs Piggyback Mortgage Loans
Genworth Financial August 2010
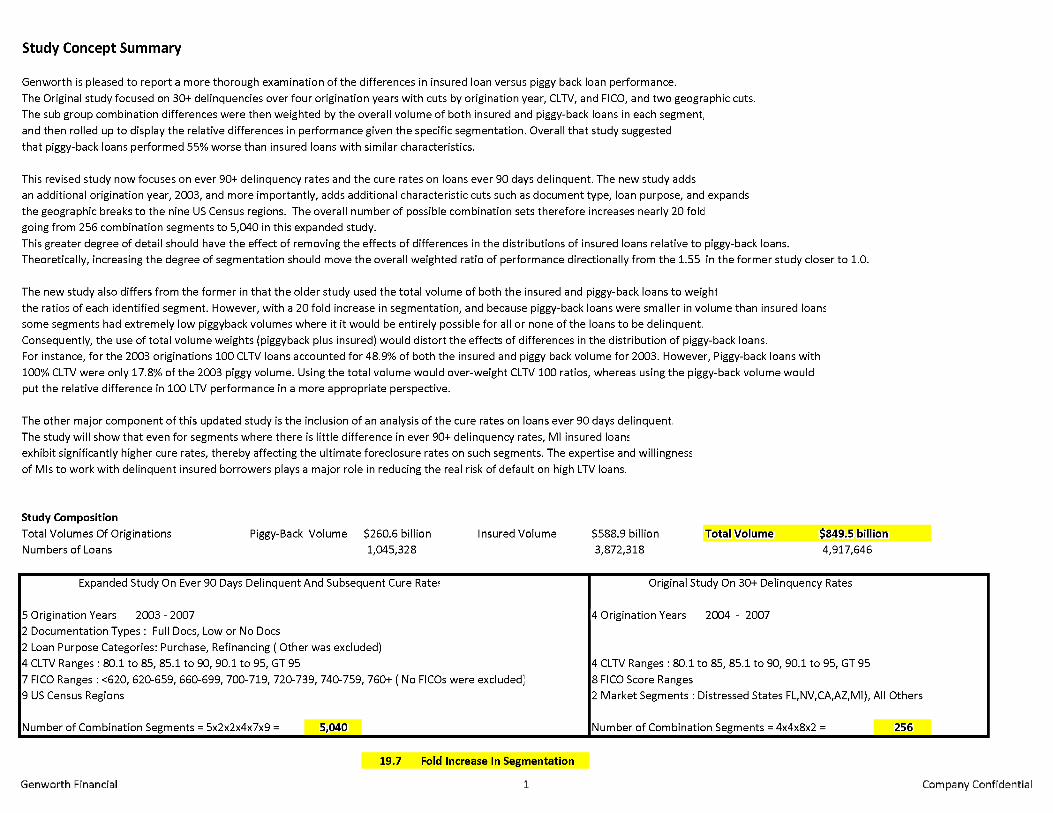
Study Concept Summary
Genworth is pleased to report a more thorough examination of the differences in insured loan versus piggy back loan performance.
The Original study focused on 30+ delinquencies over four origination years with cuts by origination year, CLTV, and FICO, and two geographic cuts. The sub group combination differences were then weighted by the overall volume of both insured and piggy-back loans in each segment,
and then rolled up to display the relative differences in performance given the specific segmentation. Overall that study suggested
that piggy-back loans performed 55% worse than insured loans with similar characteristics.
This revised study now focuses on ever 90+ delinquency rates and the cure rates on loans ever 90 days delinquent. The new study adds an additional origination year, 2003, and more importantly, adds additional characteristic cuts such as document type, loan purpose, and expands the geographic breaks to the nine US Census regions. The overall number of possible combination sets therefore increases nearly 20 fold going from 256 combination segments to 5,040 in this expanded study.
This greater degree of detail should have the effect of removing the effects of differences in the distributions of insured loans relative to piggy-back loans. Theoretically, increasing the degree of segmentation should move the overall weighted ratio of performance directionally from the 1.55 in the former study closer to 1.0.
The new study also differs from the former in that the older study used the total volume of both the insured and piggy-back loans to weight
the ratios of each identified segment. However, with a 20 fold increase in segmentation, and because piggy-back loans were smaller in volume than insured loans some segments had extremely low piggyback volumes where it it would be entirely possible for all or none of the loans to be delinquent.
Consequently, the use of total volume weights (piggyback plus insured) would distort the effects of differences in the distribution of piggy-back loans. For instance, for the 2003 originations 100 CLTV loans accounted for 48.9% of both the insured and piggy back volume for 2003. However, Piggy-back loans with
100% CLTV were only 17.8% of the 2003 piggy volume. Using the total volume would over-weight CLTV 100 ratios, whereas using the piggy-back volume would put the relative difference in 100 LTV performance in a more appropriate perspective.
The other major component of this updated study is the inclusion of an analysis of the cure rates on loans ever 90 days delinquent. The study will show that even for segments where there is little difference in ever 90+ delinquency rates, MI insured loans exhibit significantly higher cure rates, thereby affecting the ultimate foreclosure rates on such segments. The expertise and willingness of MIs to work with delinquent insured borrowers plays a major role in reducing the real risk of default on high LTV loans.
Study Composition
Total Volumes Of Originations Piggy-Back Volume $260.6 billion Insured Volume $588.9 billion Total Volume $849.5 billion Numbers of Loans 1,045,328 :Insured Volume: 3,872,318 Total Volume: 4,917,646
E x p a n d e d S t u d y O n E v e r 9 0 D a y s D e l i n q u e n t A n d S u b s e q u e n t C u r e R a t e s
5 O r i g i n a t i o n Y e a r s 2 0 0 3 - 2 0 0 7
2 D o c u m e n t a t i o n T y p e s : F u l l D o c s , L o w o r N o D o c s
2 L o a n P u r p o s e C a t e g o r i e s : P u r c h a s e , R e f i n a n c i n g ( O t h e r w a s e x c l u d e d )
4 C L T V R a n g e s : 8 0 . 1 t o 8 5 , 8 5 . 1 t o 9 0 , 9 0 . 1 t o 9 5 , G T 9 5
7 F I C O R a n g e s : < 6 2 0 , 6 2 0 - 6 5 9 , 6 6 0 - 6 9 9 , 7 0 0 - 7 1 9 , 7 2 0 - 7 3 9 , 7 4 0 - 7 5 9 , 7 6 0 + ( N o F I C O s w e r e e x c l u d e d ]
9 U S C e n s u s R e g i o n s
N u m b e r o f C o m b i n a t i o n S e g m e n t s = 5 x 2 x 2 x 4 x 7 x 9 = 5 , 0 4 0
O r i g i n a l S t u d y O n 3 0 + D e l i n q u e n c y R a t e s
4 O r i g i n a t i o n Y e a r s 2 0 0 4 - 2 0 0 7
4 C L T V R a n g e s : 8 0 . 1 t o 8 5 , 8 5 . 1 t o 9 0 , 9 0 . 1 t o 9 5 , G T 9 5
8 F I C O S c o r e R a n g e s
2 M a r k e t S e g m e n t s : D i s t r e s s e d S t a t e s F L , N V , C A , A Z , M I ) , A l l O t h e r s
N u m b e r o f C o m b i n a t i o n S e g m e n t s = 4 x 4 x 8 x 2 = 2 5 6
19.7 Fold Increase In Segmentation
D a t a A n d M e t h o d o l o g y
G e n w o r t h u t i l i z e d t h e s e r v i c i n g d a t a s e t o f C o r e l o g i c w h i c h h a s c o l l e c t e d h i g h l y d e t a i l e d l o a n l e v e l l o a n p e r f o r m a n c e i n f o r m a t i o n f r o m s e v e r a l l a r g e m a j o r s e r v i c i n g c o m p a n i e s .
P i g g y b a c k l o a n s a r e i d e n t i f i e d a s f i r s t l i e n l o a n s w i t h a n L T V o f 8 0 % a n d a C L T V g r e a t e r t h a n 8 0 % . I n s u r e d l o a n s a r e i d e n t i f i e d b y t h e c o d i n g o f a n i n s u r a n c e p r o v i d e r , w h e t h e r i1
b e a p r i v a t e m o r t g a g e i n s u r e r o r F H A o r V A . O u r s t u d y f o c u s e d o n l o a n s w i t h C L T V g r e a t e r t h a n 8 0 % , o r i g i n a t e d f r o m 2 0 0 3 t h r o u g h 2 0 0 7 . T h e s a m p l e s e l e c t e d t o t a l s 4 , 9 1 7 , 6 4 6
l o a n s o f w h i c h 3 , 8 7 2 , 3 1 8 a r e i n s u r e d h i g h L T V l o a n s , a n d 1 , 0 4 5 , 3 2 8 a r e f i r s t l i e n s t r u c t u r e d o r p i g g y b a c k l o a n s . T h e o v e r a l l v o l u m e t o t a l e d $ 0 . 8 5 t r i l l i o n .
T h e p r e v i o u s s t u d y f o c u s e d o n l o a n s t h a t w e r e c u r r e n t l y d e l i q u e n t 3 0 + d a y s a n d l o a n s t h a t h a d t e r m i n a t e d i n d e f a u l t . T h i s s t u d y t a k e s t h e a n a l y s i s m u c h f a r t h e r . T h i s s t u d y
r e v i e w e d t h e m o n t h l y s t a t u s o f a l l 4 . 9 m i l l i o n l o a n s i n t h e s a m p l e t o s e e w h i c h l o a n s w e r e e v e r 9 0 d a y s d e l i n q u e n t , a n d t h e n f o l l o w s t h e m o n t h l y s t a t u s r e p o r t s u n t i l t h e l o a n
e i t h e r c u r e s o r g o e s t o f o r e c l o s u r e . C o n s e q u e n t l y , t h i s s t u d y e v a l u a t e s b o t h t h e p e r f o r m a n c e o f t h e l o a n s a n d a l s o p e r m i t s a r e v i e w o f a c t u a l c u r e s o f p r e v i o u s d e l i n q u e n c i e s
t h a t u l t i m a t e l y r e s u l t e d i n c u r r e n t s t a t u s f o r l o a n s s t i l l o u t s t a n d i n g o r s u c c e s s f u l p a y o f f .
T h e d e l i n q u e n c y r a t e f o r t h e p i g g y b a c k l o a n s is s o m e w h a t u n d e r s t a t e d i n t h a t t h e d a t a s e t o n l y c a p t u r e s t h e d e l i n q u e n c y r a t e s o n f i r s t l i e n s . T h e r e a r e l i k e l y l o a n s w h e r e t h e
1 s t l i e n i s s t i l l c u r r e n t , b u t t h e 2 n d l i e n i s d e l i n q u e n t . If t h e s e d e l i n q u e n c i e s w e r e a d d e d t o t h e p i g g y b a c k d a t a , t h e i r d e l i n c e n c y r a t e w o u l d b e e v e n h i g h e r t h a n s h o w n a n d the
d i f f e r e n t i a l t o I n s u r e d l o a n s w o u l d b e e v e n l a r g e r .

Bar Chart Titled: Ever 90 Day Delinquency Rates By Origination Year. Weighting Segments By Piggyback Profile Bar chart is: Ever 90 Day Delinquency Rates by Origination Year. Weighting Segments by Piggyback Profile. The following information is for Insured and Piggyback information from the year 2003-2007. Insured Loans Performed 47% Better Than Piggyback Loans. Once Delinquent 90 Days or more, insured Loans exhibited cure rates nearly 54% higher than first lien Piggybacks. Comparison is done between Insured and Piggyback Delinquency rates with the years beginning with 2003 to 2007 and then ending with the combination of 2003-2007. The percentages are from 0% up to 40%. 2003 Insured:5.4% 2003 Piggyback:7.5% 2004 Insured:8.8% 2004 Piggyback:14.2% 2005 Insured:16.0% 2005 Piggyback:25.6% 2006 Insured:22.0% 2006 Piggyback:35.1% 2007 Insured:27.6% 2007 Piggyback:31.2% 2003-2007 Insured:18.9% 2003-2007 Piggyback:27.8% Bar Chart Titled: Weighted Ratios of Piggyback Delq Rates to Insured Delq Rates. Piggyback ETD 90 Rate/Insured ETD 90 Rate. This chart contains information from 2003-2007 ending with combined information of 2003-2007 together and also with the ratio being used from 0.00 up to 2.00. 2003:1.39 2004:1.61 2005:1.60 2006:1.60 2007:1.13 2003-2007:1.47 Bar chart Titled: Cure Rates on Ever 90 Day Delinquencies by Origination year. Weighting Segments by Piggyback Profile. This chart contains information for the years ranging from 2003-2007 and ending with the combined information of 2003-207 together with the percentages rates used from 0% up to 45%. The two series within the bar charts being measured are Insured and Piggyback. 2003 Insured:38.1% 2003 Piggyback:33.6% 2004 Insured:29.4% 2004 Piggyback:20.8% 2005 Insured:21.9%2005 Piggyback:13.3% 2006 Insured:18.2% 2006 Piggyback:11.8% 2007 Insured:16.7%2007 Piggyback:11.32003-2007 Insured:19.7% 2003-2007 Piggyback:12.8% Bar chart titled:Weighted Ratios of Insured Cure Rates to Piggybacks Insured Cure Rate / piggyback cure rate. This chart contains information for the years 2003-2007 ending with the combined information from the years 2003-2007 and uses the ratios from 0.0 up to 2.00. 2003:1.13 2004:1.41 2005:1.64 2006:1.55 2007:1.48 2003-2007:1.54

Bar Chart titled: Current 90+ Day Delinquency Rates By Origination Year Weighting Segments By Piggyback Profile. This chart contains information on Insured and Piggyback loans ranging from the years 2003-2007 and ending in the combined years of 2003-2007 while using the percentages from 0% to 25%. Current 90+ Day Delinquency Rates by Origination Year. Weighting Segments by Piggyback Profile. 2003 Insured:3.3% 2003 Piggyback:3.8% 2004 Insured:4.9% 2004 Piggyback:8.2% 2005 Insured:8.3% 2005 Piggyback:16.3% 2006 Insured:11.9% 2006 Piggyback:20.5% 2007 Insured:11.9% 2007 Piggyback:14.8% 2003-2007 Insured:9.4% 2003-2007 Piggyback:15.7% Bar chart titled: Weighted Ratios Of Piggyback Delq Rates To Insured Delq Rates Piggyback Current 90+ Rate / Insured Current 90+ Rate. This chart contains inform from the years 2003-2007 ending with the combined years of 2003-2007 and uses the ratios of 0.00 to 2.00 to measure the rations of piggyback delinquent rates to insured delinquent rates. Weighted Ratios of Piggyback Delq Rates to Insured Delq Rates. Piggyback Current 90+ Rate/Insured Current 90+ Rate. 2003:1.24 2004:1.64 2005:1.96 2006:1.80 2007:1.24 2003-2007:1.65
Lower Ever 90 Delqs Combined with More Cures Result in Insured Loans Having 65% Less Defaults (90+ & F/C)

Bar chart titled: E v e r 9 0 D a y + D e l i n q u e n c y R a t e s B y C L T V Ever 90 Day+Delinquency Rates by CLTV Weighted Segments by Piggyback Profile . This bar chart contains information from 85 CLTV to 100 CLTV and finally includes ALL while weighting segments by piggyback profile if the loans are either insured or piggyback. The percentages used range between 0% up to 40%. 85 CLTV Insured:17.8 85 CLTV Piggyback:27.4 90 CLTV Insured:21.9 90 CLTV Piggyback:28.1 95 CLTV Insured:19.1 95 CLTV Piggyback:20.2 100 CLTV Insured:15.9 100 CLTV Piggyback:33.7 ALL CLTV Insured:18.9 ALL CLTV Piggyback: 27.8 Bar Chart Titled: Weighted Ratios of Piggyback Delq Rates to Insured Delq Rates. Piggyback ETD 90 Rate/ Insured ETD 90 Rate. This bar chart contains information from the 85 CLTV to 100 CLTV to all against the ratio of 0.00 to 2.00 . 85 CLTV:1.53 90 CLTV:1.28 95 CLTV:1.06 100 CLTV:2.12 ALL:1.47 Bar chart titled: Cure Rates on Ever 90 Day Delinquencies by CLTV Weighting Segments by Piggyback Profile. This bar chart contains information on both insured and piggyback loans by CLTV from 85 CLTV to 100 CLTV to all and includes the percentages of 0% up t6o 30%. 85 CLTV Insured:18.9 85 CLTV Piggyback:15.0 90 CLTV Insured:16.3 90 CLTV Piggyback:12.6 95 CLTV Insured:20.1 95 CLTV Piggyback:14.5 100 CLTV Insured:23.9 100 CLTV Piggyback:11.9 ALL CLTV Insured:19.7 ALL CLTV Piggyback:12.8 Bar chart titled: Weighted Ratios of Insured Cure Rates to Piggybacks Insured Cure Rate/ Piggyback Cure Rate This Bar chart contains information on the insured cure rate and piggyback rate measured against the 85 CLTV to 100 CLTV to All from the ration of 0.00 up to 2.00. 85 CLTV:1.26 90 CLTV:1.30 95 CLTV:1.39 100 CLTV:2.01 ALL:1.54 Piggyback 90+ Deliquency Rates were significantly higher for all CLTV ranges except for 95 CLTV Nevertheless, for all CLTV ranges, including 95 cltv, insured loans had significantly higher cure rates.

Bar chart titled: E v e r 9 0 + D e l i n q u e n c y R a t e s B y F I C O S c o r e W e i g h t i n g S e g m e n t s B y P i g g y b a c k P r o f i l e This bar chart contains information based on FICO scores ranging from below 620 up to 950 and finally including all with the percentage rates measured against ranging from 0% up to 50%. <620 Insured:28.1% <620 Piggybacked:45.8% 620-659 Insured:29.1% 620-659 Piggybacked:44.0% 660-699 Insured:25.5% 660-699 Piggybacked:36.6% 700-719 Insured:21.7% 700-719 Piggybacked:31.5% 720-739 Insured:17.6% 720-739 Piggybacked:26.9% 740-759 Insured:14.8% 740-759 Piggybacked:21.6% 760-950 Insured:9.9% 760-950 Piggybacked:14.4% ALL: Insured: 18.9% ALL: Piggybacked:27.8%
Bar chart t i t l e d : W e i g h t e d R a t i o s O f P i g g y b a c k D e l q R a t e s T o I n s u r e d D e l q R a t e s This bar chart contains information concerning the ratio of PIggyback delinquent to insured rates against FICO scores ranging from below 620 up to 950 and finally including all with the ration ranging from 0.00 up to 2.00. P i g g y b a c k E T D 9 0 R a t e / I n s u r e d E T D 9 0 R a t e 85 CLTV:1.53 90 CLTV:1.28 95 CLTV:1.06 100 CLTV:2.12 ALL:1.47
Bar chart t i t l e d : C u r e R a t e s O n E v e r 9 0 D a y Delinquencies B Y F I C O R a n g e W e i g h t i n g S e g m e n t s B y P i g g y b a c k P r o f i l e : This bar chart contains information on the insured and piggyback loans delinquencies by FICO score ranging from below 620 up to 950 and then finally including all using the percentages from 0% up to 40%. 85 CLTV Insured:18.9 85 CLTV Piggyback:15.0 90 CLTV Insured:16.3 90 CLTV Piggyback:12.6 95 CLTV Insured:20.1 95 CLTV Piggyback:14.5 100 CLTV Insured:23.9 100 CLTV Piggyback:11.9 ALL CLTV Insured:19.7 ALL CLTV Piggyback:12.8
Bar chart t i t l e d : W e i g h t e d R a t i o s O f I n s u r e d C u r e R a t e s T o P i g g y b a c k s I n s u r e d C u r e R a t e / P i g g y b a c k C u r e R a t e . This bar chart contains information on the insured rate to piggyback cure rate using FICO scores from below 620 up to 950 and all from the ratio of 0.00 up to 2.00. 85 CLTV:1.26 90 CLTV:1.30 95 CLTV:1.39 100 CLTV:2.01 ALL:1.54
P i g g y b a c k P e r f o r m a n c e Decidedly W o r s e i n V i r t u a l l y A l l F I C O R a n g e s
C u r e R a t e s O n I n s u r e d L o a n s S o l i d l y H i g h e r B y 3 5 % o r M o r e D e p e n d i n g O n t h e F I C O R a n g e

Bar chart titled: E v e r 9 0 + D e l i n q u e n c y R a t e s B y D o c T y p e / L o a n P u r p o s e
W e i g h t i n g S e g m e n t s B y P i g g y b a c k P r o f i l e . This chart contains information on Insured and piggyback rates versus the percentage rates ranging from 0% up to 45% Ever 90+ Delinquency Rates Full Insured:11.4 Purchase Piggyback:14.8 Full Insured:15.8 Refinance Piggyback:28.1 Low Insured:19.5 Purchase Piggyback:29.6 Low Insured:29.7 Refinance Piggyback:41.8 All Low Insured:18.9 All Low Piggyback:27.8
bar chart titled: W e i g h t e d R a t i o s O f P i g g y b a c k D e l q R a t e s T o I n s u r e d D e l q R a t e s . This bar chart contains information on the full insured, refinance Low, Purchase and all piggyback rates based against the ratio ranging from 0.00 to 2.00.
P i g g y b a c k E T D 9 0 R a t e / I n s u r e d E T D 9 0 R a t e Full/Purchase:1.29 Full/Refinance:1.78 Low/Purchase:1.52 Low/Refinance:1.41 All: 1.47
bar chart titled: Cure Rates On Ever 90 Day Delqs By Doc Type/Loan Purpose W e i g h t i n g S e g m e n t s B y P i g g y b a c k P r o f i l e . This bar chart contains information on the Insured and Piggyback loans based against the percentages ranging from 0% up to 30%. Full Insured:21.7 Purchase Piggyback:14.7 Full Insured:24.6 Refinance Piggyback:15.9 Low Insured:18.9 Purchase Piggyback:11.6 Low Insured:18.4 Refinance Piggyback:13.4 All Insured:19.7 All Piggyback:12.8
Bar chart titled: Weighted Ratios Of Insured Cure Rates To Piggybacks I n s u r e d C u r e R a t e / P i g g y b a c k C u r e R a t e . This bar chart contains information on the insured cure rate versus piggyback from full purchase finance, refinance
and ratio from 0.00 up to 2.00 Full/Purchase:1.48 Full/Refinance:1.54 Low/Purchase:1.63 Low/Refinance:1.37 ALL: 1.54
Evaluation by Documentation & Loan Purpose Shows Insured Loans Clearly Outperform Piggybacks In Each of Segment Roll Ups
Insured Loan Cure Rates Were Substantially Higher in All Of These Roll -Up Combinations

Bar chart titled: E v e r 9 0 D a y D e l i n q u e n t R a t e s B y U S C e n s u s R e g i o n
W e i g h t i n g S e g m e n t s B y P i g g y b a c k P r o f i l e This bar chart contains information based upon various locations within the United States on delinquent rates and percentages from 0% up to 45%. Insured:East North Central:17% Piggyback:East North Central:18% Insured:East South Central:8% Piggyback:East South Central:9% Insured:Middle Atlantic:12% Piggyback:Middle Atlantic:19% Insured:Mountain:17% Piggyback:Mountain:27% Insured:New England:15% Piggyback:New England:19% Insured:Pacific:23% Piggyback:Pacific:38% Insured:South Atlantic:23% Piggyback:South Atlantic:28% Insured:West North Central:9% Piggyback:West North Central:13% Insured:West South Central:8% Piggyback:West South Central:8%
bar chart titled: W e i g h t e d R a t i o s O f P i g g y b a c k D e l q R a t e s T o I n s u r e d D e l q R a t e s P i g g y b a c k E T D 9 0 R a t e / I n s u r e d E T D 9 0 R a t e . This bar chart contains information from the various regions of the United States with the various delinquent rates from 0.00 up to 2.00. East North Central:1.04 East South Central:0.97 Middle Atlantic:1.39 Mountain:1.48 New England:1.56 Pacific:1.09 South Atlantic:1.83 West North Central:1.21 West South Central:1.37 All, Total: 1.47
Bar chart titled: Cure Rates On Ever 90 Day Delqs By US Census Region W e i g h t i n g S e g m e n t s B y P i g g y b a c k P r o f i l e This bar chart contains information on various regions in the United States on delinquent loans cure rates from percentages
ranging from 0% up to 40%. Insured:East North Central:22% Piggyback:East North Central:18% Insured:East South Central:32% Piggyback:East South Central:24% Insured:Middle Atlantic:27% Piggyback:Middle Atlantic:20%Insured:Mountain:17%Piggyback:Mountain:27% Insured:New England:26% Piggyback:New England:20% Insured:Pacific:23% Piggyback:Pacific:12% Insured:South Atlantic:23% Piggyback:South Atlantic:28% Insured:West North Central:9% Piggyback:West North Central:13% Insured:West South Central:34% Piggyback:West South Central:28%
bar chart titled: Weighted Ratios Of Insured Cure Rates To Piggybacks I n s u r e d C u r e R a t e / P i g g y b a c k C u r e R a t e . This bar chart contains information on the insured cure rates and piggyback cure rates in the various regions of the
United States and utilized the ratios from 0.0 up to 2.00. East North Central:1.34 East South Central:1.25 Middle Atlantic:1.39 Mountain:1.59 New England:1.36 Pacific:1.60 South Atlantic:1.45 West North Central:1.42 West South Central:1.25 All, Total: 1.54
W h i l e E v e r 9 0 D e l i n q u e n t P e r f o r m a n c e D i f f e r e n c e s W e r e N o t U n i f o r m A c r o s s A l l R e g i o n s ,
S u c h D i f f e r e n c e s W e r e H i g h e s t I n W o r s e P e r f o r m i n g R e g i o n s
C u r e R a t e s O n I n s u r e d L o a n s R e m a i n e d S i g n i f i c a n t l y H i g h e r A c r o s s A l l U S C e n s u s R e g i o n s

A p p e n d i x - D i f f e r e n c e s I n D i s t r i b u t i o n s A c r o s s K e y M e t r i c s Bar chart titled: Distribution By CLTV containing information on piggyback and insured loans from CLTV status from 85 to greater than 95 and percentages from 0% to 50%. 85:Insured:9 85:Piggyback:5 90:Insured:30 90:Piggyback:45 95:Insured:22 95:Piggyback:21 >95:Insured:39 >95:Piggyback:35 Bar Chart titled: Distributions by loan Purpose and Doc type The data source for all information on this page and data sources is Core Logic. Piggybacks had a higher percentage of purchase loans (74.9% vs 67.9% for Insured). But Also a Higher Percentage of Low or No Documentation. (66.7% Vs 28.6% for insured). Purchase:50% Full:25% Refinance:22% Full:9% Purchase:18% Low:50% Refinance:10% Low:15% Distributions By FICO Range: Information: Distributions by FICO Range: Piggyback loans had higher Average FICO Scores. Information is with Insured and piggyback. <620 Insured:14% <620 Piggybacked:3% 620-659 Insured:22% 620-659 Piggybacked:9% 660-699 Insured:22% 660-699 Piggybacked:22% 700-719 Insured:11% 700-719 Piggybacked:18% 720-739 Insured:8% 720-739 Piggybacked:15% 740-759 Insured:8% 740-759 Piggybacked:13% 760-950 Insured:14% 760-950 Piggybacked:23% Distribution by US Census Region: Piggybacks Highly Concentrated in Pacific Region Insured:East North Central:17% Piggyback:East North Central:18% Insured:East South Central:8% Piggyback:East South Central:9% Insured:Middle Atlantic:12% Piggyback:Middle Atlantic:19% Insured:Mountain:17% Piggyback:Mountain:27% Insured:New England:15% Piggyback:New England:19% Insured:Pacific:23% Piggyback:Pacific:38% Insured:South Atlantic:23% Piggyback:South Atlantic:28% Insured:West North Central:9% Piggyback:West North Central:13% Insured:West South Central:8% Piggyback:West South Central:8% CL Insured Loan Distributions By CLTV BY Origination Year Data Source Core Logic. Insured Loans Distributions by CLTV by Origination Year: Insured Loans Maintained Relatively Higher Risk Profile Throughout. Pricing for Risk by LTV Range Remained Constant. 85 CLTV basically remained around the 10% mark from 2003 to 2007. 95 CLTV basically remained around the 25 to 20% mark from 2003 to 2007. 90 CLTV from 2003 to 2007 went from 29% to 35% in 2005 and then downward to 29% again in 2007. >95 CLTV went from 35% in 2003 to 40% in 2007. Piggyback Loan Distributions by CLTV by Origination Year. Piggybacks in earlier Years had lower Risk CLTV Profile. Increasingly Riskier Profile Through 2007. Piggyback Loan Distributions by CLTV by Origination Year. Piggybacks in earlier Years had lower Risk CLTV Profile. Increasingly Riskier Profile Through 2007. 85 CLTV ranged from 8% in 2003 to 9% in 2007. >95 CLTV ranged from 11% in 2003 to 30% in 2006 to 27% in 2007. 95 CLTV ranged from 30% in 2003 to 27% in 2005 to 25% in 2007. 90 CLTV ranged from 51% in 2003 to 52% in 2005 to 41% in 2007.

Qualified Insured Loan Performance Bar Chart titled: NON-PERFORMING RATES * (note Non-Performing Rate: (# Loans Currently 90 or more days delinquent + loans that terminated in default ) / original number of loans) This bar chart of Non-Performing Rates is for the years of 2003 to 2007 and then an all inclusive of 2003-2007 for Piggyback, Insured, and Insured Qualified Loans and their performance based upon the percentages of 0% up to 25%. Non-Performing Rates 2003 Piggyback:3.8 2003 Insured:3.3 2003 Insured-Qualified:2.4 2004 Piggyback:8.2 2004 Insured:4.9 2004 Insured-Qualified:4.3 2005 Piggyback:16.3 2005 Insured:8.3 2005 Insured-Qualified:6.1 2006 Piggyback:20.5 2006 Insured:11.9 2006 Insured-Qualified:6.5 2007 Piggyback:14.8 2007 Insured:11.92007 Insured-Qualfied:5.9 2003-2007 Piggyback:15.7 2003-2007 Insured:9.4 2003-2007 Insured-Qualified:5.3
"Qualified" Insured Loans Have Performed Well Through the Downturn
Attachment A
Historical Performance of Qualified vs Non-Qualified
Mortgage Loans November 2010

Confidentiality Agreement / Legal Disclaimer
T h i s p r e s e n t a t i o n ( t h e " P r e s e n t a t i o n " ) i s b e i n g f u r n i s h e d t o a l i m i t e d n u m b e r o f s o p h i s t i c a t e d p a r t i e s f o r i n f o r m a t i o n a l a n d d i s c u s s i o n
p u r p o s e s o n l y . T h e i n f o r m a t i o n s e t f o r t h h e r e i n d o e s n o t p u r p o r t t o b e c o m p l e t e a n d i s s u b j e c t t o c h a n g e .
T h e i n f o r m a t i o n c o n t a i n e d h e r e i n d o e s n o t p u r p o r t t o c o n t a i n a l l o f t h e i n f o r m a t i o n t h a t m a y b e r e q u i r e d t o e v a l u a t e m o r t g a g e
p e r f o r m a n c e a n d a n y r e c i p i e n t h e r e o f i s e n c o u r a g e d a n d s h o u l d c o n d u c t i t s o w n i n d e p e n d e n t a n a l y s i s o f t h e d a t a r e f e r r e d t o h e r e i n .
G e n w o r t h F i n a n c i a l ( " G e n w o r t h " ) a n d i t s a f f i l i a t e s d i s c l a i m a n y a n d a l l l i a b i l i t y a s t o t h e i n f o r m a t i o n s e t f o r t h h e r e i n o r o m i s s i o n s
h e r e f r o m , i n c l u d i n g , w i t h o u t l i m i t a t i o n a n y e x p r e s s o r i m p l i e d r e p r e s e n t a t i o n o r w a r r a n t y w i t h r e s p e c t t o s u c h i n f o r m a t i o n .
I n f o r m a t i o n i n t h i s d o c u m e n t h a s b e e n o b t a i n e d f r o m v a r i o u s s o u r c e s ; w e d o n o t r e p r e s e n t t h a t t h i s i n f o r m a t i o n i s a c c u r a t e o r c o m p l e t e
a n d i t s h o u l d n o t b e r e l i e d u p o n a s s u c h . O p i n i o n s e x p r e s s e d h e r e i n a r e s u b j e c t t o c h a n g e w i t h o u t n o t i c e .

S c o p e o f P r o j e c t
U t i l i z i n g d a t a f r o m t h e C o r e L o g i c S e r v i c i n g D a t a b a s e , t h e S t u d y p e r f o r m e d a n u n b i a s e d c o m p a r i s o n o f
p e r f o r m a n c e s t a t i s t i c s b e t w e e n t w o p o p u l a t i o n s o f c o n v e n t i o n a l l o a n s ( Q u a l i f i e d a n d N o n - Q u a l i f i e d ) .
T h e t w o p o p u l a t i o n s a r e c o m p a r e d o n a n o v e r a l l b a s i s a n d b y o r i g i n a t i o n y e a r a s a w a y t o f u r t h e r
e x a m i n e t h e f i n d i n g s .
T h e c r i t e r i a u s e d f o r t h e d e t e r m i n a t i o n o f t h e Q u a l i f i e d p o o l i s o u t l i n e d b e l o w ( t h e " Q u a l i f i e d C r i t e r i a " ) :
D e b t - T o - I n c o m e < = 4 5 % ;
7 / 1 A R M ' s & G r e a t e r o r F i x e d R a t e ;
T e r m < = 3 6 0 m o n t h s ;
N o B a l l o o n ;
N o I n t e r e s t O n l y ;
N o N e g a t i v e A m o r t i z a t i o n ;
F u l l D o c u m e n t a t i o n ; a n d
I f t h e L o a n s h a d a L T V > 8 0 % i t m u s t c a r r y M I

M e t h o d o l o g y
D e v e l o p e d e v e r - t o - d a t e p e r f o r m a n c e s t a t i s t i c s u t i l i z i n g F A C L ' s S e r v i c i n g D a t a b a s e ( t h e
" S e r v i c i n g D a t a b a s e " ) c o m p l i e d a s o f 0 3 / 3 1 / 2 0 1 0
T h e o v e r a l l p o p u l a t i o n c o n s i s t s o f 3 7 m i l l i o n c o n v e n t i o n a l l o a n s o r i g i n a t e d b e t w e e n 2 0 0 2 a n d
2 0 0 8 ( t h e " L o a n P o p u l a t i o n " )
T h e L o a n P o p u l a t i o n w a s t h e n d e f i n e d i n t o t w o c a t e g o r i e s : Q u a l i f i e d a n d N o n - Q u a l i f i e d
T h e Q u a l i f i e d C r i t e r i a w a s c h o s e n t o m o s t c l o s e l y m a t c h t h e c r i t e r i a p r o v i d e d w i t h t h e d a t a
a v a i l a b l e i n t h e S e r v i c i n g D a t a b a s e ( t h e " Q u a l i f i e d P o o l " ; 5 . 5 m m l o a n s )
T h e n o n - q u a l i f i e d p o p u l a t i o n c o n s i s t s o f l o a n s w h e r e a l l n e c e s s a r y d a t a p o i n t s a r e p r e s e n t ,
b u t o n e o r m o r e Q u a l i f i e d C r i t e r i a w e r e n o t m e t ( t h e " N o n - Q u a l i f i e d P o o l " ; 1 1 . 5 m m l o a n s )
T h e r e m a i n i n g p o p u l a t i o n ( t h e " Q u a l i f i c a t i o n U n k n o w n P o o l " ; 2 0 m m l o a n s ) , n o t r e p o r t e d ,
c o n s i s t s o f l o a n s w h e r e t h e n e c e s s a r y d a t a p o i n t s w e r e n o t a l l p r e s e n t a n d t h e r e f o r e
q u a l i f i c a t i o n c o u l d n o t b e d e t e r m i n e d
T h e S e r v i c i n g D a t a b a s e d o e s n o t r e p o r t t h e l i q u i d a t i o n t y p e . H o w e v e r , t h e l o a n s t a t u s a t t h e
t i m e o f l i q u i d a t i o n i s t r a c k e d
N o n - p e r f o r m i n g l o a n s w e r e a n y l o a n s c u r r e n t l y 9 0 + d a y s d e l i n q u e n t o r h a d d e f a u l t e d a t t h e
t i m e o f l i q u i d a t i o n

Summary of Results 5.5 million of the Loan Population made up the Qualified Pool. 11.5 million of the Loan Population made up the Non-Qualified Loan Pool. The Qualified Pool performed considerably better than the Non-Qualified population as measured by loans that were 90+days delinquent or defaulted. A significant differential holds true across the range of vintages examined.
Bar Chart Titled: % by Original Balance (90+ Days Delinquent & Default). This bar chart contains information on qualified and non-qualified loans from the years 2002 to 2008 with the % by original balance of the qualified and non-qualified loans based upon percentages ranging from 0.00% up to 25.0%. Data Source: Core Logic Servicing Dataset. header row col 1:Year Col 2:Qualified: col 3:Non-Qualified: Total end header row Year:2002 Qualified:2.23% Non-Qualified:5.16% Year:2003 Qualified:1.85% Non-Qualified:3.68% Year:2004 Qualified:3.78% Non-Qualified:8.18% Year:2005 Qualified:6.45% Non-Qualified:16.33% Year:2006 Qualified:8.80% Non-Qualified:22.35% Year:2007 Qualified:8.95% Non-Qualified:20.54% Year:2008 Qualified:4.52% Non-Qualified:6.66%
Bar chart titled: Ratio of Non-Qualified to Qualified Loans by Original Balance (90+ Days Delinquent & Default). This bar chart contains information on the ratio of non-qualified to qualified loans from the years 2002 to the year 2008 ending with the Wtd.
Average. The ratio is measured out from 0.00 up to 3.00. 2002:2.31 2003:1.99 2004:2.16 2005:2.53 2006:2.542007:2.30 2008:1.47WTD Avg:2.21
Qualified Mortgages Outperformed Non-Qualified Mortgages by Over 2:1

About Genworth Financial G e n w o r t h F i n a n c i a l , I n c . ( N Y S E : G N W ) i s a l e a d i n g F o r t u n e 5 0 0 g l o b a l f i n a n c i a l s e c u r i t y c o m p a n y .
G e n w o r t h h a s m o r e t h a n $ 1 0 0 b i l l i o n i n a s s e t s a n d e m p l o y s a p p r o x i m a t e l y 6 , 0 0 0 p e o p l e w i t h a
p r e s e n c e i n m o r e t h a n 2 5 c o u n t r i e s . I t s p r o d u c t s a n d s e r v i c e s h e l p m e e t t h e i n v e s t m e n t ,
p r o t e c t i o n , r e t i r e m e n t a n d l i f e s t y l e n e e d s o f m o r e t h a n 1 5 m i l l i o n c u s t o m e r s . G e n w o r t h o p e r a t e s
t h r o u g h t h r e e s e g m e n t s : R e t i r e m e n t & P r o t e c t i o n , U S M o r t g a g e I n s u r a n c e a n d I n t e r n a t i o n a l . I t s
p r o d u c t s a n d s e r v i c e s a r e o f f e r e d t h r o u g h f i n a n c i a l i n t e r m e d i a r i e s , a d v i s o r s , i n d e p e n d e n t
d i s t r i b u t o r s a n d s a l e s s p e c i a l i s t s . G e n w o r t h F i n a n c i a l , w h i c h t r a c e s i t s r o o t s b a c k t o 1 8 7 1 , b e c a m e
a p u b l i c c o m p a n y i n 2 0 0 4 a n d i s h e a d q u a r t e r e d i n R i c h m o n d , V i r g i n i a . F o r m o r e i n f o r m a t i o n , v i s i t
G e n w o r t h . c o m . F r o m t i m e t o t i m e G e n w o r t h r e l e a s e s i m p o r t a n t i n f o r m a t i o n v i a p o s t i n g s o n i t s
c o r p o r a t e w e b s i t e . A c c o r d i n g l y , i n v e s t o r s a n d o t h e r i n t e r e s t e d p a r t i e s a r e e n c o u r a g e d t o e n r o l l t o
r e c e i v e a u t o m a t i c e m a i l a l e r t s a n d R e a l l y S i m p l e S y n d i c a t i o n ( R S S ) f e e d s r e g a r d i n g n e w p o s t i n g s .
E n r o l l m e n t i n f o r m a t i o n i s f o u n d u n d e r t h e " I n v e s t o r s " s e c t i o n o f G e n w o r t h . c o m .