genpact 100917095333-phpapp01
TRANSCRIPT

INTRODUCTION
Traces its beginnings to 1997, when under the name of GECIS; it was established as an independent business unit of GE Capital.
Genpact became an independent company in January 2005, enabling faster growth by reaching down to clients outside the GE family.
The company was listed on the NYSE in August 2007 under the trading symbol “G”.
Genpact has its head quarters at Gurgaon, Haryana, India.

Taking Business Processes to a
new level of effectiveness.
MISSION
Locations
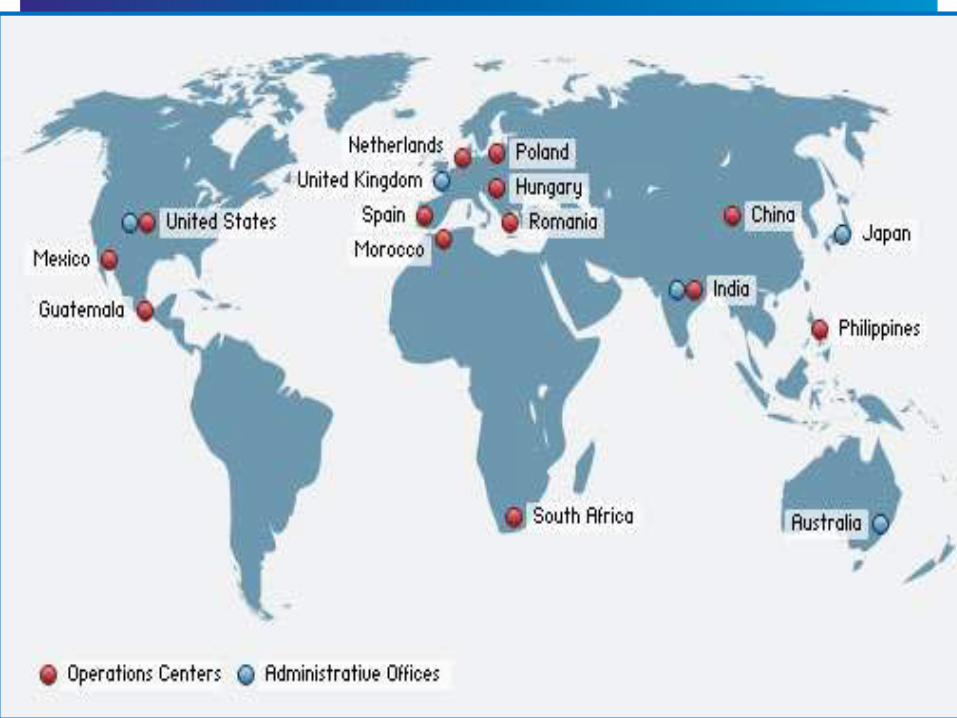
Genpact has over 41,000 employees, has more than 35 operations in 13 countries,
and supports over 25 languages.
Genpact operates from Asia, Eastern Europe, Northern America, Australia and
most recently Africa.
Headquarters is in Gurgaon, Haryana

Solutions offered
Finance and Accounting
Procurement and Supply Chain
Collections and Customer Service
Human Resource Services
IT Infrastructure Services
Enterprise Application Services
Analytics & Research

Risk Management
Services
Reengineering
Healthcare Operational Solutions
Pharmaceutical Operational Solutions
Retail/Consumer Packaged Goods
Operational Solutions
Automotive Operational Solutions
Legal Services
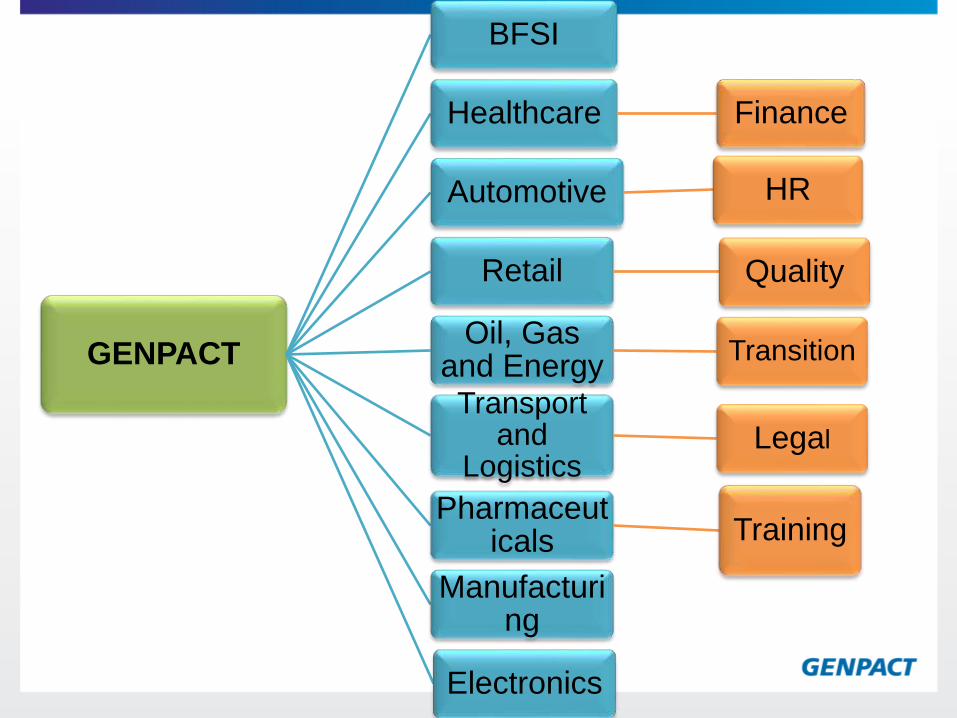
GENPACT
BFSI
Healthcare Finance
Automotive HR
Retail Quality
Oil, Gas and Energy
Transition
Transport and
LogisticsLegal
Pharmaceuticals Training
Manufacturing
Electronics

Thought about in terms of back
office operations.
Business process management solutions designed to increase capital of financial institutions.
BFSI alone contributes to around 40% of the total revenues of
Genpact.
BANKING, FINANCIAL SERVICES AND INSURANCE (BFSI COE)

Solutions Offered
Retail banking
Commercial banking
Investment banking
Investment services and
wealth
Mortgage services

ORGANISATION CHART OF BFSI
Pramod Bhasin,
President & CEO
Tiger Tyagarajan,
Chief Operating Officer
Mohit Thukral
Sr. Vice President
BFSI
Abhinav Kapoor
Vice President,BFSI
Tathagupta Mallakar
Assist. Vice President
Rahul Malhotra
Assist. Vice President
Nishi Arora
Assist. Vice President

SWOT ANALYSIS
STRENGTH WEAKNESS
• Past association with GE
• Employee satisfaction
through growth
• Lowest attrition rate
• Best training provider
• Considered to be as a low
payer
• Communication gap between
superior and subordinate
• Dependence on GE
Opportunities THREATS
• SEZ areas provided by
government
• Upcoming clients
• Emergence of new
outsourcing fields
• Increase in Indian inflation
rate
• Appreciation of rupee
• Many competitors
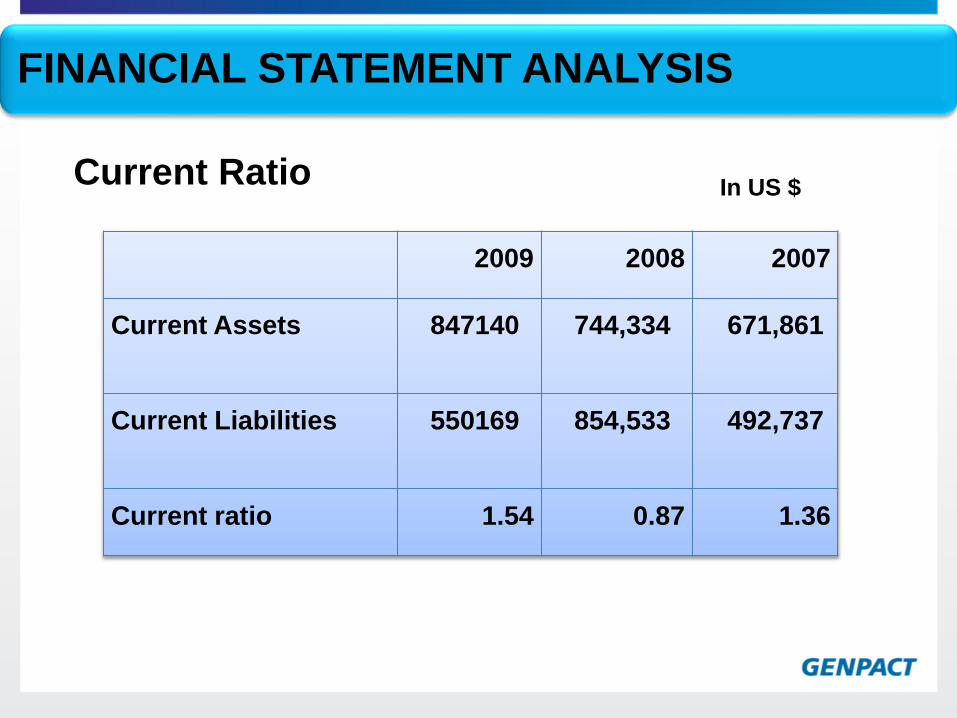
FINANCIAL STATEMENT ANALYSIS
2009 2008 2007
Current Assets 847140 744,334 671,861
Current Liabilities 550169 854,533 492,737
Current ratio 1.54 0.87 1.36
Current Ratio In US $

Acid Test/Quick Ratio
Acid test/Quick ratio 2009 2008 2007
Current Assets 847140 744,334 671,861
Inventory 0 0 0
Prepaid Expenses 0 0 0
Quick Assets 847140 744,334 671,861
Current Liabilities 550169 854,533 492,737
Quick Ratio 1.54 0.87 1.36
In US $
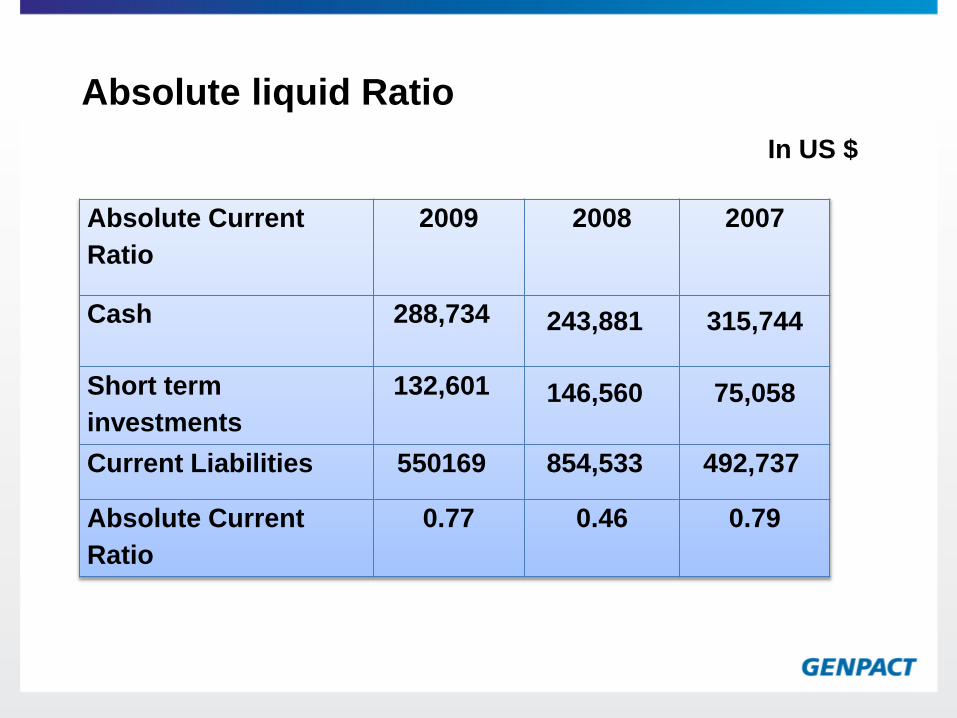
Absolute liquid Ratio
Absolute Current
Ratio
2009 2008 2007
Cash 288,734 243,881 315,744
Short term
investments
132,601 146,560 75,058
Current Liabilities 550169 854,533 492,737
Absolute Current
Ratio
0.77 0.46 0.79
In US $

Debtor Turnover Ratio
Debtor Turnover Ratio 2009 2008 2007
Total Revenue 1,120,071 1,040,847 823,171
Net Receivables 309,254 297,032 222,651
Debtor Turnover Ratio 3.62 3.50 3.70
Average Collection
Period
100.78 104.16 98.73
In US $
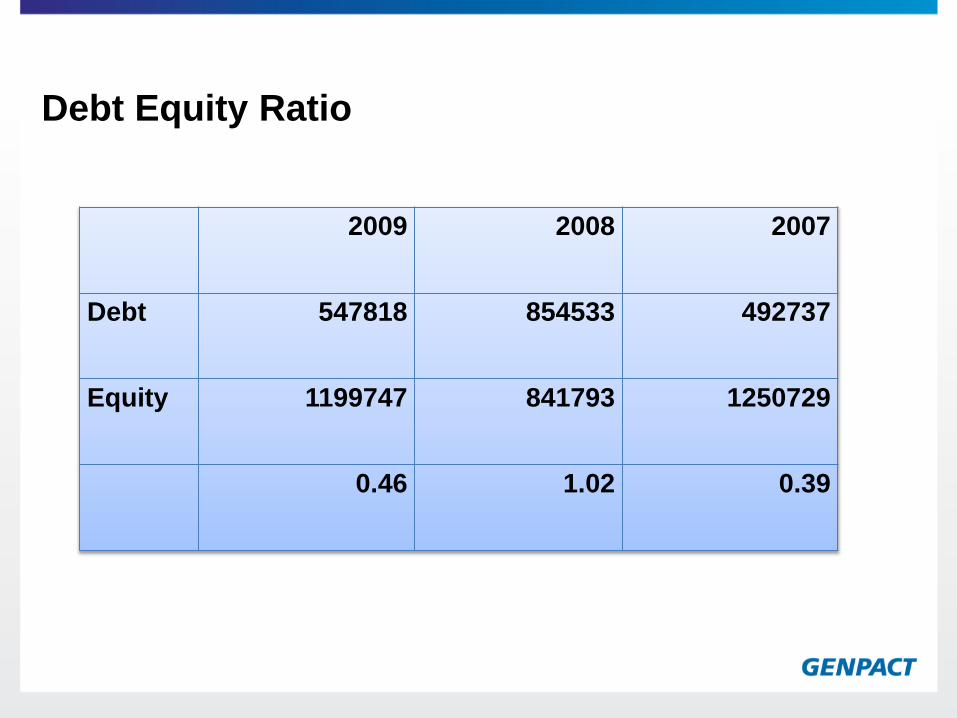
Debt Equity Ratio
2009 2008 2007
Debt 547818 854533 492737
Equity 1199747 841793 1250729
0.46 1.02 0.39

Net Profit Ratio
2009 2008 2007
Net profit 161124 144349 81608
Total revenue 1120171 1040847 823171
14.38% 13.87% 9.91%
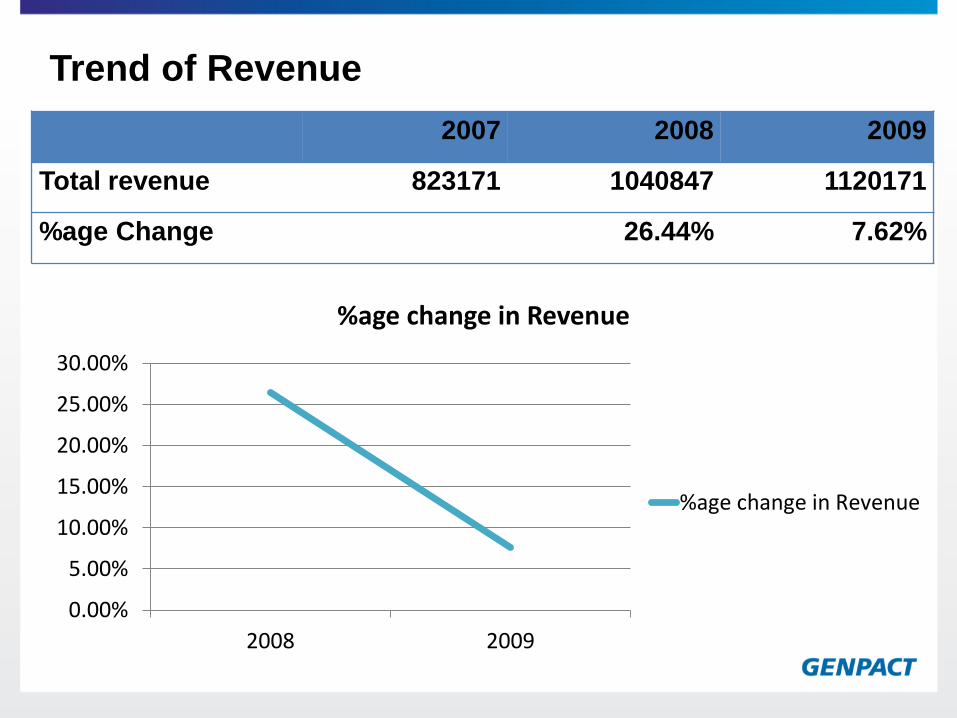
Trend of Revenue
2007 2008 2009
Total revenue 823171 1040847 1120171
%age Change 26.44% 7.62%
0.00%
5.00%
10.00%
15.00%
20.00%
25.00%
30.00%
2008 2009
%age change in Revenue
%age change in Revenue

Trend of Cost of Revenue
2007 2008 2009
Cost of revenue 482938 619231 672624
%age change in cost 28.22% 8.62%
0.00%
5.00%
10.00%
15.00%
20.00%
25.00%
30.00%
2008 2009
%age change in cost
%age change in cost

PART-B
RESEARCH PROJECT REPORT

BPO
Outsourcing is shifting a company’s essential operations to a third party vendor in order to gain various benefits including better services, low cost and speedy work.

Highlights of ITES – BPO performance in FY 09
According to Nasscom, the Indian ITES BPO market grew by over 18%.
Revenue totaled US $ 14.8 billion.
The ITES BPO employed 90,000 employees, the total head count now is 7.90,000.
ITES BPO revenues contributed 1% to India’s GDP and 4% of exports.
Technology and BPO generated 45% of total urban employment in India, BPO has created over a third of those jobs.
Source: Nasscom
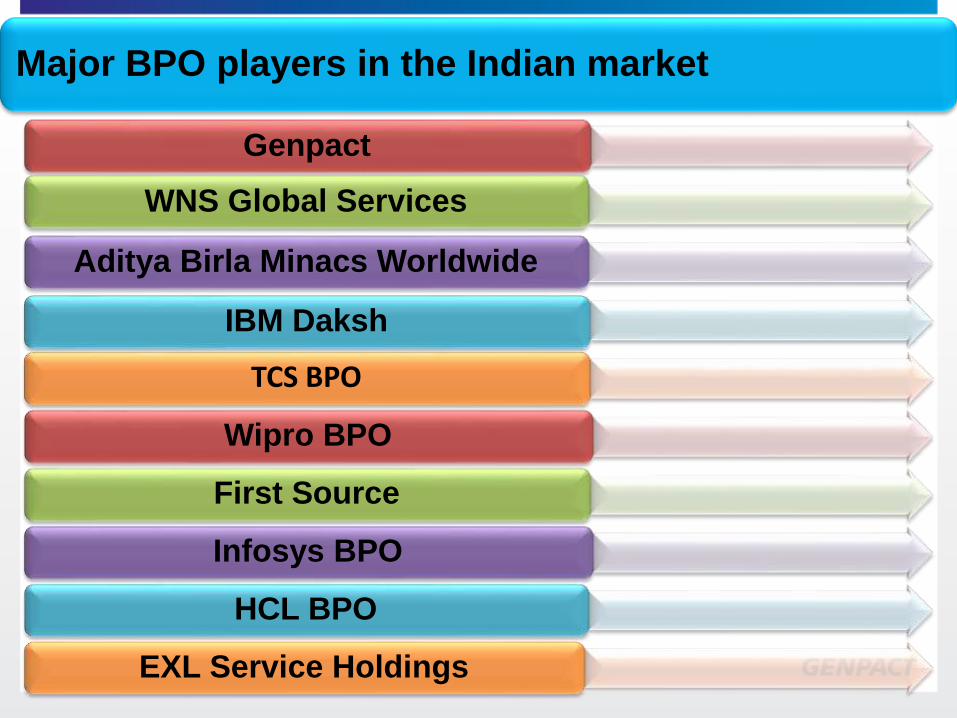
Major BPO players in the Indian market
Genpact
WNS Global Services
Aditya Birla Minacs Worldwide
IBM Daksh
TCS BPO
Wipro BPO
First Source
Infosys BPO
HCL BPO
EXL Service Holdings

STUDY ON INFLATION TREND AND ITS IMPACT ON OVER ALL FINANCIALS OF
GENPACT

•To study the inflation trend in Indian economy.
•To analyze the effect on the cost drivers in
Genpact due to various factors.
•To know the effect on the profitability of
Genpact due to change in the total cost of the
company.
Statement of Objectives

Inflation
The rate at which the general level of prices for goods and services is rising, and, subsequently, purchasing power is
falling.
Measure of price inflation is the inflation rate.
The price level rises, each unit of currency buys fewer goods and services.
Inflation is a rise in the general level of prices of goods and services.
For example: As inflation rises, every rupee will buy a smaller percentage of a good. For example, if the inflation rate
is 2%, then a Re.1 pack of gum will cost Re.1.02 in a year.

Inflation Dynamics
In short-run inflation dynamics is largely dependent on supply and demand conditions.
Monetary expansion influences inflationary condition in the long-run.
Monetary expansion could be caused by persistence of high fiscal deficit.
High monetary growth could lead to continued excess demand for a prolonged period without matching increase in output and productivity.

Source: Central statistical Organization, Ministry of Statistics and Programme Implementation, Government of India
9
5.05.6
4.8
3.83.4
4.0
5.0
7.6
6.0
4.0
7.8
0
1
2
3
4
5
6
7
8
9
10
Urban Non-Manual Employees
Urban Non-ManualEmployees
Inflation for
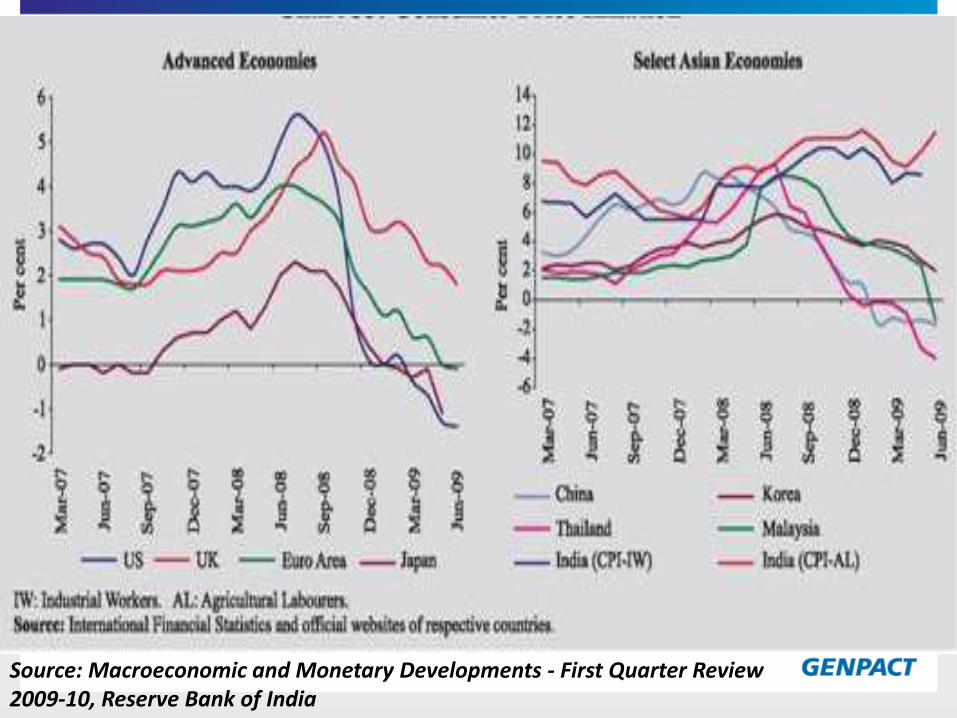
Source: Macroeconomic and Monetary Developments - First Quarter Review 2009-10, Reserve Bank of India

Research Methodology
•Scope of Research: The research has been conducted in
Gurgaon at Genpact India and it includes all the members of
Financial Planning & Analysis team.
•Universe: The people dealing in the finance support team of
various BPO companies.
•Population : Total number of employees working in the
Finance Planning and Analysis team in BFSI in Genpact India.
•Research Design : Descriptive
•Sampling Frame: all the employees working in the
Finance Planning and Analysis (FP and A) team in BFSI
in Genpact India.
•Sample size: The number of elements considered and
included in the study is 15.
•Data Collection:
Primary data
Secondary data

Limitations of the Research
Only selected expenses are considered
for the study.
For year 2010, the data was converted on proportionate
basis to 12 months in
order to reach down to a
yearly figure.
The study considered
only the financials of BFSI COE of
Genpact,.
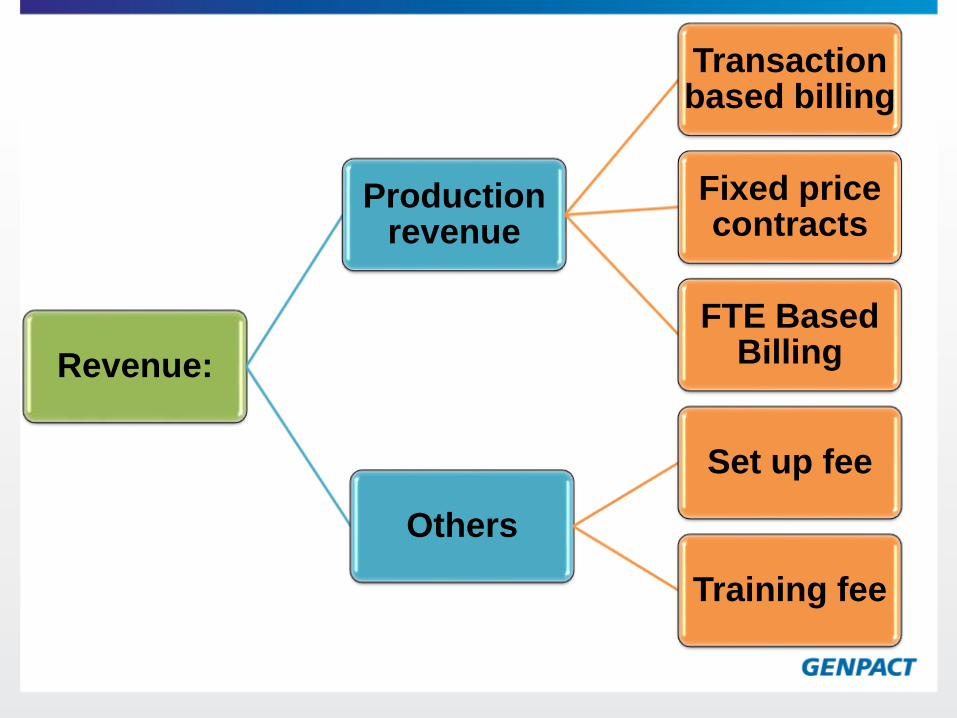
Revenue:
Production revenue
Transaction based billing
Fixed price contracts
FTE Based Billing
Others
Set up fee
Training fee

REALIZATION PER RGFTE: In simple words, it can
be defined as the contribution made to the total revenue by
each RGFTE employed by the company.
Realization per RGFTE = Production revenue
Production RGFTE Head count
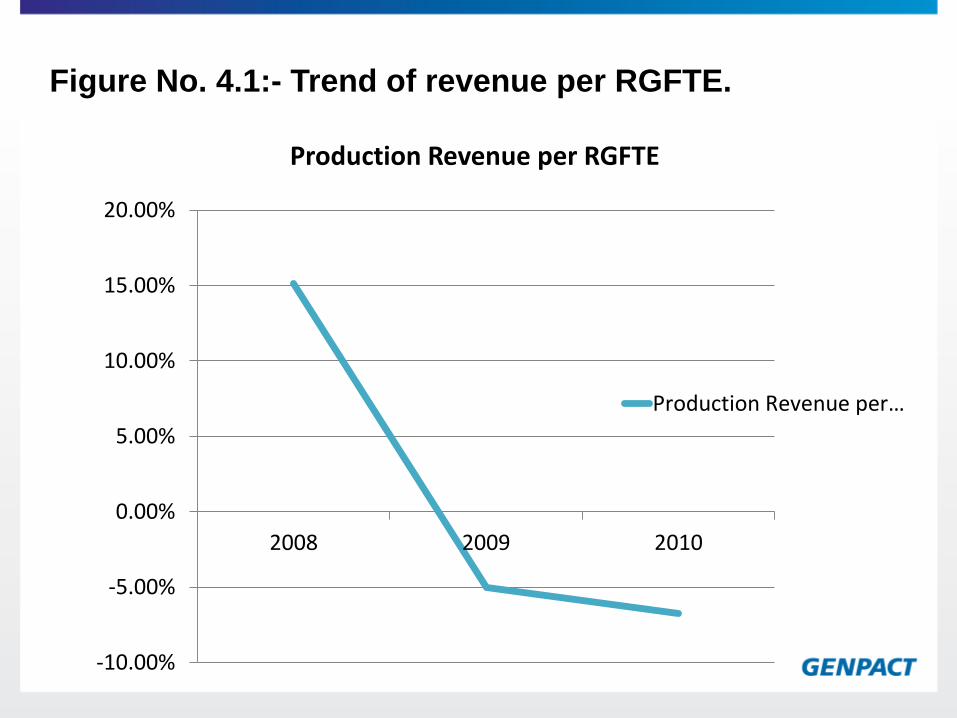
Figure No. 4.1:- Trend of revenue per RGFTE.
-10.00%
-5.00%
0.00%
5.00%
10.00%
15.00%
20.00%
2008 2009 2010
Production Revenue per RGFTE
Production Revenue per…

Expenses

SALARIES AND BENEFITS: While calculating salaries and
benefits, total of all kinds of salaries paid during the year is taken.
Cost Driver for salaries and benefits is the total Head Count of
the COE.
Salaries & Benefits per RGFTE = Total Salaries & Benefits
Total Head Count

Figure No. 4.2: Any significant deviation seen in the
cost during the contract period.
0
2
4
6
8
10
12
Yes No
No. of Respondents
No. of Respondents

Figure No: 4.3: Cost line that shows maximum
increase according to the team.
0
2
4
6
8
10
12
14
Salaries &Benefits
IT Infra Others
No. of Respondents
No. of Respondents

Figure No. 4.4: Trend for salaries per Head Count.
0.00%
1.00%
2.00%
3.00%
4.00%
5.00%
6.00%
7.00%
2008 2009 2010
Salaries per HC
Salaries per HC

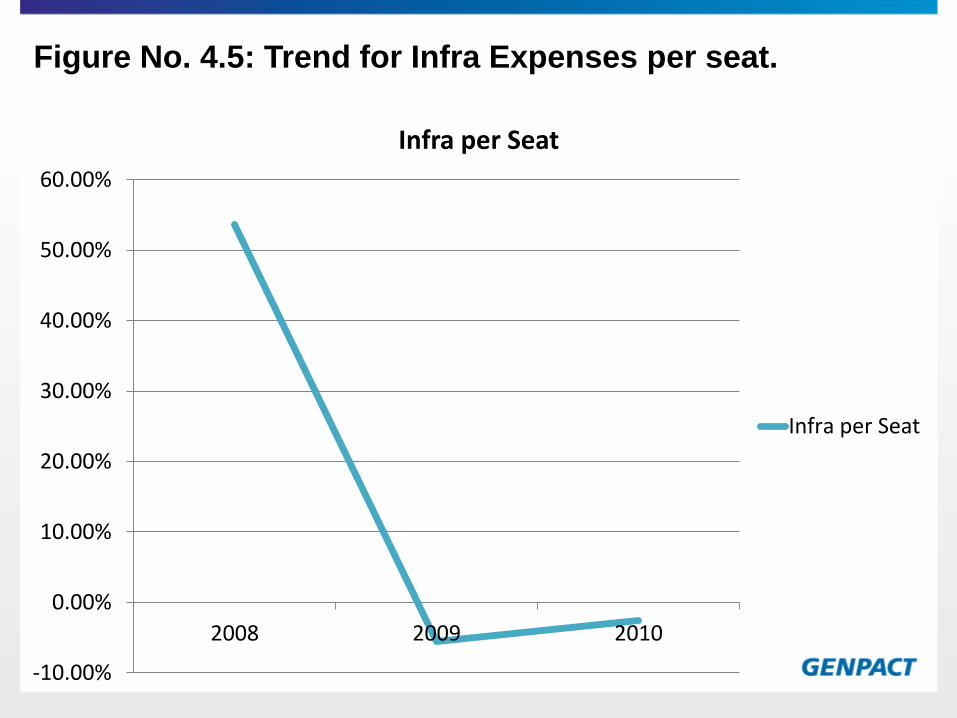
Figure No. 4.5: Trend for Infra Expenses per seat.
-10.00%
0.00%
10.00%
20.00%
30.00%
40.00%
50.00%
60.00%
2008 2009 2010
Infra per Seat
Infra per Seat

IT EXPENSES
Cost driver for IT expenses taken is SU, i.e. total number
of work stations being used at one time.
IT Expenses per SU = Total IT Expenses
Total Work Stations

Figure No. 4.6: Trend of IT Expenses per seat.
0.00%
10.00%
20.00%
30.00%
40.00%
50.00%
60.00%
70.00%
80.00%
2008 2009 2010
IT per Seat
IT per Seat

OTHER EMPLOYEE COSTS:
1. Training
Recruitment
2. Other expenses
Cost Driver for other expenses taken is HC. Total of HC up to band 4
and band 5 is taken into consideration.
Other expenses per HC = Total Cost
Total HC (Band 4 & 5)

Figure No.4.7: Trend of other expenses per head count.
-40.00%
-30.00%
-20.00%
-10.00%
0.00%
10.00%
20.00%
30.00%
40.00%
50.00%
60.00%
2008 2009 2010
Other per HC
Other per HC
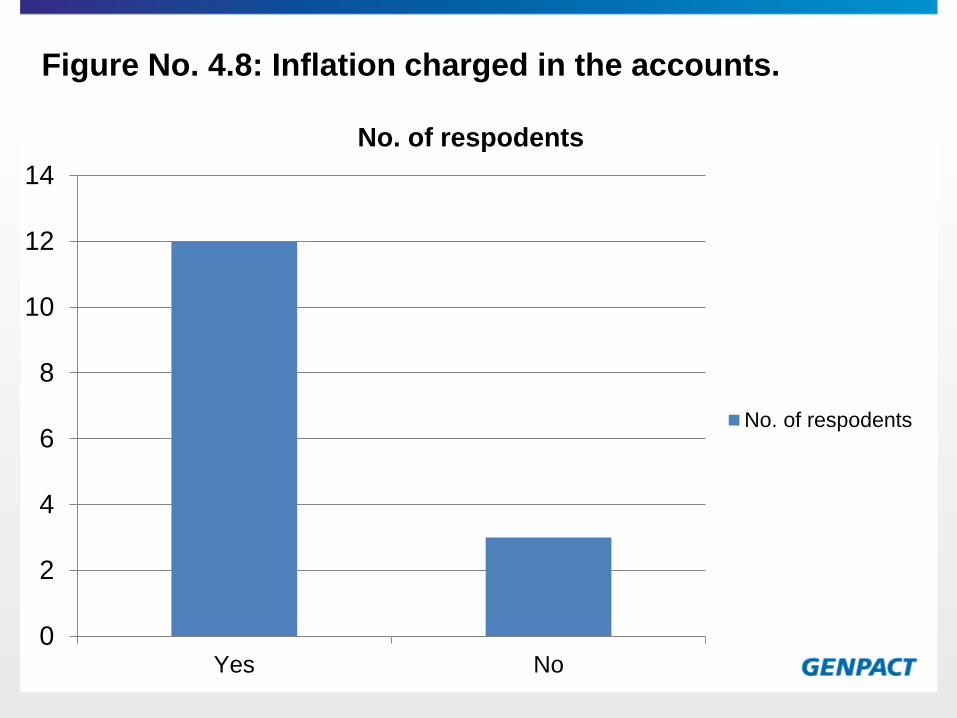
Figure No. 4.8: Inflation charged in the accounts.
0
2
4
6
8
10
12
14
Yes No
No. of respodents
No. of respodents

Figure No. 4.9: Percentage of inflation charged in the accounts.
0
1
2
3
4
5
6
7
0-5% 5-10% 10-15% More than 15
No. of respondents
No. of respondents

Figure No. 4.12: Revenue, cost and inflation.
-20.00%
-10.00%
0.00%
10.00%
20.00%
30.00%
40.00%
50.00%
2008 2009 2010
Revenue
Cost
Inflation

FINDINGS
•The cost line that is majorly affected by the change in the
rate of inflation is salary and benefits that constitute around
60-65% of the total cost of the company.
•On an average company has inflation clause in nearly all
its accounts.
•Company is charging on an average an inflation rate of 5%
on fixed rate basis from its clients.
•The Company is doing fairly enough as far as overcoming
inflation is concerned by offsetting the overall effect of
inflation by deflating other cost lines such as infra expenses
and It expenses etc.

•There has been a decline in the revenue by 10% and the
cost has increased by 3.50%. Therefore, reducing the
overall EBIT earned by the company in 2010.
•India contributes 72% in the total operations carried on the
company as a whole.
If the inflation continues to rise at the same pace and
company continues to apply the cost cutting at the same
rate, the profitability of company has a huge possibility to
decline in the future.
SUGGESTIONS
•The company should try to control the attrition rate as
that lead to hiring of new employees at the market rate.
•There are some accounts where no inflation clause is
charged. Company should try to negotiate with the
clients in order to introduce an inflation clause.
•If possible, negotiations should be made that during the
contract period with completion of every year there
should be some increment in the inflation rate provided
to the company by its clients.
For example – if inflation for 1st year is 4% then for 2nd year
the rate should be increased to 4.5% or 4.25% or so.
•Company should try to control its internal cost such as cost
on infrastructure, information technology and so on.
www.genpact.com