genomics” - archive.gersteinlab.orgarchive.gersteinlab.org/papers/e-print/funseq/preprint.pdf ·...
TRANSCRIPT
1
Title: “Integrative annotation of variants from 1,092 humans: application to cancer genomics” Authors: Ekta Khurana *,1,2, Yao Fu *,1, Vincenza Colonna *,3,4, Xinmeng Jasmine Mu *,1, Hyun Min Kang 5, Tuuli Lappalainen 6,7,8, Andrea Sboner 9,10, Lucas Lochovsky 1, Jieming Chen 1,11, Arif Harmanci 1,2 , Jishnu Das 12,13, Alexej Abyzov 1,2, Suganthi Balasubramanian 1,2, Kathryn Beal 14, Dimple Chakravarty 9, Daniel Challis 15, Yuan Chen 3, Declan Clarke 16, Laura Clarke 14, Fiona Cunningham 14, Uday S. Evani 15, Paul Flicek 14, Robert Fragoza 13, 17, Erik Garrison 18, Richard Gibbs 15, Zeynep H. Gümüş 10,19, Javier Herrero 14, Naoki Kitabayashi 9, Yong Kong 2,20, Kasper Lage 21,22,23,24,25, Vaja Liluashvili 10,19, Steven Lipkin 26, Daniel G. MacArthur 22,27, Gabor Marth 18, Donna Muzny 15, Tune H. Pers 24,28,29, Graham R. S. Ritchie 14, Jeffrey A. Rosenfeld 30,31, Cristina Sisu 1,2, Xiaomu Wei 13,26, Michael Wilson 1,32, Yali Xue 3, Fuli Yu 15, 1000 Genomes Project Consortium#, Emmanouil T. Dermitzakis 6,7,8 , Haiyuan Yu 12,13 , Mark A. Rubin 9, Chris Tyler-Smith¶ , 3, Mark Gerstein¶ ,1,2,33 *These authors contributed equally to this work ¶ Co-corresponding authors (Chris Tyler-Smith: [email protected] and Mark Gerstein: [email protected]) # A full list of participants and institutions is available in the Supplement Affiliations:
1. Program in Computational Biology and Bioinformatics, Yale University, New Haven, Connecticut 06520, USA
2. Dept of Molecular Biophysics and Biochemistry, Yale University, New Haven, Connecticut 06520, USA
3. Wellcome Trust Sanger Institute, Wellcome Trust Genome Campus, Cambridge, CB10 1SA, UK.
4. Institute of Genetics and Biophysics, National Research Council (CNR), 80131 Naples, Italy.
5. Center for Statistical Genetics, Biostatistics, University of Michigan, Ann Arbor, Michigan 48109, USA.
6. Dept of Genetic Medicine and Development, University of Geneva Medical School, Geneva, 1211 Switzerland.
7. Institute for Genetics and Genomics in Geneva (iGE3), University of Geneva, 1211 Geneva, Switzerland.
8. Swiss Institute of Bioinformatics, 1211 Geneva, Switzerland. 9. Institute for Precision Medicine and the Department of Pathology and Laboratory
Medicine, Weill Cornell Medical College and New York-Presbyterian Hospital, New York, NY, 10065 USA.
10. The HRH Prince Alwaleed Bin Talal Bin Abdulaziz Alsaud Institute for Computational Biomedicine, Weill Cornell Medical College, New York, NY, 10021, USA.
11. Integrated Graduate Program in Physical and Engineering Biology, Yale University, New Haven, CT
2
12. Department of Biological Statistics and Computational Biology, Cornell University, Ithaca, NY 14853, USA.
13. Weill Institute for Cell and Molecular Biology, Cornell University, Ithaca, NY 14853, USA.
14. European Molecular Biology Laboratory, European Bioinformatics Institute, Wellcome Trust Genome Campus, Hinxton, Cambridge, CB10 1SD, UK.
15. Baylor College of Medicine, Human Genome Sequencing Center, Houston, Texas 77030, USA.
16. Dept of Chemistry, Yale University, New Haven, Connecticut 06520, USA. 17. Department of Molecular Biology and Genetics, Cornell University, Ithaca, NY
14853, USA 18. Dept of Biology, Boston College, Chestnut Hill, Massachusetts 02467, USA. 19. Department of Physiology and Biophysics, Weill Cornell Medical College, New
York, NY, 10065, USA. 20. Keck Biotechnology Resource Laboratory, Yale University, New Haven, CT, USA. 21. Pediatric Surgical Research Laboratories, MassGeneral Hospital for Children,
Massachusetts General Hospital, Boston, MA, US 22. Analytical and Translational Genetics Unit, Massachusetts General Hospital,
Boston, MA 02114, US 23. Harvard Medical School, Boston, Massachusetts, USA. 24. Center for Biological Sequence Analysis, Department of Systems Biology,
Technical University of Denmark, Lyngby, Denmark 25. Center for Protein Research, University of Copenhagen, Copenhagen, Denmark 26. Department of Medicine, Weill Cornell Medical College, New York, NY 10065,
USA. 27. Program in Medical and Population Genetics, Broad Institute of Harvard and MIT,
Cambridge, MA 02142, USA 28. Division of Endocrinology and Center for Basic and Translational
Obesity Research, Children’s Hospital, Boston, USA 29. Broad Institute of the Massachusetts Institute of Technology and
Harvard, Cambridge, USA. 30. Department of Medicine, New Jersey Medical School, Newark, NJ 07101 31. IST/High Performance and Research Computing, University of Medicine and
Dentistry of New Jersey, Newark, NJ 07101 32. Child Study Center, Yale University, New Haven, Connecticut 06520, USA 33. Dept of Computer Science, Yale University, New Haven, Connecticut 06520,
USA.
One sentence summary: Prioritization of non-coding variants in disease studies using patterns of polymorphisms in functional elements.

3
Abstract Interpreting variants, especially non-coding ones, in the increasing number of personal genomes is challenging. We use patterns of polymorphisms in functionally annotated regions in 1,092 humans to identify deleterious variants; then we experimentally validate candidates. We analyzed both coding and non-coding regions, with the former corroborating the latter. We find regions particularly sensitive to mutations (“ultra-sensitive”) and variants that are disruptive due to mechanistic effects on transcription-factor binding (i.e. "motif-breakers"). We also find variants in regions with higher network centrality tend to be deleterious. Insertions and deletions follow a similar pattern to single -nucleotide variants, with some notable exceptions (e.g. certain deletions and enhancers). Based on these patterns, we develop a computational tool (FunSeq), whose application to ~90 cancer genomes reveals nearly a hundred candidate non-coding drivers.

4
Introduction Whole-genome sequencing has revealed millions of variants per individual. However, the functional implications of the vast majority of these variants remain poorly understood (1). It is well established that variants in protein-coding genes play a crucial role in human disease. Although it is known that non-coding regions are under negative selection and variants in them have been linked to disease, their role is generally less well understood (2-9). In particular, while some studies have demonstrated a link between common variants from genome-wide association studies (GWAS) and regulatory regions (2, 3), the deleterious effects of rare inherited variants and somatic cancer mutations in non-coding regions have not been explored in a genome-wide fashion. Recently, three studies reported non-coding driver mutations in the TERT promoter in multiple tumor types, including melanomas and gliomas (10-12). In light of these studies and the growing availability of whole-genome cancer sequencing (13-20), an integrated framework facilitating functional interpretation of non-coding variants would be useful. One may think to identify non-coding regions under strong selection purely through mammalian sequence conservation, and ultra-conserved elements have been found in this fashion (21). However, signatures of purifying selection identified using population-variation data chould provide better insights into the significance of a genomic region in humans than evolutionary conservation. This is because many regions of the genome show human-specific purifying selection, while other regions conserved across mammals show a lack of functional activity and selection in humans (7). Thus, identifying the specific elements under particularly strong purifying selection amongst humans could provide novel insights. Besides SNPs, the human genome also contains other variants including small insertions and deletions (indels) and larger structural variants (SVs) (22). They account for more nucleotide differences amongst humans than SNPs; hence an understanding of their relationship with functional elements is crucial (23). Here we use the full range of sequence polymorphisms (ranging from SNPs to SVs) from 1,092 humans to study patterns of selection in various functional categories, especially non-coding regulatory regions (24). We identify specific genomic regions where variants are more likely to have strong phenotypic impact. The list of these regions includes groups of coding genes and specific sites within them, and, importantly, particular non-coding elements. By further comparing patterns of polymorphisms with somatic mutations, we show how this list can aid in the identification of cancer drivers. We use multiple experimental methods for validation, including yeast two-hybrid experiments, Sanger sequencing of independent cancer samples and relevant gene-expression measurements. Furthermore, we provide a software tool, which allows researchers to prioritize non-coding variants in disease studies. Genomic elements under strong purifying selection: ultra-sensitive regions

5
Enrichment of rare variants can be used to estimate the strength of purifying selection in different functional categories (24). As expected, we find that having variants from 1,092 individuals allows us to detect specific functional categories under strong purifying selection with greater power than previously possible (2, 7, 9). In particular, the increased number of samples provides a better estimate of allele frequencies, making possible the measurement of differential selective constraints between specific categories (e.g., between motifs of transcription-factor (TF) families HMG and MADs-box) (Figs S4 and S5). Estimates of purifying selection obtained using enrichment of rare non-synonymous SNPs (derived allele frequency or DAF<0.5%) show that different gene categories exhibit differential selection consistent with their known phenotypic consequences (Datafile S1). Genes tolerant of loss-of-function (LoF) mutations are under the weakest selection while cancer-causal genes are under the strongest (Fig 1A and Table S1). GWAS genes associated with complex disorders lie in between these extremes, consistent with the presence of common genetic variants in them. We then analyzed selective constraints in non-coding regions, trying to find elements under very strong selection (i.e. with a fraction of rare variants similar to that of coding genes, ~67%). We first estimated the strength of negative selection in broad categories (e.g., in all TF-binding sites (TFBSs), DNaseI-hypersensitive sites (DHSs), ncRNAs and enhancers) (Fig 2A). As observed previously, most of these categories show slight but statistically significant enrichment of rare SNPs compared to the genomic average; in contrast, pseudogenes demonstrate a depletion (Fig 2A and Datafile S2) (2). We further divided the broad categories into 677 high-resolution ones. These span various genomic features likely to influence the extent of selection acting on the element. For example, TFBSs of different TF families are divided into proximal vs distal and cell-line–specific vs –non-specific (Fig S7). We find heterogeneous degrees of negative selection for specific categories (Fig 2B and Datafile S2). For instance, core motifs in the binding sites of TF families HMG and Forkhead are under particularly strong selection, whereas those in the CBF-NFY family do not exhibit selective constraints (relative to the genomic average) (Fig 2B). Amongst all the pseudogenes, polymorphic ones have the highest fraction of rare alleles consistent with their functional coding roles in some individuals (25). Overall, we find 102 of the 677 categories show statistically significant selective constraints (Datafile S2) (Figs S8 to S10). Amongst these 102 categories, we define the top ones covering ~0.02% and ~0.4% of the genome as “ultra-sensitive” and “sensitive”, respectively (Fig S11) (Datafile S3). Thus, these regions are defined such that they possess a high fraction of rare variants comparable to that for coding sequences (67.2% for coding and 65.7% for ultra-sensitive) (Fig 2C). We validated the rare variants in them by comparison with Complete Genomics data. Sensitive regions include binding sites of some chromatin and general TFs (e.g., BRF1 and FAM48A) and core motifs of some important TF families (e.g., JUN, HMG, Forkhead and GATA). For some TFs there is a strong difference between proximal and distal binding sites -- e.g. for ZNF274, proximal binding sites are under strong selection and belong to the ultra-sensitive category, whereas distal sites are not under negative selection.
6
In order to validate the functional significance of sensitive and ultra-sensitive regions, we examined the presence of inherited disease-causing mutations from HGMD (Human Gene Mutation Database) in them (26). We find ~40- and ~400-fold enrichment of disease-causing mutations in sensitive and ultra-sensitive regions, respectively (compared to the entire non-coding sequence, p-value < 2.2e-16) (Fig 2E). Thus, these documented disease-causing variants provide independent validation for the functional importance of sensitive regions. As a specific example, the disease congenital erythropoietic porphyria is caused by disruption of a binding site classified as sensitive (the GATA1 motif upstream of Uroporphyrinogen-III synthase) (27). Similarly, the well-known disease-causing ncRNA RMRP is in the binding site of BRF2, classified as ultra-sensitive (28). Purifying selection and other aspects of regulatory regions We analyzed sites at which SNPs break or conserve core-binding motifs. As expected, we find that disruptive motif-breaking SNPs are significantly enriched for rare alleles compared to motif-conserving ones (p-value < 2.2e-16; Fig 2D; motif-breaking SNP is defined as a change that decreases the matching score in the motif position weight matrix). This result is over all TF families; moreover, we find the difference between constraints on motif-breaking vs. -conserving SNPs varies considerably for different TF families, possibly reflecting differences in the topology of their DNA binding domains (Datafile S4). We also find that eQTLs are enriched in the binding sites of many TF families (Fig 2B); the association of TF binding and gene expression at these loci provides a plausible explanation for their phenotypic effects. Analysis of SNPs from a personal genome (NA12878) exhibiting allele-specific TF binding in ChIP-Seq data or allele-specific expression in RNA-seq data (with the allele-specific “activity” tagging a difference between the maternal and paternal chromosomes at the genomic region in question) shows that these sites are depleted for rare variants (relative to a matched control) (Fig 2F). This suggests that regions where differential allelic activity is not observed may be under stronger purifying selection (29). In a similar fashion, we find that core-motif regions bound in a "ubiquitous manner" (i.e. where differential cell-type-specific binding is not observed) are under stronger selection than those bound by TFs in a single cell-line (Datafile S2), consistent with the greater functional importance of ubiquitously bound regions. In relation to this, we further examined how selective constraints vary amongst coding genes and DHSs with tissue-specific activity (Fig 1B). We find there are pronounced differences between tissues: e.g. genes with ovary- and brain-specific expression are under significantly stronger selection than average across all tissues (Fig 1B and Table S4). Similarly, some DHSs are under significantly stronger selection while others are under relaxed constraints relative to the average (brain- and kidney-specific vs Urothelium- and breast-specific, respectively; Fig 1B and Table S4). Finally, the six tissues for which we have matched expression and DHS data indicate that purifying selection in tissue-specific genes and their corresponding regulatory regions is likely correlated (Fig S15). Thus, our results suggest that the deleteriousness of both coding and regulatory variants depends on the tissues they affect.
7
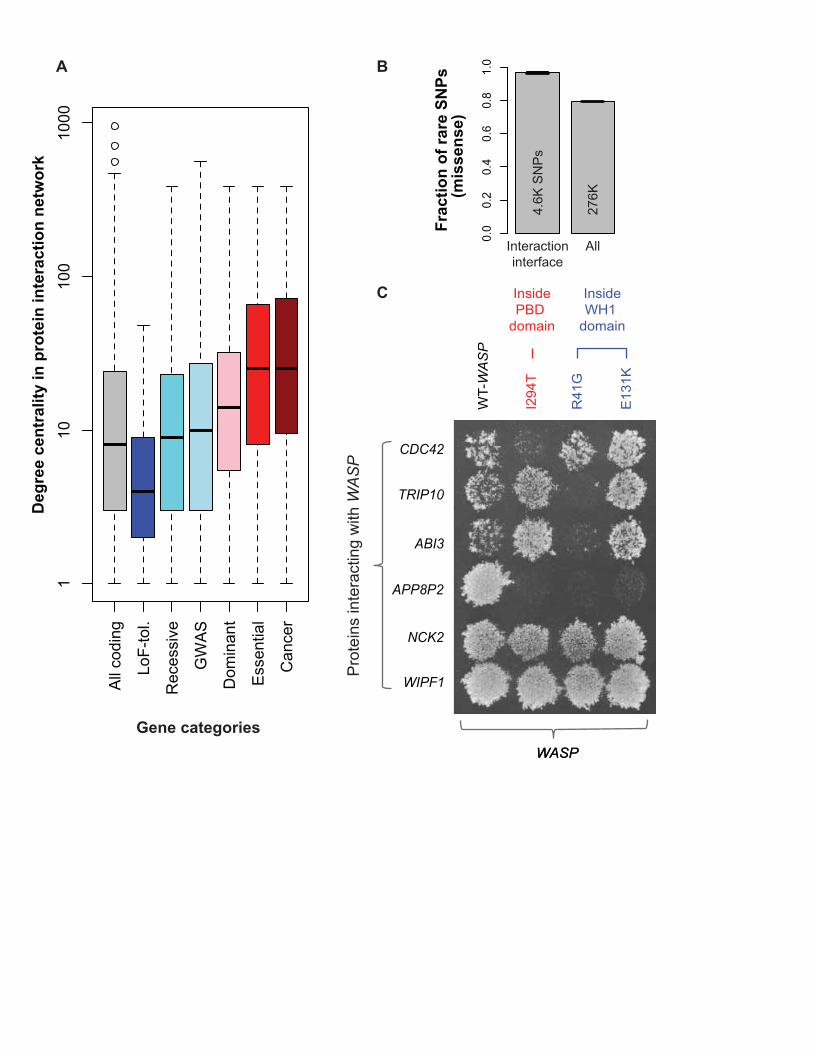
Purifying selection in the interactome and regulome We find a significant positive correlation between the fraction of rare SNPs and the degree centrality of genes in networks: physical protein-protein interaction (PPI) (rho = 0.15; p-value < 2.2e-16) and regulatory (rho = 0.07; p-value = 6.8e-08). Thus, consistent with previous studies, we find hub genes tend to be under stronger negative selection (29-31). Indeed, we find that centralities of different gene categories in the PPI network follow the same trend as differential selective constraints on them: cancer-causal genes show the highest connectivity, and LoF-tolerant genes, the least, with GWAS genes in the middle (Figs 1A and 3A). These results indicate that the interactions of a gene likely influence the selection acting upon it. Hub proteins tend to have more interaction interfaces in the PPI network (31). A corollary of this is that interaction interfaces are themselves under strong selection, in turn leading to stronger constraints on hub proteins. Indeed, we find that SNPs disrupting interaction interfaces are enriched for rare alleles (p-value < 2.2e-16) (Fig 3B). To further corroborate this, we tested a specific case -- the Wiskott-Aldrich syndrome protein (WASP) -- using yeast two-hybrid (Y2H) experiments (32). All of the three tested single nucleotide variants (SNVs) at WASP interaction interfaces disrupt its interactions with other proteins (Fig 3C). We observe similar behavior for two other proteins – mutations at their interfaces disrupt specific protein interactions (Fig S16). Relationship of functional elements with indels and larger SVs We analyzed the relationship of small indels (<50 bp) and large SVs (deletions) with functional annotations. Similar to the results for non-synonymous SNPs, we find that genes linked with diseases show stronger selection against indels while LoF-tolerant genes show weaker constraints (relative to all genes), with a consistent trend for indels overall and frameshift indels, in particular (Figs 4A and S17, Table S1). The wide range of SV sizes (~50 bp to ~1Mb) leads to their diverse modes of intersection with functional elements; for example, a single SV breakpoint can split an element, a smaller SV can cut out a portion of a single element, and a large SV can engulf an entire element. To analyze the diverse effects of SVs, we computed the enrichment/depletion of SVs overlapping each functional category, relative to a randomized control. As expected, we find that genic regions (coding sequences, UTRs and introns) are depleted for SVs, suggesting SVs affecting gene function are deleterious (Fig 4B) (22). However, when we break down the mode of SV intersection with genes into partial vs. whole (an SV breakpoint splitting a gene vs. an SV engulfing a whole gene), we find, surprisingly, SVs are enriched for whole- but depleted for partial-gene overlap. This suggests that partial-gene overlap is under stronger selection than whole-gene overlap, possibly because whole-gene deletions may be compensated by duplications. Furthermore, another category of gene-related elements, pseudogenes, are enriched for SVs, consistent with their formation mechanism involving either duplication or retrotransposition. In relation to non-genic elements, we find that SVs tend to be depleted in regulatory elements such as binding-site motifs and enhancers (Fig 4B), consistent with our
8
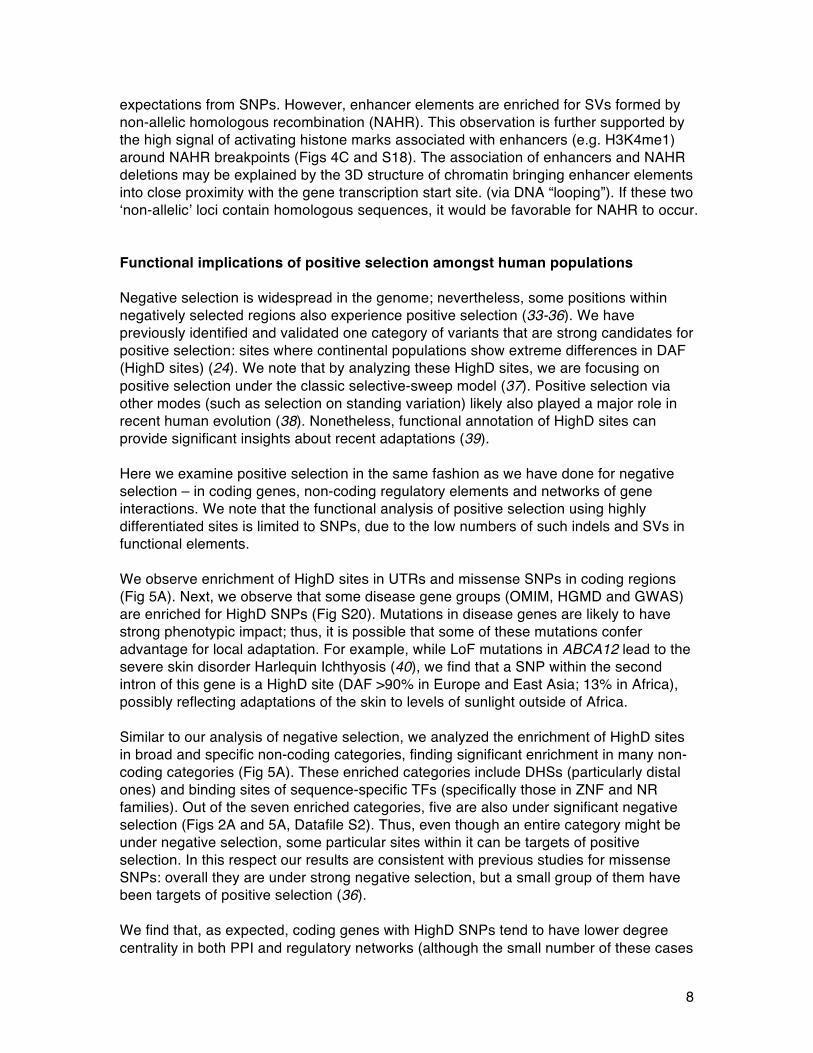
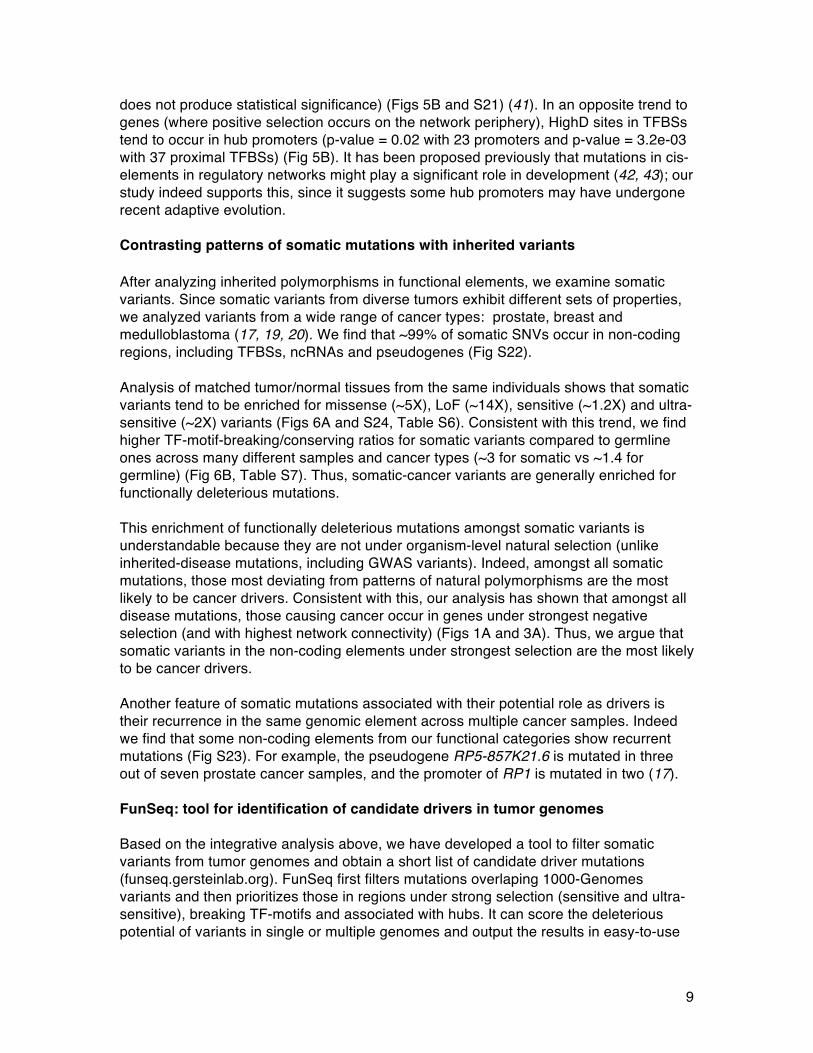
expectations from SNPs. However, enhancer elements are enriched for SVs formed by non-allelic homologous recombination (NAHR). This observation is further supported by the high signal of activating histone marks associated with enhancers (e.g. H3K4me1) around NAHR breakpoints (Figs 4C and S18). The association of enhancers and NAHR deletions may be explained by the 3D structure of chromatin bringing enhancer elements into close proximity with the gene transcription start site. (via DNA “looping”). If these two ‘non-allelic’ loci contain homologous sequences, it would be favorable for NAHR to occur. Functional implications of positive selection amongst human populations Negative selection is widespread in the genome; nevertheless, some positions within negatively selected regions also experience positive selection (33-36). We have previously identified and validated one category of variants that are strong candidates for positive selection: sites where continental populations show extreme differences in DAF (HighD sites) (24). We note that by analyzing these HighD sites, we are focusing on positive selection under the classic selective-sweep model (37). Positive selection via other modes (such as selection on standing variation) likely also played a major role in recent human evolution (38). Nonetheless, functional annotation of HighD sites can provide significant insights about recent adaptations (39). Here we examine positive selection in the same fashion as we have done for negative selection – in coding genes, non-coding regulatory elements and networks of gene interactions. We note that the functional analysis of positive selection using highly differentiated sites is limited to SNPs, due to the low numbers of such indels and SVs in functional elements. We observe enrichment of HighD sites in UTRs and missense SNPs in coding regions (Fig 5A). Next, we observe that some disease gene groups (OMIM, HGMD and GWAS) are enriched for HighD SNPs (Fig S20). Mutations in disease genes are likely to have strong phenotypic impact; thus, it is possible that some of these mutations confer advantage for local adaptation. For example, while LoF mutations in ABCA12 lead to the severe skin disorder Harlequin Ichthyosis (40), we find that a SNP within the second intron of this gene is a HighD site (DAF >90% in Europe and East Asia; 13% in Africa), possibly reflecting adaptations of the skin to levels of sunlight outside of Africa. Similar to our analysis of negative selection, we analyzed the enrichment of HighD sites in broad and specific non-coding categories, finding significant enrichment in many non-coding categories (Fig 5A). These enriched categories include DHSs (particularly distal ones) and binding sites of sequence-specific TFs (specifically those in ZNF and NR families). Out of the seven enriched categories, five are also under significant negative selection (Figs 2A and 5A, Datafile S2). Thus, even though an entire category might be under negative selection, some particular sites within it can be targets of positive selection. In this respect our results are consistent with previous studies for missense SNPs: overall they are under strong negative selection, but a small group of them have been targets of positive selection (36). We find that, as expected, coding genes with HighD SNPs tend to have lower degree centrality in both PPI and regulatory networks (although the small number of these cases
9
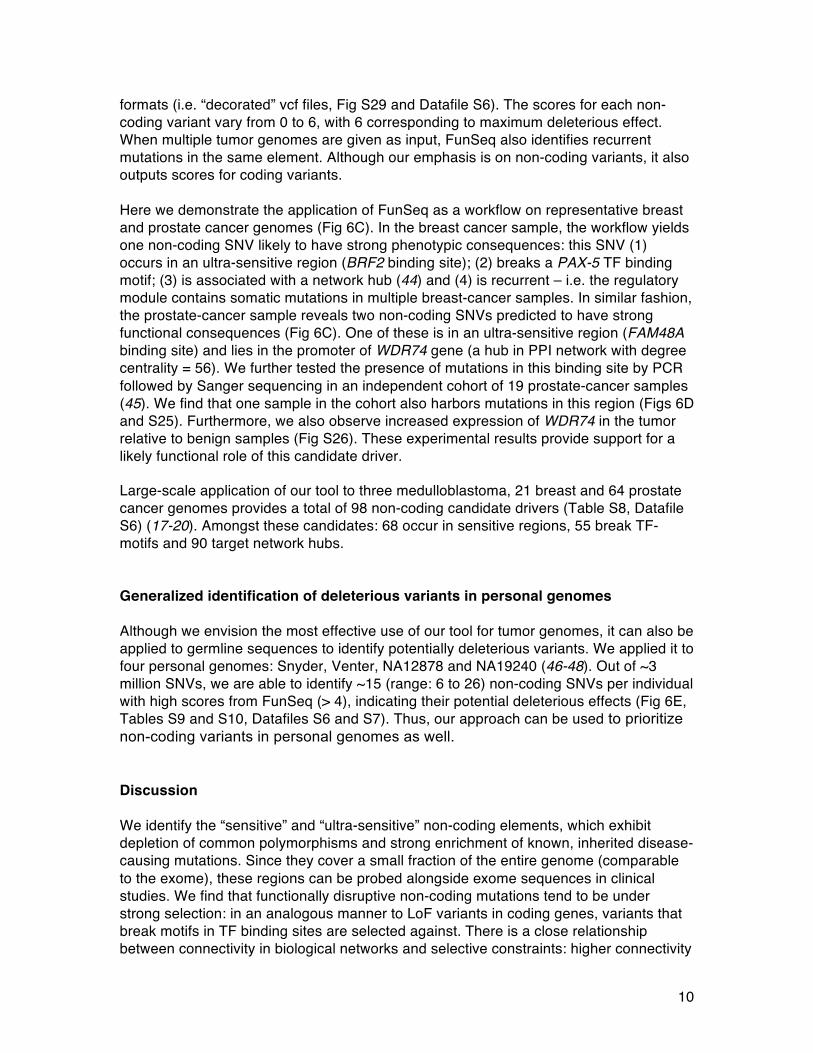
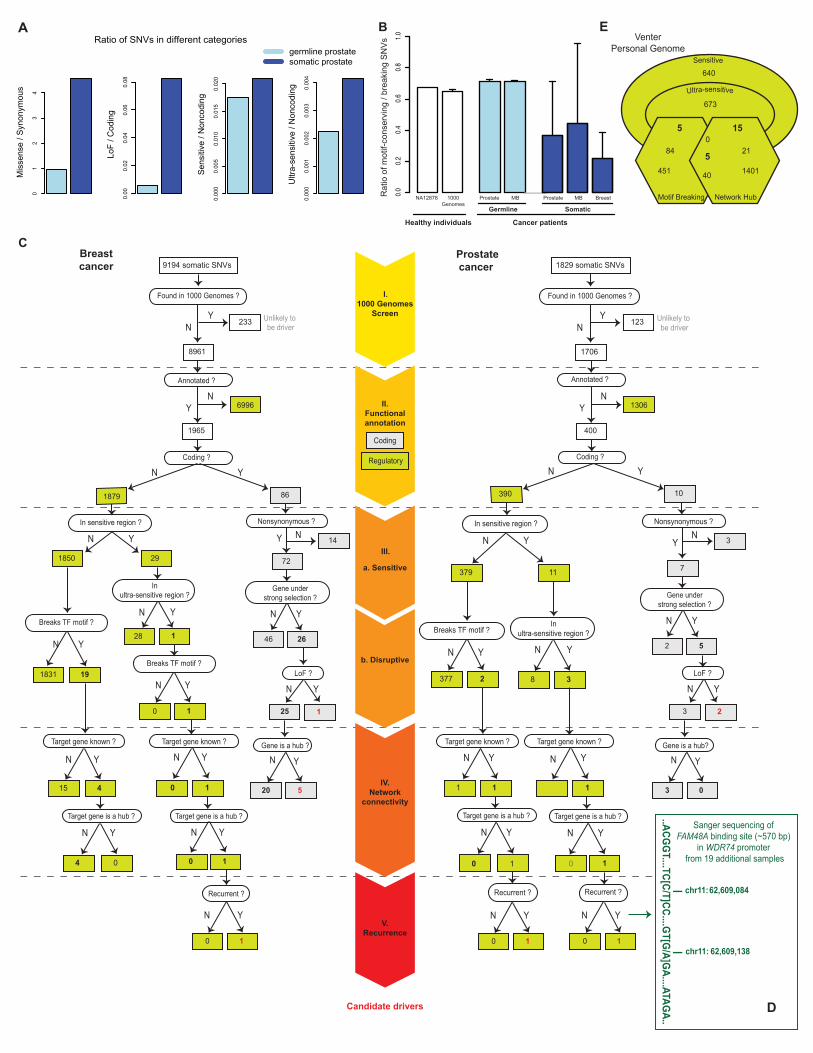
does not produce statistical significance) (Figs 5B and S21) (41). In an opposite trend to genes (where positive selection occurs on the network periphery), HighD sites in TFBSs tend to occur in hub promoters (p-value = 0.02 with 23 promoters and p-value = 3.2e-03 with 37 proximal TFBSs) (Fig 5B). It has been proposed previously that mutations in cis-elements in regulatory networks might play a significant role in development (42, 43); our study indeed supports this, since it suggests some hub promoters may have undergone recent adaptive evolution. Contrasting patterns of somatic mutations with inherited variants After analyzing inherited polymorphisms in functional elements, we examine somatic variants. Since somatic variants from diverse tumors exhibit different sets of properties, we analyzed variants from a wide range of cancer types: prostate, breast and medulloblastoma (17, 19, 20). We find that ~99% of somatic SNVs occur in non-coding regions, including TFBSs, ncRNAs and pseudogenes (Fig S22). Analysis of matched tumor/normal tissues from the same individuals shows that somatic variants tend to be enriched for missense (~5X), LoF (~14X), sensitive (~1.2X) and ultra-sensitive (~2X) variants (Figs 6A and S24, Table S6). Consistent with this trend, we find higher TF-motif-breaking/conserving ratios for somatic variants compared to germline ones across many different samples and cancer types (~3 for somatic vs ~1.4 for germline) (Fig 6B, Table S7). Thus, somatic-cancer variants are generally enriched for functionally deleterious mutations. This enrichment of functionally deleterious mutations amongst somatic variants is understandable because they are not under organism-level natural selection (unlike inherited-disease mutations, including GWAS variants). Indeed, amongst all somatic mutations, those most deviating from patterns of natural polymorphisms are the most likely to be cancer drivers. Consistent with this, our analysis has shown that amongst all disease mutations, those causing cancer occur in genes under strongest negative selection (and with highest network connectivity) (Figs 1A and 3A). Thus, we argue that somatic variants in the non-coding elements under strongest selection are the most likely to be cancer drivers. Another feature of somatic mutations associated with their potential role as drivers is their recurrence in the same genomic element across multiple cancer samples. Indeed we find that some non-coding elements from our functional categories show recurrent mutations (Fig S23). For example, the pseudogene RP5-857K21.6 is mutated in three out of seven prostate cancer samples, and the promoter of RP1 is mutated in two (17).
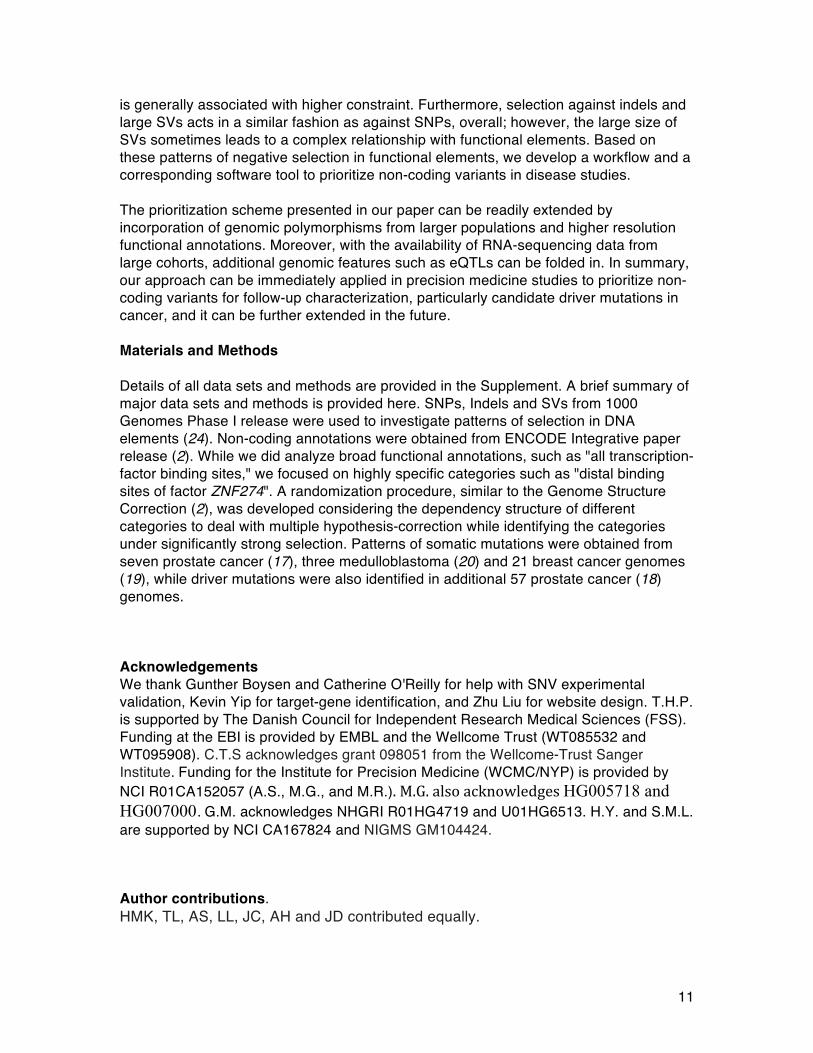
FunSeq: tool for identification of candidate drivers in tumor genomes Based on the integrative analysis above, we have developed a tool to filter somatic variants from tumor genomes and obtain a short list of candidate driver mutations (funseq.gersteinlab.org). FunSeq first filters mutations overlaping 1000-Genomes variants and then prioritizes those in regions under strong selection (sensitive and ultra-sensitive), breaking TF-motifs and associated with hubs. It can score the deleterious potential of variants in single or multiple genomes and output the results in easy-to-use
10
formats (i.e. “decorated” vcf files, Fig S29 and Datafile S6). The scores for each non-coding variant vary from 0 to 6, with 6 corresponding to maximum deleterious effect. When multiple tumor genomes are given as input, FunSeq also identifies recurrent mutations in the same element. Although our emphasis is on non-coding variants, it also outputs scores for coding variants. Here we demonstrate the application of FunSeq as a workflow on representative breast and prostate cancer genomes (Fig 6C). In the breast cancer sample, the workflow yields one non-coding SNV likely to have strong phenotypic consequences: this SNV (1) occurs in an ultra-sensitive region (BRF2 binding site); (2) breaks a PAX-5 TF binding motif; (3) is associated with a network hub (44) and (4) is recurrent – i.e. the regulatory module contains somatic mutations in multiple breast-cancer samples. In similar fashion, the prostate-cancer sample reveals two non-coding SNVs predicted to have strong functional consequences (Fig 6C). One of these is in an ultra-sensitive region (FAM48A binding site) and lies in the promoter of WDR74 gene (a hub in PPI network with degree centrality = 56). We further tested the presence of mutations in this binding site by PCR followed by Sanger sequencing in an independent cohort of 19 prostate-cancer samples (45). We find that one sample in the cohort also harbors mutations in this region (Figs 6D and S25). Furthermore, we also observe increased expression of WDR74 in the tumor relative to benign samples (Fig S26). These experimental results provide support for a likely functional role of this candidate driver. Large-scale application of our tool to three medulloblastoma, 21 breast and 64 prostate cancer genomes provides a total of 98 non-coding candidate drivers (Table S8, Datafile S6) (17-20). Amongst these candidates: 68 occur in sensitive regions, 55 break TF-motifs and 90 target network hubs. Generalized identification of deleterious variants in personal genomes Although we envision the most effective use of our tool for tumor genomes, it can also be applied to germline sequences to identify potentially deleterious variants. We applied it to four personal genomes: Snyder, Venter, NA12878 and NA19240 (46-48). Out of ~3 million SNVs, we are able to identify ~15 (range: 6 to 26) non-coding SNVs per individual with high scores from FunSeq (> 4), indicating their potential deleterious effects (Fig 6E, Tables S9 and S10, Datafiles S6 and S7). Thus, our approach can be used to prioritize non-coding variants in personal genomes as well. Discussion We identify the “sensitive” and “ultra-sensitive” non-coding elements, which exhibit depletion of common polymorphisms and strong enrichment of known, inherited disease-causing mutations. Since they cover a small fraction of the entire genome (comparable to the exome), these regions can be probed alongside exome sequences in clinical studies. We find that functionally disruptive non-coding mutations tend to be under strong selection: in an analogous manner to LoF variants in coding genes, variants that break motifs in TF binding sites are selected against. There is a close relationship between connectivity in biological networks and selective constraints: higher connectivity
11
is generally associated with higher constraint. Furthermore, selection against indels and large SVs acts in a similar fashion as against SNPs, overall; however, the large size of SVs sometimes leads to a complex relationship with functional elements. Based on these patterns of negative selection in functional elements, we develop a workflow and a corresponding software tool to prioritize non-coding variants in disease studies. The prioritization scheme presented in our paper can be readily extended by incorporation of genomic polymorphisms from larger populations and higher resolution functional annotations. Moreover, with the availability of RNA-sequencing data from large cohorts, additional genomic features such as eQTLs can be folded in. In summary, our approach can be immediately applied in precision medicine studies to prioritize non-coding variants for follow-up characterization, particularly candidate driver mutations in cancer, and it can be further extended in the future. Materials and Methods Details of all data sets and methods are provided in the Supplement. A brief summary of major data sets and methods is provided here. SNPs, Indels and SVs from 1000 Genomes Phase I release were used to investigate patterns of selection in DNA elements (24). Non-coding annotations were obtained from ENCODE Integrative paper release (2). While we did analyze broad functional annotations, such as "all transcription-factor binding sites," we focused on highly specific categories such as "distal binding sites of factor ZNF274". A randomization procedure, similar to the Genome Structure Correction (2), was developed considering the dependency structure of different categories to deal with multiple hypothesis-correction while identifying the categories under significantly strong selection. Patterns of somatic mutations were obtained from seven prostate cancer (17), three medulloblastoma (20) and 21 breast cancer genomes (19), while driver mutations were also identified in additional 57 prostate cancer (18) genomes. Acknowledgements We thank Gunther Boysen and Catherine O'Reilly for help with SNV experimental validation, Kevin Yip for target-gene identification, and Zhu Liu for website design. T.H.P. is supported by The Danish Council for Independent Research Medical Sciences (FSS). Funding at the EBI is provided by EMBL and the Wellcome Trust (WT085532 and WT095908). C.T.S acknowledges grant 098051 from the Wellcome-Trust Sanger Institute. Funding for the Institute for Precision Medicine (WCMC/NYP) is provided by NCI R01CA152057 (A.S., M.G., and M.R.). M.G. also acknowledges HG005718 and HG007000. G.M. acknowledges NHGRI R01HG4719 and U01HG6513. H.Y. and S.M.L. are supported by NCI CA167824 and NIGMS GM104424.
Author contributions. HMK, TL, AS, LL, JC, AH and JD contributed equally.

12
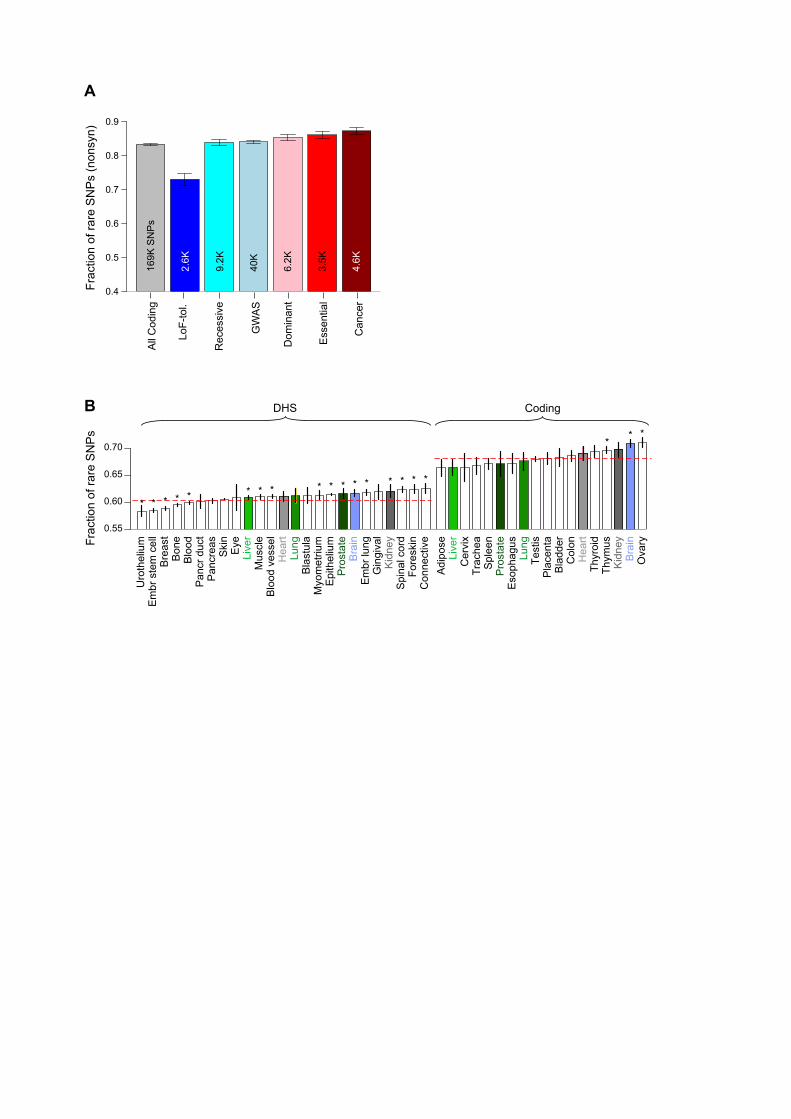
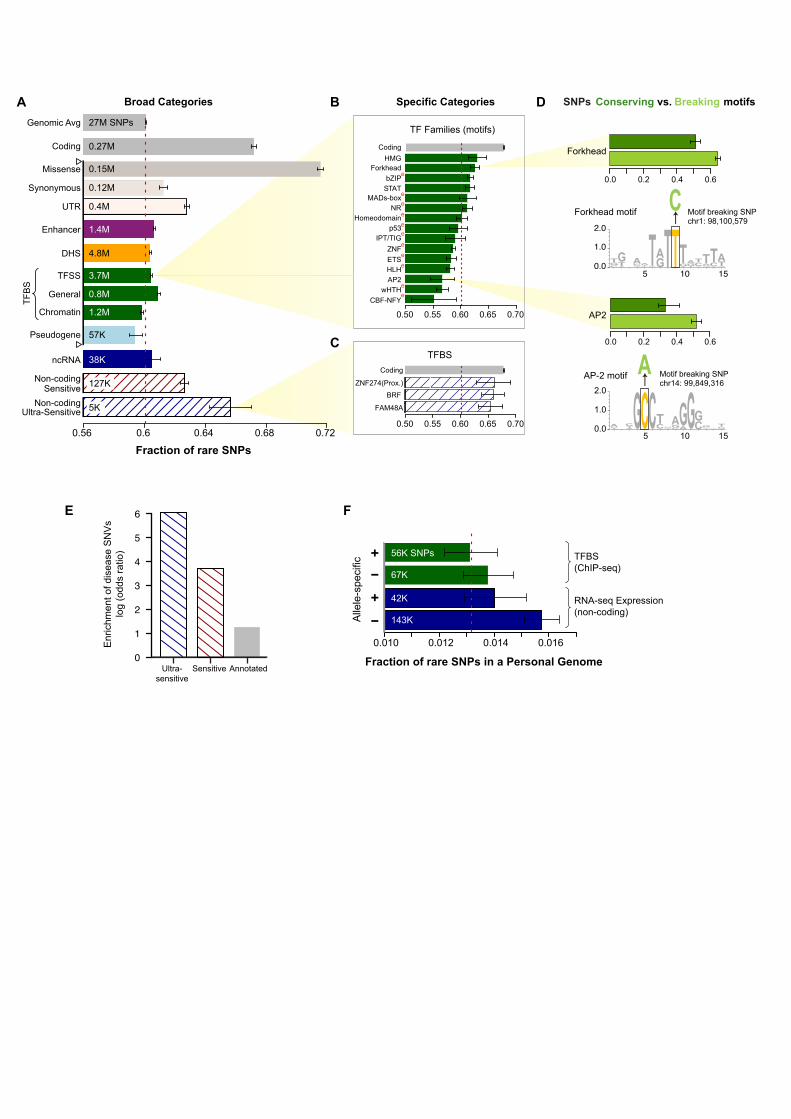
Figure legends Figure 1. Fraction of rare (DAF<0.5%) SNPs. (A) In various gene categories. Total number of SNPs in each category shown. (B) In non-coding DHSs and coding genes, which show tissue-specific behavior. Matching tissues for which both DHSs and gene expression data are available shown in same colors: shades of green for endodermal, grey for mesodermal and blue for ectodermal origin of tissues. Red dotted lines show the total fraction for all DHSs and coding genes, respectively. Asterisks show significant depletion or enrichment after multiple-hypothesis correction. Error bars in both (A) and (B) denote 95% binomial confidence intervals. Figure 2. Fraction of rare SNPs in non-coding categories. Red dotted line represents genomic average. Error bars denote 95% binomial confidence intervals. Total number of SNPs in each category shown. (A) Broad categories. “Ultra-sensitive” and “sensitive” regions are those under very strong negative selection. TFSS: Sequence-specific TFs. Categories tested for enrichment of HighD sites (Fig 5A) marked using hollow triangles on the left. (B) Example of high-resolution categories: TFBS motifs separated into 15 families. “e” (superscripts in red) denote enrichment of eQTLs in TFBSs of specific families. (C) Examples of TFBSs included in “ultra-sensitive” category. (D) SNPs breaking TF motifs show an excess of rare alleles compared to those conserving them. Representative motifs for two families are shown. (E) Enrichment of HGMD regulatory disease-causing mutations in ultra-sensitive, sensitive and annotated regions compared to all non-coding regions. (F) SNPs not exhibiting allele-specific behavior (-) are enriched in rare alleles compared to SNPs exhibiting allele-specific behavior (+). Figure 3. SNPs in protein-protein interaction (PPI) network. (A) Degree centrality of coding-gene categories in PPI network. (B) Fraction of rare missense SNPs at protein-interaction interfaces is higher than all rare missense SNPs (error bars show 95% binomial confidence intervals; total number of SNPs also shown) (C) Effects of SNVs at interaction interfaces on interactions of WASP with other proteins tested by Y2H experiments. Wild-type (WT) WASP interacts with all proteins shown, while each SNV disrupts its interaction with at least one protein. Figure 4. Functional annotations of indels and SVs. (A) Fraction of rare indels in coding-gene categories. Total number of indels shown. (B) Enrichment of SVs affecting functional annotations. Middle box shows genes, pseudogenes and TF motifs; upper blow-out shows gene parts in different modes; and bottom blow-out shows enhancers with different formation mechanisms, i.e. NAHR (non-allelic homologous recombination), NH (non-homologous), TEI (transposable element insertion) and VNTR (variable number of tandem repeats). Asterisks indicate significant enrichment (green) or depletion (red) after multiple hypothesis correction. SVs intersecting various functional categories in different modes (e.g. whole/partial) are shown in the right-hand-side schematics. (C) Aggregation of histone signal around breakpoints of deletions formed by different mechanisms. Breakpoints centered at zero. Aggregation for upstream/downstream regions corresponds to negative/positive distance. Signals for an activating histone mark (H3K4me1) and a repressive mark (H3K27me3) shown.
13
Figure 5. Functional implications of positive selection. (A) Left panel shows frequency of HighD SNPs vs. matched sites for broad categories (marked by hollow triangles in Fig 2A). Right panel shows specific categories, e.g. specific TF families. Asterisk denotes significant enrichment after multiple-hypothesis correction. “e” (superscripts in red) denote the enrichment of eQTLs. (B) Top-left panel shows that in-degree of genes with HighD missense SNPs is lower than that of all genes; bottom-left shows that in-degree of genes with HighD SNPs in their promoters is higher than all genes. Right panel shows the human regulatory network with edges in grey. Red nodes represent genes with HighD SNPs in their promoters and blue nodes represent genes with HighD missense SNPs. Size of nodes scaled based on their degree centrality. Nodes with higher centrality are bigger and tend to be in the center while those with lower centrality are smaller and tend to be on the periphery. Figure 6. Functional interpretation of disease variants. (A) Enrichment of functional mutations amongst somatic SNVs compared to germline ones. Mean values from seven prostate cancer samples shown (variation shown in Fig S16). (B) Ratios for the number of SNVs that conserve vs. break TF-binding motifs depicted for NA12878, average of 1000 Genomes Phase I samples, and the average of somatic and germline samples from different cancers. Error bars represent one standard deviation. MB: medulloblastoma. (C) Filtering of somatic variants from a breast (PD4006, left) and prostate (PR-2832, right) cancer sample leading to identification of candidate drivers. (D) A part of the FAM48A binding site sequenced by Sanger sequencing in an independent cohort of 19 prostate cancer samples shown in green (with the coordinates of mutations observed in one sample). (E) Application of variants filtering scheme to Venter personal genome. Number of SNVs in various categories shown. Supplementary Materials Details of all the materials and methods can be found in the Supplement. The Supplement is arranged in parallel to the main text and also includes details on the results. It includes Figures S1 to S29 and Tables S1 to S12. Datafiles S1 to S7 are provided separately. References: 1. B. Yngvadottir, D. G. Macarthur, H. Jin, C. Tyler-Smith, The promise and reality of
personal genomics. Genome Biol 10, 237 (2009). 2. I. Dunham et al., An integrated encyclopedia of DNA elements in the human genome.
Nature 489, 57 (2012). 3. M. T. Maurano et al., Systematic localization of common disease-associated variation in
regulatory DNA. Science 337, 1190 (2012). 4. L. D. Ward, M. Kellis, Interpreting noncoding genetic variation in complex traits and
human disease. Nat Biotechnol 30, 1095 (2012). 5. A. Visel et al., Targeted deletion of the 9p21 non-coding coronary artery disease risk
interval in mice. Nature 464, 409 (2010).
14
6. W. Lee, P. Yue, Z. Zhang, Analytical methods for inferring functional effects of single base pair substitutions in human cancers. Hum Genet 126, 481 (2009).
7. L. D. Ward, M. Kellis, Evidence of abundant purifying selection in humans for recently acquired regulatory functions. Science 337, 1675 (2012).
8. X. J. Mu, Z. J. Lu, Y. Kong, H. Y. Lam, M. B. Gerstein, Analysis of genomic variation in non-coding elements using population-scale sequencing data from the 1000 Genomes Project. Nucleic Acids Res 39, 7058 (2011).
9. B. Vernot et al., Personal and population genomics of human regulatory variation. Genome Res 22, 1689 (2012).
10. S. Horn et al., TERT promoter mutations in familial and sporadic melanoma. Science 339, 959 (2013).
11. F. W. Huang et al., Highly recurrent TERT promoter mutations in human melanoma. Science 339, 957 (2013).
12. P. J. Killela et al., TERT promoter mutations occur frequently in gliomas and a subset of tumors derived from cells with low rates of self-renewal. Proc Natl Acad Sci U S A 110, 6021 (2013).
13. C. G. A. R. Network, Integrated genomic analyses of ovarian carcinoma. Nature 474, 609 (2011).
14. C. G. A. Network, Comprehensive molecular characterization of human colon and rectal cancer. Nature 487, 330 (2012).
15. P. S. Hammerman et al., Comprehensive genomic characterization of squamous cell lung cancers. Nature 489, 519 (2012).
16. T. J. Hudson et al., International network of cancer genome projects. Nature 464, 993 (2010).
17. M. F. Berger et al., The genomic complexity of primary human prostate cancer. Nature 470, 214 (2011).
18. S. C. Baca et al., Punctuated evolution of prostate cancer genomes. Cell 153, 666 (2013). 19. S. Nik-Zainal et al., Mutational processes molding the genomes of 21 breast cancers. Cell
149, 979 (2012). 20. T. Rausch et al., Genome sequencing of pediatric medulloblastoma links catastrophic
DNA rearrangements with TP53 mutations. Cell 148, 59 (2012). 21. G. Bejerano et al., Ultraconserved elements in the human genome. Science 304, 1321
(2004). 22. R. E. Mills et al., Mapping copy number variation by population-scale genome
sequencing. Nature 470, 59 (2011). 23. R. Redon et al., Global variation in copy number in the human genome. Nature 444, 444
(2006). 24. G. R. Abecasis et al., An integrated map of genetic variation from 1,092 human genomes.
Nature 491, 56 (2012). 25. Z. D. Zhang, A. Frankish, T. Hunt, J. Harrow, M. Gerstein, Identification and analysis of
unitary pseudogenes: historic and contemporary gene losses in humans and other primates. Genome Biol 11, R26 (2010).
26. P. D. Stenson et al., The Human Gene Mutation Database: 2008 update. Genome Med 1, 13 (2009).
27. C. Solis, G. I. Aizencang, K. H. Astrin, D. F. Bishop, R. J. Desnick, Uroporphyrinogen III synthase erythroid promoter mutations in adjacent GATA1 and CP2 elements cause congenital erythropoietic porphyria. J Clin Invest 107, 753 (2001).
28. P. Hermanns et al., Consequences of mutations in the non-coding RMRP RNA in cartilage-hair hypoplasia. Hum Mol Genet 14, 3723 (2005).
29. M. B. Gerstein et al., Architecture of the human regulatory network derived from ENCODE data. Nature 489, 91 (2012).

15
30. H. B. Fraser, A. E. Hirsh, L. M. Steinmetz, C. Scharfe, M. W. Feldman, Evolutionary rate in the protein interaction network. Science 296, 750 (2002).
31. E. Khurana, Y. Fu, J. Chen, M. Gerstein, Interpretation of genomic variants using a unified biological network approach. PLoS Comput Biol 9, e1002886 (2013).
32. X. Wang et al., Three-dimensional reconstruction of protein networks provides insight into human genetic disease. Nat Biotechnol 30, 159 (2012).
33. P. C. Sabeti et al., Positive natural selection in the human lineage. Science 312, 1614 (2006).
34. J. Ohashi et al., Extended linkage disequilibrium surrounding the hemoglobin E variant due to malarial selection. Am J Hum Genet 74, 1198 (2004).
35. M. T. Hamblin, A. Di Rienzo, Detection of the signature of natural selection in humans: evidence from the Duffy blood group locus. Am J Hum Genet 66, 1669 (2000).
36. L. B. Barreiro, G. Laval, H. Quach, E. Patin, L. Quintana-Murci, Natural selection has driven population differentiation in modern humans. Nat Genet 40, 340 (2008).
37. Y. Xue et al., Population differentiation as an indicator of recent positive selection in humans: an empirical evaluation. Genetics 183, 1065 (2009).
38. R. D. Hernandez et al., Classic selective sweeps were rare in recent human evolution. Science 331, 920 (2011).
39. S. R. Grossman et al., Identifying recent adaptations in large-scale genomic data. Cell 152, 703 (2013).
40. M. Akiyama et al., Mutations in lipid transporter ABCA12 in harlequin ichthyosis and functional recovery by corrective gene transfer. J Clin Invest 115, 1777 (2005).
41. P. M. Kim, J. O. Korbel, M. B. Gerstein, Positive selection at the protein network periphery: evaluation in terms of structural constraints and cellular context. Proc Natl Acad Sci U S A 104, 20274 (2007).
42. R. Haygood, O. Fedrigo, B. Hanson, K. D. Yokoyama, G. A. Wray, Promoter regions of many neural- and nutrition-related genes have experienced positive selection during human evolution. Nat Genet 39, 1140 (2007).
43. S. B. Carroll, Evo-devo and an expanding evolutionary synthesis: a genetic theory of morphological evolution. Cell 134, 25 (2008).
44. K. Y. Yip et al., Classification of human genomic regions based on experimentally determined binding sites of more than 100 transcription-related factors. Genome Biol 13, R48 (2012).
45. C. E. Barbieri et al., Exome sequencing identifies recurrent SPOP, FOXA1 and MED12 mutations in prostate cancer. Nat Genet 44, 685 (2012).
46. G. P. Consortium, A map of human genome variation from population-scale sequencing. Nature 467, 1061 (2010).
47. R. Chen et al., Personal omics profiling reveals dynamic molecular and medical phenotypes. Cell 148, 1293 (2012).
48. S. Levy et al., The diploid genome sequence of an individual human. PLoS Biol 5, e254 (2007).
0.55
0.60
0.65
0.70
0.4
0.5
0.6
0.7
0.8
0.9
AFr
actio
n of
rare
SN
Ps
(non
syn)
All
Cod
ing
LoF-
tol.
Rec
essi
ve
GW
AS
Dom
inan
t
Ess
entia
l
Can
cer
B
Frac
tion
of ra
re S
NP
s
DHS Coding
Bon
e
Uro
thel
ium
Em
br s
tem
cel
lB
reas
t
Blo
odP
ancr
duc
tP
ancr
eas
Ski
nE
yeLi
ver
Mus
cle
Blo
od v
esse
lH
eart
Lung
Bla
stul
aM
yom
etriu
mE
pith
eliu
mP
rost
ate
Bra
inE
mbr
lung
Gin
giva
lK
idne
yS
pina
l cor
dFo
resk
inC
onne
ctiv
eA
dipo
seLi
ver
Cer
vix
Trac
hea
Spl
een
Pro
stat
eE
soph
agus
Lung
Test
isP
lace
nta
Bla
dder
Col
onH
eart
Thyr
oid
Thym
usK
idne
yB
rain
Ova
ry
* ***********
** ***
***
169K
SN
Ps
2.6K
9.2K
40K
6.2K
3.5K
4.6K
0.56 0.6 0.64 0.68 0.72C GC0.0
1.0
2.0
GTCA
C ATCG
5C
G
TTCG
CGA
10AGC
GTCG
GCA
15AGCT
0.0 0.2 0.4 0.6
CodingHMG
ForkheadbZIP
e
STATMADs-box
NR ee
Homeodomain e
p53 e
IPT/TIG e
ZNF e
ETS e
HLH e
AP2wHTH e
CBF-NFY e
Coding
ZNF274(Prox.)
BRF
FAM48A
TF Families (motifs)
TFBS
A
Fraction of rare SNPs
Broad Categories Specific Categories
E
Coding
Genomic Avg
Enhancer
ncRNA
DHS
TFB
S
Pseudogene
Non-codingSensitive
Non-codingUltra-Sensitive
TFSS
General
Chromatin
B
C
D
0.0 0.2 0.4 0.6
SNPs Breaking vs. Conserving motifs
AP2
Forkhead
A
C
AP-2 motif Motif breaking SNPchr14: 99,849,316
T0.0
1.0
2.0
CGT
ATG
TGCA
5G
CTA
CTG
ATT10AG
TGA
G
ACT
CGAT
ACT
15GTA
Forkhead motif Motif breaking SNPchr1: 98,100,579
−+−+
Fraction of rare SNPs in a Personal Genome
0.010 0.012 0.014 0.016
TFBS(ChIP-seq)
RNA-seq Expression(non-coding)
Alle
le-s
peci
fic
F
0.50 0.55 0.60 0.65 0.70
0.50 0.55 0.60 0.65 0.70
38K
1.4M
56K SNPs
67K
42K
143K
127K
57K
3.7M
0.8M
1.2M
Enr
ichm
ent o
f dis
ease
SN
Vs
l
og (o
dds
ratio
)
Ultra-sensitive
Sensitive Annotated0
1
2
3
4
5
6
Missense
Synonymous
UTR
0.15M
0.12M
0.4M
0.27M
27M SNPs
4.8M
5K
All
codi
ng
LoF-
tol.
Rec
essi
ve
GW
AS
Dom
inan
t
Ess
entia
l
Can
cer
Deg
ree
cent
ralit
y in
pro
tein
inte
ract
ion
netw
ork
110
100
1000
Gene categories
0.0
0.2
0.4
0.6
0.8
1.0
Frac
tion
of ra
re S
NPs
(mis
sens
e)
Interactioninterface
All
A B
WASPWASP
WT-
WA
SP
I294
T
R41
G
E13
1K
CDC42
WIPF1
TRIP10
ABI3
APP8P2
NCK2
InsidePBD
domain
InsideWH1
domain
Pro
tein
s in
tera
ctin
g w
ith W
AS
P
C
4.6K
SN
Ps
276K

All
codi
ng
LoF-
tol.
Rec
essi
ve
GW
AS
Dom
inan
t
Ess
entia
l
Can
cer
Frac
tion
of ra
re in
dels
0.4
0.5
0.6
0.7
0.8
0.9
1.0
A
B
C
Distance from breakpoints, Mbp-4 -3 -2 -1 0 4
Nor
mal
ized
agg
rega
tion
sign
al
0.5
0.6
0.7
0.8
0.9
1
1.1
1.2
1.3
1.4
1.5
1 2 3
H3K4me1H3K27me3
NAHR NH TEI
−80 0 40 80
all
CDS5’UTR only3’UTR onlyintron only
all TF motifs
enhancerNAHRVNTR
NHTEI
pseudogene
-40% Enrichment
OR
SV
*
***
*
*
**
5383003085861
60825192098
whole * 90partial * 5992
1989
39934
# SVs
chromosome
inter-sectingelem.
Mechanism
gene
267
7,00
4 in
dels
268
1,23
6
175
103
142

0 1 2 3 4
0 1 2 3 4
Missense
Synonymous
Enhancer
UTR
DHS
TFB
S
Pseudogene
Frequency of High D SNPs / Matched Background
TFS
S F
amili
es (T
FBS
)
NRe
p53e
ZNFe
Homeodomaine
wHTHe
bZIPe
HLHe
MADs-boxe
STAT
IPT/TIGe
ETSe
*
*
*
*
*
*
*
110
100
110
100
In-d
egre
e of
gen
es in
regu
lato
ry n
etw
ork
Genes containing missense SNPs
HighD All
Gene promoters containing SNPs
HighD All
A
B
TFSS
General
Chromatin
DH
STF
BS Distal
Proximal
Distal
Proximal9 HD SNPs
2
21
14
177
124
33
1
54
8
8
7
22
10
78
10
13
35
27
6
11
7
13
25
0.00.2
0.40.6
0.81.0
Rat
io o
f mot
if-co
nser
ving
/ br
eaki
ng S
NV
s
A
Ultr
a-se
nsiti
ve /
Non
codi
ng
Mis
sens
e / S
ynon
ymou
s
Ratio of SNVs in different categories0
12
34
LoF
/ Cod
ing
0.00
0.02
0.04
0.06
0.08
Sens
itive
/ N
onco
ding
0.00
00.
005
0.01
00.
015
0.02
0
0.00
00.
001
0.00
20.
003
0.00
4
germline prostatesomatic prostate
B
C
Found in 1000 Genomes ?
8961
Annotated ?
Coding ?
Nonsynonymous ?
86
72
14
In sensitive region ?
LoF ?
1 25
29 1850
1879
In ultra-sensitive region ?
1 28
191831
Breaks TF motif ?
YN
YN
Y N
YN
YN
Y
Unlikely to be driver
N
1 0
Breaks TF motif ?
YN
Recurrent ?
1 0
YN
Gene is a hub ?
5
YN
E
Target gene known ?
1 0
YN
YN
Target gene is a hub ?
0 1
YN
Gene under strong selection ?
26
YN
20
46
6996
233
YN
Target gene known ?
4 15
YN
YN
Target gene is a hub ?
0 4
1829 somatic SNVs
123
Found in 1000 Genomes ?
1706
Nonsynonymous ?
10
7
3
In sensitive region ?
390
LoF ?
2
11 379
In ultra-sensitive region ?
3 8 2 377
Breaks TF motif ?
YN
YN
YN
YN
YN
YNY
Unlikely to be driver
N
Target gene known ?
1 1 2
YN
Recurrent ?
Target gene known ?
1
YN
YN
Target gene is a hub ?
1
..ACGGT....TC[C/T]CC....GT[G/A]GA....ATAGA..
chr11:62,609,084
62,609,138
Annotated ?
Coding ?
YN
Gene under strong selection ?
5
YN
2
1306
Recurrent ?
YN
Target gene is a hub ?
1 0 0
3
chr11:
Candidate drivers
Gene is a hub?
0
YN
3
9194 somatic SNVs Breast cancer
Prostate cancer
1965 400
1 0
YN
1 0
YN
Sanger sequencing of FAM48A binding site (~570 bp)
in WDR74 promoter from 19 additional samples
Network HubMotif Breaking
VenterPersonal Genome
451
05
673
15
584 21
140140
640
D
V.Recurrence
a. Sensitive
IV. Network
connectivity
II. Functionalannotation
Regulatory
Coding
I. 1000 Genomes
Screen
III.
NA12878 1000Genomes
Prostate MBProstateMB Breast
Germline Somatic
Healthy individuals Cancer patients
b. Disruptive