genomic and proteomic characterisation of … · preface vi dan timp1 yang berekspresi lebih...
TRANSCRIPT

GENOMIC AND PROTEOMIC CHARACTERISATION OF PRIMARY
COLORECTAL TUMOURS IN THE MALAYSIAN POPULATION
LAU TZE PHENG
THESIS SUBMITTED IN FULFILMENT OF THE REQUIREMENT
FOR THE DEGREE OF DOCTOR OF PHILOSOPHY
FACULTY OF MEDICINE
UNIVERSITY OF MALAYA
KUALA LUMPUR
2014

Preface
iii
ABSTRACT
Colorectal cancer (CRC) is a multifactorial disease whereby gene-gene and gene-
environment interactions contribute to its development and progression. It is also
polygenic in nature, hence a large number of genetic alterations, each conferring a small
genotypic risk, determine the individual’s susceptibility to this disease. Therefore, it is
of clinical importance to identify potential CRC susceptibility gene candidates for
improvement of future CRC screening and surveillance. This can be achieved by
screening low-penetrant genetic variants via case-control studies across populations
worldwide. Here, we investigated the association between several genetic variants and
CRC susceptibility, i.e., the NOD2, XRCC1, EGF and VEGF genes, as well as the top-
ranked GWAS-identified CRC-associated common variants. The genotyping of these
genetic variants was performed via Real-Time PCR with TaqMan chemistry.
Rs4939827 was the only common variant associated with CRC susceptibility with
regards to our local population. We also attempted to characterise the CRC tumour-
specific mRNA and proteomic profiles in our samples as both mRNA and protein
expression patterns are more dynamic compared to the genetic codes. Hence, to
investigate the differential gene expression in the primary CRC tumours, we used a two-
step ACP-based PCR approach which was then followed by a confirmatory test with
RT-qPCR. We successfully characterised distinctive gene expression signatures for
both early- and advanced stage CRC tumours. The under-expression of ARPC2,
together with the over-expression of RPL35, RPS23 and TIMP1, are the main features
of early stage CRC tumours. In contrast, the advanced stage CRC group is
characterised by the over-expression of C6orf173, RPL35, RPS23 and TIMP1. After
performing comparison protein expression analysis using a combination of 2-D DIGE
and LC-MS/MS platform, we identified 10 significantly over-expressed and 6
significantly under-expressed proteins in the Stage II CRC neoplasms, but none was

Preface
iv
reported for either Stage III or IV CRC tumours. For decades, CRC has been a constant
threat to the well-being of the human population notwithstanding the fact that it can be
treated if detected at an early stage. With the latest advances in the therapeutic
management of metastatic CRC through the screening for KRAS mutation, we hope our
findings may complement current CRC management efforts in the search of potential
molecular markers for diagnostic, prognostic and treatment response predictive
purposes.

Preface
v
ABSTRAK
Kanser kolorektal adalah penyakit multifaktorial di mana interaksi antara gen-gen dan
gen-persekitaran boleh menyumbang kepada perkembangannya. Di samping itu, ia juga
bersifat ‘poligenik’ di mana sebilangan besar perubahan dalam genetik dengan setiap
satunya membawa risiko yang kecil akan menentukan kecenderungan seseorang
individu untuk mendapat penyakit ini. Oleh itu, adalah penting untuk mengenal pasti
calon-calon gen yang berisiko bagi meningkatkan pemeriksaan dan pengawasan kanser
kolorektal pada masa depan. Tujuan ini dapat dicapai dengan menyaring pelbagai
polimorfisme genetik yang mempunyai penembusan rendah dalam populasi melalui
kajian kes-kawalan. Dalam penyelidikan ini, kami telah menyiasat hubungan antara
beberapa polimorfisme genetik dan kecenderungan untuk mendapat kanser kolorektal.
Antaranya ialah gen-gen NOD2, XRCC1, EGF dan VEGF, serta polimorfisme genetik
yang telah dikenal pasti berkaitan dengan kanser kolorektal melalui kajian GWAS.
Penyaringan genetik ini telah dijalankan dengan menggunakan teknik “Real-Time PCR”
yang berunsur “TaqMan”. Kami mendapati bahawa hanya polimorfisme genetik
rs4939827 yang berkaitan dengan kecenderungan untuk mendapat kanser kolorektal
dalam populasi tempatan. Selain itu, kami juga berusaha untuk menyiasat dan
mewujudkan profil-profil transkriptomik dan proteomik bagi tumor kolorektal. Ini
adalah kerana corak ekspresi mRNA dan protein adalah lebih dinamik jika berbanding
dengan kod-kod genetik. Oleh yang demikian, kami menyiasat gen-gen yang
mempunyai ekspresi mRNA yang berbeza dalam tumor kolorektal dengan
menggunakan pendekatan PCR yang berasaskan ACP. Seterusnya, ujian pengesahan
dengan menggunakan teknik RT-qPCR juga dilaksanakan. Kami telah berjaya
memperolehi dua siri gen-gen yang merupakan tandatangan tersendiri bagi kedua-dua
tumor kolorektal peringkat awal dan lewat. Tumor kolorektal peringkat awal
mempunyai gen ARPC2 yang berekspresi lebih rendah, serta gen-gen RPL35, RPS23

Preface
vi
dan TIMP1 yang berekspresi lebih tinggi. Manakala ciri-ciri utama bagi tumor
kolorektal yang berperingkat lewat adalah gen-gen C6orf173, RPL35, RPS23 dan
TIMP1 yang berekspresi lebih tinggi. Selepas melaksanakan analisis corak ekspresi
protein dengan menggabungkan teknik-teknik 2-D DIGE dan LC-MS/MS, kami telah
mengenal pasti 10 protein yang berekspresi lebih tinggi dan 6 protein yang berekspresi
lebih rendah bagi tumor kolorektal peringkat ke-dua sahaja. Selama ini, kanser
kolorektal telah menjadi ancaman kepada kesihatan manusia walaupun pada hakikatnya,
penyakit ini dapat dirawat jika dikesan pada peringkat awal. Dengan kemajuan terkini
yang melibatkan penyaringan mutasi KRAS dalam pengurusan rawatan bagi tumor
kolorektal yang bersifat metastatik, kami berharap agar penemuan kami dapat
melengkapkan usaha-usaha dunia dalam memperolehi penanda molekul yang berpotensi
untuk memajukan diagnostik dan rawatan bagi kanser kolorektal.

Preface
vii
Acknowledgements
First and foremost, I would like to express my deepest gratitude to my supervisors,
Professor Chua Kek Heng (Department of Biomedical Science) and Dr. Lian Lay
Hoong (Department of Molecular Medicine), for their immense knowledge, insightful
comments and valuable experiences. Their continuous guidance and encouragement
have supported me throughout the time of my PhD research and thesis writing.
I would also like to express my appreciation to Professor Dr. April Camilla Roslani
(Senior Consultant Colorectal Surgeon, Department of Surgery) and Associate
Professor Dr. Ida Normiha binti Hilmi (Division of Gastroenterology and Hepatology,
Department of Medicine), for their professional clinical advices and diligence in
specimen collection. Their expertise and experiences have grounded the clinical aspects
of my PhD research.
Besides my supervisors and collaborators, I would also like to share the credit of my
current work with my colleagues for their support and motivation. We have gone
through thick and thin, sharing both laughter and tears over the past 5 years of my
research life.
I am also indebted to my parents who have showered me with unconditional love and
support in my choice to pursue a PhD degree. I also owed a word of thanks to my
siblings and Mr. Ooi Keat Soon for their encouragement and tolerance throughout those
stressful moments.
Last but not least, I would also like to acknowledge the contributions of colorectal
cancer surgeons in the Department of Surgery, lecturers and staffs of the Department of
Biomedical Science and Department of Molecular Medicine, as well as the research
funding granted by the University of Malaya.

Preface
viii
Table of Contents
Content Page
Number
CHAPTER 1 – INTRODUCTION 1 – 5
CHAPTER 2 – LITERATURE REVIEW
2.1 A Glimpse of Cancer
7 – 10
2.2 Colorectal Cancer (CRC): Facts and Figures
2.2.1 Colon and Rectum Anatomy
2.2.2 Definition
2.2.3 Incidence and Mortality
2.2.4 Clinical Manifestations
2.2.5 Histological Variants of Colorectal Carcinoma
2.2.6 Oncogenesis: The Classical Adenoma-Carcinoma Sequence
2.2.7 Risk Factors
2.2.8 Tumour Grading and Cancer Staging
2.2.9 Screening
11
11 – 12
13
13 – 17
18
19 – 20
21 – 23
23 – 26
26 – 30
31 – 33
2.3 Research Background
2.3.1 Part A: SNPs Genotyping via Allelic Discrimination Assays
2.3.2 Part B: Differential Transcriptome Analysis; and
Part C: Differentail Proteome Analysis via A Bottom-Up
Proteomics Approach
34
34 – 42
43 – 49
2.4 Objectives of Study
2.4.1 Part A: SNPs Genotyping via Allelic Discrimination Assays
2.4.2 Part B: Differential Transcriptome Analysis
2.4.3 Part C: Differentail Proteome Analysis via A Bottom-Up
Proteomics Approach
50
50
50
51
CHAPTER 3 – METHODOLOGY
3.1 Part A: SNPs Genotyping via Allelic Discrimination Assays
3.1.1 Materials
3.1.1.1 Commercialised Reagents, Instruments and Softwares
3.1.1.2 Miscellaneous Materials
3.1.2 Methods
3.1.2.1 Sample Recruiting Criteria
3.1.2.2 Blood Specimen Collection
54
54
54
55 – 56
57
57
57

Preface
ix
Content Page
Number
3.1.2.3 Genomic DNA Isolation
3.1.2.3(a) Phenol-Chloroform DNA Extraction
3.1.2.3(b) DNA Concentration and Purity Assessment
3.1.2.4 Genotyping viaTaqMan 5’ Nuclease Assays
3.1.2.4(a) qPCR
3.1.2.4(b) Genotyping Data Analysis
3.1.2.5 Statistical Analysis
58
58 – 59
59 – 60
60
60 – 63
63
64
3.2 Part B: Differential Transcriptome Analysis
3.2.1 Materials
3.2.1.1 Commercialised Reagents and Kits
3.2.1.2 Instruments and Services
3.2.1.3 Softwares
3.2.1.4 Miscellaneous Materials
65
65
65 – 66
67
67
68
3.2.2 Methods
3.2.2.1 Patient Characteristics
3.2.2.2 Tissue Specimen Collection
3.2.2.3 Total RNA Isolation
3.2.2.3(a) RNA Extraction
3.2.2.3(b) RNA Concentration and Integrity Assessment
3.2.2.3(b)(i) Set Up of Chip Priming Station and
Bioanalyzer
3.2.2.3(b)(ii) Preparation of Gel and Gel-Dye Mix
3.2.2.3(b)(iii) Loading of RNA 6000 Nano Chip
3.2.2.4 DEGs Identification
3.2.2.4(a) First-strand Complementary DNA (cDNA)
Synthesis
3.2.2.4(b) ACP-based GeneFishing PCR
3.2.2.4(c) Gel Extraction
3.2.2.4(d) Molecular Cloning Strategy
3.2.2.4(e) Plasmid Preparation
3.2.2.4(f) Automated DNA Sequencing
69
69
69 – 70
70
70 – 71
71
71 – 72
72
72
73
73
74 – 75
76
77 – 78
79
80 – 81

Preface
x
Content Page
Number
3.2.2.4(g) Pairwise Alignment and Sequence Similarity
Matching
3.2.2.5 Confirmatory Test
3.2.2.5(a) Reverse Transcription
3.2.2.5(b) RT-qPCR
3.2.2.5(b)(i) Synthesis of Primers and TaqMan Probes
3.2.2.5(b)(ii) Determination of Amplification
Efficiency of TaqMan Gene Expression
Assays
3.2.2.5(b)(iii) ΔΔCT Experiment
3.2.2.5(b)(iv) Data Interpretation and Statistical
Analysis
82
82
82
83
83 – 86
87 – 89
90 – 92
92 – 93
3.3 Part C: Differential Proteome Analysis via A Bottom-Up
Proteomics Approach
3.3.1 Materials
3.3.1.1 Commercialised Chemicals, Reagents and Kits
3.3.1.2 Consumables and Equipments
3.3.1.3 Software and Service
3.3.1.4 Miscellaneous Materials
3.3.2 Methods
3.3.2.1 Patient Characteristics
3.3.2.2 Tissue Specimen Collection
3.3.2.3 Total Protein Isolation
3.3.2.3(a) Protein Extraction
3.3.2.3(b) Protein Quantification
3.3.2.4 Total Protein Separation via 2-D DIGE
3.3.2.4(a) Sample Randomisation and Experimental Set Up
3.3.2.4(b) Sample Preparation
3.3.2.4(b)(i) Clean-Up of Protein Samples
3.3.2.4(b)(ii) pH Adjustment of Protein Samples
94
94
94 – 95
96
96
97 – 99
100
100
100
101
101
102 – 103
103
103 – 106
107
107 – 108
108

Preface
xi
Content Page
Number
3.3.2.4(c) CyDye DIGE Fluor Minimal Dye Labeling
3.3.2.4(c)(i) Preparation of CyDye DIGE Fluor Dyes
3.3.2.4(c)(ii) Minimal Labeling of Protein Samples
3.3.2.4(d) First-Dimension IEF
3.3.2.4(d)(i) Rehydration of Immobiline DryStrip Gels
and Samples Application via Rehydration
Loading Protocol
3.3.2.4(d)(ii) IEF of Protein Samples
3.3.2.4(e) Second-Dimension Sodium Dodecyl Sulfate
(SDS)-Polyacrylamide Gel Electrophoresis
(PAGE)
3.3.2.4(e)(i) Preparation of Glass Sandwich
3.3.2.4(e)(ii) Preparation of SDS-Denaturing
Polyacrylamide Resolving Gel
3.3.2.4(e)(iii) Equilibration and Loading of Focused
Immobiline DryStrip Gels
3.3.2.4(e)(iv) Assembly of Electrophoretic Unit and
Eletrophoretic Run
3.3.2.4(f) Acquisition of Gel Images
3.3.2.4(g) Mass Spectrometry (MS)-Compatible Silver
Staining
3.3.2.4(h) Image and Data Analysis
3.3.2.4(h)(i) Image Loader Module
3.3.2.4(h)(ii) DIA Module
3.3.2.4(h)(iii) BVA Module
3.3.2.5 Protein Identification via Liquid Chromatography-
Tandem Mass Spectrometry (LC-MS/MS)
3.3.2.5(a) Mass spectrometry (MS)
3.3.2.5(a)(i) De-staining Step
3.3.2.5(a)(ii) Trypsin Digestion and Peptide Extraction
3.3.2.5(a)(iii) LC-MS/MS
108 – 109
109
109
110
110
110 – 111
111
112
112
113
114
114 – 115
116
116 – 117
117
117
118
118
119
119
119 – 120
120

Preface
xii
Content Page
Number
3.3.2.5(b) Peptide Matching and Database Searching 120
CHAPTER 4 – RESULTS
4.1 Part A: SNPs Genotyping via Allelic Discrimination Assays
4.1.1 Genotyping of the NOD2/CARD15 Variants
4.1.2 Genotyping of the Common GWAS-identified CRC-
associated Variants
4.1.3 Genotyping of the Low-penetrance Genes
4.1.3.1 XRCC1 Variants
4.1.3.2 EGF +61 A>G (rs4444903)
4.1.3.3 VEGF +936 C>T (rs3025039)
122
122 – 130
131 – 139
140
140 – 146
147 – 149
150 – 152
4.2 Part B: Differential Transcriptome Analysis
4.2.1 RNA Concentration and Integrity Assessment
4.2.2 DEGs Identification
4.2.2.1 Characterisation of Differential Banding Patterns
4.2.2.2 Sequence Similarity Matching and Identification of
DEGs
4.2.3 Confirmatory Test
4.2.3.1 Assessment of Amplification Efficiency via CT Slope
Method
4.2.3.2 Relative Quantification of DEGs Expression via
Comparative Ct (ΔΔCT) Experiment
4.2.3.2(a) Computation of ΔCT, ΔΔCT and TCΔΔ-2 values
4.2.3.2(b) Determination of Statistical Significance of the
Observed Differential Expression Patterns
153
153 – 154
155
155 – 156
157 – 160
161
161
162
162 – 164
165 – 174
4.3 Part C: Differential Proteome Analysis via A Bottom-Up
Proteomics Approach
4.3.1 Total Protein Separation via 2-D DIGE
4.3.2 Protein Identification via LC-MS/MS
175
175 – 185
186 – 188

Preface
xiii
Content Page
Number
CHAPTER 5 – DISCUSSION
5.1 Part A: SNPs Genotyping via Allelic Discrimination Assays
5.1.1 Genotyping of the NOD2/CARD15 Variants
5.1.2 Genotyping of the Common GWAS-identified CRC-
associated Variants
5.1.3 Genotyping of the Low-penetrance Genes
5.1.3.1 XRCC1 Variants
5.1.3.2 EGF +61 A>G (rs4444903)
5.1.3.3 VEGF +936 C>T (rs3025039)
190
191 – 197
198 – 202
203
203 – 207
207 – 210
210 – 216
5.2 Part B: Differential Transcriptome Analysis
5.2.1 RPL35 and RPS23
5.2.2 TIMP1
5.2.3 ARPC2
5.2.4 C6orf173
217
217 – 220
221 – 223
223 – 225
225 – 228
5.3 Part C: Differential Proteome Analysis via A Bottom-Up
Proteomics Approach
5.3.1 60 kDa Heat shock protein (Hsp60)
5.3.2 Nucleophosmin (B23)
5.3.3 Stathmin (SMN)
5.3.4 S100 calcium-binding protein A9 (S100A9)
229 – 236
236 – 238
238 – 239
239 – 240
240 – 242
CHAPTER 6 – CONCLUSION & RECOMMENDATION
6.1 Part A: SNPs Genotyping via Allelic Discrimination Assays
6.2 Part B: Differential Transcriptome Analysis
6.3 Part C: Differential Proteome Analysis via A Bottom-Up
Proteomics Approach
244 – 245
245 – 246
247 – 248
References 249 – 297
List of Publications and Papers Presented 298
Appendices 299 – 301

Preface
xiv
List of Figures
Title of Figure Page
Number
Figure 2.1 Global cancer incidences in both men and women
(year 2008).
7
Figure 2.2 Global cancer mortality in both men and women
(year 2008).
8
Figure 2.3 Anatomical structure of the human large bowel. 11
Figure 2.4a Estimated age-standardised CRC incidence rates
among men for 2008.
15
Figure 2.4b Estimated age-standardised CRC incidence rates
among women for 2008.
15
Figure 2.5a Age-standardised incidence and mortality rates of
malignant diseases among Malaysian men in 2008.
17
Figure 2.5b Age-standardised incidence and mortality rates of
malignant diseases among Malaysian women in
2008.
17
Figure 2.6 Microscopic appearance of colorectal
adenocarcinoma.
19
Figure 2.7 Histological appearance of mucinous (a), signet-ring
cell (b) and medullary adenocarcinoma (c).
20
Figure 2.8 Histology of ‘mixed’ CRC tumour. 22
Figure 2.9 TNM staging of CRC primary tumours based on the
degree of bowel wall infiltration, as well as the
involvement of regional lymph nodes and distant
organs.
28
Figure 2.10 The Vogelstein model of adenoma-carcinoma
sequence, as well as genomic instability pathways
involved in CRC tumourigenesis.
37
Figure 2.11 Relevant functions of potential low-penetrance
susceptibility genes pertaining to CRC
carcinogenesis.
41

Preface
xv
Title of Figure Page
Number
Figure 2.12 Potential clinical applications of molecular profiling
in the management and surveillance of CRC patients.
45
Figure 4.1 Allelic discrimination plots for genetic distribution
of the NOD2/CARD15 variants.
123 – 127
Figure 4.2 Allelic discrimination plots for genetic distribution of
the common GWAS-identified CRC-associated
variants.
132 – 136
Figure 4.3 Allelic discrimination plots for genetic distribution
of the XRCC1 variants.
141 – 143
Figure 4.4 Allelic discrimination plots for genetic distribution of
the EGF +61 A>G polymorphism.
148
Figure 4.5 Allelic discrimination plots for genetic distribution of
the VEGF +936 C>T polymorphism.
151
Figure 4.6 Electropherogram obtained from the Agilent 2100
Expert software. The X-axis represents the time in
sec [s], while Y-axis, the fluorescence unit [FU].
154
Figure 4.7 Differential banding patterns on 3 % (w/v) ethidium
bromide-stained agarose gels. Lane N represents the
normal colonic mucosa, while lane C, the CRC
tumour.
156
Figure 4.8 Standard curve of the RPL10 gene expression assay. 161
Figure 4.9 Computed ΔCT, ΔΔCT and TCΔΔ-2 values for Paired
Sample T19 (N) and (C).
163
Figure 4.10 Bar chart showing the relative expression of all
DEGs for Paired Sample T19 (N) and (C).
164
Figure 4.11 Bar charts showing statistically significant and non-
significant DEGs in early- and advanced stage CRC
groups. The X-axis represents the DEG, while Y-
axis, the log10 RQ.
168 – 169

Preface
xvi
Title of Figure Page
Number
Figure 4.12 Bar charts showing statistically significant and non-
significant DEGs in right- and left-sided CRC
tumours. The X-axis represents the DEG, while Y-
axis, the log10 RQ.
173 – 174
Figure 4.13 Representative CyDye images of gel scanned at a
100 μm resolution. The images of the protein sample
labelled with Cy2, Cy3 and Cy5 are represented by
(a), (b) and (c), respectively.
176
Figure 4.14 Representative of 2-D DIGE spot map images of
CRC tumour and paired normal colonic mucosa
samples in each CRC Stage group (From left to right:
pI 4 – 7).
178
Figure 4.15 Protein abundance for Spot No. 547 in 10 Stage II
primary CRC tumours and their corresponding paired
normal colonic mucosa samples (Spot No. refers to
the number assigned in Figure 4.16).
179
Figure 4.16 Representative of gel images for Cy2-labelled
internal control in Stage II CRC Group (a), and its
corresponding post-silver-stained gel image
indicating the protein spots of interest excised for
LC-MS/MS analysis (b).
183
Figure 4.17 3-D view for Spot. No. 547 (magenta-coloured)
[Spot No. refers to the number assigned in Figure
4.16].
184
Figure 4.18 Histogram showing Ions Score distribution for
peptide matches.
186
Figure 5.1 The role of activated NF-κB in tumour growth and
progression.
192
Figure 5.2 Molecular targets of the activated NF-κB and their
roles in carcinogenesis.
193

Preface
xvii
Title of Figure Page
Number
Figure 5.3 The recognisation of the MDP by NOD2 protein and
downstream activation of the NF-κB in innate
immunity.
195
Figure 5.4 TGF-β signaling pathway and antagonistic role of
SMAD7.
201
Figure 5.5 Role of XRCC1 in the BER pathway.
205
Figure 5.6 EGF/EGFR signaling cascade and its roles in
oncogenesis.
208
Figure 5.7 VEGF signaling pathway. 212
Figure 5.8 Autocrine and paracrine stimulation of VEGF on
tumour angiogenesis.
213
Figure 5.9 Examples of anti-angiogenic agent in cancer therapy. 214

Preface
xviii
List of Tables
Title of Table Page
Number
Table 2.1 The 7th
edition of AJCC TNM Staging System for
CRC tumours, in comparison to the Dukes’
Classification System.
29
Table 3.1 Assays ID, PCR primers and TaqMan MGB probes
sequences used for the genotyping of 15 SNPs.
61
Table 3.2 Constituents of TaqMan SNP Genotyping Assay. 62
Table 3.3 Universal thermal cycling protocol for fast
genotyping on Applied Biosystems 7500 Fast Real-
Time PCR System.
63
Table 3.4 PCR reaction components for fast genotyping. 63
Table 3.5 Arbitrary ACP1 – 20, dT-ACP1 and dT-ACP2
primers in GeneFishing DEG 101 & 102 Premix Kit.
74
Table 3.6 Thermal cycling conditions for the two-steps ACP-
based PCR amplification.
75
Table 3.7 Reaction components for PCR screening of positive
transformants.
78
Table 3.8 Thermal cycling conditions for PCR screening of
successfully transformed clones.
78
Table 3.9 Thermal cycling conditions for BigDye Terminators
v3.1 Cycle Sequencing Kit.
81
Table 3.10 Reaction components for cycle sequencing. 81
Table 3.11 Oligonucleotides primers sequences in Custom
TaqMan Gene Expression Assays for all the
identified DEGs.
85
Table 3.12 TaqMan MGB probes sequences in Custom TaqMan
Gene Expression Assays for all the identified DEGs.
86
Table 3.13 Five-point 2-fold dilution series for the CT slope
method.
87
Table 3.14 Reaction components for PCR amplification. 88
Table 3.15 Universal thermal cycling conditions from
Applied Biosystems.
88

Preface
xix
Title of Table Page
Number
Table 3.16 Plate layout for PCR amplification of all the target
and reference genes for each individual sample.
91
Table 3.17 Singleplex reaction mixture for PCR amplification. 92
Table 3.18 Stratification of samples for the analysis of RT-
qPCR data.
93
Table 3.19 Preparation of BSA standards for the construction of
standard curve.
102
Table 3.20 Randomisation of protein samples for CyDyes
labeling.
104
Table 3.21 Randomisation of protein samples for gel loading. 106
Table 3.22 Running conditions for 13 cm Immobiline DryStrip
Gels on the Ettan IPGphor 3 IEF Unit.
111
Table 3.23 Gel recipe for 12.5 % SDS-denaturing
polyacrylamide resolving gel.
112
Table 3.24 Excitation and emission wavelengths, as well as
emission filters and PMT voltages used for the
detection of different CyDyes.
115
Table 4.1 Genotype frequencies with HWE testing, p value and
OR with 95 % CI for all NOD2/CARD15 variants in
each CRC patient and healthy control group.
129
Table 4.2 Allele frequencies, p value and OR with 95 % CI for
all NOD2/CARD15 variants in each CRC patient and
healthy control group.
130
Table 4.3 Genotype frequencies with HWE testing, p value and
OR with 95 % CI for all common GWAS-identified
CRC-associated variants in each CRC patient and
healthy control group.
138
Table 4.4 Allele frequencies, p value and OR with 95 % CI for
all common GWAS-identified CRC-associated
variants in each CRC patient and healthy control
group.
139

Preface
xx
Title of Table Page
Number
Table 4.5 Genotype frequencies with HWE testing, p value and
OR with 95 % CI for all XRCC1 variants in each
CRC patient and healthy control group.
145
Table 4.6 Allele frequencies, p value and OR with 95 % CI for
all XRCC1 variants in each CRC patient and healthy
control group.
146
Table 4.7 Genotype frequencies with HWE testing, allele
frequencies, p value and OR with 95 % CI of the
EGF +61 A>G variant in each CRC patient and
healthy control group.
149
Table 4.8 Genotype frequencies with HWE testing, allele
frequencies, p value and OR with 95 % CI of the
VEGF +936 C>T polymorphism in each CRC patient
and healthy control group.
152
Table 4.9 Summary of BLAST results and description on the
identified over-expressed DEGs.
158 – 159
Table 4.10 Summary of BLAST results and description on the
identified under-expressed DEGs.
160
Table 4.11 ΔCT mean, ΔΔCT, TCΔΔ-2 and p values for all the
DEGs in early stage CRC group.
166
Table 4.12 ΔCT mean, ΔΔCT, TCΔΔ-2 and p values for all the
DEGs in advanced stage CRC group.
167
Table 4.13 ΔCT mean, ΔΔCT, TCΔΔ-2 and p values for all the
DEGs in right-sided CRC tumours.
171
Table 4.14 ΔCT mean, ΔΔCT, TCΔΔ-2 and p values for all the
DEGs in left-sided CRC tumours.
172
Table 4.15 Number of differentially expressed protein spots
in different stages of primary CRC tumours
compared to their adjacent normal colonic mucosa,
as analysed by the DeCyder 2D software ver. 7.0.
181

Preface
xxi
Title of Table Page
Number
Table 4.16 The selected 20 protein spots of interest in Stage II
CRC Group [Spot No. refers to the numbers
assigned in Figure 4.16].
185
Table 4.17 Protein identities for all the 20 protein spots of
interest excised for LC-MS/MS analysis.
187 – 188
Table 5.1 Over-expressed proteins in primary Stage II CRC
tumours compared to adjacent paired normal colonic
mucosa.
231
Table 5.2 Under-expressed proteins in primary Stage II CRC
tumours compared to adjacent paired normal colonic
mucosa.
232
Table 5.3 Summary of patient characteristics and 2-D GE
approaches in different comparative proteomic
analyses on sporadic CRC tumours.
235

Preface
xxii
List of Symbols and Abbreviations
ACP Annealing control primer
ACTB Beta-actin
ACTC1 Actin, alpha cardiac
ACTSA Actin, alpha-2, smooth muscle
AIDS Acquired immunodeficiency syndrome
AJCC American Joint Committee on Cancer
Apaf-1 Apoptotic protease activating factor 1
APC Adenomatous polyposis coli
AP Apurinic / apyrimidinic
Arp2/3 Actin related protein 2/3
ARPC2 Actin related protein 2/3 complex, subunit 2
ARPC4 Actin related protein 2/3 complex, subunit 4
ATP Adenosine triphosphate
B23 Nucleolar phosphoprotein B23
BER Base excision repair
BLAST Basic Local Alignment Search Tool
BRCA1 Breast cancer type 1 susceptibility protein
BRCA2 Breast cancer type 2 susceptibility protein
BVA Biological variation analysis
C6orf173 Chromosome 6 open reading frame 173
CA19-9 Cancer antigen 19-9
CARD Caspase recruitment domain
CARD15 Caspase recruitment domain-containing protein 15

Preface
xxiii
CCAN Constitutive centromere associated network
CD Crohn’s disease
CENP Centromere protein
CENP-A Centromere protein A
CENP-F Centromere protein F
CENP-H Centromere protein H
CENP-T Centromere protein T
CENP-W Centromere protein W
CI Confidence interval
CIMP CpG island methylator phenotype
CIN Chromosomal instability
CRC Colorectal cancer
CT Threshold cycle
CTC Computed tomographic colonography
CUG2 Cancer-upregulated gene 2
DAMP Damage-associated molecular pattern
DCBE Double contrast barium enema
2-D DIGE Two-dimensional difference gel electrophoresis
DEG Differentially expressed gene
2-D GE Two-dimensional gel electrophoresis
DIA Differential in-gel analysis
DNA Deoxyribonucleic acid
DSBR Double-strand break repair
ECM Extracellular matrix

Preface
xxiv
EGF Epidermal growth factor
EGFR Epidermal growth factor receptor
emPAI Exponentially modified protein abundance index
FAP Familial adenomatous polyposis
FDR False discovery rate
FIT Fecal immunochemical test
FU Fluorescence unit
GAPDH Glyceraldehyde 3-phosphate dehydrogenase
gFOBT Guaiac fecal occult blood test
GWA Genome-wide association
GWAS Genome-wide association study
HNPCC Hereditary nonpolyposis colorectal cancer
HSP Heat shock protein
Hsp60 Heat shock protein 60
HWE Hardy-Weinberg equilibrium
IBD Inflammatory bowel disease
i.d. internal diameter
IEF Isoelectric focusing
LC20 20kDa myosin light chain
LC-MS/MS Liquid chromatography-tandem mass spectrometry
LD Linkage disequilibrium
log10 Logarithm to the base 10
LOH Loss of heterozygosity
LRR Leucine-rich repeat

Preface
xxv
MAPK Mitogen-activated protein kinases
MDP Muramyl dipeptide
MDSC Myeloid-derived suppressor cell
MLH1 MutL homolog 1
MMP Matrix metalloproteinase
MMR Mismatch repair
mRNA messenger RNA
MS Mass spectrometry
MSH2 MutS homolog 2
MSH6 MutS homolog 6
MSI Microsatellite instability
MS/MS Tandem mass spectrometry
NADPH Nicotinamide adenine dinucleotide phosphate
NBD Nucleotide-binding domain
NCBI National Center for Biotechnology Information
NCD Non-communicable disease
NER Nucleotide excision repair
NF-κB Nuclear factor kappa-light-chain-enhancer of activated B cells
NOD2 Nucleotide-binding oligomerisation domain-containing protein 2
NPM1 Nucleophosmin
OR Odds ratio
p value probability value
PARP Poly (ADP-ribose) polymerase
PCR Polymerase chain reaction

Preface
xxvi
pH Potential of hydrogen
pI Isoelectric point
PI3K-AKT Phosphatidyl inositol 3-kinase-protein kinase B
PMT Photomultiplier tube
R2 Coefficient of determination
RAGE Receptor for advanced glycation end products
RIN RNA integrity number
RNA Ribonucleic acid
RPL35 Ribosomal protein L35
RPLP0 Ribosomal protein LP0
RPS23 Ribosomal protein S23
rpm Revolutions per minute
RQ Relative quantification
rRNA Ribosomal RNA
RT-qPCR Real-time reverse transcription PCR
S100A8 S100 calcium binding protein A8
S100A9 S100 calcium binding protein A9
SDS Sodium dodecyl sulfate
SDS-PAGE Sodium dodecyl sulfate-polyacrylamide gel electrophoresis
SGN8 COP9 constitutive photomorphogenic homolog subunit 8
SMAD7 Mothers against decapentaplegic homolog 7
SMN Stathmin
SNP Single nucleotide polymorphism
TAM Tumour-associated macrophage

Preface
xxvii
TGF-β Transforming growth factor-beta
TIMP1 Tissue inhibitor of metalloproteinase 1
TLR Toll-like receptor
TP53 Tumour protein 53
UC Ulcerative colitis
VEGF Vascular endothelial growth factor
VEGFR Vascular endothelial growth factor receptor
WAVE WASP family verpolin homologous protein
XRCC1 X-ray repair cross-complementing protein 1
+ plus or minus
> greater than
> greater than or equal to
< less than
< less than or equal to
% percentage
χ2 Chi-square
0C degree Celsius
Å angstrom
bp base pair
cm centimetre
Da Dalton
g gravitational acceleration
g gram
hr hour

Preface
xxviii
kb kilo base
kVh kilovolt-hours
L litre
M molar
mA milliampere
mg milligram
min minute
ml millilitre
mM millimolar
mm millimetre
ng nanogram
nl nanolitre
nm nanometre
nmol nanomole
pmol picomole
sec second
U enzyme unit
μA microampere
μg microgram
μl microlitre
μM micromolar
μm micrometre
V volt
v/v volume/volume

Preface
xxix
w/v weight/volume
w/w weight/weight

Preface
xxx
List of Appendices
i) Appendix A - Certificate of Participation for 1st National Postgraduate
Conference in Molecular Medicine 2011.
ii) Appendix B - Certificate of Participation and Best Poster Award for
Coloproctology 2012.

Chapter One – Introduction
1
CHAPTER ONE
INTRODUCTION

Chapter One – Introduction
2
For decades, colorectal cancer (CRC) has been a threat to the wellbeing of humans
worldwide, notwithstanding the fact that effective treatment and promising outcome(s)
are possible if detected early enough. CRC can arise either sporadically or in the setting
of Mendelian-inherited syndromes which are etiologically and pathogenetically well-
established. In contrast to the hereditary CRC syndromes, the genetic variants of low-
penetrance genes conferring modest risks were thought to contribute to the genetic
predisposition of sporadic CRC. As a majority of the CRC incidences are sporadic,
medical scientists focused their research in trying to understand molecular changes
underlying the carcinogenic process, hoping to improve its screening, diagnosis,
treatment and prognosis (McDermott et al., 2011; Weitz et al., 2005). At present,
research on CRC in Malaysian patients is still scarce despite increased incidence and
mortality rates over the years. In fact most CRC studies are carried out in Western
populations, which typically exhibit different genetic background and disease
characteristics from our local population. Hence, in the present study, we aim to
investigate and characterise primary sporadic CRC tumours among our Malaysian
cancer patients from the perspective of genomics, transcriptomics and proteomics.
To date, CRC screening has only been targeted at high-risk individuals, i.e., those with
family or personal history of CRC or other cancers. As genetic predisposition is
indispensable for multi-hit CRC carcinogenesis, investigations on the role of low-
penetrance genes, as well as the interactive relationships have become the center of
attention (Kotnis et al., 2005). It is envisioned that the identification of low-penetrance
CRC susceptibility variants will improve the screening and detection for adenomas or
early stage colorectal carcinomas in average-risk population (Winawer, 2007).
Consistent with this notion, we aimed to investigate the potential association between
15 single nucleotide polymorphisms (SNPs) of nine low-penetrance candidate genes or

Chapter One – Introduction
3
chromosomal loci, and CRC susceptibility with regards to our Malaysian cohort via a
case-control association study.
In the first part of this study, the NOD2 gene was selected owing to its crucial role in the
inflammatory conditions predisposing to CRC. The low-penetrance genetic variants of
the XRCC1, EGF and VEGF genes were also chosen as anomalies in the mechanisms of
DNA repair, cell proliferation and angiogenesis, will trigger and promote the
development and progression of CRC tumours (Carmeliet and Jain, 2000; Citri and
Yarden, 2006; Hisamatsu et al., 2003; Hung et al., 2005). Recently, GWA studies were
performed and several common CRC risk variants were identified, i.e., the loci 8q24
(rs6983267), 8q23 (rs16892766), 11q23 (rs3802842), 15q13 (rs4779584) and 18q21
(rs4939827) (Broderick et al., 2007; Houlston et al., 2008; Jaeger et al., 2008; Tenesa et
al., 2008; Tomlinson et al., 2008). Several independent studies have replicated these
associations, but their exclusiveness in the populations of the European and American
ancestry, warrants more replication efforts in non-European populations, e.g., Malaysia
(Curtin et al., 2009; Pittman et al., 2009; Pittman et al., 2008; Yeager et al., 2008).
In the post-genomic era, both transcriptomic and proteomic profiling of cancer cells
hold promises for a better insight into CRC oncogenesis. Abnormalities in nucleotide
sequences alone are insufficient to trigger and sustain the development and progression
of tumour cells. Further alterations at the mRNA and protein levels, i.e., transcription,
translation, post-translational modification, subcellular localisation, proteolysis, etc.,
greatly influence numerous intracellular processes that impact CRC carcinogenesis
(Habermann et al., 2008; Soreide et al., 2009). In the present study, we aimed to
characterise CRC tumour-specific mRNA and protein expression patterns in comparison
to the adjacent ostensibly normal colonic tissues via comparative expression analyses.

Chapter One – Introduction
4
The mRNAs (transcriptome) are intermediate molecules between DNA codes in the
human genome and functional proteins that are actively involved in the cellular
activities and determination of cellular phenotype. The transcription rate of genes and
the stability of the transcribed mRNAs are altered in response to certain stimuli or
diseased state. Therefore, the characterisation of the transcriptome of tumour cells will
reflect the changes in the gene expression of the tumour genome that favours the cancer
pathogenesis (Gerling et al., 2003; Pradet-Balade et al., 2001). Hence, in the second
part of our study, we have employed a combination approach consisting of a two-step
annealing control primer (ACP)-based PCR and real-time reverse transcription PCR
(RT-qPCR), in order to characterise the mRNA expression patterns for both early- and
advanced stage primary CRC tumours.
Meanwhile, the characterisation of stage-specific protein expression patterns for
primary sporadic CRC tumours was performed via two-dimensional difference gel
electrophoresis (2-D DIGE) in the third part of our study. Since the synthesis of
functional proteins involve regulation at different steps of translation, the structure,
function and abundance of proteins cannot simply be predicted by the DNA blueprint
and mRNAs (Habermann et al., 2008; Kalia and Gupta, 2005). In fact, proteins are the
functional end products of genes that act as actual mediators in all biological processes.
Therefore, it is vital to study the cancer proteome to provide a more comprehensive
view on carcinogenesis at the molecular level. Hence, recent studies have looked into
the cancer proteome for potential molecular marker(s) or target(s) to improve future
cancer diagnosis, prognosis and treatment.
On the whole, the present research consists of three main parts that covers the genomic,
transcriptomic and proteomic aspects of primary sporadic CRC neoplasms in our
Malaysian patients’ cohort, i.e., Part A, B and C, respectively. There are a total of six
chapters in this thesis, i.e., Introduction, Literature Review, Methodology, Results,

Chapter One – Introduction
5
Discussion and, Conclusion and Recommendation. And now, the journey of our CRC
study begins on the next page!

Chapter Two – Literature Review
6
CHAPTER TWO
LITERATURE
REVIEW

Chapter Two – Literature Review
7
2.1 A Glimpse of Cancer
Cancer, which is the leading cause of morbidity and mortality worldwide, denotes to a
group of diseases where there is uncontrolled proliferation and spread of abnormal cells
(World Health Organisation [WHO], 2002). In 2008, there was an estimated cancer
incidence of 12.7 million cases, with the lung, female breast, colorectal, stomach and
prostate cancers as the most common (48.3 % of all cancer cases diagnosed worldwide)
(Figure 2.1). Globally, lung and breast cancers had emerged as the most common
neoplasm among men (16.5 %) and women (22.9 %), respectively (Ferlay et al., 2010).
Figure 2.1: Global cancer incidences in both men and women (year 2008) (Chart
generated according to Ferlay et al., 2010).
12.70%
10.90%
9.80%
7.80%
7.10% 5.90% 4.20%
3.80% 3.00%
34.80%
Incidence
Lung Female breast Colorectum Stomach Prostate Liver Cervix uteri Esophagus Bladder Others and unspecified

Chapter Two – Literature Review
8
In the same year, cancer had accounted for 13 % (7.6 million deaths) of global mortality,
in which the lung, stomach, liver, colorectal and female breast cancers contributed the
most (Figure 2.2) (Ferlay et al., 2010).
Figure 2.2: Global cancer mortality in both men and women (year 2008) (Chart
generated according to Ferlay et al., 2010).
Cancer was responsible for one in eight deaths worldwide, and thus is higher than the
combined number of deaths contributed by AIDS, tuberculosis and malaria (World
Health Organisation [WHO], 2008). Likewise, it was the second most common (17
million deaths) cause contributing to global non-communicable disease (NCD) deaths in
2008 alone (World Health Organisation [WHO], 2011). In Malaysia, cancer (11.28 %)
is the third leading cause of deaths, following cardiovascular diseases (16.49 %) and
septicaemia (13.38 %) (Omar and Ibrahim Tamin, 2011). In 2010, there were an
estimated of 62, 120 new cancer cases, and a total of 5, 349 deaths were caused by
cancer (World Health Organisation [WHO], 2011a).
18.20%
9.70%
9.20%
8.10% 6.10% 5.40%
3.60% 3.40%
2.00%
34.30%
Mortality
Lung Stomach Liver
Colorectum Female breast Esophagus
Cervix uteri Prostate Bladder
Others and unspecified
Chapter Two – Literature Review
9
Cancer is predicted as a continuous threat to the well-being of the global population for
the next few decades, in accordance to population growth and ageing. By 2030, cancer
incidence and mortality are projected to increase to 22 million cases and 13.2 million
deaths, respectively. It is speculated that two-thirds of all diagnosed cancer cases will
occur in low- and middle income countries by then. These are parallel to the forecasted
changes in global population demographics for the next two decades (Ferlay et al., 2010;
Soreide et al., 2009; World Health Organisation [WHO], 2008).
In human malignancy, genetic abnormalities are the major determinant in the initiation,
progression and invasion of cancer. The carcinogenesis is triggered by external
carcinogens (i.e., tobacco, asbestos, chemicals, radiation, etc.), infectious organisms,
and internal factors (i.e., inherited genetic mutations, hormones and immune conditions).
These risk factors act either simultaneously or sequentially in the initiation and
progression of human malignancies. In reality, cancer may arise years to decades after
the initial exposure to etiological agents. Hence, an individual’s risk of getting cancer
increases with age, and virtually 77 % of all diagnosed cancer cases were those 55 years
and older (American Cancer Society [ACS], 2012; World Health Organisation [WHO],
2002).
Cancer staging delineates the extent and spread of malignancy at the time of diagnosis.
It is based on the size of the primary tumour and the presence or absence of
disseminated cancerous cells in other parts of the body. The TNM staging (Stages I –
IV) and summary staging systems (in situ, local, regional and distant) are two cardinal
cancer classification systems. Generally, the former is widely applied in clinical
settings, while the latter is used for the descriptive and statistical analysis of tumour
registry data (Sobin et al., 2009; Young et al., 2001).

Chapter Two – Literature Review
10
Cancer is one of the leading diseases with high morbidity and mortality rates in both
developed and developing countries. However, a large proportion of human
malignancies can, in fact, be potentially prevented or detected at an early stage when the
cancer is more treatable (Mackay et al., 2006; World Health Organisation [WHO],
2008). For instance, both cervical and colorectal cancers can be potentially prevented
through the detection and subsequent removal of precancerous lesions. This highlights
the importance of disease screening in reducing cancer incidences and mortalities.
Cancer screening refers to the testing of asymptomatic individuals in an attempt to
detect any precancerous lesion(s) or early stage tumour(s) via rapidly-applicable tests,
examinations or procedures. Screening has been shown to be effective in detecting
early stage tumours of cervical, colorectal, breast and prostate cancers (Winawer et al.,
2003; World Health Organisation [WHO], 2002). The reduction in carcinogen exposure
and an adoption of a healthy lifestyle can also potentially decrease the risk of
developing cancers, as neoplastic development is augmented by certain environmental
and behavioural factors (World Health Organisation [WHO], 2002).

Chapter Two – Literature Review
11
2.2 Colorectal Cancer (CRC): Facts and Figures
2.2.1 Colon and Rectum Anatomy
Both the colon and rectum, together with the esophagus, stomach, small intestine,
cecum and anus, form the human gastrointestinal tract. As illustrated in Figure 2.3, the
human colon is a muscular tube of about five feet long and is macroscopically divided
into four anatomical sections, i.e., the ascending, transverse, descending and sigmoid
colon (Haubrich et al., 1995; Morson and Dawson, 1979).
Figure 2.3: Anatomical structure of the human large bowel (Adapted from: http://
www.nlm.nih.gov/medlineplus/ency/imagepages/8832.htm).
Hepatic flexure Splenic flexure
Sigmoid colon

Chapter Two – Literature Review
12
The human rectum, on the other hand, is about 12 cm long and begins approximately at
the level of the third sacral vertebra. The lumen of rectum is fusiform and indented by
three prominent crescentic folds, i.e., the superior, middle and inferior valve of Houston.
Clinically, these colonic segments and rectal valves serve as important landmarks in the
designation of tumour location for CRC diagnosis (Haubrich et al., 1995).
Microscopically, the walls of the colon and rectum comprises of four main concentric
layers, which from the lumen outward, are the mucosa (consists of simple columnar
epithelium, lamina propria and muscularis mucosae), submucosa, muscularis propria
(comprised of inner circular and outer longitudinal layer of smooth muscle) and serosa /
adventitia (DeVita et al., 1985; Haubrich et al., 1995; Morson and Dawson, 1979). The
bowel wall is innervated by two main nerve plexuses – the Meissner’s and Auerbach’s
plexus, which lies within the submucosa and between the two layers of smooth muscle
in the muscularis propria, respectively (Morson and Dawson, 1979).
The human colon is supplied by the superior mesenteric artery from the cecum to
splenic flexure, and the inferior mesenteric artery in the remaining colonic sections and
recto-sigmoid junction. On the other hand, the rectum is supplied by the superior rectal
(branch of inferior mesenteric artery), middle rectal (branch of internal iliac artery) and
inferior rectal arteries (branch of internal pudendal artery) (Griffiths, 1961). In addition,
both the colon and rectum are endowed with extensive lymphatic network, as well as
numerous aggregates of lymphoid follicles (especially at the ileocecal junction, within
the transverse mesocolon at both flexures area and within the pararectal spaces) (Ellis,
1983). The insight into these intricate vascular and lymphatic networks greatly assists
in the understanding of tumour spread, and subsequent formulation of effective
operative treatment and adjuvant therapy. Furthermore, the innervating blood and
lymphatic vasculature also serve as important features in CRC staging, together with the
histological structures of the bowel wall.

Chapter Two – Literature Review
13
2.2.2 Definition
CRC is a clinical term denoting cancer of the colon or rectum origin. In both the
clinical and research setting, ‘right-sided / proximal CRC’ refers to neoplasms arising
from colonic segments that are proximal to the splenic flexure, i.e., the cecum,
ascending colon, hepatic flexure or transverse colon. Conversely, the term ‘left-sided /
distal CRC’ refers to those arising from the splenic flexure itself, descending colon,
sigmoid colon or rectum (Haubrich et al., 1995; Morson and Dawson, 1979).
2.2.3 Incidence and Mortality
Worldwide, CRC is the third most common cancer with 1.2 million new cases expected
to occur within the decade. As depicted in Figures 2.4a and 2.4b, a marked regional
difference of about 10-fold in CRC incidence rate was observed in both men and
women globally. For instance, the North Americans, Australians, New Zealanders and
Europeans reported with higher CRC incidence rates, while countries in Africa and
South Central Asia were relatively lower. The incidence of CRC was notably higher in
men than women with a ratio of 1.4:1. CRC alone was responsible for 8 % of all cancer
deaths worldwide (609, 000 deaths) in the same respective year. There was, however,
no noticeable gender variation in CRC mortalities (Ferlay et al., 2010).
CRC has been long thought as a ‘westernised’ disease owing to its noticeably higher
incidence in developed / high income countries. Yet recently, the rate is stabilizing or
declining in these high-risk regions, e.g., France, Australia, United States, New Zealand
and Canada. In the United States, the reduction in CRC incidence was contributed
largely by the CRC screening programme, which allowed the prevention of CRC by
detecting and removing the precancerous lesions (Center et al., 2009; Center et al.,
2009a; Edwards et al., 2010; Ferlay et al., 2010). On the contrary, a greater increasing
trend in CRC incidence is observed in those countries of historically lower risk, i.e.,

Chapter Two – Literature Review
14
Japan, Korea, China, Singapore and Eastern Europe. This might be ascribed to the
impact of westernisation that involves changes associated with CRC risk factors, such
as increased prevalence of obesity and smoking (Center et al., 2009; Center et al., 2009a;
Ferlay et al., 2010; García-Álvarez et al., 2007; de Kok et al., 2008; Martín et al., 2008).

Chapter Two – Literature Review
15
Figure 2.4a: Estimated age-standardised CRC incidence rates among men for 2008
(Source: Ferlay et al., 2010).
Figure 2.4b: Estimated age-standardised CRC incidence rates among women for 2008
(Source: Ferlay et al., 2010).
0 4.3 7.5 14.8 36.0 61
Age-standardized incidence rates per 100, 000
0 3.3 6.5 11.9 23.4 38
Age-standardized incidence rates per 100, 000

Chapter Two – Literature Review
16
As opposed to the incidence rate, the CRC mortality rate has been declining in most
countries owing to increased awareness in CRC screening and improved treatment for
CRC patients, with the exception of Mexico and Brazil in South America, and Romania
in Eastern Europe. This could be due to relatively limited health resources and facilities
(Center et al., 2009; Edwards et al., 2010; Sant et al., 2001).
In Malaysia, cancers of the breast (14.0 %), colorectum (11.4 %), lung (11.3 %), cervix
uteri (6.6 %) and nasopharynx (6.3 %) were the five most frequent for 2008. CRC was
ranked as the second and third most common cancer among Malaysian men and women,
respectively (Figures 2.5a and 2.5b) (Ferlay et al., 2010). A sex ratio of 1.3:1 was
reported for CRC incidence rate, with 13.4 per 100, 000 in men and 10.2 per 100, 000 in
women (Omar and Ibrahim Tamin, 2011). The lung, colorectal, breast and stomach
cancers, as well as leukaemia, were the five malignancies that contributed the most to
cancer deaths in Malaysia (Ferlay et al., 2010).

Chapter Two – Literature Review
17
Figure 2.5a: Age-standardised incidence and mortality rates of malignant diseases
among Malaysian men in 2008 (Source: Ferlay et al., 2010).
Figure 2.5b: Age-standardised incidence and mortality rates of malignant diseases
among Malaysian women in 2008 (Source: Ferlay et al., 2010).

Chapter Two – Literature Review
18
2.2.4 Clinical Manifestations
Early stage CRC is asymptomatic, and more often than not, the manifested signs and
symptoms are implication of a more advanced disease (American Cancer Society [ACS],
2011). As tumours grow, the obstruction and perforation of the bowel will eventually
result in the warning signs and symptoms of CRC, e.g., bleeding and abdominal pain.
Bleeding can present either directly as rectal bleeding, or indirectly as blood in the
faeces and black-coloured stools (American Cancer Society [ACS], 2011; Goulston et
al., 1986; Thompson, 2002). Besides cramping pain in the lower stomach, CRC
patients will also experience a change in bowel habits such as a new onset of
constipation or diarrhoea that lasts for more than a few days. The loss of weight and
fatigue are not uncommon in most CRC patients. Occasionally, anemia can also
develop due to excessive blood loss in some severe cases (American Cancer Society
[ACS], 2011; Garcia-Valdecasas et al., 1991; Haubrich et al., 1995; Thompson, 2002).

Chapter Two – Literature Review
19
2.2.5 Histological Variants of Colorectal Carcinoma
Adenocarcinomas constitute more than 90 % of all CRC carcinomas, while the
remaining are those of rarer types, e.g., neuroendocrine, squamous cell, adenosquamous,
spindle cell and undifferentiated carcinomas (Bosman et al., 2010). The colorectal
adenocarcinomas are characterised by glandular formation and most of them are
moderately-differentiated (Figure 2.6). Of all, less than 15 % are mucinous
adenocarcinomas, which are featured with substantial quantity (> 50 % of the tumour
volume) of extracellular mucin within tumours (Figure 2.7a). There are also other rarer
types of colorectal adenocarcinoma, such as signet-ring cell (< 1 % of all CRC
carcinomas) and medullary adenocarcinoma (5 – 8 in every 10, 000 diagnosed CRC
cases), as illustrated in Figures 2.7b and 2.7c respectively (Bosman et al., 2010; Morson
and Dawson, 1979; Sasaki et al., 1987; Thirunavukarasu et al., 2010; Thompson and
West, 2000).
Figure 2.6: Microscopic appearance of colorectal adenocarcinoma (Adapted from: http:
//www.microscopyu.com/staticgallery/pathology/adenocarcinomaofcolon20
x02.html).
Prominent nucleoli
& increased nuclear
to cytoplasmic ratio

Chapter Two – Literature Review
20
Figure 2.7: Histological appearance of mucinous (a), signet-ring cell (b) and medullary
adenocarcinoma (c) (Adapted from: Fleming et al., 2012).
Prominent
intracytoplasmic
mucin vacuole
(a)
(b)
(c)
Abundant
extracellular
mucin
Vesicular nuclei
with prominent
nucleoli

Chapter Two – Literature Review
21
2.2.6 Oncogenesis: The Classical Adenoma-Carcinoma Sequence
Majority of, yet not all, CRC tumours evolve from adenomatous tissues. Adenomas
(neoplastic polyps) are premalignant lesions composed of dysplastic epithelia, in which
the histological, biochemical and genetic alterations are parallel to carcinomas. As a
consequence, adenomas are widely accepted as the antecedent of most CRC carcinomas.
It represents a fundamental intermediary within the continuum, from normal colonic
epithelium to invasive carcinoma, of the classical adenoma-carcinoma sequence in CRC
oncogenesis. In reality, both adenomas and carcinomas tend to co-exist within an
individual (Day and Morson, 1978; Dorundi and Bannerjea, 2008; Haubrich et al., 1995;
Morson and Dawson, 1979; Muto et al., 1975; Zhang et al., 2012).
Generally, there are three distinct histological subtypes of adenoma which vary in size,
tissue architecture and malignancy potential, i.e., tubular, tubulovillous and villous
adenomas. Tubular adenomas, which are also referred to as adenomatous polyps, are
the most common subtypes (75 – 90 %). They are characterised by simple crypt-like
dysplastic glands and < 25 % of villous components. In contrast, the villous subtype is
the least common (3 – 10 %) and composed of > 75 % of finger-like projections (villous
components). The tubulovillous adenoma, on the other hand, exhibits an intermediate
histological pattern with 25 – 75 % of villous components, and broad, stunted villi (Jass
and Sobin, 1989; Konishi and Morson, 1982; Morson and Dawson, 1979; Muto et al.,
1975; Shinya and Wolff, 1979). As a rule, the sporadic colonic adenoma tends to occur
singly, with an exception of several adenomas in about 25 – 50 % of patients and 5 – 50
polyps in only a few patients. It was previously reported that individuals with five or
more adenomas during colonoscopy assessment were at an increased risk of developing
CRC (Jass, 1989; Schuman et al., 1990). Rarely, hundreds or even thousands of
adenomas can be observed, e.g., in familial adenomatous polyposis (FAP) syndrome
(Konishi and Morson, 1982; Morson and Dawson, 1979; Vatn and Stalsberg, 1982).

Chapter Two – Literature Review
22
The thought that colonic adenomas precede CRC carcinomas was further evidenced by
several findings. First, adenomas tend to occur at a younger age than carcinomas, and
are detectable in about one in three of all resected CRC specimens. CRC patients with
synchronous adenomas are at twice the rate of developing a second or metachronous
tumour in the remaining parts of the bowel, if compared to those where the associated
adenoma is absent (Bussey et al., 1967; Dorundi and Bannerjea, 2008; Morson and
Dawson, 1972). Thirdly, both the adenoma with a microscopical focus of carcinoma,
and the invasive carcinoma with residual benign adenoma at one edge, are detected
histologically in the clinical setting (Figure 2.8).
Figure 2.8: Histology of ‘mixed’ CRC tumour (Adapted from: Oxentenko and Smyrk,
2012).
Adenoma Carcinoma

Chapter Two – Literature Review
23
On occasions, these ‘mixed’ tumours can be visualised macroscopically (Dorundi and
Bannerjea, 2008; Muto et al., 1975). Fourthly, more adenomas are progressively
destroyed or transformed into malignant tissues as the carcinoma enlarges. This was
evidenced as both adenomas and adenocarcinomas were contiguously found in only 7 %
of the T3 CRC tumours, but a quantity of adenomatous tissues were observed in almost
60 % of the T1 tumours (Morson, 1966). The malignant transformation of adenomas
into carcinomas was also successfully demonstrated in vitro, and the removal of
adenomas had effectively reduced the risk of developing CRC (Dorundi and Bannerjea,
2008). In addition, this adenoma-carcinoma sequence was further supported by the
Vogelstein model from the viewpoint of molecular genetics (Vogelstein et al., 1988).
2.2.7 Risk Factors
Previous studies had reported several modifiable and non-modifiable risk factors that
influence an individual’s risk of developing CRC. The non-modifiable risk factors
include increasing age, personal or family history of CRC or adenomatous polyps,
personal history of chronic inflammatory bowel diseases (IBDs) [e.g., ulcerative colitis
(UC) and Crohn’s disease (CD)] and certain hereditary syndromes [e.g., hereditary non-
polyposis CRC (HNPCC) and FAP] (Bernstein et al., 2001; Butterworth et al., 2006;
Jasperson et al., 2010; Lynch and de la Chapelle, 2003).
An individual’s risk of developing CRC begins to increase after the age of 40, rising
sharply at 50 – 55 years old, and doubling with each succeeding decade, until it reaches
the peak at 75 years old (Soreide et al., 2009; Winawer, 2007). The incidence rate of
CRC is more than 15 times higher among individuals of 50 years old and above,
compared to those aged between 20 – 49 years. This was evidenced as individuals of 50
years old and older contributed to 90 % of new cases and 94 % of deaths overall. Hence,

Chapter Two – Literature Review
24
CRC is considered as a disease of advancing years and the average age at time of
diagnosis is about 60 years old (American Cancer Society [ACS], 2011; Hall, 2007).
Undeniably, genetic factors do play an important role in the development of CRC (~ 30 %
of the total cases) (Dorundi and Bannerjea, 2008; Lichtenstein et al., 2000). The
familial clustering of CRC, which does not fulfill the strict criteria of typical hereditary
CRC, has contributed to 20 – 25 % of total cases. A two- to three-fold increased risk of
getting CRC was reported in two or more first-degree relatives of CRC patients
(Houlston and Peto, 1996; Knudson, 2002). This familial risk was found to increase
with the number of CRC-affected relatives, the closer the degree of kinship to the CRC
patients, and a younger age-at-onset of the affected family members. Family history of
adenomas also accounts for a two-fold increased risk (Butterworth et al., 2006;
Cunningham et al., 2010; Johns and Houlston, 2001; Kune et al., 1989; Lynch and de la
Chapelle, 2003; Stewart and Kleihues, 2003). Those previously diagnosed with
colorectal carcinomas, approximately 1.5 – 3 % of them will develop second primary
CRC in the first five years (Stewart and Kleihues, 2003). In addition, individuals with
previous history of small bowel, endometrial, breast or ovarian cancer, will also be at
increased risk for CRC development.
Numerous evidences on the other hand, have demonstrated an increased risk of
developing sporadic CRC in patients with chronic IBD (Choi and Zelig, 1994; Ekbom
et al., 1990; Gyde et al., 1982; Langholz et al., 1992). Individuals with IBD tend to
develop sporadic CRC 15 – 20 years earlier (median age of 54.5 years in CD patients
and 43 years in those with UC) than the average-risk population (median age of 65
years) (Choi and Zelig, 1994). The magnitude of CRC risk was found to increase with
an early age at the time of diagnosis for IBD, a longer disease duration, more severe and
extensive area of inflammation (e.g., pancolitis) and the presence of dysplasia (Eaden et
al., 2001; Gyde et al., 1982; Gyde et al., 1988; Itzkowitz and Harpaz, 2004; Lakatos et

Chapter Two – Literature Review
25
al., 2006; Munkholm, 2003). For instance, CRC risk is increased with disease duration
among UC patients, i.e., from 2 % at 10 years after diagnosis, to 8 % and 18 % after 20
and 30 years, respectively. Furthermore, the estimated prevalence of CRC was noted to
be 3.7 % among UC patients, and increased to 5.4 % in those with pancolitis (Eaden et
al., 2001).
Certain inherited polyposis and non-polyposis syndromes are responsible for excessive
familial risk of CRC and contribute to hereditary CRC. Among them, FAP and HNPCC
syndromes, which follow the autosomal dominant Mendelian-inheritance pattern, are
the most prominent inherited CRC-predisposing disorders (Lynch et al., 1991; Lynch
and Lynch, 1985; Veale, 1965). The former accounts for < 1 % of the total CRC burden,
while another 4 – 6 % is contributed by the latter (Haubrich et al., 1995). The hallmark
of FAP syndrome is the presence of hundreds to thousands of adenomas (500 – 2500 in
average), which are typically manifested earlier in the second and third decades of life.
Notably, the penetrance of CRC approaches 100 %, and CRC arises at the age of 40
years in most of the FAP patients if this large amount of adenomas is left untreated
(Half and Bresalier, 2004; Kinzler and Vogelstein, 1996). In view of the presence of
this considerable amount of adenomas, the occurrence of multiple synchronous
carcinomas are common, and virtually half of the FAP patients reported with CRC
malignancy of more than one carcinoma (Bussey, 1975).
As for HNPCC syndrome (also known as Lynch syndrome), the progress of malignancy
from adenoma to carcinoma is accelerated and thus, the onset of CRC is usually at a
younger age (an average of 45 years compared to 63 years in general population)
(Lynch et al., 1991). Patients with HNPCC syndrome are characterised with an
increased risk of developing neoplasias at various specific extracolonic sites, i.e.,
endometrium, ovary, stomach, small bowel, hepatobiliary tract, pancreas, upper
uroepithelial tract and brain. Additionally, a high risk of developing second primary

Chapter Two – Literature Review
26
CRC within 10 years of surgical resection has been reported in about 25 – 30 % of the
HNPCC patients (Barrow et al., 2009; Cunningham et al., 2010; Hampel et al., 2008;
Vasen et al., 1991; Vasen et al., 1999; Watson et al., 2008). There is also a 50 % risk of
developing CRC among the first-degree relatives of HNPCC patients (Lynch et al.,
1991).
A wide variety of modifiable factors have also been associated with increased risk for
sporadic CRC through epidemiological studies. The list includes physical inactivity,
obesity, diet high in red and processed meats, long-term cigarette smoking and heavy
alcohol consumption (Ellis, 1999; Giannopoulos et al., 2008; Huxley et al., 2009; Lewis,
2002; Pesta et al., 2007; Samad et al., 2005; Stewart and Kleihues, 2003). Hence, CRC
is considered to be preventable if one practices a healthy lifestyle by abstaining from the
above-mentioned behavioural risk factors.
2.2.8 Tumour Grading and Cancer Staging
The histological grading of CRC carcinoma provides information on tumour growth rate
and aids in patient prognostication. Broadly, there are three different grades of
malignancy, i.e., low, average and high, based on the degree of tubules differentiation,
the morphology of cells and nuclei, as well as the number of mitotic figures. If the
tubular architecture and morphology are similar to the adenomatous epithelium, the
tumour is considered as well-differentiated. In contrast, poorly-differentiated tumours
(20 %) exhibit irregular tubules or clumps of undifferentiated cells. The remaining 60 %
are moderately-differentiated tumours with varying degrees of abnormality in tubular
architecture (Dorundi and Bannerjea, 2008). As previously reported, the tumour grade
of resected CRC specimens is closely associated with the extent of cancer spread. For
instance, the incidence of lymph node involvement is only 25 % among cases with low
grade malignancy, 50 % in average grade CRC tumours and almost 80 % in those of

Chapter Two – Literature Review
27
high grade. On the other hand, the crude five-year survival rate of CRC patients is in an
inverse relationship to the tumour grade, i.e., about 80 % for those with low grade
tumours, 60 % for average grade cases, and only 25 % for CRC patients with high grade
neoplasm (Morson and Dawson, 1979).
In routine clinical practice, two cardinal systems are employed for CRC staging, i.e., the
classical Dukes’ Classification System and the American Joint Committee on Cancer
(AJCC) Tumour-Node-Metastasis (TNM) Staging System (Hall, 2007; Puppa et al.,
2010). The Dukes’ Classification System was first proposed by Sir Cuthbert Dukes in
1932. Originally, the assessment on the degree of tumour infiltration through the bowel
wall, as well as the presence or absence of lymph nodes involvement grounded the
application of this system (Dukes, 1932). Thereafter, several modifications by other
investigators had further refined the staging criteria and thus, shaped the current Dukes’
Classification System (Astler and Coller, 1954; Kirklin et al., 1949). In brief, the node-
negative CRC neoplasms are classified as Dukes’ A (tumours are confined within the
muscularis propria) or B (tumours penetrate through the muscularis propria). On the
other hand, the CRC tumours with lymph nodes involvement are grouped as Dukes’ C,
whereas the presence of distant metastatic spread is a hallmark of Dukes’ D (Astler and
Coller, 1954; Dukes, 1932; Hall, 2007).
On top of the Dukes’ Classification System, the AJCC TNM Staging System also plays
an integral role in CRC staging (Hu et al., 2011; Treanor and Quirke, 2007). The
staging criteria and classification rules of this system have been perpetually revised over
the years, and its latest version, the 7th
edition of AJCC Cancer Staging Manual was
published recently (Edge et al., 2010; Gospodarowicz et al., 2004; Jessup et al., 2011;
Sobin et al., 2009) (Table 2.1). Likewise, the TNM Staging System also relies on the
anatomical evaluation of primary tumours, i.e., the depth of bowel wall infiltration at
time of diagnosis (T), the presence or absence of regional lymph nodes involvement (N),

Chapter Two – Literature Review
28
as well as the presence or absence of metastatic spread to distal organs (M) (Edge et al.,
2010; Hu et al., 2011; Puppa et al., 2010) (Figure 2.9). This system is relatively more
comprehensive and allows a more detailed categorisation of CRC tumours, compared to
the Dukes’ Classification System (Table 2.1).
Figure 2.9: TNM staging of CRC primary tumours based on the degree of bowel wall
infiltration, as well as the involvement of regional lymph nodes and distant
organs (Adapted from: http://www.hopkinscoloncancercenter.org/CMS/
CMS_Page.aspx?CurrentUDV=59&CMS_Page_ID=EEA2CD91-3276-
4123-BEE B-BAF1984D20C7).
TisN0M0 T1-2N0M0 T3-4N0M0 T1-4N1-2M0 T1-4N1-2M1

Chapter Two – Literature Review
29
Table 2.1: The 7th
edition of AJCC TNM Staging System for CRC tumours, in
comparison to the Dukes’ Classification System.
Stage T N M Dukes’ System
0 Tis N0 M0 -
I T1
T2
N0
N0
M0
M0
A
A
IIA
IIB
IIC
T3
T4a
T4b
N0
N0
N0
M0
M0
M0
B
B
B
IIIA
IIIB
IIIC
T1-T2
T1
T3-T4a
T2-T3
T1-T2
T4a
T3-T4a
T4b
N1/N1c
N2a
N1/N1c
N2a
N2b
N2a
N2b
N1-N2
M0
M0
M0
M0
M0
M0
M0
M0
C
C
C
C
C
C
C
C
IVA
IVB
Any T
Any T
Any N
Any N
M1a
M1b
-
-
Broadly, the TNM Staging System is applicable for both clinical (cTNM) and
pathological (pTNM) staging of CRC primary tumours. The cTNM staging is founded
on the medical history of the patient, as well as results of various physical, imaging and
endoscopic examinations. On the other hand, the pTNM staging is performed post-
operatively via histological examination on resected specimens. Therefore, this system
allows the consolidation of both clinical information (which is obtained through

Chapter Two – Literature Review
30
physical examination, radiologic imaging and endoscopic inspection) and surgical
findings for cancer staging and patient stratification (Hu et al., 2011; Puppa et al., 2010).
In addition, this TNM Staging System is not limited to the classification of untreated
CRC primary tumours, but also applicable for those with neoadjuvant therapy by
assigning a prefix “y”, eg., ycTNM and ypTNM staging (Brierley et al., 2006;
Nagtegaal et al., 2007; Wittekind et al., 2001).
In oncology, precise and reproducible cancer staging is vital for patient management
and surveillance. It allows the stratification of morbidity and mortality risks of
individual patients in order to devise appropriate therapeutic intervention (Hu et al.,
2011). For instance, no adjuvant therapy is required for CRC tumours of pT1-2N0
stage (Puppa et al., 2010). In addition, the tumour stage at the time of diagnosis also
acts as an important prognosticator for cancer outcome, e.g., the overall survival of
CRC patients and risk of CRC recurrences (Compton, 2003; Zlobec and Lugli, 2008).
The 5-year survival is over 90 % among CRC patients of Dukes’ A stage, and reduces
to merely 5 % in those of Dukes’ D stage (Braunwald et al., 2001). For cases of pT4
stage, where the CRC tumours have directly invaded into adjacent organs or perforated
into visceral peritoneum, a worse prognosis and higher risk of local recurrence was
reported (Treanor and Quirke, 2007). As previously noted, there is also a higher
recurrence rate post presumable curative resection for rectal tumours that have
infiltrated into the entire rectal wall and involved nodal metastasis (Domergue et al.,
1989). In summary, the fundamental idea in cancer staging is that the more advanced
the cancer stage (which typically features a deeper bowel wall invasion, as well as
metastatic spread to regional lymph nodes and distal organs), the poorer the patient
prognosis, irrespective of the treatment regime (Gunderson et al., 2010; Hu et al., 2011).

Chapter Two – Literature Review
31
2.2.9 Screening
For decades, CRC remains a constant health threat to world population. Nonetheless, it
is considered as a potentially preventable and curable disease. This is owing to the fact
that most of CRC cases evolve from adenomatous polyps, which are detectable and
removable to prevent subsequent neoplastic transition. In reality, these colonic
adenomas can be detected in about 11 – 40 % of average-risk individuals, and a
significant reduction in CRC risk (75 – 90 %) has been reported following surgical
removal of these preneoplastic lesions (Betes et al., 2003; Levine and Ahnen, 2006;
Winawer et al., 1993). On the other hand, the 5-year survival rate is as high as 90 % in
patients with early stage CRC and thus, CRC is potentially curable if it is detected early
(Braunwald et al., 2001). Hence, the primary goals of CRC screening are to detect and
remove precancerous lesions for cancer prevention, as well as to diagnose early stage
CRC for effective cancer treatment and better patient survival.
On account of its long time frame (2 – 30 years) for the progression from precancerous
adenomas to invasive carcinomas, screening is thus the most important preventive
measure for CRC. A successful screening programme is critical in reducing CRC
mortality by decreasing the incidence rate, as well as detecting CRC at an earlier, more
treatable and potentially curable stage. In most countries, periodic CRC screening is
recommended for both men and women, who are aged 50 years and older, and in an
average risk for developing CRC. As for those with high-risk (e.g., history of colonic
adenomas / CRC, IBDs and inherited genetic disorders), CRC screening is advised at an
earlier age compared to the 50-years-old of the average-risk population (Levin et al.,
2008; Liu et al., 2011; Winawer et al., 2003; Winawer, 2007; World Gastroenterology
Organisation [WGO], 2007).

Chapter Two – Literature Review
32
The World Gastroenterology Organisation formulated guidelines for CRC screening by
proposing several approaches, which conform to the differences in local resources,
cultural preferences and national health policies of different countries worldwide
(World Gastroenterology Organisation [WGO], 2007). According to CRC screening
guidelines developed by the American Cancer Society in collaboration with other
organisations, the widely-available CRC screening methods are categorised into two
distinct groups with different purposes. The cancer detection group is comprised of
tests that primarily detect CRC tumours, while another group for structural
examinations is employed for the detection (and possibly removal) of both precancerous
adenomatous polyps and CRC tumours. The former group includes the guaiac-based
fecal occult blood test (gFOBT), fecal immunochemical test (FIT) and fecal DNA test.
Flexible sigmoidoscopy, colonoscopy, computed tomographic colonography (CTC) and
double-contrast barium enema (DCBE) are categorised under the latter group (Levin et
al., 2008).
Colonoscopy is considered most advantageous over the other methods owing to its high
sensitivity and specificity for direct examination of both adenomatous polyps and CRC
tumours throughout the entire large bowel. It also allows the simultaneous excision of
precancerous polyps and biopsy sampling of CRC tumours. Hence, this approach is
thus far, considered as the ‘gold standard’ in CRC diagnosis and screening,
notwithstanding the existence of several drawbacks, such as greater cost, time-
consuming, need of expertise, patients inconvenience and morbidity risk (Kahi and Rex,
2004; Lieberman and Weiss, 2001; Rex et al., 1997; Winawer et al., 2003; Winawer,
2007).
In fact, CRC screening initiatives are still scarce in certain regions such as Africa, Asia
and South America (American Cancer Society [ACS], 2012a). Despite the availability
of various screening methods and numerous evidences on its leverage, CRC screening

Chapter Two – Literature Review
33
in average-risk population remains lagging when compared to mammography and Pap
testing. The low compliance to CRC screening programme is thought to be contributed
by several factors, i.e., complexity in choosing appropriate screening approaches,
requirement for considerable effort from both healthcare providers and CRC patients, as
well as the unsatisfactory level of public awareness and acceptance related to this
programme (Winawer, 2007).

Chapter Two – Literature Review
34
2.3 Research Background
2.3.1 Part A: SNPs Genotyping via Allelic Discrimination Assays
Cancers are complex genetic diseases and are characterised by the outgrowth of selected
clones of cells which possess selective growth advantages via multiple epigenetic and
genetic alterations (Kotnis et al., 2005). These sequential and cumulative genetic
alterations lead to self-sufficiency in growth signals, insensitivity to growth-control
signals, infinite replicative potential, evasion of apoptosis, sustained angiogenesis, as
well as invasion and metastasis (Hanahan and Weinberg, 2000; Nakao et al., 2012).
Consequently, these hallmark characteristics confer the clones with the ability to
proliferate, expand and grow, which ultimately result in neoplastic progression (Abdel-
Rahman and El-Zein, 2000; Goode et al., 2002). Therefore, the potential cancer
susceptibility gene candidates comprise of xenobiotic metabolism, methylation, DNA
repair, microenvironmental modifier, antitumour immune response, cell cycle check
point and tumour suppressor genes, as well as oncogenes (Houlston and Peto, 2004;
Houlston and Tomlinson, 2001; Kotnis et al., 2005).
According to their biological roles, the potential cancer susceptibility genes are mainly
those categorised as ‘gatekeepers’, ‘caretakers’ and ‘landscapers’ (Kinzler and
Vogelstein, 1998). The ‘caretaker’ genes are responsible in safeguarding and
maintaining the integrity of the human genome, i.e., DNA repair genes and xenobiotic
metabolizing enzymes-encoding genes. Thus, the loss of the function of these
‘caretaker’ genes will lead to hypermutability of the genome (Baak et al., 2003; Kinzler
and Vogelstein, 1998; Kotnis et al., 2005). Since our body cells are constantly exposed
to various carcinogens from both the microenvironment (e.g., hydroxyl radicals and
superoxide anions) and macroenvironment (e.g., viruses, chemical carcinogens and
radiation), the ‘gatekeeper’ genes will come into action by prohibiting cellular

Chapter Two – Literature Review
35
proliferation or inducing apoptosis, if the damaged DNA is not efficiently repaired.
Both oncogenes and tumour suppressor genes are grouped under this category. In fact,
a defect in ‘gatekeeper’ genes is considered rate-limiting in tumourigenesis, as it allows
the genetic errors to pass on to new daughter cells. Therefore, it is predicted that any
mutation or polymorphism that disrupts the biological roles of these genes will lead to
the accumulation of genetic lesions and result in subsequent malignant transformation.
On the other hand, the ‘landscaper’ hypothesis proposes that the disruption of the
microenvironment (i.e., altered stroma) is also important in promoting neoplastic
transformation, especially of epithelial malignancies (Barcellos-Hoff, 2001; Kinzler and
Vogelstein, 1998; Wilson and Bohr, 2007).
In general, cancers can be classified into hereditary and sporadic types. The hereditary
cancers are featured by germline mutations in high-penetrance genes, more often than
not, the tumour suppressor genes and proto-oncogenes, e.g., BRCA1 and BRCA2 (breast
and ovarian cancers), and APC (CRC) (Kotnis et al., 2005). On the other hand,
numerous somatic mutations and / or polymorphisms in low-penetrance genes, as well
as environmental risk factors are the facet of non-hereditary, sporadic cancers (Houlston
and Peto, 2004; Imyanitov et al., 2004). Typically, the development of sporadic cancers
can be elucidated with a polygenic model – a large number of alleles with each
confering a small genotypic risk, combine either additively or multiplicatively in
determining the individual susceptibility to cancer. These gene-gene interactions, in
conjunction with their interaction with endogenous and exogenous carcinogens, will
ultimately contribute to the initiation and progression of sporadic cancers (Houlston and
Peto, 2004). Hereditary cancers only constitute to less than 5 % of all cancer cases,
whilst a vast majority of human cancers arise sporadically without obvious Mendelian-
inheritance patterns. Hence, the searching and identification of prospective low-
penetrance variants are of great significance owing to their high frequency in the

Chapter Two – Literature Review
36
populations (high population attributable risk) and contribution in a high proportion of
cancer cases (Kotnis et al., 2005).
Of all CRC incidences, approximately 5 – 10 % are contributed by defined CRC-
predisposing hereditary syndromes (i.e., FAP and HNPCC syndromes), whereby
germline mutations of high-penetrance genes are thought to underlie the CRC
predisposition (Soreide et al., 2009). This fact is prominently exemplified by
established inherited mutations in the APC and DNA mismatch repair genes (e.g.,
MLH1, MSH2, MSH6 genes) in FAP and HNPCC syndromes, respectively (Kemp et al.,
2004). These rare, high-penetrance mutations exhibit only a small contribution to the
overall disease burden owing to their low allelic frequencies. In typical, their
identification can be performed through linkage analysis and positional cloning as they
tend to result in multiple-cases families (Kotnis et al., 2005). On the other hand, a large
proportion of CRC incidences (88 – 94 %) are evolved sporadically without observable
Mendelian-inheritance pattern, and are not attributed to those recognisable highly-
penetrant genetic variants (Houlston and Tomlinson, 2000; Soreide et al., 2009). This
polygenic, sporadic CRC is multifactorial where both ‘nature’ and ‘nurture’ underlie its
occurrence. It is proposed that the accumulation of multiple low-penetrance variants,
accompanied by the gene-gene interactions, as well as their interactions with
environmental and behavioral risk factors, deciphers the development of sporadic CRC
(Caldecott et al., 1994; de la Chapelle, 2004; Kotnis et al., 2005). In reality, each of
these low-penetrance variants confers only a modest individual risk to CRC, but the risk
is increased substantially through associated gene-gene and gene-environment
interactions.
According to Fearon and Vogelstein (1990), multiple genetic alterations that occur
chronologically over years to decades, underlie the classical, multistep adenoma-
carcinoma sequence in CRC tumourigenesis (Figure 2.10) (Jelonek et al., 2010).

Chapter Two – Literature Review
37
Figure 2.10: The Vogelstein model of adenoma-carcinoma sequence, as well as genomic instability pathways involved in CRC tumourigenesis
(Adapted from Fearon and Vogelstein, 1990; Souglakos, 2007; Worthley et al., 2007).
Environmental Factors
Carcinoma
in situ Metastasis Late
Adenoma
Intermediate
Adenoma
Early
Adenoma
Aberrant
Crypt Foci
Normal
Colonic
Epithelium
Chromosomal Instability (CIN) Pathway
(e.g., del 1p, del 8p, LOH 17p, LOH 18q)
Microsatellite Instability (MSI) Pathway
(e.g., MLH1, MSH2, MSH6)
APC k-RAS DCC, SMAD4, ELF p53
Stromal Events
Epigenetics - CIMP

Chapter Two – Literature Review
38
However, the rate of random mutational events alone is found to be insufficient to
explicate the genetic abnormalities in cancer genome. Thus, it is proposed that the
tumour-specific patterns of genomic imbalances, which confer either the “suppressor”
or “mutator” phenotype to cancer cells, are acquired early in the tumourigenesis of most
human solid tumours including CRC (Loeb, 2001; Loeb et al., 2003; Ried et al., 1999).
As exemplified by the molecular basis of CRC carcinogenesis, the genomic instability
of the cancer genome can be elucidated via two prominent pathways, i.e., chromosomal
instability (CIN) (suppressor) and microsatellite instability (MSI) (mutator) pathways
(Deschoolmeester et al., 2010; Jass, 2007; Soreide, 2007; Soreide et al., 2006) (Figure
2.10). The CIN pathway, which lies beneath 85 % of sporadic CRC cases, is
characterised by mutations of certain oncogenes, e.g., ras, myc and p53 genes. It also
involves the altered functions of genes that engage in mitotic-spindle checkpoint and
sister-chromatids separation pathways, which eventually lead to the gaining or losing of
whole or parts of the chromosomes during cell division. Generally, the structural and
numerical changes of chromosomes such as aneuploidy, allelic losses, translocations
and loss of heterozygosity (LOH), are the hallmark of CIN tumours (Chen et al., 2012;
Fortini and Dogliotti, 2007; Jallepalli and Lengauer, 2001; Leslie et al., 2003; Lindblom,
2001; Liu et al., 2011).
The remaining sporadic CRC cases are accounted for by the MSI pathway. The
inactivation of DNA mismatch repair genes through either frameshift mutations or base-
pair substitutions, ultimately leads to genomic instability (Aquilina et al., 1994; Soreide
et al., 2006). These two distinct pathways are characterised by diverse genetic
alterations that render the development of CRC, different anatomical distribution of
CRC tumours, distinctive pathological and clinical features, varying response to drug
treatment, as well as different prognosis of CRC patients (Popat et al., 2005; Soreide et
al., 2006; Thibodeau et al., 1993; Walther et al., 2009; Walther et al., 2008).

Chapter Two – Literature Review
39
Recently, a third pathway involving epigenetic changes was proposed to underlie CRC
carcinogenesis (Figure 2.10). This pathway greatly differs from both classical CIN and
MSI pathways as the chromosome anomalies and alterations at nucleotide levels are
uncommon (Feinberg et al., 2006; Grady, 2005). There is hypermethylation and
hypomethylation at CpG islands, which eventually leads to the silencing of genes and
increased in genes transcription, respectively (Wong et al., 2007). These aberrant DNA
methylation and altered histone modification patterns confer a CpG Island Methylator
Phenotype (CIMP) to the cancer cells, in which the clinical, pathological and molecular
features are distinctive from those CIN and MSI tumours (Lin et al., 2004; Toyota et al.,
1999; Van Rijnsoever et al., 2003). On the whole, these three pathways are acquired
early in CRC tumourigenesis and act as a pre-requisite for further accumulation of
numerous genetic and epigenetic abnormalities, which then confer survival benefits to
cancer clones, contribute to the neoplastic phenotypes and facilitate tumour progression
(Habermann et al., 2006).
CRC is considered as a common and lethal cancer, but the reality is, it is curable and
preventable if early stage CRC or preneoplastic lesions are detected (Cincin et al., 2012).
In fact, the slow progression rate of CRC carcinogenesis provides a great opportunity
for effective screening of early stage CRC tumours or adenomas to reduce both the
incidence and mortality rates (Winawer, 2007; Winawer et al., 1997). There is a wide
range of methods available for population screening. Nevertheless, each of the methods
has their own strengths and shortcomings, and none of the test is superior over another.
Although colonoscopy remains the “gold standard” in CRC screening and detection to
date, this method is time-consuming, costly, invasive and sometimes, accompanied with
a risk of perforation as well as major bleeding. Moreover, the need for prior vigorous
bowel preparation will also cause discomfort and inconvenience to the patients (Cincin
et al., 2012; Rabeneck et al., 2008; Winawer, 2007). As for other methods, the

Chapter Two – Literature Review
40
unsatisfactory false positive and false negative rates, limited sensitivity and specificity
to certain morphologies and sizes of adenomas, low patient compliance, risk of
morbidity, radioactive exposure risk, as well as the need for expertise personnel are the
main drawbacks (Cincin et al., 2012; Gatto et al., 2003; Imperiale et al., 2004; Rockey
et al., 2005; Toma et al., 2008; Winawer, 2007).
Indeed, an ideal method for population screening should be simple, cost-effective,
highly sensitive and specific, as well as widely-accepted by the public (Winawer, 2007).
Yet, the clinically accessible CRC screening methods at present are subjected to various
limitations (Cunningham et al., 2010). Thus, it is of utmost importance to effectively
risk-stratify the average-risk population in order to avoid unnecessary hassle through an
array of screening and detection procedures, as the CRC population screening is mainly
targeted on asymptomatic (potentially healthy) individuals (Winawer, 2007). Since
CRC is a genetically heterogenous disease where a large proportion of the CRC cases
exhibit different inherited individual susceptibility conferred by multiple common, low-
penetrance variants, the screening of specific genetic fingerprints can potentially be
applied as the foremost step in CRC screening programme for the risk-stratification
purpose (Kemp et al., 2004).
Numerous association studies (case vs control studies) have been performed in order to
identify low penetrance CRC susceptibility variants. It is anticipated that the
identification of these low penetrance CRC susceptibility genes will open up
possibilities for individual cancer risk assessment which in turn permit targeted
screening, as well as individualised preventive measures or therapies in a foreseeable
future (Kemp et al., 2004). Generally, the potential CRC susceptibility candidate genes
may be those of functionally relevance to the initiation, progression, transformation and
metastasis of CRC neoplasms, as depicted in Figure 2.11.

Chapter Two – Literature Review
41
Figure 2.11: Relevant functions of potential low-penetrance susceptibility genes pertaining to CRC carcinogenesis.
Normal
Epithelium
Early
Adenoma
Late
Adenoma
Dukes’
A
Dukes’
B
Dukes’
C
Dukes’
D
Adhesion
Drug Resistance
Angiogenesis
Apoptosis
Signaling
Growth Factors

Chapter Two – Literature Review
42
Theoretically, 99.9 % of the human genome is identical in all human beings, and the
inter-individual variation is accounted by only 0.1 % difference of the genome,
notwithstanding the presence of great phenotypic differences among individuals
(Imyanitov et al., 2004; Venter et al., 2001). The naturally occurring genetic variations
in the DNA sequence, i.e., single nucleotide polymorphisms (SNPs), insertion / deletion
polymorphisms, minisatellite and microsatellite polymorphisms, confer genomic
variability in human. These genetic polymorphisms are differed from mutations in
which it occurs in the ‘normal healthy’ population at a frequency of at least 1 %
(Balasubramanian et al., 2002). In early 2005, an estimated 10 million SNPs were
identified and listed in the NCBI public database, of which 3 – 5 million contribute to
the inter-individual differences among humans (Altshuler and Clark, 2005; Shastry,
2002). A SNP is a single base substitution occurring ubiquitously within both the
coding and regulatory regions in DNA strands, which will regulate the expression of
gene or alter the functions of the encoded gene products (Xue et al., 2011). In reality,
only < 1 % of the SNPs occurs within gene-encoding exons, while the remaining of
them affects the regions that command the expression of genes. Although these low-
penetrance functional polymorphisms do not result in discernible phenotypes as those
disease-causing mutations, it has been demonstrated to be responsible for the inter-
individual differences in disease predisposition, disease severity and outcome, as well as
response to drug / treatment (Hemminki and Shields, 2002; Jiang et al., 2010; Yeatman,
2003). Furthermore, these functional polymorphisms will also impact the gene-gene
and gene-environment interactions, which may in turn, increase or decrease the risk of
developing diseases, i.e., cancers. Over past decades, tremendous efforts were focused
on single nucleotide polymorphisms (SNPs) as the low penetrance variants in
determining individual cancer risk (Hemminki and Shields, 2002; Jiang et al., 2010;
Yeatman, 2003).

Chapter Two – Literature Review
43
2.3.2 Part B: Differential Transcriptome Analysis; and Part C: Differential
Proteome Analysis via A Bottom-Up Proteomics Approach
Notwithstanding continuous improvement via the refinement of staging criteria and
stage subdivision over the years, several limitations in the TNM Staging System still
exist. Though this system is equipped with comprehensive definitions and uniform
rules of application, yet the evaluation of anatomical pathology is greatly dependent on
the expertise of pathologist and subjected to inter-observer variations (Puppa et al.,
2010). Furthermore, the increased complexity of different subcategories within a cancer
stage in its latest version has made the interpretation and stratification of CRC tumours
more arduous and challenging (Doyle and Bateman, 2012; Jessup et al., 2011). The
type, quality and quantity of post-operative resection specimens provided for
pathological assessment will also significantly influence the accuracy and reliability of
this system (Treanor and Quirke, 2007). For example, the number of positive lymph
nodes is essential in nodal stratification, i.e., in distinguishing between pN1 (3 or less)
and pN2 (more than 3) CRC tumours. This is, however, largely dependent on the total
number of lymph nodes harvested for pathological evaluation. It was proposed later, a
standard of 12 lymph nodes to be retrieved for pathological examination in order to
avoid under-staging of nodal involvement (Jass et al., 2008; Sobin and Greene, 2001).
Kotake and co-workers have recently demonstrated the number of retrieved lymph
nodes as an important prognostic factor for Stage II and III CRC (Kotake et al., 2012).
Hence, the accuracy and reliability of TNM Staging System is, in a greater part, relied
on the expertise of surgeons and pathologists.
Although the major background genetic alterations underlying the classical adenoma-
carcinoma sequence in CRC oncogenesis have been established decades ago, the
inadequacy in elucidating the heterogeneity in disease manifestation and severity, as
well as patients prognosis, response to treatment regime and recurrence risk, still exists

Chapter Two – Literature Review
44
in actual clinical settings. Notably, the molecular and clinical heterogeneity of CRC
neoplasms are not merely contributed by these genetic variations alone, but also the
disparity in ensuing transcription of mRNAs and translation of proteins. The effects of
cancer-causing genetic abnormalities are further tangled via their transcription and
translation into a variety of functional proteins, which then pilot the initiation and
progression of neoplasms. The disease phenotypes of CRC, as with other cancers, are
contributed by defective gene products or altered regulation in the gene expression
levels. Hence, molecular profiling, where the activity of genes and proteins is studied,
has become an interesting avenue of research in medical oncology to provide insights
into the pathogenesis, diagnosis, screening, prognostication and therapeutic targets of
CRC at molecular level (Gerling et al., 2003; Liotta and Petricoin, 2000; Nannini et al.,
2009; Soreide et al., 2009).
In this post-genomic era, vast endeavours are focused in transcriptomic and proteomic
profiling of the CRC adenocarcinomas in an attempt to discern disease-specific
alterations (molecular markers / targets), which can be potentially applied to improve
the management and surveillance of CRC patients in future (Figure 2.12) (Nannini et al.,
2009; Nowsheen et al., 2012). Undoubtedly, the integration of gene expression and
proteomic profiling of individual patients, into existing clinical, imaging and
microscopic examinations, is postulated to increase the reliability in CRC detection,
diagnosis, classification and prognostication, as well as recurrence risk prediction,
treatment regime selection and monitoring of response to therapy among CRC patients
(Golub et al., 1999; Nowsheen et al., 2012; Wadlow and Ramaswamy, 2005).

Chapter Two – Literature Review
45
Figure 2.12: Potential clinical applications of molecular profiling in the management and surveillance of CRC patients.
Molecular Profiling
(Gene Expression / Proteomic Profiling)
Molecular Diagnosis Molecular Drug Target
Discovery Molecular Characterization
Screening /
Early Detection /
Disease Classification
Molecular
Staging
Response to
Treatment
Prediction
New Treatment Regime
Prognostication Treatment
Regime
Selection

Chapter Two – Literature Review
46
In light of the completion of the Human Genome Project, approximately 35, 000 genes
are predicted to be present within the human genome. But the fact is, only 1.1 % of
human genome is comprised of protein-coding exons, while another 24 % are intronic
regions and the remaining 75 % are intergenic DNA sequences with unknown function
in RNA transcription and protein translation (Ewing and Green, 2000; Roest Crollius et
al., 2000; Soreide et al., 2009; Venter et al., 2001). Therefore, only a small proportion
of the human genome (< 5 %) is transcribed into RNA molecules and constitutes the
transcriptome of a given cell (Frith et al., 2005).
The term “transcriptome” denotes to a population of transcribed genes or a set of
mRNAs being transcribed by a genome. This includes both unspliced and spliced gene
products that code for proteins. On the other hand, transcriptomic profiling involves the
investigation on global transcriptional activity, and the expression of all encoding genes
(Graveley, 2001; Sperling, 2001). In reality, it is not uncommon that not every gene is
transcriptionally active in all cell types at all time. It was demonstrated that different
cell types possess different compositions of transcriptome, and the gene expression
patterns of a given cell / tissue is differed between its healthy and diseased states. Thus,
it is of great significance to analyse the transcriptomic pattern in providing insights into
the pathogenesis and development of diseases, as certain alternative splicing events only
occur in a specific tissue at a specific time under certain physiological / diseased
conditions (Habermann et al., 2008; Soreide et al., 2009; Su et al., 2002).
“Proteome” refers to a complete set of proteins encoded by a genome or the entirety of
proteins expressed by a genome. In general, proteomic research involves extensive
studies on the protein abundance, post-translational polypeptides modifications, protein-
protein interactions, as well as functional and dynamic processes within cells / tissues
(Gossage et al., 2012; Habermann et al., 2008). Physiologically, the alternative splicing
of pre-mRNAs and RNA editing processes result in multiple protein-encoding

Chapter Two – Literature Review
47
transcripts (mRNA variants) and subsequently, a plethora of proteins and their isoforms
which vary in characteristics and functions (Graveley, 2001; Tyers and Mann, 2003).
Since human proteins are composed of 20 amino acids and possess a three-dimensional
functional structure, the complexity of the human proteome is augmented and cannot be
predicted simply by the blueprints of genetic sequences (Yeatman, 2003). Moreover,
the great diversity of the human proteome is further enhanced by a wide range of post-
translational modifications, i.e., phosphorylation, acetylation, glycosylation, prenylation,
myristoylation, disulfides formation, side chain oxidation, N- and C-terminal sequence
truncations, etc. (Kalia and Gupta, 2005; Khidekel and Hsieh-Wilson, 2004; Nedelkov,
2008).
In comparison to the human genome, the human proteome is in a fluidic state and more
dynamic as the expression of proteins is greatly influenced by the types of cell / tissue,
cellular processes, environmental signals, etc. (Nedelkov, 2008). The expression levels
of proteins are regulated at transcriptional, translational and post-translational levels, i.e.,
dependent on transcription rates, nuclear export and localisation of mRNAs, stability of
transcripts, as well as translational control and regulation of proteins degradation
(Belasco and Brawerman, 1993; Fleck and Nielsen, 2004; Kirschner, 1999; Sonenberg
et al., 2000). Therefore, a multitude of proteomes with different protein compositions
and levels is postulated within a cell or within specific cells / tissues of an organism at
different intervals of various developmental stages / disease conditions (Werner, 2004).
In summary, proteomic profiling involves the study of the structure, function and
expression of all proteins within a cell or tissue as a function of time, age, biological
state and external factors (Gossage et al., 2012; Jiang et al., 2010a).
During a diseased state, both macro- and micro-environmental factors exert impacts on
the pathogenesis by altering gene products or their expression levels. Inevitably, the
transcriptomic and proteomic profiles of the affected cells / tissues are altered and differ

Chapter Two – Literature Review
48
from their normal states (Gerling et al., 2003). The CIN pathway, which is
characterised by nuclear DNA aneuploidy, underlies the genomic imbalances in most of
the sporadic CRC cases. The impact of chromosomal aneuploidy on downstream
cellular transcription level has been proven in several studies (Habermann et al., 2008;
Mao et al., 2003; Phillips et al., 2001; Ried et al., 2012; Upender et al., 2004).
Undoubtedly, the alteration in copy number of the whole chromosome will lead to an
overall increased in the average expression of genes that reside on that particular
chromosome. Furthermore, the expression of a substantial number of genes located on
other diploid chromosomes is also significantly altered in a stochastic manner
(FitzPatrick et al., 2002; Habermann et al., 2006; Phillips et al., 2001). On the other
hand, epigenetic abnormalities in CRC tumours also lead to changes in the chromatin
architecture, which subsequently alter the accessibility of genes for transcription and
affect subsequent expression of genes (Hendrich and Bird, 2000; Klochendler-Yeivin
and Yaniv, 2001). The effects of these transcriptional dysregulation are further
augmented at the protein level by post-translational modifications (Habermann et al.,
2006). The presence of SNPs will also result in different amino acid compositions
within the polypeptide sequences and in turn, affect the folding, processing and function
of the final protein molecules (Nedelkov, 2008). Furthermore, deletions or substitutions
of base pair(s) may produce premature stop codon(s) and as a consequence, the altered
gene is only partially transcribed and the downstream production of the functional
protein is then affected (Baak et al., 2003).
In the aforementioned multistep model of CRC tumourigenesis, different genetic and
epigenetic alterations are acquired at different stages of cancer progression, as some of
them occur early for tumour initiation, while others are involved in the later
progression-related events. The chromosomal aberrations, accompanied by these
sequentially acquired genetic alterations, have resulted in global transcriptional

Chapter Two – Literature Review
49
dysregulation, which gives a distinctive transcriptome and proteome composition in
CRC tumours of different stages. Hence, it is postulated that different transcriptomic
and proteomic patterns at different stages of CRC progression, beginning from the pre-
malignant lesions to invasive tumours, are potentially useful to aid in tumour
classification (Baak et al., 2003; Graveley, 2001; Kalia and Gupta, 2005). In the near
future, a paradigm shift in clinical cancer management is envisioned owing to more
extensive cancer research at the genomic, transcriptomic and proteomic levels.

Chapter Two – Literature Review
50
2.4 Objectives of Study
In present study, we aimed to characterise the primary sporadic CRC tumours of our
local Malaysian CRC patients from the perspective of genomics, transcriptomics and
proteomics with specific objectives as follows:
2.4.1 Part A: SNPs Genotyping via Allelic Discrimination Assays
i) To investigate the potential association of the NOD2/CARD15, XRCC1, EGF
and VEGF genes, as well as the common GWAS-identified CRC-associated
variants, to sporadic CRC susceptibility in the Malaysian CRC patients.
ii) To determine the distribution patterns of the NOD2/CARD15, XRCC1, EGF and
VEGF genetic variants, as well as the common GWAS-identified CRC-
associated variants in the Malaysian population.
2.4.2 Part B: Differential Transcriptome Analysis
i) To identify differentially expressed genes in primary CRC tumours specific to
the Malaysian sporadic CRC patients.
ii) To characterise distinctive gene expression signatures for the early- and
advanced stage sporadic CRC specific to the Malaysian CRC patients.
iii) To complement current growing list of potential molecular candidates that could
be applied to improve the screening, diagnosis and patients’ management of
CRC in future.

Chapter Two – Literature Review
51
2.4.3 Part C: Differential Proteome Analysis via A Bottom-Up Proteomics
Approach
i) To identify the CRC tumour-specific differentially expressed proteins in the
Malaysian sporadic CRC patients.
ii) To characterise the stage-specific differentially expressed proteins in each
different stage of sporadic CRC progression of the Malaysian CRC patients.
iii) To serve as a starting point for the development of custom-fit screening,
diagnostic or treatment scheme to improve the management of our local
Malaysian CRC patients.

Chapter Three – Methodology
52
CHAPTER THREE
METHODOLOGY

Chapter Three – Methodology
53
Research Methodology Overview
SNPs Genotyping via
Allelic Discrimination Assays
Differential Transcriptome
Analysis
Differential Proteome Analysis via
A Bottom-Up Proteomics
Approach
Blood Specimen Collection
Genomic DNA Isolation
Genotyping via TaqMan
5’ Nuclease Assays
Statistical Analysis
Tissue Specimen Collection
Total RNA Isolation
DEGs Identification
Confirmatory Test
Tissue Specimen Collection
Total Protein Isolation
Total Protein Separation via
2-D DIGE
Protein Identification via
LC-MS/MS

Chapter Three – Methodology
54
3.1 Part A: SNPs Genotyping via Allelic Discrimination Assays
3.1.1 Materials
3.1.1.1 Commercialised Reagents, Instruments and Softwares
Item Manufacturer
Reagent
Sucrose AMRESCO (United States)
Triton X-100 Merck (Germany)
Magnesium chloride hexahydrate (MgCl2.6H2O) AMRESCO (United States)
Tris-Hydrochloride (Tris-HCl) AMRESCO (United States)
Ethylenediaminetetraacetic acid (EDTA) AMRESCO (United States)
Sodium dodecyl sulfate (SDS) Bio-Rad Laboratories (United States)
Proteinase K Promega (United States)
Premixed Phenol / Chloroform / Isoamyl alcohol (25:24:1)
solution (~ pH 8.0)
AMRESCO (United States)
Sodium chloride (NaCl) AMRESCO (United States)
Sodium acetate (NaOAc) AMRESCO (United States)
Glacial Acetic acid Merck (Germany)
Absolute ethanol VWR International (United States)
Tris-EDTA (TE) Buffer Promega (United States)
Pre-designed TaqMan SNP Genotyping Assays for Human Applied Biosystems (United States)
Custom TaqMan SNP Genotyping Assays Applied Biosystems (United States)
TaqMan GTXpress Master Mix Applied Biosystems (United States)
Instrument
Implen NanoPhotometer Implen (Germany)
Applied Biosystems 7500 Fast Real-Time PCR System
- Applied Biosystems 7500 software ver. 2.0.5
Applied Biosystems (United States)
Software
TaqMan Genotyper software ver. 1.0.1 Applied Biosystems (United States)

Chapter Three – Methodology
55
3.1.1.2 Miscellaneous Materials
Other required solutions were prepared accordingly, as follows:
i) 1X Cell Lysis Buffer
The 10X Cell Lysis Buffer stock solution was prepared by adding 548 g of Sucrose, 50
ml of Triton X-100, 25 ml of 1 M MgCl2.6H2O and 60 ml of 1 M Tris-HCl (pH 7.5),
into ddH2O to a final volume of 1 L. The stock solution was stored at 4 0C and diluted
to 1X working solution immediately before use.
ii) 5X Proteinase K Buffer
A 750 μl of 5 M NaCl was added to 2.4 ml of 0.5 M EDTA (pH 8.0), and topped up
with ddH2O to a total volume of 10 ml. The prepared solution was then filtered with
0.45 μm syringe filter before aliquoting into 1 ml working solution. All the aliquots
were stored at -20 0C until further use.
iii) 20 % (w/v) SDS
The 20 % (w/v) SDS solution was prepared by dissolving 200 g of SDS in 1 L ddH2O.
The prepared solution was filtered via membrane filtration.
iv) 10 mg/ml Proteinase K
The 10 mg/ml Proteinase K solution was freshly prepared by dissolving 10 mg of
Proteinase K in 1 ml ddH2O.
v) 6 M saturated NaCl
A 35.06 g of NaCl was dissolved slowly in 100 ml of ddH2O and followed by
autoclaving at 121 0C for 15 min. The prepared solution was then kept at room
temperature.

Chapter Three – Methodology
56
vi) 2 M NaOAc (pH 5.6)
A 16.41 g of NaOAc was dissolved in 100 ml of ddH2O to form a 2 M NaOAc solution.
The pH was then adjusted to 5.6 with Glacial Acetic acid. Finally, the prepared solution
was autoclaved at 121 0C for 15 min, and stored at room temperature.
vii) 70 % (v/v) ethanol
A 100 ml of 70 % (v/v) ethanol was prepared by adding 70 ml of absolute ethanol with
30 ml of ddH2O.

Chapter Three – Methodology
57
3.1.2 Methods
3.1.2.1 Sample Recruiting Criteria
The recruited cases were newly-diagnosed sporadic CRC patients from both University
Malaya Medical Centre (UMMC) in Kuala Lumpur, and Queen Elizabeth Hospital in
Sabah, Malaysia. The patients were aged between 40 – 90 years and manifested
different stages of disease progression, ranging from CRC Stage I to Stage IV. The
confirmed diagnosis and accurate staging of CRC patients were based on their
histopathological reports, CT scanning images and serum CEA levels, as well as
morphological evaluations during surgical resection. All CRC cases were ruled out
from any hereditary CRC syndrome, cancer history or family history of CRC.
Concurrently, age-matched healthy controls, who were CRC-free at the time of
sampling, were also randomly recruited for this study.
3.1.2.2 Blood Specimen Collection
Ethical approval was obtained from the Medical Ethics Committee of UMMC (Ref. No.:
654.1) and the collection of blood samples was carried out in both institutions with
written informed consent from all volunteers. In total, 130 CRC patient and 212 normal
healthy control blood samples were collected. The blood specimens were collected in 3
ml Vacutainer Blood Collection Tubes with spray-coated Potassium-EDTA (K2EDTA)
(Becton, Dickinson and Company, United States). The whole blood samples were then
stored at -20 0C for further application.

Chapter Three – Methodology
58
3.1.2.3 Genomic DNA Isolation
The extraction of human genomic DNA from blood samples was performed via a
conventional phenol-chloroform DNA extraction method. This is a liquid-liquid
extraction method, where a mixture of biomolecules is separated based on their different
solubility in two different immiscible liquids. Through this method, DNA molecules
are solubilised in the upper hydrophilic layer, and the lipids dissolved in the bottom
hydrophobic organic phase; while the proteins and carbohydrates precipitate at the
interface between the two phases. Typically, a premixed solution containing phenol,
chloroform and isoamyl alcohol is used. The mixture of phenol and chloroform is more
efficient in protein denaturation, whereas the addition of isoamyl alcohol is to prevent
foaming (Tan and Yiap, 2009). In our current study, both the concentration and purity
of the extracted genomic DNA were determined via the Implen NanoPhotometer with
ultra-low volume of samples, e.g., 0.7 – 10 μl, when compared to common
spectrophotometers (Implen, Germany).
3.1.2.3(a) Phenol-Chloroform DNA Extraction
Genomic DNA was isolated from blood samples via an in-house phenol-chloroform
DNA extraction protocol. First, 6 ml of whole blood was added with 40 ml of 1X Cell
Lysis Buffer and vortexed for 1 min. The mixture was centrifuged at 3, 850 x g for 10
min at 10 0C and the resulted supernatant was discarded. Next, the pellet was
resuspended in another 20 ml of 1X Cell Lysis Buffer and followed by centrifugation at
3, 850 x g for 10 min at 10 0C. The supernatant was discarded while the pellet was left
to dry for 1 min. Subsequently, 160 μl of 5X Proteinase K Buffer, 40 μl of 20 % (w/v)
SDS, 40 μl of 10 mg/ml Proteinase K and 200 μl of ddH2O were added to the pellet.
The mixture was vortexed briefly and incubated overnight at 37 0C.

Chapter Three – Methodology
59
On the second day, 800 μl of premixed Phenol / Chloroform / Isoamyl alcohol (25:24:1)
solution (~ pH 8.0) was added. The tube was shaken gently until the mixture became
homogenous, and centrifuged later at 16, 060 x g at 10 0C for 15 min to allow a biphasic
emulsion. Subsequently, the upper clear, hydrophilic aqueous layer was transferred to a
new 1.5 ml microcentrifuge tube, and 200 μl of 6 M saturated NaCl, 40 μl 2 M NaOAc
of pH 5.6 and 900 μl of chilled absolute ethanol were added. The mixture was then
incubated overnight at -70 0C for DNA precipitation. On the third day, the supernatant
was discarded and the pellet was rinsed with 1 ml of 70 % (v/v) ethanol to remove the
excess salt after centrifugation at 16, 060 x g for 5 min at 4 0C. The tube was
centrifuged again at similar conditions and the ethanol supernatant was discarded.
Finally, the resulting DNA pellet was air-dried, resuspended in 100 μl of TE Buffer and
stored at -70 0C.
3.1.2.3(b) DNA Concentration and Purity Assessment
In general, the concentration and purity of DNA can be assessed by applying a
spectrophotometric method owing to its maximum absorbance at wavelength within the
ultraviolet range of 260 nm. According to the Beer-Lambert Law, a reading of 1.0 at
260 nm corresponds to 50 μg/ml of double-stranded DNA (dsDNA) in 1 cm of
pathlength.
dsDNA concentration (μg/ml) = A260 x 50 μg/ml x dilution factor
The A260 reading in conjunction with the measurement of absorbance at wavelengths
of 280 nm and 230 nm were used to determine the DNA purity. The A260/A280 ratio
of less than 1.8 indicates protein contamination in the DNA sample because the
aromatic ring structures on the amino acids absorb at a wavelength of 280 nm. The
ratio of A260/A230 is, on the other hand, another indicator for DNA purity. Certain
organic compounds such as carbohydrates, EDTA, phenol, as well as salts, absorb at a

Chapter Three – Methodology
60
wavelength of 230 nm. Hence, the lower the A260/A230 ratio, the more organic
contaminants and salts carryover in the DNA sample (Sambrook and Russell, 2001). In
our study, only DNA samples with good purity (A260/A280 ratio of 1.8 – 2.0; and
A260/A230 ratio of 2.0 – 2.2) were subjected for subsequent SNP genotyping.
3.1.2.4 Genotyping via TaqMan 5’ Nuclease Assays
A total of 15 SNPs were genotyped using Applied Biosystems TaqMan SNP
Genotyping Assays (Applied Biosystems, United States) via the Applied Biosystems
7500 Fast Real-Time PCR System. The Applied Biosystems 7500 software ver. 2.0.5
was used to monitor and execute the PCR reactions, whilst the TaqMan Genotyper
software ver. 1.0.1 was employed for genotyping data analysis.
3.1.2.4(a) qPCR
Of the 15 SNPs, 13 were genotyped with Pre-designed TaqMan SNP Genotyping
Assays for Human, while the remaining 2 with Custom TaqMan SNP Genotyping
Assays. The Assays ID, PCR primers and TaqMan MGB probes sequences are listed in
Table 3.1.

Chapter Three – Methodology
61
Table 3.1: Assays ID, PCR primers and TaqMan MGB probes sequences used for the
genotyping of 15 SNPs.
Gene
SNP
Variant
Nucleotide
Substitution
Assay ID /
Primers and Probes Sequence
Pre-designed TaqMan SNP Genotyping Assay
NOD2/
CARD15
Gly908Arg G>C C_11717466_20
([V]: Allele C; [F]: Allele G)
Pro268Ser C>T C_11717470_20
([V]: Allele C; [F]: Allele T)
Arg702Trp C>T C_11717468_20
([V]: Allele C; [F]: Allele T)
Chr. 11q23.1 rs3802842 C>A C_27503482_10
([V]: Allele A; [F]: Allele C)
Chr. 18q21.1 rs4939827 T>C C_27913406_10
([V]: Allele C; [F]: Allele T)
Chr. 8q24.21 rs6983267 G>T C_29086771_20
([V]: Allele G; [F]: Allele T)
Chr. 15q13.3 rs4779584 C>T C_28019826_10
([V]: Allele C; [F]: Allele T)
Chr. 8q23.3 rs16892766 A>C C_32670283_10
([V]: Allele A; [F]: Allele C)
EGF rs4444903 G>A C_27031637_10
([V]: Allele A; [F]: Allele G)
VEGF rs3025039 C>T C_16198794_10
([V]: Allele C; [F]: Allele T)
XRCC1
rs1799782 C>T C_11463404_10
([V]: Allele T; [F]: Allele C)
rs25487 G>A C_622564_10
([V]: Allele G; [F]: Allele A)
rs25489 G>A C_622570_10
([V]: Allele G; [F]: Allele A)
Custom TaqMan SNP Genotyping Assay
NOD2/
CARD15
JW1
C>T
Primer (F): 5’- TGG AGT AAG GAA AAA
AGA CCA TTG GAT T-3’
Primer (R): 5’- GAG GAC AAG GGA CAT TTC
CAA GT-3’
VIC-Probe: 5’- CAG AAA GAC TCG AGT
GTC-3’
6-FAM-Probe: 5’- CAG AAA GAC TCA AGT
GTC-3’
3020insC
Wild-type /
insC
Primer (F): 5’- GTC CAA TAA CTG CAT CAC
CTA CCT-3’
Primer (R): 5’- ACT TCC AGG ATG GTG TCA
TTC C-3’
VIC-Probe: 5’- CCT GCA GGC CCT TG-3’
6-FAM-Probe: 5’- CTG CAG GCC CCT TG-3’
*[V] = VIC-Probe, [F] = 6-FAM-Probe

Chapter Three – Methodology
62
Typically, each of these pre-formulated single-tube SNP Genotyping Assays comprised
of a pair of unlabelled PCR primers and two allele-specific TaqMan MGB probes in a
40X stock concentration (Table 3.2). These made-to-order TaqMan SNP Genotyping
Assays were specifically designed for universal thermal cycling conditions, in
conjunction with Applied Biosystems TaqMan Genotyping Master Mix (Applied
Biosystems, United States) for highly accurate, reproducible and reliable genotyping
results.
Table 3.2: Constituents of TaqMan SNP Genotyping Assay.
Component Concentration
Forward Primer 36 μM
Reverse Primer 36 μM
6-FAM dye-labelled TaqMan MGB Probe 8 μM
VIC dye-labelled TaqMan MGB Probe 8 μM
We used both TaqMan GTXpress Master Mix and Applied Biosystems 7500 Fast Real-
Time PCR System for fast SNP genotyping. The total PCR reaction time is halved,
when compared to typical standard genotyping protocols, as illustrated in Table 3.3.
The fast PCR reactions for all 15 SNPs were performed using the same universal
thermal cycling conditions (Table 3.3) with universal reaction components
concentration (Table 3.4), as specified by the manufacturer.

Chapter Three – Methodology
63
Table 3.3: Universal thermal cycling protocol for fast genotyping on Applied
Biosystems 7500 Fast Real-Time PCR System.
Stage Step Temperature Time
Holding DNA Polymerase Activation 95 0C 20 sec
Cycling
(40 cycles)
Denaturation 95 0C 3 sec
Annealing / Extension 60 0C 30 sec
Table 3.4: PCR reaction components for fast genotyping.
Reaction Component Volume (μl)
2X TaqMan GTXpress Master Mix 5.0
20X TaqMan SNP Genotyping Assay 0.5
20 ng/μl DNA Template 1.0
ddH2O 3.5
Total Volume 10.0
3.1.2.4(b) Genotyping Data Analysis
Following qPCR, the raw genotyping data obtained were analysed via TaqMan
Genotyper software ver. 1.0.1. The data files of different qPCR runs of each 15 SNPs
were imported, compiled and analysed together under 15 different SNP studies created
within the software. Subsequently, all data points were called into different genotypes
with the software algorithm through a ‘Autocalling’ method, and displayed as scatter
plots for visualisation. The genotype calls were reviewed carefully for confirmation and
sometimes, ‘Manual Calling’ was performed if any of the calls were incorrect.

Chapter Three – Methodology
64
3.1.2.5 Statistical Analysis
Both genotype and allele frequencies of the 15 SNPs were calculated for all the CRC
patients and healthy controls. The observed genotype frequencies were then verified for
concordance to Hardy-Weinberg Equilibrium (HWE) by calculating the expected
frequencies and significance testing with the Pearson’s Chi-squared (χ2) test. The
significance of observed differences in genotype and allele frequencies between CRC
patients and healthy controls was assessed with the Fisher’s Exact Test, where a p value
of less than 0.05 is considered significant. In addition, the odds ratio (OR) was also
determined with 95 % confidence interval (CI) (Xue et al., 2011).

Chapter Three – Methodology
65
3.2 Part B: Differential Transcriptome Analysis
3.2.1 Materials
3.2.1.1 Commercialised Reagents and Kits
Chemical / Reagent / Kit Manufacturer
Section 3.2.2.2 – Tissue Specimen Collection
RNAlater RNA Stabilization Reagent
QIAGEN (Germany)
Section 3.2.2.3 – Total RNA Isolation
RNeasy Plus Mini Kit
Absolute ethanol
40 U/μl ScriptGuard RNase Inhibitor
RNA 6000 Nano Kit for Eukaryote Total RNA
QIAGEN (Germany)
VWR International (United States)
Epicentre Biotechnologies (United States)
Agilent Technologies (United States)
Section 3.2.2.4 – DEGs Identification
GeneFishing DEG 101 & 102 Premix Kit
(ACP1 – 20)
5X RT Buffer
200 U/μl M-MLV Reverse Transcriptase
Agarose
10X Tris-Borate-EDTA (TBE) Buffer
Ethidium bromide
PureLink Quick Gel Extraction Kit
TOPO TA Cloning Kit for Sequencing
Difco Lysogeny Broth (LB) Agar, Lennox
Ampicillin
Difco LB Broth, Lennox
10X Taq Buffer with Potassium chloride (KCl)
25 mM Magnesium chloride (MgCl2)
Seegene (Korea)
Mbiotech (Korea)
Mbiotech (Korea)
Promega (United States)
Invitrogen (United States)
Promega (United States)
Invitrogen (United States)
Invitrogen (United States)
Becton, Dickinson and Company
(United States)
Merck (Germany)
Becton, Dickinson and Company
(United States)
Fermentas (Canada)
Fermentas (Canada)

Chapter Three – Methodology
66
Chemical / Reagent / Kit Manufacturer
10 mM Deoxyribonucleotide triphosphate
(dNTP) mix
5 U/μl Taq DNA Polymerase (recombinant)
PureLink Quick Plasmid Miniprep Kit
Fermentas (Canada)
Fermentas (Canada)
Invitrogen (United States)
Section 3.2.2.5 – Confirmatory Test
0.5 μg/μl Oligo(dT)12-18 Primer
5X First Strand Buffer
40 U/μl RNaseOUT Recombinant RNase
Inhibitor
200 U/μl M-MLV Reverse Transcriptase
Custom TaqMan Gene Expression Assays
TaqMan Gene Expression Master Mix
Pre-developed TaqMan Endogenous Control
Assays
Invitrogen (United States)
Invitrogen (United States)
Invitrogen (United States)
Invitrogen (United States)
Applied Biosystems (United States)
Applied Biosystems (United States)
Applied Biosystems (United States)

Chapter Three – Methodology
67
3.2.1.2 Instruments and Services
Instrument / Service Manufacturer /
Service Provider
1.5 ml pellet pestle with cordless motor Kimble Chase (United States)
Agilent 2100 Bioanalyzer
- Agilent 2100 Expert software ver. B.02.07.SI532
Agilent Technologies (United States)
IKA MS 3 Chip Vortexer IKA (Germany)
Eppendorf Mastercycler Gradient Thermal Cycler Eppendorf (Germany)
Applied Biosystems 7500 Fast Real-Time PCR System
- Applied Biosystems 7500 software ver. 2.0.5
Applied Biosystems (United States)
Single Pass DNA Sequencing Service 1st BASE Pte Ltd (Malaysia)
3.2.1.3 Softwares
Software Manufacturer
BioEdit software ver. 7.0.9 Ibis Biosciences (United States)
Basic Local Alignment Search Tool (BLAST)
programme
National Institutes of Health
(United States)
Integromics RealTime StatMiner software ver. 4.2.8 Integromics (Spain)

Chapter Three – Methodology
68
3.2.1.4 Miscellaneous Materials
Other required materials were prepared accordingly, as follows:
i) 70 % (v/v) ethanol
A 100 ml of 70 % (v/v) ethanol solution was prepared by adding 70 ml of absolute
ethanol with 30 ml of ddH2O.
ii) 2 mM dNTP mix
A 1 in 5 dilution was performed on commercially-available 10 mM dNTP mix to obtain
a concentration of 2 mM.
iii) 3 % (w/v) agarose gel
Three grams of agarose powder was dissolved in 100 ml of 1X TBE Buffer. The
mixture was heated until it became homogenous.
iv) LB plate containing 50 μg/ml Ampicillin
A 35 g of LB Agar powder was dissolved in 1 L of ddH2O, and autoclaved at 121 0C for
15 min. The solution was allowed to cool down to 50 0C before the addition of 50
μg/ml Ampicillin. Subsequently, the Ampicillin-containing LB medium was poured
onto Petri dishes and left to solidify at room temperature. The prepared LB plates were
kept at 4 0C.
v) LB
The LB was prepared by dissolving 20 g of commercialised LB Broth powder in 1 L of
ddH2O, and followed by autoclaving at 121 0C for 15 min. Next, 50 μg/ml of
Ampicillin was added once it was cooled down. The LB was then aliquoted into 20 ml
each and stored at 4 0C.

Chapter Three – Methodology
69
3.2.2 Methods
3.2.2.1 Patient Characteristics
The recruited CRC patients were those who presented with newly-diagnosed disease in
the absence of previous history of cancer or family history of CRC. All volunteered
patients were ruled out for possible hereditary CRC syndromes by gastroenterologists.
In addition, the patients were not subjected to any chemo- or radiotherapy prior to tissue
specimen collection. Our cohort of samples consisted of CRC patients aged between 40
– 86 years old. These patients, who presented with early stage CRC of Dukes’ A and B,
were included for the identification of DEGs. As for the confirmatory test, the recruited
CRC patient samples exhibited all stages of cancer progression, ranging from Dukes’ A
– D (Stages I – IV). The accurate diagnosis and staging of all CRC patients were
performed by experienced surgeons and oncologists by taking into consideration the
histopathological reports, CT scanning images, morphological evaluations during
surgery and serum CEA levels.
3.2.2.2 Tissue Specimen Collection
The preliminary study of the identification of DEGs comprised of four paired colonic
tissue specimens, whilst a total of 27 paired samples were included for subsequent
confirmatory tests. In the confirmatory tests, the paired samples were further stratified
into early stage (Stages I and II) and late stage (Stages III and IV) CRC groups, with 13
and 14 sample pairs, respectively. All paired colonic samples were collected from
voluntary CRC patients who underwent surgical resection in UMMC with written
informed consent. Ethical approval had been obtained from the Medical Ethics
Committee, UMMC (Ref. No.: 654.1) prior to specimen collection. Both CRC tumours
and normal colonic mucosa specimens were obtained from volunteered CRC patients by
experienced gastrointestinal surgeons during surgery. The CRC specimens were

Chapter Three – Methodology
70
excised from the dissected tumours, whereas the paired normal tissues were obtained
from macroscopically normal colonic mucosa, distal to the tumours. All the tissue
specimens were submerged completely in the RNAlater RNA Stabilization Reagent
immediately after excision and incubated overnight at 4 0C for fully immersion.
Subsequently, the tissues were stored at -80 0C for archival storage. This reagent
efficiently preserves the integrity of RNA and enables reliable gene expression analysis,
without the need of inconvenient and equipment-intensive sample processing steps,
such as snap-freezing in liquid nitrogen and immediate processing of harvested tissue
samples.
3.2.2.3 Total RNA Isolation
3.2.2.3(a) RNA Extraction
Total RNA was extracted from both CRC tumours and normal colonic tissues via
commercially-available RNeasy Plus Mini Kits. These column-based total RNA
extraction kits are capable of isolating high yield of total RNA, with the enrichment of
mRNAs since most rRNAs and tRNAs (< 200 nucleotides) were selectively excluded.
Moreover, the specifically designed gDNA Eliminator spin column enables effective
elimination of possible genomic DNA contamination. Initially, 30 mg of RNAlater-
stabilised tissue was excised and homogenised in 600 μl of Buffer RLT Plus by using a
disposable 1.5 ml pellet pestle with cordless motor. The lysate was then centrifuged at
17, 000 x g for 3 min, and the supernatant was transferred to the gDNA Eliminator spin
column. Next, the tube was centrifuged at 13, 800 x g for 30 sec. The flow-through
was added with 1 volume of 70 % (v/v) ethanol and mixed well. Seven hundred
microlitres of sample was then transferred to an RNeasy spin column, followed by
centrifugation at 13, 800 x g for 15 sec. Subsequently, 700 μl of Buffer RW1 was
added to the column and centrifuged for 15 sec at 13, 800 x g. The column was then

Chapter Three – Methodology
71
added with 500 μl of Buffer RPE and centrifuged at 13, 800 x g for a further 15 sec.
Later, 500 μl of Buffer RPE was added again to the spin column and centrifuged at 13,
800 x g for 2 min. The tube was centrifuged at full speed for 1 min following the
placement of RNeasy spin column in a new 2 ml collection tube. Finally, the purified
total RNA was eluted by adding 30 μl of RNase-free water and centrifuging for 1 min at
13, 800 x g. The extracted total RNA was stored at -80 0C following the addition of 1
μl of 40 U/μl ScriptGuard RNase Inhibitor.
3.2.2.3(b) RNA Concentration and Integrity Assessment
The concentration and purity of isolated total RNA were subsequently ascertained via
the Agilent 2100 Bioanalyzer in conjunction with RNA 6000 Nano Kit for Eukaryote
Total RNA. This assay was performed according to the manufacturer’s protocol as
described herewith. The Agilent 2100 Expert software ver. B.02.07.SI532 was utilised
to conduct the measurement, as well as view and analyse the data obtained. This Lab-
on-a-Chip technology is able to quantitate 25 – 500 ng/µl of total RNA and measure the
RNA integrity by determining the RNA Integrity Number (RIN) value. The RIN
algorithm across a ten-point scale is used for unambiguous integrity assessment of RNA
samples. This is especially important for comparative analysis where the intactness of
RNA across samples will greatly influence the results observed (Fleige and Pfaffl,
2006). For accurate analysis, the RNA samples with RIN value of 8.0 – 10.0 and rRNA
ratio [28S/18S] of 1.5 – 2.5 were selected for subsequent experiments.
3.2.2.3(b)(i) Set Up of Chip Priming Station and Bioanalyzer
First, a new syringe was inserted into the clip, slid into the luer lock adapter and
screwed tightly onto the chip priming station. The base plate of the chip priming station
was then lifted to position C, while the syringe clip was placed at the top position.

Chapter Three – Methodology
72
Subsequently, the chip selector within the Agilent 2100 Bioanalyzer was adjusted to
position (1).
3.2.2.3(b)(ii) Preparation of Gel and Gel-Dye Mix
The RNA 6000 Nano Gel Matrix was pipetted into a spin filter and centrifuged at 1, 500
x g for 10 min under room temperature. The filtered gel was aliquoted into 0.5 ml
RNase-free microfuge tubes. On the other hand, the RNA 6000 Nano Dye Concentrate
was allowed to equilibrate to room temperature for 30 min and vortexed for 10 sec.
Next, 1 µl of dye was added into 65 µl of gel aliquot. The solution was vortexed and
centrifuged under room temperature at 13, 000 x g for 10 min.
3.2.2.3(b)(iii) Loading of RNA 6000 Nano Chip
Initially, a new RNA 6000 Nano Chip was placed on the chip priming station. Nine
microlitres of gel-dye mix was pipetted into well marked . The priming station was
closed with the plunger positioned at 1 ml. Next, the plunger was pressed down until it
was held by the clip. The clip was then released after 30 sec and slowly pulled back to
the position of 1 ml after 5 sec. Another 9 µl of gel-dye mix was loaded into each of the
two wells marked . Following gel priming, the RNA 6000 Nano Marker, RNA 6000
Nano Ladder and RNA samples were loaded into the chip. The RNA 6000 Nano
Marker was pipetted into all 12 sample wells and the well marked , with 5 µl each.
One microlitre of heat-denatured RNA 6000 Nano Ladder was then pipetted into the
well marked . Subsequently, 1 µl of RNA sample was loaded into each sample well.
Finally, the chip was vortexed horizontally at 2, 400 rpm for 1 min with the use of IKA
MS 3 Chip Vortexer. The chip was then placed in the Agilent 2100 Bioanalyzer for
analysis.

Chapter Three – Methodology
73
3.2.2.4 DEGs Identification
The characterisation and identification of DEGs in CRC tumours, compared to normal
colonic mucosa, was performed via two-step ACP-based PCR with commercially-
available GeneFishing DEG 101 & 102 Premix Kit (ACP1 – 20). This technology
increases the specificity of primers annealing, and thus allows target-specific PCR
amplification (Hwang et al., 2003).
3.2.2.4(a) First-strand Complementary DNA (cDNA) Synthesis
The isolated total RNA was subjected to reverse transcription for the synthesis of first-
strand cDNA. This step was carried out according to the manufacturer’s protocol in the
GeneFishing DEG 101 & 102 Premix Kit (ACP1 – 20), as follows: 3 µg of total RNA
was added with 2 µl of 10 µM dT-ACP1 (Table 3.5) and RNase-free water to a final
volume of 9.5 µl. The reagents was mixed by tapping and incubated at 80 0C for 3 min.
Next, the tube was chilled on ice for 2 min and spun down briefly. The mixture was
then added with 4 µl of 5X RT Buffer, 5 µl of 2 mM dNTP mix, 0.5 µl of 40 U/µl
ScriptGuard RNase Inhibitor and 1 µl of 200 U/µl M-MLV Reverse Transcriptase. The
tube was incubated at 42 0C for 90 min, followed by 94
0C for 2 min and chilled on ice
for another 2 min. Finally, the tube was spun briefly before adding 70 µl of DNase-free
water to dilute the synthesised first-strand cDNA. The cDNA was stored at -20 0C until
further application.

Chapter Three – Methodology
74
3.2.2.4(b) ACP-based GeneFishing PCR
The characterisation of DEGs was carried out via ACP-based PCR with 20 arbitrary
ACPs (ACP1 – 20), as listed in Table 3.5.
Table 3.5: Arbitrary ACP1 – 20, dT-ACP1 and dT-ACP2 primers in GeneFishing DEG
101 & 102 Premix Kit.
Primer Sequence
Arbitrary ACP1 5’-GTCTACCAGGCATTCGCTTCATXXXXXGCCATCGACC-3’
Arbitrary ACP2 5’-GTCTACCAGGCATTCGCTTCATXXXXXAGGCGATGCC-3’
Arbitrary ACP3 5’-GTCTACCAGGCATTCGCTTCATXXXXXCCGGAGGATG-3’
Arbitrary ACP4 5’-GTCTACCAGGCATTCGCTTCATXXXXXGCTGCTCGCG-3’
Arbitrary ACP5 5’-GTCTACCAGGCATTCGCTTCATXXXXXAGTGCGCTCG-3’
Arbitrary ACP6 5’-GTCTACCAGGCATTCGCTTCATXXXXXGGCCACATCG-3’
Arbitrary ACP7 5’-GTCTACCAGGCATTCGCTTCATXXXXXCTGCGGATCG-3’
Arbitrary ACP8 5’-GTCTACCAGGCATTCGCTTCATXXXXXGGTCACGGAG-3’
Arbitrary ACP9 5’-GTCTACCAGGCATTCGCTTCATXXXXXGATGCCGCTG-3’
Arbitrary ACP10 5’-GTCTACCAGGCATTCGCTTCATXXXXXTGGTCGTGCC-3’
Arbitrary ACP11 5’-GTCTACCAGGCATTCGCTTCATXXXXXCTGCAGGACC-3’
Arbitrary ACP12 5’-GTCTACCAGGCATTCGCTTCATXXXXXACCGTGGACG-3’
Arbitrary ACP13 5’-GTCTACCAGGCATTCGCTTCATXXXXXGCTTCACCGC-3’
Arbitrary ACP14 5’-GTCTACCAGGCATTCGCTTCATXXXXXGCAAGTCGGC-3’
Arbitrary ACP15 5’-GTCTACCAGGCATTCGCTTCATXXXXXCCACCGTGTG-3’
Arbitrary ACP16 5’-GTCTACCAGGCATTCGCTTCATXXXXXGTCGACGGTG-3’
Arbitrary ACP17 5’-GTCTACCAGGCATTCGCTTCATXXXXXCAAGCCCACG-3’
Arbitrary ACP18 5’-GTCTACCAGGCATTCGCTTCATXXXXXCGGAGCATCC-3’
Arbitrary ACP19 5’-GTCTACCAGGCATTCGCTTCATXXXXXCTCTGCGAGC-3’
Arbitrary ACP20 5’-GTCTACCAGGCATTCGCTTCATXXXXXGACGTTGGCG-3’
dT-ACP1 5’-CTGTGAATGCTGCGACTACGATXXXXX(T)18-3’
dT-ACP2 5’-CTGTGAATGCTGCGACTACGATXXXXX(T)15-3’

Chapter Three – Methodology
75
First, all four cDNA samples within each CRC and normal control group were pooled
together in equal amount. The 20 µl reagent mixture containing 50 ng of diluted first-
strand cDNA, 2 µl of 5 µM arbitrary ACP, 1 µl of 10 µM dT-ACP2 (Table 3.5), 10 µl
of 2X SeeAmp ACP Master Mix and ddH2O was prepared. Subsequently, the two-step
PCR amplification was commenced in accordance to the manufacturer’s protocol and
thermal cycling conditions (Table 3.6) of the GeneFishing DEG 101 & 102 Premix Kit
(ACP1 – 20), on an Eppendorf Mastercycler Gradient Thermal Cycler. The second-
strand cDNA was synthesised briefly during the first-stage PCR, and amplified in the
second-stage PCR. Finally, the amplified products were visualised on 3 % (w/v)
ethidium bromide-stained agarose gels. The differentially expressed bands between
CRC and normal control samples were observed by comparing the intensity of bands
through visual inspection.
Table 3.6: Thermal cycling conditions for the two-steps ACP-based PCR amplification.
PCR Temperature Duration No. of Cycle(s)
First-stage
94 0C
50 0C
72 0C
5 min
3 min
1 min
1
Second-stage
94 0C
65 0C
72 0C
40 sec
40 sec
40 sec
40
Final Extension Step 72 0C 5 min 1

Chapter Three – Methodology
76
3.2.2.4(c) Gel Extraction
The observed differentially expressed bands were extracted from the agarose gel by
using commercially-available PureLink Quick Gel Extraction Kit. This gel extraction
kit enables the purification of DNA fragments, ranging from 40 bp to 10 kb in size,
from both low- and high-melting point agarose gels. First, the area of gel containing the
desired DNA fragment was cut with a clean blade and weighed. The Gel Solubilization
Buffer was then added depending on the weight of gel slice, with 60 μl for every 10 mg
of gel. Subsequently, the gel piece in buffer was incubated at 50 0C for 15 min, and
followed by another 5 min after the gel slice had dissolved. The tube was mixed every
5 min during the incubation period to ensure complete gel dissolution. The dissolved
gel piece was then loaded into a Quick Gel Extraction Column and centrifuged at 13,
000 x g for 1 min. Next, the flow-through was discarded and 500 μl of Gel
Solubilization Buffer was added to the column. The tube was then incubated at room
temperature for 1 min and centrifuged at 13, 000 x g for 1 min. The flow-through was
discarded prior to the addition of 700 μl Wash Buffer W9. The flow-through was
discarded after incubation at room temperature for 5 min and centrifugation at 13, 000 x
g for 1 min. Before the elution step, the tube was centrifuged for another 1 min at 13,
000 x g to remove any residual Wash Buffer W9. Lastly, the purified DNA was eluted
from the silica membrane by adding 30 μl of 68 0C TE Buffer, followed by incubating
at room temperature for 1 min and centrifuging at 13, 000 x g for 2 min. The purified
DNA was stored at -20 0C for successive applications.

Chapter Three – Methodology
77
3.2.2.4(d) Molecular Cloning Strategy
The cloning of desired differentially expressed bands was performed by using the
commercially-available TOPO TA Cloning Kit for Sequencing. This kit contains the
OneShot TOP10 Chemically Competent E. coli and pCR4-TOPO plasmid vector. The
pCR4-TOPO enables direct selection of successful recombinants without the need of
blue / white screening. The ligation of targeted DNA fragment would disrupt the
expression of lacZα-ccdB gene fusion, which then permits the growth of positive
recombinant clones only upon transformation into TOP10 cells. First, 4 μl of purified
DNA fragment was added with 1 μl of salt solution (1.2 M NaCl and 0.06 M MgCl2)
and 1 μl of pCR4-TOPO vector. The mixture was then mixed and incubated for 5 min
at room temperature. Next, 2 μl of this TOPO cloning reaction mixture was added into
a vial of OneShot TOP10 Chemically Competent E. coli and mixed gently. The tube
was incubated on ice for 30 min, heat-shocked at 42 0C for 30 sec without shaking and
again, transferred to ice immediately. Subsequently, 250 μl of room temperature S.O.C.
medium was added to the tube and shaken horizontally at 200 rpm for 1 hour at 37 0C.
A 50 μl of transformation mixture was then spread on pre-warmed selective LB plate
containing 50 μg/ml Ampicillin, and incubated overnight at 37 0C. Finally, 10 of the
resulting colonies were picked and diluted individually in 10 μl of ddH2O. Successful
transformation was then confirmed by PCR screening using both M13F(-20) and
M13R-pUC(-26) primers, on Eppendorf Mastercycler Gradient Thermal Cycler. The
PCR reaction components and thermal cycling conditions are stated in Tables 3.7 and
3.8, respectively.

Chapter Three – Methodology
78
Table 3.7: Reaction components for PCR screening of positive transformants.
Reaction Component Volume (μl)
Diluted E.coli Cells 1.0
10X Taq Buffer with KCl 2.0
25 mM MgCl2 0.6
50 μM M13F(-20) Primer 0.15
50 μM M13R-pUC(-26) Primer 0.15
10 mM dNTP mix 0.15
5 U/μl Taq DNA Polymerase (recombinant) 0.15
ddH2O 15.8
Total Volume 20.0
Table 3.8: Thermal cycling conditions for PCR screening of successfully transformed
clones.
PCR Step Temperature Duration No. of Cycle(s)
Initial Denaturation 94 0C 5 min 1
Denaturation
Annealing
Extension
94 0C
60 0C
72 0C
30 sec
30 sec
30 sec
30
Final Extension 72 0C 7 min 1

Chapter Three – Methodology
79
3.2.2.4(e) Plasmid Preparation
The plasmid DNA was isolated from three successfully transformed clones with the use
of the PureLink Quick Plasmid Miniprep Kit. This silica-based spin column
minipreparation enables the isolation of high quality plasmid DNA from E. coli cells.
The isolated plasmid DNA is free of RNA, proteins and salt, and hence suitable for
downstream applications such as automated fluorescent DNA sequencing, manual DNA
sequencing, PCR, restriction mapping, cloning and labeling. The selected transformed
clone was initially cultured overnight in 1 ml LB at 37 0C. This overnight culture was
pelleted by centrifuging at 1, 500 x g for 15 min and the culture medium was then
thoroughly discarded. Next, the pellet was resuspended completely in 250 μl of
Resuspension Buffer (R3) with RNase A. The tube was then gently mixed by inverting
it five times following the addition of 250 μl Lysis Buffer (L7). The mixture was
incubated at room temperature for 5 min and 350 μl Precipitation Buffer (N4) was then
added. Again, the tube was mixed gently by inverting it another five times and
centrifuged at 12, 000 x g for 10 min at room temperature. The resulting supernatant
was loaded into a Quick Plasmid Mini spin column and centrifuged at 12, 000 x g for 1
min. The flow-through was discarded and 500 μl of Wash Buffer W10 with ethanol
was added to the spin column. The tube was incubated for 1 min at room temperature
and centrifuged at 12, 000 x g for 1 min. Prior to the addition of 700 μl Wash Buffer
W9 with ethanol, the flow-through from previous step was discarded. The spin column
was then centrifuged twice at 12, 000 x g for 1 min in order to completely remove any
residual Wash Buffer W9. Finally, the purified plasmid DNA was eluted by adding 75
μl of 68 0C TE Buffer and incubated at room temperature for 1 min. The column was
centrifuged at 12, 000 x g for 2 min and the purified plasmid DNA was stored at -20 0C
for further applications.

Chapter Three – Methodology
80
3.2.2.4(f) Automated DNA Sequencing
Purified plasmid DNA was sequenced in order to characterise the inserted gene of
interest. The automated DNA sequencing by capillary electrophoresis was employed
under the Single Pass DNA Sequencing Service provided by 1st BASE Pte Ltd,
Malaysia. In this procedure, the high capacity fluorescence-based cycle sequencing
platform, Applied Biosystems 3730xl Genetic Analyzer (Applied Biosystems, United
States), in parallel with the BigDye Terminators v3.1 Cycle Sequencing Kit (Applied
Biosystems, United States) were used. The Applied Biosystems automated DNA
sequencing, which utilises the labeling of fluorescent dyes, is an extension and
improvement of the Sanger dideoxy sequencing method. The whole sequencing process
comprises of template preparation, cycle sequencing, purification, capillary
electrophoresis and data analysis. In an attempt to obtain sequencing results of superior
quality, the optimised protocols supplied by Applied Biosystems were employed
throughout the five-step workflow. The standard thermal cycling conditions for cycle
sequencing are showed in Table 3.9, while Table 3.10 lists the reaction components.
Subsequently, the extension products were purified with the Agencourt CleanSEQ
System (Agencourt Bioscience, United States) prior to capillary electrophoresis.
Finally, the data was analysed using the Sequencing Analysis Software available from
Applied Biosystems (Applied Biosystems, United States).

Chapter Three – Methodology
81
Table 3.9: Thermal cycling conditions for BigDye Terminators v3.1 Cycle Sequencing
Kit.
Stage Step Temperature Duration
1 Denaturation 96 0C 1 min
2
Amplification
(25 cycles)
96 0C 10 sec
50 0C 5 sec
60 0C 4 min
3 Hold 4 0C Indefinite
Table 3.10: Reaction components for cycle sequencing.
Reagent Quantity
Ready Reaction Mix 8.0 μl
Template 200 – 500 ng
Primer 3.2 pmol
ddH2O Variable
Total Volume 20.0 μl

Chapter Three – Methodology
82
3.2.2.4(g) Pairwise Alignment and Sequence Similarity Matching
Following sequencing, the results obtained were subjected to pairwise alignment by
using the BioEdit software ver. 7.0.9. The consensus sequences for all the DEGs were
matched for sequence similarity via the web-interface programme, BLAST. This
programme allows the comparison of the query DNA sequences with the nucleotide
database provided by the National Center for Biotechnology Information (NCBI), under
National Institutes of Health (NIH), United States. Finally, the sequence similarity
scores were assessed and the DEGs were identified.
3.2.2.5 Confirmatory Test
The observed differential expression patterns from preceding ACP-based PCRs were
further confirmed with two-step RT-qPCRs on a larger sample set. The relative
expression of all the identified DEGs was obtained for each individual paired samples.
In this set-up, a second, different experimental approach was used to assess the
significance of the differential expression patterns demonstrated previously.
3.2.2.5(a) Reverse Transcription
The isolated total RNA was reverse transcribed to first-strand cDNA before RT-qPCR.
First, a 9.5 μl mixture containing 3 μg of total RNA, 2 μl of 0.5 μg/μl Oligo(dT)12-18
Primer and RNase-free water was incubated at 80 0C for 3 min. The tube was then
chilled on ice for another 2 min. Next, 4 μl of 5X First Strand Buffer, 5 μl of 2 mM
dNTP mix, 0.5 μl of 40 U/μl RNaseOUT Recombinant RNase Inhibitor and 1 μl of 200
U/μl M-MLV Reverse Transcriptase were added. The mixture was then incubated at 42
0C for 90 min, and subsequently heated at 94
0C for 2 min. Finally, the tube was chilled
on ice for 2 min and the resulting first-strand cDNA was diluted in 70 μl of DNase-free
water. All the cDNA samples were stored at -20 0C until further applications.

Chapter Three – Methodology
83
3.2.2.5(b) RT-qPCR
The difference in gene expression level between both CRC tumour and normal colonic
mucosa samples was determined via a relative quantification method. In the current
study, the Comparative CT (∆∆CT) experimental design was employed along with the
TaqMan chemistry. The RT-qPCR was performed with the Applied Biosystems 7500
Fast Real-Time PCR System. The Applied Biosystems 7500 software ver. 2.0.5 was
used to design, set up and monitor the RT-qPCR experiment, as well as determine the
fluorescence location and intensity of each reading. Finally, the data collected was
further analysed by using the Integromics RealTime StatMiner software ver. 4.2.8,
which is specifically designed and compatible with all the Real-Time PCR Systems
from Applied Biosystems.
3.2.2.5(b)(i) Synthesis of Primers and TaqMan Probes
The sequences obtained previously were used to customise the primers and 6-FAM dye-
labelled TaqMan MGB (minor groove binder) probes (Applied Biosystems, United
States) for each characterised DEGs. The Primer Express software ver. 3.0 (Applied
Biosystems, United States) was used to design the appropriate primers and probes
sequences, as listed in Tables 3.11 and 3.12. These Custom TaqMan Gene Expression
Assays were specifically synthesised by Applied Biosystems in accordance to the Rapid
Assay Development Guidelines, for optimum performance with TaqMan Gene
Expression Master Mix. On the other hand, the Applied Biosystems Pre-developed
TaqMan Endogenous Control Assays were also available for both reference genes used
in this study, i.e., the beta-actin (ACTB) (Assay ID: Hs99999903_m1) and
glyceraldehyde-3-phosphate dehydrogenase (GAPDH) (Assay ID: Hs99999905_m1).
Each of the assays was formulated with two unlabelled primers of 18 μΜ each and a 5
μΜ 6-FAM dye-labelled TaqMan MGB probe in a single tube of 20X stock

Chapter Three – Methodology
84
concentration. The synthesis of primers and probes in referral to the Rapid Assay
Development Guidelines allowed the standardisation of assay conditions (default
concentration of primers and probe) and thermal cycling parameters for all the gene
expression assays from Applied Biosystems.

Chapter Three – Methodology
85
Table 3.11: Oligonucleotides primers sequences in Custom TaqMan Gene Expression
Assays for all the identified DEGs.
DEG Primer Sequence
DEG1 Primer (F): 5’-GGGCGTGTGCACAGAAG-3’
Primer (R): 5’-AAGTCCTCCTGAGTGACATGGA-3’
DEG2 Primer (F): 5’-GATGCTTACCGAATCCGGAGATC-3’
Primer (R): 5’-GCATTGCTCTCTCACTGTTGTTAG-3’
DEG3 Primer (F): 5’-CAACCGTCATTGGGTACAAAGG-3’
Primer (R): 5’-TGTAAGGGTCCAGCTGATCAAGA-3’
DEG4 Primer (F): 5’-CGGCCAGGAAACTTGAACTTG-3’
Primer (R): 5’-CCGAGCTGCAGAACAAGGA-3’
DEG5 Primer (F): 5’-CTGGTCGAATGAGGCACCTAAAA-3’
Primer (R): 5’-TGGGTTTAGGTGTTGTTCCTTCAC-3’
DEG6 Primer (F): 5’-AGATTAGCGGGATGAAAACGTCTT-3’
Primer (R): 5’-CGCCCAGATGCCGAGAAAA-3’
DEG7 Primer (F): 5’-GGTAGTGATGTGCAAGAGTCCAT-3’
Primer (R): 5’-CCGCAGCGAGGAGTTTCT-3’
DEG8 Primer (F): 5’-GAAGGAGACCATCAAAGGATTCCA-3’
Primer (R): 5’-GAAGGCCTGTTCTGGGAGATG-3’
DEG9 Primer (F): 5’-GGCAGGGTGGTCCTGAGA-3’
Primer (R): 5’-CCGCCATTGGCCTTAACTG-3’
DEG11 Primer (F): 5’-CAGGTTTCAGTGAAGCCATCTG-3’
Primer (R): 5’-GGGTTGGCATCTACGTGTGA-3’
DEG12 Primer (F): 5’-CCAGGTCAAACTTGTGGATCCT-3’
Primer (R): 5’-GCTTCAGTAAATCTCCACTCGATCT-3’
DEG14 Primer (F): 5’-CCCGCTCCTTATCTGCAAGTT-3’
Primer (R): 5’-TCAAGATGGACGTGCACATTACTC-3’
DEG15 Primer (F): 5’-CGGCCTCCAAGCTCTCT-3’
Primer (R): 5’-TGAGAACACGGGCAATGGATTT-3’
DEG16 Primer (F): 5’-GGACTCTTCTGCTAATCGATGAACA-3’
Primer (R): 5’-GCCTCAACTTCGTCTGGAGAAAA-3’

Chapter Three – Methodology
86
Table 3.12: TaqMan MGB probes sequences in Custom TaqMan Gene Expression
Assays for all the identified DEGs.
DEG Probe Sequence
DEG1 5’-CTCGCAGGGCATACAT-3’
DEG2 5’-CCTCTTCCTCTTCCTCCTCC-3’
DEG3 5’-ATGGCAAGAAAATCAC-3’
DEG4 5’-CAGGGCCTCAATCACA-3’
DEG5 5’-CATGCCTGAATCTGC-3’
DEG6 5’-CCCCGTGATTGTTTTC-3’
DEG7 5’-CATTGCTGGAAAACTG-3’
DEG8 5’-ATTCACCTGCCAAAATC-3’
DEG9 5’-CCTCTCTCCGCCCCGGACA-3’
DEG11 5’-CACCCAAGGGTAACAAC-3’
DEG12 5’-ATGGACAGGAAACCCAC-3’
DEG14 5’-CATGCAGTGAACAAGC-3’
DEG15 5’-CCGGACGACTCGGATCT-3’
DEG16 5’-CAGATGGACCAATAAGTCA-3’

Chapter Three – Methodology
87
3.2.2.5(b)(ii) Determination of Amplification Efficiency of TaqMan Gene
Expression Assays
The amplification efficiency for both target and reference gene expression assays must
be approximately equal in order to assure accurate relative quantification with ∆∆CT
method. Hence, it is essential to determine the PCR amplification efficiency for all the
target and reference gene expression assays prior to the experiment. In this current
study, the efficiency value was measured by using the CT slope method with 2-log
dilution series in 5 concentration points. First, a 5-point series of 2-fold dilutions of
cDNA template was prepared as shown in Table 3.13.
Table 3.13: Five-point 2-fold dilution series for the CT slope method.
Dilution cDNA Concentration (ng/μl) Final Volume (μl)
1 150.0 10
2 75.0 10
3 37.5 10
4 18.75 10
5 9.375 10

Chapter Three – Methodology
88
Subsequently, the CT value for each dilution was measured for all the target and
reference gene expression assays by preparing the reaction mixture as shown in Table
3.14. The PCR was carried out according to the universal thermal cycling conditions
from Applied Biosystems (Table 3.15).
Table 3.14: Reaction components for PCR amplification.
Reaction Component Volume per tube (μl)
2X TaqMan Gene Expression Master Mix 10.0
20X TaqMan Gene Expression Assay 1.0
cDNA Template 1.0
ddH2O 8.0
Total Volume 20.0
Table 3.15: Universal thermal cycling conditions from Applied Biosystems.
PCR Step Temperature Duration No. of Cycle(s)
Holding 50 0C 2 min 1
Holding 95 0C 10 min 1
Melting
Annealing / Extension
95 0C
60 0C
15 sec
1 min
40

Chapter Three – Methodology
89
There were a total of three replicates for each dilution sample, as well as three tubes of
‘No Template Control’ (NTC) in each CT slope analysis. Finally, a standard curve of
CT value against the quantity of cDNA template in nanograms was plotted. The slope
of the standard curve indicates the amplification efficiency of the assay tested, and the
value of -3.32 corresponds to 100 % efficiency, is the most ideal. In addition, the
square of correlation coefficient (R2) value reflects the statistical significance of the
linear relationship between two variables. The R2 value ranges from 0 to 1, and a value
closer to 1 is more desirable. As for the amplification efficiency, a value of 100 % (+
10 %) is preferred for all the target and reference assays in order to obtain reliable
relative quantification results (Life Technologies Corporation, 2012; Liu and Saint,
2002).
Chapter Three – Methodology
90
3.2.2.5(b)(iii) ΔΔCT Experiment
There were a total of 27 paired colonic tissue samples obtained for this experiment.
Each of the CRC tumour and normal colonic mucosa specimens was subjected to PCR
amplification for all the target and reference genes in separate reaction plates (Table
3.16). The PCR amplification was performed in triplicates for each gene expression
assay and NTCs were also included. Table 3.17 shows the singleplex reaction mixture
for PCR amplification whilst the universal thermal cycling parameters are as previously
described in Table 3.15. Both ACTB and GAPDH genes were used as reference genes
for normalisation in determining the ‘true’ expression level of target genes.
CT (Target gene) – CT (Reference gene) = ∆CT
In current ∆∆CT method, the normal colonic tissue sample served as a calibrator. The
relative expression level of target genes in CRC tumour compared to normal colonic
mucosa was determined by using the following formula (Livak and Schmittgen, 2001):
∆CT (Sample) – ∆CT (Calibrator) = ∆∆CT
As shown in formula, the positive value of ΔΔCT indicates the over-expression of target
gene in CRC tumour, and vice-versa. On the other hand, the TCΔΔ-2 value refers to the
relative fold change in gene expression level between the CRC tumour and normal
colonic samples.
TCΔΔ-2= (RQ) Expressionin Change Fold Relative

Chapter Three – Methodology
91
Table 3.16: Plate layout for PCR amplification of all the target and reference genes for each individual sample.
ACTB
NTC
ACTB
NTC
ACTB
NTC
GAPDH
NTC
GAPDH
NTC
GAPDH
NTC
ACTB
sample
ACTB
sample
ACTB
sample
GAPDH
sample
GAPDH
sample
GAPDH
sample
ARPC2
NTC
ARPC2
NTC
ARPC2
NTC
ATP5B
NTC
ATP5B
NTC
ATP5B
NTC
ARPC2
sample
ARPC2
sample
ARPC2
sample
ATP5B
sample
ATP5B
sample
ATP5B
sample
C6orf173
NTC
C6orf173
NTC
C6orf173
NTC
C11orf10
NTC
C11orf10
NTC
C11orf10
NTC
C6orf173
sample
C6orf173
sample
C6orf173
sample
C11orf10
sample
C11orf10
sample
C11orf10
sample
FAM96B
NTC
FAM96B
NTC
FAM96B
NTC
MRPL24
NTC
MRPL24
NTC
MRPL24
NTC
FAM96B
sample
FAM96B
sample
FAM96B
sample
MRPL24
sample
MRPL24
sample
MRPL24
sample
PSMC5
NTC
PSMC5
NTC
PSMC5
NTC
RPL10
NTC
RPL10
NTC
RPL10
NTC
PSMC5
sample
PSMC5
sample
PSMC5
sample
RPL10
sample
RPL10
sample
RPL10
sample
RPS23
NTC
RPS23
NTC
RPS23
NTC
RPL35
NTC
RPL35
NTC
RPL35
NTC
RPS23
sample
RPS23
sample
RPS23
sample
RPL35
sample
RPL35
sample
RPL35
sample
RPL37
NTC
RPL37
NTC
RPL37
NTC
SLC25A1
NTC
SLC25A1
NTC
SLC25A1
NTC
RPL37
sample
RPL37
sample
RPL37
sample
SLC25A1
sample
SLC25A1
sample
SLC25A1
sample
TIMP1
NTC
TIMP1
NTC
TIMP1
NTC
UQCRH
NTC
UQCRH
NTC
UQCRH
NTC
TIMP1
sample
TIMP1
sample
TIMP1
sample
UQCRH
sample
UQCRH
sample
UQCRH
sample
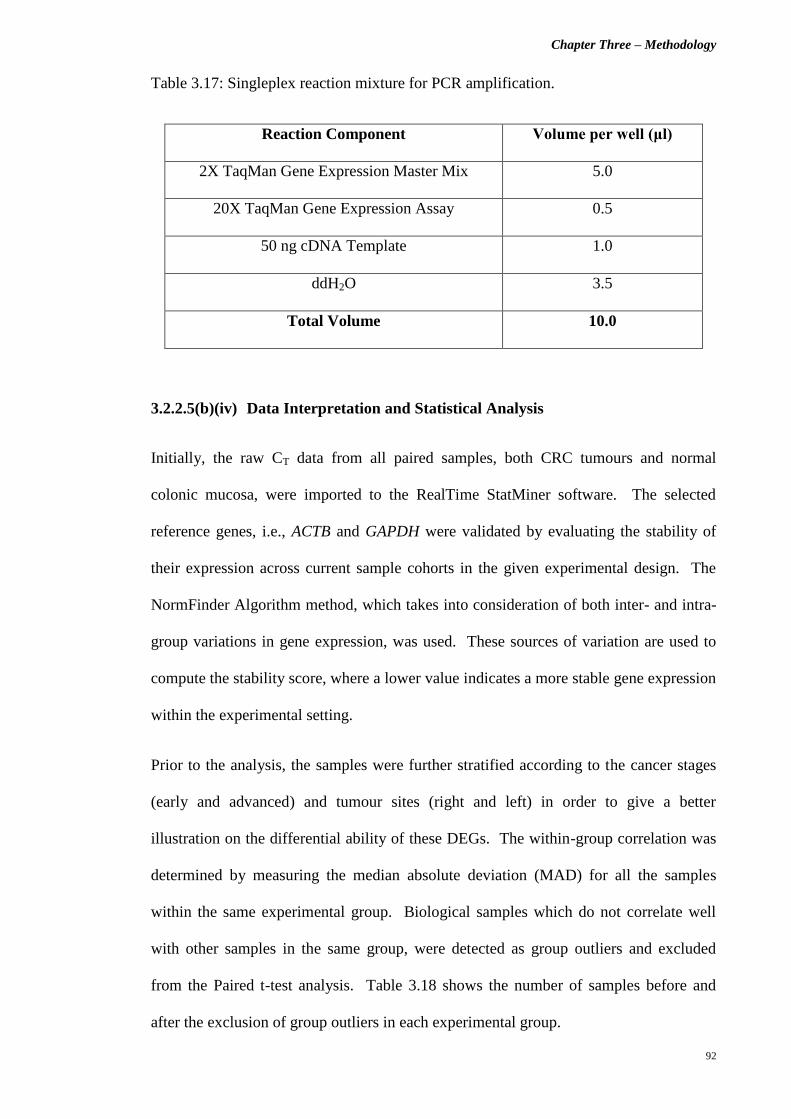
Chapter Three – Methodology
92
Table 3.17: Singleplex reaction mixture for PCR amplification.
Reaction Component Volume per well (μl)
2X TaqMan Gene Expression Master Mix 5.0
20X TaqMan Gene Expression Assay 0.5
50 ng cDNA Template 1.0
ddH2O 3.5
Total Volume 10.0
3.2.2.5(b)(iv) Data Interpretation and Statistical Analysis
Initially, the raw CT data from all paired samples, both CRC tumours and normal
colonic mucosa, were imported to the RealTime StatMiner software. The selected
reference genes, i.e., ACTB and GAPDH were validated by evaluating the stability of
their expression across current sample cohorts in the given experimental design. The
NormFinder Algorithm method, which takes into consideration of both inter- and intra-
group variations in gene expression, was used. These sources of variation are used to
compute the stability score, where a lower value indicates a more stable gene expression
within the experimental setting.
Prior to the analysis, the samples were further stratified according to the cancer stages
(early and advanced) and tumour sites (right and left) in order to give a better
illustration on the differential ability of these DEGs. The within-group correlation was
determined by measuring the median absolute deviation (MAD) for all the samples
within the same experimental group. Biological samples which do not correlate well
with other samples in the same group, were detected as group outliers and excluded
from the Paired t-test analysis. Table 3.18 shows the number of samples before and
after the exclusion of group outliers in each experimental group.

Chapter Three – Methodology
93
Table 3.18: Stratification of samples for the analysis of RT-qPCR data.
Stratification Criteria Number of Samples
Initially Recruited After Exclusion
Cancer Stage
Early Stage (Stages I and II) 13 10
Advanced Stage (Stages III and IV) 14 10
Tumour Location
Right-sided 10 6
Left-sided 17 13
In order to assess the statistical significance of the observed differential expression
patterns across the current sample cohort, a Two-tailed Paired t-test was performed with
the RealTime StatMiner software. A p value of less than 0.05 indicates that the
observed differential gene expression is statistically significant, which corresponds to a
less than 5 % probability that the observation obtained is merely by chance. The log10
RQ bar charts were then plotted to illustrate both statistically significant and non-
significant DEGs between both CRC tumour (sample) and normal colonic mucosa
(calibrator) groups.

Chapter Three – Methodology
94
3.3 Part C: Differential Proteome Analysis via A Bottom-Up Proteomics
Approach
3.3.1 Materials
3.3.1.1 Commercialised Chemicals, Reagents and Kits
Chemical / Reagent / Kit Manufacturer
Section 3.3.2.2 – Tissue Specimen Collection
Allprotect Tissue Reagent
QIAGEN (Germany)
Section 3.3.2.3 – Total Protein Isolation
Total Protein Isolation Kit for
Two-Dimensional Difference Gel Electrophoresis
100X Halt Protease Inhibitor Cocktail
0.5 M EDTA (100X)
Ettan 2-D Quant Kit
ITSI-Biosciences (United States)
Thermo Scientific (United States)
Thermo Scientific (United States)
GE Healthcare (United Kingdom)
Section 3.3.2.4 – Total Protein Separation via 2-D
DIGE
CyDye DIGE Fluor Minimal Dye Labeling Kit
Ettan 2-D Clean-Up Kit
Urea
Thiourea
PlusOne 3-[(3-cholamidopropyl)dimethylammonio]
-1-propanesulfonate (CHAPS)
Sodium hydroxide (NaOH)
N, N-Dimethylformamide (DMF) Anhydrous
L-Lysine monohydrochloride
Dithiothreitol (DTT)
IPG Buffer (pH 4 – 7)
Bromophenol Blue
PlusOne DryStrip Cover Fluid
30 % Acrylamide/Bis Solution 37.5:1 (2.6 % C)
GE Healthcare (United Kingdom)
GE Healthcare (United Kingdom)
Nacalai Tesque (Japan)
GE Healthcare (United Kingdom)
GE Healthcare (United Kingdom)
AMRESCO (United States)
Sigma-Aldrich (United States)
Sigma-Aldrich (United States)
Fermentas (Canada)
GE Healthcare (United Kingdom)
Bio-Rad Laboratories (United States)
GE Healthcare (United Kingdom)
Bio-Rad Laboratories (United States)

Chapter Three – Methodology
95
Chemical / Reagent / Kit Manufacturer
Tris Base
SDS
Ammonium persulfate
Tetramethylethylenediamine (TEMED)
PlusOne 87 % (w/w) Glycerol
Iodoacetamide
PlusOne Glycine
Agarose
Absolute methanol
Glacial Acetic acid
Sodium thiosulfate
Silver nitrate
Formalin (37 % Formaldehyde in water)
Sodium carbonate
PhytoTechnology Laboratories
(United States)
Bio-Rad Laboratories (United States)
Bio-Rad Laboratories (United States)
Sigma-Aldrich (United States)
GE Healthcare (United Kingdom)
GE Healthcare (United Kingdom)
GE Healthcare (United Kingdom)
Promega (United States)
Merck (Germany)
Merck (Germany)
AMRESCO (United States)
Sigma-Aldrich (United States)
AMRESCO (United States)
Merck (Germany)

Chapter Three – Methodology
96
3.3.1.2 Consumables and Equipments
Consumable / Equipment Manufacturer
1.5 ml pellet pestle with cordless motor Kimble Chase (United States)
Implen NanoPhotometer Implen (Germany)
Neutralit pH-indicator strip (non-bleeding; pH 5.0 – 10.0) Merck (Germany)
Ettan IPGphor 3 Isoelectric Focusing (IEF) Unit
- Ettan IPGphor 3 Control software ver. 1.2
GE Healthcare (United Kingdom)
Immobiline DryStrip Reswelling Tray GE Healthcare (United Kingdom)
13 cm Immobiline DryStrip Gel of pH 4 – 7 GE Healthcare (United Kingdom)
Ettan IPGphor Strip Holder GE Healthcare (United Kingdom)
SE 600 Ruby Standard Dual Cooled Gel Electrophoresis
Unit
GE Healthcare (United Kingdom)
MS Waver Shaker Major Science (United States)
Electrophoresis Power Supply EPS 601 GE Healthcare (United Kingdom)
Typhoon FLA 9000 Variable Mode Laser Scanner
- Typhoon FLA 9000 Control software ver. 1.2
GE Healthcare (United Kingdom)
3.3.1.3 Software and Service
Software /
Service
Manufacturer /
Service Provider
DeCyder 2D software ver. 7.0 GE Healthcare (United Kingdom)
Liquid Chromatography-Tandem Mass Spectrometry
(LC-MS/MS) Service
Proteomics International Pty Ltd
(Australia)

Chapter Three – Methodology
97
3.3.1.4 Miscellaneous Materials
Other solutions were prepared accordingly, as follows:
i) Thiourea Rehydration Solution
The Thiourea Rehydration Solution was prepared by adding 5.25 g Urea, 1.9 g Thiourea,
0.25 g CHAPS and ddH2O, to a total volume of 12.5 ml. Next, 1 ml aliquots of this
solution were stored at -20 0C until further use.
ii) 50 mM NaOH
The 50 mM NaOH solution was prepared by dissolving 20 mg NaOH in 10 ml ddH2O.
iii) 10 mM L-Lysine monohydrochloride
The solution was prepared by dissolving 19 mg of L-Lysine monohydrochloride in 10
ml of ddH2O.
iv) 1 % (w/v) Bromophenol Blue stock solution
The 1 % (w/v) Bromophenol Blue stock solution was prepared by dissolving 0.1 g of
Bromophenol Blue powder in 10 ml of ddH2O.
v) 4X Resolving Gel Buffer
First, 181.7 g of Tris Base was dissolved in 750 ml of ddH2O. The pH was then
adjusted to 8.8, and the solution was further topped up to 1 L with ddH2O. The
prepared solution was filtered via a 0.45 μm syringe filter and stored at 4 0C.
vi) 10 % (w/v) SDS
Five grams of SDS was dissolved in 50 ml ddH2O and followed by filtration with a 0.45
μm syringe filter. The prepared 10 % (w/v) SDS solution was stored at room
temperature.
Chapter Three – Methodology
98
vii) 10 % (w/v) Ammonium persulfate
The 10 % (w/v) Ammonium persulfate was freshly prepared before use, by dissolving
15 mg Ammonium persulfate in 150 μl of ddH2O.
viii) SDS Equilibration Buffer
The SDS Equilibration Buffer was prepared by adding 144.2 g of Urea, 20 ml of
solution (v), 138 ml of 87 % (w/w) Glycerol, 8 g of SDS, and topping up to a final
volume of 400 ml with ddH2O.
ix) 10 mg/ml DTT-containing SDS Equilibration Buffer
This solution was prepared by adding 0.1 g of DTT into 10 ml of solution (viii).
x) 25 mg/ml Iodoacetamide-containing SDS Equilibration Buffer
This solution was prepared by adding 0.25 g of Iodoacetamide into 10 ml solution (viii).
xi) 1X Laemmli SDS Electrophoresis Buffer
The 1X Laemmli SDS Electrophoresis Buffer was prepared by dissolving 30.3 g of Tris
Base, 144 g of Glycine and 10 g of SDS in 10 L ddH2O. The prepared solution was
then stored at 4 0C.
xii) 0.5 % (w/v) agarose sealing solution
A 0.5 g of agarose powder was dissolved in 100 ml ddH2O via heating to form the 0.5 %
(w/v) agarose sealing solution.
xiii) Fixing solution containing 50 % (v/v) methanol and 5 % (v/v) Acetic acid
The 250 ml fixing solution was prepared by adding 125 ml of absolute methanol and
12.5 ml of Glacial Acetic acid, to 112.5 ml ddH2O.

Chapter Three – Methodology
99
xiv) Sensitizing solution containing 0.02 % (w/v) Sodium thiosulfate
This sensitizing solution was prepared by dissolving 0.05 g of Sodium thiosulfate in 250
ml of ddH2O.
xv) Staining solution containing 0.1 % (w/v) Silver nitrate
A 0.25 g of Silver nitrate was dissolved in 250 ml ddH2O to form a 0.1 % (w/v) Silver
nitrate staining solution.
xvi) Developing solution containing 0.04 % (v/v) Formalin (37 % Formaldehyde in
water) and 2 % (w/v) Sodium carbonate
The developing solution was prepared by adding 100 μl of Formalin (37 %
Formaldehyde in water ) and 5 g of Sodium carbonate into 250 ml ddH2O.
xvii) 5 % (v/v) Acetic acid
The 5 % (v/v) Acetic acid solution was prepared by adding 12.5 ml of Glacial Acetic
acid into 250 ml ddH2O.
xviii) 1 % (v/v) Acetic acid
A 2.5 ml of Glacial Acetic acid was added to 250 ml ddH2O to form a 1 % (v/v) Acetic
acid solution.

Chapter Three – Methodology
100
3.3.2 Methods
3.3.2.1 Patient Characteristics
In this study, the volunteered CRC patients were aged between 40 – 86 years old and
grouped accordingly based on their cancer stage at the time of diagnosis, i.e., either
Stages II, III or IV. Both the diagnosis and staging of these patients were accurately
performed by experienced surgeons and oncologists by taking into account
histopathological reports, CT scanning images, morphological evaluations during
surgery, as well as serum CEA levels. All recruited patients were newly-diagnosed with
the absence of previous history of cancer or family history of CRC. They presented
with sporadic CRC and the possibility for any hereditary CRC syndrome was ruled out
by gastroenterologists. In addition, those who have received chemo- or radiotherapies
prior to surgical resection were also excluded from this study.
3.3.2.2 Tissue Specimen Collection
The collection of tissue specimens was performed in UMMC with the necessary ethical
approval (Ref. No.: 654.1). A total of 20 paired tissue samples were collected from
volunteered CRC patients – 10 presented with Stage II CRC, and 5 with Stages III and
IV each. Both CRC and normal tissue specimens were obtained during surgical
resection with written informed consent. The CRC specimens were obtained from
resected CRC tumours, whilst the paired normal tissue samples were excised from
distally located, macroscopically normal colonic mucosa. All tissue specimens were
submerged in Allprotect Tissue Reagent immediately after excision and incubated
overnight at 4 0C prior to storage at -80
0C for further applications. This reagent allows
the immediate processing of harvested human tissue samples for protein preservation in
long-term archival storage without degradation. Hence, the cellular proteins will remain
intact without the need of traditional labour- and equipment-intensive methods.

Chapter Three – Methodology
101
3.3.2.3 Total Protein Isolation
3.3.2.3(a) Protein Extraction
The commercially-available Total Protein Isolation Kit for Two-Dimensional
Difference Gel Electrophoresis (ToPI-DIGE Kit) was used to isolate total proteins from
the tissue specimens. Both the buffer systems and operating procedures of this kit were
optimised and validated to improve the chances for successful downstream 2-D DIGE
application. First, approximately 50 – 100 mg of fresh tissue was weighed and rinsed
briefly with 5 – 10 ml of Buffer 1. The tissue was then immediately transferred into
iTube-A and a 3X volume of Buffer 2 was added. Subsequently, the tissue was rapidly
homogenised by using disposable 1.5 ml pellet pestle with cordless motor. The sample
tube has to be immersed in ice throughout the homogenisation process. The
homogenised tissue was incubated on ice for 30 min and vortexed for at least 3 times
during the incubation. Next, the tube was centrifuged under 4 0C at 15, 000 x g for 10
min and the supernatant was transferred into iTube-B. Finally, an appropriate volume
of 100X Halt Protease Inhibitor Cocktail and 0.5 M EDTA (100X) were added
accordingly to produce a 1X final concentration each. This ready-to-use cocktail
inhibits the activity of aspartic acid, cysteine and serine proteases, and thus minimises
protein degradation. Furthermore, the inclusion of EDTA also enables the inhibition of
metalloproteases. The isolated total proteins was then stored at -80 0C for downstream
applications.

Chapter Three – Methodology
102
3.3.2.3(b) Protein Quantification
The concentration of isolated total proteins was determined with the commercialised
Ettan 2-D Quant Kit prior to 2-D DIGE analysis. This kit was exclusively designed to
quantitatively precipitate proteins while leaving out interfering substances in the
solution and thus, allows accurate determination of protein concentration. It differs
from other common spectrophotometric methods in a way that the precipitated proteins
will specifically bind to copper ions in the copper-containing solution, while the
unbound copper is then measured with the use of a colorimetric agent. The initial step
involved the construction of a standard curve by using 2 mg/ml of Bovine Serum
Albumin (BSA) as a standard solution. A total of six standards were prepared
accordingly, as shown in Table 3.19. As for the protein samples to be assayed, 5 ul was
needed for quantity measurement with this kit.
Table 3.19: Preparation of BSA standards for the construction of standard curve.
Tube No. 1 2 3 4 5 6
2 mg/ml BSA standard solution (μl) 0 5 10 15 20 25
Protein quantity (μg) 0 10 20 30 40 50
First, 500 μl of Precipitant was added to all the standard and sample tubes. The mixture
was vortexed briefly and incubated at room temperature for 3 min. Another 500 μl of
Co-precipitant was then added to the mixture and vortexed briefly prior to
centrifugation at > 10, 000 x g for 5 min. At this step, the protein was sedimented out
and the supernatant decanted. The tube was centrifuged again with a brief pulse and the

Chapter Three – Methodology
103
remaining supernatant (if any) was discarded. Subsequently, 100 μl of copper solution
and 400 μl of ddH2O were added. The mixture was vortexed briefly to dissolve the
precipitated proteins. Next, 1 ml of working colour reagent was added by introducing it
as rapidly as possible and the tube was inverted several times for instantaneous mixing.
Following incubation at room temperature for 20 min, the absorbance of each standard
and sample was read at 480 nm with water as a reference. A standard curve was
constructed by plotting the absorbance value of the standards against the protein
quantities, and finally the protein concentration of the samples was determined. Both
absorbance measurements and standard curve construction were performed on the
Implen NanoPhotometer.
3.3.2.4 Total Protein Separation via 2-D DIGE
The application of the 2-D DIGE utilises the Ettan DIGE System (GE Healthcare,
United Kingdom), which comprises the CyDye DIGE Fluor Minimal Dye Labeling Kit
(i.e., Cy2, Cy3 and Cy5), the Typhoon FLA 9000 Variable Mode Laser Scanner and the
DeCyder 2D software ver. 7.0. The specific experimental design and advanced
statistical analysis within this system effectively minimise both system-related results
and inherent biological variations, compared to classical 2-D GE. Moreover, this Ettan
DIGE System also allows the detection and quantification of differences in protein
abundance between two different samples, as small as 10 %, with a statistical
confidence of greater than 95 % (GE Healthcare Bio-Sciences AB, 2005).
3.3.2.4(a) Sample Randomisation and Experimental Set Up
In an attempt to eliminate possible bias from experimental conditions, sample handling
and CyDyes labeling, all total protein samples for both CRC tumour and normal colonic
mucosa groups were evenly distributed among different CyDye DIGE Fluor Minimal
Dyes (i.e., Cy3 and Cy5) for labeling, as shown in Table 3.20.

Chapter Three – Methodology
104
Table 3.20: Randomisation of protein samples for CyDyes labeling.
Cy3 Cy5
Stage II CRC Group
E1 (N) E6 (N)
E2 (N) E7 (N)
E3 (N) E8 (N)
E4 (N) E9 (N)
E5 (N) E10 (N)
E6 (C) E1 (C)
E7 (C) E2 (C)
E8 (C) E3 (C)
E9 (C) E4 (C)
E10 (C) E5 (C)
Stage III CRC Group
L1 (N) L4 (N)
L2 (N) L5 (N)
L3 (N) L1 (C)
L4 (C) L2 (C)
L5 (C) L3 (C)
Stage IV CRC Group
L6 (N) L9 (N)
L7 (N) L10 (N)
L8 (N) L6 (C)
L9 (C) L7 (C)
L10 (C) L8 (C)
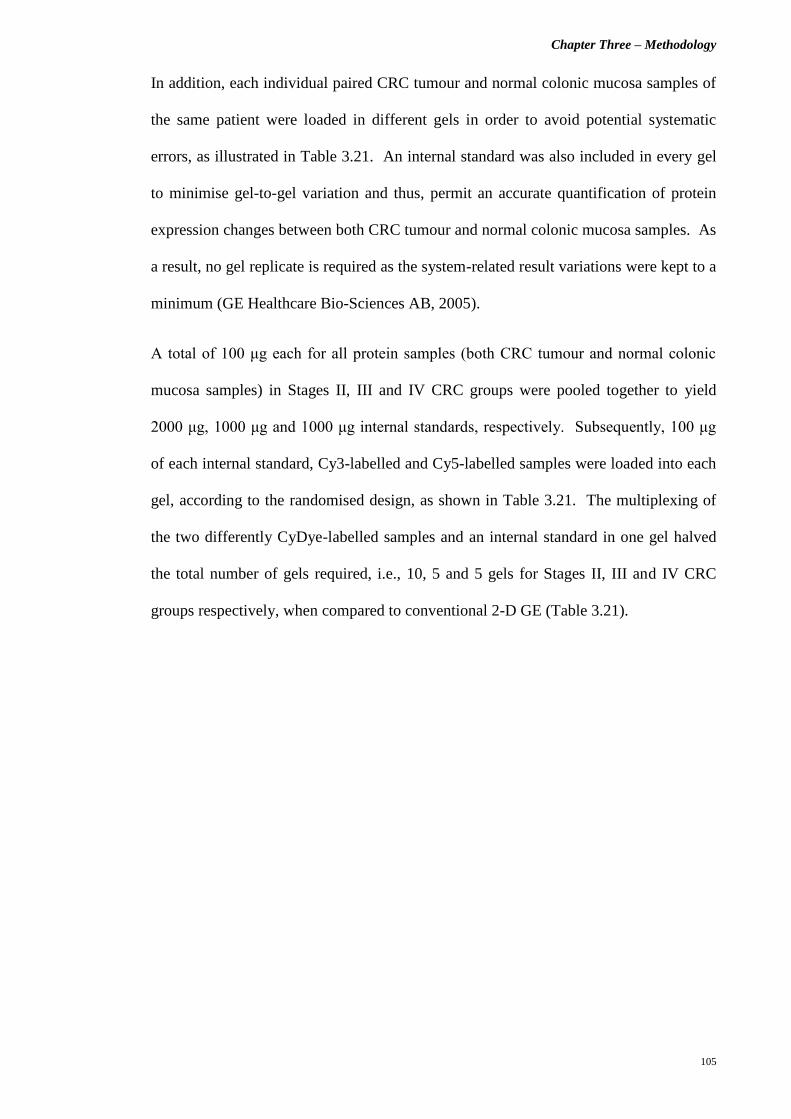
Chapter Three – Methodology
105
In addition, each individual paired CRC tumour and normal colonic mucosa samples of
the same patient were loaded in different gels in order to avoid potential systematic
errors, as illustrated in Table 3.21. An internal standard was also included in every gel
to minimise gel-to-gel variation and thus, permit an accurate quantification of protein
expression changes between both CRC tumour and normal colonic mucosa samples. As
a result, no gel replicate is required as the system-related result variations were kept to a
minimum (GE Healthcare Bio-Sciences AB, 2005).
A total of 100 μg each for all protein samples (both CRC tumour and normal colonic
mucosa samples) in Stages II, III and IV CRC groups were pooled together to yield
2000 μg, 1000 μg and 1000 μg internal standards, respectively. Subsequently, 100 μg
of each internal standard, Cy3-labelled and Cy5-labelled samples were loaded into each
gel, according to the randomised design, as shown in Table 3.21. The multiplexing of
the two differently CyDye-labelled samples and an internal standard in one gel halved
the total number of gels required, i.e., 10, 5 and 5 gels for Stages II, III and IV CRC
groups respectively, when compared to conventional 2-D GE (Table 3.21).

Chapter Three – Methodology
106
Table 3.21: Randomisation of protein samples for gel loading.
Gel Cy2 Cy3 Cy5
Stage II CRC Group
1
100 μg internal standard
100 μg E1 (N) 100 μg E3 (C)
2 100 μg E2 (N) 100 μg E5 (C)
3 100 μg E3 (N) 100 μg E1 (C)
4 100 μg E4 (N) 100 μg E2 (C)
5 100 μg E5 (N) 100 μg E4 (C)
6 100 μg E6 (C) 100 μg E7 (N)
7 100 μg E7 (C) 100 μg E10 (N)
8 100 μg E8 (C) 100 μg E6 (N)
9 100 μg E9 (C) 100 μg E8 (N)
10 100 μg E10 (C) 100 μg E9 (N)
Stage III CRC Group
1
100 μg internal standard
100 μg L1 (N) 100 μg L2 (C)
2 100 μg L2 (N) 100 μg L3 (C)
3 100 μg L3 (N) 100 μg L1 (C)
4 100 μg L4 (C) 100 μg L5 (N)
5 100 μg L5 (C) 100 μg L4 (N)
Stage IV CRC Group
1
100 μg internal standard
100 μg L6 (N) 100 μg L7 (C)
2 100 μg L7 (N) 100 μg L8 (C)
3 100 μg L8 (N) 100 μg L6 (C)
4 100 μg L9 (C) 100 μg L10 (N)
5 100 μg L10 (C) 100 μg L9 (N)
Chapter Three – Methodology
107
3.3.2.4(b) Sample Preparation
The quality of 2-D GE results is usually affected by the presence of non-protein
impurities in the samples. Excessive salts and buffers in protein samples can lead to
high conductivity and thus, affect the first-dimension isoelectric focusing (IEF) results.
In addition, the presence of other interfering substances such as charged detergents,
lipids, phenolics and nucleic acids can also lead to poor 2-D GE results. Hence, it is
essential to prepare and process the total protein samples adequately prior to 2-D DIGE
applications in order to ensure optimum results (GE Healthcare Bio-Sciences AB, 2005).
On the other hand, the labeling of protein samples is sensitive to pH, where a lower pH
than optimal will render an ineffective labeling. Therefore, the adjustment of protein
samples to the optimum pH, i.e., 8.5, is very important for the following successful
CyDyes minimal labeling within the 2-D DIGE workflow (GE Healthcare Bio-Sciences
AB, 2005).
3.3.2.4(b)(i) Clean-Up of Protein Samples
All total protein samples were cleaned-up with commercially-available Ettan 2-D
Clean-Up Kits. These kits are specifically designed to improve the quality of 2-D GE
results by reducing streaking, background staining and other interfering contaminants in
the protein samples. They selectively precipitate proteins and leave interfering
substances, i.e., detergents, salts, lipids, phenolics, nucleic acids and chaotropes, in
solution.
First, 300 μl of Precipitant was added to 100 μg of total protein, followed by vortexing
and incubation on ice for 15 min. Next, 300 μl of Co-precipitant was added to the
mixture and vortexed briefly. The tube was then centrifuged at 17, 000 x g for 5 min.
The supernatant was decanted until no visible liquid remained in the tube.
Subsequently, another 40 μl of Co-precipitant was layered on top of the pellet and

Chapter Three – Methodology
108
incubated on ice for 5 min. The wash was discarded following centrifugation at 17, 000
x g for 5 min. Twenty-five microlitres of ddH2O was layered on top of the pellet and
vortexed for 5 – 10 sec before 1 ml of pre-chilled Wash Buffer and 5 μl of Wash
Additive were added to the tube. The pellet was then fully dispersed and incubated
overnight at -20 0C. The next day, the tube was vortexed and centrifuged at 17, 000 x g
for 5 min. The supernatant was then discarded and the pellet was air-dried briefly. The
resulting protein pellet was then resuspended in an appropriate volume of Thiourea
Rehydration Solution, vortexed for at least 30 sec and incubated at room temperature
until full dissolution. The cleaned protein sample was quantified again according to the
protocol as in Section 3.3.2.3(b), and was stored at -80 0C until further analysis.
3.3.2.4(b)(ii) pH Adjustment of Protein Samples
Each protein sample (1 – 3 μl) was spotted on Neutralit pH-indicator strips (non-
bleeding; pH 5.0 – 10.0) for pH screening. The desired optimal pH 8.5 was targeted for
effective and specific CyDyes labeling. Small volume aliquots of 50 mM NaOH were
gradually added to the protein samples if needed.
3.3.2.4(c) CyDye DIGE Fluor Minimal Dye Labeling
The CyDye DIGE Fluor Minimal Dyes consist of three spectrally resolvable dyes, i.e.,
Cy2, Cy3 and Cy5, which are matched in mass and charge. Each of these dyes adds
450 Da to the protein mass when it couples to the protein by forming an amide linkage
with the lysine residue. Therefore, it allows the multiplexing of up to three samples in a
gel without affecting the pattern visible on the second-dimension SDS-denaturing
polyacrylamide gel. Moreover, the specific dye:protein ratio used in minimal labeling
also ensures that the dye only labels an approximate of 1 – 2 % of lysine residues, and
thus each labelled protein carries only one dye label and is visualised as a single protein
Chapter Three – Methodology
109
spot on the SDS-denaturing polyacrylamide gel (GE Healthcare Bio-Sciences AB,
2005).
3.3.2.4(c)(i) Preparation of CyDye DIGE Fluor Dyes
Initially, 5 μl of DMF was added to each tube of 5 nmol CyDye (Cy2, Cy3 and Cy5).
The tubes were vortexed vigorously for 30 sec to dissolve the dyes. This was followed
by centrifugation at 12, 000 x g for 30 sec. Next, 1 mM of each CyDye DIGE Fluor
Minimal Dye stock solution was obtained, i.e., the Cy2, Cy3 and Cy5; giving an intense
colour of yellow, red and blue, respectively. The reconstituted dye stock solutions were
stored at -20 0C and stable for up to 2 months in the dark.
Prior to labeling, a 400 pmol/μl working dye solution for each CyDye was prepared.
The dye stock solution was spun briefly before the addition of 1.5 volumes of DMF to 1
volume of dye stock solution. The resulting working dye solutions were stored at -20
0C in the dark and were only stable for up to 1 week.
3.3.2.4(c)(ii) Minimal Labeling of Protein Samples
A volume of protein sample equivalent to 100 μg was added with 1 μl of 400 pmol/μl
working CyDye solution. The internal standard was labelled with Cy2 while the CRC
and normal protein samples were labelled with either Cy3 or Cy5, according to the
experimental design in Table 3.20. The tube was then mixed and centrifuged briefly
prior to incubation on ice for 30 min in the dark. Next, 1 μl of 10 mM L-Lysine
monohydrochloride was added to stop the labeling reaction. The tube was mixed, spun
briefly and incubated on ice for 10 min in the dark. Finally, the labelled internal
standard and protein samples were processed immediately in first-dimension IEF.

Chapter Three – Methodology
110
3.3.2.4(d) First-Dimension IEF
The first-dimension IEF of protein samples was performed with Immobiline DryStrip
Gels (GE Healthcare, United Kingdom) on the Ettan IPGphor 3 IEF Unit. The
Immobiline DryStrip Gels are pre-cast polyacrylamide gels with pre-formed pH
gradient on a plastic backing. The stable and accurate immobilised pH gradient allows
highly reproducible and reliable first-dimension IEF results for gel-to-gel comparison
(GE Healthcare Bio-Sciences AB, 2005). The Ettan IPGphor 3 IEF Unit is equipped
with Ettan IPGphor 3 Control software ver. 1.2 for the monitoring and documentation of
IEF process.
3.3.2.4(d)(i) Rehydration of Immobiline DryStrip Gels and Samples Application
via Rehydration Loading Protocol
First, the Immobiline DryStrip Reswelling Tray was leveled until the bubble in the spirit
level is centered by turning the leveling feet. Twenty milligrams of DTT, 5 μl of IPG
Buffer (pH 4 – 7) and 2 ul of 1 % (w/v) Bromophenol Blue stock solution were added to
the 1 ml aliquot of Thiourea Rehydration Solution. Subsequently, a 250 μl-mixture
consisting of CyDye-labelled protein samples (i.e., internal standard, CRC and normal
protein samples) and Thiourea Rehydration Solution was pipetted into the tray channel.
The 13 cm Immobiline DryStrip Gel of pH 4 – 7 was then positioned into the tray
channel with gel side down. Finally, the strip was overlaid with PlusOne DryStrip
Cover Fluid and left overnight at room temperature in the dark for rehydration and
sample uptake.
3.3.2.4(d)(ii) IEF of Protein Samples
Following overnight rehydration and sample uptake, the Immobiline DryStrip Gel was
transferred to the Ettan IPGphor Strip Holder. The strip was positioned with gel side up
and the acidic end (“+” end) was oriented towards the anodic end of the Ettan IPGphor

Chapter Three – Methodology
111
3 IEF Unit. Next, two paper electrode wicks were damped with ddH2O and placed onto
both acidic and basic ends of the strip. The electrodes were clipped firmly onto the
paper electrode wicks, where the metal of electrodes was in contact with the thermally
conductive aluminium oxide ceramic of the strip holder. Subsequently, the strip was
overlaid with 108 ml of PlusOne DryStrip Cover Fluid until it was fully covered.
Finally, the IEF process was started and monitored by Ettan IPGphor 3 Control software
with the running conditions shown in Table 3.22. The running conditions were set at 20
0C, 50 μA per strip, while the time required for each step was modified accordingly for
a more convenient overnight IEF run.
Table 3.22: Running conditions for 13 cm Immobiline DryStrip Gels on the Ettan
IPGphor 3 IEF Unit.
Step Step Voltage
Mode
Voltage
(V)
Time
(hr:min:sec)
Volt-hours
(kVh)
1 Step and Hold 100 5:00:00 0.5
2 Step and Hold 500 2:00:00 1.0
3 Gradient 4000 1:42:00 6.8
4 Gradient 8000 1:30:00 12.0
5 Step and Hold 8000 5:37:30 – 6:15:00 45.0 – 50.0
Total 15:49:30 – 16:27:00 65.3 – 70.3
3.3.2.4(e) Second-Dimension Sodium Dodecyl Sulfate (SDS)-Polyacrylamide
Gel Electrophoresis (PAGE)
The second-dimension SDS-PAGE was performed subsequent to the first-dimension
IEF of protein samples. A vertical electrophoresis system, i.e., SE 600 Ruby Standard
Dual Cooled Gel Electrophoresis Unit was used for this purpose.

Chapter Three – Methodology
112
3.3.2.4(e)(i) Preparation of Glass Sandwich
Initially, the gel caster was adjusted until the bubble in the spirit level was centered.
Next, two pieces of clean, unchipped and scratch-free, 18 x 16 cm low fluorescence
glass plates were assembled together with a 2 cm wide x 1 mm thick spacer placed on
each side of the edge. The glass sandwich was secured with clamps on both sides by
tightening the screws on the clamps. Prior to the assembly of glass sandwich on casting
cradle, the laminated gaskets were placed into the casting cradles with foam side down.
The glass sandwich was then placed into the casting cradle with screw side facing out
and sealed with a cam at each side.
3.3.2.4(e)(ii) Preparation of SDS-Denaturing Polyacrylamide Resolving Gel
The proteins were resolved in a 12.5 % SDS-denaturing polyacrylamide gel, which was
prepared according to the gel recipe in Table 3.23.
Table 3.23: Gel recipe for 12.5 % SDS-denaturing polyacrylamide resolving gel.
Component Volume (ml)
Monomer Solution [30 % Acrylamide/Bis Solution 37.5:1 (2.6 % C)] 10.43
4X Resolving Gel Buffer 6.25
10 % (w/v) SDS 0.25
ddH2O 7.93
10 % (w/v) Ammonium persulfate 0.125
TEMED 0.015
Total Volume 25.0
The gel solution was mixed gently and filled into the gel cassette until 5 – 10 mm below
the top of the upper plate edge. Immediately, a thin layer of ddH2O was overlaid on top
of the gel. The gel was then allowed to polymerise for 1 hr.

Chapter Three – Methodology
113
3.3.2.4(e)(iii) Equilibration and Loading of Focused Immobiline DryStrip Gels
The focused Immobiline DryStrip Gels must be equilibrated immediately prior to SDS-
PAGE. First, the focused strip was transferred to a 25 x 200 mm screw-cap culture tube,
with gel side up and the support film towards the wall of tube. Next, 10 ml of 10 mg/ml
DTT-containing SDS Equilibration Buffer was added to the tube. The strip was
allowed to equilibrate for 15 min in the dark with gentle agitation on MS Waver Shaker
at 35 rpm. The solution was then discarded and 10 ml of 25 mg/ml Iodoacetamide-
containing SDS Equilibration Buffer was added. Similarly, the strip was also incubated
in the dark with gentle agitation at 35 rpm for 15 min.
Following this, the equilibration solution was discarded and the focused Immobiline
DryStrip Gel was rinsed briefly with 1X Laemmli SDS Electrophoresis Buffer. The
strip was then slid carefully in between the glass sandwich until it came in contact with
the surface of gel. The focused strip was positioned with the acidic end (“+” end) on
the right side of the gel. Finally, the Immobiline DryStrip Gel was sealed in place with
an aliquot of melted 0.5 % (w/v) agarose sealing solution on the upper surface of the
SDS-denaturing polyacrylamide resolving gel.

Chapter Three – Methodology
114
3.3.2.4(e)(iv) Assembly of Electrophoretic Unit and Electrophoretic Run
The lower buffer chamber of the SE 600 Ruby Standard Dual Cooled Gel
Electrophoresis Unit was first filled with 3 L of 1X Laemmli SDS Electrophoresis
Buffer. The upper buffer chamber was turned upside down where the slotted gasket and
acrylic buffer dam were fitted into both sandwich holder recesses. The glass sandwich
was then released from the caster by removing the cams and clamped in place to the
upper buffer chamber. Finally, the assembled upper buffer chamber with gel sandwich
was fitted into the lower buffer chamber, and 500 ml of 1X Laemmli SDS
Electrophoresis Buffer was filled into the upper buffer chamber.
Upon final assembly of the electrophoretic unit, the electrophoresis was programmed
via the Electrophoresis Power Supply EPS 601 and commenced in two steps with
constant current. The electrophoretic running conditions were: Step 1 – 10 mA per gel
for 20 min; and Step 2 – 30 mA per gel for ~ 2 hr 40 min.
3.3.2.4(f) Acquisition of Gel Images
Once the electrophoresis was completed, the electrophoretic unit was unassembled and
the clamps were unscrewed. The glass sandwich was wiped with deionised water until
the glass plates were clean and free from lint. Subsequently, the glass sandwich was
placed onto the low fluorescence glass plate stage and fixed in position by both front
and rear glass holders at each side. The stage was then placed into the image scanner
and the gel was ready for scanning under a pixel size of 100 μm.
The gel was scanned with Typhoon FLA 9000 Variable Mode Laser Scanner, which
supports the Ettan DIGE System with its fluorescence imaging mode. In this mode, the
Cy2, Cy3 and Cy5 dyes were excited by blue (473 nm), green (532 nm) and red (635
nm) laser, respectively. Upon excitation, the emitted light was collected and
transformed to an electrical signal by bialkali photomultiplier tube (PMT). These

Chapter Three – Methodology
115
electrical signals were then converted for image display. Table 3.24 shows the
excitation and emission wavelengths for different CyDyes, as well as the types of
emission filter and PMT voltages used for their detection. The whole gel scanning
process was monitored and controlled via Typhoon FLA 9000 Control software ver. 1.2.
Table 3.24: Excitation and emission wavelengths, as well as emission filters and PMT
voltages used for the detection of different CyDyes.
CyDye Excitation
Wavelength (nm)
Emission Light
Wavelength (nm)
Emission
Filter
PMT Voltage
(V)
Cy2 489 506 LPB 490 - 630
Cy3 550 570 LPG 560 - 700
Cy5 649 670 LPR 655 - 780

Chapter Three – Methodology
116
3.3.2.4(g) Mass Spectrometry (MS)-Compatible Silver Staining
All gels were post-stained with MS-compatible silver staining to facilitate ensuing spot
picking and mass spectrometric analysis, as well as to ensure satisfactory peptide
sequencing results (Shevchenko et al., 1996). This modified protocol has excluded the
treatment of gel with glutaraldehyde, which is a cross-linking and sensitising agent
commonly used in silver staining procedure. Subsequent to images acquisition, the
glass plates were separated, while the gel was lifted gently and placed carefully into the
staining tray. First, the gel was fixed in a solution of 50 % (v/v) methanol and 5 % (v/v)
acetic acid for 20 min. It was then washed in deionised water for 10 min. Next, the gel
was sensitised with 0.02 % (w/v) sodium thiosulfate for 1 min and rinsed twice with
deionised water for 1 min each. This was followed by incubation in chilled 0.1 % (w/v)
silver nitrate for 20 min at 4 0C. The gel was then rinsed twice with deionised water for
1 min each prior to the developing step. The gel was developed in a solution of 0.04 %
(v/v) formalin (37 % formaldehyde in water) and 2 % (w/v) sodium carbonate with
intensive shaking. In this step, the developer was replaced with a new portion once it
turned yellowish. Finally, the development was terminated by washing the gel with 5 %
(v/v) acetic acid after the desired intensity of staining was achieved. All silver stained
gels were stored in 1 % (v/v) acetic acid at 4 0C for spot picking.
3.3.2.4(h) Image and Data Analysis
The specifically designed and integrated DeCyder 2D software ver. 7.0 in the Ettan
DIGE System allows co-detection of multiplexed gel images with its novel algorithm,
DeCyder Detection Algorithm 6.0. It is an automated image analysis software suite for
the execution of gel-to-gel matching, as well as spots detection, quantification and
analysis with high confidence and accuracy. The DeCyder 2D software ver. 7.0 consists
of five modules, i.e., Image Loader, Differential In-Gel Analysis (DIA), Biological

Chapter Three – Methodology
117
Variation Analysis (BVA), Batch Processor and XML Toolbox. However, only the first
three modules were employed for the analysis of 2-D DIGE results in the current
experimental settings.
3.3.2.4(h)(i) Image Loader Module
In the 2-D DIGE experiments, each gel consisted of three images, i.e., Cy2, Cy3 and
Cy5. The images were first edited in order to remove unwanted artifacts and gel edges.
The editing and cropping of images from the same gel was performed simultaneously
using a three-coloured gel overlay image within the Image Editor module. Next, the
edited gel image files were imported into DeCyder 2D Database through the Image
Loader module, readily analysed with the DIA module.
3.3.2.4(h)(ii) DIA Module
Prior to the inter-gel analysis in BVA module, the imported images were processed via
DIA interface for the co-detection and quantification of protein spots within each in-gel
linked image set. The co-migration of CyDyes produced a set of three co-run images
for a gel (i.e., Cy2, Cy3 and Cy5 images), which were then merged together for triple
detection and matching of protein spots via DeCyder Detection Algorithm 6.0. In the
DIA module, the abundance value of each protein spot was expressed as ratios and
determined by directly comparison of corresponding spots within an in-gel set of
images. In the current experimental setting, the abundance values of the protein spots
for a sample (i.e., CRC tumour or normal colonic mucosa) was quantified against the
internal standard to permit accurate inter-gel protein spots comparison. Finally, all
generated spots data were utilised for subsequent inter-gel analysis in BVA module.

Chapter Three – Methodology
118
3.3.2.4(h)(iii) BVA Module
Following spot detection and quantification, the generated DIA workspaces, along with
all original scanned image files, were imported into BVA module for inter-gel analysis.
The gel-to-gel matching of all protein spots was performed within this module and
allows for quantitative comparison of the protein expression levels across all biological
replicates. Initially, one of the Cy2 images was selected as ‘Master’ image, which all
the other images were matched for the identification of common protein spots across
multiple gels. Subsequently, the average ratio of each protein spot, which indicates the
difference in its expression level between the CRC tumour and normal colonic mucosa
groups, was calculated. The Two-tailed Paired t-test with False Discovery Rate (FDR)
correction was performed to statistically assess the significance in protein expression
changes between the CRC tumour and normal colonic mucosa samples within each
stage of the CRC group. A p value of less than 0.05 indicates that the observed
difference in protein abundance is statistically significant, where only less than 5 % of
the probability is merely due to stochastic events.
3.3.2.5 Protein Identification via Liquid Chromatography-Tandem Mass
Spectrometry (LC-MS/MS)
The desired protein spots (where the different protein expression levels were
statistically significant between the CRC tumour and normal colonic mucosa samples in
each stage of the CRC group) were excised from the polyacrylamide gels and pooled for
subsequent LC-MS/MS analysis. These dried MS-compatible silver stained gel bands
were sent to Proteomics International Pty Ltd in Australia for LC-MS/MS and MS/MS
data analysis.

Chapter Three – Methodology
119
3.3.2.5(a) Mass Spectrometry (MS)
In our current study, the MS analysis was performed on the UltiMate 3000 Nano HPLC
System (Dionex, United States) interfaced with a 4000 Q TRAP Hybrid Triple
Quadrupole / Linear Ion Trap Mass Spectrometer (Applied Biosystems, United States)
which is coupled to a NanoSpray source.
3.3.2.5(a)(i) De-staining Step
Prior to trypsin digestion, the silver stained proteins were de-stained with chemical
reducers in order to remove the silver, as described previously in Gharahdaghi et al.,
1999 (Gharahdaghi et al., 1999). Initially, two stock solutions of 30 mM potassium
ferricyanide and 100 mM sodium thiosulfate were prepared. Next, the working solution
which consisted of a 1:1 ratio of these stock solutions was prepared freshly before each
de-staining process. A 30 – 50 μl of working solution was added until the gel band is
fully covered, and the tube was vortexed occasionally. The gel band was then rinsed
with deionised water for a few times to stop the reaction once the brownish colour of
the gel band disappeared. Subsequently, 200 mM of ammonium bicarbonate was added
to cover the gel band and left at room temperature for 20 min. The solution was then
discarded and the gel band was cut into smaller pieces. The gel pieces were washed
with deionised water and dehydrated repeatedly with the changing of acetonitrile (ACN)
solution until they turned opaque white. Finally, the gel pieces were dried for 30 min in
a vacuum centrifuge.
3.3.2.5(a)(ii) Trypsin Digestion and Peptide Extraction
The protein samples were digested with trypsin and the resulting peptides were
extracted according to standard techniques, as previously described in Bringans et al.,
2008 (Bringans et al., 2008). Ten microlitres of trypsin digest solution (which consisted
of 12.5 μg/ml of trypsin in 25 mM of ammonium bicarbonate) was added to dried gel

Chapter Three – Methodology
120
pieces and incubated overnight at 37 0C. Next, the digested peptides were extracted
twice with the addition of 10 – 20 μl ACN containing 1 % trifluoroacetic acid (TFA)
solution and incubated at room temperature for 20 min. The pooled extracts were then
dried and stored at -20 0C for further analysis via LC-MS/MS.
3.3.2.5(a)(iii) LC-MS/MS
The dried peptide extracts were resuspended in 50 μl of 2 % ACN consisting 0.05 %
TFA solution. Ten microlitres of tryptic peptides were then loaded onto the Acclaim
PepMap100 C18 Nanocolumn (3 μm, 100 Å, 75 μm i.d. x 15 cm) (Dionex, United
States). Subsequently, the peptides were eluted over 60 min through the column with a
linear gradient of 10 – 40 % ACN consisting 0.1 % formic acid at a flow-rate of 300
nl/min, into the mass spectrometer via a PicoTip emitter. The mass spectrometer was
operated with the ion source temperature of 150 0C and the spray voltage of 2650 V
(Ravenscroft et al., 2008).
3.3.2.5(b) Peptide Matching and Database Searching
All fragment ions data were imported into Mascot software ver. 2.3.02 (Matrix Science,
United Kingdom) for peptide matching and database searching. The MS/MS Ions
Search was performed with the following searching parameters against Homo sapiens
entries in the LudwigNR database (Aug 2012; 281, 382 sequences): peptide mass
tolerance was +1.2 Da, fragment mass tolerance was +0.6 Da, trypsin specificity was
applied to a maximum of one missed cleavage, and the monoisotopic mass value was
reported. In addition, there was no fixed modification being applied, but the oxidation
of methionines was set as variable modification.

Chapter Four – Results
121
CHAPTER FOUR
RESULTS

Chapter Four – Results
122
4.1 Part A: SNPs Genotyping via Allelic Discrimination Assays
4.1.1 Genotyping of the NOD2/CARD15 Variants
The genotyping of the NOD2/CARD15 variants was performed via real-time PCR with
TaqMan chemistry. Figure 4.1 illustrates the allelic discrimination plots that summarise
the genetic distribution of each NOD2/CARD15 variant in both CRC patient and healthy
control groups. The Arg702Trp, Gly908Arg and 3020insC variants appear
monomorphic (homozygous wild-type) in our Malaysian population, as depicted in
Figures 4.1 (a), (b) and (c) respectively. On the other hand, the mutation-positive
heterozygotes were reported in addition to the homozygous wild-type for both
Pro268Ser and JW1 variants [Figures 4.1 (d) and (e)].

Chapter Four – Results
123
(a) Arg702Trp
Figure 4.1: Allelic discrimination plots for genetic distribution of the NOD2/CARD15
variants.
CRC Group
Control Group
Homozygous C

Chapter Four – Results
124
(b) Gly908Arg
Figure 4.1, continued.
CRC Group
Control Group
Homozygous G

Chapter Four – Results
125
(c) 3020insC
Figure 4.1, continued.
CRC Group
Control Group
Homozygous wild-type

Chapter Four – Results
126
(d) Pro268Ser
Figure 4.1, continued.
CRC Group
Control Group
Homozygous C Heterozygous C/T

Chapter Four – Results
127
(e) JW1
Figure 4.1, continued.
CRC Group
Control Group
Homozygous C Heterozygous C/T

Chapter Four – Results
128
Tables 4.1 and 4.2 summarise the respective genotype and allele frequencies of the
Arg702Trp, Gly908Arg, 3020insC, Pro268Ser and JW1 variants in each CRC patient
and healthy control group. The observed genotype frequencies in the control group fit
the HWE model for all the NOD2/CARD15 variants studied (p > 0.05) (Table 4.1).
With regards to our Malaysian population, the mutant alleles of these NOD2/CARD15
variants were either absent or present in an extremely low frequency (< 2.0 %) (Table
4.2). The rare variant (allele T) of the Pro268Ser and JW1 was scored as heterozygotes
with a frequency of only 3.5 % and 0.6 %, respectively. On the other hand, the Fisher’s
Exact Test had revealed that none of the NOD2/CARD15 variants was significantly
associated to the development of CRC in Malaysian patients (p > 0.05) (Tables 4.1 and
4.2).

Chapter Four – Results
129
Table 4.1: Genotype frequencies with HWE testing, p value and OR with 95 % CI for
all NOD2/CARD15 variants in each CRC patient and healthy control group.
NOD2/
CARD15
Variant
Genotype
Genotype Frequency
(%)
Fisher’s
p value
OR
(95 % CI)
HWE
(Control)
p value CRC
Patient
Control
Arg702Trp
C/C
C/T
T/T
130 (100)
0 (0)
0 (0)
212 (100)
0 (0)
0 (0)
1.0000
-
-
Gly908Arg
G/G
G/C
C/C
130 (100)
0 (0)
0 (0)
212 (100)
0 (0)
0 (0)
1.0000
-
-
3020insC
-/-
-/+
+/+
130 (100)
0 (0)
0 (0)
212 (100)
0 (0)
0 (0)
1.0000
-
-
Pro268Ser
C/C
C/T
T/T
126 (96.9)
4 (3.1)
0 (0)
204 (96.2)
8 (3.8)
0 (0)
1.0000
1.2353
(0.3645-4.1868)
0.8095
(0.2388-2.7437)
-
0.7795
JW1
C/C
C/T
T/T
129 (99.2)
1 (0.8)
0 (0)
211 (99.5)
1 (0.5)
0 (0)
1.0000
0.6114
(0.0379-9.8597)
1.6357
(0.1014-26.3784)
-
0.9725

Chapter Four – Results
130
Table 4.2: Allele frequencies, p value and OR with 95 % CI for all NOD2/CARD15
variants in each CRC patient and healthy control group.
NOD2/CARD15
Variant
Allele
Allele Frequency (%)
Fisher’s
p value
OR
(95 % CI)
CRC
Patient
Control
Arg702Trp C
T
260 (100)
0 (0)
424 (100)
0 (0)
1.0000
-
Gly908Arg G
C
260 (100)
0 (0)
424 (100)
0 (0)
1.0000
-
3020insC -
+
260 (100)
0 (0)
424 (100)
0 (0)
1.0000 -
Pro268Ser
C
T
256 (98.5)
4 (1.5)
416 (98.1)
8 (1.9)
1.0000
1.2308
(0.3669-4.1286)
0.8125
(0.2422-2.7255)
JW1
C
T
259 (99.6)
1 (0.4)
423 (99.8)
1 (0.2)
1.0000
0.6123
(0.0381-9.8318)
1.6332
(0.1017-26.2250)

Chapter Four – Results
131
4.1.2 Genotyping of the Common GWAS-identified CRC-associated Variants
Figure 4.2 depicts the distribution of the common GWAS-identified CRC-associated
variants in the Malaysian population, i.e., the rs6983267, rs4939827, rs4779584,
rs16892766 and rs3802842. All the three genotypes of these biallelic polymorphisms
were scored in both CRC patient and healthy control groups [Figures 4.2 (a), (b), (c)
and (e)], with the exclusion of the rs16892766 [Figure 4.2 (d)].

Chapter Four – Results
132
(a) rs6983267
Figure 4.2: Allelic discrimination plots for genetic distribution of the common GWAS-
identified CRC-associated variants.
CRC Group
Control Group
Homozygous G Heterozygous G/T Homozygous T

Chapter Four – Results
133
(b) rs4939827
Figure 4.2, continued.
CRC Group
Control Group
Homozygous C Heterozygous T/C Homozygous T

Chapter Four – Results
134
(c) rs4779584
Figure 4.2, continued.
CRC Group
Control Group
Homozygous C Heterozygous C/T Homozygous T

Chapter Four – Results
135
(d) rs16892766
Figure 4.2, continued.
CRC Group
Control Group
Homozygous A Heterozygous A/C

Chapter Four – Results
136
(e) rs3802842
Figure 4.2, continued.
CRC Group
Control Group
Homozygous A Heterozygous C/A Homozygous C

Chapter Four – Results
137
Tables 4.3 and 4.4 show the genotype and allele frequencies of these common variants
in the CRC patient and healthy control groups, respectively. The genotype frequencies
of rs4939827, rs4779584, rs16892766 and rs3802842 SNPs in healthy control group fit
the HWE (p > 0.05), but those of rs6983267 did not (p < 0.05) (Table 4.3). As shown in
Table 4.3, the genotype frequencies of rs6983267, rs4779584, rs16892766 and
rs3802842 did not differ significantly between the CRC patient and healthy control
groups (p > 0.05). However, the common variant rs4939827 was inversely correlated to
CRC susceptibility with an OR of 0.5936 (p < 0.05; 95 % CI = 0.3803-0.9267) (Table
4.3). Hence, we suggest that the allele C might confer a protective effect on the genetic
predisposition of CRC in our Malaysian population (Table 4.4).

Chapter Four – Results
138
Table 4.3: Genotype frequencies with HWE testing, p value and OR with 95 % CI for
all common GWAS-identified CRC-associated variants in each CRC patient
and healthy control group.
*p < 0.05 – statistically significant
SNP
Genotype
Genotype Frequency
(%)
Fisher’s
p value
OR
(95 % CI)
HWE
(Control)
p value CRC
Patient
Control
rs6983267
G/G
G/T
T/T
29 (22.3)
58 (44.6)
43 (33.1)
43 (20.3)
87 (41.0)
82 (38.7)
0.6831
0.5733
0.3548
1.1285
(0.6632-1.9202)
1.1574
(0.7447-1.7989)
0.7836
(0.4956-1.2389)
0.0284
rs4939827
T/T
T/C
C/C
18 (13.8)
63 (48.5)
49 (37.7)
22 (10.4)
83 (39.1)
107 (50.5)
0.3867
0.0930
0.0253*
1.3880
(0.7136-2.6996)
1.4614
(0.9404-2.2712)
0.5936
(0.3803-0.9267)
0.3293
rs4779584
C/C
C/T
T/T
7 (5.4)
44 (33.8)
79 (60.8)
8 (3.8)
73 (34.4)
131 (61.8)
0.5881
1.0000
0.9090
1.4512
(0.5136-4.1008)
0.9742
(0.6146-1.5443)
0.9578
(0.6119-1.4991)
0.5787
rs16892766
A/A
A/C
C/C
129 (99.2)
1 (0.8)
0 (0)
211 (99.5)
1 (0.5)
0 (0)
1.0000
1.0000
1.0000
0.6114
(0.0379-9.8597)
1.6357
(0.1014-26.3784)
-
0.9725
rs3802842
C/C
C/A
A/A
20 (15.4)
62 (47.7)
48 (36.9)
29 (13.7)
98 (46.2)
85 (40.1)
0.7508
0.8238
0.5701
1.1473
(0.6192-2.1260)
1.0606
(0.6848-1.6426)
0.8746
(0.5578-1.3714)
0.9290

Chapter Four – Results
139
Table 4.4: Allele frequencies, p value and OR with 95 % CI for all common GWAS-
identified CRC-associated variants in each CRC patient and healthy control
group.
*p < 0.05 – statistically significant
SNP
Allele
Allele Frequency (%) Fisher’s
p value
OR
(95 % CI) CRC Patient Control
rs6983267
G
T
116 (44.6)
144 (55.4)
173 (40.8)
251 (59.2)
0.3394
1.1688
(0.8556-1.5966)
0.8556
(0.6263-1.1688)
rs4939827
T
C
99 (38.1)
161 (61.9)
127 (30.0)
297 (70.0)
0.0298*
1.4380
(1.0386-1.9909)
0.6954
(0.5023-0.9628)
rs4779584
C
T
58 (22.3)
202 (77.7)
89 (21.0)
335 (79.0)
0.7019
1.0808
(0.7435-1.5709)
0.9253
(0.6366-1.3449)
rs16892766
A
C
259 (99.6)
1 (0.4)
423 (99.8)
1 (0.2)
1.0000
0.6123
(0.0381-9.8318)
1.6332
(0.1017-26.2250)
rs3802842
C
A
102 (39.2)
158 (60.8)
156 (36.8)
268 (63.2)
0.5695
1.1091
(0.8072-1.5238)
0.9017
(0.6562-1.2389)

Chapter Four – Results
140
4.1.3 Genotyping of the Low-penetrance Genes
4.1.3.1 XRCC1 Variants
All three genotypes of the biallelic polymorphisms, XRCC1 rs25487 and rs1799782
were scored in our Malaysian population, as illustrated in Figures 4.3 (a) and (c).
Meanwhile, the genotyping on the XRCC1 rs25489 variant revealed the common
presence of homozygous G and heterozygous genotypes in both CRC patient and
healthy control groups. The homozygote A of the rs25489 variant is relatively rare,
where only one individual presented with this genotype in our control group [Figure 4.3
(b)].
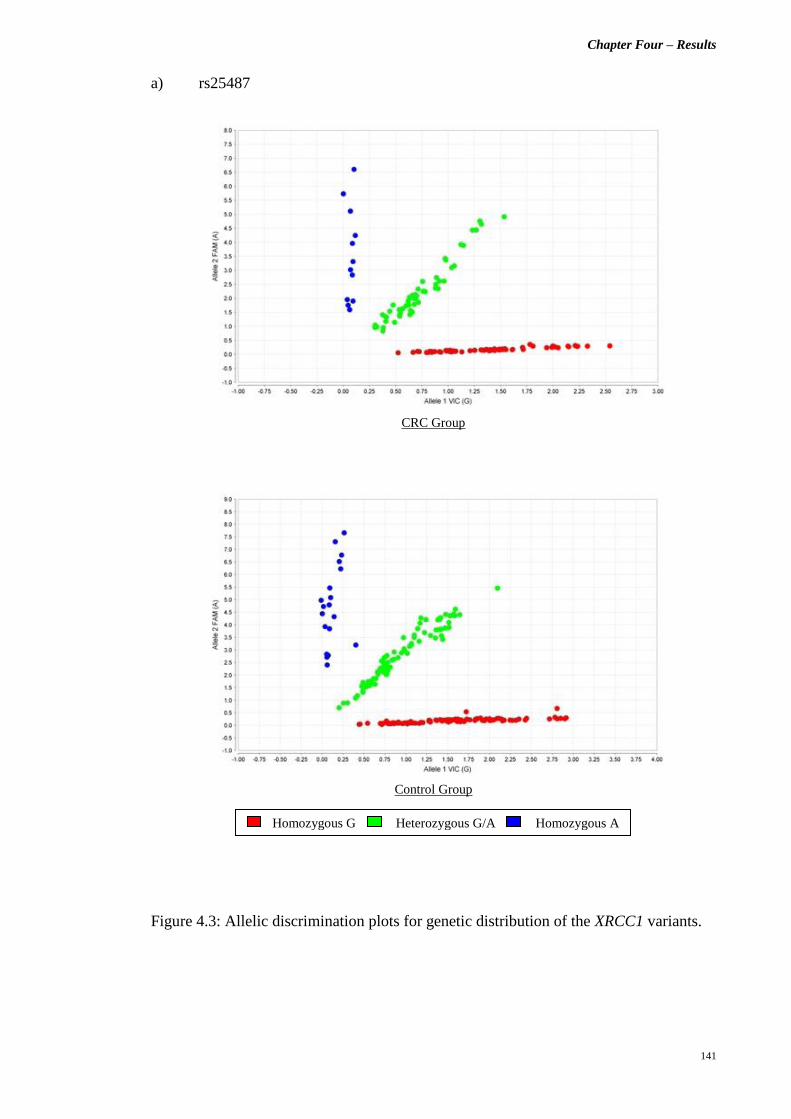
Chapter Four – Results
141
a) rs25487
Figure 4.3: Allelic discrimination plots for genetic distribution of the XRCC1 variants.
CRC Group
Control Group
Homozygous G Heterozygous G/A Homozygous A

Chapter Four – Results
142
b) rs25489
Figure 4.3, continued.
CRC Group
Control Group
Homozygous G Heterozygous G/A Homozygous A

Chapter Four – Results
143
c) rs1799782
Figure 4.3, continued.
CRC Group
Control Group
Homozygous T Heterozygous C/T Homozygous C

Chapter Four – Results
144
As shown in Table 4.5, the observed genotype frequencies in our control group were
within the probability limits for HWE (p > 0.05). The homozygous genotypes for the
minor alleles of all three XRCC1 SNPs were in very low frequencies, i.e., less than 10.0 %
in our population. The homozygotes A (minor allele carriers) for the XRCC1 variant
rs25489 was only 0.5 % among the healthy controls and completely absent among the
CRC patients (Table 4.5). Further statistical analysis with Fisher’s Exact Test failed to
establish any significant association between the studied XRCC1 genetic variants and
CRC susceptibility in our Malaysian cohort (p > 0.05) (Tables 4.5 and 4.6).

Chapter Four – Results
145
Table 4.5: Genotype frequencies with HWE testing, p value and OR with 95 % CI for
all XRCC1 variants in each CRC patient and healthy control group.
SNP
Genotype
Genotype Frequency
(%)
Fisher’s
p value
OR
(95 % CI)
HWE
(Control)
p value
CRC
Patient
Control
rs25487
G/G
G/A
A/A
65 (50.0)
53 (40.8)
12 (9.2)
109 (51.4)
84 (39.6)
19 (9.0)
0.8243
0.9095
1.0000
0.9450
(0.6106-1.4625)
1.0489
(0.6721-1.6369)
1.0330
(0.4840-2.2048)
0.6275
rs25489
G/G
G/A
A/A
105 (80.8)
25 (19.2)
0 (0)
170 (80.2)
41 (19.3)
1 (0.5)
1.0000
1.0000
1.0000
1.0376
(0.5977-1.8015)
0.9930
(0.5709-1.7273)
-
0.3737
rs1799782
C/C
C/T
T/T
65 (50.0)
56 (43.1)
9 (6.9)
103 (48.6)
94 (44.3)
15 (7.1)
0.8243
0.8235
1.0000
1.0583
(0.6838-1.6378)
0.9500
(0.6116-1.4756)
0.9769
(0.4147-2.3012)
0.2985

Chapter Four – Results
146
Table 4.6: Allele frequencies, p value and OR with 95 % CI for all XRCC1 variants in
each CRC patient and healthy control group.
SNP
Allele
Allele Frequency (%) Fisher’s
p value
OR
(95 % CI) CRC Patient Control
rs25487
G
A
183 (70.4)
77 (29.6)
302 (71.2)
122 (28.8)
0.8624
0.9601
(0.6839-1.3479)
1.0416
(0.7419-1.4623)
rs25489
G
A
235 (90.4)
25 (9.6)
381 (89.9)
43 (10.1)
0.8956
1.0609
(0.6313-1.7828)
0.9426
(0.5609-1.5840)
rs1799782
C
T
186 (71.5)
74 (28.5)
300 (70.8)
124 (29.2)
0.8623
1.0389
(0.7387-1.4612)
0.9625
(0.6843-1.3538)

Chapter Four – Results
147
4.1.3.2 EGF +61 A>G (rs4444903)
All three genotypes, i.e., homozygous G, heterozygous and homozygous A, of the EGF
+61 A>G polymorphism were scored in our Malaysian population (Figure 4.4). The
homozygous G was the most frequent genotype reported among the CRC patients
(48.4 %), while the heterozygotes were the most common in the control group (49.1 %).
On the other hand, the homozygous A was the least frequent genotype in both study
groups. The observed genotype frequencies of the EGF +61 A>G variant in the control
group did not fit the HWE model (p < 0.05) (Table 4.7). As calculated via the Fisher’s
Exact Test, both genotype and allele frequencies of the EGF +61 A>G polymorphism
did not differ significantly between CRC patient and healthy control groups (p > 0.05)
(Table 4.7).
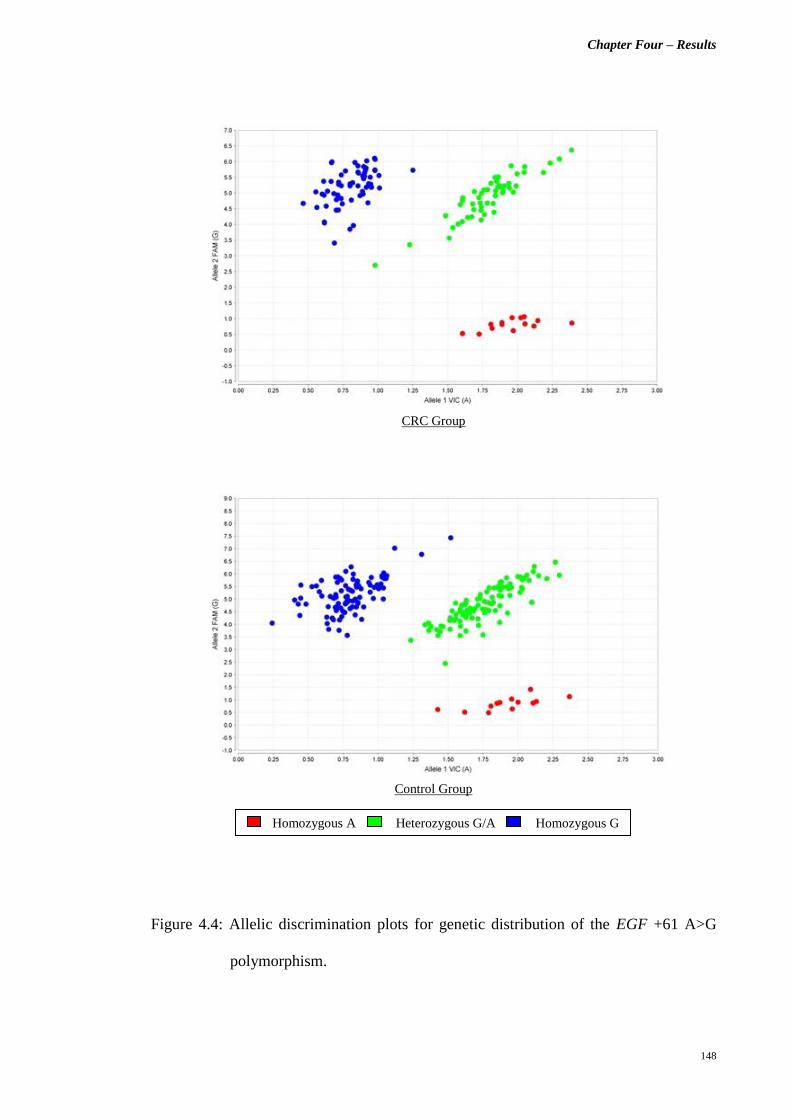
Chapter Four – Results
148
Figure 4.4: Allelic discrimination plots for genetic distribution of the EGF +61 A>G
polymorphism.
CRC Group
Control Group
Homozygous A Heterozygous G/A Homozygous G

Chapter Four – Results
149
Table 4.7: Genotype frequencies with HWE testing, allele frequencies, p value and OR
with 95 % CI of the EGF +61 A>G variant in each CRC patient and healthy
control group.
Genotype /
Allele
Genotype /
Allele Frequency (%)
Fisher’s
p value
OR
(95 % CI)
HWE
(Control)
p value
CRC
Patient
Control
Genotype
G/G
G/A
A/A
63 (48.4)
53 (40.8)
14 (10.8)
95 (44.8)
104 (49.1)
13 (6.1)
0.5765
0.1471
0.1486
1.1581
(0.7475-1.7940)
0.7148
(0.4597-1.1115)
1.8475
(0.8394-4.0662)
0.0252
Allele
G
A
179 (68.8)
81 (31.2)
294 (69.3)
130 (30.7)
0.9321
0.9772
(0.6997-1.3645)
1.0234
(0.7328-1.4291)

Chapter Four – Results
150
4.1.3.3 VEGF +936 C>T (rs3025039)
Figure 4.5 illustrates the genetic distribution of the VEGF +936 C>T polymorphism in
both CRC patient and healthy control groups. All three genotypes of this biallelic
polymorphism were scored in our healthy control group, but the homozygous of the
minor allele T was not reported among CRC patients (Figure 4.5). Overall, the
homozygous C genotype was the most common in our Malaysian population and the
observed genotype frequencies for the control group were in HWE (p > 0.05) (Table
4.8). As summarised in Table 4.8, none of the genotypes or alleles of the VEGF +936
C>T polymorphism was significantly associated to disease susceptibility in Malaysian
CRC patients (p > 0.05).

Chapter Four – Results
151
Figure 4.5: Allelic discrimination plots for genetic distribution of the VEGF +936 C>T
polymorphism.
CRC Group
Control Group
Homozygous C Heterozygous C/T Homozygous T

Chapter Four – Results
152
Table 4.8: Genotype frequencies with HWE testing, allele frequencies, p value and OR
with 95 % CI of the VEGF +936 C>T polymorphism in each CRC patient
and healthy control group.
Genotype /
Allele
Genotype /
Allele Frequency (%)
Fisher’s
p value
OR
(95 % CI)
HWE
(Control)
p value
CRC
Patient
Control
Genotype
C/C
C/T
T/T
99 (76.2)
31 (23.8)
0 (0)
151 (71.2)
57 (26.9)
4 (1.9)
0.3794
0.6106
0.3018
1.2901
(0.7816-2.1295)
0.8515
(0.5139-1.4108)
-
0.6032
Allele
C
T
229 (88.1)
31 (11.9)
359 (84.7)
65 (15.3)
0.2567
1.3375
(0.8454-2.1162)
0.7477
(0.4726-1.1829)

Chapter Four – Results
153
4.2 Part B: Differential Transcriptome Analysis
4.2.1 RNA Concentration and Integrity Assessment
The concentration and integrity of isolated total RNA were assessed by using the
Agilent 2100 Bioanalyzer. In the current study, total RNA samples with RIN value of
8.0 and above were selected for the differential expression analysis. Figures 4.6 (a), (b)
and (c) are the examples of electropherogram for total RNA samples with RIN value of
8.0, 9.0 and 10.0, respectively.

Chapter Four – Results
154
(a) Total RNA sample with RIN = 8.0 [Sample T1 (C)]
(b) Total RNA sample with RIN = 9.0 [Sample T7 (N)]
(c) Total RNA sample with RIN = 10.0 [Sample T2 (N)]
Figure 4.6: Electropherogram obtained from the Agilent 2100 Expert software. The X-
axis represents the time in sec [s], while Y-axis, the fluorescence unit [FU].

Chapter Four – Results
155
4.2.2 DEGs Identification
4.2.2.1 Characterisation of Differential Banding Patterns
The identification of DEGs in CRC tumours was performed via a two-step ACP-based
PCR. The resulting amplified products were visualised on 3 % (w/v) ethidium bromide-
stained agarose gels, and a total of 13 differentially expressed bands were observed, as
shown in Figure 4.7. The bands with different intensities between CRC tumours and
normal colonic mucosa might represent potential DEGs, and thus were selected for
further analysis.

Chapter Four – Results
156
A4 ACP Primer A6 ACP Primer A9 ACP Primer
A10 ACP Primer A13 ACP Primer
A18 ACP Primer A20 ACP Primer
Figure 4.7: Differential banding patterns on 3 % (w/v) ethidium bromide-stained
agarose gels. Lane N represents the normal colonic mucosa, while lane C,
the CRC tumour.
50 bp N C 50 bp N C
500 bp
500 bp
250 bp 250 bp
A4.2 A4.1 A6.1
50 bp N C
50 bp N C
500 bp
250 bp
500 bp
250 bp
A10.1
50 bp N C
50 bp N C
500 bp
500 bp
250 bp
250 bp
A13.4
A13.3
A13.2
A13.1
A18.1
50 bp N C
500 bp
250 bp
A20.2 A20.1
A9.2
A9.1

Chapter Four – Results
157
4.2.2.2 Sequence Similarity Matching and Identification of DEGs
Following sequencing, the genes of interest were identified through sequence similarity
matching with the nucleotide database available from NCBI. Each differentially
expressed band corresponded to a gene identity, with the exception of bands A4.1, A9.2
and A13.1 (Tables 4.9 and 4.10). Tables 4.9 and 4.10 list out all the identified DEGs
and their physiological importance, as well as sequence homology (%) and accession
number of the BLAST results. Among the 16 successfully identified DEGs, 13 of them
were over-expressed (Table 4.9), while 3 were under-expressed in CRC tumours (Table
4.10).
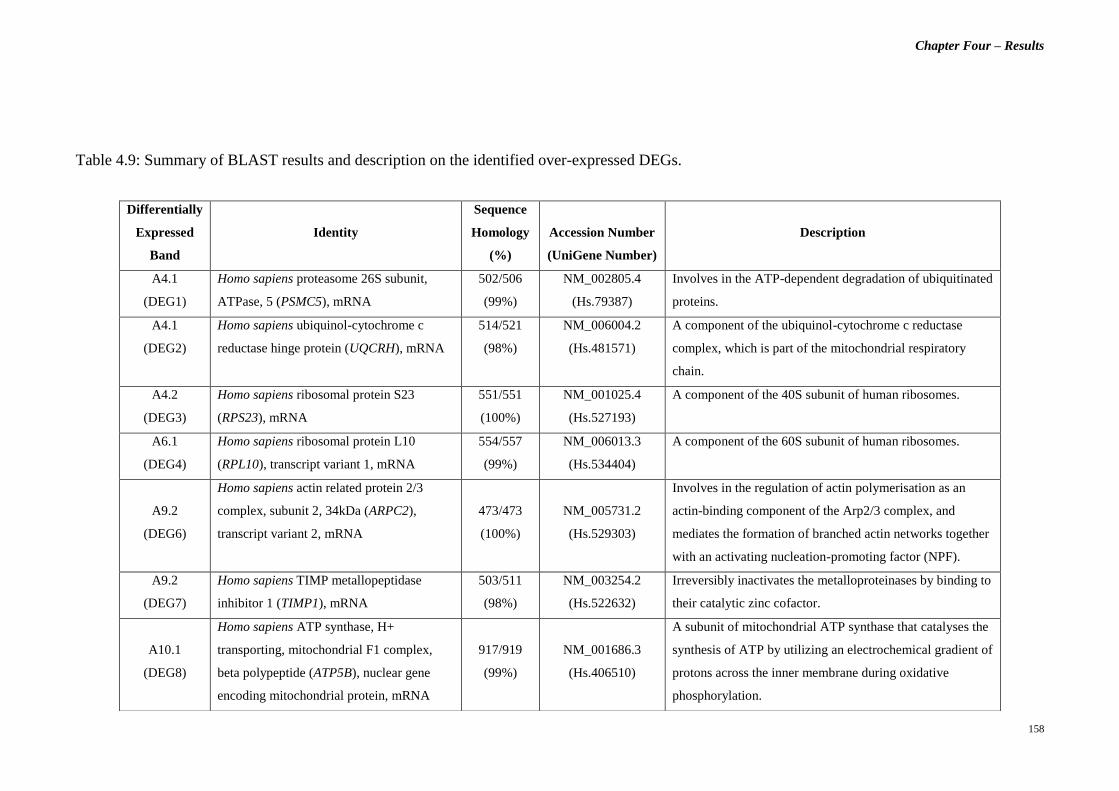
Chapter Four – Results
158
Table 4.9: Summary of BLAST results and description on the identified over-expressed DEGs.
Differentially
Expressed
Band
Identity
Sequence
Homology
(%)
Accession Number
(UniGene Number)
Description
A4.1
(DEG1)
Homo sapiens proteasome 26S subunit,
ATPase, 5 (PSMC5), mRNA
502/506
(99%)
NM_002805.4
(Hs.79387)
Involves in the ATP-dependent degradation of ubiquitinated
proteins.
A4.1
(DEG2)
Homo sapiens ubiquinol-cytochrome c
reductase hinge protein (UQCRH), mRNA
514/521
(98%)
NM_006004.2
(Hs.481571)
A component of the ubiquinol-cytochrome c reductase
complex, which is part of the mitochondrial respiratory
chain.
A4.2
(DEG3)
Homo sapiens ribosomal protein S23
(RPS23), mRNA
551/551
(100%)
NM_001025.4
(Hs.527193)
A component of the 40S subunit of human ribosomes.
A6.1
(DEG4)
Homo sapiens ribosomal protein L10
(RPL10), transcript variant 1, mRNA
554/557
(99%)
NM_006013.3
(Hs.534404)
A component of the 60S subunit of human ribosomes.
A9.2
(DEG6)
Homo sapiens actin related protein 2/3
complex, subunit 2, 34kDa (ARPC2),
transcript variant 2, mRNA
473/473
(100%)
NM_005731.2
(Hs.529303)
Involves in the regulation of actin polymerisation as an
actin-binding component of the Arp2/3 complex, and
mediates the formation of branched actin networks together
with an activating nucleation-promoting factor (NPF).
A9.2
(DEG7)
Homo sapiens TIMP metallopeptidase
inhibitor 1 (TIMP1), mRNA
503/511
(98%)
NM_003254.2
(Hs.522632)
Irreversibly inactivates the metalloproteinases by binding to
their catalytic zinc cofactor.
A10.1
(DEG8)
Homo sapiens ATP synthase, H+
transporting, mitochondrial F1 complex,
beta polypeptide (ATP5B), nuclear gene
encoding mitochondrial protein, mRNA
917/919
(99%)
NM_001686.3
(Hs.406510)
A subunit of mitochondrial ATP synthase that catalyses the
synthesis of ATP by utilizing an electrochemical gradient of
protons across the inner membrane during oxidative
phosphorylation.

Chapter Four – Results
159
Table 4.9, continued.
Differentially
Expressed
Band
Identity
Sequence
Homology
(%)
Accession Number
(UniGene Number)
Description
A13.2
(DEG11)
Homo sapiens chromosome 11 open reading
frame 10 (C11orf10), mRNA
273/273
(100%)
NM_014206.3
(Hs.437779)
Unknown.
A13.3
(DEG12)
Homo sapiens mitochondrial ribosomal
protein L24 (MRPL24), nuclear gene
encoding mitochondrial protein, transcript
variant 2, mRNA
408/411
(99%)
NM_024540.3
(Hs.418233)
Involves in protein synthesis within the mitochondrion.
A13.4
(DEG13)
Homo sapiens similar to OK/SW-CL.16
(LOC100288418)
635/644
(98%)
XM_002342023.1
(-)
Unknown.
A18.1
(DEG14)
Homo sapiens family with sequence
similarity 96, member B (FAM96B),
transcript variant 2, transcribed RNA
486/487
(99%)
NR_024525.1
(Hs.9825)
Involves in chromosome segregation as part of the mitotic
spindle-associated MMXD complex.
A20.1
(DEG15)
Homo sapiens ribosomal protein L35
(RPL35), mRNA
440/446
(99%)
NM_007209.3
(Hs.182825)
A component of the 60S subunit of human ribosomes.
A20.2
(DEG16)
Homo sapiens chromosome 6 open reading
frame173 (C6orf173), mRNA
551/554
(99%)
NM_001012507.2
(Hs.486401)
May be required for proper chromosome segregation during
mitosis and involved with CENPT in the establishment of
centromere chromatin structure.

Chapter Four – Results
160
Table 4.10: Summary of BLAST results and description on the identified under-expressed DEGs.
Differentially
Expressed
Band
Identity
Sequence
Homology
(%)
Accession Number
(UniGene Number)
Description
A9.1
(DEG5)
Homo sapiens ribosomal protein L37
(RPL37), mRNA
284/284
(100%)
NM_000997.4
(Hs.558601)
A component of the 60S subunit of human ribosomes, and
can bind to the 23S rRNA.
A13.1
(DEG9)
Homo sapiens solute carrier family 25
(mitochondrial carrier; citrate transporter),
member 1 (SLC25A1), nuclear gene
encoding mitochondrial protein, mRNA
165/165
(100%)
NM_005984.2
(Hs.111024)
A mitochondrial tricarboxylate transporter which is
responsible for the movement of citrate across the
mitochondrial inner membrane.
A13.1
(DEG10)
Homo sapiens similar to cytochrome c
oxidase subunit II (LOC100288578),
miscRNA
141/146
(97%)
XR_078216.1
(-)
Unknown.

Chapter Four – Results
161
4.2.3 Confirmatory Test
4.2.3.1 Assessment of Amplification Efficiency via CT Slope Method
To ensure accuracy and reliability of the Comparative CT study, the PCR amplification
efficiency for both reference and target gene assays must be approximately equal. In
our current study, an efficiency value of 90 – 110 % is acceptable. Figure 4.8 illustrates
the example of the standard curve for gene expression assay with an efficiency of
100.6 %.
Figure 4.8: Standard curve of the RPL10 gene expression assay.

Chapter Four – Results
162
4.2.3.2 Relative Quantification of DEGs Expression via Comparative CT (ΔΔCT)
Experiment
Following the commencement of PCR amplification for all the DEGs on paired tissue
specimens, i.e., both CRC tumour and normal colonic mucosa, the relative
quantification of their expression level was computed by using the afore-mentioned
software. The Applied Biosystems 7500 software ver. 2.0.5 was used to obtain the
relative genes expression level between each individual paired sample. The Integromics
RealTime StatMiner software ver. 4.2.8 on the other hand, was employed to assess the
stability of the chosen reference genes, quantify the relative expression level of the
identified DEGs across all the sample pairs, and also determine the statistical
significance of the observed differential expression patterns in current sample cohort.
4.2.3.2(a) Computation of ΔCT, ΔΔCT and TCΔΔ-2 values
Figure 4.9 shows the calculated ΔCT, ΔΔCT and TCΔΔ-2 values for one of the sample pairs
using the Applied Biosystems 7500 software ver. 2.0.5. These data were computed by
using both ACTB and GAPDH as reference genes. The relative expression, i.e., over- or
under-expression, of the DEGs is illustrated in a bar chart of log10 RQ vs sample (Figure
4.10).

Chapter Four – Results
163
Figure 4.9: Computed ΔCT, ΔΔCT and TCΔΔ-2 values for Paired Sample T19 (N) and (C).

Chapter Four – Results
164
Figure 4.10: Bar chart showing the relative expression of all DEGs for Paired Sample
T19 (N) and (C).

Chapter Four – Results
165
4.2.3.2(b) Determination of Statistical Significance of the Observed Differential
Expression Patterns.
As stated previously, the raw CT data obtained for all paired samples were imported to
the Integromics RealTime StatMiner software ver. 4.2.8, which executes the two-tailed
paired t-test and computes the p value for each observed differential expression pattern.
The statistical significance of the observed fold change in expression for all the reported
DEGs were determined for each sample group, i.e., early stage CRC, advanced stage
CRC, right-sided CRC tumours and left-sided CRC tumours. In early stage CRC group,
the RPL35, RPS23 and TIMP1 genes were significantly over-expressed (p < 0.05),
while the ARPC2 gene was under-expressed (p < 0.05) (Table 4.11). On the other hand,
the C6orf173, RPL35, RPS23 and TIMP1 genes were reported to be significantly over-
expressed (p < 0.05) in advanced stage primary CRC tumours (Table 4.12). Figures
4.11 (a) and (b) illustrate the statistically significant and non-significant DEGs for both
early- and advanced stage CRC groups, respectively.

Chapter Four – Results
166
Table 4.11: ΔCT mean, ΔΔCT, TCΔΔ-2 and p values for all the DEGs in early stage CRC
group.
*p < 0.05 = statistically significant
DEG
ΔCT Mean
(CRC)
ΔCT Mean
(Normal) ΔΔCT
TCΔΔ2
- log10 RQ p value
ARPC2 2.6854 2.0664 0.6190 0.6511 -0.1864 0.0282*
ATP5B 1.5846 1.2702 0.3144 0.8042 -0.0946 0.3524
C11orf10 3.2897 3.3639 -0.0742 1.0528 0.0223 0.8333
C6orf173 6.1083 7.1943 -1.0860 2.1228 0.3269 0.0905
FAM96B 3.5602 3.8955 -0.3353 1.2616 0.1009 0.2935
MRPL24 4.9171 5.0839 -0.1668 1.1226 0.0502 0.3564
PSMC5 3.8232 3.9617 -0.1385 1.1008 0.0417 0.6812
RPL10 -0.7462 -0.4853 -0.2609 1.1982 0.0785 0.4001
RPL35 -0.1926 0.6222 -0.8148 1.7591 0.2453 0.0024*
RPL37 -0.0059 -0.1539 0.1480 0.9025 -0.0446 0.8645
RPS23 0.2176 0.7739 -0.5563 1.4705 0.1675 0.0310*
SLC25A1 3.7514 3.5430 0.2084 0.8655 -0.0627 0.5721
TIMP1 2.9096 4.3059 -1.3963 2.6323 0.4203 0.0440*
UQCRH 2.0087 2.2216 -0.2129 1.1590 0.0641 0.4108
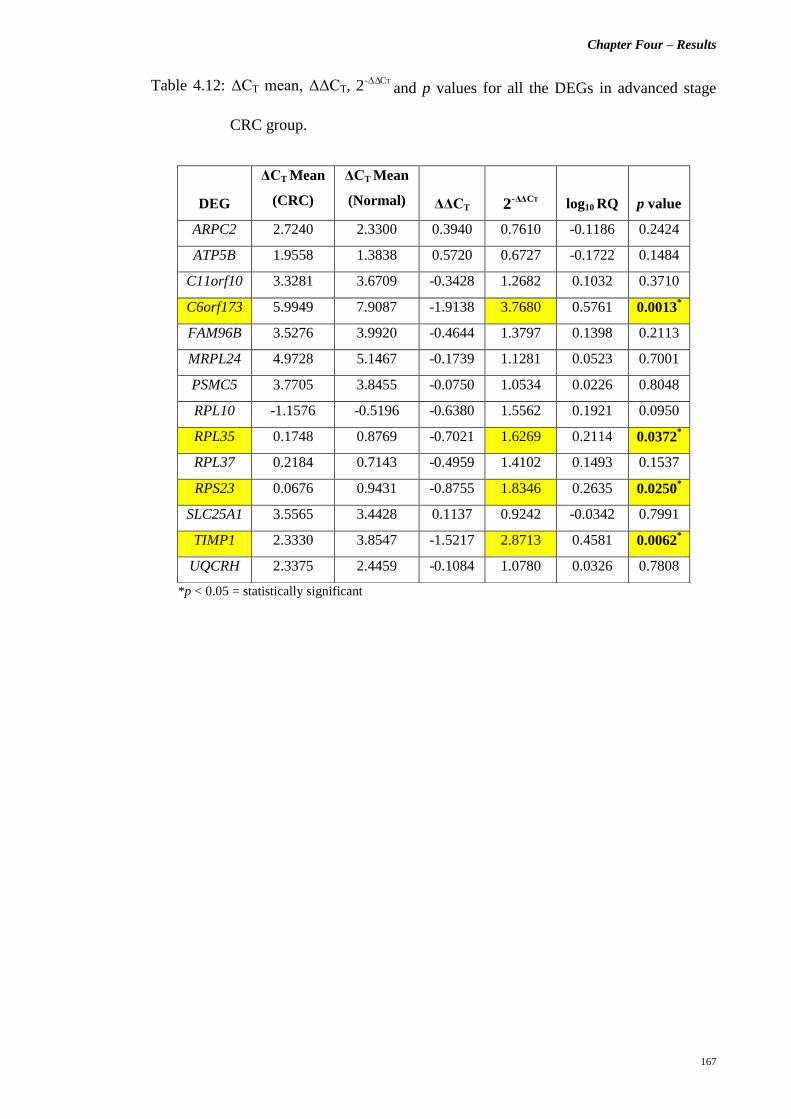
Chapter Four – Results
167
Table 4.12: ΔCT mean, ΔΔCT, TCΔΔ-2 and p values for all the DEGs in advanced stage
CRC group.
*p < 0.05 = statistically significant
DEG
ΔCT Mean
(CRC)
ΔCT Mean
(Normal) ΔΔCT
TCΔΔ2
- log10 RQ p value
ARPC2 2.7240 2.3300 0.3940 0.7610 -0.1186 0.2424
ATP5B 1.9558 1.3838 0.5720 0.6727 -0.1722 0.1484
C11orf10 3.3281 3.6709 -0.3428 1.2682 0.1032 0.3710
C6orf173 5.9949 7.9087 -1.9138 3.7680 0.5761 0.0013*
FAM96B 3.5276 3.9920 -0.4644 1.3797 0.1398 0.2113
MRPL24 4.9728 5.1467 -0.1739 1.1281 0.0523 0.7001
PSMC5 3.7705 3.8455 -0.0750 1.0534 0.0226 0.8048
RPL10 -1.1576 -0.5196 -0.6380 1.5562 0.1921 0.0950
RPL35 0.1748 0.8769 -0.7021 1.6269 0.2114 0.0372*
RPL37 0.2184 0.7143 -0.4959 1.4102 0.1493 0.1537
RPS23 0.0676 0.9431 -0.8755 1.8346 0.2635 0.0250*
SLC25A1 3.5565 3.4428 0.1137 0.9242 -0.0342 0.7991
TIMP1 2.3330 3.8547 -1.5217 2.8713 0.4581 0.0062*
UQCRH 2.3375 2.4459 -0.1084 1.0780 0.0326 0.7808
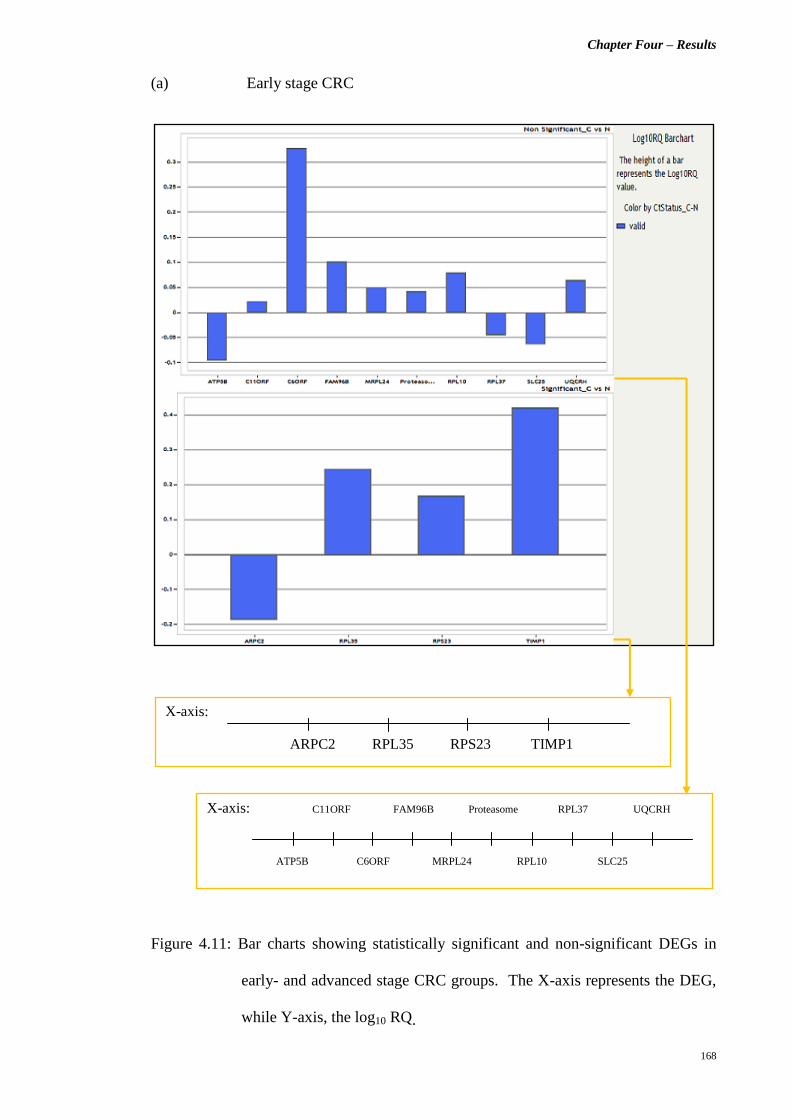
Chapter Four – Results
168
(a) Early stage CRC
Figure 4.11: Bar charts showing statistically significant and non-significant DEGs in
early- and advanced stage CRC groups. The X-axis represents the DEG,
while Y-axis, the log10 RQ.
X-axis:
ARPC2 RPL35 RPS23 TIMP1
X-axis: C11ORF FAM96B Proteasome RPL37 UQCRH
ATP5B C6ORF MRPL24 RPL10 SLC25

Chapter Four – Results
169
(b) Advanced stage CRC
Figure 4.11, continued.
X-axis:
C6ORF RPL35 RPS23 TIMP1
X-axis: ATP5B FAM96B Proteasome RPL37 UQCRH
ARPC2 C11ORF MRPL24 RPL10 SLC25

Chapter Four – Results
170
On the other hand, the stratification of samples according to the tumour site revealed
different gene expression profiles. For both right- and left-sided CRC tumours, three
genes were reported to be significantly over-expressed (p < 0.05), i.e., C6orf173, RPL35
and TIMP1 genes (Tables 4.13 and 4.14). It is noted that the left-sided primary CRC
tumours have an additional RPS23 gene which is over-expressed (p < 0.05), compared
to its right-sided counterparts (Table 4.14). Figures 4.12 (a) and (b) show the
statistically significant and non-significant DEGs in both right- and left-sided primary
CRC tumours, respectively.

Chapter Four – Results
171
Table 4.13: ΔCT mean, ΔΔCT, TCΔΔ-2 and p values for all the DEGs in right-sided CRC
tumours.
*p < 0.05 = statistically significant
DEG
ΔCT Mean
(CRC)
ΔCT Mean
(Normal) ΔΔCT
TCΔΔ2
- log10 RQ p value
ARPC2 2.7905 2.0540 0.7365 0.6002 -0.2217 0.1234
ATP5B 1.8011 1.2592 0.5419 0.6869 -0.1631 0.3267
C11orf10 3.3613 3.5984 -0.2371 1.1786 0.0714 0.7056
C6orf173 5.6993 7.8108 -2.1115 4.3214 0.6356 0.0222*
FAM96B 3.7004 3.8263 -0.1259 1.0912 0.0379 0.7562
MRPL24 5.1103 5.2487 -0.1384 1.1007 0.0417 0.5558
PSMC5 4.0208 3.9409 0.0799 0.9461 -0.0241 0.8673
RPL10 -0.9872 -0.1565 -0.8307 1.7785 0.2501 0.1212
RPL35 0.0551 0.9995 -0.9444 1.9244 0.2843 0.0463*
RPL37 -0.0984 0.8607 -0.9591 1.9441 0.2887 0.0756
RPS23 0.2592 1.2111 -0.9519 1.9344 0.2865 0.0706
SLC25A1 3.6657 3.5243 0.1414 0.9066 -0.0426 0.8234
TIMP1 2.7847 4.5670 -1.7823 3.4397 0.5365 0.0028*
UQCRH 2.1359 2.5387 -0.4028 1.3221 0.1213 0.4135

Chapter Four – Results
172
Table 4.14: ΔCT mean, ΔΔCT, TCΔΔ-2 and p values for all the DEGs in left-sided CRC
tumours.
*p < 0.05 = statistically significant
DEG
ΔCT Mean
(CRC)
ΔCT Mean
(Normal) ΔΔCT
TCΔΔ2
- log10 RQ p value
ARPC2 2.8380 2.4382 0.3998 0.7580 -0.1203 0.1223
ATP5B 1.9302 1.6162 0.3140 0.8044 -0.0945 0.2882
C11orf10 3.5019 3.6857 -0.1838 1.1359 0.0553 0.5246
C6orf173 6.4111 7.6303 -1.2192 2.3282 0.3670 0.0208*
FAM96B 3.7068 4.1473 -0.4405 1.3571 0.1326 0.1499
MRPL24 5.0577 5.1539 -0.0962 1.0690 0.0290 0.7758
PSMC5 3.8735 4.1235 -0.2500 1.1892 0.0753 0.3475
RPL10 -0.8851 -0.5358 -0.3493 1.2739 0.1051 0.2161
RPL35 0.1602 0.7824 -0.6222 1.5392 0.1873 0.0089*
RPL37 0.4015 0.1894 0.2121 0.8633 -0.0638 0.7459
RPS23 0.2246 0.8407 -0.6161 1.5327 0.1855 0.0228*
SLC25A1 3.7409 3.5992 0.1417 0.9065 -0.0426 0.6783
TIMP1 2.6362 3.8726 -1.2364 2.3561 0.3722 0.0368*
UQCRH 2.4767 2.4948 -0.0181 1.0126 0.0054 0.9478

Chapter Four – Results
173
(a) Right-sided primary CRC tumours
Figure 4.12: Bar charts showing statistically significant and non-significant DEGs in
right- and left-sided CRC tumours. The X-axis represents the DEG, while
Y-axis, the log10 RQ.
X-axis:
C6ORF RPL35 TIMP1
X-axis: ATP5B FAM96B Proteasome RPL37 SLC25
ARPC2 C11ORF MRPL24 RPL10 RPS23 UQCRH

Chapter Four – Results
174
(b) Left-sided primary CRC tumours
Figure 4.12, continued.
X-axis:
C6ORF RPL35 RPS23 TIMP1
X-axis: ATP5B FAM96B Proteasome RPL37 UQCRH
ARPC2 C11ORF MRPL24 RPL10 SLC25

Chapter Four – Results
175
4.3 Part C: Differential Proteome Analysis via A Bottom-Up Proteomics
Approach
4.3.1 Total Protein Separation via 2-D DIGE
The isolated total proteins from the CRC tumours and normal colonic mucosa were
labelled with CyDye DIGE Fluor Minimal Dyes (i.e., Cy3 and Cy5 dyes), according to
the randomised experimental design shown in Section 3.3.2.4(a), Chapter 3. On the
other hand, the internal standard for each of the Stage II, III and IV CRC group was
labelled with the Cy2 dye. The two-dimensional separation of these total proteins was
performed subsequently: first-dimension IEF on a 13 cm Immobiline DryStrip Gel of
pH 4 – 7, and followed by second-dimension SDS-PAGE on 12.5 % SDS-denaturing
polyacrylamide resolving gel. Following 2-D GE, the Cy2, Cy3 and Cy5 channels were
individually imaged with mutually exclusive excitation and emission wavelengths, as
listed in Section 3.3.2.4(f), Chapter 3. Figure 4.13 illustrates the representative CyDye
images captured by the Typhoon FLA 9000 Variable Mode Laser Scanner.

Chapter Four – Results
176
Figure 4.13: Representative CyDye images of gel scanned at a 100 μm resolution. The images of the protein sample labelled with Cy2, Cy3 and Cy5
are represented by (a), (b) and (c), respectively.
(b) (c) (a)

Chapter Four – Results
177
All scanned gel images were incorporated into the DeCyder 2D software ver. 7.0 for
further analysis. In the present study, we observe that the distribution of protein spots
varies among the Stage II, III and IV CRC groups. Figures 4.14 (a), (b) and (c) show
the examples of 2-D DIGE spot map images of CRC tumour and paired normal colonic
mucosa samples in Stage II, III and IV CRC Group, respectively.

Chapter Four – Results
178
a) Stage II CRC Group
b) Stage III CRC Group
c) Stage IV CRC Group
Figure 4.14: Representative of 2-D DIGE spot map images of CRC tumour and paired
normal colonic mucosa samples in each CRC Stage group (From left to
right: pI 4 – 7).
CRC Normal Colonic Mucosa
CRC Normal Colonic Mucosa
CRC Normal Colonic Mucosa

Chapter Four – Results
179
The quantitative comparison of the protein expression levels between the CRC tumours
and normal colonic mucosa across all biological replicates of each CRC Stage group
was conducted using the DeCyder 2D software ver. 7.0. Under the DIA module, the
intensity of every protein spot for each sample in all CRC Stage groups was quantified
against their respective internal standard. Gel-to-gel matching was then performed
within each CRC Stage group via the BVA module. Here, the differentially expressed
protein spots were detected, and the average spot volume ratios calculated, to indicate
the changes in abundance for individual proteins in primary CRC tumours when
compared to their paired normal colonic mucosa. Figure 4.15 illustrates an example of
the abundance of a specific protein spot in 10 Stage II CRC tumours and their paired
normal colonic mucosa samples.
Figure 4.15: Protein abundance for Spot No. 547 in 10 Stage II primary CRC tumours
and their corresponding paired normal colonic mucosa samples (Spot No.
refers to the number assigned in Figure 4.16).

Chapter Four – Results
180
Subsequently, Two-tailed Paired t-tests were performed to assess the statistical
significance of the observed differentially expressed protein spots. The protein
expression levels in both Stage III and IV CRC primary tumours were not significantly
different from their paired normal colonic mucosa samples (p > 0.05) (Table 4.15).
Following FDR correction, only the Stage II CRC Group reported with 46 statistically
significant differentially expressed protein spots (out of 1356 protein spots detected)
that were stably visualised on all 2-D DIGE spot map images of 10 parallel gels in the
Stage II CRC Group (30 spot map images) (Table 4.15). These protein spots of interest
were reported with the average spot volume ratios of ≤ -2 or ≥ 2, and had a statistical
variance within the 99 % confidence level (p < 0.01) (Table 4.15). Here we had applied
more stringent criteria in choosing the protein spots of interest for further analysis in
order to minimise the effects of intrinsic variability associated with patient peculiarity
and tissue heterogeneity.
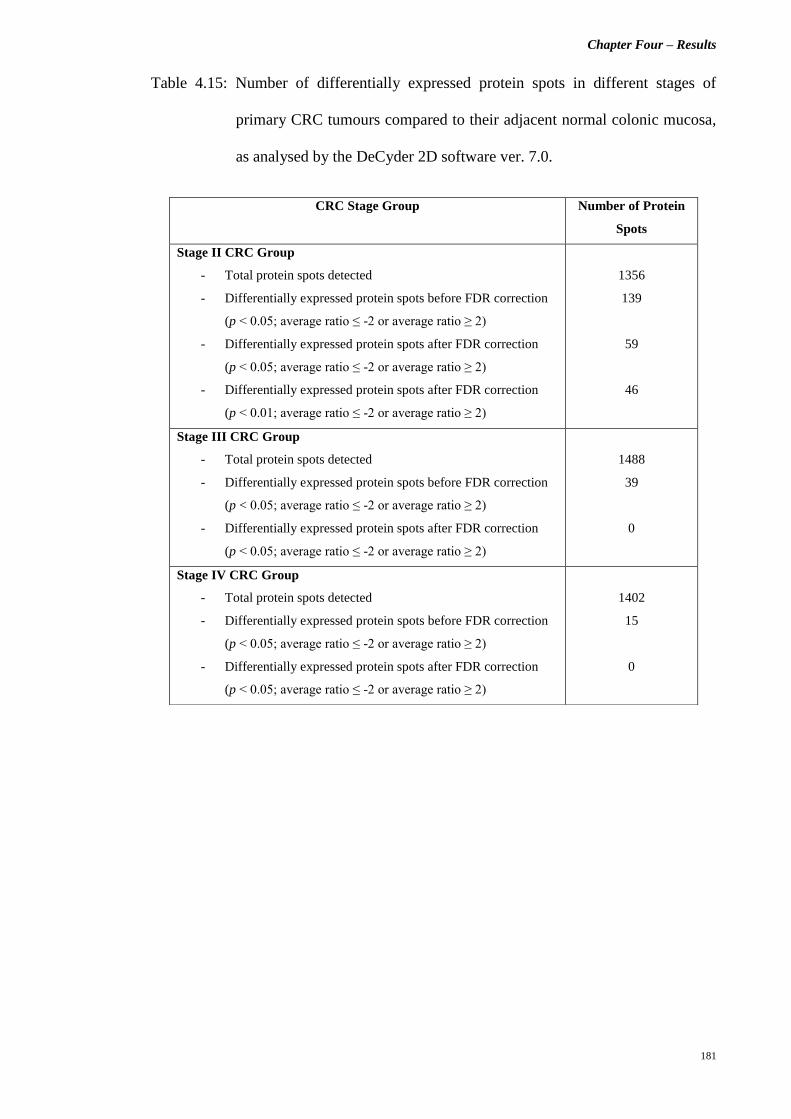
Chapter Four – Results
181
Table 4.15: Number of differentially expressed protein spots in different stages of
primary CRC tumours compared to their adjacent normal colonic mucosa,
as analysed by the DeCyder 2D software ver. 7.0.
CRC Stage Group Number of Protein
Spots
Stage II CRC Group
- Total protein spots detected
- Differentially expressed protein spots before FDR correction
(p < 0.05; average ratio ≤ -2 or average ratio ≥ 2)
- Differentially expressed protein spots after FDR correction
(p < 0.05; average ratio ≤ -2 or average ratio ≥ 2)
- Differentially expressed protein spots after FDR correction
(p < 0.01; average ratio ≤ -2 or average ratio ≥ 2)
1356
139
59
46
Stage III CRC Group
- Total protein spots detected
- Differentially expressed protein spots before FDR correction
(p < 0.05; average ratio ≤ -2 or average ratio ≥ 2)
- Differentially expressed protein spots after FDR correction
(p < 0.05; average ratio ≤ -2 or average ratio ≥ 2)
1488
39
0
Stage IV CRC Group
- Total protein spots detected
- Differentially expressed protein spots before FDR correction
(p < 0.05; average ratio ≤ -2 or average ratio ≥ 2)
- Differentially expressed protein spots after FDR correction
(p < 0.05; average ratio ≤ -2 or average ratio ≥ 2)
1402
15
0

Chapter Four – Results
182
In order to facilitate spot picking for subsequent LC-MS/MS analysis, all gels in Stage
II CRC Group were post-stained with MS-compatible silver staining (Figure 4.16).
Only protein spots that remained visible and appeared as individual spots on the silver-
stained gels were excised for protein identification. The correct matching and
localisation of the protein spots were performed by referring to their 3-D view for
further confirmation (Figure 4.17). After gel normalisation, background elimination,
artifact removal and matching between the CyDye and silver-stained images, a total of
20 protein spots with at least a significant two-fold difference in the expression levels
were excised and sent for LC-MS/MS analysis (Figure 4.16).

Chapter Four – Results
183
Figure 4.16: Representative of gel images for Cy2-labelled internal control in Stage II CRC Group (a), and its corresponding post-silver-stained gel
image indicating the protein spots of interest excised for LC-MS/MS analysis (b).
(a) (b)
877
795
943
1095
730
1199
706
457
547 562
326
300 306 308
1010 1011
1031 1040
1146
1055
306 300
326
547 562
706 730
795
877
943
1010 1011
1031 1040
1146
1055
1095
1199
308
457

Chapter Four – Results
184
Figure 4.17: 3-D view for Spot. No. 547 (magenta-coloured) [Spot No. refers to the
number assigned in Figure 4.16].

Chapter Four – Results
185
Table 4.16 summarises all the 20 protein spots of interest, as well as their average spot
volume ratios and statistical significance values. A total of 13 protein spots appear to
be more abundant in the Stage II primary CRC tumours, while seven others are more
abundant in the normal colonic mucosa samples. The calculated average spot volume
ratios ranged from 3.68-fold decrease for Spot No. 1031 to 4.77-fold increase for Spot
No. 1011 (Table 4.16).
Table 4.16: The selected 20 protein spots of interest in Stage II CRC Group [Spot No.
refers to the numbers assigned in Figure 4.16].
No. Spot No. Appearance Two-tailed Paired
t-test (p value)
Average Ratio
1. 300 30 (30) 0.0076 2.49
2. 306 30 (30) 0.0083 2.70
3. 308 30 (30) 0.0034 3.28
4. 326 30 (30) 0.0031 3.87
5. 457 30 (30) 0.0034 -3.54
6. 547 30 (30) 0.0039 -2.43
7. 562 30 (30) 0.0057 -2.18
8. 706 30 (30) 0.0039 2.36
9. 730 30 (30) 0.0018 3.19
10. 795 30 (30) 0.0052 2.28
11. 877 30 (30) 0.0039 -2.05
12. 943 30 (30) 0.0031 2.59
13. 1010 30 (30) 0.00069 4.62
14. 1011 30 (30) 0.00074 4.77
15. 1031 30 (30) 0.0031 -3.68
16. 1040 30 (30) 0.0053 -2.41
17. 1055 30 (30) 0.0028 2.21
18. 1095 30 (30) 0.00069 2.85
19. 1146 30 (30) 0.0028 -2.46
20. 1199 30 (30) 0.0080 2.18

Chapter Four – Results
186
4.3.2 Protein Identification via LC-MS/MS
Following LC-MS/MS run, the MS/MS data was analysed and interpreted using the
Mascot software ver. 2.3.02 and LudwigNR database (Aug 2012; 281, 382 sequences).
In our study, the protein identity was determined by taking into account a few criteria.
The first was the highest Protein Score and exponentially modified Protein Abundance
Index (emPAI) value among the listed putatively identified proteins. The second, at
least two individual peptide matches with an Expect value of less than 0.05, and the Ions
Score indicating extensive homology or identity (above the “threshold” score). Peptide
match with Ions Score above the “threshold” score is considered statistically significant
(p < 0.05), as shown in Figure 4.18. The “threshold” score varies with every search and
represents a 5 % confidence threshold. On the other hand, an Expect value of less than
0.05 indicates a confident match where less than 5 % probability that the observed
match would be found by chance. Table 4.17 summarises the protein identities for all
the 20 protein spots of interest in Stage II CRC Group.
Figure 4.18: Histogram showing Ions Score distribution for peptide matches.

Chapter Four – Results
187
Table 4.17: Protein identities for all the 20 protein spots of interest excised for LC-
MS/MS analysis.
Spot
No.a
Accession
No.b
Protein Identityc Protein
Score
No. of
Matched
Peptidesd
Sequence
Coverage
(%)
Molecular
Weight
(Da)e
Calculated
pIe
Trend of
changes in
protein
expressionf
300 B3GQS7 Mitochondrial
heat shock 60kD
protein 1 variant 1
105 5 (2) 16 60813 5.83 ↑
306 B3GQS7 Mitochondrial
heat shock 60kD
protein 1 variant 1
914 27 (25) 44 60642 5.83 ↑
308 P10809 60kDa heat shock
protein,
mitochondrial
1124 35 (34) 67 61016 5.70 ↑
326 B3GQS7 Mitochondrial
heat shock 60kD
protein 1 variant 1
790 25 (23) 51 60642 5.83 ↑
457 P35900 Keratin, type I
cytoskeletal 20
762 28 (14) 74 48457 5.52 ↓
547 P68032 Actin, alpha
cardiac muscle 1
447 14 (8) 58 42334 5.23 ↓
562 P62736 Actin, aortic
smooth muscle
414 9 (8) 51 42381 5.23 ↓
706 P05388 60S acidic
ribosomal protein
P0
95 4 (3) 30 34423 5.71 ↑
730 Q15181 Inorganic
pyrophosphatase
255 8 (7) 36 32639 5.54 ↑
795 O00299 Chloride
intracellular
channel protein 1
149 7 (3) 54 27248 5.09 ↑
877 P04792 Heat shock
protein beta-1
127 4 (4) 56 22826 5.98 ↓
943 Q5W0H4 Tumour protein,
translationally-
controlled 1
249 9 (5) 52 21512 5.34 ↑
1010 P06748 Nucleophosmin 87 4 (2) 12 32555 4.64 ↑
1011 Q99627 COP9
signalosome
complex subunit
8
77 1 (1) 12 23211 5.25 ↑
1031 Q6IBG1 MYL9 protein 297 7 (7) 34 19836 4.94 ↓
1040 Q6IBG1 MYL9 protein 108 1 (1) 22 19894 4.94 ↓

Chapter Four – Results
188
Table 4.17, continued.
Spot
No.a
Accession
No.b
Protein Identityc Protein
Score
No. of
Matched
Peptidesd
Sequence
Coverage
(%)
Molecular
Weight
(Da)e
Calculated
pIe
Trend of
changes in
protein
expressionf
1055 P15531 Nucleoside
diphosphate
kinase A
82 2 (1) 60 17309 5.83 ↑
1095 B5BU83 Stathmin 229 6 (6) 38 17320 5.76 ↑
1146 G3V1V0 Myosin light
polypeptide 6
119 4 (3) 53 18311 4.68 ↓
1199 P06702 Protein S100-A9 62 3 (0) 52 13291 5.71 ↑
a Spot No. refers to the numbers assigned in Figure 4.16.
b Accession No. provided in the LudwigNR database.
c Chosen protein identity is of the Tax_Id = 9606 [Homo sapiens], and presented with the highest protein score and
emPAI value.
d No. of matched peptides where Expect value < 0.05 and Ions Score indicates homology (No. of matched peptides where
Expect value < 0.05 and Ions Score indicates extensive homology or identity.
e Theoretical value.
f ↑ indicates over-expression, ↓ indicates under-expression.

Chapter Five – Discussion
189
CHAPTER FIVE
DISCUSSION
Chapter Five – Discussion
190
5.1 Part A: SNPs Genotyping via Allelic Discrimination Assays
Upon the completion of the Human Genome Project, our insight into human diseases
has crossed the boundary of clinicopathological features, and deepened into a more
complex molecular level (Caldecott, 2003; Venter et al., 2001). Numerous endeavours
were involved in studying the relationship between genetic variation and different
aspects of diseases. Genetic association studies were performed in an attempt to
investigate the correlation between genetic variants and diseases, as well as identify
potential disease susceptibility loci, especially in complex diseases, e.g., cancers
(Lohmueller et al., 2003). Of all, the case-control study is the most widely-used and
simplest study design to determine the association between a genetic variant (exposure)
and the disease risk (outcome). It involves the direct comparison of allele / genotype
frequency of the genetic polymorphism between cases (individuals diagnosed with
disease) and controls (unaffected individuals) (Lewallen and Courtright, 1998; Lewis
and Knight, 2012; Xue et al., 2011). Generally, case-control studies are retrospective
based and thus, are suitable for diseases with long latency periods, i.e., cancers. Cohort
studies on the other hand, are unfeasible (Schulz and Grimes, 2002).

Chapter Five – Discussion
191
5.1.1 Genotyping of the NOD2/CARD15 Variants
Typically, the normal physiological inflammatory response is self-limiting, but in some
circumstances, chronic inflammation will ensue if the initiating factors persist or the
resolving mechanisms fail (Coussens and Werb, 2002; Macarthur et al., 2004). As early
as 1863, Virchow had hypothesised a correlation between inflammation and cancer.
This hypothesis was proven later through our discovery of the inflammatory cells-rich
microenvironment of the neoplasms, i.e., the presence of infiltrating leucocytes in both
supporting stroma and malignant tissues (Balkwill and Mantovani, 2001). In fact, the
inflammatory-type response was found to be an early and persistent event that is
responsible for cancer development and progression (de Visser et al., 2006). The
recruitment of various inflammatory cells (which subsequently produce a broad array of
cytokines and chemokines) favours the growth and differentiation of tumour cells in
early carcinogenesis. Later in the neoplastic process, the inflammatory response and its
byproducts also remodel the extracellular matrix, as well as promote angiogenesis and
evade host defence mechanisms for the dissemination of tumour cells (Coussens and
Werb, 2002; Jackson et al., 1997; Jaiswal et al., 2000; Nakajima et al., 1997; Orlando,
2002). The prominent examples for the connection between chronic inflammatory
condition and human malignancy are: human papillomavirus infection and cervical
cancer; hepatitis B infection and hepatocellular carcinoma; H. pylori-induced gastritis
and gastric cancer; IBDs and colorectal cancer, and etc. (Parkin et al., 1999).

Chapter Five – Discussion
192
The insult of the epithelial barrier in the gastrointestinal system results in direct
exposure of the intestinal microflora to host immune system. Subsequently, the nuclear
factor kappa-light-chain-enhancer of activated B cells (NF-κB) activity is triggered and
pro-inflammatory molecules are released (Figure 5.1).
Figure 5.1: The role of activated NF-κB in tumour growth and progression (Adapted
from: Karin and Greten, 2005).
Expression of anti-apoptotic genes to ensure
the survival and proliferation of tumour cells
Expression of genes encoding cytokines, growth and
survival factors that act on tumour cells and stroma

Chapter Five – Discussion
193
In the milieu of chronic inflammation, the disrupted mucosal barrier and concomitant
immune hyperactivity are thought to model the permissive microenvironment for the
neoplastic transformation of colonic epithelial cells. On the other hand, the constitutive
activation of NF-κB also confers survival to the transformed epithelial cells through
activated Toll-like receptors (TLRs) in a cell-autonomous manner (Beutler, 2004;
Cheon et al., 2002; Clevers, 2004; Seril et al., 2003) (Figure 5.1). In brief, the NF-κB
acts as an omnipresent transcription factor that regulates a wide assortment of genes
involved in inflammation, apoptosis, cell proliferation, oncogenesis, etc. (Gupta et al.,
2010; Macarthur et al., 2004) (Figure 5.2).
Figure 5.2: Molecular targets of the activated NF-κB and their roles in carcinogenesis
(Chart generated according to Baud and Karin, 2009).
Inflammation
TNF, IL-1, IL-8, MIP2,
MCP1, iNOS, COX2,
ICAM1, ELAM1
Proliferation
Cyclin D1, Cyclin E,
CDK2, MYC, TNF, IL-1,
IL-6
Cell death & anti-
proliferative effects
FasL, Fas & DR4/5, p53,
p21
Survival
BFL1, GADD45β, BCL-2,
BCL-X, TRAF1/2, XIAP,
cIAP1/2, FLIP, A20, IEX-1L,
survivin, telomerase, MnSOD
Angiogenesis
CXCL1/8, IL-1/6, VEGF,
IL-8, HIF1α, TNF
Tumour promotion &
metastasis
uPA, MMP2/9, VCAM1,
ICAM1, ELAM1,
KAL1, COX2, iNOS
NF-κB

Chapter Five – Discussion
194
Often, the histology of the CRC precursor lesions exhibits a certain degree of
inflammatory features (Higaki et al., 1999). Chronic inflammation paves the way for
CRC oncogenesis by enhancing epithelial cells turnover, inducing DNA damage,
facilitating genomic instability and stimulating persistent cell proliferation (Coussens
and Werb, 2002). In reality, an estimated 1 – 2 % of the total CRC incidences were
developed on the background of chronic IBDs. These IBD-related CRCs were reported
in up to 15 % of the IBDs patients and attributed for nearly 1 in 6 deaths among them.
Therefore, it is considered as a serious sequela in IBD patients despite its low
proportion in the global CRC burden (Bernstein et al., 2001; Eaden et al., 2001;
Munkholm, 2003). Notably, the clinical features of this colitis-associated CRC are
distinguishable from sporadic CRC, e.g., younger age at diagnosis, more proximal
tumours and higher proportion of mucinous or signet ring cell adenocarcinoma. In
addition, it also follows a distinctive histological sequence, i.e., the inflammation-
dysplasia-carcinoma pathway, instead of the classical adenoma-carcinoma model of
sporadic CRC. Nonetheless, both disease entities share similarities in the molecular
pathogenesis of CRC (Balkwill and Mantovani, 2001; Itzkowitz and Yio, 2004; Rhodes
and Campbell, 2002; Seril et al., 2003; Xie and Itzkowitz, 2008).
Owing to the pronounced relationship between IBDs and CRC, it was thus proposed
that the predisposing genes of IBDs might also influence the risk of developing CRC.
The NOD2/CARD15 gene is the most prominent and well-defined candidate in the
genetic predisposition of IBDs (Hugot et al., 2001). The NOD2/CARD15 gene is
located on chromosome 16q12 and encodes for the NOD2 protein of 1040 amino acids,
a member of the Apaf-1/Nod1 superfamily. Structurally, the NOD2 protein is tripartite
and consisted of two N-terminal caspase recruitment domains (CARDs), a central
nucleotide-binding domain (NBD), and a C-terminal regulatory domain of ten tandem
leucine-rich repeats (LRRs) (Ogura et al., 2001). Generally, this intracellular protein is

Chapter Five – Discussion
195
mainly expressed in the monocytes, macrophages and granulocytes, as well as other cell
types, e.g., Paneth cells and epithelial cells (Gutierrez et al., 2002; Ogura et al., 2003;
Uehara et al., 2007). Its expression in the intestinal epithelial cells plays an integral role
in guarding against the luminal bacteria via mucosal innate immune response
(Hisamatsu et al., 2003). In innate immunity, the LRR domain of the NOD2 protein
recognises its ligand, the muramyl-dipeptide (MDP) of the peptidoglycans in bacterial
cell wall, and leads to the activation of NF-κB (Inohara and Nunez, 2001; Naohiro et al.,
2005; Ogura et al., 2001) (Figure 5.3).
Figure 5.3: The recognisation of the MDP by NOD2 protein and downstream activation
of the NF-κB in innate immunity (Adapted from: Shaw et al., 2011).
Pro-inflammatory cytokines
& chemokines
Bacteria

Chapter Five – Discussion
196
In our study, the mutant alleles of the Arg702Trp, Gly908Arg and 3020insC variants
were absent among the Malaysians, while those of the Pro268Ser and JW1 variants
were reported in low frequencies. Remarkably, the observed genetic distribution
patterns were similar to a previous study on CD and NOD2/CARD15 variants of the
same cohort (Chua et al., 2009). Earlier observations had revealed the existence of
ethnic heterogeneity in the genetic distribution of the Arg702Trp, Gly908Arg and
3020insC variants. The mutant allele frequencies of these three major NOD2/CARD15
variants were notably different between the Caucasians and Asians (Esters et al., 2004).
For instance, the mutant alleles of these variants were scored among the Greeks,
Hungarians, Poles, Germans and Finns, but not reported in the Japanese, Indian,
Chinese and Korean populations (Alhopuro et al., 2004; Gao et al., 2005; Inoue et al.,
2002; Lakatos et al., 2007; Lee et al., 2005; Mockelmann et al., 2009; Papaconstantinou
et al., 2005; Pugazhendhi et al., 2008; Szeliga et al., 2008). Our findings were in
concordance with other Asian cohorts as these three genetic variants were also absent in
our Malaysian samples.
Numerous studies were performed to unravel the association between NOD2/CARD15
variants and CRC susceptibility. Yet, the findings obtained thus far are still
controversial. Among them, the 3020insC variant is the most extensively studied owing
to its functional relevance on the intact NOD2 protein. It is proposed that this single
base insertion results in a premature stop codon that truncates the LRR domain of the
NOD2 protein (Ogura et al., 2001a). As a consequence, the loss of NOD2 function will
lead to an excessive NF-κB activation in the adaptive immune system, which might then
initiate the inflammation-dysplasia-carcinoma process in the colorectal oncogenesis
(Angeletti et al., 2009; Vermeire et al., 2002). The correlation between the 3020insC
variant and CRC susceptibility among patients older than 50 years has been replicated
in several studies (Kurzawski et al., 2004; Lubinski et al., 2005; Suchy et al., 2008).

Chapter Five – Discussion
197
The same association, however, was not observed in Finnish, New Zealand, Hungarian,
German and Polish CRC patient studies (Alhopuro et al., 2004; Lakatos et al., 2007;
Mockelmann et al., 2009; Roberts et al., 2006; Szeliga et al., 2008).
Our study demonstrated that both genotype and allele frequencies of the Arg702Trp,
Gly908Arg, 3020insC, Pro268Ser and JW1 variants were not significantly different
between CRC patients and healthy controls. Hence, we failed to establish any
relationship between NOD2/CARD15 variants and cancer susceptibility in our
Malaysian CRC patients. Likewise, the Arg702Trp and Gly908Arg variants were also
not associated to CRC susceptibility among the Hungarians, Polish, Germans and Finns
(Lakatos et al., 2007; Mockelmann et al., 2009; Szeliga et al., 2008; Tuupanen et al.,
2007). On the contrary, Papaconstantinou and his group had successfully demonstrated
the correlation between all three major NOD2/CARD15 variants and CRC risk in the
Greek population (Papaconstantinou et al., 2005). As for the Pro268Ser and JW1
variants, the investigation into their relationship to the risk of getting CRC is relatively
scarce compared to the other three major NOD2/CARD15 variants (Kutikhin, 2011;
Tian et al., 2010). Szeliga and his group had reported an increased risk of getting rectal
cancer with the allele T of Pro268Ser in the Polish patients, but no association was
observed among the New Zealanders (Roberts et al., 2006; Szeliga et al., 2008).
On the whole, the great discrepancy in these association findings is mainly contributed
by the ethnic heterogeneity in the genetic distribution of the NOD2/CARD15 variants.
Typically, these variants are rare or completely absent in the northern European and
Asian countries. Hence, the rarity of these variants is thought to deter the assessment of
their impacts on CRC risk in our population. In addition, the presence of varying
confounding factors in different population background might also, to a certain extent,
lead to the conflicting results obtained (Tian et al., 2010).

Chapter Five – Discussion
198
5.1.2 Genotyping of the Common GWAS-identified CRC-associated Variants
The first-degree relatives of CRC cases have a two-fold increased risk compared to the
general average population (Butterworth et al., 2006). Twin studies had revealed that
the genetic components underlie the familial clustering of CRC, and contribute to about
30 % of the total CRC burden (Lichtenstein et al., 2000). In fact, familial risk in known
hereditary CRC syndromes can be explained by rare, high-penetrance genetic variants,
e.g., APC gene in FAP and DNA mismatch repair genes in HNPCC. Nonetheless, these
identified genetic variants confer risk to only < 5 % of the total CRC incidences, while
other common, low-penetrance variants are postulated to be responsible for the
remaining familial risk (Aaltonen et al., 2007). The “common disease, common variant”
paradigm in CRC carcinogenesis suggests that an appreciable amount of common
genetic variants (minor allele frequency (MAF) > 0.05), each with minor effects on
CRC risk, has constituted a significant fraction of the overall sporadic CRC burden
(Tenesa and Dunlop, 2009). Predominantly, the investigations on the genetic
predisposition of CRC were based on the candidate gene approach in focusing on SNPs
within the candidate genes or pathways that might be essential for CRC oncogenesis
(Dong et al., 2008). However, this method may be rather impractical because of the
need to explore the millions of SNPs that are present in our human genome.
With the advent in SNP genotyping approaches and platforms, GWAS had recently
emerged as a high-throughput and robust method in identifying the common, low-
penetrance CRC susceptibility loci, as it allows scanning of the whole genome without
prior knowledge on any candidate genes or pathways (Easton and Eeles, 2008). To date,
GWAS have successfully identified 14 novel independent CRC susceptibility loci
mapped to chromosomal regions of 8q24, 8q23, 11q23, 15q13, 18q21, 10p14, 14q22,
16q22, 19q13, 20p12, 1q41, 3q26, 12q13 and 20q13. These common variants exert
only a modest risk on the development and progression of CRC (OR < 1.2) (Broderick

Chapter Five – Discussion
199
et al., 2007; Houlston et al., 2010; Houlston et al., 2008; Jaeger et al., 2008; Tenesa et
al., 2008; Tomlinson et al., 2008; Zanke et al., 2007). Most of these regions were
destitute of known coding sequences and transcriptional activities, and hence, their
biological significance on CRC oncogenesis remains to be elucidated. It was then
postulated that these common variants might affect CRC tumourigenesis by interacting
with other critical CRC-related genes / pathways (Goel and Boland, 2010; Hoskins et al.,
2012; Tokuoka et al., 2009).
In the present study, we failed to demonstrate any association between loci 8q24, 8q23,
11q23 and 15q13, and disease susceptibility in the Malaysian CRC patients. However,
the relationship between rs4939827 mapped to chromosome 18q21 and CRC risk was
established herein. The individuals with CC genotype might be protected from the
development of CRC, with the reported p value of 0.0253 and OR of 0.5936 (95 % CI =
0.3803-0.9267). This observation was parallel to those previously reported where there
was an inverse association between the allele C of rs4939827 and CRC (Broderick et al.,
2007; Slattery et al., 2010; von Holst et al., 2010). On the other hand, the allele T was
associated to an increased risk of CRC in other replication studies (Ho et al., 2011;
Tenesa et al., 2008; Xiong et al., 2010). The association between this common variant
and CRC predisposition was not, however, reported in several other studies (Curtin et
al., 2009; Li et al., 2011; Thompson et al., 2009). Meanwhile, the observed frequencies
for rs4939827 in our population were comparable to those among Han Chinese, where
the major allele is allele C instead of allele T in the Western populations (Li et al., 2011;
Xiong et al., 2010).

Chapter Five – Discussion
200
With the exception of rs6983267, the rs4939827 SNP was the most top-ranking CRC
risk locus in previous GWAS (Broderick et al., 2007; Song et al., 2012). This
rs4939827 SNP was mapped to the LD block within the intron 3 of the mothers against
decapentaplegic homolog 7 (SMAD7) gene, but its functional implications on SMAD7
gene and CRC progression still remains elusive (Broderick et al., 2007; Tokuoka et al.,
2009). SMAD7 is an intracellular antagonist that negatively regulates the transforming
growth factor-beta (TGF-β) signaling cascade in human (Figure 5.4). In oncogenesis,
the TGF-β pathway exerts tumour suppressor effects at pre-neoplastic stage but displays
its pro-oncogenic properties later in tumour development (Blobe et al., 2000; Glick,
2004; Roberts and Wakefield, 2003; Siegel and Massague, 2003). It was well-
established that the aberrant expression of SMAD7 is crucial in CRC progression owing
to its roles in modulating both TGF-β and Wnt signaling pathways (Boulay et al., 2003;
ten Dijke and Hill, 2004; Levy and Hill, 2006). The SMAD7 overexpression is
correlated to the perturbation of TGF-β-induced growth inhibition and apoptosis, which
consequently favours the development and progression of CRC tumours (Broderick et
al., 2007; ten Dijke and Hill, 2004; Mochizuki et al., 2004).

Chapter Five – Discussion
201
Figure 5.4: TGF-β signaling pathway and antagonistic role of SMAD7 (Adapted from:
Yang, 2010).
Natural antagonist

Chapter Five – Discussion
202
The failure to replicate the associations between common variants rs6983267,
rs4779584, rs16892766 and rs3802842, and CRC susceptibility in our present study
may be due to the diverse allele frequencies of the variants, differences in CRC
prevalence, other confounding risk factors for CRC, as well as different impacts of
genetic variation on CRC risk under different population backgrounds (Ioannidis, 2007;
Lubbe et al., 2012; Picelli et al., 2009). On the other hand, the discrepancy in the
direction of association for rs4939827 and CRC risk could be due to genetic
heterogeneity and possible gene-environment interactions in different ethnicities /
populations (Center et al., 2009; Jakobsson et al., 2008; Sebastiani et al., 2009).
Owing to the relatively modest individual effects of these CRC risk loci, they are
postulated to interact with other common alleles for a more profound impact on CRC
susceptibility. Thus, continuous efforts are needed to search for more CRC
susceptibility loci as the multi-locus model holds promise for more effective risk
prediction and stratification, e.g., 80 % accuracy in CRC risk prediction with a multi-
locus model of ~100 SNPs, in order to identify high-risk subgroups for regular
colonoscopic surveillance (Tenesa and Dunlop, 2009).

Chapter Five – Discussion
203
5.1.3 Genotyping of the Low-penetrance Genes
The genetic predisposition of non-hereditary sporadic CRC is attributed to the
combination of a set of low-penetrance genes, which each confers a relatively small
genotypic risk in modulating the individual’s susceptibility to CRC; as opposed to
single gene mutation or a few high-penetrance genes (Houlston and Peto, 2004;
Houlston and Tomlinson, 2000; Imyanitov et al., 2004; Kotnis et al., 2005; Pharoah et
al., 2004). According to Knudson, the heritable predisposition to cancer is
unambiguous, while the interaction between the low-penetrance susceptibility variants
and environmental risk factors is of relevance in triggering sporadic CRC (de la
Chapelle, 2004; Knudson, 2002). Since it has been proven that both nature and nurture
underlie the cancer predisposition of an individual, growing attention has been devoted
to investigate the cancer-genotype associations of low-penetrance genetic variants in
many human malignancies.
5.1.3.1 XRCC1 Variants
Our body is constantly exposed to endogenous (e.g., methylation, hydroxylation and
oxidation processes) and exogenous factors (e.g., ionizing radiation and environmental
toxins) that induce damages to our genomic DNA. The DNA repair machinery is
targeted to correct any erroneous DNA lesion(s) in order to maintain the integrity and
stability of the human genome (Fleck and Nielsen, 2004; Friedberg, 2008). There are
several important DNA repair pathways that function in rectifying different types of
DNA damage, i.e., nucleotide excision repair (NER), mismatch repair (MMR), double-
strand break repair (DSBR) and base excision repair (BER) pathways (Naccarati et al.,
2007). The BER pathway is responsible in repairing small DNA lesions, e.g., oxidised
or reduced bases, and non-bulky adducts, resulting from oxidation, deamination,
alkylation and methylation processes (Naccarati et al., 2007; Wilson and Bohr, 2007).

Chapter Five – Discussion
204
Since the maintenance of genome integrity is crucial for the general and specialised
functions of cells, any anomaly in the DNA repair mechanisms or abnormality of the
participating components can lead to deleterious consequences, e.g., cancers
(Hoeijmakers, 2001; Kaina, 2003). The inherited defects in the DNA repair pathways
will modulate the individual’s DNA repair capacity, which might in turn determine the
individual susceptibility to cancer development (Friedberg, 2003). Numerous evidences
have addressed the relevance of DNA repair capacity in triggering human malignancies
(Tomlinson et al., 2012). It has been reported the individuals with DNA repair capacity
of about 65 – 80 % are more frequently associated to the cancer cohort in a general
population (Grossman, 1997).
Previous studies have also demonstrated that inter-individual polymorphic variations in
the BER genes will confer inter-individual variation in DNA repair capacity. This will
hence affect inter-individual differences in cancer risk, prognosis, as well as response to
cancer therapy (Berwick and Vineis, 2005; Gossage et al., 2012). Hence, tremendous
efforts have been focused on analyzing the influence of the low-penetrant BER gene,
i.e., the X-ray repair cross complementation group 1 (XRCC1) gene, on DNA repair
capacity and cancer predisposition. The encoded XRCC1 protein (one of the accessory
scaffold proteins), plays key mechanistic roles in the BER machinery through
interactions with other BER components, e.g., DNA ligase III, DNA polymerase β,
PARP, polynucleotide kinase and AP endonuclease I (Figure 5.5) (Caldecott et al., 1994;
Fortini and Dogliotti, 2007; Gryk et al., 2002; Vidal et al., 2001; Whitehouse et al.,
2001). Evidences have shown that XRCC1 deficiency will evoke mutagenesis and the
embryonic knock-out of this protein is lethal (Thompson and West, 2000).

Chapter Five – Discussion
205
Figure 5.5: Role of XRCC1 in the BER pathway (Adapted from: Caldecott, 2003).
Given these facts, the coding polymorphisms of the XRCC1 gene in exons 6, 9 and 10
have been widely investigated in cancer research, i.e., Arg194Trp (rs1799782, C/T),
Arg280His (rs25489, G/A) and Arg399Gln (rs25487, G/A), respectively (Mohrenweiser
et al., 1989; Shen et al., 1998). Among these three biologically plausible XRCC1
variants, the Arg194Trp and Arg399Gln have been more extensively studied for their
association to cancer susceptibility (Abdel-Rahman and El-Zein, 2000; Lunn et al.,
1999). For the Arg194Trp variant, the 194Trp/Trp genotype was found to confer a
perceptible increased risk of lung and gastric cancers, while Goode and his group had
contradictorily reported a decreased risk of cancer with the 194Trp allele (Chen et al.,
Damaged DNA base
is removed by DNA
glycosylase, and
displaced from the
abasic site by APE1.
APE1 recruits Polβ
and cleaves the abasic
site.
Polβ inserts a single
nucleotide and repairs
the 5’-deoxyribose
phosphate terminus
created by APE1.
Results in a ligatable
nick which is sealed
by the recruitment of
XRCC1-Lig3α.
Chapter Five – Discussion
206
2012; Goode et al., 2002; Jiang et al., 2010; Wen et al., 2012). Meanwhile, several
other studies have failed to demonstrate any significant association between the codon
194 polymorphism and CRC susceptibility in different populations (Gsur et al., 2011;
Hong et al., 2005; Jiang et al., 2010a; Muniz-Mendoza et al., 2012; Pardini et al., 2008;
Skjelbred et al., 2006; Sliwinski et al., 2008).
Likewise, contradictory findings were also described for the relationship between the
Arg399Gln variant and cancer susceptibility. In gliomas, as well as colorectal,
pancreatic and endometrial cancers, the increased risk of disease development was
associated with carriers of the 399Gln allele (Abdel-Rahman et al., 2000; Cincin et al.,
2012; Hong et al., 2005; Jelonek et al., 2010; Nakao et al., 2012; Wang et al., 2012;
Zeng et al., 2013). Through a meta-analysis, it was shown that increased CRC risk was
correlated with the Arg399Gln polymorphism in Asians, instead of Caucasians (Zeng et
al., 2013). Most the cancer studies however, failed to link the codon 399 polymorphism
conferring susceptibility to CRC, as well as other cancer entities, i.e., gastric and liver
cancers (Gsur et al., 2011; Li et al., 2013; Liu et al., 2011; Muniz-Mendoza et al., 2012;
Nissar et al., 2013; Pardini et al., 2008; Sliwinski et al., 2008; Xue et al., 2011).
To date, the 280His allele of the Arg280His variant has been significantly correlated to
a higher risk of lung cancer, but not colorectal and gastric cancers (Hong et al., 2005;
Ratnasinghe et al., 2001; Xue et al., 2011). In our present case-control study, none of
the XRCC1 genetic variants was significantly associated to CRC susceptibility in our
Malaysian population. This was further supported by a few recent meta-analyses
showing that these three major XRCC1 coding polymorphisms do not confer genetic
predisposition of CRC (Liu et al., 2013; Mao et al., 2013; Wang et al., 2010). Thus far,
the investigations on the relationship between the XRCC1 genetic variants and CRC
susceptibility have been conflicting and inconclusive. These discrepancies can be

Chapter Five – Discussion
207
unfolded by the variation in ethnic origins and confounding factors in different
population backgrounds (Skjelbred et al., 2006).
5.1.3.2 EGF +61 A>G (rs4444903)
In humans, the EGF/EGFR (epidermal growth factor receptor) signaling cascade is
involved in several crucial cellular processes, i.e., proliferation, migration,
differentiation and apoptosis, via the activation of various transcription factors through
intracellular mitogen-activated protein kinase (MAPK) and phosphatidyl inositol 3-
kinase- (PI3K-) protein kinase B (AKT) pathways. Physiologically, the ligand binding
of EGFR activates its intrinsic tyrosine kinase domains, which in turn leads to the
autophosphorylation and activation of the downstream intracellular signal transduction
pathways (Figure 5.6). In view of its roles in key cellular events, the EGFR signaling
pathway is tightly-regulated at the receptor level, as well as via both positive and
negative feedback loops under normal circumstances (Citri and Yarden, 2006).
Evidently, the deregulation of growth signaling is one of the hallmarks of cancer cells
(Hanahan and Weinberg, 2000). The aberrant regulation or any gene mutation,
amplification and over-expression of any component within the EGFR cascade
contributes to the malignant phenotypes of the tumour cells and leads to neoplastic
transformation (Figure 5.6) (Citri and Yarden, 2006; Mitsudomi and Yatabe, 2010;
Normanno et al., 2006). During oncogenesis, the EGF/EGFR interaction is thought to
act in both the autocrine and paracrine manner within the tumour microenvironment (De
Luca et al., 2008). In fact, the expression of EGFR is known to correlate with a variety
of human malignancies, e.g., gliomas, cancers of the lung, colon, head and neck,
pancreas, breast, etc. (Krasinskas, 2011).

Chapter Five – Discussion
208
Figure 5.6: EGF/EGFR signaling cascade and its roles in oncogenesis (Adapted from:
Brambilla and Gazdar, 2009).
Of all, the EGF is the most important natural ligand for EGFR and essential for the
survival, proliferation, differentiation and tumourigenesis of the human epithelial cells
(Groenen et al., 1994; Lanuti et al., 2008; Yarden and Schlessinger, 1987). The EGF
was first described by Cohen in 1962 but its ability to stimulate the growth of cultured
cells was only discovered ten years later (Carpenter and Cohen, 1976; Cohen, 1962).
The EGF gene is located on chromosome 4q25-27 and encodes for a 6 kDa protein of
Ligand Intrinsic tyrosine
kinase domains
Oncogenesis

Chapter Five – Discussion
209
53 amino acids. This encoded product is a potent mitogenic peptide that exerts effects
on the DNA synthesis and cell proliferation in epidermal tissues (Boguski and
McCormick, 1993; Laurence and Gusterson, 1990; Salomon et al., 1995; Taylor et al.,
1972). Since EGF is one of the key components in the EGFR signaling pathway, the
genetic variants within the EGF gene are postulated to impact the susceptibility and
severity of cancers, as well as the prognosis and response to treatment of the cancer
patients.
In our study, we focused on the only EGF SNP in which the functional impact had been
described thus far, i.e., the EGF +61 A>G transition in the 5’-untranslated region. This
polymorphism has been shown to modulate the EGF gene transcription and
consequently, alter the serum EGF level (Araújo et al., 2007). For example, the
homozygous A genotype was demonstrated with a significantly lower EGF level in
cultured peripheral-blood mononuclear cells (Shahbazi et al., 2002). Hence, this EGF
variant in the promoter region may be responsible for inter-individual differences in
cancer susceptibility and outcome. The EGF +61 A>G polymorphism has been
demonstrated to associate with either the disease susceptibility, severity, outcome or
patients’ survival in gastric, cervical, lung, colorectal and esophageal cancers, as well as
in melanomas and glioblastomas (Bhowmick et al., 2004; Jin et al., 2007; Kang et al.,
2007; Lanuti et al., 2008; Lim et al., 2005; Shahbazi et al., 2002; Spindler et al., 2007).
A study in Caucasians had revealed a significant increased in CRC susceptibility among
individuals carrying homozygous G genotypes (Wu et al., 2009). In addition, the
homozygosity of the allele G was also significantly correlated to the development of
melanoma and gallbladder cancer (Shahbazi et al., 2002; Vishnoi et al., 2008).
Evidences have shown that the minor allele G and its homozygous genotype are
associated with a higher EGF production. This higher serum level of EGF might then
favour the development of cancer and increase the cancer risk (Araújo et al., 2007;

Chapter Five – Discussion
210
Bhowmick et al., 2004; Lanuti et al., 2008; Shahbazi et al., 2002). Nevertheless, our
current study did not show any significant difference in either the genotype distribution
or allele frequencies of the EGF +61 A>G variant between CRC patients and healthy
controls. This is consistent with similar results in Chinese and Iranian CRC patients
(Daraei et al., 2012; Yu and Weng, 2011). To date, the research on the relationship
between EGF +61 A>G polymorphism and CRC risk is still scarce.
Through a meta-analysis on the association between EGF +61 A>G polymorphism and
cancer risk, the carriage of allele A was proposed as a protective factor in cancer
development. Remarkably, this association is ethnic-specific, i.e., more pronounced
among the Asians and Americans, compared to the Caucasians. It is also cancer-
specific where similar associations were only reported in the gastric and esophageal
cancers, hepatomas and gliomas, but not in other cancer entities (Xu et al., 2010). In
reality, the genetic distribution of the EGF +61 A>G polymorphism shows ethnic-
specificity in which the allele G is more frequent in Asians than Europeans. The
homozygous G genotype is relatively more common in non-Caucasians, i.e., Japanese
(47.8 %), Han Chinese (47.6 %) and Korean (51.5 %) (Goto et al., 2005; Jin et al., 2007;
Kang et al., 2007). Likewise, G homozygotes were most commonly scored in our
Malaysian samples. Hence, the discrepancy in existing association findings might be
attributed to the genetic diversity of the EGF +61 A>G in different ethnicities and
diverse carcinogenic mechanisms of different cancer entities.
5.1.3.3 VEGF +936 C>T (rs3025039)
The generation of new blood vessels via either angiogenesis or vasculogenesis is one of
the critical steps in neoplastic progression (Witsch et al., 2010). Initially, the increased
proliferation rate and evasion from apoptosis will lead to early hyperplastic growth.
Subsequently, tumour vascularisation is crucial for the transition from the small

Chapter Five – Discussion
211
localised avascular masses to highly vascularised neoplastic outgrowth (Baeriswyl and
Christofori, 2009). New blood vessels are formed in order to supply metabolic demands,
e.g., oxygen and nutrients, for tumour growth, as well as provide routes for further
dissemination of tumour cells (Baeriswyl and Christofori, 2009; Ferrara and Davis-
Smyth, 1997). In fact, both vasculogenesis and angiogenesis are essential in embryonic
development, but remain quiescence most of the time later in adulthood. Nonetheless,
angiogenesis is retained and reactivated under certain circumstances, i.e., during wound
healing, in the cycling ovary and placenta during pregnancy, as well as certain
inflammatory and malignant disorders (Carmeliet, 2003).
The angiogenic switch, which is elicited when the fine-tuned balance between various
angiogenic promoters and inhibitors is tilted, is an intrinsic event within the tumour
microenvironment. The tilted equilibrium towards pro-angiogenic activities results in
the migration and proliferation of endothelial cells, capillary morphogenesis, as well as
increased vascular permeability (Bergers and Benjamin, 2003; Ribatti et al., 2007).
Generally, the expression of pro-angiogenic factors is stimulated by hypoxia, reactive
oxygen species, cellular acidosis, the activation of oncogenes and loss of function of
tumour suppressor genes (Arbiser et al., 1997; North et al., 2005; Pugh and Ratcliffe,
2003; Ravi et al., 2000). Within the tumour microenvironment, both tumour cells and
tumour-infiltrating inflammatory cells secrete and regulate the ultimate ratio of pro- and
anti-angiogenic factors that favours the angiogenic process. In a plethora of stromal
cells, the tumour-associated macrophages (TAMs) are one of the central components in
regulating angiogenesis through a paracrine fashion. Initially, the tumour cells secrete
chemo-attractants for the recruitment of TAMs into tumour microenvironment, while
these TAMs are then in turn, responsible for tumour progression via the secretion of
pro-angiogenic factors, including VEGF (Carmeliet and Jain, 2000; Pollard, 2004;
Veikkola and Alitalo, 1999; Zumsteg and Christofori, 2009).

Chapter Five – Discussion
212
In the milieu of oncogenesis, the roles of growth factors are not merely related to clonal
expansion, but are also in the invasion and metastasis of the neoplasms. The VEGF,
which binds to its bona fide vascular endothelial growth factor receptor (VEGFR) on
the endothelial cells of blood vessels, is the most potent direct-acting pro-angiogenic
factor in humans. It is a pivotal driver in both physiological and pathological
angiogenesis owing to its functional specificity on vascular endothelial cells (Figure
5.7).
Figure 5.7: VEGF signaling pathway (Adapted from: Li and Harris, 2009).

Chapter Five – Discussion
213
Evidences have shown that the VEGF is mitogenic to the endothelial cells and capable
to increase vascular permeability (Alitalo et al., 2005; Connolly et al., 1989; Ferrara et
al., 2003; Ferrara and Davis-Smyth, 1997). The VEGF signaling exerts both autocrine
and paracrine stimulatory effects on tumour-associated angiogenesis (Figure 5.8)
(Lichtenberger et al., 2010; McMahon, 2000). Hypoxia is the main stimulus for VEGF
production and additionally, the overexpression of various oncogenes, e.g., Ras, is also
responsible for the overexpression of VEGF in tumours of epithelial origin (Bergers and
Benjamin, 2003; Minchenko et al., 1994; Shweiki et al., 1992).
Figure 5.8: Autocrine and paracrine stimulation of VEGF on tumour angiogenesis
(Adapted from: McMahon, 2000).
Proliferation
Angiogenesis
VEGF VEGF

Chapter Five – Discussion
214
VEGF and its cognate receptor are well-recognised in the angiogenic process of solid
tumours, i.e., breast, colon, bladder, gastric, lung and prostate cancers (Balbay et al.,
1999; Droller, 1998; Kitamura et al., 1998; Kurebayashi et al., 1999; Shaheen et al.,
1999; Toi et al., 2001). Within the classical adenoma-carcinoma model of CRC, VEGF
is thought to initiate and sustain angiogenesis throughout the neoplastic transformation
as it is overexpressed in both adenomas and carcinomas (Hanrahan et al., 2003).
Consistent with this notion, the VEGF overexpression is associated with increased
tumour size, formation of metastasis, tumour vascularity, as well as poor prognosis in
CRC patients (Baker et al., 2000; Guba et al., 2004; Hanrahan et al., 2003; Kang et al.,
1997; Maeda et al., 2000; Tokunaga et al., 1998). Clinically, the anti-angiogenic
treatment through the inhibition of VEGF signaling via VEGF antagonists has been
proven to suppress the angiogenesis and growth of tumours in cancer management
(Figure 5.9) (Ferrara, 2002; Jain, 2005).
Figure 5.9: Examples of anti-angiogenic agent in cancer therapy (Adapted from: Chau
and Figg, 2012).
Binds to all isoforms
of VEGF-A
Targets all isoforms of
VEGF-A, VEGF-B & PIGF
Binds to the extracellular
domain of VEGFR-2
Binds to the extracellular
domain of VEGFR-1
Targets the intrinsic tyrosine
kinase activity & inhibits
ligand-dependent receptor
auto-phosphorylation of VEGFRs

Chapter Five – Discussion
215
The human VEGF gene, which consists of eight exons and seven introns, is located on
chromosome 6p21.3. An estimation of 30 SNPs have been described in previous
published studies and among them, the functional SNP VEGF +936 C>T in the 3’-
untranslated region is of particular remark (Chae et al., 2006; Dassoulas et al., 2009;
Vincenti et al., 1996; Watson et al., 2000; Xu et al., 2010a). A significantly lower
circulating VEGF plasma level was demonstrated with the VEGF +936 C>T transition
owing to the loss of the potential binding site for transcription factor AP-4 (Renner et al.,
2000). Hence, this functional relevance on VEGF production has driven interests in
studying the relationship between this polymorphism and cancer susceptibility.
Our results show that the VEGF +936 C>T variant is not associated with disease
susceptibility in Malaysian CRC patients. This observation is in parallel with those
previously reported among the Caucasians and Greeks (Dassoulas et al., 2009; Hofmann
et al., 2008; Wu et al., 2009). However, the TT genotype of this functional
polymorphism is correlated with other adverse clinicopathological features of CRC, i.e.,
more advanced stage and higher histologic grade of tumours, higher CA19-9 serum
level, as well as distant metastasis (Chae et al., 2008). Moreover, the TT genotype
carriers have also reported worse overall survival rates among Greek and Korean CRC
patients (Dassoulas et al., 2009; Kim et al., 2008). As for other cancer entities, the
allele T was associated with an increased risk of gastric and oral cancers, but an inverse
association was reported for breast cancer (Bae et al., 2008; Kataoka et al., 2006; Krippl
et al., 2003; Xu et al., 2010a; Yapijakis et al., 2007). Other researchers were unable to
demonstrate any relationship between the VEGF +936 C>T polymorphism and genetic
predisposition of cancer (Balasubramanian et al., 2002; Lee et al., 2005a).

Chapter Five – Discussion
216
According to a recent meta-analysis, the allele T was proposed to exert an augmentative
effect on cancer risk among the Asians and Europeans, but not in the Africans (Xu et al.,
2010a). The great discrepancy in the impacts of VEGF genetic variants on cancers
might be grounded on a few basis - first, the VEGF signaling pathway is a complex
network that involves ‘cross-talk’ between various molecules, instead of the VEGF
alone. Second, the differences in genetic backgrounds, gene-environment interactions
and confounding risk factors within different study populations might contribute to the
contradictory findings. Third, the studied SNP might be in linkage disequilibrium with
other SNPs in the VEGF or other genes that are not yet identified (Hofmann et al., 2008;
Jain et al., 2009).

Chapter Five – Discussion
217
5.2 Part B: Differential Transcriptome Analysis
In the preliminary phase of the present study, a total of thirteen over-expressed and
three under-expressed genes were successfully identified in CRC tumours, in
comparison to normal colonic mucosa samples. These observed differential expression
patterns were further examined for their consistencies in another cohort of primary CRC
tumours, which were stratified according to the CRC stage and tumour site, i.e., early-
and advanced stage CRC groups; right- and left-sided CRC tumours. Only four out of
the sixteen DEGs reached statistical significance for each early- and advanced stage
CRC group. The early stage CRC tumours were characterised with the down-regulation
of ARPC2, and up-regulation of RPL35, RPS23 and TIMP1. On the other hand, the
over-expressed C6orf173, RPL35, RPS23 and TIMP1 genes were features of advanced
stage CRC neoplasms. Based on the tumour site stratifications, the significant over-
expression of C6orf173, RPL35 and TIMP1 genes was reported in both right- and left-
sided primary CRC tumours, but with an addition of RPS23 gene in the left-sided
neoplasms. These distinctive patterns of mRNA expression levels reflect the molecular
differences in tumour biology between different stages of CRC progression and between
different sites of primary CRC tumours (Gervaz et al., 2001).
In the following sections, we discuss the relevance of identified DEGs in the
development and progression of CRC. These identified small gene expression
signatures comprise of genes that are statistically significant, as well as biologically
related and clinically important to oncogenesis.
5.2.1 RPL35 and RPS23
Ribosome biogenesis is precisely coordinated with the cell cycle machinery under
normal physiological condition (Pyronnet and Sonenberg, 2001). Ribosome production
and protein synthesis are proportionately associated with cellular growth and

Chapter Five – Discussion
218
proliferation as a response to the increased metabolic demands in the proliferating cells
(Pyronnet and Sonenberg, 2001). In ribosome biogenesis, the ribosomal proteins serve
as RNA chaperones, guide the assembly of the ribosomal components, stabilise the
domains within the rRNAs, as well as coordinate the interaction between different
translational apparatuses, e.g., ribosome, mRNAs, initiation and elongation factors
(Boisvert et al., 2007; Draper and Reynaldo, 1999; Maguire and Zimmermann, 2001;
Ramakrishnan, 2002). In addition to their roles in basic cellular machinery, human
ribosomal proteins are also related to other extra-ribosomal functions, i.e., apoptosis
(e.g., RPL23), transcription / translation (e.g., RPL26), mRNA processing (e.g., RPS13),
DNA repair (e.g., RPS3), development (e.g., RPL11) and malignant transformation (e.g.,
RPS15a) (Dai et al., 2004; Gazda et al., 2008; Ko et al., 2008; Lian et al., 2004;
Malygin et al., 2007; Takagi et al., 2005; Wool, 1996). There is an approximate of 80
ribosomal proteins and their encoding genes are mapped successfully in humans, each
with only one functional gene code (Lai and Xu, 2007; Perry, 2005).
As early as the 19th
century, cancer-associated abnormalities in nucleolar morphology
have reliably featured malignant transformation. The hypertrophic nucleolus and the
deregulation of translational machinery are prominent within cancer cells (Gani, 1976).
In oncogenesis, the aberrant regulation of ribosome biogenesis was thought to trigger
and promote tumour growth and progression (Amsterdam et al., 2004; Ruggero and
Pandolfi, 2003; Stewart and Denell, 1993; Watson et al., 1992). It was proposed that
the overall increase in translational capacity might result in the increased level of the
functionally-important cancer-related proteins, which are normally expressed in low or
moderate levels (Montanaro et al., 2008). Another hypothesis awaiting to be proven
suggests that altered ribosome biogenesis is merely a consequence of increased cellular
proliferation rate during tumourigenesis (Lindstrom, 2009; Ruggero and Pandolfi, 2003).

Chapter Five – Discussion
219
Owing to their functional roles in ribosome biogenesis and other possible independent
extra-ribosomal events, the deregulation of ribosomal protein biosynthesis in inherited
genetic diseases and cancers, is theoretically not inconceivable (Jang et al., 2004; Lai
and Xu, 2007; Lian et al., 2004; Marygold et al., 2005; Ruggero and Pandolfi, 2003).
Since decades ago, the perturbation in the mRNA expression of ribosomal proteins was
constantly demonstrated in several human malignancies, e.g., breast, prostate, uterine
cervical, esophageal, liver and colorectal cancers (Cheng et al., 2002; Henry et al., 1993;
Kim et al., 2004; Kitahara et al., 2001; Vaarala et al., 1998; Wang et al., 2001).
Mounting evidences have shown that proto-oncogenes and tumour suppressor genes
will exert a direct impact on ribosomal protein biosynthesis. For instance, the proto-
oncogene MYC was reported to up-regulate the transcription of ribosomal proteins
(Boon et al., 2001; Menssen and Hermeking, 2002). The activation of the PI3K
signaling cascade during carcinogenesis will also increase the translation of ribosomal
proteins (Holland et al., 2004).
As noted previously, the mRNA expression level of ribosomal proteins is greatly
dependent on the types of cell, cell cycle progression and ambient conditions within the
cellular microenvironment (Bortoluzzi et al., 2001). Hence, the expression patterns of
the ribosomal proteins mRNAs are tissue- and tumour-specific in both normal and
pathological states (Barnard et al., 1992; Barnard et al., 1993; Bortoluzzi et al., 2001).
The relationship between the aberrant expression of ribosomal proteins and CRC has
been well-characterised in several studies. For instance, the increased mRNA
expression of ribosomal proteins S3, S5, S6, S8, S9, S10, S12, S29, L5, L18, L21, L27a,
L28, L31 and L37 are associated with the initiation and proliferation of CRC neoplasms
(Barnard et al., 1993; Chester et al., 1989; Frigerio et al., 1995; Kitahara et al., 2001;
Pogue-Geile et al., 1991). The mRNA expression of ribosomal proteins P0 and S19

Chapter Five – Discussion
220
have also been shown to correlate with CRC progression and metastasis (Barnard et al.,
1992; Kondoh et al., 1992).
In the present study, we have added two ribosomal proteins, i.e., the RPL35 and RPS23,
to this expanding list. Both RPL35 and RPS23 were significantly over-expressed, and
the fold change in the mRNA expression level was noted to be comparable between the
early- and advanced stages of CRC. This was in agreement with Barnard’s and
Frigerio’s reports, where the observed mRNA over-expression of the ribosomal proteins
was not related to the CRC stage (Barnard et al., 1993; Frigerio et al., 1995). These
findings appeared to be acceptable as the same ribosomal protein may play different
roles in different stages of cancer progression. Moreover, the possible contribution of
their extra-ribosomal roles, which are still unknown to date, also cannot be excluded
(Lai and Xu, 2007). Ivanov and his groups had demonstrated a high affinity of RPS23
to the pre-mRNA fragment of RPS26, but its functional consequence remains to be
determined (Ivanov et al., 2002; Ivanov et al., 2004).
From the aspect of tumour site, the mRNA of RPL35 was significantly over-expressed
in both right- and left-sided primary CRC tumours. On the other hand, the over-
expression of RPS23 mRNA was only reported in the latter group. The fold change in
mRNA expression of RPL35 was comparable between right- and left-sided CRC
neoplasms and thus, was not reflective of the tumour site. Presumably, the proliferation
rate in CRC tumours is not much significantly different from normal colonic mucosa,
which typically possesses a high basal turnover time. Hence, more studies are
warranted to investigate the true implications of the aberrant expression of human
ribosomal proteins in the development and progression of CRC, instead of arbitrarily
taking it as a mere consequence of increased proliferation in tumour cells (Hoffman and
Post, 1967; Lai and Xu, 2007; Pogue-Geile et al., 1991).

Chapter Five – Discussion
221
5.2.2 TIMP1
Our results showed that the tissue inhibitors of metalloproteinase 1 (TIMP1) was
significantly over-expressed in CRC tumours, compared to normal colonic mucosa
samples. A comparable fold change in mRNA expression level was observed between
early- and advanced stage CRC groups, as well as between right- and left-sided CRC
tumours. Our observation was in agreement with other reported findings, where TIMP1
mRNA over-expression in CRC neoplasms was not uncommon (Baker et al., 2000a;
Inagaki et al., 2010; Offenberg et al., 2008; Pesta et al., 2005). In fact, there have been
several researchers that have not observed any significant relationship between TIMP1
mRNA expression levels and tumour sites / CRC stages (Inagaki et al., 2010; Pesta et
al., 2007). Likewise, the observed TIMP1 mRNA over-expression in our study was also
not indicative of either the CRC stage or primary tumour site. On the basis of evidences
to date, this lack of significant correlation between mRNA expression level of TIMP1
and CRC stage might be ascribed to its dual role in tumour development and
progression (Egeblad and Werb, 2002; Herszenyi et al., 2012; Jiang et al., 2002).
TIMP1 is one of the members in the TIMP family that reversibly inhibits and abolishes
the proteolytic activities of proteolytic enzymes, the matrix metalloproteinases (MMPs).
Typically, TIMP1 is an endogenous tissue-specific inhibitor for the MMP-1, MMP-3
and MMP-9. It binds to the N-terminal of the activated form of MMPs and
subsequently, inhibits these enzymatically active proteinases in a 1:1 stoichiometric
manner (Bode et al., 1994; Ennis and Matrisian, 1993; Lambert et al., 2004). Under
normal state, the finely-regulated MMP / TIMP balance is indispensable for the
turnover and homeostasis of extracellular matrix (ECM), as well as several
physiological processes in the human gut (Medina and Radomski, 2006; Sun, 2010).
Therefore, the shifted MMP / TIMP equilibrium towards the preponderance of ECM

Chapter Five – Discussion
222
degradation is one of the crucial events in gastrointestinal malignancies (Herszenyi et al.,
2012; Herszenyi et al., 2012a).
In the milieu of neoplasis, MMPs and TIMPs are produced and secreted by both the
tumour and its surrounding stromal cells (Herszenyi et al., 2012; Hewitt et al., 1991;
Newell et al., 1994; Tomita and Iwata, 1996). MMPs are responsible in degrading the
ECM and maintaining a favoured microenvironment for further growth, invasion and
metastasis of primary tumours (Amalinei et al., 2010; Geho et al., 2005; Herszenyi et al.,
2012a; Herszényi et al., 2000). In line with this, the over-expression of MMPs was
correlated with tumour aggressiveness and prognosis in a variety of human
malignancies, including CRC (Figueira et al., 2009; Gao et al., 2006; Giannopoulos et
al., 2008; Groblewska et al., 2012; Hu et al., 2012; Liu et al., 2011a).
Theoretically, the TIMP1 was simply thought as an intrinsic barrier to cancer
progression owing to its direct roles in modulating MMPs activities and proteolysis of
ECM components. In fact, the elevated expression of TIMP1 through gene transfer had
demonstrated a profound anti-tumour effect in various animal models (Brand, 2002;
Elezkurtaj et al., 2004). Previous studies however, had related the TIMP1 over-
expression with poorer prognosis and shorter disease-free survival in several carcinomas,
e.g., gastric, lung, breast and colorectal cancers (Fong et al., 1996; Mimori et al., 1997;
Ree et al., 1997; Zeng et al., 1995). Initially, this increase in TIMP1 expression was
hypothesised as a response to the increased MMPs activities rather than a cause in
carcinogenesis (Egeblad and Werb, 2002; Inagaki et al., 2010; Joo et al., 2000; Kahlert
et al., 2008; Schrohl et al., 2004). It was only thereafter that the active tumour-
promoting roles of the TIMP1, i.e., stimulating cell proliferation, inhibiting apoptosis,
regulating angiogenesis, as well as facilitating invasion and metastasis of tumour cells,
were revealed through mounting evidences (Akahane et al., 2004; Bourboulia and

Chapter Five – Discussion
223
Stetler-Stevenson, 2010; Hornebeck et al., 2005; Liu et al., 2003; Mannello and
Gazzanelli, 2001; Tsuchiya et al., 1993).
In CRC carcinogenesis, these growth-stimulatory and metastasis-promoting effects of
the TIMP1 are well-characterised. A significantly higher expression of the TIMP1
mRNA was associated with the presence of synchronous lymph nodes and distant
metastasis in CRC patients. Furthermore, the over-expression of TIMP1 mRNA was
also reported in the metastatic liver foci of CRC (Asano et al., 2008; Sutnar et al., 2007;
Zeng et al., 1995). As observed in our present study, the TIMP1 mRNA over-
expression in both early- and advanced stages of CRC was not paradoxical, but in line
with its pleiotropic effects in both MMP inhibitory and MMP-independent regulatory
activities. However, the actual clinical relevance of this over-expression of TIMP in
CRC carcinogenesis remains to be clarified.
5.2.3 ARPC2
In the present study, the actin-related protein 2/3 complex, subunit 2 (ARPC2) gene is
significantly under-expressed in early stage CRC primary tumours, but not in the
advanced stage neoplasms. This under-expression of ARPC2 gene however, did not
reach statistical significance after stratifying our CRC patients according to tumour sites.
Notably, this is the only under-expressed gene being observed in our sample cohort.
The ARPC2 is one of the seven evolutionarily well-conserved subunits of the actin-
related protein 2/3 (Arp2/3) complex. It serves as the structural core of the Arp2/3
complex by forming a heterodimer with ARPC4 (Robinson et al., 2001). On the other
hand, the ARPC2 is also essential for side binding and branch formation because the
heterodimer ARPC2/ARPC4 was predicted to contact substantially with the mother
filaments during actin polymerisation (Bailly et al., 2001; Volkmann et al., 2001). The
Arp2/3 complex is the major actin nucleator in eukaryotes and plays a crucial role in

Chapter Five – Discussion
224
forming the branched-actin-filament network. Following its binding to nucleation
promoting factors, the activated Arp2/3 complex nucleates the formation of new
filaments at a 700
angle from existing filaments in a Y-branch configuration (Amann
and Pollard, 2001; Mullins et al., 1998).
Under normal physiological state, the organisation of actin cytoskeleton is important for
cellular vesicle trafficking, cell motility, cell division, cell adhesion, phagocytosis,
mechanical support for cells, etc. (Cao et al., 2010; Le Clainche and Carlier, 2008;
Stossel et al., 2001). Along with the degradation of ECM, the inactivation of cell-cell
adhesion and remodeling of actin network are key drivers in tumour cells migration,
leading to lethal metastatic disease in cancers (Iwaya et al., 2007; Rauhala et al., 2013).
This aberrant regulation in tumour cell motility is the driver behind the cancer invasion
and metastasis achieved through protrusive structures, e.g., lamellipodia, in which the
Arp2/3 complex is localised within its leading edge (Bailly and Condeelis, 2002;
Machesky, 2008; Machesky et al., 1997; Yamaguchi et al., 2005).
In view of its critical roles in nucleation and branching of the actin network, the
dysfunction of Arp2/3 complex was predicted to modulate the above-mentioned cellular
processes, which in turn contributes to cancer development and progression (Otsubo et
al., 2004; Wang et al., 2005). In fact, the WAVE-Arp2/3 complex pathway, which is
one of the downstream targets within the EGF signaling pathway (a fundamental
pathway involved in oncogenesis), was up-regulated in several cancers (Otsubo et al.,
2004; Semba et al., 2006; Wang et al., 2004). The altered mRNA and protein
expression levels of the subunits of Arp2/3 complex were also reported in tumour
tissues and invasive cells (Otsubo et al., 2004; Wang et al., 2005). The over-expression
of ARPC2 was reported in melanomas and acted as one of the discriminative markers in
distinguishing melanomas from benign nevi (Kashani-Sabet et al., 2009).

Chapter Five – Discussion
225
However, Kaneda and his group had reported a significant decrease in mRNA
expression of all the seven subunits of the Arp2/3 complex in human gastric cancer.
These observed reductions in the expression level were particularly pronounced for
ARPC2, ARPC4 and Arp2 (Kaneda et al., 2004). Similarly, our present study on CRC
also revealed a decreased mRNA expression level of the ARPC2. Since the actin
cytoskeleton is important in supporting and maintaining the cell shape, it was
hypothesised that the under-expression of the Arp2/3 complex or its subunits might be
responsible for the dysplastic cell morphology, a typical feature of cancer cells
(Flanagan et al., 2001; Welch, 1999). On the other hand, the decreased expression of
the subunits of Arp2/3 complex might also affect the intracellular signal transductions
that are regulated by the actin network (Kaneda et al., 2004; Stossel et al., 2001). These
hypotheses might then provide a different conceptual view on the implications of the
aberration in Arp2/3 complex expression patterns in carcinogenesis.
5.2.4 C6orf173
The chromosome 6 open reading frame 173 (C6orf173) is more commonly known as
the cancer-upregulated gene 2 (CUG2), and later renamed as centromere protein W
(CENP-W) (Hori et al., 2008). Given to its potent in vivo and in vitro transforming
abilities, the CENP-W has been identified as a novel oncogene and is up-regulated in
several human cancer tissues, i.e., ovary, liver, lung, breast, colon, rectum and stomach
(Lee et al., 2007). As implied by its name, the CENP-W is also one of the centromere-
associated network proteins – a crucial participant in both mitosis and meiosis (Hori et
al., 2008; Kim et al., 2009; Perpelescu and Fukagawa, 2011).
In mitosis, the proper chromosome segregation is important in maintaining the euploidy
of daughter cells, as well as ensuring the accurate transmission of genetic materials and
normal cell physiology. The centromere is a specific chromosomal region where the
Chapter Five – Discussion
226
formation of kinetochore takes place for the attachment of spindle microtubules and
subsequent segregation of sister chromatids to the opposite poles of the dividing cells
(Kops et al., 2005; Mellone et al., 2006; Perpelescu and Fukagawa, 2011). Thus, both
centromere and kinetochore specifications are central for faithful chromosome
segregation and of all the kinetochore proteins, the targeted deposition of histone H3
variant CENP-A is the key determinant for centromere identity at the chromatin level
(Cheeseman and Desai, 2008; Howman et al., 2000; Sullivan et al., 1994).
The recently-identified novel CENP-W is one of the members of the constitutive
centromere-associated network (CCAN), in which a group of kinetochore proteins are
interdependent in propagating the centromere and assembling the kinetochore, with
coordination of CENP-A (Hori et al., 2008; Liu et al., 2006; Okada et al., 2006; Okada
et al., 2009). The CENP-W is tightly associated with CENP-T to form a complex that
functions upstream of other CCAN components and provides a platform for their
assembly within the centromeric region (Okada et al., 2006). This CENP-T / CENP-W
complex possesses DNA-binding ability, and interacts directly with the nucleosomal
DNA and canonical histone H3 for the formation of centromere chromatin structure
(Hori et al., 2008).
In line with the roles of CENP-T / CENP-W complex in mediating the centromeric
chromatin and outer kinetochore components, as well as assembling the functional
kinetochore in G2 phase, its aberrant expression was hypothesised to influence the
mitotic process and implicate in oncogenesis (Hori et al., 2008; Kim et al., 2009;
Perpelescu and Fukagawa, 2011; Prendergast et al., 2011). Several CENPs were related
to the promotion and progression of neoplasms, i.e., CENP-A and CENP-H in CRC;
CENP-F in head and neck squamous cell carcinoma (de la Guardia et al., 2001;
Tomonaga et al., 2005; Tomonaga et al., 2003). Typically, the dysregulation of
kinetochore proteins is associated with chromosome missegregation and aneuploidy, a

Chapter Five – Discussion
227
ubiquitous feature of solid tumours in human (Pihan and Doxsey, 1999; Yuen et al.,
2005). Although the aneuploidy is closely-related to CIN in human malignancy, there
has yet to be any evidence on the direct causative relationship between the impaired
kinetochore assembly and CIN thus far (Orr-Weaver and Weinberg, 1998; Tomonaga et
al., 2005).
Our present study revealed that the C6orf173 (CENP-W) was over-expressed in both
early- and advanced stage primary CRC tumours, but only reached statistical
significance in the latter group. This was supported by a report where a greater
proportion of the advanced stage CRC neoplasms were found to be aneuploid and they
tend to exhibit higher growth rate, as well as poorer survival than the diploid tumours
(Chen et al., 2002; Saccani Jotti et al., 1995). In order to ensure normal kinetochore
assembly and proper spindle checkpoint signaling, the stoichiometric expression and
dosage of the core kinetochore components are vital. It was hence, proposed that any
anomaly in the expression of the kinetochore components and their assembly might
contribute to aneuploidy and CRC carcinogenesis (Tomonaga et al., 2005; Yuen et al.,
2005).
Following the stratification of the sample cohort by tumour sites, the C6orf173 was
significantly over-expressed in both right- and left-sided CRC neoplasms. Notably, the
observed fold change in the C6orf173 mRNA expression level was approximately
double in the right-sided CRC tumours ( TCΔΔ-2 = 4.3214), compared to its left-sided
counterparts ( TCΔΔ-2 = 2.3282). In fact, previous studies had revealed the differences in
the clinical and molecular features between right- and left-sided CRC tumours. Most of
the left-sided CRC tumours are aneuploid, highly-differentiated and follow the CIN
pathway, while the right-sided neoplasms are mostly diploid, poorly-differentiated and
follow the MSI pathway (Iacopetta, 2002; Soreide et al., 2009). Hence, our observation
in the right-sided CRC tumours might reveal a possible contribution of CENP-W in

Chapter Five – Discussion
228
other oncogenic activities on top of the aneuploidy. A recent study by Chun and his
team had demonstrated the localisation of CENP-W in various sub-nuclear
compartments, e.g., nucleoli and nuclear matrix, rather on the centromere alone. This
provides an additional insight into the potential involvement of the CENP-W in other
crucial nuclear activities or even carcinogenesis (Chun et al., 2011).
In brief, our findings on the over-expression of C6orf173 in primary CRC tumours were
in concordance with a few hypothesis and facts – first, the aberrant expression of
kinetochore protein might associate with aneuploidy in CRC neoplasms. Second, the
aneuploidy is associated with advanced stage and poorly-differentiated tumours. Third,
there might be the presence of other hitherto unknown function(s) of CENP-W in
oncogenesis. Therefore, further functional studies on diploid cell lines and mouse
models are in need to delineate the true impacts of mRNA over-expression of C6orf173
on CRC carcinogenesis (Yuen et al., 2005).

Chapter Five – Discussion
229
5.3 Part C: Differential Proteome Analysis via A Bottom-Up Proteomics
Approach
Two-dimensional DIGE and LC-MS/MS were employed for the quantitative proteomic
profiling of sporadic CRC tumours. The recruited CRC tumour specimens were
grouped according to their cancer stage in order to characterise the stage-specific CRC
tumour-specific protein expression patterns. Despite our attempts to investigate
tumouric samples of all CRC stages, we failed to obtain the Stage I level samples. As
approximately 70 % of CRC cases are usually detected at advanced tumour stages
(which often relate with poor patient prognosis), this could have possibly impeded the
sample collection (O'Connell et al., 2004). According to a demographic and anatomic
survey conducted among Malaysian CRC patients, only 4.5 % of the patients were
diagnosed with Dukes’ A CRC at the time of diagnosis (Goh et al., 2005). Hence, our
sample cohort only comprised of the primary CRC tumours of Stages II, III and IV.
Through our comparative protein expression screening, only Stage II CRC tumours
were reported with significant differentially expressed proteins. However, the global
protein abundance of the advanced stage CRC neoplasms, i.e., Stages III and IV, was
not significantly different from their respective adjacent morphologically normal
colonic mucosa. These intriguing findings are not unexpected as the histologically
normal colorectal mucosa adjacent to the advanced stage tumours might have
experienced certain molecular changes to provide a conducive tumour
microenvironment for the invasion and metastasis of primary tumours to distal sites
(Brown et al., 1999; Hanrahan et al., 2003). Alternatively, the proteins that exhibit
significant changes in the expression level for advanced stage CRC tumours might not
fall within the investigated pI range (pI 4 – 7). Hence, further experimental attention
with the use of different pH ranges or lengths of Immobiline DryStrip Gels is warranted.
It would also be useful to further investigate the relative basal level of protein

Chapter Five – Discussion
230
abundance between the histologically normal colonic mucosa adjacent to early- and
advanced stage CRC tumours.
Our present study had revealed a total of 20 protein spots which exhibited significant
changes in the protein abundance, and were consistently reported in all 10 CRC patients
within the Stage II CRC Group [as shown in Table 4.16, Section 4.3, Chapter 4]. These
spots displayed an average volume ratio ranging from -3.68 for Spot No. 1031 to 4.77
for Spot No. 1011, and had a statistical variance within the 99 % confidence level (p <
0.01). Following mass spectrometric protein identification, we had successfully
identified 16 unique proteins that were aberrantly regulated in the Stage II CRC tumours.
Ten proteins were found to be over-expressed, while the remaining 6 were under-
expressed. The details are shown in Tables 5.1 and 5.2. In our current study, the Hsp60
and LC20 proteins appeared in multiple protein spots upon 2-D DIGE separation [as
shown in Table 4.17, Section 4.3, Chapter 4]. This observation may correspond to the
post-translational modifications on the same proteins which may be responsible for the
different molecular mechanisms related to CRC carcinogenesis (Friedman et al., 2004).

Chapter Five - Discussion
231
Table 5.1: Over-expressed proteins in primary Stage II CRC tumours compared to
adjacent paired normal colonic mucosa.
No. Over-expressed
Protein
Alternate Name* Molecular
Function*
Reported in CRC
Studies**
1. Mitochondrial heat shock
60kD protein 1 variant 1
Heat shock protein 60;
Chaperonin; Hsp60
Chaperone activity - Alfonso et al., 2005
- Bi et al., 2006
- Gourley et al., 2010
- Krasnov et al., 2009
- Lin et al., 2009
- Muto et al., 2011
- O’Dwyer et al., 2011
- Shi et al., 2011
- Tomonaga et al., 2004
2. 60S acidic ribosomal
protein P0
Ribosomal protein,
large, P0; RPLP0
Structural constituent
of ribosome
3. Inorganic pyrophosphatase PPase Catalytic activity - Friedman et al., 2004
- Petrova et al., 2008
- Tomonaga et al., 2004
4. Chloride intracellular
channel protein 1
Nuclear chloride ion
channel 27; NCC27
Intracellular ligand-
gated ion channel
activity
- Krasnov et al., 2009
- Lin et al., 2009
- Petrova et al., 2008
- Tomonaga et al., 2004
5. Tumour protein,
translationally-controlled 1
Translationally
controlled tumour
protein; TCTP
Calcium ion binding - Friedman et al., 2004
- O’Dwyer et al., 2011
6. Nucleophosmin Nucleolar
phosphoprotein B23;
Numatrin; B23
Chaperone activity - O’Dwyer et al., 2011
7. COP9 signalosome
complex subunit 8
COP9 constitutive
photomorphogenic
homolog subunit 8;
SGN8
Component of the
COP9 signalosome
complex
8. Nucleoside diphosphate
kinase A
NDP kinase A; NM23 Catalytic activity - Friedman et al., 2004
- Ma et al., 2009
- O’Dwyer et al., 2011
- Shi et al., 2011
- Tomonaga et al., 2004
- Wang et al., 2012a
9. Stathmin Phosphoprotein 19;
SMN
Structural molecule
activity
- Ma et al., 2009
- Tomonaga et al., 2004
10. Protein S100-A9 S100 calcium binding
protein A9; Calgranulin
B; S100A9
Calcium ion binding - Friedman et al., 2004
- Lin et al., 2009
- O’Dwyer et al., 2011
- Stulík et al., 2001
* Accessed via The Human Protein Atlas (www.proteinatlas.org) and Human Protein Reference Database (www.hprd.org)
** Only included CRC studies with surgical resected tissue specimens and coupled 2-D GE / MS approach

Chapter Five - Discussion
232
Table 5.2: Under-expressed proteins in primary Stage II CRC tumours compared to
adjacent paired normal colonic mucosa.
No. Under-expressed
Protein
Alternate Name* Molecular
Function*
Reported in CRC
Studies**
1. Keratin, type I
cytoskeletal 20
Keratin 20; K20 Major cellular
protein in mature
enterocytes and
goblet cells
- Lin et al., 2009
- Shi et al., 2011
2. Actin, alpha cardiac
muscle 1
Actin, alpha
cardiac; ACTC1
Structural
constituent of
cytoskeleton
3. Actin, aortic
smooth muscle
Actin, alpha-2,
smooth muscel,
aorta; ACTSA
Structural
constituent of
cytoskeleton
- Ma et al., 2009
4. Heat shock protein
beta-1
Heat shock protein
27; HSP27
Chaperone activity - Ma et al., 2009
- Pei et al., 2007
- Wang et al., 2012a
- Xing et al., 2006
5. MYL9 protein Myosin regulatory
light polypeptide 9;
20kDa myosin light
chain; LC20
Myosin regulatory
subunit
- Friedman et al., 2004
- Ma et al., 2009
- Petrova et al., 2008
6. Myosin light
polypeptide 6
17 kDa myosin
light chain; LC17
Structural
constituent of
cytoskeleton
- Ma et al., 2009
- Petrova et al., 2008
* Accessed via The Human Protein Atlas (www.proteinatlas.org) and Human Protein Reference
Database (www.hprd.org)
** Only included CRC studies with surgical resected tissue specimens and coupled 2-D GE / MS
approach

Chapter Five – Discussion
233
To a certain extent, the current proteomic profiling on Stage II CRC tumours was in
accordance to our earlier findings in studying the mRNA expression levels of both
early- and advanced stage CRC tumours (Section 5.2 – Part B: Differential
Transcriptome Analysis). In this comparative screening of protein expression, we had
uncovered the over-expression of a ribosomal protein, RPLP0, and the under-expression
of two actin isoforms, ACTC1 and ACTSA. Consistently, we had also identified the
mRNA over-expression of the ribosomal proteins, RPL35 and RPS23, as well as the
mRNA under-expression of the subunit of Arp2/3 complex, ARPC2, in the early stage
primary CRC tumours [as shown in Figure 4.11, Section 4.2, Chapter 4]. These
concordant findings between the mRNA and protein expression analyses on the Stage II
primary CRC tumours might reliably reveal the involvement of ribosomal proteins and
components of the actin network in the early development of CRC. Hence, more
challenging tasks, i.e., investigations on their functional roles in early CRC oncogenesis,
and their value in the early diagnosis of CRC, lie ahead for elucidating data with regards
to better CRC management in future.
As shown in Tables 5.1 and 5.2, most of the identified differentially expressed proteins
in our study were previously reported in other comparative proteomic studies with 2-D
GE approach, except RPLP0, SGN8 and ACTC1 proteins. This shows that the
comparative proteomic analysis with 2-D GE platform is more reproducible and reliable
compared to the gene expression analysis at the mRNA level, notwithstanding
variations in CRC stage of the recruited patients, pH range of the Immobiline DryStrip
Gels and 2-D gel staining methods (Table 5.3). Despite considerable similarities in
these 2-D GE-based proteomic studies, there are also discrepancies in the list of
identified differentially expressed proteins among different comparative CRC studies.
Presumably, these might be due to the variation in the demographics of the sample

Chapter Five – Discussion
234
cohort, CRC tumour locations, criteria of tissue specimen collection, number of samples
included and other statistical criteria (Muto et al., 2011; Petrova et al., 2008).
Although the combination of 2-D DIGE and LC-MS/MS is not a new platform for
proteomic profiling, our approaches in stratifying the sample cohort according to the
tumour stage (i.e., Stage II, III and IV CRC Group) and performing the normal / tumour
pair-wise analysis within each CRC stage group, are different from other comparative
protein expression analyses on sporadic CRC tumours. In previous studies, either the
primary CRC tumours of a specific disease stage or the pooled CRC specimens of
different stages were used to characterise the CRC tumour-specific differentially
expressed proteins (Table 5.3).

Chapter Five - Discussion
235
Table 5.3: Summary of patient characteristics and 2-D GE approaches in different comparative proteomic analyses on sporadic CRC tumours.
CRC Stage of Recruited
Patients
Dukes’ A Dukes’ B Dukes’ A – C Stages I – IV Stages II – IV Stage IV with
synchronous
liver metastasis
Wang et al., 2012a
O’Dwyer et al., 2011 Alfonso et al., 2005
Krasnov et al., 2009;
Muto et al., 2011;
Pei et al., 2007;
Stulík et al., 2001;
Xing et al., 2006
Friedman et al., 2004;
Lin et al., 2009;
Petrova et al., 2008;
Tomonaga et al., 2004
Shi et al., 2011
pH Range of the
Immobiline DryStrip Gels
4 – 7 4 – 9 6 – 9 3 – 8 3 – 10 Linear &
Non-linear
3 – 11
Alfonso et al., 2005;
Friedman et al., 2004;
Ma et al., 2009;
Xing et al., 2006
Tomonaga et al., 2004 Muto et al., 2011
Krasnov et al., 2009 Lin et al., 2009;
O’Dwyer et al., 2011;
Pei et al., 2007;
Petrova et al., 2008;
Stulík et al., 2001
Shi et al., 2011
2-D Gel Staining Methods 2-D DIGE 2-D with
silver-staining
2-D with
coomasie blue-staining
Alfonso et al., 2005;
Friedman et al., 2004;
Lin et al., 2009;
Muto et al., 2011;
Shi et al., 2011
Pei et al., 2007;
Petrova et al., 2008;
Stulík et al., 2001;
Wang et al., 2012a;
Xing et al., 2006
Krasnov et al., 2009;
Ma et al., 2009;
O’Dwyer et al., 2011;
Tomonaga et al., 2004

Chapter Five - Discussion
236
In summary, our proteomic analysis had unraveled the Stage II primary CRC tumour-
specific protein expression pattern, which consists of differentially expressed proteins
that are involved in various key cellular processes, i.e., protein metabolism, signal
transduction, ion transportation, ribosome biogenesis, energy metabolism, stress
response, cytoskeleton, as well as cell proliferation, differentiation, locomotion and
communication. The over-expression of Hsp60, B23, SMN and S100A9 proteins are
further discussed below as they are the most remarkable proteins associated with CRC
oncogenesis, as well as other cancer entities.
5.3.1 60 kDa Heat shock protein (Hsp60)
Heat shock proteins (HSPs) are highly evolutionarily conserved proteins which were
first discovered with their heat shock-inducible expression (Ritossa, 1962). Later, their
expression were reported to be induced by other types of environmental and metabolic
stresses (e.g., hypoxia, heavy metal ions, nicotine, viral agents, anoxia, etc.), hence the
term “stress proteins” (Boshoff et al., 2004). These HSPs exhibit potent cytoprotective
functions that enable cells to adapt and survive in response to various stress stimuli,
which would otherwise be lethal (Parcellier et al., 2003). Most of HSPs are molecular
chaperones which execute housekeeping functions of folding, stabilizing, assembling
and translocating of proteins in mammalian cells (Bukau and Horwich, 1998;
Hightower, 1991). In addition, these stress proteins also responsible for the repair or
proteosomal degradation of denatured proteins following stress or injury (Hohfeld et al.,
2001). In both eukaryotes and prokaryotes, HSPs share a high degree of
phylogenetically conserved structures and functions, reflective of their significance in
maintaining the viability and survival of cells (Pockley, 2003). The Hsp60 is one of the
three major families of the high molecular weight HSPs that are constitutively
expressed in the mammalian cells (Parcellier et al., 2003). This mammalian Hsp60 is an
ATP-dependent chaperone, named chaperonin. It is constitutively expressed and

Chapter Five – Discussion
237
predominantly compartmentalised within the mitochondrial matrix, where it regulates
the proper folding of mitochondrial proteins, as well as elimination of the misfolded or
denatured proteins via ATP-dependent proteolytic degradation (Bukau and Horwich,
1998; Garrido et al., 2001).
Under normal physiological condition, the Hsp60 protein is pivotal for the maintenance
of cellular homeostasis, as well as regulation of cell cycle and apoptosis (Ellis, 1999).
Hence, any translocation of the Hsp60 protein to extra-mitochondrial or extracellular
sites, or alteration in its expression level might involve in several pathophysiological
events, e.g., cardiovascular diseases, autoimmune diseases and malignancies (Garrido et
al., 2001; Pockley, 2003). Typically, the release of the intracellular HSPs into
extracellular milieu is indicative of non-physiological tissue damage. These
extracellular HSPs are danger signals and act as signaling molecules for intercellular
communication in inducing pro-inflammatory responses (Pockley, 2003). In cancers,
the Hsp60 protein was demonstrated to be actively secreted by tumour cells via the
proposed exosomal pathway (Merendino et al., 2010). The increased expression of the
Hsp60 protein has been reported in several tumours, i.e., prostate, ovarian, pancreatic,
colorectal, breast and cervical (Bini et al., 1997; Cappello et al., 2005; Cappello et al.,
2003; Hwang et al., 2009; Piselli et al., 2000; Schneider et al., 1999). In fact, the
staining and accumulation of the Hsp60 protein have been demonstrated in the
cytoplasm of tumour cells, indicative of the involvement of the cytosolic Hsp60 in
cancer progression. The over-expression of the Hsp60 protein was also observed in the
pre-tumoural lesions of prostate, uterine exocervix, colon and rectum (Cappello et al.,
2003a; Cappello et al., 2003). In addition to its chaperonic activity in altering the
activity and turnover of cancer-associated proteins, previous studies had proposed other
non-chaperonic roles of the over-expressed Hsp60 protein in carcinogenesis, i.e.,
restraining the p53 activity and sequestering the Bax-containing complexes to evade

Chapter Five – Discussion
238
apoptosis, mediating the NF-κB-dependent signaling to promote tumour cell survival, as
well as activating β-catenin to promote cancer invasion and metastasis (Chun et al.,
2010; Garrido et al., 2001; Ghosh et al., 2007; Shan et al., 2003; Tsai et al., 2009).
5.3.2 Nucleophosmin (B23)
The B23, or also known as numatrin, is a non-ribosomal nucleolar phosphoprotein that
exists in two isoforms as a result of alternative splicing, i.e., B23.1 and B23.2 (Chang
and Olson, 1990; Feuerstein and Mond, 1987a; Yung et al., 1985). These isoforms are
expressed in different subcellular locations, whereby the expression level is cell growth-
related for B23.1 but relatively constant for B23.2 (Wang et al., 1993). The B23.1 is the
predominant isoform and hereafter referred to as B23 in our discussion. Physiologically,
this multifunctional protein is engaged in a range of biological processes, i.e., ribosome
biogenesis, maintenance of genomic stability, as well as cell proliferation (Chartier et al.,
2007; Lim and Wang, 2006). The involvement of the B23 protein rely on its RNA and
DNA binding ability, intrinsic endoribonuclease activity, as well as its regulatory role in
the cell cycle progression, centromere duplication, DNA histone assembly and ARF-
p53 pathway (Bertwistle et al., 2004; Colombo et al., 2002; Gadad et al., 2011; Herrera
et al., 1995; Okuda, 2002; Okuda et al., 2000; Savkur and Olson, 1998; Wang et al.,
1994). The B23 protein has demonstrated both oncogenic and tumour suppressive
abilities via its interaction with the p53 and ARF proteins (Bertwistle et al., 2004;
Colombo et al., 2002). The B23 protein has also been observed to shuttle between the
nucleus and cytoplasm, and this might relate to its molecular chaperone activities (Borer
et al., 1989; Szebeni and Olson, 1999).
Given the fact that B23 protein is the key regulator in several cellular processes, any
perturbation in its expression or function is expected to implicate in disease
pathogenesis, e.g., tumourigenesis (Lim and Wang, 2006). For instance, the mutated

Chapter Five – Discussion
239
B23 protein, as a consequence of mutation in exon 12 of the NPM1 gene, is a hallmark
of acute myeloid leukemias (Falini et al., 2005). However, this mutation is absent in
most of the human solid tumours where the over-expression of B23 protein is frequently
observed (Jeong et al., 2007). In fact, the expression level of the B23 protein is higher
in proliferating cells compared to the resting cells (Chan et al., 1989; Feuerstein et al.,
1988; Feuerstein and Mond, 1987). This close relationship between the B23 protein
level and cell proliferation elucidates its over-expression in most of human neoplasms,
i.e., colorectal, oral, bladder, stomach, prostate, ovary and liver cancers (Chang et al.,
2005; Nozawa et al., 1996; Subong et al., 1999; Tanaka et al., 1992; Tsui et al., 2004;
Yun et al., 2007; Zhang, 2004). The high abundance of B23 protein has been
speculated to inhibit the p53 tumour suppressive activity via direct binding or negative
regulatory effect on the ARF protein (Gjerset, 2006; Li et al., 2010). The ARF-induced
p53-mediated apoptosis in response to oncogenes activation is then impaired, resulting
in the continued outgrowth of abnormal cells with hyperproliferative oncogenic signals
(Bertwistle et al., 2004; Gjerset, 2006; Korgaonkar et al., 2005). Hence, the over-
expression of B23 protein might implicate as one of the early events in carcinogenesis
(Lim and Wang, 2006).
5.3.3 Stathmin (SMN)
The cytoplasmic protein SMN, which is also known as the Oncoprotein 18, is a member
of the phosphoprotein family that is involved in microtubule dynamics, cytoskeleton
biogenesis and focal adhesion reorganisation (Curmi et al., 1997; Koppel et al., 1990;
Sherbet and Cajone, 2005). This microtubule destabilizing protein is crucial for the
proper assembly of the mitotic spindle and chromosome movement during mitosis
(Johnsen et al., 2000; Larsson et al., 1997; Rana et al., 2008; Rubin and Atweh, 2004).
In addition, it also plays an important role in signal transduction by integrating,
coordinating and directing diverse extracellular and intracellular signals (Sherbet and

Chapter Five – Discussion
240
Cajone, 2005; Sobel, 1991). Hence, the aberrant expression of the SMN protein would
have serious consequences on the biological behaviours of cells, i.e., cell morphology,
proliferation, differentiation and motility, which then contribute to the proliferative
potential and invasive behaviours of the cancer cells (Johnsen et al., 2000; Rubin and
Atweh, 2004; Sherbet and Cajone, 2005; Singer et al., 2007).
As previously observed in the hepatocarcinogenesis, the over-expression of SMN was
thought to be an early protumourigenic event. This might in part associate with the
genetic alterations in the TP53 gene, a most common early event in oncogenesis. The
expression of SMN is down-regulated with wild-type p53, while its elevated level is
thought to be associated with the p53 gain-of-function mutations (Ahn et al., 1999; Alli
et al., 2007; Levine, 1997; Singer et al., 2007). It is then not surprising that the over-
expression of SMN is reported in a variety of human malignancies, i.e., acute leukemia,
hepatocellular carcinoma, as well as prostate, ovarian, breast and colorectal cancer
(Alaiya et al., 1997; Curmi et al., 2000; Ghosh et al., 2007a; Hanash et al., 1988; Singer
et al., 2007; Zheng et al., 2010). Singer et al. and Tan et al. had previously revealed the
relationship between the expression of SMN and the migratory ability of cancer cells.
The invasion and metastasis of the CRC neoplasms were facilitated through the gain in
motility and loss of cell attachment of the tumour cells as a result of the SMN over-
expression (Singer et al., 2009; Tan et al., 2012; Zheng et al., 2010).
5.3.4 S100 calcium-binding protein A9 (S100A9)
More recent insight into the CRC tumourigenesis had established the interaction
between the tumour microenvironment and tumour cells in contributing to the hallmark
phenotypes of cancer. The extracellular matrix, fibroblasts, immune cells and
endothelial cells constitute the tumour stromal components that are aggressively
involved in carcinogenesis (Hanahan and Weinberg, 2011; Tlsty and Coussens, 2006).

Chapter Five – Discussion
241
On the other hand, the soluble mediators (which are either released by the tumour cells
or actively secreted by these stromal cells), are also critical players in this pathologic
process. Recent studies had focused on the damage-associated molecular pattern
(DAMP) molecules, with one of the examples, the S100A9 protein that is widely
implicated in inflammatory disorders and malignancies, through its release into the
extracellular milieu (Gebhardt et al., 2006; Németh et al., 2009; Srikrishna and Freeze,
2009). In humans, the formation of the stable S100A8/A9 heterodimer (calprotectin) is
favoured (Leukert et al., 2006). This functional heterocomplex is crucial in several
intracellular processes, i.e., calcium sensing, cytoskeleton rearrangement, activation of
the NADPH oxidase and transportation of the arachidonic acid (Donato, 2001; Kerkhoff
et al., 2005). Once the S100A8/A9 is released into the extracellular space, it acts as the
DAMP ligand that binds to the cell surface receptors, which consequently leads to the
activation of intracellular signaling cascades and cellular responses contributing to
potential tumour formation (Srikrishna, 2012). Both S100A8 and S100A9 are
intracellular calcium-binding proteins that are predominantly expressed by myeloid
cells, while their expressions cell- and tissue-specific (Roth et al., 2003).
Pathologically, the extracellular S100A8/A9 complex is essential for both
inflammation-induced cancer and cancer-induced inflammation. This has been
evidenced by the over-expression of both S100A8 and S100A9 proteins in different
types of human neoplasms, i.e., gastric, pancreatic, bladder, colorectal, breast, ovarian
and thyroid cancers (Salama et al., 2008). The pathologic effects of the S100A8/A9
heterodimer on CRC tumour cells were mainly mediated by the transmembrane receptor,
RAGE. The recognition of the RAGE on S100A8/A9 results in the induction of MAPK
signaling pathway and activation of NF-κB, which ultimately promotes the proliferation,
viability and migration of CRC tumour cells in autocrine and paracrine fashion
(Ghavami et al., 2008; Ichikawa et al., 2011; Kim et al., 2009a; Kolligs et al., 2002;

Chapter Five – Discussion
242
Turovskaya et al., 2008). A recent finding on the role of S100A8/A9 in the progression
of CRC neoplasms had reported an up-regulation of the Wnt/β-catenin pathway
associated with it (Duan et al., 2013). Moreover, the over-expression of the S100A9
protein also leads to the recruitment and accumulation of myeloid-derived suppressor
cells (MDSC) that exhibit immunosuppressive effect and thus, allows immune evasion
of developing tumours (Dolcetti et al., 2008; Ostrand-Rosenberg, 2010). In view of its
implications in tumour progression, as well as its over-expression in both adenoma and
early stage CRC neoplasms, the S100A9 protein may hold diagnostic value as a tissue /
serum biomarker for the early detection of CRC for future screening (Kim et al., 2009a).

Chapter Six – Conclusion & Recommendation
243
CHAPTER SIX
CONCLUSION
&
RECOMMENDATION

Chapter Six – Conclusion & Recommendation
244
6.1 Part A: SNPs Genotyping via Allelic Discrimination Assays
In the present study, we have genotyped 15 SNPs to investigate their distribution in our
Malaysian population, as well as their association to CRC susceptibility in our patients’
cohort. None of the genetic variants in the NOD2, XRCC1, EGF and VEGF genes was
associated to disease susceptibility in our local samples. As for the screening of the
common GWAS-identified CRC-associated variants, we also failed to replicate the
associations between the rs6983267, rs16892766, rs3802842 and rs4779584, to CRC
risk. In our local population, only rs4939827 of the SMAD7 gene (chromosome 18q21)
was associated to CRC, where its homozygous C/C genotype was speculated to confer
protection from the predisposition of CRC. To the best of our knowledge, there is yet to
be any published data relating the 15 SNPs and CRC susceptibility with regards to our
Malaysian population.
Given the large amount of epidemiological studies being performed worldwide, the
findings on the relationship between these genetic variants and CRC risk are still
inconsistent, and no firm conclusion can be drawn thus far. This might be attributed to
the genetic heterogeneity across different study populations, relatively small size of
sample cohorts, lack of information on tumour location and CRC staging, different
selection criteria for control groups, and publication bias against negative findings. In
our present study, there were a few short-comings that need to be addressed herein.
First, our sample cohort was relatively small and hence, the statistical power might be
too low to detect the moderate effects of these low-penetrance genetic variants on CRC
susceptibility. Second, we did not consider the effects of possible modifiers or
confounding factors, i.e., dietary and lifestyle factors, due to the lack of sufficient
information.

Chapter Six – Conclusion & Recommendation
245
For future work, perhaps it would be advisable to address these confounding factors in
order to obtain a clearer picture on the contribution of these low-penetrance genes on
CRC, as certain genetic variants might only impact CRC carcinogenesis in concomitant
with other modifying factors. It would be more useful to perform the screening of these
low-penetrance genetic variants using a larger sample cohort with sufficient statistical
power. It will also provide a better insight into the impacts of these genetic variants on
CRC progression if the patients’ cohort is large enough for further stratification
according to tumour location and cancer stage. It is also interesting to study the low-
penetrance genetic variants in combination since an ‘adverse combination’ of the less
favourable genetic variants was thought to exhibit an amplified effect on CRC
predisposition.
6.2 Part B: Differential Transcriptome Analysis
In our current analysis, two distinctive gene expression signatures were identified to
recognise the early- and advanced stage CRC neoplasms. The early stage CRC group
was represented by the under-expression of ARPC2, as well as the over-expression of
the RPL35, RPS23 and TIMP1 genes. On the other hand, the advanced stage CRC
tumours were characterised by the over-expression of the C6orf173, RPL35, RPS23 and
TIMP1 genes. We also investigated the mRNA expression patterns of the primary
sporadic CRC tumours of different tumour sites, i.e., right- and left-sided. The right-
sided CRC tumours were characterised by a 3-gene signature, i.e., the over-expressed
C6orf173, RPL35 and TIMP1 genes. We reported an additional over-expressed RPS23
gene in the left-sided CRC neoplasms compared to the former group.
The microarray technology is the most widely-used approach in transcriptomic profiling.
However, the microarray experiment is often subjected to various sources of variability
and false positives. Moreover, the massive data set generated by this approach also
Chapter Six – Conclusion & Recommendation
246
presents both statistical and bioinformatic challenges. Therefore, we chose to perform
our gene expression analysis with another approach, i.e., the two-step ACP-based PCR.
The ACP technology with its unique tripartite structure of primers and PCR steps allows
high specificity and minimises false-positives. For our study, the sample cohort was
relatively small, thus we were not able to reach a statistically firm conclusion. This is
due to several reasons:- first, there is a lack of a Tissue Bank in our institution and
hence, the collection of tissue specimens was fully dependent on the number of
surgically resected CRC patients within our study period. Second, the voluntariness of
CRC patients was still low in our population. Third, the application of stringent
criteria(s) had hampered the collection of suitable tissue specimens within a short time-
frame. Nevertheless, our identified gene expression signatures were still convincing
owing to our stringent sample selection, high specificity of ACP primers and TaqMan
assays, as well as reliable statistical analysis software.
Since the identified differentially expressed genes in our present study were biologically
plausible and clinically relevant to CRC carcinogenesis, further validation of their
sensitivity and specificity on a larger set of clinical samples is needed. In future, the
extensive testing of their distinctive abilities on each stage of CRC progression, i.e.,
Stages I, II, III and IV, would hold more value in the clinical setting. In addition, the
identified gene expression signatures in the early stage CRC tumours should also be
examined based on pre-neoplastic lesions, e.g., adenomas. It would be interesting to see
if these changes in gene expression patterns can be observed prior to the development of
malignancy. Furthermore, the integration of the imaging and histological information,
as well as other histochemical parameters should be made possible in future studies.
Moreover, we should also perform gene expression analysis with different platforms,
and subsequently exploit a combination of several gene markers to improve the staging,
prognostication and monitoring of the complex CRC neoplasms.

Chapter Six – Conclusion & Recommendation
247
6.3 Part C: Differential Proteome Analysis via A Bottom-Up Proteomics
Approach
In the third part of our study, we were able to characterise the protein expression
patterns of only the Stage II CRC tumours. The protein abundance analysis between the
advanced stages of CRC tumours (Stages III and IV) and their paired macroscopically
normal tumour-adjacent tissues, failed to detect any differentially expressed protein in
our patients’ cohort. The proteins that found to be over-expressed in the Stage II CRC
neoplasms were the Hsp60, RPLP0, PPase, NCC27, TCTP, B23, SGN8, NM23, SMN
and S100A9. Meanwhile, the K20, ACTC1, ACTSA, HSP27, LC20 and LC17 proteins
were under-expressed. In fact, most of these aberrantly expressed proteins were also
reported in the neoplastic colonic mucosa via similar approaches in other proteomic
studies, with the exception of RPLP0, SGN8 and ACTC1 proteins. This proves the
reliability of our present 2-D DIGE analysis regardless of the different disease stages of
recruited CRC tumouric tissue specimens and 2-D GE approaches compared to other
proteomic studies.
The short-coming of our current protein expression analysis is the lack of tumouric
samples from the Stage I CRC patients. It would be more beneficial if the protein
expression changes in this earliest stage of CRC progression could be characterised.
While we did not detect any significant protein abundance changes in the advanced
stage CRC neoplasms, one of the possibilities would be the proteins that are responsible
for the late CRC progression might not fall within the pI range of 4 – 7. It is possible
that the proteins with significant changes might overlap with other proteins, which
render them undetectable. Therefore, the studies on Stages III and IV CRC tumours
should be repeated by applying different pH ranges or extended lengths of Immobiline
DryStrip Gels.

Chapter Six – Conclusion & Recommendation
248
Improving steps would be to authenticate the identified protein expression patterns in a
larger sample cohort (consisting of all stages of CRC tumours) with other approaches,
i.e., Western Blot or recently developed TaqMan Chemistry-Based Protein Assay. It
would be more clinically useful if the pre-neoplastic adenomas are included as well. In
view of the general wide screening acceptance for serological markers, further analysis
is needed to investigate whether these over-expressed proteins in the Stage II CRC
tumours are being released into the circulation and are readily detectable in the patients’
serum. This would be the foremost step in translating the laboratory findings into
potential bedside application. On the other hand, the same study approaches could also
be applied to characterise aberrantly expressed proteins in Malaysian CRC patients of
better or worse prognosis, as well as those who are responsive or non-responsive to the
adjuvant therapy.
Overall, the CRC research in Malaysia is still in its infancy and has a long way to go.
However, what is needed is a multi-disciplinary and inter-laboratory collaborative effort
towards a better personalised future CRC management.

References
249
References
Aaltonen, L., Johns, L., Jarvinen, H., Mecklin, J. P., & Houlston, R. (2007). Explaining
the familial colorectal cancer risk associated with mismatch repair (MMR)-
deficient and MMR-stable tumours. Clin Cancer Res, 13(1), 356-361.
Abdel-Rahman, S. Z., & El-Zein, R. A. (2000). The 399Gln polymorphism in the DNA
repair gene XRCC1 modulates the genotoxic response induced in human
lymphocytes by the tobacco-specific nitrosamine NNK. Cancer Lett, 159(1), 63-
71.
Abdel-Rahman, S. Z., Soliman, A. S., Bondy, M. L., Omar, S., El-Badawy, S. A.,
Khaled, H. M., . . . Levin, B. (2000). Inheritance of the 194Trp and the 399Gln
variant alleles of the DNA repair gene XRCC1 are associated with increased risk
of early-onset colorectal carcinoma in Egypt. Cancer Lett, 159(1), 79-86.
Ahn, J., Murphy, M., Kratowicz, S., Wang, A., Levine, A. J., & George, D. L. (1999).
Down-regulation of the stathmin/Op18 and FKBP25 genes following p53
induction. Oncogene, 18(43), 5954-5958.
Akahane, T., Akahane, M., Shah, A., Connor, C. M., & Thorgeirsson, U. P. (2004).
TIMP-1 inhibits microvascular endothelial cell migration by MMP-dependent
and MMP-independent mechanisms. Exp Cell Res, 301(2), 158-167.
Alaiya, A. A., Franzén, B., Fujioka, K., Moberger, B., Schedvins, K., Silfversvärd,
C., . . . Auer, Gert. (1997). Phenotypic analysis of ovarian carcinoma:
polypeptide expression in benign, borderline and malignant tumours. Int J
Cancer, 73(5), 678-682.
Alfonso, P., Nunez, A., Madoz-Gurpide, J., Lombardia, L., Sanchez, L., & Casal, J. I.
(2005). Proteomic expression analysis of colorectal cancer by two-dimensional
differential gel electrophoresis. Proteomics, 5(10), 2602-2611.
Alhopuro, P., Ahvenainen, T., Mecklin, J. P., Juhola, M., Jarvinen, H. J., Karhu, A., &
Aaltonen, L. A. (2004). NOD2 3020insC alone is not sufficient for colorectal
cancer predisposition. Cancer Res, 64(20), 7245-7247.
Alitalo, K., Tammela, T., & Petrova, T. V. (2005). Lymphangiogenesis in development
and human disease. Nature, 438(7070), 946-953.
Alli, E., Yang, J. M., & Hait, W. N. (2007). Silencing of stathmin induces tumour-
suppressor function in breast cancer cell lines harboring mutant p53. Oncogene,
26(7), 1003-1012.
Altshuler, D., & Clark, A. G. (2005). Harvesting medical information from the human
family tree. Science, 307(5712), 1052-1053.
Amalinei, C., Caruntu, I. D., Giusca, S. E., & Balan, R. A. (2010). Matrix
metalloproteinases involvement in pathologic conditions. Rom J Morphol
Embryol, 51(2), 215-228.

References
250
Amann, K. J., & Pollard, T. D. (2001). Direct real-time observation of actin filament
branching mediated by Arp2/3 complex using total internal reflection
fluorescence microscopy. Proc Natl Acad Sci, 98(26), 15009-15013.
American Cancer Society. (2011). Colorectal cancer facts and figures 2011 – 2013.
Atlanta, GA: Author.
American Cancer Society. (2012). Cancer facts and figures 2012. Atlanta, GA: Author.
American Cancer Society. (2012a). Cancer prevention and early detection facts and
figures 2012. Atlanta, GA: Author.
Amsterdam, A., Sadler, K. C., Lai, K., Farrington, S., Bronson, R. T., Lees, J. A., &
Hopkins, N. (2004). Many ribosomal protein genes are cancer genes in zebrafish.
PLoS Biol, 2(5), E139.
Angeletti, S., Galluzzo, S., Santini, D., Ruzzo, A., Vincenzi, B., Ferraro, E., . . .
Dicuonzo, G. (2009). NOD2/CARD15 polymorphisms impair innate immunity
and increase susceptibility to gastric cancer in an Italian population. Hum
Immunol, 70(9), 729-732.
Aquilina, G., Hess, P., Branch, P., MacGeoch, C., Casciano, I., Karran, P., & Bignami,
M. (1994). A mismatch recognition defect in colon carcinoma confers DNA
microsatellite instability and a mutator phenotype. Proc Natl Acad Sci, 91(19),
8905-8909.
Araújo, A., Ribeiro, R., Azevedo, I., Coelho, A., Soares, M., Sousa, B., . . . Scagliotti, G.
V. (2007). Genetic polymorphisms of the epidermal growth factor and related
receptor in non-small cell lung cancer—a review of the literature. Oncologist,
12(2), 201-210.
Arbiser, J. L., Moses, M. A., Fernandez, C. A., Ghiso, N., Cao, Y., Klauber, N., . . .
Folkman, J. (1997). Oncogenic H-ras stimulates tumour angiogenesis by two
distinct pathways. Proc Natl Acad Sci, 94(3), 861-866.
Asano, T., Tada, M., Cheng, S., Takemoto, N., Kuramae, T., Abe, M., . . . Kondo, S.
(2008). Prognostic values of matrix metalloproteinase family expression in
human colorectal carcinoma. J Surg Res, 146(1), 32-42.
Astler, V. B., & Coller, F. A. (1954). The prognostic significance of direct extension of
carcinoma of the colon and rectum. Ann Surg, 139(6), 846-852.
Baak, J. P. A., Path, F. R. C., Hermsen, M. A. J. A., Meijer, G., Schmidt, J., & Janssen,
E. A. M. (2003). Genomics and proteomics in cancer. Eur J Cancer, 39(9),
1199-1215.
Bae, S. J., Kim, J. W., Kang, H., Hwang, S. G., Oh, D., & Kim, N. K. (2008). Gender-
specific association between polymorphism of vascular endothelial growth
factor (VEGF 936 C > T) gene and colon cancer in Korea. Anticancer Res,
28(2B), 1271-1276.
Baeriswyl, V., & Christofori, G. (2009). The angiogenic switch in carcinogenesis.
Semin Cancer Biol, 19(5), 329-337.

References
251
Bailly, M., & Condeelis, J. (2002). Cell motility: insights from the backstage. Nat Cell
Biol, 4(12), E292-294.
Bailly, M., Ichetovkin, I., Grant, W., Zebda, N., Machesky, L. M., Segall, J. E., &
Condeelis, J. (2001). The F-actin side binding activity of the Arp2/3 complex is
essential for actin nucleation and lamellipod extension. Curr Biol, 11(8), 620-
625.
Baker, E. A., Bergin, F. G., & Leaper, D. J. (2000). Plasminogen activator system,
vascular endothelial growth factor, and colorectal cancer progression. Mol
Pathol, 53(6), 307-312.
Baker, E. A., Bergin, F. G., & Leaper, D. J. (2000a). Matrix metalloproteinases, their
tissue inhibitors and colorectal cancer staging. Br J Surg, 87(9), 1215-1221.
Balasubramanian, S. P., Brown, N. J., & Reed, M. W. (2002). Role of genetic
polymorphisms in tumour angiogenesis. Br J Cancer, 87(10), 1057-1065.
Balbay, M. D., Pettaway, C. A., Kuniyasu, H., Inoue, K., Ramirez, E., Li, E., . . .
Dinney, C. P. (1999). Highly metastatic human prostate cancer growing within
the prostate of athymic mice overexpresses vascular endothelial growth factor.
Clin Cancer Res, 5(4), 783-789.
Balkwill, F., & Mantovani, A. (2001). Inflammation and cancer: back to Virchow?
Lancet, 357(9255), 539-545.
Barcellos-Hoff, M. H. (2001). It takes a tissue to make a tumour: epigenetics, cancer
and the microenvironment. J Mammary Gland Biol Neoplasia, 6(2), 213-221.
Barnard, G. F., Staniunas, R. J., Mori, M., Puder, M., Jessup, M. J., Steele, G. D. Jr., &
Chen, L. B. (1993). Gastric and hepatocellular carcinomas do not overexpress
the same ribosomal protein messenger RNAs as colonic carcinoma. Cancer Res,
53(17), 4048-4052.
Barnard, G. F., Staniunas, R. J., Bao, S., Mafune, K., Steele, G. D. Jr., Gollan, J. L., &
Chen, L. B. (1992). Increased expression of human ribosomal phosphoprotein
P0 messenger RNA in hepatocellular carcinoma and colon carcinoma. Cancer
Res, 52(11), 3067-3072.
Barrow, E., Robinson, L., Alduaij, W., Shenton, A., Clancy, T., Lalloo, F., . . . Evans, D.
G. (2009). Cumulative lifetime incidence of extracolonic cancers in Lynch
syndrome: a report of 121 families with proven mutations. Clin Genet, 75(2),
141-149.
Baud, V., & Karin, M. (2009). Is NF-kappaB a good target for cancer therapy? Hopes
and pitfalls. Nat Rev Drug Discov, 8(1), 33-40.
Belasco, J. G., & Brawerman, G. (Eds.). (1993). Control of messenger RNA stability.
New York, NY: Academic Press.
Bergers, G., & Benjamin, L. E. (2003). Tumourigenesis and the angiogenic switch. Nat
Rev Cancer, 3(6), 401-410.

References
252
Bernstein, C. N., Blanchard, J. F., Kliewer, E., & Wajda, A. (2001). Cancer risk in
patients with inflammatory bowel disease: a population-based study. Cancer,
91(4), 854-862.
Bertwistle, D., Sugimoto, M., & Sherr, C. J. (2004). Physical and functional interactions
of the Arf tumour suppressor protein with nucleophosmin/B23. Mol Cell Biol,
24(3), 985-996.
Berwick, M., & Vineis, P. (2005). Measuring DNA repair capacity: small steps. J Natl
Cancer Inst, 97(2), 84-85.
Betes, M., Munoz-Navas, M. A., Duque, J. M., Angos, R., Macias, E., Subtil, J. C., . . .
Martinez-Gonzalez, M. A. (2003). Use of colonoscopy as a primary screening
test for colorectal cancer in average risk people. Am J Gastroenterol, 98(12),
2648-2654.
Beutler, B. (2004). Inferences, questions and possibilities in Toll-like receptor
signalling. Nature, 430(6996), 257-263.
Bhowmick, D. A., Zhuang, Z., Wait, S. D., & Weil, R. J. (2004). A functional
polymorphism in the EGF gene is found with increased frequency in
glioblastoma multiforme patients and is associated with more aggressive disease.
Cancer Res, 64(4), 1220-1223.
Bi, X., Lin, Q., Foo, T. W., Joshi, S., You, T., Shen, H. M., . . . Hew, C. L. (2006).
Proteomic analysis of colorectal cancer reveals alterations in metabolic
pathways: mechanism of tumourigenesis. Mol Cell Proteomics, 5(6), 1119-1130.
Bini, L., Magi, B., Marzocchi, B., Arcuri, F., Tripodi, S., Cintorino, M., . . . Tosi, P.
(1997). Protein expression profiles in human breast ductal carcinoma and
histologically normal tissue. Electrophoresis, 18(15), 2832-2841.
Blobe, G. C., Schiemann, W. P., & Lodish, H. F. (2000). Role of transforming growth
factor beta in human disease. N Engl J Med, 342(18), 1350-1358.
Bode, W., Reinemer, P., Huber, R., Kleine, T., Schnierer, S., & Tschesche, H. (1994).
The X-ray crystal structure of the catalytic domain of human neutrophil
collagenase inhibited by a substrate analogue reveals the essentials for catalysis
and specificity. EMBO J, 13(6), 1263-1269.
Boguski, M. S., & McCormick, F. (1993). Proteins regulating Ras and its relatives.
Nature, 366(6456), 643-654.
Boisvert, F. M., van Koningsbruggen, S., Navascues, J., & Lamond, A. I. (2007). The
multifunctional nucleolus. Nat Rev Mol Cell Biol, 8(7), 574-585.
Boon, K., Caron, H. N., van Asperen, R., Valentijn, L., Hermus, M. C., van Sluis, P., . . .
Versteeg, R. (2001). N-myc enhances the expression of a large set of genes
functioning in ribosome biogenesis and protein synthesis. EMBO J, 20(6), 1383-
1393.
Borer, R. A., Lehner, C. F., Eppenberger, H. M., & Nigg, E. A. (1989). Major nucleolar
proteins shuttle between nucleus and cytoplasm. Cell, 56(3), 379-390.

References
253
Bortoluzzi, S., d'Alessi, F., Romualdi, C., & Danieli, G. A. (2001). Differential
expression of genes coding for ribosomal proteins in different human tissues.
Bioinformatics, 17(12), 1152-1157.
Boshoff, A., Nicoll, W. S., Hennessy, F., Ludewig, M., Daniel, S., Modisakeng, K.
W., . . . Blatch, G. L. (2004). Molecular chaperones in biology, medicine and
protein biotechnology. S Afr J Sci, 100(11-12), 665-677.
Bosman, F. T., Carneiro, F., Hruban, R. H., & Theise, N. D. (Eds.). (2010). WHO
classification of tumours of the digestive system. Lyon: International Agency for
Research on Cancer.
Boulay, J. L., Mild, G., Lowy, A., Reuter, J., Lagrange, M., Terracciano, L., . . .
Rochlitz, C. (2003). SMAD7 is a prognostic marker in patients with colorectal
cancer. Int J Cancer, 104(4), 446-449.
Bourboulia, D., & Stetler-Stevenson, W. G. (2010). Matrix metalloproteinases (MMPs)
and tissue inhibitors of metalloproteinases (TIMPs): positive and negative
regulators in tumour cell adhesion. Semin Cancer Biol, 20(3), 161-168.
Brambilla, E., & Gazdar, A. (2009). Pathogenesis of lung cancer signalling pathways:
roadmap for therapies. Eur Respir J, 33(6), 1485-1497.
Brand, K. (2002). Cancer gene therapy with tissue inhibitors of metalloproteinases
(TIMPs). Curr Gene Ther, 2(2), 255-271.
Braunwald, E., Fauci, A. S., Kasper, D. L., Hauser, S. L., Longo, D. L., & Jameson, J. L.
(Eds.). (2001). Harrison’s principles of internal medicine (15th ed.). New York,
NY: McGraw-Hill.
Brierley, J. D., Greene, F. L., Sobin, L. H., & Wittekind, C. (2006). The "y" symbol: an
important classification tool for neoadjuvant cancer treatment. Cancer, 106(11),
2526-2527.
Bringans, S., Eriksen, S., Kendrick, T., Gopalakrishnakone, P., Livk, A., Lock, R., &
Lipscombe, R. (2008). Proteomic analysis of the venom of Heterometrus
longimanus (Asian black scorpion). Proteomics, 8(5), 1081-1096.
Broderick, P., Carvajal-Carmona, L., Pittman, A. M., Webb, E., Howarth, K., Rowan,
A., . . . Houlston, R. S. (2007). A genome-wide association study shows that
common alleles of SMAD7 influence colorectal cancer risk. Nat Genet, 39(11),
1315-1317.
Brown, L. F., Guidi, A. J., Schnitt, S. J., Van De Water, L., Iruela-Arispe, M. L., Yeo, T.
K., . . . Dvorak, H. F. (1999). Vascular stroma formation in carcinoma in situ,
invasive carcinoma, and metastatic carcinoma of the breast. Clin Cancer Res,
5(5), 1041-1056.
Bukau, B., & Horwich, A. L. (1998). The Hsp70 and Hsp60 chaperone machines. Cell,
92(3), 351-366.
Bussey, H. J. R. (1975). Familial polyposis coli. Baltimore, MD: Johns Hopkins
University Press.

References
254
Bussey, H. J., Wallace, M. H., & Morson, B. C. (1967). Metachronous carcinoma of the
large intestine and intestinal polyps. Proc R Soc Med, 60(3), 208-210.
Butterworth, A. S., Higgins, J. P., & Pharoah, P. (2006). Relative and absolute risk of
colorectal cancer for individuals with a family history: a meta-analysis. Eur J
Cancer, 42(2), 216-227.
Caldecott, K. W. (2003). XRCC1 and DNA strand break repair. DNA Repair (Amst),
2(9), 955-969.
Caldecott, K. W., Mckeown, C. K., Tucker, J. D., Ljungquist, S., & Thompson, L. H.
(1994). An interaction between the mammalian DNA-repair protein XRCC1 and
DNA Ligase-III. Mol Cell Biol, 14(1), 68-76.
Cao, J., Crest, J., Fasulo, B., & Sullivan, W. (2010). Cortical actin dynamics facilitate
early-stage centrosome separation. Curr Biol, 20(8), 770-776.
Cappello, F., Bellafiore, M., Palma, A., David, S., Marciano, V., Bartolotta, T., . . .
Bucchieri, F. (2003a). 60kDa chaperonin (HSP60) is over-expressed during
colorectal carcinogenesis. Eur J Histochem, 47(2), 105-110.
Cappello, F., David, S., Rappa, F., Bucchieri, F., Marasa, L., Bartolotta, T. E., . . .
Zummo, G. (2005). The expression of HSP60 and HSP10 in large bowel
carcinomas with lymph node metastase. BMC Cancer, 5, 139.
Cappello, F., Rappa, F., David, S., Anzalone, R., & Zummo, G. (2003).
Immunohistochemical evaluation of PCNA, p53, HSP60, HSP10 and MUC-2
presence and expression in prostate carcinogenesis. Anticancer Res, 23(2B),
1325-1331.
Carmeliet, P. (2003). Angiogenesis in health and disease. Nat Med, 9(6), 653-660.
Carmeliet, P., & Jain, R. K. (2000). Angiogenesis in cancer and other diseases. Nature,
407(6801), 249-257.
Carpenter, G., & Cohen, S. (1976). Human epidermal growth factor and the
proliferation of human fibroblasts. J Cell Physiol, 88(2), 227-237.
Center, M. M., Jemal, A., Smith, R. A., & Ward, E. (2009). Worldwide variations in
colorectal cancer. CA Cancer J Clin, 59(6), 366-378.
Center, M. M., Jemal, A., & Ward, E. (2009a). International trends in colorectal cancer
incidence rates. Cancer Epidemiol Biomarkers Prev, 18(6), 1688-1694.
Chae, Y. S., Kim, J. G., Sohn, S. K., Cho, Y. Y., Ahn, B. M., Moon, J. H., . . . Jun, S. H.
(2008). Association of vascular endothelial growth factor gene polymorphisms
with susceptibility and clinicopathologic characteristics of colorectal cancer. J
Korean Med Sci, 23(3), 421-427.
Chae, Y. S., Kim, J. G., Sohn, S. K., Cho, Y. Y., Moon, J. H., Bae, H. I., . . . Yu, W.
(2006). Investigation of vascular endothelial growth factor gene polymorphisms
and its association with clinicopathologic characteristics in gastric cancer.
Oncology, 71(3-4), 266-272.

References
255
Chan, W. Y., Liu, Q. R., Borjigin, J., Busch, H., Rennert, O. M., Tease, L. A., & Chan,
P. K. (1989). Characterisation of the cDNA encoding human nucleophosmin and
studies of its role in normal and abnormal growth. Biochemistry, 28(3), 1033-
1039.
Chang, J. H., & Olson, M. O. (1990). Structure of the gene for rat nucleolar protein B23.
J Biol Chem, 265(30), 18227-18233.
Chang, J. T., Wang, H. M., Chang, K. W., Chen, W. H., Wen, M. C., Hsu, Y. M., . . .
Cheng, A. J. (2005). Identification of differentially expressed genes in oral
squamous cell carcinoma (OSCC): overexpression of NPM, CDK1 and NDRG1
and underexpression of CHES1. Int J Cancer, 114(6), 942-949.
Chartier, N. T., Oddou, C. I., Lainé, M. G., Ducarouge, B., Marie, C. A., Block, M. R.,
& Jacquier-Sarlin, M. R. (2007). Cyclin-dependent kinase 2/cyclin E complex is
involved in p120 catenin (p120ctn)–dependent cell growth control: a new role
for p120ctn in cancer. Cancer Res, 67(20), 9781-9790.
Chau, C. H., & Figg, W. D. (2012). Aflibercept in pediatric solid tumours: moving
beyond the trap. Clin Cancer Res, 18(18), 4868-4871.
Cheeseman, I. M., & Desai, A. (2008). Molecular architecture of the kinetochore-
microtubule interface. Nat Rev Mol Cell Biol, 9(1), 33-46.
Chen, B., Zhou, Y., Yang, P., & Wu, X. T. (2012). Polymorphisms of XRCC1 and
gastric cancer susceptibility: a meta-analysis. Mol Biol Rep, 39(2), 1305-1313.
Chen, H. S., Sheen-Chen, S. M., & Lu, C. C. (2002). DNA index and S-phase fraction
in curative resection of colorectal adenocarcinoma: analysis of prognosis and
current trends. World J Surg, 26(5), 626-630.
Cheng, Q., Lau, W. M., Chew, S. H., Ho, T. H., Tay, S. K., & Hui, K. M. (2002).
Identification of molecular markers for the early detection of human squamous
cell carcinoma of the uterine cervix. Br J Cancer, 86(2), 274-281.
Cheon, S. S., Cheah, A. Y., Turley, S., Nadesan, P., Poon, R., Clevers, H., & Alman, B.
A. (2002). β-catenin stabilisation dysregulates mesenchymal cell proliferation,
motility, and invasiveness and causes aggressive fibromatosis and hyperplastic
cutaneous wounds. Proc Natl Acad Sci, 99(10), 6973-6978.
Chester, K. A., Robson, L., Begent, R. H., Talbot, I. C., Pringle, J. H., Primrose, L., . . .
Malcolm, A. D. (1989). Identification of a human ribosomal protein mRNA with
increased expression in colorectal tumours. Biochim Biophys Acta, 1009(3),
297-300.
Choi, P. M., & Zelig, M. P. (1994). Similarity of colorectal cancer in Crohn's disease
and ulcerative colitis: implications for carcinogenesis and prevention. Gut, 35(7),
950-954.
Chua, K. H., Hilmi, I., Ng, C. C., Eng, T. L., Palaniappan, S., Lee, W. S., & Goh, K. L.
(2009). Identification of NOD2/CARD15 mutations in Malaysian patients with
Crohn's disease. J Dig Dis, 10(2), 124-130.

References
256
Chun, J. N., Choi, B., Lee, K. W., Lee, D. J., Kang, D. H., Lee, J. Y., . . . Kang, S. W.
(2010). Cytosolic Hsp60 is involved in the NF-kappaB-dependent survival of
cancer cells via IKK regulation. PLoS One, 5(3), e9422.
Chun, Y., Park, B., Koh, W., Lee, S., Cheon, Y., Kim, R., . . . Lee, S. (2011). New
centromeric component CENP-W is an RNA-associated nuclear matrix protein
that interacts with nucleophosmin/B23 protein. J Biol Chem, 286(49), 42758-
42769.
Cincin, Z. B., Iyibozkurt, A. C., Kuran, S. B., & Cakmakoglu, B. (2012). DNA repair
gene variants in endometrial carcinoma. Med Oncol, 29(4), 2949-2954.
Citri, A., & Yarden, Y. (2006). EGF-ERBB signalling: towards the systems level. Nat
Rev Mol Cell Biol, 7(7), 505-516.
Clevers, H. (2004). At the crossroads of inflammation and cancer. Cell, 118(6), 671-674.
Cohen, S. (1962). Isolation of a mouse submaxillary gland protein accelerating incisor
eruption and eyelid opening in the new-born animal. J Biol Chem, 237, 1555-
1562.
Colombo, E., Marine, J. C., Danovi, D., Falini, B., & Pelicci, P. G. (2002).
Nucleophosmin regulates the stability and transcriptional activity of p53. Nat
Cell Biol, 4(7), 529-533.
Colon adenocarcinoma at 20X magnification. [Art]. In Human Pathology Digital Image
Gallery. Retrieved from http://www.microscopyu.com/staticgallery/
pathology/adenocarcinomaofcolon20x02.html.
Compton, C. C. (2003). Colorectal carcinoma: diagnostic, prognostic, and molecular
features. Mod Pathol, 16(4), 376-388.
Connolly, D. T., Heuvelman, D. M., Nelson, R., Olander, J. V., Eppley, B. L., Delfino, J.
J., . . . Feder, J. (1989). Tumour vascular permeability factor stimulates
endothelial cell growth and angiogenesis. J Clin Invest, 84(5), 1470-1478.
Coussens, L. M., & Werb, Z. (2002). Inflammation and cancer. Nature, 420(6917), 860-
867.
Cunningham, D., Atkin, W., Lenz, H. J., Lynch, H. T., Minsky, B., Nordlinger, B., &
Starling, N. (2010). Colorectal cancer. Lancet, 375(9719), 1030-1047.
Curmi, P. A., Nogues, C., Lachkar, S., Carelle, N., Gonthier, M. P., Sobel, A., . . .
Bieche, I. (2000). Overexpression of stathmin in breast carcinomas points out to
highly proliferative tumours. Br J Cancer, 82(1), 142-150.
Curmi, P. A., Andersen, S. S., Lachkar, S., Gavet, O., Karsenti, E., Knossow, M., &
Sobel, A. (1997). The stathmin/tubulin interaction in vitro. J Biol Chem, 272(40),
25029-25036.
Curtin, K., Lin, W. Y., George, R., Katory, M., Shorto, J., Cannon-Albright, L. A., . . .
Colorectal Cancer Study Group. (2009). Meta association of colorectal cancer
confirms risk alleles at 8q24 and 18q21. Cancer Epidemiol Biomarkers Prev,
18(2), 616-621.

References
257
Dai, M. S., Zeng, S. X., Jin, Y., Sun, X. X., David, L., & Lu, H. (2004). Ribosomal
protein L23 activates p53 by inhibiting MDM2 function in response to
ribosomal perturbation but not to translation inhibition. Mol Cell Biol, 24(17),
7654-7668.
Daraei, A., Salehi, R., Salehi, M., Emami, M. H., Janghorbani, M., Mohamadhashem, F.,
& Tavakoli, H. (2012). Effect of rs6983267 polymorphism in the 8q24 region
and rs4444903 polymorphism in EGF gene on the risk of sporadic colorectal
cancer in Iranian population. Med Oncol, 29(2), 1044-1049.
Dassoulas, K., Gazouli, M., Rizos, S., Theodoropoulos, G., Christoni, Z., Nikiteas, N.,
& Karakitsos, P. (2009). Common polymorphisms in the vascular endothelial
growth factor gene and colorectal cancer development, prognosis, and survival.
Mol Carcinog, 48(6), 563-569.
Day, D. W., & Morson, B. C. (1978). The adenoma-carcinoma sequence. In B. C.
Morson (Ed.), The pathogenesis of colorectal cancer (pp. 58-71). London:
Saunders.
de Kok, I. M., Wong, C. S., Chia, K. S., Sim, X., Tan, C. S., Kiemeney, L. A., &
Verkooijen, H. M. (2008). Gender differences in the trend of colorectal cancer
incidence in Singapore, 1968–2002. Int J Colorectal Dis, 23(5), 461-467.
de la Chapelle, A. (2004). Genetic predisposition to colorectal cancer. Nat Rev Cancer,
4(10), 769-780.
de la Guardia, C., Casiano, C. A., Trinidad-Pinedo, J., & Baez, A. (2001). CENP-F gene
amplification and overexpression in head and neck squamous cell carcinomas.
Head Neck, 23(2), 104-112.
De Luca, A., Carotenuto, A., Rachiglio, A., Gallo, M., Maiello, M. R., Aldinucci, D., . . .
Normanno, N. (2008). The role of the EGFR signaling in tumour
microenvironment. J Cell Physiol, 214(3), 559-567.
de Visser, K. E., Eichten, A., & Coussens, L. M. (2006). Paradoxical roles of the
immune system during cancer development. Nat Rev Cancer, 6(1), 24-37.
DeVita, V. T. Jr., Hellman, S., & Rosenberg, S. A. (Eds.). (1985). Cancer: principles
and practice of oncology vol. 1 (2nd ed.). Philadelphia, PA: Lippincott.
Deschoolmeester, V., Baay, M., Specenier, P., Lardon, F., & Vermorken, J. B. (2010).
A review of the most promising biomarkers in colorectal cancer: one step closer
to targeted therapy. Oncologist, 15(7), 699-731.
Dolcetti, L., Marigo, I., Mantelli, B., Peranzoni, E., Zanovello, P., & Bronte, V. (2008).
Myeloid-derived suppressor cell role in tumour-related inflammation. Cancer
Lett, 267(2), 216-225.
Domergue, J., Rouanet, P., Daures, J. P., Dubois, J. B., Joyeux, H., Solassol, C., & Pujol,
H. (1989). Multivariate analysis of prognostic factors for curative resectable
rectal cancer. Eur J Surg Oncol, 15(2), 93-98.

References
258
Donato, R. (2001). S100: a multigenic family of calcium-modulated proteins of the EF-
hand type with intracellular and extracellular functional roles. Int J Biochem Cell
Biol, 33(7), 637-668.
Dong, L. M., Potter, J. D., White, E., Ulrich, C. M., Cardon, L. R., & Peters, U. (2008).
Genetic susceptibility to cancer: the role of polymorphisms in candidate genes.
JAMA, 299(20), 2423-2436.
Dorundi, S., & Bannerjea, A. (2008). Colorectal cancer: early diagnosis and
predisposing causes. Surgery (Oxford), 26(8), 323-328.
Doyle, V. J., & Bateman, A. C. (2012). Colorectal cancer staging using TNM 7: is it
time to use this new staging system? J Clin Pathol, 65(4), 372-374.
Draper, D. E., & Reynaldo, L. P. (1999). RNA binding strategies of ribosomal proteins.
Nucleic Acids Res, 27(2), 381-388.
Droller, M. J. (1998). Vascular endothelial growth factor is a predictor of relapse and
stage progression in superficial bladder cancer. J Urol, 160(5), 1932.
Duan, L., Wu, R., Ye, L. W., Wang, H. Y., Yang, X., Zhang, Y. Y., . . . Zhou, L. (2013).
S100A8 and S100A9 are associated with colorectal carcinoma progression and
contribute to colorectal carcinoma cell survival and migration via Wnt/beta-
catenin pathway. PLoS One, 8(4), e62092.
Dukes, C. E. (1932). The classification of cancer of the rectum. J Pathol Bacteriol,
35(3), 323-332.
Eaden, J. A., Abrams, K. R., & Mayberry, J. F. (2001). The risk of colorectal cancer in
ulcerative colitis: a meta-analysis. Gut, 48(4), 526-535.
Easton, D. F., & Eeles, R. A. (2008). Genome-wide association studies in cancer. Hum
Mol Genet, 17(R2), R109-115.
Edge, S. B., Byrd, D. R., Compton, C. C., Fritz, A. G., Greene, F. L., & Trotti, A. (Eds.).
(2010). AJCC cancer staging manual (7th ed.). New York, NY: Springer.
Edwards, B. K., Ward, E., Kohler, B. A., Eheman, C., Zauber, A. G., Anderson, R.
N., . . . Ries, L. A. (2010). Annual report to the nation on the status of cancer,
1975-2006, featuring colorectal cancer trends and impact of interventions (risk
factors, screening, and treatment) to reduce future rates. Cancer, 116(3), 544-
573.
Egeblad, M., & Werb, Z. (2002). New functions for the matrix metalloproteinases in
cancer progression. Nat Rev Cancer, 2(3), 161-174.
Ekbom, A., Adami, H. O., Helmick, C., & Zack, M. (1990). Increased risk of large-
bowel cancer in Crohn's disease with colonic involvement. Lancet, 336(8711),
357-359.
Elezkurtaj, S., Kopitz, C., Baker, A. H., Perez-Cantó, A., Arlt, M. J., Khokha, R., . . .
Krüger, A. (2004). Adenovirus-mediated overexpression of tissue inhibitor of
metalloproteinases-1 in the liver: efficient protection against T-cell lymphoma
and colon carcinoma metastasis. J Gene Med, 6(11), 1228-1237.

References
259
Ellis, H. (1983). Clinical anatomy (7th ed.). Oxford: Blackwell Scientific.
Ellis, R. J. (1999). Molecular chaperones: pathways and networks. Curr Biol, 9(4),
R137-139.
Ennis, B. W., & Matrisian, L. M. (1993). Matrix degrading metalloproteinases. J
Neurooncol, 18(2), 105-109.
Esters, N., Pierik, M., van Steen, K., Vermeire, S., Claessens, G., Joossens, S., . . .
Rutgeerts, P. (2004). Transmission of CARD15 (NOD2) variants within families
of patients with inflammatory bowel disease. Am J Gastroenterol, 99(2), 299-
305.
Ewing, B., & Green, P. (2000). Analysis of expressed sequence tags indicates 35,000
human genes. Nat Genet, 25(2), 232-234.
Falini, B., Mecucci, C., Tiacci, E., Alcalay, M., Rosati, R., Pasqualucci, L., . . . Martelli,
M. F. (2005). Cytoplasmic nucleophosmin in acute myelogenous leukemia with
a normal karyotype. N Engl J Med, 352(3), 254-266.
Fearon, E. R., & Vogelstein, B. (1990). A genetic model for colorectal tumourigenesis.
Cell, 61(5), 759-767.
Feinberg, A. P., Ohlsson, R., & Henikoff, S. (2006). The epigenetic progenitor origin of
human cancer. Nat Rev Genet, 7(1), 21-33.
Ferlay, J., Shin, H. R., Bray, F., Forman, D., Mathers, C., & Parkin, D. M. (Eds.).
(2010). GLOBOCAN 2008: Cancer incidence and mortality worldwide. Lyon:
International Agency for Research on Cancer.
Ferrara, N. (2002). VEGF and the quest for tumour angiogenesis factors. Nat Rev
Cancer, 2(10), 795-803.
Ferrara, N., Gerber, H. P., & LeCouter, J. (2003). The biology of VEGF and its
receptors. Nat Med, 9(6), 669-676.
Ferrara, N., & Davis-Smyth, T. (1997). The biology of vascular endothelial growth
factor. Endocr Rev, 18(1), 4-25.
Feuerstein, N., Chan, P. K., & Mond, J. J. (1988). Identification of numatrin, the nuclear
matrix protein associated with induction of mitogenesis, as the nucleolar protein
B23. Implication for the role of the nucleolus in early transduction of mitogenic
signals. J Biol Chem, 263(22), 10608-10612.
Feuerstein, N., & Mond, J. J. (1987). Identification of a prominent nuclear protein
associated with proliferation of normal and malignant B cells. J Immunol, 139(6),
1818-1822.
Feuerstein, N., & Mond, J. J. (1987a). "Numatrin," a nuclear matrix protein associated
with induction of proliferation in B lymphocytes. J Biol Chem, 262(23), 11389-
11397.

References
260
Figueira, R. C., Gomes, L. R., Neto, J. S., Silva, F. C., Silva, I. D., & Sogayar, M. C.
(2009). Correlation between MMPs and their inhibitors in breast cancer tumour
tissue specimens and in cell lines with different metastatic potential. BMC
Cancer, 9(1), 20.
FitzPatrick, D. R., Ramsay, J., McGill, N. I., Shade, M., Carothers, A. D., & Hastie, N.
D. (2002). Transcriptome analysis of human autosomal trisomy. Hum Mol Genet,
11(26), 3249-3256.
Flanagan, L. A., Chou, J., Falet, H., Neujahr, R., Hartwig, J. H., & Stossel, T. P. (2001).
Filamin A, the Arp2/3 complex, and the morphology and function of cortical
actin filaments in human melanoma cells. J Cell Biol, 155(4), 511-517.
Fleck, O., & Nielsen, O. (2004). DNA repair. J Cell Sci, 117(Pt 4), 515-517.
Fleige, S., & Pfaffl, M. W. (2006). RNA integrity and the effect on the real-time qRT-
PCR performance. Mol Aspects Med, 27(2-3), 126-139.
Fleming, M., Ravula, S., Tatishchev, S. F., & Wang, H. L. (2012). Colorectal carcinoma:
pathologic aspects. J Gastrointest Oncol, 3(3), 153-173.
Fong, K. M., Kida, Y., Zimmerman, P. V., & Smith, P. J. (1996). TIMP1 and adverse
prognosis in non-small cell lung cancer. Clin Cancer Res, 2(8), 1369-1372.
Fortini, P., & Dogliotti, E. (2007). Base damage and single-strand break repair:
mechanisms and functional significance of short- and long-patch repair
subpathways. DNA Repair (Amst), 6(4), 398-409.
Friedberg, E. C. (2003). DNA damage and repair. Nature, 421(6921), 436-440.
Friedberg, E. C. (2008). A brief history of the DNA repair field. Cell Res, 18(1), 3-7.
Friedman, D. B., Hill, S., Keller, J. W., Merchant, N. B., Levy, S. E., Coffey, R. J., &
Caprioli, R. M. (2004). Proteome analysis of human colon cancer by two-
dimensional difference gel electrophoresis and mass spectrometry. Proteomics,
4(3), 793-811.
Frigerio, J. M., Dagorn, J. C., & Iovanna, J. L. (1995). Cloning, sequencing and
expression of the L5, L21, L27a, L28, S5, S9, S10 and S29 human ribosomal
protein mRNAs. Biochim Biophys Acta, 1262(1), 64-68.
Frith, M. C., Pheasant, M., & Mattick, J. S. (2005). The amazing complexity of the
human transcriptome. Eur J Hum Genet, 13(8), 894-897.
Gadad, S. S., Senapati, P., Syed, S. H., Rajan, R. E., Shandilya, J., Swaminathan, V., . . .
Kundu, T. K. (2011). The multifunctional protein nucleophosmin (NPM1) is a
human linker histone H1 chaperone. Biochemistry, 50(14), 2780-2789.
Gani, R. (1976). The nucleoli of cultured human lymphocytes: I. Nucleolar morphology
in relation to transformation and the DNA cycle. Exp Cell Res, 97(2), 249-258.
Gao, M., Cao, Q., Luo, L. H., Wu, M. L., Hu, W. L., & Si, J. M. (2005).
NOD2/CARD15 gene polymorphisms and susceptibility to Crohn's disease in
Chinese Han population. Zhonghua Nei Ke Za Zhi, 44(3), 210-212.

References
261
Gao, Z. H., Tretiakova, M. S., Liu, W. H., Gong, C., Farris, P. D., & Hart, J. (2006).
Association of E-cadherin, matrix metalloproteinases, and tissue inhibitors of
metalloproteinases with the progression and metastasis of hepatocellular
carcinoma. Mod Pathol, 19(4), 533-540.
García-Álvarez, A., Serra-Majem, L., Ribas-Barba, L., Castell, C., Foz, M., Uauy,
R., . . . Salleras, L. (2007). Obesity and overweight trends in Catalonia, Spain
(1992–2003): gender and socio-economic determinants. Public Health Nutr,
10(11A), 1368-1378.
Garcia-Valdecasas, J. C., Llovera, J. M., deLacy, A. M., Reverter, J. C., Grande, L.,
Fuster, J., . . . Pera, C. (1991). Obstructing colorectal carcinomas. Dis Colon
Rectum, 34(9), 759-762.
Garrido, C., Gurbuxani, S., Ravagnan, L., & Kroemer, G. (2001). Heat shock proteins:
endogenous modulators of apoptotic cell death. Biochem Biophys Res Commun,
286(3), 433-442.
Gatto, N. M., Frucht, H., Sundararajan, V., Jacobson, J. S., Grann, V. R., & Neugut, A.
I. (2003). Risk of perforation after colonoscopy and sigmoidoscopy: a
population-based study. J Natl Cancer Inst, 95(3), 230-236.
Gazda, H. T., Sheen, M. R., Vlachos, A., Choesmel, V., O'Donohue, M. F., Schneider,
H., . . . Beggs, A. H. (2008). Ribosomal protein L5 and L11 mutations are
associated with cleft palate and abnormal thumbs in Diamond-Blackfan anemia
patients. Am J Hum Genet, 83(6), 769-780.
Gebhardt, C., Németh, J., Angel, P., & Hess, J. (2006). S100A8 and S100A9 in
inflammation and cancer. Biochem Pharmacol, 72(11), 1622-1631.
GE Healthcare Bio-Sciences AB. (2005). Ettan DIGE system user manual. Uppsala:
Author.
Geho, D. H., Bandle, R. W., Clair, T., & Liotta, L. A. (2005). Physiological
mechanisms of tumour-cell invasion and migration. Physiology, 20(3), 194-200.
Gerling, I. C., Solomon, S. S., & Bryer-Ash, M. (2003). Genomes, transcriptomes, and
proteomes: molecular medicine and its impact on medical practice. Arch Intern
Med, 163(2), 190-198.
Gervaz, P., Bouzourene, H., Cerottini, J. P., Chaubert, P., Benhattar, J., Secic, M., . . .
Belin, B. (2001). Dukes B colorectal cancer: distinct genetic categories and
clinical outcome based on proximal or distal tumour location. Dis Colon Rectum,
44(3), 364-372.
Gharahdaghi, F., Weinberg, C. R., Meagher, D. A., Imai, B. S., & Mische, S. M. (1999).
Mass spectrometric identification of proteins from silver-stained polyacrylamide
gel: a method for the removal of silver ions to enhance sensitivity.
Electrophoresis, 20(3), 601-605.
Ghavami, S., Rashedi, I., Dattilo, B. M., Eshraghi, M., Chazin, W. J., Hashemi, M., . . .
Los, M. (2008). S100A8/A9 at low concentration promotes tumour cell growth
via RAGE ligation and MAP kinase-dependent pathway. J Leukoc Biol, 83(6),
1484-1492.

References
262
Ghosh, J. C., Dohi, T., Kang, B. H., & Altieri, D. C. (2007). Hsp60 regulation of tumour
cell apoptosis. J Biol Chem, 283(8), 5188-5194.
Ghosh, R., Gu, G., Tillman, E., Yuan, J., Wang, Y., Fazli, L., . . . Kasper, S. (2007a).
Increased expression and differential phosphorylation of stathmin may promote
prostate cancer progression. Prostate, 67(10), 1038-1052.
Giannopoulos, G., Pavlakis, K., Parasi, A., Kavatzas, N., Tiniakos, D., Karakosta,
A., . . . Peros, G. (2008). The expression of matrix metalloproteinases-2 and -9
and their tissue inhibitor 2 in pancreatic ductal and ampullary carcinoma and
their relation to angiogenesis and clinicopathological parameters. Anticancer Res,
28(3B), 1875-1881.
Gjerset, R. A. (2006). DNA damage, p14ARF, nucleophosmin (NPM/B23), and cancer.
J Mol Histol, 37(5-7), 239-251.
Glick, A. B. (2004). TGF? Back to the future: revisiting its role as a transforming
growth factor. Cancer Biol Ther, 3(3), 276-283.
Goel, A., & Boland, C. R. (2010). Recent insights into the pathogenesis of colorectal
cancer. Curr Opin Gastroenterol, 26(1), 47-52.
Goh, K. L., Quek, K. F., Yeo, G. T., Hilmi, I. N., Lee, C. K., Hasnida, N., . . . Ong, K. T.
(2005). Colorectal cancer in Asians: a demographic and anatomic survey in
Malaysian patients undergoing colonoscopy. Aliment Pharmacol Ther, 22(9),
859-864.
Golub, T. R., Slonim, D. K., Tamayo, P., Huard, C., Gaasenbeek, M., Mesirov, J. P., . . .
Lander, E. S. (1999). Molecular classification of cancer: class discovery and
class prediction by gene expression monitoring. Science, 286(5439), 531-537.
Goode, E. L., Ulrich, C. M., & Potter, J. D. (2002). Polymorphisms in DNA repair
genes and associations with cancer risk. Cancer Epidemiol Biomarkers Prev,
11(12), 1513-1530.
Gospodarowicz, M. K., Miller, D., Groome, P. A., Greene, F. L., Logan, P. A., & Sobin,
L. H. (2004). The process for continuous improvement of the TNM
classification. Cancer, 100(1), 1-5.
Gossage, L., Perry, C., Abbotts, R., & Madhusudan, S. (2012). Base excision repair
factors are promising prognostic and predictive markers in cancer. Curr Mol
Pharmacol, 5(1), 115-124.
Goto, Y., Ando, T., Goto, H., & Hamajima, N. (2005). No association between EGF
gene polymorphism and gastric cancer. Cancer Epidemiol Biomarkers Prev,
14(10), 2454-2456.
Goulston, K. J., Cook, I., & Dent, O. F. (1986). How important is rectal bleeding in the
diagnosis of bowel cancer and polyps? Lancet, 328(8501), 261-265.
Gourley, G. R., Yang, L., Higgins, L., Riviere, M. A., & David, L. L. (2010). Proteomic
analysis of biopsied human colonic mucosa. J Pediatr Gastroenterol Nutr, 51(1),
46-54.

References
263
Grady, W. M. (2005). Epigenetic events in the colorectum and in colon cancer. Biochem
Soc Trans, 33(Pt 4), 684-688.
Graveley, B. R. (2001). Alternative splicing: increasing diversity in the proteomic world.
Trends Genet, 17(2), 100-107.
Griffiths, J. D. (1961). Extramural and intramural blood-supply of colon. BMJ, 1(5222),
323-326.
Groblewska, M., Siewko, M., Mroczko, B., & Szmitkowski, M. (2012). The role of
matrix metalloproteinases (MMPs) and their inhibitors (TIMPs) in the
development of esophageal cancer. Folia Histochem Cytobiol, 50(1), 12-19.
Groenen, L. C., Nice, E. C., & Burgess, A. W. (1994). Structure-function relationships
for the EGF/TGF-alpha family of mitogens. Growth Factors, 11(4), 235-257.
Grossman, L. (1997). Epidemiology of ultraviolet-DNA repair capacity and human
cancer. Environ Health Perspect, 105(Suppl 4), 927-930.
Gryk, M. R., Marintchev, A., Maciejewski, M. W., Robertson, A., Wilson, S. H., &
Mullen, G. P. (2002). Mapping of the interaction interface of DNA polymerase
beta with XRCC1. Structure, 10(12), 1709-1720.
Gsur, A., Bernhart, K., Baierl, A., Feik, E., Fuhrlinger, G., Hofer, P., . . . Micksche, M.
(2011). No association of XRCC1 polymorphisms Arg194Trp and Arg399Gln
with colorectal cancer risk. Cancer Epidemiol, 35(5), e38-41.
Guba, M., Seeliger, H., Kleespies, A., Jauch, K. W., & Bruns, C. (2004). Vascular
endothelial growth factor in colorectal cancer. Int J Colorectal Dis, 19(6), 510-
517.
Gunderson, L. L., Jessup, J. M., Sargent, D. J., Greene, F. L., & Stewart, A. K. (2010).
Revised TN categorisation for colon cancer based on national survival outcomes
data. J Clin Oncol, 28(2), 264-271.
Gupta, S. C., Sundaram, C., Reuter, S., & Aggarwal, B. B. (2010). Inhibiting NF-
kappaB activation by small molecules as a therapeutic strategy. Biochim Biophys
Acta, 1799(10-12), 775-787.
Gutierrez, O., Pipaon, C., Inohara, N., Fontalba, A., Ogura, Y., Prosper, F., . . .
Fernandez-Luna, J. L. (2002). Induction of Nod2 in myelomonocytic and
intestinal epithelial cells via nuclear factor-kappa B activation. J Biol Chem,
277(44), 41701-41705.
Gyde, S. N., Prior, P., Allan, R. N., Stevens, A., Jewell, D. P., Truelove, S. C., . . .
Hellers, G. (1988). Colorectal cancer in ulcerative colitis: a cohort study of
primary referrals from three centres. Gut, 29(2), 206-217.
Gyde, S., Prior, P., Dew, M. J., Saunders, V., Waterhouse, J. A., & Allan, R. N. (1982).
Mortality in ulcerative colitis. Gastroenterology, 83(1), 36-43.
Habermann, J. K., Bader, F. G., Franke, C., Zimmermann, K., Gemoll, T., Fritzsche,
B., . . . Roblick, U. J. (2008). From the genome to the proteome-biomarkers in
colorectal cancer. Langenbecks Arch Surg, 393(1), 93-104.

References
264
Habermann, J. K., Roblick, U. J., Upender, M., Ried, T., & Auer, G. (2006). From
genome to proteome in tumour profiling: molecular events in colorectal cancer
genesis. Adv Exp Med Biol, 587, 161-177.
Half, E. E., & Bresalier, R. S. (2004). Clinical management of hereditary colorectal
cancer syndromes. Curr Opin Gastroenterol, 20(1), 32-42.
Hall, N. (2007). Colorectal cancer: features and investigation. Medicine, 35(6), 302-305.
Hampel, H., Frankel, W. L., Martin, E., Arnold, M., Khanduja, K., Kuebler, P., . . . de la
Chapelle, A. (2008). Feasibility of screening for Lynch syndrome among
patients with colorectal cancer. J Clin Oncol, 26(35), 5783-5788.
Hanahan, D., & Weinberg, R. A. (2000). The hallmarks of cancer. Cell, 100(1), 57-70.
Hanahan, D., & Weinberg, R. A. (2011). Hallmarks of cancer: the next generation. Cell,
144(5), 646-674.
Hanash, S. M., Strahler, J. R., Kuick, R., Chu, E. H., & Nichols, D. (1988).
Identification of a polypeptide associated with the malignant phenotype in acute
leukemia. J Biol Chem, 263(26), 12813-12815.
Hanrahan, V., Currie, M. J., Gunningham, S. P., Morrin, H. R., Scott, P. A., Robinson,
B. A., & Fox, S. B. (2003). The angiogenic switch for vascular endothelial
growth factor (VEGF)-A, VEGF-B, VEGF-C, and VEGF-D in the adenoma-
carcinoma sequence during colorectal cancer progression. J Pathol, 200(2), 183-
194.
Haubrich, W. S., Schaffner, F., & Berk, J. E. (Eds.). (1995). Bockus gastroenterology
(5th ed.). Philadelphia, PA: W.B. Saunders.
Hemminki, K., & Shields, P. G. (2002). Skilled use of DNA polymorphisms as a tool
for polygenic cancers. Carcinogenesis, 23(3), 379-380.
Hendrich, B., & Bird, A. (2000). Mammalian methyltransferases and methyl-CpG-
binding domains: proteins involved in DNA methylation. In P. A. Jones & P. K.
Vogt (Eds.), Current topics in microbiology and immunology, vol. 249: DNA
methylation and cancer (pp. 55-74). Berlin: Springer-Verlag.
Henry, J. L., Coggin, D. L., & King, C. R. (1993). High-level expression of the
ribosomal protein L19 in human breast tumours that overexpress erbB-2. Cancer
Res, 53(6), 1403-1408.
Herrera, J. E., Savkur, R., & Olson, M. O. (1995). The ribonuclease activity of nucleolar
protein B23. Nucleic Acids Res, 23(19), 3974-3980.
Herszenyi, L., Hritz, I., Lakatos, G., Varga, M. Z., & Tulassay, Z. (2012). The behavior
of matrix metalloproteinases and their inhibitors in colorectal cancer. Int J Mol
Sci, 13(10), 13240-13263.
Herszenyi, L., Lakatos, G., Hritz, I., Varga, M. Z., Cierny, G., & Tulassay, Z. (2012a).
The role of inflammation and proteinases in tumour progression. Dig Dis, 30(3),
249-254.

References
265
Herszényi, L., Plebani, M., Carraro, P., De Paoli, M., Roveroni, G., Cardin, R., . . .
Farinati, F. (2000). Proteases in gastrointestinal neoplastic diseases. Clin Chim
Acta, 291(2), 171-187.
Hewitt, R. E., Leach, I. H., Powe, D. G., Clark, I. M., Cawston, T. E., & Turner, D. R.
(1991). Distribution of collagenase and tissue inhibitor of metalloproteinases
(TIMP) in colorectal tumours. Int J Cancer, 49(5), 666-672.
Higaki, S., Akazawa, A., Nakamura, H., Yanai, H., Yoshida, T., & Okita, K. (1999).
Metaplastic polyp of the colon develops in response to inflammation. J
Gastroenterol Hepatol, 14(7), 709-714.
Hightower, L. E. (1991). Heat shock, stress proteins, chaperones, and proteotoxicity.
Cell, 66(2), 191-197.
Hisamatsu, T., Suzuki, M., Reinecker, H. C., Nadeau, W. J., McCormick, B. A., &
Podolsky, D. K. (2003). CARD15/NOD2 functions as an antibacterial factor in
human intestinal epithelial cells. Gastroenterology, 124(4), 993-1000.
Ho, J. W., Choi, S. C., Lee, Y. F., Hui, T. C., Cherny, S. S., Garcia-Barcelo, M. M., . . .
Sham, P. C. (2011). Replication study of SNP associations for colorectal cancer
in Hong Kong Chinese. Br J Cancer, 104(2), 369-375.
Hoeijmakers, J. H. (2001). Genome maintenance mechanisms for preventing cancer.
Nature, 411(6835), 366-374.
Hoffman, J., & Post, J. (1967). In vivo studies of DNA synthesis in human normal and
tumour cells. Cancer Res, 27(5 Part 1), 898-902.
Hofmann, G., Langsenlehner, U., Renner, W., Langsenlehner, T., Yazdani-Biuki, B.,
Clar, H., . . . Krippl, P. (2008). Common single nucleotide polymorphisms in the
vascular endothelial growth factor gene and colorectal cancer risk. J Cancer Res
Clin Oncol, 134(5), 591-595.
Hohfeld, J., Cyr, D. M., & Patterson, C. (2001). From the cradle to the grave: molecular
chaperones that may choose between folding and degradation. EMBO Rep, 2(10),
885-890.
Holland, E. C., Sonenberg, N., Pandolfi, P. P., & Thomas, G. (2004). Signaling control
of mRNA translation in cancer pathogenesis. Oncogene, 23(18), 3138-3144.
Hong, Y. C., Lee, K. H., Kim, W. C., Choi, S. K., Woo, Z. H., Shin, S. K., & Kim, H.
(2005). Polymorphisms of XRCC1 gene, alcohol consumption and colorectal
cancer. Int J Cancer, 116(3), 428-432.
Hori, T., Amano, M., Suzuki, A., Backer, C. B., Welburn, J. P., Dong, Y., . . .
Fukagawa, T. (2008). CCAN makes multiple contacts with centromeric DNA to
provide distinct pathways to the outer kinetochore. Cell, 135(6), 1039-1052.
Hornebeck, W., Lambert, E., Petitfrère, E., & Bernard, P. (2005). Beneficial and
detrimental influences of tissue inhibitor of metalloproteinase-1 (TIMP-1) in
tumour progression. Biochimie, 87(3–4), 377-383.

References
266
Hoskins, J. M., Ong, P. S., Keku, T. O., Galanko, J. A., Martin, C. F., Coleman, C.
A., . . . McLeod, H. L. (2012). Association of eleven common, low-penetrance
colorectal cancer susceptibility genetic variants at six risk loci with clinical
outcome. PLoS One, 7(7), e41954.
Houlston, R. S., Cheadle, J., Dobbins, S. E., Tenesa, A., Jones, A. M., Howarth, K., . . .
Tomlinson, I. P. (2010). Meta-analysis of three genome-wide association studies
identifies susceptibility loci for colorectal cancer at 1q41, 3q26.2, 12q13.13 and
20q13.33. Nat Genet, 42(11), 973-977.
Houlston, R. S., & Peto, J. (1996). Genetics of common cancers. In R. A. Eeles, B.
Ponder, D. E. Easton & A. Horwich (Eds.), Inherited predisposition to cancer
(1st ed.) (pp. 208-226). London: Chapman Hall Medical.
Houlston, R. S., & Tomlinson, I. P. (2000). Detecting low penetrance genes in cancer:
the way ahead. J Med Genet, 37(3), 161-167.
Houlston, R. S., Webb, E., Broderick, P., Pittman, A. M., Di Bernardo, M. C., Lubbe,
S., . . . Dunlop, M. G. (2008). Meta-analysis of genome-wide association data
identifies four new susceptibility loci for colorectal cancer. Nat Genet, 40(12),
1426-1435.
Houlston, R. S., & Peto, J. (2004). The search for low-penetrance cancer susceptibility
alleles. Oncogene, 23(38), 6471-6476.
Houlston, R. S., & Tomlinson, I. P. (2001). Polymorphisms and colorectal tumour risk.
Gastroenterology, 121(2), 282-301.
Howman, E. V., Fowler, K. J., Newson, A. J., Redward, S., MacDonald, A. C., Kalitsis,
P., & Choo, K. H. (2000). Early disruption of centromeric chromatin
organisation in centromere protein A (Cenpa) null mice. Proc Natl Acad Sci,
97(3), 1148-1153.
Hu, H., Krasinskas, A., & Willis, J. (2011). Perspectives on current tumour-node-
metastasis (TNM) staging of cancers of the colon and rectum. Semin Oncol,
38(4), 500-510.
Hu, X., Li, D., Zhang, W., Zhou, J., Tang, B., & Li, L. (2012). Matrix
metalloproteinase-9 expression correlates with prognosis and involved in
ovarian cancer cell invasion. Arch Gynecol Obstet, 286(6), 1537-1543.
Hugot, J. P., Chamaillard, M., Zouali, H., Lesage, S., Cezard, J. P., Belaiche, J., . . .
Thomas, G. (2001). Association of NOD2 leucine-rich repeat variants with
susceptibility to Crohn's disease. Nature, 411(6837), 599-603.
Hung, R. J., Hall, J., Brennan, P., & Boffetta, P. (2005). Genetic polymorphisms in the
base excision repair pathway and cancer risk: a HuGE review. Am J Epidemiol,
162(10), 925-942.
Huxley, R. R., Ansary-Moghaddam, A., Clifton, P., Czernichow, S., Parr, C. L., &
Woodward, M. (2009). The impact of dietary and lifestyle risk factors on risk of
colorectal cancer: a quantitative overview of the epidemiological evidence. Int J
Cancer, 125(1), 171-180.

References
267
Hwang, I. T., Kim, Y. J., Kim, S. H., Kwak, C. I., Gu, Y. Y., & Chun, J. Y. (2003).
Annealing control primer system for improving specificity of PCR amplification.
Biotechniques, 35(6), 1180-1184.
Hwang, Y. J., Lee, S. P., Kim, S. Y., Choi, Y. H., Kim, M. J., Lee, C. H., . . . Kim, D. Y.
(2009). Expression of heat shock protein 60 kDa is upregulated in cervical
cancer. Yonsei Med J, 50(3), 399-406.
Iacopetta, B. (2002). Are there two sides to colorectal cancer? Int J Cancer, 101(5),
403-408.
Ichikawa, M., Williams, R., Wang, L., Vogl, T., & Srikrishna, G. (2011). S100A8/A9
activate key genes and pathways in colon tumour progression. Mol Cancer Res,
9(2), 133-148.
Imperiale, T. F., Ransohoff, D. F., Itzkowitz, S. H., Turnbull, B. A., & Ross, M. E.
(2004). Fecal DNA versus fecal occult blood for colorectal-cancer screening in
an average-risk population. N Engl J Med, 351(26), 2704-2714.
Imyanitov, E. N., Togo, A. V., & Hanson, K. P. (2004). Searching for cancer-associated
gene polymorphisms: promises and obstacles. Cancer Lett, 204(1), 3-14.
Inagaki, D., Oshima, T., Yoshihara, K., Tamura, S., Kanazawa, A., Yamada, T., . . .
Imada, T. (2010). Overexpression of tissue inhibitor of metalloproteinase-1 gene
correlates with poor outcomes in colorectal cancer. Anticancer Res, 30(10),
4127-4130.
Inohara, N., & Nunez, G. (2001). The NOD: a signaling module that regulates apoptosis
and host defense against pathogens. Oncogene, 20(44), 6473-6481.
Inohara, N., Chamaillard, M., McDonald, C., & Nuñez, G. (2005). NOD-LRR proteins:
role in host-microbial interactions and inflammatory disease. Annu Rev Biochem,
74(1), 355-383.
Inoue, N., Tamura, K., Kinouchi, Y., Fukuda, Y., Takahashi, S., Ogura, Y., . . . Hibi, T.
(2002). Lack of common NOD2 variants in Japanese patients with Crohn's
disease. Gastroenterology, 123(1), 86-91.
Ioannidis, J. P. (2007). Non-replication and inconsistency in the genome-wide
association setting. Hum Hered, 64(4), 203-213.
Itzkowitz, S. H., & Harpaz, N. (2004). Diagnosis and management of dysplasia in
patients with inflammatory bowel diseases. Gastroenterology, 126(6), 1634-
1648.
Itzkowitz, S. H., & Yio, X. (2004). Inflammation and cancer IV. Colorectal cancer in
inflammatory bowel disease: the role of inflammation. Am J Physiol
Gastrointest Liver Physiol, 287(1), G7-G17.
Ivanov, A. V., Malygin, A. A., & Karpova, G. G. (2002). Ribosomal protein binding
with the first intron of the human rpS26 pre-mRNA stimulates its interaction
with proteins extracted from HeLa cells. Mol Biol (Mosk), 36(3), 394-399.

References
268
Ivanov, A. V., Malygin, A. A., & Karpova, G. G. (2004). Human ribosomal protein S26
inhibits splicing of its own pre-mRNA. Mol Biol (Mosk), 38(4), 676-683.
Iwaya, K., Oikawa, K., Semba, S., Tsuchiya, B., Mukai, Y., Otsubo, T., . . . Mukai, K.
(2007). Correlation between liver metastasis of the colocalisation of actin-related
protein 2 and 3 complex and WAVE2 in colorectal carcinoma. Cancer Sci, 98(7),
992-999.
Jackson, J. R., Seed, M. P., Kircher, C. H., Willoughby, D. A., & Winkler, J. D. (1997).
The codependence of angiogenesis and chronic inflammation. FASEB J, 11(6),
457-465.
Jaeger, E., Webb, E., Howarth, K., Carvajal-Carmona, L., Rowan, A., Broderick, P., . . .
Tomlinson, I. (2008). Common genetic variants at the CRAC1 (HMPS) locus on
chromosome 15q13.3 influence colorectal cancer risk. Nat Genet, 40(1), 26-28.
Jain, L., Vargo, C. A., Danesi, R., Sissung, T. M., Price, D. K., Venzon, D., . . . Figg, W.
D. (2009). The role of vascular endothelial growth factor SNPs as predictive and
prognostic markers for major solid tumours. Mol Cancer Ther, 8(9), 2496-2508.
Jain, R. K. (2005). Normalisation of tumour vasculature: an emerging concept in
antiangiogenic therapy. Science, 307(5706), 58-62.
Jaiswal, M., LaRusso, N. F., Burgart, L. J., & Gores, G. J. (2000). Inflammatory
cytokines induce DNA damage and inhibit DNA repair in cholangiocarcinoma
cells by a nitric oxide-dependent mechanism. Cancer Res, 60(1), 184-190.
Jakobsson, M., Scholz, S. W., Scheet, P., Gibbs, J. R., VanLiere, J. M., Fung, H. C., . . .
Singleton, A. B. (2008). Genotype, haplotype and copy-number variation in
worldwide human populations. Nature, 451(7181), 998-1003.
Jallepalli, P. V., & Lengauer, C. (2001). Chromosome segregation and cancer: cutting
through the mystery. Nat Rev Cancer, 1(2), 109-117.
Jang, C. Y., Lee, J. Y., & Kim, J. (2004). RpS3, a DNA repair endonuclease and
ribosomal protein, is involved in apoptosis. FEBS Lett, 560(1–3), 81-85.
Jasperson, K. W., Tuohy, T. M., Neklason, D. W., & Burt, R. W. (2010). Hereditary and
familial colon cancer. Gastroenterology, 138(6), 2044-2058.
Jass, J. R. (2007). Classification of colorectal cancer based on correlation of clinical,
morphological and molecular features. Histopathology, 50(1), 113-130.
Jass, J. R., O'Brien, J., Riddell, R. H., & Snover, D. C. (2008). Recommendations for
the reporting of surgically resected specimens of colorectal carcinoma:
Association of Directors of Anatomic and Surgical Pathology. Am J Clin Pathol,
129(1), 13-23.
Jass, J. R., & Sobin, L. H. (1989). Histological typing of intestinal tumours (2nd ed.).
Berlin: Springer-Verlag.
Jass, J. R. (1989). Do all colorectal carcinomas arise in preexisting adenomas? World J
Surg, 13(1), 45-51.

References
269
Jelonek, K., Gdowicz-Klosok, A., Pietrowska, M., Borkowska, M., Korfanty, J.,
Rzeszowska-Wolny, J., & Widlak, P. (2010). Association between single-
nucleotide polymorphisms of selected genes involved in the response to DNA
damage and risk of colon, head and neck, and breast cancers in a Polish
population. J Appl Genet, 51(3), 343-352.
Jeong, E. G., Lee, S. H., Yoo, N. J., & Lee, S. H. (2007). Absence of nucleophosmin 1
(NPM1) gene mutations in common solid cancers. APMIS, 115(4), 341-346.
Jessup, J. M., Gunderson, L. L., Greene, F. L., Washington, M. K., Compton, C. C.,
Sobin, L. H., . . . Hamilton, S. R. (2011). 2010 staging system for colon and
rectal carcinoma. Ann Surg Oncol, 18(6), 1513-1517.
Jiang, J. W., Liang, X. H., Zhou, X. L., Huang, R. F., Chu, Z. H., Zhan, Q. O., & Lin, H.
(2010). DNA repair gene X-ray repair cross complementing group 1 Arg194Trp
polymorphism on the risk of lung cancer: a meta-analysis on 22 studies. J
Thorac Oncol, 5(11), 1741-1747.
Jiang, Y., Goldberg, I. D., & Shi, Y. E. (2002). Complex roles of tissue inhibitors of
metalloproteinases in cancer. Oncogene, 21(14), 2245-2252.
Jiang, Z., Li, C., Xu, Y., & Cai, S. (2010a). A meta-analysis on XRCC1 and XRCC3
polymorphisms and colorectal cancer risk. Int J Colorectal Dis, 25(2), 169-180.
Jin, G., Miao, R., Deng, Y., Hu, Z., Zhou, Y., Tan, Y., . . . Shen, H. (2007). Variant
genotypes and haplotypes of the epidermal growth factor gene promoter are
associated with a decreased risk of gastric cancer in a high-risk Chinese
population. Cancer Sci, 98(6), 864-868.
Johns, L. E., & Houlston, R. S. (2001). A systematic review and meta-analysis of
familial colorectal cancer risk. Am J Gastroenterol, 96(10), 2992-3003.
Johnsen, J. I., Aurelio, O. N., Kwaja, Z., Jorgensen, G. E., Pellegata, N. S., Plattner,
R., . . . Cajot, J. F. (2000). p53-mediated negative regulation of stathmin/Op18
expression is associated with G(2)/M cell-cycle arrest. Int J Cancer, 88(5), 685-
691.
Joo, Y. E., Seo, K. S., Kim, H. S., Rew, J. S., Park, C. S., & Kim, S. J. (2000).
Expression of tissue inhibitors of metalloproteinases (TIMPs) in gastric cancer.
Dig Dis Sci, 45(1), 114-121.
Kahi, C. J., & Rex, D. K. (2004). Current and future trends in colorectal cancer
screening. Cancer Metastasis Rev, 23(1-2), 137-144.
Kahlert, C., Bandapalli, O. R., Schirmacher, P., Weitz, J., & Brand, K. (2008). Invasion
front-specific overexpression of tissue inhibitor of metalloproteinase-1 in liver
metastases from colorectal cancer. Anticancer Res, 28(3A), 1459-1465.
Kaina, B. (2003). DNA damage-triggered apoptosis: critical role of DNA repair,
double-strand breaks, cell proliferation and signaling. Biochem Pharmacol,
66(8), 1547-1554.
Kalia, A., & Gupta, R. P. (2005). Proteomics: a paradigm shift. Crit Rev Biotechnol,
25(4), 173-198.

References
270
Kaneda, A., Kaminishi, M., Sugimura, T., & Ushijima, T. (2004). Decreased expression
of the seven ARP2/3 complex genes in human gastric cancers. Cancer Lett,
212(2), 203-210.
Kang, S., Kim, J. W., Park, N. H., Song, Y. S., Park, S. Y., Kang, S. B., & Lee, H. P.
(2007). Epidermal growth factor 61 A/G polymorphism and uterine cervical
cancer. Int J Gynecol Cancer, 17(2), 492-496.
Kang, S. M., Maeda, K., Onoda, N., Chung, Y. S., Nakata, B., Nishiguchi, Y., & Sowa,
M. (1997). Combined analysis of p53 and vascular endothelial growth factor
expression in colorectal carcinoma for determination of tumour vascularity and
liver metastasis. Int J Cancer, 74(5), 502-507.
Karin, M., & Greten, F. R. (2005). NF-kappaB: linking inflammation and immunity to
cancer development and progression. Nat Rev Immunol, 5(10), 749-759.
Kashani-Sabet, M., Rangel, J., Torabian, S., Nosrati, M., Simko, J., Jablons, D. M., . . .
Sagebiel, R. W. (2009). A multi-marker assay to distinguish malignant
melanomas from benign nevi. Proc Natl Acad Sci, 106(15), 6268-6272.
Kataoka, N., Cai, Q., Wen, W., Shu, X. O., Jin, F., Gao, Y. T., & Zheng, W. (2006).
Population-based case-control study of VEGF gene polymorphisms and breast
cancer risk among Chinese women. Cancer Epidemiol Biomarkers Prev, 15(6),
1148-1152.
Kemp, Z., Thirlwell, C., Sieber, O., Silver, A., & Tomlinson, I. (2004). An update on
the genetics of colorectal cancer. Hum Mol Genet, 13(Suppl 2), R177-185.
Kerkhoff, C., Nacken, W., Benedyk, M., Dagher, M. C., Sopalla, C., & Doussiere, J.
(2005). The arachidonic acid-binding protein S100A8/A9 promotes NADPH
oxidase activation by interaction with p67phox and Rac-2. FASEB J, 19(3), 467-
469.
Khidekel, N., & Hsieh-Wilson, L. C. (2004). A 'molecular switchboard'-covalent
modifications to proteins and their impact on transcription. Org Biomol Chem,
2(1), 1-7.
Kim, H. J., Kang, H. J., Lee, H., Lee, S. T., Yu, M. H., Kim, H., & Lee, C. (2009a).
Identification of S100A8 and S100A9 as serological markers for colorectal
cancer. J Proteome Res, 8(3), 1368-1379.
Kim, H., Lee, M., Lee, S., Park, B., Koh, W., Lee, D. J., . . . Lee, S. (2009). Cancer-
upregulated gene 2 (CUG2), a new component of centromere complex, is
required for kinetochore function. Mol Cells, 27(6), 697-701.
Kim, J. G., Chae, Y. S., Sohn, S. K., Cho, Y. Y., Moon, J. H., Park, J. Y., . . . Jun, S. H.
(2008). Vascular endothelial growth factor gene polymorphisms associated with
prognosis for patients with colorectal cancer. Clin Cancer Res, 14(1), 62-66.
Kim, J. H., You, K. R., Kim, I. H., Cho, B. H., Kim, C. Y., & Kim, D. G. (2004). Over-
expression of the ribosomal protein L36a gene is associated with cellular
proliferation in hepatocellular carcinoma. Hepatology, 39(1), 129-138.

References
271
Kinzler, K. W., & Vogelstein, B. (1996). Lessons from hereditary colorectal cancer.
Cell, 87(2), 159-170.
Kinzler, K. W., & Vogelstein, B. (1998). Landscaping the cancer terrain. Science,
280(5366), 1036-1037.
Kirklin, J. W., Dockerty, M. B., & Waugh, J. M. (1949). The role of the peritoneal
reflection in the prognosis of carcinoma of the rectum and sigmoid colon. Surg
Gynecol Obstet, 88(3), 326-331.
Kirschner, M. (1999). Intracellular proteolysis. Trends Cell Biol, 9(12), M42-45.
Kitahara, O., Furukawa, Y., Tanaka, T., Kihara, C., Ono, K., Yanagawa, R., . . .
Tsunoda, T. (2001). Alterations of gene expression during colorectal
carcinogenesis revealed by cDNA microarrays after laser-capture
microdissection of tumour tissues and normal epithelia. Cancer Res, 61(9),
3544-3549.
Kitamura, M., Toi, M., Arai, K., Iwasaki, Y., Suzuki, H., & Matsuo, K. (1998).
Concentrations of vascular endothelial growth factor in the sera of gastric cancer
patients. Oncol Rep, 5(6), 1419-1424.
Klochendler-Yeivin, A., & Yaniv, M. (2001). Chromatin modifiers and tumour
suppression. Biochim Biophys Acta, 1551(1), M1-M10.
Knudson, A. G. (2002). Cancer genetics. Am J Med Genet, 111(1), 96-102.
Ko, S. I., Park, J. H., Park, M. J., Kim, J., Kang, L. W., & Han, Y. S. (2008). Human
ribosomal protein S3 (hRpS3) interacts with uracil-DNA glycosylase (hUNG)
and stimulates its glycosylase activity. Mutat Res, 648(1–2), 54-64.
Kolligs, F. T., Bommer, G., & Göke, B. (2002). Wnt/beta-catenin/Tcf signaling: a
critical pathway in gastrointestinal tumourigenesis. Digestion, 66(3), 131-144.
Kondoh, N., Schweinfest, C. W., Henderson, K. W., & Papas, T. S. (1992). Differential
expression of S19 ribosomal protein, laminin-binding protein, and human
lymphocyte antigen class I messenger RNAs associated with colon carcinoma
progression and differentiation. Cancer Res, 52(4), 791-796.
Konishi, F., & Morson, B. C. (1982). Pathology of colorectal adenomas: a colonoscopic
survey. J Clin Pathol, 35(8), 830-841.
Koppel, J., Boutterin, M. C., Doye, V., Peyro-Saint-Paul, H., & Sobel, A. (1990).
Developmental tissue expression and phylogenetic conservation of stathmin, a
phosphoprotein associated with cell regulations. J Biol Chem, 265(7), 3703-
3707.
Kops, G. J., Weaver, B. A., & Cleveland, D. W. (2005). On the road to cancer:
aneuploidy and the mitotic checkpoint. Nat Rev Cancer, 5(10), 773-785.
Korgaonkar, C., Hagen, J., Tompkins, V., Frazier, A. A., Allamargot, C., Quelle, F. W.,
& Quelle, D. E. (2005). Nucleophosmin (B23) targets ARF to nucleoli and
inhibits its function. Mol Cell Biol, 25(4), 1258-1271.

References
272
Kotake, K., Honjo, S., Sugihara, K., Hashiguchi, Y., Kato, T., Kodaira, S., . . . Koyama,
Y. (2012). Number of lymph nodes retrieved is an important determinant of
survival of patients with stage II and stage III colorectal cancer. Jpn J Clin
Oncol, 42(1), 29-35.
Kotnis, A., Sarin, R., & Mulherkar, R. (2005). Genotype, phenotype and cancer: role of
low penetrance genes and environment in tumour susceptibility. J Biosci, 30(1),
93-102.
Krasinskas, A. M. (2011). EGFR signaling in colorectal carcinoma. Patholog Res Int,
2011, 932932.
Krasnov, G. S., Oparina, N. Y., Hankin, S. L., Mashkova, T. D., Ershov, A. N.,
Zatsepina, O. G., . . . Beresten, S. F. (2009). Identification of proteins with
altered expression in colorectal cancer by means of 2D-proteomics. Mol Biol,
43(2), 321-328.
Krippl, P., Langsenlehner, U., Renner, W., Yazdani-Biuki, B., Wolf, G., Wascher, T.
C., . . . Samonigg, H. (2003). A common 936 C/T gene polymorphism of
vascular endothelial growth factor is associated with decreased breast cancer risk.
Int J Cancer, 106(4), 468-471.
Kune, G. A., Kune, S., & Watson, L. F. (1989). The role of heredity in the etiology of
large bowel cancer: data from the Melbourne colorectal cancer study. World J
Surg, 13(1), 124-129.
Kurebayashi, J., Otsuki, T., Kunisue, H., Mikami, Y., Tanaka, K., Yamamoto, S., &
Sonoo, H. (1999). Expression of vascular endothelial growth factor (VEGF)
family members in breast cancer. Jpn J Cancer Res, 90(9), 977-981.
Kurzawski, G., Suchy, J., Kladny, J., Grabowska, E., Mierzejewski, M., Jakubowska,
A., . . . Lubinski, J. (2004). The NOD2 3020insC mutation and the risk of
colorectal cancer. Cancer Res, 64(5), 1604-1606.
Kutikhin, A. G. (2011). Role of NOD1/CARD4 and NOD2/CARD15 gene
polymorphisms in cancer etiology. Hum Immunol, 72(10), 955-968.
Lai, M. D., & Xu, J. (2007). Ribosomal proteins and colorectal cancer. Curr Genomics,
8(1), 43-49.
Lakatos, L., Mester, G., Erdelyi, Z., David, G., Pandur, T., Balogh, M., . . . Lakatos, P.
L. (2006). Risk factors for ulcerative colitis-associated colorectal cancer in a
Hungarian cohort of patients with ulcerative colitis: results of a population-
based study. Inflamm Bowel Dis, 12(3), 205-211.
Lakatos, P. L., Hitre, E., Szalay, F., Zinober, K., Fuszek, P., Lakatos, L., . . . Ferenci, P.
(2007). Common NOD2/CARD15 variants are not associated with susceptibility
or the clinicopathologic characteristics of sporadic colorectal cancer in
Hungarian patients. BMC Cancer, 7, 54.
Lambert, E., Dassé, E., Haye, B., & Petitfrère, E. (2004). TIMPs as multifacial proteins.
Crit Rev Oncol Hematol, 49(3), 187-198.

References
273
Langholz, E., Munkholm, P., Davidsen, M., & Binder, V. (1992). Colorectal cancer risk
and mortality in patients with ulcerative colitis. Gastroenterology, 103(5), 1444-
1451.
Lanuti, M., Liu, G., Goodwin, J. M., Zhai, R., Fuchs, B. C., Asomaning, K., . . .
Christiani, D. C. (2008). A functional epidermal growth factor (EGF)
polymorphism, EGF serum levels, and esophageal adenocarcinoma risk and
outcome. Clin Cancer Res, 14(10), 3216-3222.
Larsson, N., Marklund, U., Gradin, H. M., Brattsand, G., & Gullberg, M. (1997).
Control of microtubule dynamics by oncoprotein 18: dissection of the regulatory
role of multisite phosphorylation during mitosis. Mol Cell Biol, 17(9), 5530-
5539.
Laurence, D. J., & Gusterson, B. A. (1990). The epidermal growth factor. A review of
structural and functional relationships in the normal organism and in cancer cells.
Tumour Biol, 11(5), 229-261.
Le Clainche, C., & Carlier, M. F. (2008). Regulation of actin assembly associated with
protrusion and adhesion in cell migration. Physiol Rev, 88(2), 489-513.
Lee, G. H., Kim, C. G., Kim, J. S., Jung, H. C., & Song, I. S. (2005). Frequency
analysis of NOD2 gene mutations in Korean patients with Crohn's disease.
Korean J Gastroenterol, 45(3), 162-168.
Lee, S., Gang, J., Jeon, S. B., Choo, S. H., Lee, B., Kim, Y. G., . . . Koh, S. S. (2007).
Molecular cloning and functional analysis of a novel oncogene, cancer-
upregulated gene 2 (CUG2). Biochem Biophys Res Commun, 360(3), 633-639.
Lee, S. J., Lee, S. Y., Jeon, H. S., Park, S. H., Jang, J. S., Lee, G. Y., . . . Park, J. Y.
(2005a). Vascular endothelial growth factor gene polymorphisms and risk of
primary lung cancer. Cancer Epidemiol Biomarkers Prev, 14(3), 571-575.
Leslie, A., Pratt, N. R., Gillespie, K., Sales, M., Kernohan, N. M., Smith, G., . . . Steele,
R. J. (2003). Mutations of APC, K-ras, and p53 are associated with specific
chromosomal aberrations in colorectal adenocarcinomas. Cancer Res, 63(15),
4656-4661.
Leukert, N., Vogl, T., Strupat, K., Reichelt, R., Sorg, C., & Roth, J. (2006). Calcium-
dependent tetramer formation of S100A8 and S100A9 is essential for biological
activity. J Mol Biol, 359(4), 961-972.
Levin, B., Lieberman, D. A., McFarland, B., Smith, R. A., Brooks, D., Andrews, K.
S., . . . American College of Radiology Colon Cancer Committee. (2008).
Screening and surveillance for the early detection of colorectal cancer and
adenomatous polyps, 2008: a joint guideline from the American Cancer Society,
the US Multi-Society Task Force on Colorectal Cancer, and the American
College of Radiology. CA Cancer J Clin, 58(3), 130-160.
Levine, A. J. (1997). p53, the cellular gatekeeper for growth and division. Cell, 88(3),
323-331.
Levine, J. S., & Ahnen, D. J. (2006). Clinical practice. Adenomatous polyps of the
colon. N Engl J Med, 355(24), 2551-2557.

References
274
Levy, L., & Hill, C. S. (2006). Alterations in components of the TGF-β superfamily
signaling pathways in human cancer. Cytokine Growth Factor Rev, 17(1–2), 41-
58.
Lewallen, S., & Courtright, P. (1998). Epidemiology in practice: case-control studies.
Community Eye Health, 11(28), 57-58.
Lewis, C. M. (2002). Genetic association studies: design, analysis and interpretation.
Brief Bioinform, 3(2), 146-153.
Lewis, C. M., & Knight, J. (2012). Introduction to genetic association studies. Cold
Spring Harb Protoc, 2012(3), 297-306.
Li, J. L., & Harris, A. L. (2009). Crosstalk of VEGF and Notch pathways in tumour
angiogenesis: therapeutic implications. Front Biosci (Landmark Ed), 14, 3094-
3110.
Li, Q. F., Tang, J., Liu, Q. R., Shi, S. L., & Chen, X. F. (2010). Localisation and altered
expression of nucleophosmin in the nuclear matrix during the differentiation of
human hepatocarcinoma SMMC-7721 cells induced by HMBA. Cancer Invest,
28(10), 1004-1012.
Li, X., Yang, X. X., Hu, N. Y., Sun, J. Z., Li, F. X., & Li, M. (2011). A risk-associated
single nucleotide polymorphism of SMAD7 is common to colorectal, gastric,
and lung cancers in a Han Chinese population. Mol Biol Rep, 38(8), 5093-5097.
Li, Y., Li, S., Wu, Z., Hu, F., Zhu, L., Zhao, X., . . . Zhao, Y. (2013). Polymorphisms in
genes of APE1, PARP1, and XRCC1: risk and prognosis of colorectal cancer in
a Northeast Chinese population. Med Oncol, 30(2), 505.
Lian, Z. R., Liu, J., Li, L., Li, X. X., Tufan, N. L. S., Wu, M. C., . . . Feitelson, M. A.
(2004). Human S15a expression is upregulated by hepatitis B virus X protein.
Mol Carcinog, 40(1), 34-46.
Lichtenberger, B. M., Tan, P. K., Niederleithner, H., Ferrara, N., Petzelbauer, P., &
Sibilia, M. (2010). Autocrine VEGF signaling synergises with EGFR in tumour
cells to promote epithelial cancer development. Cell, 140(2), 268-279.
Lichtenstein, P., Holm, N. V., Verkasalo, P. K., Iliadou, A., Kaprio, J., Koskenvuo,
M., . . . Hemminki, K. (2000). Environmental and heritable factors in the
causation of cancer-analyses of cohorts of twins from Sweden, Denmark, and
Finland. N Engl J Med, 343(2), 78-85.
Lieberman, D. A., & Weiss, D. G. (2001). One-time screening for colorectal cancer
with combined fecal occult-blood testing and examination of the distal colon. N
Engl J Med, 345(8), 555-560.
Life Technologies Corporation. (2012). Real-time PCR handbook (2nd ed.). Carlsbad,
CA: Author.
Lim, M. J., & Wang, X. W. (2006). Nucleophosmin and human cancer. Cancer Detect
Prev, 30(6), 481-490.

References
275
Lim, Y. J., Kim, J. W., Song, J. Y., Hong, M. S., Jin, S. Y., Yoon, S. H., . . . Park, Y. H.
(2005). Epidermal growth factor gene polymorphism is different between
schizophrenia and lung cancer patients in Korean population. Neurosci Lett,
374(3), 157-160.
Lin, S. Y., Yeh, K. T., Chen, W. T., Chen, H. C., Chen, S. T., Chiou, H. Y., & Chang, J.
G. (2004). Promoter CpG methylation of tumour suppressor genes in colorectal
cancer and its relationship to clinical features. Oncol Rep, 11(2), 341-348.
Lin, Y., Dynan, W. S., Lee, J. R., Zhu, Z. H., & Schade, R. R. (2009). The current state
of proteomics in GI oncology. Dig Dis Sci, 54(3), 431-457.
Lindblom, A. (2001). Different mechanisms in the tumourigenesis of proximal and
distal colon cancers. Curr Opin Oncol, 13(1), 63-69.
Lindstrom, M. S. (2009). Emerging functions of ribosomal proteins in gene-specific
transcription and translation. Biochem Biophys Res Commun, 379(2), 167-170.
Liotta, L., & Petricoin, E. (2000). Molecular profiling of human cancer. Nat Rev Genet,
1(1), 48-56.
Liu, F., Li, B., Wei, Y., Yan, L., Wen, T., Zhao, J., & Xu, M. (2011). XRCC1 genetic
polymorphism Arg399Gln and hepatocellular carcinoma risk: a meta-analysis.
Liver Int, 31(6), 802-809.
Liu, H. Q., Song, S., Wang, J. H., & Zhang, S. L. (2011a). Expression of MMP-3 and
TIMP-3 in gastric cancer tissue and its clinical significance. Oncol Lett, 2(6),
1319-1322.
Liu, L., Miao, L., Ji, G., Qiang, F., Liu, Z., & Fan, Z. (2013). Association between
XRCC1 and XRCC3 polymorphisms and colorectal cancer risk: a meta-analysis
of 23 case-control studies. Mol Biol Rep, 40(6), 3943-3952.
Liu, S. T., Rattner, J. B., Jablonski, S. A., & Yen, T. J. (2006). Mapping the assembly
pathways that specify formation of the trilaminar kinetochore plates in human
cells. J Cell Biol, 175(1), 41-53.
Liu, W., & Saint, D. A. (2002). A new quantitative method of real time reverse
transcription polymerase chain reaction assay based on simulation of polymerase
chain reaction kinetics. Anal Biochem, 302(1), 52-59.
Liu, X. W., Bernardo, M. M., Fridman, R., & Kim, H. R. (2003). Tissue inhibitor of
metalloproteinase-1 protects human breast epithelial cells against intrinsic
apoptotic cell death via the focal adhesion kinase/phosphatidylinositol 3-kinase
and MAPK signaling pathway. J Biol Chem, 278(41), 40364-40372.
Livak, K. J., & Schmittgen, T. D. (2001). Analysis of relative gene expression data
using real-time quantitative PCR and the 2(-delta delta C(T)) method. Methods,
25(4), 402-408.
Loeb, L. A. (2001). A mutator phenotype in cancer. Cancer Res, 61(8), 3230-3239.
Loeb, L. A., Loeb, K. R., & Anderson, J. P. (2003). Multiple mutations and cancer.
Proc Natl Acad Sci, 100(3), 776-781.

References
276
Lohmueller, K. E., Pearce, C. L., Pike, M., Lander, E. S., & Hirschhorn, J. N. (2003).
Meta-analysis of genetic association studies supports a contribution of common
variants to susceptibility to common disease. Nat Genet, 33(2), 177-182.
Lubbe, S. J., Di Bernardo, M. C., Broderick, P., Chandler, I., & Houlston, R. S. (2012).
Comprehensive evaluation of the impact of 14 genetic variants on colorectal
cancer phenotype and risk. Am J Epidemiol, 175(1), 1-10.
Lubinski, J., Huzarski, T., Kurzawski, G., Suchy, J., Masojc, B., Mierzejewski, M., . . .
Narod, S. A. (2005). The 3020insC allele of NOD2 predisposes to cancers of
multiple organs. Hered Cancer Clin Pract, 3(2), 59-63.
Lunn, R. M., Langlois, R. G., Hsieh, L. L., Thompson, C. L., & Bell, D. A. (1999).
XRCC1 polymorphisms: effects on aflatoxin B1-DNA adducts and glycophorin
A variant frequency. Cancer Res, 59(11), 2557-2561.
Lynch, H. T., & de la Chapelle, A. (2003). Hereditary colorectal cancer. N Engl J Med,
348(10), 919-932.
Lynch, H. T., Smyrk, T., Watson, P., Lanspa, S. J., Boman, B. M., Lynch, P. M., . . .
Cavalieri, J. (1991). Hereditary colorectal cancer. Semin Oncol, 18(4), 337-366.
Lynch, P. M., & Lynch, H. T. (1985). Colon cancer genetics. New York, NY: Van
Nostrand Rheinhold.
Ma, Y., Peng, J., Liu, W., Zhang, P., Huang, L., Gao, B., . . . Qin, H. (2009). Proteomics
identification of desmin as a potential oncofetal diagnostic and prognostic
biomarker in colorectal cancer. Mol Cell Proteomics, 8(8), 1878-1890.
Macarthur, M., Hold, G. L., & El-Omar, E. M. (2004). Inflammation and Cancer II.
Role of chronic inflammation and cytokine gene polymorphisms in the
pathogenesis of gastrointestinal malignancy. Am J Physiol Gastrointest Liver
Physiol, 286(4), G515-520.
Machesky, L. M. (2008). Lamellipodia and filopodia in metastasis and invasion. FEBS
Lett, 582(14), 2102-2111.
Machesky, L. M., Reeves, E., Wientjes, F., Mattheyse, F. J., Grogan, A., Totty, N.
F., . . . Segal, A. W. (1997). Mammalian actin-related protein 2/3 complex
localises to regions of lamellipodial protrusion and is composed of
evolutionarily conserved proteins. Biochem J, 328(Pt 1), 105-112.
Mackay, J., Jemal, A., Lee, N. C., & Parkin, D. M. (2006). The cancer atlas. Atlanta,
GA: American Cancer Society.
Maeda, K., Nishiguchi, Y., Yashiro, M., Yamada, S., Onoda, N., Sawada, T., . . .
Hirakawa, K. (2000). Expression of vascular endothelial growth factor and
thrombospondin-1 in colorectal carcinoma. Int J Mol Med, 5(4), 373-378.
Maguire, B. A., & Zimmermann, R. A. (2001). The ribosome in focus. Cell, 104(6),
813-816.

References
277
Malygin, A. A., Parakhnevitch, N. M., Ivanov, A. V., Eperon, I. C., & Karpova, G. G.
(2007). Human ribosomal protein S13 regulates expression of its own gene at
the splicing step by a feedback mechanism. Nucleic Acids Res, 35(19), 6414-
6423.
Mannello, F., & Gazzanelli, G. (2001). Tissue inhibitors of metalloproteinases and
programmed cell death: conundrums, controversies and potential implications.
Apoptosis, 6(6), 479-482.
Mao, D., Zhang, Y., Lu, H., & Fu, X. (2013). Association between X-ray repair cross-
complementing group 1 Arg194Trp polymorphism and colorectal cancer risk.
Tumour Biol, 34(5), 2529-2538.
Mao, R., Zielke, C. L., Zielke, H. R., & Pevsner, J. (2003). Global up-regulation of
chromosome 21 gene expression in the developing Down syndrome brain.
Genomics, 81(5), 457-467.
Martín, J. J., Hernández, L. S., Gonzalez, M. G., Mendez, C. P., Rey Galán, C., &
Guerrero, S. M. (2008). Trends in childhood and adolescent obesity prevalence
in Oviedo (Asturias, Spain) 1992–2006. Acta Pædiatr, 97(7), 955-958.
Marygold, S. J., Coelho, C. M., & Leevers, S. J. (2005). Genetic analysis of RpL38 and
RpL5, two minute genes located in the centric heterochromatin of chromosome
2 of Drosophila melanogaster. Genetics, 169(2), 683-695.
McDermott, U., Downing, J. R., & Stratton, M. R. (2011). Genomics and the continuum
of cancer care. N Engl J Med, 364(4), 340-350.
McMahon, G. (2000). VEGF receptor signaling in tumour angiogenesis. Oncologist,
5(90001), 3-10.
Medina, C., & Radomski, M. W. (2006). Role of matrix metalloproteinases in intestinal
inflammation. J Pharmacol Exp Ther, 318(3), 933-938.
Mellone, B., Erhardt, S., & Karpen, G. H. (2006). The ABCs of centromeres. Nat Cell
Biol, 8(5), 427-429.
Menssen, A., & Hermeking, H. (2002). Characterisation of the c-MYC-regulated
transcriptome by SAGE: identification and analysis of c-MYC target genes.
Proc Natl Acad Sci, 99(9), 6274-6279.
Merendino, A. M., Bucchieri, F., Campanella, C., Marciano, V., Ribbene, A., David,
S., . . . Cappello, F. (2010). Hsp60 is actively secreted by human tumour cells.
PLoS One, 5(2), e9247.
Mimori, K., Mori, M., Shiraishi, T., Fujie, T., Baba, K., Haraguchi, M., . . . Akiyoshi, T.
(1997). Clinical significance of tissue inhibitor of metalloproteinase expression
in gastric carcinoma. Br J Cancer, 76(4), 531-536.
Minchenko, A., Bauer, T., Salceda, S., & Caro, J. (1994). Hypoxic stimulation of
vascular endothelial growth factor expression in vitro and in vivo. Lab Invest,
71(3), 374-379.

References
278
Mitsudomi, T., & Yatabe, Y. (2010). Epidermal growth factor receptor in relation to
tumour development: EGFR gene and cancer. FEBS J, 277(2), 301-308.
Mochizuki, T., Miyazaki, H., Hara, T., Furuya, T., Imamura, T., Watabe, T., &
Miyazono, K. (2004). Roles for the MH2 domain of Smad7 in the specific
inhibition of transforming growth factor-β superfamily signaling. J Biol Chem,
279(30), 31568-31574.
Mockelmann, N., von Schonfels, W., Buch, S., von Kampen, O., Sipos, B., Egberts, J.
H., . . . Hampe, J. (2009). Investigation of innate immunity genes CARD4,
CARD8 and CARD15 as germline susceptibility factors for colorectal cancer.
BMC Gastroenterol, 9, 79.
Mohrenweiser, H. W., Carrano, A. V., Fertitta, A., Perry, B., Thompson, L. H., Tucker,
J. D., & Weber, C. A. (1989). Refined mapping of the three DNA repair genes,
ERCC1, ERCC2, and XRCC1, on human chromosome 19. Cytogenet Cell Genet,
52(1-2), 11-14.
Montanaro, L., Trere, D., & Derenzini, M. (2008). Nucleolus, ribosomes, and cancer.
Am J Pathol, 173(2), 301-310.
Morson, B. C. (1966). Factors influencing the prognosis of early cancer of the rectum.
Proc R Soc Med, 59(7), 607-608.
Morson, B. C., & Dawson, I. M. P. (1972). Gastrointestinal pathology (1st ed.). Oxford:
Blackwell Scientific.
Morson, B. C., & Dawson, I. M. P. (1979). Gastroenterology pathology (2nd ed.).
London: Blackwell Scientific.
Mullins, R. D., Heuser, J. A., & Pollard, T. D. (1998). The interaction of Arp2/3
complex with actin: nucleation, high affinity pointed end capping, and formation
of branching networks of filaments. Proc Natl Acad Sci, 95(11), 6181-6186.
Muniz-Mendoza, R., Ayala-Madrigal, M. L., Partida-Perez, M., Peregrina-Sandoval, J.,
Leal-Ugarte, E., Macias-Gomez, N., . . . Gutierrez-Angulo, M. (2012). MLH1
and XRCC1 polymorphisms in Mexican patients with colorectal cancer. Genet
Mol Res, 11(3), 2315-2320.
Munkholm, P. (2003). Review article: the incidence and prevalence of colorectal cancer
in inflammatory bowel disease. Aliment Pharmacol Ther, 18(Suppl 2), 1-5.
Muto, T., Bussey, H. J. R., & Morson, B. C. (1975). The evolution of cancer of the
colon and rectum. Cancer, 36(6), 2251-2270.
Muto, T., Taniguchi, H., Kushima, R., Tsuda, H., Yonemori, H., Chen, C., . . . Kondo, T.
(2011). Global expression study in colorectal cancer on proteins with alkaline
isoelectric point by two-dimensional difference gel electrophoresis. J
Proteomics, 74(6), 858-873.
Naccarati, A., Pardini, B., Hemminki, K., & Vodicka, P. (2007). Sporadic colorectal
cancer and individual susceptibility: a review of the association studies
investigating the role of DNA repair genetic polymorphisms. Mutat Res, 635(2-
3), 118-145.

References
279
Nagtegaal, I. D., Gosens, M. J., Marijnen, C. A., Rutten, H. J., van de Velde, C. J., &
van Krieken, J. H. (2007). Combinations of tumour and treatment parameters are
more discriminative for prognosis than the present TNM system in rectal cancer.
J Clin Oncol, 25(13), 1647-1650.
Nakajima, N., Kuwayama, H., Ito, Y., Iwasaki, A., & Arakawa, Y. (1997). Helicobacter
pylori, neutrophils, interleukins, and gastric epithelial proliferation. J Clin
Gastroenterol, 25(Suppl 1), S198-S202.
Nakao, M., Hosono, S., Ito, H., Watanabe, M., Mizuno, N., Sato, S., . . . Matsuo, K.
(2012). Selected polymorphisms of base excision repair genes and pancreatic
cancer risk in Japanese. J Epidemiol, 22(6), 477-483.
Nannini, M., Pantaleo, M. A., Maleddu, A., Astolfi, A., Formica, S., & Biasco, G.
(2009). Gene expression profiling in colorectal cancer using microarray
technologies: results and perspectives. Cancer Treat Rev, 35(3), 201-209.
Nedelkov, D. (2008). Discovering human protein diversity. Maced J Chem Chem Eng,
27(2), 99-106.
Németh, J., Angel, P., & Hess, J. (2009). Dual role of S100A8 and S100A9 in
inflammation-associated cancer. Antiinflamm Antiallergy Agents Med Chem,
8(4), 329-336.
Newell, K. J., Witty, J. P., Rodgers, W. H., & Matrisian, L. M. (1994). Expression and
localisation of matrix-degrading metalloproteinases during colorectal
tumourigenesis. Mol Carcinog, 10(4), 199-206.
Nissar, S., Lone, T. A., Banday, M. Z., Rasool, R., Chowdri, N. A., Parray, F. Q., . . .
Sameer, A. S. (2013). Arg399Gln polymorphism of XRCC1 gene and risk of
colorectal cancer in Kashmir: a case control study. Oncol Lett, 5(3), 959-963.
Normanno, N., De Luca, A., Bianco, C., Strizzi, L., Mancino, M., Maiello, M. R., . . .
Salomon, D. S. (2006). Epidermal growth factor receptor (EGFR) signaling in
cancer. Gene, 366(1), 2-16.
North, S., Moenner, M., & Bikfalvi, A. (2005). Recent developments in the regulation
of the angiogenic switch by cellular stress factors in tumours. Cancer Lett,
218(1), 1-14.
Nowsheen, S., Aziz, K., Panayiotidis, M. I., & Georgakilas, A. G. (2012). Molecular
markers for cancer prognosis and treatment: have we struck gold? Cancer Lett,
327(1-2), 142-152.
Nozawa, Y., Van Belzen, N., Van der Made, A. C., Dinjens, W. N., & Bosman, F. T.
(1996). Expression of nucleophosmin/B23 in normal and neoplastic colorectal
mucosa. J Pathol, 178(1), 48-52.
O'Connell, J. B., Maggard, M. A., & Ko, C. Y. (2004). Colon cancer survival rates with
the new American Joint Committee on Cancer sixth edition staging. J Natl
Cancer Inst, 96(19), 1420-1425.

References
280
O'Dwyer, D., Ralton, L. D., O'Shea, A., & Murray, G. I. (2011). The proteomics of
colorectal cancer: identification of a protein signature associated with prognosis.
PLoS One, 6(11), e27718.
Offenberg, H., Brünner, N., Mansilla, F., Ørntoft Torben, F., & Birkenkamp-Demtroder,
K. (2008). TIMP-1 expression in human colorectal cancer is associated with
TGF-B1, LOXL2, INHBA1, TNF-AIP6 and TIMP-2 transcript profiles. Mol
Oncol, 2(3), 233-240.
Ogura, Y., Lala, S., Xin, W., Smith, E., Dowds, T. A., Chen, F. F., . . . Nuñez, G. (2003).
Expression of NOD2 in Paneth cells: a possible link to Crohn’s ileitis. Gut,
52(11), 1591-1597.
Ogura, Y., Bonen, D. K., Inohara, N., Nicolae, D. L., Chen, F. F., Ramos, R., . . . Cho, J.
H. (2001a). A frameshift mutation in NOD2 associated with susceptibility to
Crohn's disease. Nature, 411(6837), 603-606.
Ogura, Y., Inohara, N., Benito, A., Chen, F. F., Yamaoka, S., & Nunez, G. (2001).
Nod2, a Nod1/Apaf-1 family member that is restricted to monocytes and
activates NF-kappaB. J Biol Chem, 276(7), 4812-4818.
Okada, M., Cheeseman, I. M., Hori, T., Okawa, K., McLeod, I. X., Yates, J. R. 3rd., . . .
Fukagawa, T. (2006). The CENP-H-I complex is required for the efficient
incorporation of newly synthesised CENP-A into centromeres. Nat Cell Biol,
8(5), 446-457.
Okada, M., Okawa, K., Isobe, T., & Fukagawa, T. (2009). CENP-H-containing complex
facilitates centromere deposition of CENP-A in cooperation with FACT and
CHD1. Mol Biol Cell, 20(18), 3986-3995.
Okuda, M. (2002). The role of nucleophosmin in centrosome duplication. Oncogene,
21(40), 6170-6174.
Okuda, M., Horn, H. F., Tarapore, P., Tokuyama, Y., Smulian, A. G., Chan, P. K., . . .
Fukasawa, K. (2000). Nucleophosmin/B23 is a target of CDK2/cyclin E in
centrosome duplication. Cell, 103(1), 127-140.
Omar, Z. A., & Ibrahim Tamin, N. S. (2011). National cancer registry report 2007.
Malaysia: Ministry of Health.
Orlando, R. C. (2002). Mechanisms of epithelial injury and inflammation in
gastrointestinal diseases. Rev Gastroenterol Disord, 2(Suppl 2), S2-8.
Orr-Weaver, T. L., & Weinberg, R. A. (1998). A checkpoint on the road to cancer.
Nature, 392(6673), 223-224.
Ostrand-Rosenberg, S. (2010). Myeloid-derived suppressor cells: more mechanisms for
inhibiting antitumour immunity. Cancer Immunol Immunother, 59(10), 1593-
1600.
Otsubo, T., Iwaya, K., Mukai, Y., Mizokami, Y., Serizawa, H., Matsuoka, T., & Mukai,
K. (2004). Involvement of Arp2/3 complex in the process of colorectal
carcinogenesis. Mod Pathol, 17(4), 461-467.

References
281
Oxentenko, A. S., & Smyrk, T. C. (2012). Interval colon cancer in a Lynch syndrome
patient under annual colonoscopic surveillance: a case for advanced imaging
techniques? BMC Gastroenterol, 12, 50.
Papaconstantinou, I., Theodoropoulos, G., Gazouli, M., Panoussopoulos, D., Mantzaris,
G. J., Felekouras, E., & Bramis, J. (2005). Association between mutations in the
CARD15/NOD2 gene and colorectal cancer in a Greek population. Int J Cancer,
114(3), 433-435.
Parcellier, A., Gurbuxani, S., Schmitt, E., Solary, E., & Garrido, C. (2003). Heat shock
proteins, cellular chaperones that modulate mitochondrial cell death pathways.
Biochem Biophys Res Commun, 304(3), 505-512.
Pardini, B., Naccarati, A., Novotny, J., Smerhovsky, Z., Vodickova, L., Polakova,
V., . . . Vodicka, P. (2008). DNA repair genetic polymorphisms and risk of
colorectal cancer in the Czech Republic. Mutat Res, 638(1-2), 146-153.
Parkin, D. M., Pisani, P., Munoz, N., & Ferlay, J. (1999). The global health burden of
infection associated cancers. In R. Newton, V. Beral & R. A. Weiss (Eds.),
Infections and human cancer (pp. 5-33). New York, NY: Cold Spring Harbor
Laboratory Press.
Pei, H., Zhu, H., Zeng, S., Li, Y., Yang, H., Shen, L., . . . Shen, H. (2007). Proteome
analysis and tissue microarray for profiling protein markers associated with
lymph node metastasis in colorectal cancer. J Proteome Res, 6(7), 2495-2501.
Perpelescu, M., & Fukagawa, T. (2011). The ABCs of CENPs. Chromosoma, 120(5),
425-446.
Perry, R. (2005). The architecture of mammalian ribosomal protein promoters. BMC
Evol Biol, 5(1), 15.
Pesta, M., Holubec, L. Jr., Topolcan, O., Cerna, M., Rupert, K., Holubec, L. S., . . .
Cerny, R. (2005). Quantitative estimation of matrix metalloproteinases 2 and 7
(MMP-2, MMP-7) and tissue inhibitors of matrix metalloproteinases 1 and 2
(TIMP-1, TIMP-2) in colorectal carcinoma tissue samples. Anticancer Res,
25(5), 3387-3391.
Pesta, M., Topolcan, O., Holubec, L. Jr., Rupert, K., Cerna, M., Holubec, L. S., . . .
Cerny, R. (2007). Clinicopathological assessment and quantitative estimation of
the matrix metalloproteinases MMP-2 and MMP-7 and the inhibitors TIMP-1
and TIMP-2 in colorectal carcinoma tissue samples. Anticancer Res, 27(4A),
1863-1867.
Petrova, D. T., Asif, A. R., Armstrong, V. W., Dimova, I., Toshev, S., Yaramov, N., . . .
Toncheva, D. (2008). Expression of chloride intracellular channel protein 1
(CLIC1) and tumour protein D52 (TPD52) as potential biomarkers for colorectal
cancer. Clin Biochem, 41(14-15), 1224-1236.
Pharoah, P. D., Dunning, A. M., Ponder, B. A., & Easton, D. F. (2004). Association
studies for finding cancer-susceptibility genetic variants. Nat Rev Cancer, 4(11),
850-860.

References
282
Phillips, J. L., Hayward, S. W., Wang, Y., Vasselli, J., Pavlovich, C., Padilla-Nash,
H., . . . Ried, T. (2001). The consequences of chromosomal aneuploidy on gene
expression profiles in a cell line model for prostate carcinogenesis. Cancer Res,
61(22), 8143-8149.
Picelli, S., Von Holst, S., & Wessendorf, P. (2009). The continuing search for
predisposing colorectal cancer variants. Cancer Genomics Proteomics, 6(6),
305-316.
Pihan, G. A., & Doxsey, S. J. (1999). The mitotic machinery as a source of genetic
instability in cancer. Semin Cancer Biol, 9(4), 289-302.
Piselli, P., Vendetti, S., Vismara, D., Cicconi, R., Poccia, F., Colizzi, V., & Delpino, A.
(2000). Different expression of CD44, ICAM-1, and HSP60 on primary tumour
and metastases of a human pancreatic carcinoma growing in scid mice.
Anticancer Res, 20(2A), 825-831.
Pittman, A. M., Naranjo, S., Webb, E., Broderick, P., Lips, E. H., van Wezel, T., . . .
Houlston, R. S. (2009). The colorectal cancer risk at 18q21 is caused by a novel
variant altering SMAD7 expression. Genome Res, 19(6), 987-993.
Pittman, A. M., Webb, E., Carvajal-Carmona, L., Howarth, K., Di Bernardo, M. C.,
Broderick, P., . . . Houlston, R. S. (2008). Refinement of the basis and impact of
common 11q23.1 variation to the risk of developing colorectal cancer. Hum Mol
Genet, 17(23), 3720-3727.
Pockley, A. G. (2003). Heat shock proteins as regulators of the immune response.
Lancet, 362(9382), 469-476.
Pogue-Geile, K., Geiser, J. R., Shu, M., Miller, C., Wool, I. G., Meisler, A. I., & Pipas,
J. M. (1991). Ribosomal protein genes are overexpressed in colorectal cancer:
isolation of a cDNA clone encoding the human S3 ribosomal protein. Mol Cell
Biol, 11(8), 3842-3849.
Pollard, J. W. (2004). Tumour-educated macrophages promote tumour progression and
metastasis. Nat Rev Cancer, 4(1), 71-78.
Popat, S., Hubner, R., & Houlston, R. S. (2005). Systematic review of microsatellite
instability and colorectal cancer prognosis. J Clin Oncol, 23(3), 609-618.
Pradet-Balade, B., Boulme, F., Beug, H., Mullner, E. W., & Garcia-Sanz, J. A. (2001).
Translation control: bridging the gap between genomics and proteomics? Trends
Biochem Sci, 26(4), 225-229.
Prendergast, L., van Vuuren, C., Kaczmarczyk, A., Doering, V., Hellwig, D., Quinn,
N., . . . Sullivan, K. F. (2011). Premitotic assembly of human CENPs -T and -W
switches centromeric chromatin to a mitotic state. PLoS Biol, 9(6), e1001082.
Pugazhendhi, S., Amte, A., Balamurugan, R., Subramanian, V., & Ramakrishna, B. S.
(2008). Common NOD2 mutations are absent in patients with Crohn's disease in
India. Indian J Gastroenterol, 27(5), 201-203.
Pugh, C. W., & Ratcliffe, P. J. (2003). Regulation of angiogenesis by hypoxia: role of
the HIF system. Nat Med, 9(6), 677-684.

References
283
Puppa, G., Sonzogni, A., Colombari, R., & Pelosi, G. (2010). TNM staging system of
colorectal carcinoma: a critical appraisal of challenging issues. Arch Pathol Lab
Med, 134(6), 837-852.
Pyronnet, S., & Sonenberg, N. (2001). Cell-cycle-dependent translational control. Curr
Opin Genet Dev, 11(1), 13-18.
Rabeneck, L., Paszat, L. F., Hilsden, R. J., Saskin, R., Leddin, D., Grunfeld, E., . . .
Stukel, T. A. (2008). Bleeding and perforation after outpatient colonoscopy and
their risk factors in usual clinical practice. Gastroenterology, 135(6), 1899-1906.
Ramakrishnan, V. (2002). Ribosome structure and the mechanism of translation. Cell,
108(4), 557-572.
Rana, S., Maples, P. B., Senzer, N., & Nemunaitis, J. (2008). Stathmin 1: a novel
therapeutic target for anticancer activity. Expert Rev Anticancer Ther, 8(9),
1461-1470.
Ratnasinghe, D., Yao, S. X., Tangrea, J. A., Qiao, Y. L., Andersen, M. R., Barrett, M.
J., . . . Taylor, P. R. (2001). Polymorphisms of the DNA repair gene XRCC1 and
lung cancer risk. Cancer Epidemiol Biomarkers Prev, 10(2), 119-123.
Rauhala, H. E., Teppo, S., Niemela, S., & Kallioniemi, A. (2013). Silencing of the
ARP2/3 complex disturbs pancreatic cancer cell migration. Anticancer Res,
33(1), 45-52.
Ravenscroft, G., Colley, S. M., Walker, K. R., Clement, S., Bringans, S., Lipscombe,
R., . . . Nowak, K. J. (2008). Expression of cardiac alpha-actin spares
extraocular muscles in skeletal muscle alpha-actin diseases-quantification of
striated alpha-actins by MRM-mass spectrometry. Neuromuscul Disord, 18(12),
953-958.
Ravi, R., Mookerjee, B., Bhujwalla, Z. M., Sutter, C. H., Artemov, D., Zeng, Q., . . .
Bedi, A. (2000). Regulation of tumour angiogenesis by p53-induced degradation
of hypoxia-inducible factor 1 alpha. Genes Dev, 14(1), 34-44.
Ree, A. H., Florenes, V. A., Berg, J. P., Maelandsmo, G. M., Nesland, J. M., & Fodstad,
O. (1997). High levels of messenger RNAs for tissue inhibitors of
metalloproteinases (TIMP-1 and TIMP-2) in primary breast carcinomas are
associated with development of distant metastases. Clin Cancer Res, 3(9), 1623-
1628.
Renner, W., Kotschan, S., Hoffmann, C., Obermayer-Pietsch, B., & Pilger, E. (2000). A
common 936 C/T mutation in the gene for vascular endothelial growth factor is
associated with vascular endothelial growth factor plasma levels. J Vasc Res,
37(6), 443-448.
Rex, D. K., Cutler, C. S., Lemmel, G. T., Rahmani, E. Y., Clark, D. W., Helper, D.
J., . . . Mark, D. G. (1997). Colonoscopic miss rates of adenomas determined by
back-to-back colonoscopies. Gastroenterology, 112(1), 24-28.
Rhodes, J. M., & Campbell, B. J. (2002). Inflammation and colorectal cancer: IBD-
associated and sporadic cancer compared. Trends Mol Med, 8(1), 10-16.

References
284
Ribatti, D., Nico, B., Crivellato, E., Roccaro, A. M., & Vacca, A. (2007). The history of
the angiogenic switch concept. Leukemia, 21(1), 44-52.
Ried, T., Heselmeyer-Haddad, K., Blegen, H., Schrock, E., & Auer, G. (1999).
Genomic changes defining the genesis, progression, and malignancy potential in
solid human tumours: a phenotype/genotype correlation. Genes Chromosomes
Cancer, 25(3), 195-204.
Ried, T., Hu, Y., Difilippantonio, M. J., Ghadimi, B. M., Grade, M., & Camps, J. (2012).
The consequences of chromosomal aneuploidy on the transcriptome of cancer
cells. Biochim Biophys Acta, 1819(7), 784-793.
Ritossa, F. (1962). A new puffing pattern induced by temperature shock and DNP in
Drosophila. Experientia, 18(12), 571-573.
Roberts, A. B., & Wakefield, L. M. (2003). The two faces of transforming growth factor
β in carcinogenesis. Proc Natl Acad Sci, 100(15), 8621-8623.
Roberts, R. L., Gearry, R. B., Allington, M. D., Morrin, H. R., Robinson, B. A., &
Frizelle, F. A. (2006). Caspase recruitment domain-containing protein 15
mutations in patients with colorectal cancer. Cancer Res, 66(5), 2532-2535.
Robinson, R. C., Turbedsky, K., Kaiser, D. A., Marchand, J. B., Higgs, H. N., Choe, S.,
& Pollard, T. D. (2001). Crystal structure of Arp2/3 complex. Science,
294(5547), 1679-1684.
Rockey, D. C., Paulson, E., Niedzwiecki, D., Davis, W., Bosworth, H. B., Sanders,
L., . . . Halvorsen, R. (2005). Analysis of air contrast barium enema, computed
tomographic colonography, and colonoscopy: prospective comparison. Lancet,
365(9456), 305-311.
Roest Crollius, H., Jaillon, O., Bernot, A., Dasilva, C., Bouneau, L., Fischer, C., . . .
Weissenbach, J. (2000). Estimate of human gene number provided by genome-
wide analysis using Tetraodon nigroviridis DNA sequence. Nat Genet, 25(2),
235-238.
Roth, J., Vogl, T., Sorg, C., & Sunderkötter, C. (2003). Phagocyte-specific S100
proteins: a novel group of proinflammatory molecules. Trends Immunol, 24(4),
155-158.
Rubin, C. I., & Atweh, G. F. (2004). The role of stathmin in the regulation of the cell
cycle. J Cell Biochem, 93(2), 242-250.
Ruggero, D., & Pandolfi, P. P. (2003). Does the ribosome translate cancer? Nat Rev
Cancer, 3(3), 179-192.
Saccani Jotti, G., Fontanesi, M., Orsi, N., Sarli, L., Pietra, N., Peracchia, A., . . . Becchi,
G. (1995). DNA content in human colon cancer and non-neoplastic adjacent
mucosa. Int J Biol Markers, 10(1), 11-16.
Salama, I., Malone, P. S., Mihaimeed, F., & Jones, J. L. (2008). A review of the S100
proteins in cancer. Eur J Surg Oncol, 34(4), 357-364.

References
285
Salomon, D. S., Brandt, R., Ciardiello, F., & Normanno, N. (1995). Epidermal growth
factor-related peptides and their receptors in human malignancies. Crit Rev
Oncol Hematol, 19(3), 183-232.
Samad, A. K., Taylor, R. S., Marshall, T., & Chapman, M. A. (2005). A meta-analysis
of the association of physical activity with reduced risk of colorectal cancer.
Colorectal Dis, 7(3), 204-213.
Sambrook, J., & Russell, D. W. (2001). Molecular cloning: a laboratory manual, vol. 2
(3rd ed.). New York, NY: Cold Spring Harbor Laboratory Press.
Sant, M., Capocaccia, R., Coleman, M. P., Berrino, F., Gatta, G., Micheli, A., . . .
Zappone, A. (2001). Cancer survival increases in Europe, but international
differences remain wide. Eur J Cancer, 37(13), 1659-1667.
Sasaki, O., Atkin, W. S., & Jass, J. R. (1987). Mucinous carcinoma of the rectum.
Histopathology, 11(3), 259-272.
Savkur, R. S., & Olson, M. O. (1998). Preferential cleavage in pre-ribosomal RNA by
protein B23 endoribonuclease. Nucleic Acids Res, 26(19), 4508-4515.
Schneider, J., Jimenez, E., Marenbach, K., Romero, H., Marx, D., & Meden, H. (1999).
Immunohistochemical detection of HSP60-expression in human ovarian cancer.
Correlation with survival in a series of 247 patients. Anticancer Res, 19(3A),
2141-2146.
Schrohl, A. S., Holten-Andersen, M. N., Peters, H. A., Look, M. P., Meijer-van Gelder,
M. E., Klijn, J. G., . . . Foekens, J. A. (2004). Tumour tissue levels of tissue
inhibitor of metalloproteinase-1 as a prognostic marker in primary breast cancer.
Clin Cancer Res, 10(7), 2289-2298.
Schulz, K. F., & Grimes, D. A. (2002). Case-control studies: research in reverse. Lancet,
359(9304), 431-434.
Schuman, B. M., Simsek, H., & Lyons, R. C. (1990). The association of multiple
colonic adenomatous polyps with cancer of the colon. Am J Gastroenterol, 85(7),
846-849.
Sebastiani, P., Timofeev, N., Dworkis, D. A., Perls, T. T., & Steinberg, M. H. (2009).
Genome-wide association studies and the genetic dissection of complex traits.
Am J Hematol, 84(8), 504-515.
Semba, S., Iwaya, K., Matsubayashi, J., Serizawa, H., Kataba, H., Hirano, T., . . . Mukai,
K. (2006). Coexpression of actin-related protein 2 and Wiskott-Aldrich
syndrome family verproline-homologous protein 2 in adenocarcinoma of the
lung. Clin Cancer Res, 12(8), 2449-2454.
Seril, D. N., Liao, J., Yang, G. Y., & Yang, C. S. (2003). Oxidative stress and ulcerative
colitis-associated carcinogenesis: studies in humans and animal models.
Carcinogenesis, 24(3), 353-362.
Shahbazi, M., Pravica, V., Nasreen, N., Fakhoury, H., Fryer, A. A., Strange, R. C., . . .
Hutchinson, I. V. (2002). Association between functional polymorphism in EGF
gene and malignant melanoma. Lancet, 359(9304), 397-401.

References
286
Shaheen, R. M., Davis, D. W., Liu, W., Zebrowski, B. K., Wilson, M. R., Bucana, C.
D., . . . Ellis, L. M. (1999). Antiangiogenic therapy targeting the tyrosine kinase
receptor for vascular endothelial growth factor receptor inhibits the growth of
colon cancer liver metastasis and induces tumour and endothelial cell apoptosis.
Cancer Res, 59(21), 5412-5416.
Shan, Y. X., Liu, T. J., Su, H. F., Samsamshariat, A., Mestril, R., & Wang, P. H. (2003).
Hsp10 and Hsp60 modulate Bcl-2 family and mitochondria apoptosis signaling
induced by doxorubicin in cardiac muscle cells. J Mol Cell Cardiol, 35(9), 1135-
1143.
Shastry, B. S. (2002). SNP alleles in human disease and evolution. J Hum Genet, 47(11),
561-566.
Shaw, M. H., Kamada, N., Warner, N., Kim, Y. G., & Nunez, G. (2011). The ever-
expanding function of NOD2: autophagy, viral recognition, and T cell activation.
Trends Immunol, 32(2), 73-79.
Shen, M. R., Jones, I. M., & Mohrenweiser, H. (1998). Nonconservative amino acid
substitution variants exist at polymorphic frequency in DNA repair genes in
healthy humans. Cancer Res, 58(4), 604-608.
Sherbet, G. V., & Cajone, F. (2005). Stathmin in cell proliferation and cancer
progression. Cancer Genomics Proteomics, 2(4), 227-237.
Shevchenko, A., Wilm, M., Vorm, O., & Mann, M. (1996). Mass spectrometric
sequencing of proteins silver-stained polyacrylamide gels. Anal Chem, 68(5),
850-858.
Shi, H., Hood, K. A., Hayes, M. T., & Stubbs, R. S. (2011). Proteomic analysis of
advanced colorectal cancer by laser capture microdissection and two-
dimensional difference gel electrophoresis. J Proteomics, 75(2), 339-351.
Shinya, H., & Wolff, W. I. (1979). Morphology, anatomic distribution and cancer
potential of colonic polyps. Ann Surg, 190(6), 679-683.
Shweiki, D., Itin, A., Soffer, D., & Keshet, E. (1992). Vascular endothelial growth
factor induced by hypoxia may mediate hypoxia-initiated angiogenesis. Nature,
359(6398), 843-845.
Siegel, P. M., & Massague, J. (2003). Cytostatic and apoptotic actions of TGF-beta in
homeostasis and cancer. Nat Rev Cancer, 3(11), 807-821.
Singer, S., Ehemann, V., Brauckhoff, A., Keith, M., Vreden, S., Schirmacher, P., &
Breuhahn, K. (2007). Protumourigenic overexpression of stathmin/Op18 by
gain-of-function mutation in p53 in human hepatocarcinogenesis. Hepatology,
46(3), 759-768.
Singer, S., Malz, M., Herpel, E., Warth, A., Bissinger, M., Keith, M., . . . Breuhahn, K.
(2009). Coordinated expression of stathmin family members by far upstream
sequence element-binding protein-1 increases motility in non–small cell lung
cancer. Cancer Res, 69(6), 2234-2243.

References
287
Skjelbred, C. F., Saebo, M., Wallin, H., Nexo, B. A., Hagen, P. C., Lothe, I. M., . . .
Kure, E. H. (2006). Polymorphisms of the XRCC1, XRCC3 and XPD genes and
risk of colorectal adenoma and carcinoma, in a Norwegian cohort: a case control
study. BMC Cancer, 6, 67.
Slattery, M. L., Herrick, J., Curtin, K., Samowitz, W., Wolff, R. K., Caan, B. J., . . .
Peters, U. (2010). Increased risk of colon cancer associated with a genetic
polymorphism of SMAD7. Cancer Res, 70(4), 1479-1485.
Sliwinski, T., Krupa, R., Wisniewska-Jarosinska, M., Lech, J., Morawiec, Z., Chojnacki,
J., & Blasiak, J. (2008). No association between the Arg194Trp and Arg399Gln
polymorphisms of the XRCC1 gene and colorectal cancer risk and progression
in a Polish population. Exp Oncol, 30(3), 253-254.
Sobel, A. (1991). Stathmin: a relay phosphoprotein for multiple signal transduction?
Trends Biochem Sci, 16(8), 301-305.
Sobin, L., Gospodarowicz, M. K., & Wittekind, C. (Eds.). (2009). TNM classification of
malignant tumours (7th ed.). Geneva: Union for International Cancer Control.
Sobin, L. H., & Greene, F. L. (2001). TNM classification: clarification of number of
regional lymph nodes for pNo. Cancer, 92(2), 452.
Sonenberg, N., Hershey, J. W. B., & Mathews, M. B. (Eds.). (2000). Translational
control of gene expression. New York, NY: Cold Spring Harbor Laboratory
Press.
Song, Q. B., Zhu, B. B., Hu, W. G., Cheng, L. M., Gong, H. Y., Xu, B., . . . Miao, X. P.
(2012). A common SMAD7 variant is associated with risk of colorectal cancer:
evidence from a case-control study and a meta-analysis. PLoS One, 7(3), e33318.
Soreide, K. (2007). Genetics and molecular classification of colorectal cancer. Tidsskr
Nor Laegeforen, 127(21), 2818-2823.
Soreide, K., Janssen, E. A., Soiland, H., Korner, H., & Baak, J. P. (2006). Microsatellite
instability in colorectal cancer. Br J Surg, 93(4), 395-406.
Soreide, K., Nedrebo, B. S., Knapp, J. C., Glomsaker, T. B., Soreide, J. A., & Korner, H.
(2009). Evolving molecular classification by genomic and proteomic biomarkers
in colorectal cancer: potential implications for the surgical oncologist. Surg
Oncol, 18(1), 31-50.
Souglakos, J. (2007). Genetic alterations in sporadic and hereditary colorectal cancer:
implementations for screening and follow-up. Dig Dis, 25(1), 9-19.
Sperling, K. (2001). From proteomics to genomics. Electrophoresis, 22(14), 2835-2837.
Spindler, K. L., Nielsen, J. N., Ornskov, D., Brandslund, I., & Jakobsen, A. (2007).
Epidermal growth factor (EGF) A61G polymorphism and EGF gene expression
in normal colon tissue from patients with colorectal cancer. Acta Oncol, 46(8),
1113-1117.
Srikrishna, G. (2012). S100A8 and S100A9: new insights into their roles in malignancy.
J Innate Immun, 4(1), 31-40.

References
288
Srikrishna, G., & Freeze, H. H. (2009). Endogenous damage-associated molecular
pattern molecules at the crossroads of inflammation and cancer. Neoplasia,
11(7), 615-628.
Staging of colorectal cancer. [Art]. In Johns Hopkins Medicine: colorectal cancer.
Retrieved from http://www.hopkinscoloncancercenter.org/CMS/CMS_Page.
aspx?CurrentUDV=59&CMS_Page_ID=EEA2CD91-3276-4123-BEEB-
BAF1984D20C7.
Stewart, B. W., & Kleihues, P. (Eds.). (2003). World cancer report. Lyon: International
Agency for Research on Cancer.
Stewart, M. J., & Denell, R. (1993). Mutations in the Drosophila gene encoding
ribosomal protein S6 cause tissue overgrowth. Mol Cell Biol, 13(4), 2524-2535.
Stossel, T. P., Condeelis, J., Cooley, L., Hartwig, J. H., Noegel, A., Schleicher, M., &
Shapiro, S. S. (2001). Filamins as integrators of cell mechanics and signalling.
Nat Rev Mol Cell Biol, 2(2), 138-145.
Stulík, J., Hernychová, L., Porkertová, S., Knízek, J., Macela, A., Bures, J., . . . Jungblut,
P. R. (2001). Proteome study of colorectal carcinogenesis. Electrophoresis,
22(14), 3019-3025.
Su, A. I., Cooke, M. P., Ching, K. A., Hakak, Y., Walker, J. R., Wiltshire, T., . . .
Hogenesch, J. B. (2002). Large-scale analysis of the human and mouse
transcriptomes. Proc Natl Acad Sci, 99(7), 4465-4470.
Subong, E. N., Shue, M. J., Epstein, J. I., Briggman, J. V., Chan, P. K., & Partin, A. W.
(1999). Monoclonal antibody to prostate cancer nuclear matrix protein (PRO:4-
216) recognises nucleophosmin/B23. Prostate, 39(4), 298-304.
Suchy, J., Klujszo-Grabowska, E., Kladny, J., Cybulski, C., Wokolorczyk, D.,
Szymanska-Pasternak, J., . . . Lubinski, J. (2008). Inflammatory response gene
polymorphisms and their relationship with colorectal cancer risk. BMC Cancer,
8, 112.
Sullivan, K. F., Hechenberger, M., & Masri, K. (1994). Human CENP-A contains a
histone H3 related histone fold domain that is required for targeting to the
centromere. J Cell Biol, 127(3), 581-592.
Sun, J. (2010). Matrix metalloproteinases and tissue inhibitor of metalloproteinases are
essential for the inflammatory response in cancer cells. J Signal Transduct, 2010,
985132.
Sutnar, A., Pesta, M., Liska, V., Treska, V., Skalicky, T., Kormunda, S., . . . Holubec, L.
Jr. (2007). Clinical relevance of the expression of mRNA of MMP-7, MMP-9,
TIMP-1, TIMP-2 and CEA tissue samples from colorectal liver metastases.
Tumour Biol, 28(5), 247-252.
Szebeni, A., & Olson, M. O. (1999). Nucleolar protein B23 has molecular chaperone
activities. Protein Sci, 8(4), 905-912.

References
289
Szeliga, J., Sondka, Z., Jackowski, M., Jarkiewicz-Tretyn, J., Tretyn, A., & Malenczyk,
M. (2008). NOD2/CARD15 polymorphism in patients with rectal cancer. Med
Sci Monit, 14(9), CR480-484.
Takagi, M., Absalon, M. J., McLure, K. G., & Kastan, M. B. (2005). Regulation of p53
translation and induction after DNA damage by ribosomal protein L26 and
nucleolin. Cell, 123(1), 49-63.
Tan, H. T., Wu, W., Ng, Y. Z., Zhang, X., Yan, B., Ong, C. W., . . . Chung, M. C.
(2012). Proteomic analysis of colorectal cancer metastasis: stathmin-1 revealed
as a player in cancer cell migration and prognostic marker. J Proteome Res,
11(2), 1433-1445.
Tan, S. C., & Yiap, B. C. (2009). DNA, RNA, and protein extraction: the past and the
present. J Biomed Biotechnol, 2009, 574398.
Tanaka, M., Sasaki, H., Kino, I., Sugimura, T., & Terada, M. (1992). Genes
preferentially expressed in embryo stomach are predominantly expressed in
gastric cancer. Cancer Res, 52(12), 3372-3377.
Taylor, J. M., Mitchell, W. M., & Cohen, S. (1972). Epidermal growth factor: physical
and chemical properties. J Biol Chem, 247(18), 5928-5934.
ten Dijke, P., & Hill, C. S. (2004). New insights into TGF-β–Smad signalling. Trends
Biochem Sci, 29(5), 265-273.
Tenesa, A., & Dunlop, M. G. (2009). New insights into the aetiology of colorectal
cancer from genome-wide association studies. Nat Rev Genet, 10(6), 353-358.
Tenesa, A., Farrington, S. M., Prendergast, J. G., Porteous, M. E., Walker, M., Haq,
N., . . . Dunlop, M. G. (2008). Genome-wide association scan identifies a
colorectal cancer susceptibility locus on 11q23 and replicates risk loci at 8q24
and 18q21. Nat Genet, 40(5), 631-637.
The large intestine. [Art]. In MedlinePlus. Retrieved from http://www.nlm.nih.gov/
medlineplus/ency/imagepages/8832.htm.
Thibodeau, S. N., Bren, G., & Schaid, D. (1993). Microsatellite instability in cancer of
the proximal colon. Science, 260(5109), 816-819.
Thirunavukarasu, P., Sathaiah, M., Singla, S., Sukumar, S., Karunamurthy, A.,
Pragatheeshwar, K. D., . . . Bartlett, D. L. (2010). Medullary carcinoma of the
large intestine: a population based analysis. Int J Oncol, 37(4), 901-907.
Thompson, C. L., Plummer, S. J., Acheson, L. S., Tucker, T. C., Casey, G., & Li, L.
(2009). Association of common genetic variants in SMAD7 and risk of colon
cancer. Carcinogenesis, 30(6), 982-986.
Thompson, L. H., & West, M. G. (2000). XRCC1 keeps DNA from getting stranded.
Mutat Res, 459(1), 1-18.
Thompson, M. R. (2002). ACPGBI referral guidelines for colorectal cancer. Colorectal
Dis, 4(4), 287-297.

References
290
Tian, Y., Li, Y., Hu, Z., Wang, D., Sun, X., & Ren, C. (2010). Differential effects of
NOD2 polymorphisms on colorectal cancer risk: a meta-analysis. Int J
Colorectal Dis, 25(2), 161-168.
Tlsty, T. D., & Coussens, L. M. (2006). Tumour stroma and regulation of cancer
development. Annu Rev Pathol, 1(1), 119-150.
Toi, M., Matsumoto, T., & Bando, H. (2001). Vascular endothelial growth factor: its
prognostic, predictive, and therapeutic implications. Lancet Oncol, 2(11), 667-
673.
Tokunaga, T., Oshika, Y., Abe, Y., Ozeki, Y., Sadahiro, S., Kijima, H., . . . Nakamura,
M. (1998). Vascular endothelial growth factor (VEGF) mRNA isoform
expression pattern is correlated with liver metastasis and poor prognosis in colon
cancer. Br J Cancer, 77(6), 998-1002.
Tokuoka, M., Ishii, H., Mimori, K., Inoue, H., Doki, Y., & Mori, M. (2009). Genetic
susceptibility to gastrointestinal cancer: minireview of the genomewide studies.
Ann Surg Oncol, 16(7), 1783-1788.
Toma, J., Paszat, L. F., Gunraj, N., & Rabeneck, L. (2008). Rates of new or missed
colorectal cancer after barium enema and their risk factors: a population-based
study. Am J Gastroenterol, 103(12), 3142-3148.
Tomita, T., & Iwata, K. (1996). Matrix metalloproteinases and tissue inhibitors of
metalloproteinases in colonic adenomas-adenocarcinomas. Dis Colon Rectum,
39(11), 1255-1264.
Tomlinson, I. P., Houlston, R. S., Montgomery, G. W., Sieber, O. M., & Dunlop, M. G.
(2012). Investigation of the effects of DNA repair gene polymorphisms on the
risk of colorectal cancer. Mutagenesis, 27(2), 219-223.
Tomlinson, I. P., Webb, E., Carvajal-Carmona, L., Broderick, P., Howarth, K., Pittman,
A. M., . . . Houlston, R. S. (2008). A genome-wide association study identifies
colorectal cancer susceptibility loci on chromosomes 10p14 and 8q23.3. Nat
Genet, 40(5), 623-630.
Tomonaga, T., Matsushita, K., Ishibashi, M., Nezu, M., Shimada, H., Ochiai, T., . . .
Nomura, F. (2005). Centromere protein H is up-regulated in primary human
colorectal cancer and its overexpression induces aneuploidy. Cancer Res, 65(11),
4683-4689.
Tomonaga, T., Matsushita, K., Yamaguchi, S., Oh-Ishi, M., Kodera, Y., Maeda, T., . . .
Nomura, F. (2004). Identification of altered protein expression and post-
translational modifications in primary colorectal cancer by using agarose two-
dimensional gel electrophoresis. Clin Cancer Res, 10(6), 2007-2014.
Tomonaga, T., Matsushita, K., Yamaguchi, S., Oohashi, T., Shimada, H., Ochiai, T., . . .
Nomura, F. (2003). Overexpression and mistargeting of centromere protein-A in
human primary colorectal cancer. Cancer Res, 63(13), 3511-3516.
Toyota, M., Ahuja, N., Ohe-Toyota, M., Herman, J. G., Baylin, S. B., & Issa, J. P. J.
(1999). CpG island methylator phenotype in colorectal cancer. Proc Natl Acad
Sci, 96(15), 8681-8686.

References
291
Treanor, D., & Quirke, P. (2007). Pathology of colorectal cancer. Clin Oncol (R Coll
Radiol), 19(10), 769-776.
Tsai, Y. P., Yang, M. H., Huang, C. H., Chang, S. Y., Chen, P. M., Liu, C. J., . . . Wu, K.
J. (2009). Interaction between HSP60 and beta-catenin promotes metastasis.
Carcinogenesis, 30(6), 1049-1057.
Tsuchiya, Y., Sato, H., Endo, Y., Okada, Y., Mai, M., Sasaki, T., & Seiki, M. (1993).
Tissue inhibitor of metalloproteinase 1 is a negative regulator of the metastatic
ability of a human gastric cancer cell line, KKLS, in the chick embryo. Cancer
Res, 53(6), 1397-1402.
Tsui, K. H., Cheng, A. J., Chang, P. L., Pan, T. L., & Yung, B. Y. (2004). Association
of nucleophosmin/B23 mRNA expression with clinical outcome in patients with
bladder carcinoma. Urology, 64(4), 839-844.
Turovskaya, O., Foell, D., Sinha, P., Vogl, T., Newlin, R., Nayak, J., . . . Srikrishna, G.
(2008). RAGE, carboxylated glycans and S100A8/A9 play essential roles in
colitis-associated carcinogenesis. Carcinogenesis, 29(10), 2035-2043.
Tuupanen, S., Alhopuro, P., Mecklin, J. P., Jarvinen, H., & Aaltonen, L. A. (2007). No
evidence for association of NOD2 R702W and G908R with colorectal cancer.
Int J Cancer, 121(1), 76-79.
Tyers, M., & Mann, M. (2003). From genomics to proteomics. Nature, 422(6928), 193-
197.
Uehara, A., Fujimoto, Y., Fukase, K., & Takada, H. (2007). Various human epithelial
cells express functional Toll-like receptors, NOD1 and NOD2 to produce anti-
microbial peptides, but not proinflammatory cytokines. Mol Immunol, 44(12),
3100-3111.
Upender, M. B., Habermann, J. K., McShane, L. M., Korn, E. L., Barrett, J. C.,
Difilippantonio, M. J., & Ried, T. (2004). Chromosome transfer induced
aneuploidy results in complex dysregulation of the cellular transcriptome in
immortalised and cancer cells. Cancer Res, 64(19), 6941-6949.
Vaarala, M. H., Porvari, K. S., Kyllönen, A. P., Mustonen, M. V., Lukkarinen, O., &
Vihko, P. T. (1998). Several genes encoding ribosomal proteins are over-
expressed in prostate-cancer cell lines: confirmation of L7a and L37 over-
expression in prostate-cancer tissue samples. Int J Cancer, 78(1), 27-32.
Van Rijnsoever, M., Elsaleh, H., Joseph, D., McCaul, K., & Iacopetta, B. (2003). CpG
island methylator phenotype is an independent predictor of survival benefit from
5-fluorouracil in stage III colorectal cancer. Clin Cancer Res, 9(8), 2898-2903.
Vasen, H. F., Mecklin, J. P., Khan, P. M., & Lynch, H. T. (1991). The International
Collaborative Group on hereditary non-polyposis colorectal cancer (ICG-
HNPCC). Dis Colon Rectum, 34(5), 424-425.
Vasen, H. F., Watson, P., Mecklin, J. P., & Lynch, H. T. (1999). New clinical criteria
for hereditary nonpolyposis colorectal cancer (HNPCC, Lynch syndrome)
proposed by the International Collaborative Group on HNPCC.
Gastroenterology, 116(6), 1453-1456.

References
292
Vatn, M. H., & Stalsberg, H. (1982). The prevalence of polyps of the large intestine in
Oslo: an autopsy study. Cancer, 49(4), 819-825.
Veale, A. M. (1965). Intestinal polyposis. Cambridge: Cambridge University Press.
Veikkola, T., & Alitalo, K. (1999). VEGFs, receptors and angiogenesis. Semin Cancer
Biol, 9(3), 211-220.
Venter, J. C., Adams, M. D., Myers, E. W., Li, P. W., Mural, R. J., Sutton, G. G., . . .
Zhu, X. (2001). The sequence of the human genome. Science, 291(5507), 1304-
1351.
Vermeire, S., Wild, G., Kocher, K., Cousineau, J., Dufresne, L., Bitton, A., . . . Rioux, J.
D. (2002). CARD15 genetic variation in a Quebec population: prevalence,
genotype-phenotype relationship, and haplotype structure. Am J Hum Genet,
71(1), 74-83.
Vidal, A. E., Boiteux, S., Hickson, I. D., & Radicella, J. P. (2001). XRCC1 coordinates
the initial and late stages of DNA abasic site repair through protein-protein
interactions. EMBO J, 20(22), 6530-6539.
Vincenti, V., Cassano, C., Rocchi, M., & Persico, G. (1996). Assignment of the vascular
endothelial growth factor gene to human chromosome 6p21.3. Circulation,
93(8), 1493-1495.
Vishnoi, M., Pandey, S. N., Modi, D. R., Kumar, A., & Mittal, B. (2008). Genetic
susceptibility of epidermal growth factor +61A>G and transforming growth
factor beta 1 -509C>T gene polymorphisms with gallbladder cancer. Hum
Immunol, 69(6), 360-367.
Vogelstein, B., Fearon, E. R., Hamilton, S. R., Kern, S. E., Preisinger, A. C., Leppert,
M., . . . Bos, J. L. (1988). Genetic alterations during colorectal-tumour
development. N Engl J Med, 319(9), 525-532.
Volkmann, N., Amann, K. J., Stoilova-McPhie, S., Egile, C., Winter, D. C., Hazelwood,
L., . . . Hanein, D. (2001). Structure of Arp2/3 complex in its activated state and
in actin filament branch junctions. Science, 293(5539), 2456-2459.
von Holst, S., Picelli, S., Edler, D., Lenander, C., Dalen, J., Hjern, F., . . . Lindblom, A.
(2010). Association studies on 11 published colorectal cancer risk loci. Br J
Cancer, 103(4), 575-580.
Wadlow, R., & Ramaswamy, S. (2005). DNA microarrays in clinical cancer research.
Curr Mol Med, 5(1), 111-120.
Walther, A., Houlston, R., & Tomlinson, I. (2008). Association between chromosomal
instability and prognosis in colorectal cancer: a meta-analysis. Gut, 57(7), 941-
950.
Walther, A., Johnstone, E., Swanton, C., Midgley, R., Tomlinson, I., & Kerr, D. (2009).
Genetic prognostic and predictive markers in colorectal cancer. Nat Rev Cancer,
9(7), 489-499.

References
293
Wang, B., Wang, D., Huang, G., Zhang, C., Xu, D. H., & Zhou, W. (2010). XRCC1
polymorphisms and risk of colorectal cancer: a meta-analysis. Int J Colorectal
Dis, 25(3), 313-321.
Wang, D., Baumann, A., Szebeni, A., & Olson, M. O. (1994). The nucleic acid binding
activity of nucleolar protein B23.1 resides in its carboxyl-terminal end. J Biol
Chem, 269(49), 30994-30998.
Wang, D., Hu, Y., Gong, H., Li, J., Ren, Y., Li, G., & Liu, A. (2012). Genetic
polymorphisms in the DNA repair gene XRCC1 and susceptibility to glioma in a
Han population in northeastern China: a case-control study. Gene, 509(2), 223-
227.
Wang, D., Umekawa, H., & Olson, M. O. (1993). Expression and subcellular locations
of two forms of nucleolar protein B23 in rat tissues and cells. Cell Mol Biol Res,
39(1), 33-42.
Wang, J. J., Liu, Y., Zheng, Y., Lin, F., Cai, G. F., & Yao, X. Q. (2012a). Comparative
proteomics analysis of colorectal cancer. Asian Pac J Cancer Prev, 13(4), 1663-
1666.
Wang, Q., Yang, C., Zhou, J., Wang, X., Wu, M., & Liu, Z. (2001). Cloning and
characterisation of full-length human ribosomal protein L15 cDNA which was
overexpressed in esophageal cancer. Gene, 263(1–2), 205-209.
Wang, W., Goswami, S., Lapidus, K., Wells, A. L., Wyckoff, J. B., Sahai, E., . . .
Condeelis, J. S. (2004). Identification and testing of a gene expression signature
of invasive carcinoma cells within primary mammary tumours. Cancer Res,
64(23), 8585-8594.
Wang, W., Goswami, S., Sahai, E., Wyckoff, J. B., Segall, J. E., & Condeelis, J. S.
(2005). Tumour cells caught in the act of invading: their strategy for enhanced
cell motility. Trends Cell Biol, 15(3), 138-145.
Watson, C. J., Webb, N. J., Bottomley, M. J., & Brenchley, P. E. (2000). Identification
of polymorphisms within the vascular endothelial growth factor (VEGF) gene:
correlation with variation in VEGF protein production. Cytokine, 12(8), 1232-
1235.
Watson, K. L., Konrad, K. D., Woods, D. F., & Bryant, P. J. (1992). Drosophila
homolog of the human S6 ribosomal protein is required for tumour suppression
in the hematopoietic system. Proc Natl Acad Sci, 89(23), 11302-11306.
Watson, P., Vasen, H. F., Mecklin, J. P., Bernstein, I., Aarnio, M., Jarvinen, H. J., . . .
Lynch, H. T. (2008). The risk of extra-colonic, extra-endometrial cancer in the
Lynch syndrome. Int J Cancer, 123(2), 444-449.
Weitz, J., Koch, M., Debus, J., Höhler, T., Galle, P. R., & Büchler, M. W. (2005).
Colorectal cancer. Lancet, 365(9454), 153-165.
Welch, M. D. (1999). The world according to Arp: regulation of actin nucleation by the
Arp2/3 complex. Trends Cell Biol, 9(11), 423-427.

References
294
Wen, Y. Y., Pan, X. F., Loh, M., Tian, Z., Yang, S. J., Lv, S. H., . . . Yang, C. X. (2012).
ADPRT Val762Ala and XRCC1 Arg194Trp polymorphisms and risk of gastric
cancer in Sichuan of China. Asian Pac J Cancer Prev, 13(5), 2139-2144.
Werner, T. (2004). Proteomics and regulomics: the yin and yang of functional genomics.
Mass Spectrom Rev, 23(1), 25-33.
Whitehouse, C. J., Taylor, R. M., Thistlethwaite, A., Zhang, H., Karimi-Busheri, F.,
Lasko, D. D., . . . Caldecott, K. W. (2001). XRCC1 stimulates human
polynucleotide kinase activity at damaged DNA termini and accelerates DNA
single-strand break repair. Cell, 104(1), 107-117.
Wilson, D. M. 3rd., & Bohr, V. A. (2007). The mechanics of base excision repair, and
its relationship to aging and disease. DNA Repair (Amst), 6(4), 544-559.
Winawer, S. J. (2007). The multidisciplinary management of gastrointestinal cancer.
Colorectal cancer screening. Best Pract Res Clin Gastroenterol, 21(6), 1031-
1048.
Winawer, S. J., Fletcher, R. H., Miller, L., Godlee, F., Stolar, M. H., Mulrow, C. D., . . .
Mayer, R. J. (1997). Colorectal cancer screening: clinical guidelines and
rationale. Gastroenterology, 112(2), 594-642.
Winawer, S. J., Zauber, A. G., Ho, M. N., O'Brien, M. J., Gottlieb, L. S., Sternberg, S.
S., . . . National Polyp Study Workgroup. (1993). Prevention of colorectal cancer
by colonoscopic polypectomy. N Engl J Med, 329(27), 1977-1981.
Winawer, S., Fletcher, R., Rex, D., Bond, J., Burt, R., Ferrucci, J., . . . Gastrointestinal
Consortium Panel. (2003). Colorectal cancer screening and surveillance: clinical
guidelines and rationale—update based on new evidence. Gastroenterology,
124(2), 544-560.
Witsch, E., Sela, M., & Yarden, Y. (2010). Roles for growth factors in cancer
progression. Physiology (Bethesda), 25(2), 85-101.
Wittekind, C., Henson, D. E., Hutter, R. V., & Sobin, L. H. (2001). TNM supplement: a
commentary on uniform use (2nd ed.). New York, NY: Wiley-Liss.
Wong, J. J., Hawkins, N. J., & Ward, R. L. (2007). Colorectal cancer: a model for
epigenetic tumourigenesis. Gut, 56(1), 140-148.
Wool, I. G. (1996). Extraribosomal functions of ribosomal proteins. Trends Biochem Sci,
21(5), 164-165.
World Gastroenterology Organisation. (2007). Practice guidelines: colorectal cancer
screening. Paris: Author.
World Health Organisation. (2002). National cancer control programmes: policies and
managerial guidelines (2nd ed.). Geneva: Author.
World Health Organisation. (2008). The global burden of disease: 2004 update. Geneva:
Author.

References
295
World Health Organisation. (2011). Global status report on noncommunicable diseases
2010. Geneva: Author.
World Health Organisation. (2011a). Western Pacific country health information
profiles: 2011 revision. Geneva: Author.
Worthley, D. L., Whitehall, V. L., Spring, K. J., & Leggett, B. A. (2007). Colorectal
carcinogenesis: road maps to cancer. World J Gastroenterol, 13(28), 3784-3791.
Wu, G. Y., Hasenberg, T., Magdeburg, R., Bonninghoff, R., Sturm, J. W., & Keese, M.
(2009). Association between EGF, TGF-beta 1, VEGF gene polymorphism and
colorectal cancer. World J Surg, 33(1), 124-129.
Xie, J., & Itzkowitz, S. H. (2008). Cancer in inflammatory bowel disease. World J
Gastroenterol, 14(3), 378-389.
Xing, X., Lai, M., Gartner, W., Xu, E., Huang, Q., Li, H., Chen, G. (2006).
Identification of differentially expressed proteins in colorectal cancer by
proteomics: down-regulation of secretagogin. Proteomics, 6(9), 2916-2923.
Xiong, F., Wu, C., Bi, X., Yu, D., Huang, L., Xu, J., . . . Lin, D. (2010). Risk of
genome-wide association study-identified genetic variants for colorectal cancer
in a Chinese population. Cancer Epidemiol Biomarkers Prev, 19(7), 1855-1861.
Xu, B., Li, J. M., Tong, N., Tao, J., Li, P. C., Song, N. H., . . . Hua, L. X. (2010a).
VEGFA +936C>T polymorphism and cancer risk: a meta-analysis. Cancer
Genet Cytogenet, 198(1), 7-14.
Xu, W., Li, Y., Wang, X., Chen, B., Liu, S., Wang, Y., . . . Wu, J. (2010). Association
between EGF promoter polymorphisms and cancer risk: a meta-analysis. Med
Oncol, 27(4), 1389-1397.
Xue, H., Ni, P., Lin, B., Xu, H., & Huang, G. (2011). X-ray repair cross-complementing
group 1 (XRCC1) genetic polymorphisms and gastric cancer risk: a HuGE
review and meta-analysis. Am J Epidemiol, 173(4), 363-375.
Yamaguchi, H., Wyckoff, J., & Condeelis, J. (2005). Cell migration in tumours. Curr
Opin Cell Biol, 17(5), 559-564.
Yang, L. (2010). TGFbeta and cancer metastasis: an inflammation link. Cancer
Metastasis Rev, 29(2), 263-271.
Yapijakis, C., Vairaktaris, E., Vassiliou, S., Vylliotis, A., Nkenke, E., Nixon, A. M., . . .
Patsouris, E. (2007). The low VEGF production allele of the +936C/T
polymorphism is strongly associated with increased risk for oral cancer. J
Cancer Res Clin Oncol, 133(10), 787-791.
Yarden, Y., & Schlessinger, J. (1987). Epidermal growth factor induces rapid,
reversible aggregation of the purified epidermal growth factor receptor.
Biochemistry, 26(5), 1443-1451.

References
296
Yeager, M., Xiao, N., Hayes, R. B., Bouffard, P., Desany, B., Burdett, L., . . . Chanock,
S. J. (2008). Comprehensive resequence analysis of a 136 kb region of human
chromosome 8q24 associated with prostate and colon cancers. Hum Genet,
124(2), 161-170.
Yeatman, T. J. (2003). The future of cancer management: translating the genome,
transcriptome, and proteome. Ann Surg Oncol, 10(1), 7-14.
Young, J. L. Jr., Roffers, S. D., Ries, L. A. G., Fritz, A. G., & Hurlbut, A. A. (Eds.).
(2001). SEER summary staging manual – 2000: codes and coding instructions.
Bethesda, MD: National Cancer Institute.
Yu, X. F., & Weng, M. W. (2011). Association between epidermal growth factor (EGF)
G61A polymorphism and the susceptibility as well as clinicopathological
characteristics of colorectal cancer. J Med Res, 2011(3), 92-94.
Yuen, K. W., Montpetit, B., & Hieter, P. (2005). The kinetochore and cancer: what's the
connection? Curr Opin Cell Biol, 17(6), 576-582.
Yun, J. P., Miao, J., Chen, G. G., Tian, Q. H., Zhang, C. Q., Xiang, J., . . . Lai, P. B. S.
(2007). Increased expression of nucleophosmin/B23 in hepatocellular carcinoma
and correlation with clinicopathological parameters. Br J Cancer, 96(3), 477-
484.
Yung, B. Y. M., Busch, H., & Chan, P. K. (1985). Translocation of nucleolar
phosphoprotein B23 (37kDa/pI 5.1) induced by selective inhibitors of ribosome
synthesis. Biochim Biophys Acta, 826(4), 167-173.
Zanke, B. W., Greenwood, C. M., Rangrej, J., Kustra, R., Tenesa, A., Farrington, S.
M., . . . Dunlop, M. G. (2007). Genome-wide association scan identifies a
colorectal cancer susceptibility locus on chromosome 8q24. Nat Genet, 39(8),
989-994.
Zeng, F. R., Ling, Y., Yang, J., Tian, X. C., Yang, X., & Luo, R. C. (2013). X-ray repair
cross-complementing group 1 Arg399Gln gene polymorphism and susceptibility
to colorectal cancer: a meta-analysis. Tumour Biol, 34(1), 555-563.
Zeng, Z. S., Cohen, A. M., Zhang, Z. F., Stetler-Stevenson, W., & Guillem, J. G. (1995).
Elevated tissue inhibitor of metalloproteinase 1 RNA in colorectal cancer stroma
correlates with lymph node and distant metastases. Clin Cancer Res, 1(8), 899-
906.
Zhang, K., Zhou, B., Wang, Y., Rao, L., & Zhang, L. (2012). The XRCC1 Arg280His
polymorphism contributes to cancer susceptibility: an update by meta-analysis
of 53 individual studies. Gene, 510(2), 93-101.
Zhang, Y. (2004). The ARF-B23 connection: implications for growth control and
cancer treatment. Cell Cycle, 3(3), 259-262.
Zheng, P., Liu, Y. X., Chen, L., Liu, X. H., Xiao, Z. Q., Zhao, L., . . . Li, J. M. (2010).
Stathmin, a new target of PRL-3 identified by proteomic methods, plays a key
role in progression and metastasis of colorectal cancer. J Proteome Res, 9(10),
4897-4905.

References
297
Zlobec, I., & Lugli, A. (2008). Prognostic and predictive factors in colorectal cancer. J
Clin Pathol, 61(5), 561-569.
Zumsteg, A., & Christofori, G. (2009). Corrupt policemen: inflammatory cells promote
tumour angiogenesis. Curr Opin Oncol, 21(1), 60-70.

Supplementary
298
List of Publications and Papers Presented
Publications
i) Tze Pheng Lau, April Camilla Roslani, Lay Hoong Lian, Ping Chin Lee, Ida
Hilmi, Khean Lee Goh, Kek Heng Chua (2013) Association between the EGF,
VEGF functional polymorphisms and sporadic colorectal cancer in the
Malaysian population. Genetics and Molecular Research. (Accepted for
publication)
ii) Tze Pheng Lau, April Camilla Roslani, Lay Hoong Lian, Ping Chin Lee, Ida
Hilmi, Khean Lee Goh, Kek Heng Chua (2013) NOD2/CARD15 variants in
Malaysian patients with sporadic colorectal cancer. Genetics and Molecular
Research. (Accepted for publication)
iii) Tze Pheng Lau, April Camilla Roslani, Lay Hoong Lian, Ping Chin Lee, Ida
Hilmi, Khean Lee Goh, Kek Heng Chua (2013) Distinctive gene expression
signatures for early and advanced stage sporadic colorectal adenocarcinomas in
Malaysian patient cohort. BMJ Open. (Under review)
Poster Presentations
i) “Identification of differentially expressed genes in early stage sporadic
colorectal cancer” at 1st National Postgraduate Conference in Molecular
Medicine 2011. – Appendix A
ii) “Gene expression signatures for early and advanced stage CRC” at
Coloproctology 2012. – Appendix B
Award
i) “Gene expression signatures for early and advanced stage CRC” – 1st Prize in
the Best Poster Award at Coloproctology 2012. – Appendix B

Supplementary
299
Appendices

Supplementary
300
Appendix A

Supplementary
301
Appendix B