genome-wide evidence for speciation with gene flow in … et al. 2013.pdf · research genome-wide...
TRANSCRIPT

10.1101/gr.159426.113Access the most recent version at doi:2013 23: 1817-1828 originally published online September 17, 2013Genome Res.
Simon H. Martin, Kanchon K. Dasmahapatra, Nicola J. Nadeau, et al. butterflies
HeliconiusGenome-wide evidence for speciation with gene flow in
Material
Supplemental
http://genome.cshlp.org/content/suppl/2013/09/17/gr.159426.113.DC1.html
References
http://genome.cshlp.org/content/23/11/1817.full.html#ref-list-1
This article cites 62 articles, 18 of which can be accessed free at:
License
Commons Creative
.http://creativecommons.org/licenses/by-nc/3.0/described at
a Creative Commons License (Attribution-NonCommercial 3.0 Unported), as ). After six months, it is available underhttp://genome.cshlp.org/site/misc/terms.xhtml
first six months after the full-issue publication date (see This article is distributed exclusively by Cold Spring Harbor Laboratory Press for the
ServiceEmail Alerting
click here.top right corner of the article or
Receive free email alerts when new articles cite this article - sign up in the box at the
http://genome.cshlp.org/subscriptionsgo to: Genome Research To subscribe to
© 2013 Martin et al.; Published by Cold Spring Harbor Laboratory Press
Cold Spring Harbor Laboratory Press on November 7, 2013 - Published by genome.cshlp.orgDownloaded from Cold Spring Harbor Laboratory Press on November 7, 2013 - Published by genome.cshlp.orgDownloaded from Cold Spring Harbor Laboratory Press on November 7, 2013 - Published by genome.cshlp.orgDownloaded from Cold Spring Harbor Laboratory Press on November 7, 2013 - Published by genome.cshlp.orgDownloaded from Cold Spring Harbor Laboratory Press on November 7, 2013 - Published by genome.cshlp.orgDownloaded from Cold Spring Harbor Laboratory Press on November 7, 2013 - Published by genome.cshlp.orgDownloaded from Cold Spring Harbor Laboratory Press on November 7, 2013 - Published by genome.cshlp.orgDownloaded from Cold Spring Harbor Laboratory Press on November 7, 2013 - Published by genome.cshlp.orgDownloaded from Cold Spring Harbor Laboratory Press on November 7, 2013 - Published by genome.cshlp.orgDownloaded from Cold Spring Harbor Laboratory Press on November 7, 2013 - Published by genome.cshlp.orgDownloaded from Cold Spring Harbor Laboratory Press on November 7, 2013 - Published by genome.cshlp.orgDownloaded from Cold Spring Harbor Laboratory Press on November 7, 2013 - Published by genome.cshlp.orgDownloaded from Cold Spring Harbor Laboratory Press on November 7, 2013 - Published by genome.cshlp.orgDownloaded from
Research
Genome-wide evidence for speciation with gene flowin Heliconius butterfliesSimon H. Martin,1,8 Kanchon K. Dasmahapatra,2,3 Nicola J. Nadeau,1 Camilo Salazar,4
James R. Walters,5 Fraser Simpson,2 Mark Blaxter,6 Andrea Manica,1 James Mallet,2,7
and Chris D. Jiggins1
1Department of Zoology, University of Cambridge, Cambridge CB2 3EJ, United Kingdom; 2Department of Genetics, Evolution
and Environment, University College London, London WC1E 6BT, United Kingdom; 3Department of Biology, University of York,
York YO10 5DD, United Kingdom; 4Facultad de Ciencias Naturales y Matematicas, Universidad del Rosario, Bogota DC, Colombia;5Department of Biology, Stanford University, Stanford, California 94305, USA; 6Institute of Evolutionary Biology, The University
of Edinburgh, Edinburgh EH9 3JT, United Kingdom; 7Department of Organismic and Evolutionary Biology, Harvard University,
Cambridge, Massachusetts 02138, USA
Most speciation events probably occur gradually, without complete and immediate reproductive isolation, but the fullextent of gene flow between diverging species has rarely been characterized on a genome-wide scale. Documenting theextent and timing of admixture between diverging species can clarify the role of geographic isolation in speciation. Herewe use new methodology to quantify admixture at different stages of divergence in Heliconius butterflies, based on whole-genome sequences of 31 individuals. Comparisons between sympatric and allopatric populations of H. melpomene, H. cydno,and H. timareta revealed a genome-wide trend of increased shared variation in sympatry, indicative of pervasive interspecificgene flow. Up to 40% of 100-kb genomic windows clustered by geography rather than by species, demonstrating thata very substantial fraction of the genome has been shared between sympatric species. Analyses of genetic variation sharedover different time intervals suggested that admixture between these species has continued since early in speciation. Allelesshared between species during recent time intervals displayed higher levels of linkage disequilibrium than those sharedover longer time intervals, suggesting that this admixture took place at multiple points during divergence and is probablyongoing. The signal of admixture was significantly reduced around loci controlling divergent wing patterns, as well asthroughout the Z chromosome, consistent with strong selection for Mullerian mimicry and with known Z-linked hybridincompatibility. Overall these results show that species divergence can occur in the face of persistent and genome-wideadmixture over long periods of time.
[Supplemental material is available for this article.]
Ongoing hybridization between closely related species appears to
be common in nature (Mallet 2005; Rieseberg 2009) and theoret-
ical work has demonstrated a diversity of scenarios whereby species
can emerge without complete geographical isolation (Kirkpatrick
and Ravigne 2002; Gavrilets 2004; van Doorn et al. 2009). Despite
widespread interest in these scenarios, there remains little consen-
sus among speciation biologists regarding the extent to which on-
going gene flow actually plays a role during speciation. This is partly
because it is challenging to reconstruct ancestral ranges and
therefore almost impossible to know for sure the extent of histor-
ical contact between species. Fortunately, genomic approaches are
now beginning to allow us to address these long-standing ques-
tions from a different angle, by documenting the extent of ad-
mixture between species on a genome-wide scale (Kulathinal et al.
2009; Ellegren et al. 2012; Garrigan et al. 2012; The Heliconius
Genome Consortium 2012; Nosil et al. 2012). Speciation genomics
therefore offers an opportunity to address long-standing questions
regarding the extent to which divergence and speciation occurs in
the face of ongoing gene flow.
One prediction of models of speciation with gene flow is that
the level of divergence should be heterogeneous across the ge-
nome. Some loci are likely to be shared between incipient species,
while selection maintains divergence at others (Turner et al. 2005;
Nosil et al. 2009). Recently, considerable progress has been made in
documenting patterns of genomic divergence between incipient
species (Hohenlohe et al. 2010; Lawniczak et al. 2010; Michel et al.
2010; Ellegren et al. 2012; Nosil et al. 2012; Gagnaire et al. 2013).
Genome-wide studies of threespine sticklebacks (Hohenlohe et al.
2010, 2012) and Ficedula flycatchers (Ellegren et al. 2012) revealed
patterns of divergence consistent with a model of ‘‘islands’’ of di-
vergence amidst a sea of gene flow. In contrast, analyses of
Anopheles gambiae subspecies (Lawniczak et al. 2010) and Rhagoletis
host races (Michel et al. 2010) reported widespread divergence
throughout the genome. One problem is that patterns of diver-
gence are typically noisy, reflecting the complex interactions of
selection, drift, migration, recombination, mutation, and ancestral
polymorphism, all of which can lead to heterogeneity in divergence
� 2013 Martin et al. This article is distributed exclusively by Cold SpringHarbor Laboratory Press for the first six months after the full-issue publicationdate (see http://genome.cshlp.org/site/misc/terms.xhtml). After six months, itis available under a Creative Commons License (Attribution-NonCommercial3.0 Unported), as described at http://creativecommons.org/licenses/by-nc/3.0/.
8Corresponding authorE-mail [email protected] published online before print. Article, supplemental material, and pub-lication date are at http://www.genome.org/cgi/doi/10.1101/gr.159426.113.
23:1817–1828 Published by Cold Spring Harbor Laboratory Press; ISSN 1088-9051/13; www.genome.org Genome Research 1817www.genome.org
(Noor and Bennett 2009; Michel et al. 2010; Nadeau et al. 2012). A
key challenge is therefore to distinguish the signal of gene flow
from background noise.
Analyses of genomic divergence therefore need to be com-
plemented with more sensitive tests for gene flow between pop-
ulations (Kulathinal et al. 2009; Ellegren et al. 2012; Garrigan et al.
2012; The Heliconius Genome Consortium 2012; Nosil et al. 2012).
A widely used approach is to fit coalescent models (Pinho and Hey
2010), but this can be computationally prohibitive for genomic
data sets and requires strong assumptions about population pa-
rameters. A simpler method is to compare the extent of shared
variation between sympatric and allopatric populations (Grant
et al. 2005). Recent gene flow should result in reduced differenti-
ation and an excess of shared variation between sympatric pop-
ulations compared with allopatric populations. This logic has been
applied on a genomic scale to test for gene flow in Drosophila
(Kulathinal et al. 2009) and hominids (Green et al. 2010). However,
this approach does not account for the age of shared variation,
such that recent admixture may be confounded with ancestral
geographic structure (Green et al. 2010; Durand et al. 2011;
Eriksson and Manica 2012). It is therefore best used in combina-
tion with other methods that can distinguish recent gene flow
from ancient shared variation.
In this paper, we focus on the closely related neotropical
butterfly species Heliconius melpomene, Heliconius cydno, and Heli-
conius timareta (Fig. 1). These species are distasteful to predators
and often involved in Mullerian mimicry with other species. All
three comprise multiple distinct wing pattern races that have been
considered as an early stage in speciation ( Jiggins 2008). Indeed
there is strong evidence that selection for Mullerian mimicry can
lead to wing pattern divergence and assortative mating without
the need for geographic separation (Chamberlain et al. 2009).
Heliconius cydno and H. timareta together form a clade that is sister
to H. melpomene, estimated about two million years divergent (Bull
et al. 2006; Salazar et al. 2008). Heliconius melpomene and H. cydno
have distinct wing patterns and other ecological differences, and
display strong assortative mating (Merrill et al. 2011a). Hybrids
occur at low frequency (<1/1000) (Mallet et al. 2007), and are fe-
male-sterile (Naisbit et al. 2002), as well as being preferentially
attacked by predators due to their non-mimetic wing patterns
(Merrill et al. 2012). Unlike H. cydno, several H. timareta races have
H. melpomene-like patterns (Giraldo et al. 2008; Merot et al. 2013)
and similarly show differences in host plant use and mating pref-
erences (Giraldo et al. 2008). Recent genomic studies have begun
to dissect the genetic variation underlying color pattern diversity
in this genus (The Heliconius Genome Consortium 2012; Nadeau
et al. 2012; Supple et al. 2013). One important insight is that the
shared color patterns between H. melpomene and H. timareta appear
to have resulted from introgression (The Heliconius Genome
Consortium 2012; Pardo-Diaz et al. 2012). There is also evidence
for exchange of other loci between H. melpomene and the H. cydno/
timareta clade (Bull et al. 2006; Kronforst et al. 2006; The Heliconius
Genome Consortium 2012; Pardo-Diaz et al. 2012; Nadeau et al.
2013). RAD-tag analyses of Peruvian races of H. melpomene and
H. timareta suggest that at least ;2%–5% of the genome is admixed
(The Heliconius Genome Consortium 2012). The recent comple-
tion of the H. melpomene genome now allows investigation of ge-
nome-wide patterns of divergence and gene flow within and be-
tween these species.
Here we take advantage of the geographic distribution of
H. melpomene, with some populations many thousands of kilome-
ters from the current range of the H. cydno/timareta clade (Fig. 1),
and carry out a much more powerful genome-wide test for gene flow
than was possible with the sequenced fragments hitherto studied.
We analyzed 31 resequenced individuals (30 of which were newly
sequenced in this study) from replicate sympatric species pairs of the
two clades in Peru, where they are convergent in wing pattern, and
Panama, where they are divergent. We also sampled an allopatric
H. melpomene population from French Guiana (Fig. 1). Four species
of the silvaniform clade of Heliconius were included as outgroups.
Our new methods allowed us to investigate the extent and time
course of genomic admixture, both before speciation and during
different time periods after speciation.
Results
Phylogenomic analysis
Five populations of H. melpomene, one population of H. cydno, one
population of H. timareta, and four outgroup species were se-
quenced (Fig. 1; Supplemental Table S1). Populations were repre-
sented by four wild-caught individuals (eight haploid genomes)
except H. m. melpomene from Panama, for which three individuals
were sampled (Supplemental Table S1). All individuals were wild-
caught except for H. m. melpomene specimen no. 1, which was from
the inbred reference genome strain. Whole-genome shotgun se-
quencing using the Illumina GA IIx and HiSeq 2000 technology
gave an average coverage per individual of 15–623 (Supplemental
Table S1). Sequences were aligned to the H. melpomene reference
genome (The Heliconius Genome Consortium 2012) (version 1.1),
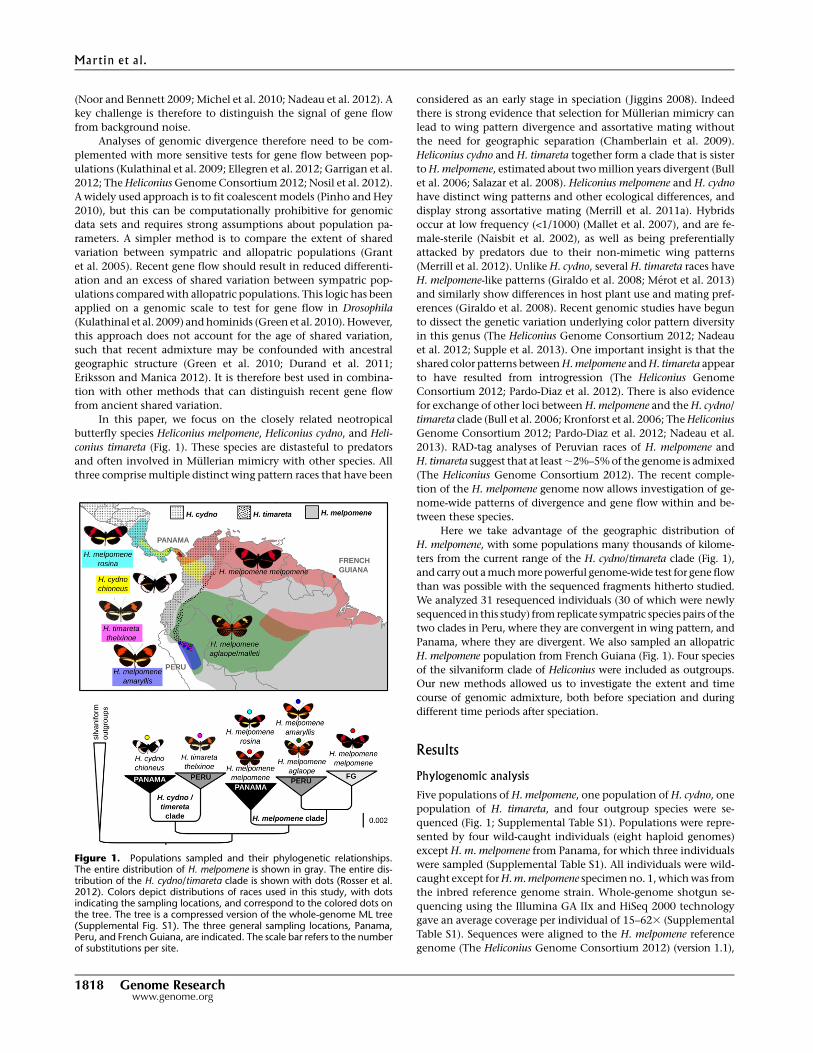
Figure 1. Populations sampled and their phylogenetic relationships.The entire distribution of H. melpomene is shown in gray. The entire dis-tribution of the H. cydno/timareta clade is shown with dots (Rosser et al.2012). Colors depict distributions of races used in this study, with dotsindicating the sampling locations, and correspond to the colored dots onthe tree. The tree is a compressed version of the whole-genome ML tree(Supplemental Fig. S1). The three general sampling locations, Panama,Peru, and French Guiana, are indicated. The scale bar refers to the numberof substitutions per site.
1818 Genome Researchwww.genome.org
Martin et al.
including the complete mitochondrial scaffold. Genotyping and
quality filtering (see Methods for details) produced an average of 190
million high-quality genotype calls per individual (69% of the ge-
nome). Proportions of variant sites were similar across all wild-caught
individuals, and the ratio of transitions to transversions with respect
to the reference was similar across all taxa, indicating that there was no
systematic bias in the distribution of sequencing errors among taxa.
Maximum likelihood (ML) phylogenetic reconstruction using
all sites with high-quality genotype calls for all 31 individuals
(60 Mb of sequence, ;25% of the genome) confirmed that the
H. melpomene and the H. cydno/timareta clades are reciprocally
monophyletic (Fig. 1; Supplemental Fig. S1; The Heliconius Genome
Consortium 2012; Nadeau et al. 2013). We here term this topology
‘‘the species tree.’’ A tree generated from complete mitochondrial
sequences produced a similar topology (Supplemental Fig. S1).
Phylogenetic discordance acrossthe genome
Although the genome-wide ML tree re-
vealed strong support for the expected
‘‘species tree,’’ most speciation scenarios
predict discordant coalescent histories
among genomic regions (Garrigan et al.
2012). To investigate this, we generated
maximum-likelihood trees for non-over-
lapping 100-kb windows throughout
the genome. To simplify the hypotheses
being tested, we analyzed two sets of
four taxa separately, each representing
a sympatric species pair and an allopatric
‘‘control’’ population. The cydno/melpomene
set consisted of H. cydno and H. m. rosina
(both from Panama), H. m. melpomene
from French Guiana and outgroups,
while the timareta/melpomene set con-
sisted of H. timareta and H. m. amaryllis
(both from Peru), with H. m. melpomene
from French Guiana and outgroups. We
summed the frequency of four possible
topologies: species, geography, control,
and unresolved (Fig. 2B). Three of these
we considered ‘‘resolved,’’ meaning that
two of the ingroup populations (eight
individuals) formed a monophyletic
clade, while the four individuals com-
prising the third ingroup population
formed a distinct monophyletic sister
clade (see Supplemental Fig. S3 for ex-
amples). For both data sets, the majority
of genomic windows (53% and 53.2%,
respectively) supported a resolved ‘‘species
tree’’ topology in which the H. melpomene
populations are monophyletic (Fig. 2).
Under a bifurcating topology, incomplete
lineage sorting should result in similar
numbers of two alternative resolved to-
pologies, which we term the ‘‘geography
tree’’ (sympatric populations of different
species cluster together) and the ‘‘control
tree’’ (allopatric populations of differ-
ent species cluster together). The final
possibility is an ‘‘unresolved tree,’’ in which the three ingroup
populations are not neatly partitioned into two monophyletic
clusters (Fig. 2; see Supplemental Fig. S3 for examples).
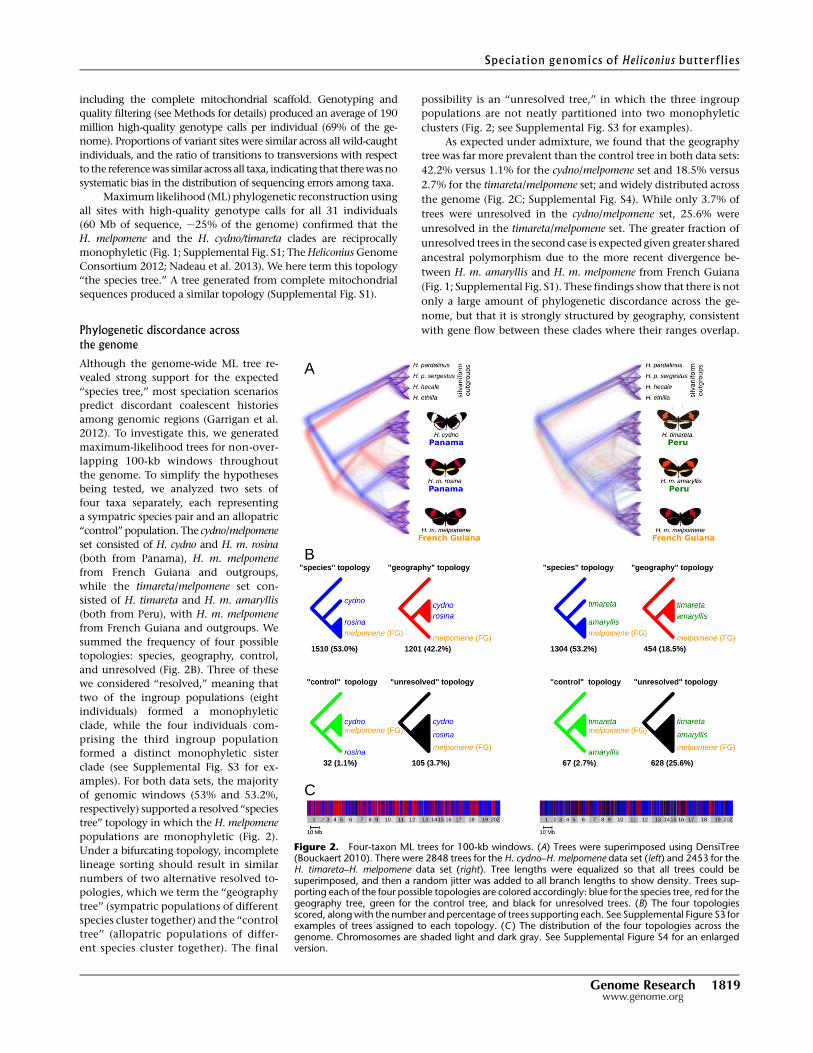
As expected under admixture, we found that the geography
tree was far more prevalent than the control tree in both data sets:
42.2% versus 1.1% for the cydno/melpomene set and 18.5% versus
2.7% for the timareta/melpomene set; and widely distributed across
the genome (Fig. 2C; Supplemental Fig. S4). While only 3.7% of
trees were unresolved in the cydno/melpomene set, 25.6% were
unresolved in the timareta/melpomene set. The greater fraction of
unresolved trees in the second case is expected given greater shared
ancestral polymorphism due to the more recent divergence be-
tween H. m. amaryllis and H. m. melpomene from French Guiana
(Fig. 1; Supplemental Fig. S1). These findings show that there is not
only a large amount of phylogenetic discordance across the ge-
nome, but that it is strongly structured by geography, consistent
with gene flow between these clades where their ranges overlap.
Figure 2. Four-taxon ML trees for 100-kb windows. (A) Trees were superimposed using DensiTree(Bouckaert 2010). There were 2848 trees for the H. cydno–H. melpomene data set (left) and 2453 for theH. timareta–H. melpomene data set (right). Tree lengths were equalized so that all trees could besuperimposed, and then a random jitter was added to all branch lengths to show density. Trees sup-porting each of the four possible topologies are colored accordingly: blue for the species tree, red for thegeography tree, green for the control tree, and black for unresolved trees. (B) The four topologiesscored, along with the number and percentage of trees supporting each. See Supplemental Figure S3 forexamples of trees assigned to each topology. (C ) The distribution of the four topologies across thegenome. Chromosomes are shaded light and dark gray. See Supplemental Figure S4 for an enlargedversion.
Speciation genomics of Heliconius butterflies
Genome Research 1819www.genome.org

Here we report results for 100-kb windows because linkage dis-
equilibrium (LD) tends to break down completely within 100 kb in
Heliconius genomes (Supplemental Fig. S2), making each 100-kb
block effectively independent from its neighbors. However, we
also repeated the tests at various window sizes between 10 and 200
kb (Supplemental Table S2). Although the number of unresolved
trees increases at smaller window sizes, the relative ratios of re-
solved trees are robust to window size variation (Supplemental
Table S2).
Evidence of recent gene flow
Allele frequency correlations provide further evidence for recent
interspecific gene flow. Our geographically structured sampling
design allowed us to distinguish between ancient and recent ad-
mixture using a sensitive ‘‘four-population’’ test (Reich et al. 2009,
2012) for geographical correlations in allele frequencies. In the
absence of admixture, allele frequency changes due to drift in dis-
parate populations should not be correlated. Across all tests, there
was a highly significant allele frequency correlation between H. m.
rosina and H. cydno from Panama, and between H. m. amaryllis and
H. timareta from Peru (Table 1). These correlations indicate recent
gene flow between these species where they occur in sympatry.
Gene flow has occurred at multiple points since earlyin speciation
Evidence for recent gene flow does not necessarily imply that gene
flow has persisted throughout speciation. Secondary contact after
allopatric speciation might be characterized by a burst of recent
gene flow, while sympatric speciation should leave a signature of
continuous gene flow during speciation. We estimated admixture
along different branches of the phylogeny using a method devised
by Green et al. (2010), which compares two classes of shared de-
rived alleles, termed ABBAs and BABAs. For three populations and
an outgroup, with the relationship {[(P1,P2),P3],O}, we can test for
differential admixture between P3 and either of P1 or P2 by exam-
ining the numbers of shared derived alleles between P3 and P2
(ABBAs) and between P3 and P1 (BABAs). We calculated two sta-
tistics: ‘‘D’’ used to test for a significant imbalance of ABBAs and
BABAs, indicative of admixture; and ‘‘f,’’ the estimated fraction of
the genome that has been shared between populations (Green
et al. 2010; Durand et al. 2011). These measures are robust to var-
iation in effective population size (Durand et al. 2011).
We examined rates of gene flow between H. timareta and H. m.
amaryllis across three time periods (Fig. 3): a short, recent period,
subsequent to the divergence between H. m. amaryllis and H. m.
aglaope (period 4 of Fig. 3A); an intermediate period, subsequent to
the divergence of the Peruvian populations from French Guianan
H. m. melpomene (periods 3, 4 of Fig. 3A); and a long period, sub-
sequent to the divergence between Peruvian and Panamanian
populations (periods 2, 3, 4 of Fig. 3A). Across these comparisons
there was a strong trend of increasing f with time (Fig. 3C; Table 2).
Similarly, for H. m. rosina and H. cydno, over two time periods, f was
again much greater for the longer period (Fig. 3C; Table 2). Because
this method assumes unidirectional gene flow from P3, and com-
plete isolation between P3 and P1, the actual fraction of the ge-
nome that has been shared may be greater than estimated here.
What is important is that the relative values of f increase with the
length of the period examined, which is consistent with gene flow
having occurred during time periods 2, 3, and 4. One potential
caveat is that the extent of isolation between P3 and P1 could differ
between these tests, accounting for some of the variation in f. We
therefore investigated linkage disequilibrium among these shared
derived sites as an additional signal to differentiate between recent
and long-term gene flow.
Linkage disequilibrium between shared derived alleles
The extent of LD between introgressed alleles carries information
about the age of admixture. Recently introgressed haplotypes have
had insufficient time to be broken down by recombination, and
therefore closely linked introgressed alleles should occur in LD
with one another (Machado et al. 2002; Sankararaman et al. 2012).
In contrast, anciently introgressed alleles should display levels of
LD similar to the average genomic level. We tested for this signal by
examining LD at sites carrying shared derived variants (i.e., ABBA
SNPs) in H. m. amaryllis and H. m. rosina. For H. m. amaryllis, three
sets of SNPs carrying shared variants
could be examined, corresponding to the
three time periods described above (Fig.
3B). Likewise, in H. m. rosina, two sets of
SNPs could be examined.
We found that the extent of LD dif-
fered dramatically between the time pe-
riods (Fig. 3D). Variants shared between
H. timareta and H. m. amaryllis but absent
from H. m. aglaope displayed the strongest
LD, extending up to a megabase. This is
consistent with the existence of large
introgressed haplotypes that have yet to
be fully broken down. Variants shared
between H. timareta and H. m. amaryllis
but absent from French Guianan H. m.
melpomene displayed weaker LD, while
those shared between H. timareta and
H. m. amaryllis but absent from H. m. rosina
displayed the weakest LD, declining with
distance at a similar rate to the genomic
average (Fig. 3D). Thus, these two latter
comparisons include variation that ap-
Table 1. Results of the four-population test for recent gene flow
Testa f4 ± std err Z-score P-value
Whole genomef4(cydno,timareta; rosina,melp. [FG]) 0.0764 ± 0.0013 60.14b <0.0001f4(cydno,timareta; amaryllis,melp. [FG]) �0.0370 ± 0.0016 �22.70b <0.0001f4(cydno,timareta; rosina,melp. [Pan]) 0.0056 ± 0.0005 10.95b <0.0001f4(cydno,timareta; amaryllis,aglaope) �0.0039 ± 0.0006 �6.91b <0.0001f4(cydno,timareta; rosina,amaryllis) 0.0883 ± 0.0015 58.51b <0.0001
Z chromosomef4(cydno,timareta; rosina,melp. [FG]) 0.0256 ± 0.0064 4.00c 0.0001f4(cydno,timareta; amaryllis,melp. [FG]) �0.0235 ± 0.0100 �2.34d 0.0192f4(cydno,timareta; rosina,melp. [Pan]) 0.0021 ± 0.0027 0.77 0.4418f4(cydno,timareta; amaryllis,aglaope) �0.0108 ± 0.0104 �1.04 0.2997f4(cydno,timareta; rosina,amaryllis) 0.0394 ± 0.0085 4.64b <0.0001
(aglaope) H. m. aglaope; (amaryllis) H. m. amaryllis; (rosina) H. m. rosina; (melp.) H. m. melpomene;(cydno) H. c. chioneus; (timareta) H. t. thelxinoe; (Pan) Panama; (FG) French Guiana.aFor f4(A,B; C,D), a significantly positive Z-score implies gene flow between A and C, or B and D, or both.A significantly negative Z-score implies gene flow between A and D, or B and C, or both.bIndicates f4 significantly different from 0, P < 0.0001.cIndicates f4 significantly different from 0, P < 0.01.dIndicates f4 significantly different from 0, P < 0.05.
Martin et al.
1820 Genome Researchwww.genome.org
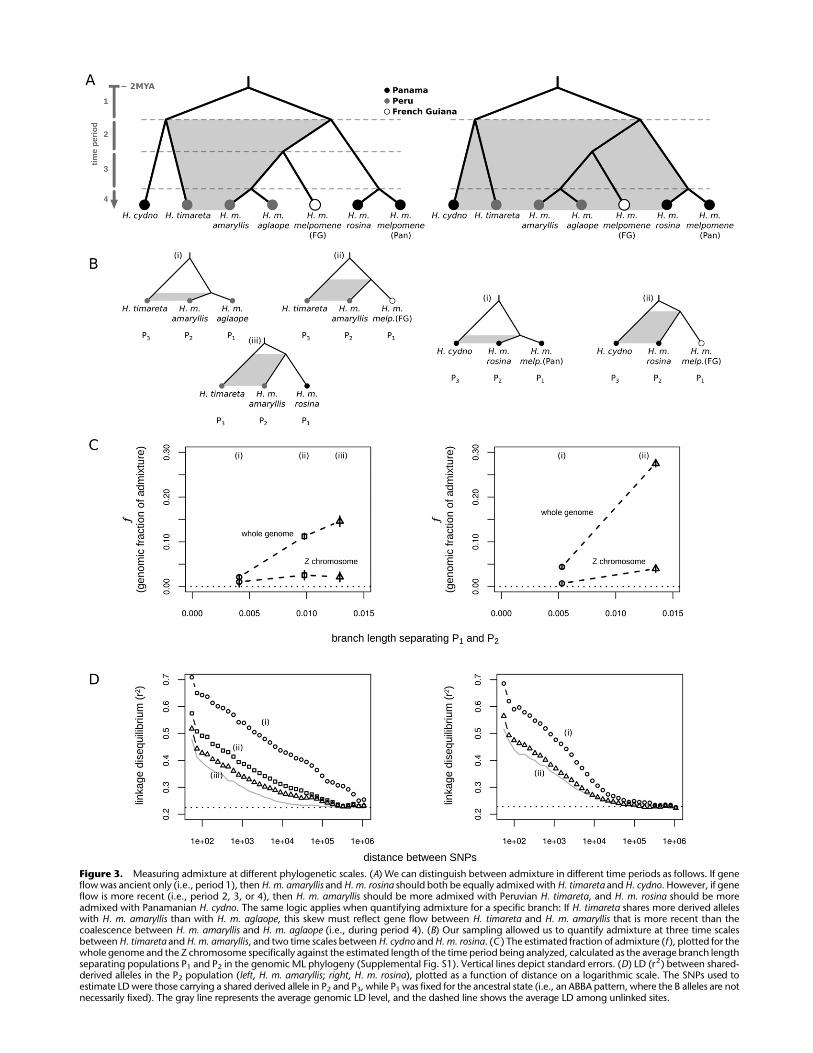
Figure 3. Measuring admixture at different phylogenetic scales. (A) We can distinguish between admixture in different time periods as follows. If geneflow was ancient only (i.e., period 1), then H. m. amaryllis and H. m. rosina should both be equally admixed with H. timareta and H. cydno. However, if geneflow is more recent (i.e., period 2, 3, or 4), then H. m. amaryllis should be more admixed with Peruvian H. timareta, and H. m. rosina should be moreadmixed with Panamanian H. cydno. The same logic applies when quantifying admixture for a specific branch: If H. timareta shares more derived alleleswith H. m. amaryllis than with H. m. aglaope, this skew must reflect gene flow between H. timareta and H. m. amaryllis that is more recent than thecoalescence between H. m. amaryllis and H. m. aglaope (i.e., during period 4). (B) Our sampling allowed us to quantify admixture at three time scalesbetween H. timareta and H. m. amaryllis, and two time scales between H. cydno and H. m. rosina. (C ) The estimated fraction of admixture (f ), plotted for thewhole genome and the Z chromosome specifically against the estimated length of the time period being analyzed, calculated as the average branch lengthseparating populations P1 and P2 in the genomic ML phylogeny (Supplemental Fig. S1). Vertical lines depict standard errors. (D) LD (r2) between shared-derived alleles in the P2 population (left, H. m. amaryllis; right, H. m. rosina), plotted as a function of distance on a logarithmic scale. The SNPs used toestimate LD were those carrying a shared derived allele in P2 and P3, while P1 was fixed for the ancestral state (i.e., an ABBA pattern, where the B alleles are notnecessarily fixed). The gray line represents the average genomic LD level, and the dashed line shows the average LD among unlinked sites.

pears to have been shared more anciently, giving sufficient time for
introgressed haplotypes to be broken down. Similar differences
were observed in the extent of LD among variants shared between
H. cydno and H. m. rosina at the two time intervals examined. By
exploiting a different aspect of the data, these results provide an
independent line of evidence that both recent and ancient ad-
mixture has occurred between these species pairs.
Patterns of genomic divergence along the speciation continuum
We characterized patterns of divergence across the genome be-
tween populations at various levels of divergence and geographic
separation using the fixation index, FST. At the earliest stage of
divergence, between parapatric races, FST was low throughout the
genome with just a few narrow peaks (Fig. 4), which are partly
explained by known wing pattern divergence. Between H. m.
aglaope and H. m. amaryllis from Peru, only two pronounced di-
vergence peaks were present, corresponding to the known pattern
loci HmB (red elements) and HmYb (yellow elements) (Baxter et al.
2010; Nadeau et al. 2012). For the Panamanian races, the level of
FST was noisier but there was a small FST peak at the HmYb locus
(Fig. 4). There was no peak at the HmB locus, consistent with the
fact that the Panamanian races share the same red mimetic pat-
terns. Between allopatric races, background FST was significantly
higher and more heterogeneous, and color pattern loci no longer
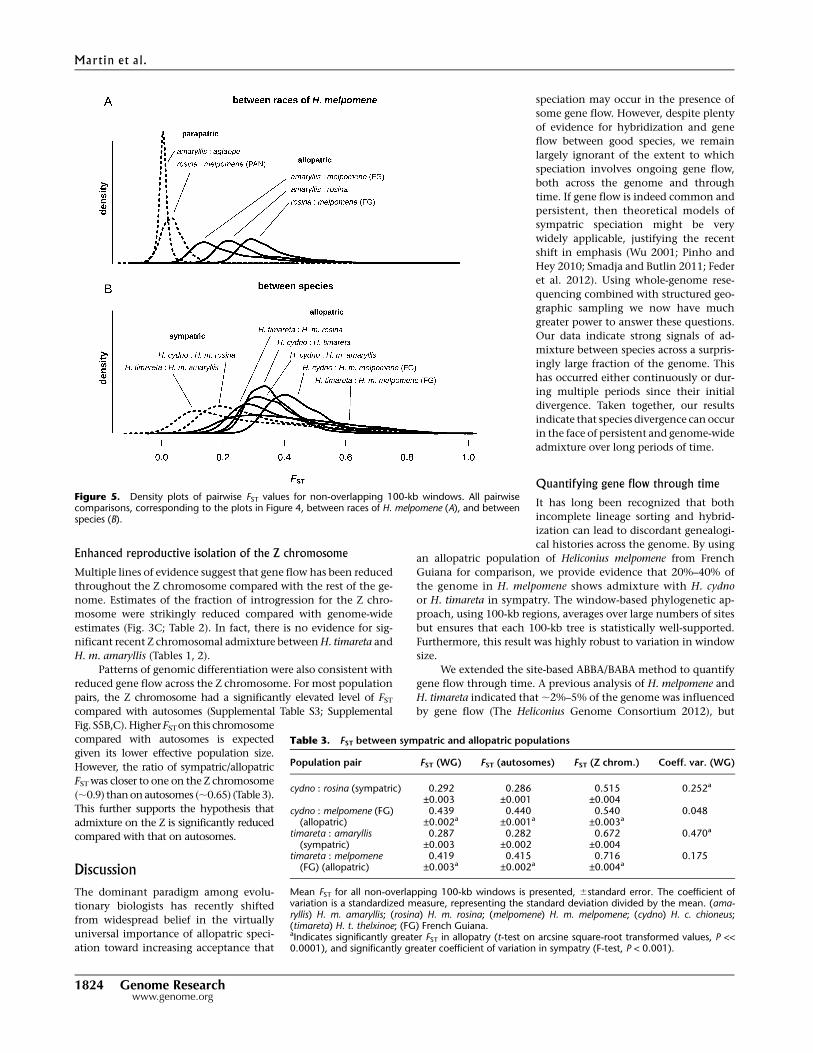
appeared as clear outliers. Patterns of FST between species were
broadly similar in mean and variance to those between allopatric
races of H. melpomene (Figs. 4, 5).
Reduced interspecific divergence in sympatry
Gene flow between sympatric populations should lead to reduced
FST as compared with that between allopatric populations. Con-
sistent with phylogenetic evidence for gene flow in sympatry, FST
between sympatric species pairs in both Panama and Peru was
significantly lower than that between either H. timareta or H. cydno
and the allopatric H. m. melpomene from French Guiana (Table 3).
Each of the 21 chromosomes independently showed the same
trend of significantly lower FST in sympatry than in allopatry
(Supplemental Fig. S5B). This trend is also robust to the use of
different allopatric populations. Peruvian H. m. amaryllis can be
considered as allopatric to Panamanian H. cydno (separated by
the Andes). Likewise, H. m. rosina can be considered allopatric to
H. timareta. These allopatric comparisons both displayed signifi-
cantly higher average FST than the sympatric comparisons, al-
though not quite as high as when the French Guianan population
was used (Supplemental Table S3). This variation may be partly due
to differences in the extent of isolation, but probably also reflect
differences in effective population size. Nevertheless no inter-
species allopatric comparison showed anything close to the re-
duced FST observed between the species in sympatry (Fig. 5).
Plotted across individual chromosomes, the pattern of FST was
highly heterogeneous in both sympatry and allopatry (Supple-
mental Figs. S5C, S6, S7). As admixture between species is expected
to be non-uniformly distributed across the genome, we predicted
that there would be greater heterogeneity in FST in sympatry. In-
deed the coefficient of variation was significantly greater for FST
between sympatric pairs than allopatric pairs (Table 3).
Comparison of FST in sympatry relative to that in allopatry
may be useful in identifying regions subject to divergent selection
and hence reduced gene flow. When plotted across individual
chromosomes, the trend of lower FST in sympatry was widespread
but punctuated by narrow regions at which FST between the sym-
patric populations approached and occasionally exceeded that
between allopatric populations (Supplemental Figs. S5C, S6, S7).
Assuming that the allopatric population pair provides a reference
Table 2. Results of ABBA BABA tests to quantify gene flow over specific time periods
P1 P2 P3 Time perioda Db Zc P-valuec f (%)d
Whole genomeaglaope amaryllis timareta 4 0.039 ± 0.006 6.58e <0.0001 2.1 ± 0.3melp. (FG) amaryllis timareta 4 + 3 0.197 ± 0.009 22.60e <0.0001 11.2 ± 0.7rosina amaryllis timareta 4 + 3 + 2 0.209 ± 0.013 16.09e <0.0001 14.6 ± 1.2melp. (Pan) amaryllis timareta 4 + 3 + 2 0.229 ± 0.013 17.38e <0.0001 15.6 ± 1.2melp. (Pan) rosina cydno 4 0.073 ± 0.005 14.71e <0.0001 4.4 ± 0.3melp. (FG) rosina cydno 4 + 3 + 2 0.493 ± 0.009 53.08e <0.0001 27.6 ± 0.8amaryllis rosina cydno 4 + 3 + 2 0.490 ± 0.009 56.83e <0.0001 29.3 ± 0.8aglaope rosina cydno 4 + 3 + 2 0.501 ± 0.009 55.49e <0.0001 29.7 ± 0.9
Z chromosomeaglaope amaryllis timareta 4 0.092 ± 0.098 0.94 0.3460 1.1 ± 1.1melp. (FG) amaryllis timareta 4 + 3 0.204 ± 0.074 2.77f 0.0056 2.5 ± 1.1rosina amaryllis timareta 4 + 3 + 2 0.140 ± 0.057 2.47g 0.0136 2.2 ± 1.1melp. (Pan) amaryllis timareta 4 + 3 + 2 0.155 ± 0.059 2.64f 0.0082 2.4 ± 1.1melp. (Pan) rosina cydno 4 0.050 ± 0.012 4.27e <0.0001 0.7 ± 0.2melp. (FG) rosina cydno 4 + 3 + 2 0.191 ± 0.025 7.52e <0.0001 4.0 ± 0.8amaryllis rosina cydno 4 + 3 + 2 0.103 ± 0.008 12.46e <0.0001 2.3 ± 0.4aglaope rosina cydno 4 + 3 + 2 0.120 ± 0.030 3.94f 0.0001 2.7 ± 0.9
P1, P2, and P3 refer to the three populations used for the ABBA BABA tests (see Methods for details). (aglaope) H. m. aglaope; (amaryllis) H. m. amaryllis;(rosina) H. m. rosina; (melp.) H. m. melpomene; (cydno) H. c. chioneus; (timareta) H. t. thelxinoe; (Pan) Panama; (FG) French Guiana.aPeriod over which gene flow is measured, as shown in Figure 3A.bD statistic, to test for an overrepresentation of ABBA versus BABA patterns, 6standard error.cZ-score and P-value for the block jack-knife test of whether D differs significantly from zero.dEstimated fraction of introgression, given as a percentage 6 standard error.eIndicates D significantly different from 0, P < 0.0001.fIndicates D significantly different from 0, P < 0.01.gIndicates D significantly different from 0, P < 0.05.
Martin et al.
1822 Genome Researchwww.genome.org
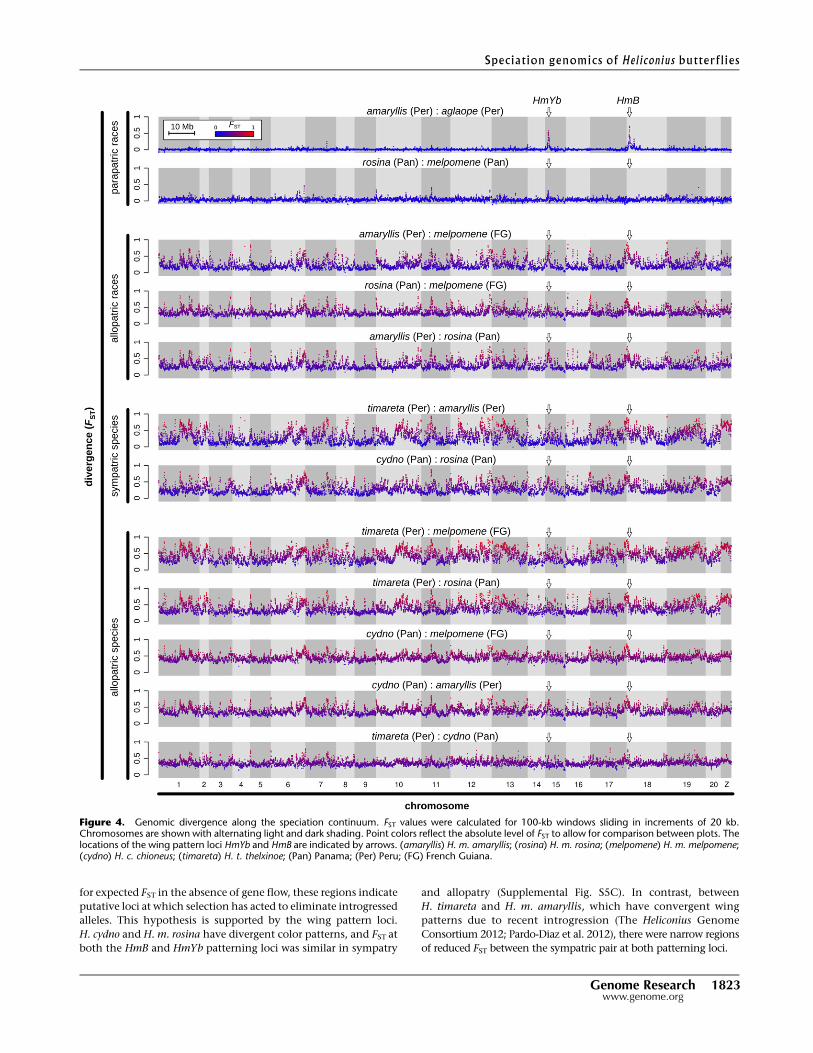
for expected FST in the absence of gene flow, these regions indicate
putative loci at which selection has acted to eliminate introgressed
alleles. This hypothesis is supported by the wing pattern loci.
H. cydno and H. m. rosina have divergent color patterns, and FST at
both the HmB and HmYb patterning loci was similar in sympatry
and allopatry (Supplemental Fig. S5C). In contrast, between
H. timareta and H. m. amaryllis, which have convergent wing
patterns due to recent introgression (The Heliconius Genome
Consortium 2012; Pardo-Diaz et al. 2012), there were narrow regions
of reduced FST between the sympatric pair at both patterning loci.
Figure 4. Genomic divergence along the speciation continuum. FST values were calculated for 100-kb windows sliding in increments of 20 kb.Chromosomes are shown with alternating light and dark shading. Point colors reflect the absolute level of FST to allow for comparison between plots. Thelocations of the wing pattern loci HmYb and HmB are indicated by arrows. (amaryllis) H. m. amaryllis; (rosina) H. m. rosina; (melpomene) H. m. melpomene;(cydno) H. c. chioneus; (timareta) H. t. thelxinoe; (Pan) Panama; (Per) Peru; (FG) French Guiana.
Speciation genomics of Heliconius butterflies
Genome Research 1823www.genome.org
Enhanced reproductive isolation of the Z chromosome
Multiple lines of evidence suggest that gene flow has been reduced
throughout the Z chromosome compared with the rest of the ge-
nome. Estimates of the fraction of introgression for the Z chro-
mosome were strikingly reduced compared with genome-wide
estimates (Fig. 3C; Table 2). In fact, there is no evidence for sig-
nificant recent Z chromosomal admixture between H. timareta and
H. m. amaryllis (Tables 1, 2).
Patterns of genomic differentiation were also consistent with
reduced gene flow across the Z chromosome. For most population
pairs, the Z chromosome had a significantly elevated level of FST
compared with autosomes (Supplemental Table S3; Supplemental
Fig. S5B,C). Higher FSTon this chromosome
compared with autosomes is expected
given its lower effective population size.
However, the ratio of sympatric/allopatric
FST was closer to one on the Z chromosome
(;0.9) than on autosomes (;0.65) (Table 3).
This further supports the hypothesis that
admixture on the Z is significantly reduced
compared with that on autosomes.
DiscussionThe dominant paradigm among evolu-
tionary biologists has recently shifted
from widespread belief in the virtually
universal importance of allopatric speci-
ation toward increasing acceptance that
speciation may occur in the presence of
some gene flow. However, despite plenty
of evidence for hybridization and gene
flow between good species, we remain
largely ignorant of the extent to which
speciation involves ongoing gene flow,
both across the genome and through
time. If gene flow is indeed common and
persistent, then theoretical models of
sympatric speciation might be very
widely applicable, justifying the recent
shift in emphasis (Wu 2001; Pinho and
Hey 2010; Smadja and Butlin 2011; Feder
et al. 2012). Using whole-genome rese-
quencing combined with structured geo-
graphic sampling we now have much
greater power to answer these questions.
Our data indicate strong signals of ad-
mixture between species across a surpris-
ingly large fraction of the genome. This
has occurred either continuously or dur-
ing multiple periods since their initial
divergence. Taken together, our results
indicate that species divergence can occur
in the face of persistent and genome-wide
admixture over long periods of time.
Quantifying gene flow through time
It has long been recognized that both
incomplete lineage sorting and hybrid-
ization can lead to discordant genealogi-
cal histories across the genome. By using
an allopatric population of Heliconius melpomene from French
Guiana for comparison, we provide evidence that 20%–40% of
the genome in H. melpomene shows admixture with H. cydno
or H. timareta in sympatry. The window-based phylogenetic ap-
proach, using 100-kb regions, averages over large numbers of sites
but ensures that each 100-kb tree is statistically well-supported.
Furthermore, this result was highly robust to variation in window
size.
We extended the site-based ABBA/BABA method to quantify
gene flow through time. A previous analysis of H. melpomene and
H. timareta indicated that ;2%–5% of the genome was influenced
by gene flow (The Heliconius Genome Consortium 2012), but
Figure 5. Density plots of pairwise FST values for non-overlapping 100-kb windows. All pairwisecomparisons, corresponding to the plots in Figure 4, between races of H. melpomene (A), and betweenspecies (B).
Table 3. FST between sympatric and allopatric populations
Population pair FST (WG) FST (autosomes) FST (Z chrom.) Coeff. var. (WG)
cydno : rosina (sympatric) 0.292 0.286 0.515 0.252a
±0.003 ±0.001 ±0.004cydno : melpomene (FG)
(allopatric)0.439 0.440 0.540 0.048
±0.002a ±0.001a ±0.003a
timareta : amaryllis(sympatric)
0.287 0.282 0.672 0.470a
±0.003 ±0.002 ±0.004timareta : melpomene
(FG) (allopatric)0.419 0.415 0.716 0.175
±0.003a ±0.002a ±0.004a
Mean FST for all non-overlapping 100-kb windows is presented, 6standard error. The coefficient ofvariation is a standardized measure, representing the standard deviation divided by the mean. (ama-ryllis) H. m. amaryllis; (rosina) H. m. rosina; (melpomene) H. m. melpomene; (cydno) H. c. chioneus;(timareta) H. t. thelxinoe; (FG) French Guiana.aIndicates significantly greater FST in allopatry (t-test on arcsine square-root transformed values, P <<0.0001), and significantly greater coefficient of variation in sympatry (F-test, P < 0.001).
Martin et al.
1824 Genome Researchwww.genome.org

this comparison could detect admixture that occurred only over
a short, recent time period. Our sampling design here allowed us to
vary the choice of ingroup populations and examine gene flow
over different time scales. Estimates of admixture increased with
increasing length of the time period examined, implying contin-
ued gene flow during speciation as opposed to a recent burst.
Furthermore, LD between derived alleles that were shared during
the recent time period was strongest, indicating the existence of
introgressed haplotype blocks that are yet to be broken down fully
by recombination. This signal was most extensive for alleles shared
between H. timareta and H. m. amaryllis but absent from H. m.
aglaope, with LD extending up to 1 Mb. This is consistent with
extremely recent gene flow, as H. m. amaryllis and H. m. aglaope
coalesce very recently. In contrast, LD between variants shared
over longer time periods was weaker and declined with physical
distance at a rate similar to the genome-wide average, implying
that most of these admixed variants were shared very long ago.
Thus two independent lines of evidence suggest that gene flow
extends from early in speciation to the present. While we cannot
rule out periods of allopatry during this time, particularly very
early during the species divergence, our results imply that admix-
ture has been a major influence on the genome throughout most
of the speciation process.
Genomic divergence through time and space
There has been mixed support for the verbal model of islands of
divergence amidst a sea of gene flow (Noor and Bennett 2009; Nosil
et al. 2009; Feder et al. 2012). Here we examined this model by
comparing patterns of genomic divergence at different stages of
speciation and different levels of geographical separation. Para-
patric races that are known to hybridize in nature, and in particular
H. m. amaryllis and H. m. aglaope from Peru, displayed patterns of
differentiation strongly congruent with this islands of divergence
model, with strong differentiation at known wing patterning loci.
Nonetheless, patterns of divergence are likely to be heterogeneous
regardless of gene flow (Noor and Bennett 2009; Michel et al. 2010).
For example, between allopatric populations of H. melpomene, sub-
ject to isolation by distance and biogeographic barriers such as the
Andes, there is a higher average FST but also considerable hetero-
geneity across the genome, including divergence peaks at the color
pattern loci. This probably reflects the fact that strong selection, and
various other demographic factors, can cause localized reductions
in effective population size, such that certain regions appear as
outliers for population differentiation, even in the absence of
homogenizing gene flow at other loci (Charlesworth 1998; Turner
and Hahn 2010). The presence of FST outliers alone does not
provide sufficient evidence that divergence occurred with ongo-
ing gene flow.
FST between sympatric species was highly heterogeneous, and
was not congruent with an idealized scenario of islands of di-
vergence against an otherwise homogenized genome. Neverthe-
less, interspecific FST between sympatric species was generally
lower, and more variable (Table 3) than between the corresponding
allopatric populations, as expected under a model of admixture
with variable selection against introgressing alleles. The trend of
lower FST in sympatry was widespread across all chromosomes,
consistent with pervasive admixture across the whole genome.
Despite this widespread signal, the rate of effective gene flow be-
tween H. melpomene and the H. cydno/timareta clade is apparently
insufficient to completely abolish differentiation across most of
the genome (Nosil et al. 2009; Feder et al. 2012).
Comparisons of sympatric and allopatric populations also
permit detection of outlier loci using the joint distribution of FST in
sympatry and allopatry. Loci at which interspecific FST is similar in
sympatry and allopatry could indicate putative targets of divergent
selection where the effective rate of gene flow is reduced. In effect,
the allopatric population provides a reference for the expected
divergence value in the absence of gene flow, controlling for the
inherent heterogeneity in rates of divergence across the genome.
This is conceptually similar to an approach applied in hybrid
zones, where allopatric populations are used as a control to detect
introgressed loci (Gompert and Buerkle 2010). Loci known to be
under selection offer a test of this logic. H. cydno and H. melpomene
from Panama have distinct wing patterns and both the HmB and
HmYb pattern loci fall under peaks at which FST is similar in sym-
patry and allopatry. The Peruvian pair has convergent wing pat-
terns, and narrow tracts of the genome have here introgressed at
both color pattern loci (The Heliconius Genome Consortium 2012;
Pardo-Diaz et al. 2012). Indeed, at both loci, there is a narrow
trough of low FST between these populations. The relatively high
levels of FST surrounding these troughs may be remnants of
hitchhiking following initial divergence in wing pattern. Although
we are here mostly interested in the genome-wide patterns of di-
vergence and admixture, we believe that in the future such joint
distributions of FST are likely to provide a powerful method for
detection of genomic regions subject to selection.
The Z chromosome is at a more advanced stage of speciation
There is both theoretical and empirical evidence for a dispropor-
tionate role of the sex chromosomes in speciation (Qvarnstrom
and Bailey 2009). Sex-linked genes are expected to diverge more
rapidly (Coyne and Orr 2004), and in the Lepidoptera species dif-
ferences have been shown to map disproportionately to the Z
chromosome (Prowell 1998). In our data there was a significantly
reduced signal of admixture on the Z chromosome compared with
autosomes. The discrepancy between the Z and autosomal FST was
also considerably greater in sympatry than in allopatry (Table 3).
Thus the difference cannot be explained solely by reduced effective
population size of sex chromosomes. Numbers of shared derived
alleles suggest that ancient gene flow did occur on the Z, but that
the contemporary migration rate for this chromosome is very low.
This can be explained, in part, by Z-autosome incompatibilities
known to cause female hybrid sterility ( Jiggins et al. 2001; Naisbit
et al. 2002). These sex chromosome versus autosome patterns are
similar to those seen in the genomes of the Drosophila simulans
group and in Ficedula flycatchers (Ellegren et al. 2012; Garrigan
et al. 2012), providing general support for the hypothesis that sex
chromosomes play a major role in speciation.
Conclusions
Genomic methods offer the opportunity to address the ongoing
debate between recent proponents of sympatric speciation and the
classical wisdom of ubiquitous allopatric speciation. It is unlikely
that genomic data from extant species will ever rule out brief pe-
riods of allopatry during speciation. Nonetheless, it is clear from
our results that admixture between H. melpomene and the H. cydno/
timareta lineage has taken place on a large scale throughout much
of their divergence history. To some extent, our findings fit with
verbal ideas of speciation with gene flow (Wu 2001; Feder et al.
2012), in which a progression from narrow islands leads to more
genomically widespread divergence. Indeed, despite increasing
Speciation genomics of Heliconius butterflies
Genome Research 1825www.genome.org

genome-wide divergence later on, the effects of gene flow remain
pervasive throughout the genome. Up to 40% of the genome
shows a discordant phylogenetic pattern consistent with admix-
ture in sympatry. Our results imply that the recent focus on
mechanisms that permit speciation-with-gene-flow in the litera-
ture is not misguided (Servedio et al. 2011; Smadja and Butlin
2011). In the case of H. melpomene and H. cydno, wing patterns have
a relatively simple genetic basis (Naisbit et al. 2007), and the loci that
affect male mate preference and hybrid sterility are associated with
color pattern loci (Merrill et al. 2011b), both of which should make
speciation easier. Genomics therefore has provided empirical data
that help answer thorny questions about the relative importance of
allopatric isolation in speciation, which have hitherto proved to be
among the most intractable debates in evolutionary biology.
Methods
Whole-genome resequencing and genotype callingSamples were preserved in NaCl-saturated DMSO solution at�20°C and DNA was isolated using the DNeasy Blood and TissueKit (Qiagen). Illumina paired-end libraries were generated accord-ing to the manufacturer’s protocol (Illumina Inc.). These wereshotgun sequenced on either Illumina’s Genome Analyzer IIxsystem or Illumina’s HiSeq 2000 system, according to the manu-facturer’s protocol (Illumina Inc.).
Quality-filtered, paired-end sequence reads were mapped tothe H. melpomene genome scaffolds (version 1.1) (The HeliconiusGenome Consortium 2012) using Stampy v1.0.13 (Lunter andGoodson 2011). Defaults were used for all parameters with theexception of the expected substitution rate, which was set to 0.03for H. melpomene samples (0.001 for the individual from the ref-erence genome strain), 0.04 for H. cydno/timareta samples, and 0.05for outgroup silvaniform samples to allow mapping of reads fromdivergent species. To minimize false SNPs due to inconsistentmapping around indels, base alignment quality (BAQ) was con-sidered during mapping, and then local realignment around indelswas performed using the Genome Analysis Tool Kit (GATK) v1.6(DePristo et al. 2011). SAM/BAM file conversion, analysis, andfiltering were performed using SAMtools (Li et al. 2009) and Picard(http://picard.sourceforge.net). PCR-duplicate reads were removedusing Picard.
Genotypes were called using the GATK v1.6 UnifiedGe-notyper (DePristo et al. 2011). Individuals from the same pop-ulation were genotyped simultaneously. Default parameters wereused, except expected heterozygosity was set to 0.01, and BAQcalculation was performed where necessary to optimize callsaround indels. For a genotype call to be considered high quality, ithad to meet the following criteria: Quality (QUAL) $ 30, 10 #
depth # 200 (the upper bound was imposed to avoid false SNPs dueto mis-mapping in repetitive regions), and for variant (non-refer-ence) calls, genotype quality (GQ) $ 30. Only these ‘‘high-quality’’genotype calls were used in downstream analyses. Genotypingsummary statistics for each sample are provided in SupplementalTable S1.
Assigning scaffolds to chromosomes
Several analyses involved comparisons among chromosomes.Scaffolds were assigned to chromosomes based on the Heliconiusmelpomene linkage map (The Heliconius Genome Consortium2012), version 1.1, which has ;80% of the genome assigned tochromosomes. An important focus of this study was the compar-ison between autosomal and Z-linked regions. We therefore per-formed extra tests to confirm Z-linkage of mapped scaffolds and
identify additional Z-linked scaffolds among those previously un-mapped (see Supplemental Appendix A for details). This procedurealso identified several mis-assembled scaffolds that were Z/auto-some chimeras. Using the most likely breakpoints identified, weremoved Z-linked regions from autosomes and also removed au-tosomal regions from the Z-linked scaffolds.
Phylogenomic analysis
A whole-genome ML tree was generated using only sites in thegenome with high-quality genotype calls for all 31 individuals,resulting in an alignment of 60 Mb. RAxML (Stamatakis 2006; Ottet al. 2007; Stamatakis et al. 2008) was used with the GTRGAMMAmodel, and 100 bootstrap replicates were performed. A separatetree was constructed for the mitochondrial genome (alignmentof 9.5 kb), using the same procedure, but with 1000 bootstraps.To investigate phylogenetic discordance across the genome, in-dependent ML trees were generated for non-overlapping 100-kbwindows. To minimize artifacts of data quality, only sites witha high-quality genotype call for all 31 genomes were used, andwindows that contained <10000 sites were rejected.
Four-population tests for admixture
To test for admixture between pairs of heterospecific populations,we used the four-population test (Reich et al. 2009, 2012). This testis based on the fact that genetic drift should be uncorrelated inunadmixed populations. Given the populations A, B, C, and D,with the unrooted relationship [(A,B),(C,D)], the f4 statistic, f4(A,B;C,D), allows a test for whether allele frequency differencesbetween A and B are correlated with differences between C and D,thus indicative of admixture (either between A and C, or between Band D, or both). We calculated the f4 statistic (Equation S6.1 ofReich et al. 2012) using all informative sites, i.e., biallelic sites atwhich both pairs of populations differ in allele frequency. Themean and variance in f4 were then estimated using a block jack-knifing approach (Reich et al. 2009), which controls for LD amongsites. We used a block size of 1 Mb, far greater than the extent of LDin the Heliconius genomes studied here (Supplemental Fig. S2; TheHeliconius Genome Consortium 2012). This allowed us to testwhether f4 deviated significantly from zero. Such deviations wouldindicate that the allele frequency differences between the twopopulation pairs are significantly correlated, indicating gene flow.
Quantifying gene flow over specific time periods
To quantify gene flow along a specific branch of the phylogeny, weused a method based on the relative abundance of two classes ofpolymorphic sites called ‘‘ABBAs’’ and ‘‘BABAs’’ (Green et al. 2010;Durand et al. 2011). Given four populations, P1, P2, P3, and anoutgroup O, with the relationship {[(P1,P2),P3],O}, ABBAs are SNPsat which P2 and P3 share a derived allele ‘‘B,’’ while P1 retains theancestral allele ‘‘A,’’ as inferred from the outgroup (i.e., P2 = P3 6¼P1 = O). Similarly, BABAs are SNPs at which P1 and P3 share a de-rived allele ‘‘B,’’ while P2 retains the ancestral allele ‘‘A’’ (i.e., P1 =
P3 6¼ P2 = O). Under the null hypothesis of no gene flow, ABBA andBABA patterns can only arise via incomplete lineage sorting, andshould be equally infrequent (assuming no recurrent mutationand random mating in the ancestral population). However, if therehas been gene flow between P3 and P2 since the split between P1
and P2, there should be an overrepresentation of ABBA patterns.The relative abundance of ABBA and BABA patterns throughoutthe genome was compared using the D statistic (Equation 2 ofDurand et al. 2011), based on allele frequencies at each SNP. Onlysites at which the four outgroup genomes were homozygous for
Martin et al.
1826 Genome Researchwww.genome.org

the same allele were considered to ensure confident assignment ofthe ancestral and derived states. We used a 1-Mb block jack-knifingapproach to calculate the mean and variance of D, allowing a testfor whether D differed significantly from zero.
We then estimated f, the fraction of the genome that isadmixed. In the example described above, the fraction of the ge-nome that is admixed between P3 and P2 subsequent to the splitbetween P1 and P2 can be estimated by comparing the observeddifference in abundance of ABBA and BABA patterns with thatwhich would be expected under a scenario of 100% admixturebetween P3 and P2 (Equation 8 of Durand et al. 2011). As above, weused a 1-Mb block jack-knife approach to calculate the mean andvariance of the f value.
Estimating the extent of linkage disequilibrium (LD)
Linkage disequilibrium (LD) was estimated using all pairs of biallelicsites with high-quality genotype calls in all 31 genomes and a minorallele count of at least five. We estimated r2 within H. melpomenepopulations using the ML estimator (Clayton and Leung 2007),implemented in the R package ‘‘snpstats,’’ which does not requirephased haplotypes. To investigate how LD breaks down withdistance, r2 values were binned according to distance in logarith-mically increasing bin sizes, to account for small numbers of SNPpairs at large distances. Only SNP pairs on the same scaffold wereconsidered. To obtain an estimate of background LD between un-linked sites, subsets of 500 SNPs were randomly selected and r2 wasestimated for all pairs for which the two SNPs were on separatechromosomes. This procedure was repeated 100 times and a 95%confidence interval was calculated.
We investigated the rate of decline in LD between sharedderived alleles in H. m. amaryllis and H. m. rosina. Following thedefinition of an ABBA site above, all sites at which P1 was fixed forthe ancestral state while P2 and P3 carried a derived allele wereconsidered. r2 values were binned according to distance as de-scribed above.
Patterns of genetic differentiation between populations
We estimated levels of genetic differentiation between populationsby calculating FST for 100-kb genomic windows. Nadeau et al.(2012) showed that averaging over large numbers of sites in thisway provides highly repeatable FST estimates from small samples.FST was calculated using the EggLib Python module (De Mita andSiol 2012). To minimize variation due to stochasticity and geno-typing errors, windows were rejected if they contained <2500variant sites genotyped with high quality for all individuals fromthe two populations being analyzed. Windows were restricted tosingle scaffolds (i.e., they did not cross scaffold boundaries). Toplot FST across chromosomes, scaffolds were arranged accordingto the H. melpomene linkage map (The Heliconius Genome Con-sortium 2012), version 1.1, having corrected for the severalZ/autosome chimeric scaffolds identified as described in Supple-mental Appendix A.
Data accessWhole-genome shotgun sequencing paired-end FASTQ files havebeen submitted to the European Nucleotide Archive (ENA; http://www.ebi.ac.uk/ena/) under accession number ERP002440. Thefollowing files have been deposited in the Data Dryad repository(http://datadryad.org/resource/doi:10.5061/dryad.dk712): allprocessed VCF files, site-based allele frequency data used for thefour-population tests and ABBA BABA analyses, all pairwise FST
values for 100-kb windows, maximum-likelihood trees for each
100-kb window for the two four-taxon data sets analyzed (Newickformat), data files providing the topology supported by eachwindow, a list of scaffolds and scaffold regions designated asZ-linked, and custom Python and R scripts used for data analyses.
AcknowledgmentsWe thank Richard Merrill and Simon Baxter for field work. JudithMank and Jamie Walters kindly contributed funds from their FellFund grant. We also thank Anders Eriksson for his input in dis-cussions of this study. Lastly, we are most grateful to the threeanonymous referees, whose thoughtful and in-depth reviewsgreatly improved the standard of this work. This study was fundedby the BBSRC (G006903/1, G008841/1, and H01439X/1), theLeverhulme Trust (F/09364/E), and The Fell Fund.
References
Baxter SW, Nadeau NJ, Maroja LS, Wilkinson P, Counterman BA, Dawson A,Beltran M, Perez-Espona S, Chamberlain N, Ferguson L, et al. 2010.Genomic hotspots for adaptation: The population genetics of Mullerianmimicry in the Heliconius melpomene clade. PLoS Genet 6: 12.
Bouckaert RR. 2010. DensiTree: Making sense of sets of phylogenetic trees.Bioinformatics 26: 1372–1373.
Bull V, Beltran M, Jiggins CD, McMillan WO, Bermingham E, Mallet J. 2006.Polyphyly and gene flow between non-sibling Heliconius species. BMCBiol 4: 11.
Chamberlain NL, Hill RI, Kapan DD, Gilbert LE, Kronforst MR. 2009.Polymorphic butterfly reveals the missing link in ecological speciation.Science 326: 847–850.
Charlesworth B. 1998. Measures of divergence between populations and theeffect of forces that reduce variability. Mol Biol Evol 15: 538–543.
Clayton D, Leung H-T. 2007. An R package for analysis of whole-genomeassociation studies. Hum Hered 64: 45–51.
Coyne JA, Orr HA. 2004. Speciation. Sinauer, Sunderland, MA.De Mita S, Siol M. 2012. EggLib: Processing, analysis and simulation tools for
population genetics and genomics. BMC Genet 13: 27.DePristo MA, Banks E, Poplin R, Garimella KV, Maguire JR, Hartl C,
Philippakis AA, del Angel G, Rivas MA, Hanna M, et al. 2011. A frameworkfor variation discovery and genotyping using next-generation DNAsequencing data. Nat Genet 43: 491–498.
Durand EY, Patterson N, Reich D, Slatkin M. 2011. Testing for ancientadmixture between closely related populations. Mol Biol Evol 28: 2239–2252.
Ellegren H, Smeds L, Burri R, Olason PI, Backstrom N, Kawakami T, KunstnerA, Makinen H, Nadachowska-Brzyska K, Qvarnstrom A, et al. 2012. Thegenomic landscape of species divergence in Ficedula flycatchers. Nature491: 756–760.
Eriksson A, Manica A. 2012. Effect of ancient population structure on thedegree of polymorphism shared between modern human populationsand ancient hominins. Proc Natl Acad Sci 109: 13956–13960.
Feder J, Egan S, Nosil P. 2012. The genomics of speciation-with-gene-flow.Trends Genet 28: 342–350.
Gagnaire P-A, Pavey SA, Normandeau E, Bernatchez L. 2013. The geneticarchitecture of reproductive isolation during speciation-with-gene-flowin lake whitefish species pairs assessed by rad-sequencing. Evolution 67:2483–2497.
Garrigan D, Kingan SB, Geneva AJ, Andolfatto P, Clark AG, Thornton K,Presgraves DC. 2012. Genome sequencing reveals complex speciation inthe Drosophila simulans clade. Genome Res 22: 1499–1511.
Gavrilets S. 2004. Fitness landscapes and the origin of species. PrincetonUniversity Press, Princeton, NJ.
Giraldo N, Salazar C, Jiggins CD, Bermingham E, Linares M. 2008. Twosisters in the same dress: Heliconius cryptic species. BMC Evol Biol 8: 324.
Gompert Z, Buerkle AC. 2010. Introgress: A software package for mappingcomponents of isolation in hybrids. Mol Ecol Resour 10: 378–384.
Grant PR, Grant BR, Petren K. 2005. Hybridization in the recent past. Am Nat166: 56–67.
Green RE, Krause J, Briggs AW, Maricic T, Stenzel U, Kircher M, Patterson N,Li H, Zhai W, Fritz MH-Y, et al. 2010. A draft sequence of the Neandertalgenome. Science 328: 710–722.
The Heliconius Genome Consortium. 2012. Butterfly genome revealspromiscuous exchange of mimicry adaptations among species. Nature487: 94–98.
Hohenlohe PA, Bassham S, Etter PD, Stiffler N, Johnson EA, Cresko WA.2010. Population genomics of parallel adaptation in threespinestickleback using sequenced RAD tags. PLoS Genet 6: e1000862.
Speciation genomics of Heliconius butterflies
Genome Research 1827www.genome.org

Hohenlohe PA, Bassham S, Currey M, Cresko WA. 2012. Extensive linkagedisequilibrium and parallel adaptive divergence across threespinestickleback genomes. Philos T Roy Soc B 367: 395–408.
Jiggins C. 2008. Ecological speciation in mimetic butterflies. Bioscience 58:541–548.
Jiggins CD, Linares M, Naisbit RE, Salazar C, Yang ZH, Mallet J. 2001. Sex-linked hybrid sterility in a butterfly. Evolution 55: 1631–1638.
Kirkpatrick M, Ravigne V. 2002. Speciation by natural and sexual selection:Models and experiments. Am Nat (Suppl) 159: S22–S35.
Kronforst MR, Young LG, Blume LM, Gilbert LE. 2006. Multilocus analysesof admixture and introgression among hybridizing Heliconiusbutterflies. Evolution 60: 1254–1268.
Kulathinal RJ, Stevison LS, Noor MAF. 2009. The genomics of speciation inDrosophila: Diversity, divergence, and introgression estimated usinglow-coverage genome sequencing. PLoS Genet 5: e1000550.
Lawniczak MKN, Emrich SJ, Holloway AK, Regier AP, Olson M, White B,Redmond S, Fulton L, Appelbaum E, Godfrey J, et al. 2010. Widespreaddivergence between incipient Anopheles gambiae species revealed bywhole genome sequences. Science 330: 512–514.
Li H, Handsaker B, Wysoker A, Fennell T, Ruan J, Homer N, Marth G,Abecasis G, Durbin R. 2009. The Sequence Alignment/Map format andSAMtools. Bioinformatics 25: 2078–2079.
Lunter G, Goodson M. 2011. Stampy: A statistical algorithm for sensitiveand fast mapping of Illumina sequence reads. Genome Res 21: 936–939.
Machado CA, Kliman RM, Markert JA, Hey J. 2002. Inferring the history ofspeciation from multilocus DNA sequence data: The case of Drosophilapseudoobscura and close relatives. Mol Biol Evol 19: 472–488.
Mallet J. 2005. Hybridization as an invasion of the genome. Trends Ecol Evol20: 229–237.
Mallet J, Beltran M, Neukirchen W, Linares M. 2007. Natural hybridizationin heliconiine butterflies: The species boundary as a continuum. BMCEvol Biol 7: 28.
Merot C, Mavarez J, Evin A, Dasmahapatra KK, Mallet J, Lamas G, Joron M.2013. Genetic differentiation without mimicry shift in a pair ofhybridizing Heliconius species (Lepidoptera: Nymphalidae). Biol J LinnSoc Lond 109: 830–847.
Merrill RM, Gompert Z, Dembeck LM, Kronforst MR, McMillan WO, JigginsCD. 2011a. Mate preference across the speciation continuum in a cladeof mimetic butterflies. Evolution 65: 1489–1500.
Merrill RM, Van Schooten B, Scott JA, Jiggins CD. 2011b. Pervasive geneticassociations between traits causing reproductive isolation in Heliconiusbutterflies. Proc Roy Sci B 278: 511–518.
Merrill RM, Wallbank RWR, Bull V, Salazar PC, Mallet J, Stevens M, JigginsCD. 2012. Disruptive ecological selection on a mating cue. Proc Roy Sci B279: 4907–4913.
Michel APA, Sim S, Powell THQ , Taylor MS, Nosil P, Feder JL. 2010.Widespread genomic divergence during sympatric speciation. Proc NatlAcad Sci 107: 9724–9729.
Nadeau NJ, Whibley A, Jones RT, Davey JW, Dasmahapatra KK, Baxter SW,Quail MA, Joron M, Ffrench-Constant RH, Blaxter ML, et al. 2012.Genomic islands of divergence in hybridizing Heliconius butterfliesidentified by large-scale targeted sequencing. Philos Trans R Soc Lond BBiol Sci 367: 343–353.
Nadeau NJ, Martin SH, Kozak KM, Salazar C, Dasmahapatra KK, Davey JW,Baxter SW, Blaxter ML, Mallet J, Jiggins CD. 2013. Genome-widepatterns of divergence and gene flow across a butterfly radiation. MolEcol 22: 814–826.
Naisbit RE, Jiggins CD, Linares M, Salazar C, Mallet J. 2002. Hybrid sterility,Haldane’s rule and speciation in Heliconius cydno and H. melpomene. Race1526: 1517–1526.
Naisbit RE, Jiggins CD, Mallet J. 2007. Mimicry: Developmental genes thatcontribute to speciation. Evol Dev 5: 269–280.
Noor MAF, Bennett SM. 2009. Islands of speciation or mirages in the desert?Examining the role of restricted recombination in maintaining species.Heredity 103: 439–444.
Nosil P, Funk DJ, Ortiz-Barrientos D. 2009. Divergent selection andheterogeneous genomic divergence. Mol Ecol 18: 375–402.
Nosil P, Gompert Z, Farkas TE, Comeault AA, Feder JL, Buerkle CA, ParchmanTL. 2012. Genomic consequences of multiple speciation processes ina stick insect. Proc Roy Sci B 279: 5058–5065.
Ott M, Zola J, Stamatakis A, Aluru S. 2007. Large-scale maximum likelihood-based phylogenetic analysis on the IBM BlueGene/L. In Proceedingsof the 2007 ACM/IEEE conference on supercomputing, SC ’07. Reno,Nevada.
Pardo-Diaz C, Salazar C, Baxter SW, Merot C, Figueiredo-Ready W, Joron M,McMillan WO, Jiggins CD. 2012. Adaptive introgression across speciesboundaries in Heliconius butterflies. PLoS Genet 8: e1002752.
Pinho C, Hey J. 2010. Divergence with gene flow: Models and data. Annu RevEcol Evol Syst 41: 215–230.
Prowell DP. 1998. Sex linkage and speciation in Lepidoptera. In Endlessforms: Species and speciation (ed. Howard DJ, Berlocher SH), pp. 309–319.Oxford University Press, New York.
Qvarnstrom A, Bailey RI. 2009. Speciation through evolution of sex-linkedgenes. Heredity 102: 4–15.
Reich D, Thangaraj K, Patterson N, Price AL, Singh L. 2009. ReconstructingIndian population history. Nature 461: 489–494.
Reich D, Patterson N, Campbell D, Tandon A, Mazieres S, Ray N, Parra MV,Rojas W, Duque C, Mesa N, et al. 2012. Reconstructing Native Americanpopulation history. Nature 488: 370–374.
Rieseberg LH. 2009. Evolution: Replacing genes and traits throughhybridization. Curr Biol 19: R119–R122.
Rosser N, Phillimore AB, Huertas B, Willmott KR, Mallet J. 2012. Testinghistorical explanations for gradients in species richness inheliconiine butterflies of tropical America. Biol J Linn Soc Lond 105:479–497.
Salazar C, Jiggins CD, Taylor JE, Kronforst MR, Linares M. 2008. Gene flow andthe genealogical history of Heliconius heurippa. BMC Evol Biol 8: 132.
Sankararaman S, Patterson N, Li H, Paabo S, Reich D. 2012. The date ofinterbreeding between Neandertals and modern humans. PLoS Genet 8:e1002947.
Servedio MR, Van Doorn GS, Kopp M, Frame AM, Nosil P. 2011. Magic traitsin speciation: ‘‘Magic’’ but not rare? Trends Ecol Evol 26: 389–397.
Smadja CM, Butlin RK. 2011. A framework for comparing processes ofspeciation in the presence of gene flow. Mol Ecol 20: 5123–5140.
Stamatakis A. 2006. RAxML-VI-HPC: Maximum likelihood-basedphylogenetic analyses with thousands of taxa and mixed models.Bioinformatics 22: 2688–2690.
Stamatakis A, Hoover P, Rougemont J. 2008. A rapid bootstrap algorithm forthe RAxML Web servers. Syst Biol 57: 758–771.
Supple MA, Hines HM, Dasmahapatra KK, Lewis JJ, Nielsen DM, Lavoie C,Ray DA, Salazar C, McMillan WO, Counterman BA. 2013. Genomicarchitecture of adaptive color pattern divergence and convergence inHeliconius butterflies. Genome Res 23: 1248–1257.
Turner TL, Hahn MW. 2010. Genomic islands of speciation or genomicislands and speciation? Mol Ecol 19: 848–850.
Turner TL, Hahn MW, Nuzhdin SV. 2005. Genomic islands of speciation inAnopheles gambiae. PLoS Biol 3: e285.
van Doorn GS, Edelaar P, Weissing FJ. 2009. On the origin of species bynatural and sexual selection. Science 326: 1704–1707.
Wu C. 2001. The genic view of the process of speciation. Science 14: 851–865.
Received April 23, 2013; accepted in revised form August 15, 2013.
Martin et al.
1828 Genome Researchwww.genome.org