genome-wide analysis of transposon and retroviral ... · retroviral insertions reveals preferential...
TRANSCRIPT

INVESTIGATION
Genome-Wide Analysis of Transposon andRetroviral Insertions Reveals PreferentialIntegrations in Regions of DNA FlexibilityPavle Vrljicak,*,1 Shijie Tao,†,1 Gaurav K. Varshney,‡,1 Helen Ngoc Bao Quach,†,1 Adita Joshi,†
Matthew C. LaFave,‡ Shawn M. Burgess,‡,2 and Karuna Sampath*,2
*Division of Biomedical Sciences, Warwick Medical School, University of Warwick, Coventry CV4 7AJ, United Kingdom,†Temasek Life Sciences Laboratory, National University of Singapore, 117604, Singapore, and ‡National Human GenomeResearch Institute, Bethesda, Maryland 20892-8004
ORCID ID: 0000-0002-0729-1977 (K.S.)
ABSTRACT DNA transposons and retroviruses are important transgenic tools forgenome engineering. An important consideration affecting the choice of transgenicvector is their insertion site preferences. Previous large-scale analyses of Dstransposon integration sites in plants were done on the basis of reporter geneexpression or germ-line transmission, making it difficult to discern vertebrateintegration preferences. Here, we compare over 1300 Ds transposon integrationsites in zebrafish with Tol2 transposon and retroviral integration sites. Genome-wideanalysis shows that Ds integration sites in the presence or absence of markerselection are remarkably similar and distributed throughout the genome. No strictmotif was found, but a preference for structural features in the target DNAassociated with DNA flexibility (Twist, Tilt, Rise, Roll, Shift, and Slide) was observed.Remarkably, this feature is also found in transposon and retroviral integrations inmaize and mouse cells. Our findings show that structural features influence theintegration of heterologous DNA in genomes, and have implications for targetedgenome engineering.
KEYWORDS
transposonAc/Dsgenome-wide analysisintegrationsgene targetinggenome engineeringfunctional genomicsTol2retrovirusMMLVmouseES cellsvertebrate genomeszebrafish
DNA elements capable of genomic integration, such as transposonsand retroviruses, are important tools in molecular biology research.From the fission yeast Schizosaccharomyces pombe to humans, these
vectors have been used for gene delivery and insertional mutagenesis(e.g., Cavazzana-Calvo et al. 2000; Aiuti et al. 2002; Kawakami andNoda 2004; Wang et al. 2007a; Guo et al. 2013). Significantly, the in-tegration of these elements has revealed features of genes and genomes,such as the function and regulation of genes, and the “open” state ofchromatin (Wang et al. 2007a; Genovesi et al. 2013; Guo et al. 2013;De Ravin et al. 2014; Davie et al. 2015; Rad et al. 2015; Takeda et al. 2015).
Three of the integrating elements currently used in zebrafish are theTol2 and Activator/Dissociator (Ac/Ds) transposons, and the MoloneyMurine Leukemia Virus (MMLV) (Lin et al. 1994; Koga et al. 1996;Kawakami et al. 2004; Emelyanov et al. 2006; McGrail et al. 2011; Songet al. 2012; Cheng et al. 2014; Quach et al. 2015). Ac/Ds and Tol2transposable elements are members of the hAT family (named forhobo, Ac and Tam3) (Calvi et al. 1991). They integrate into the hostDNA through a “cut-and-paste” mechanism requiring cis-terminal el-ements flanking the transgene of interest and the transposase enzyme,
Copyright © 2016 Vrljicak et al.doi: 10.1534/g3.115.026849Manuscript received November 23, 2015; accepted for publication January 19,2016; published Early Online January 26, 2016.This is an open-access article distributed under the terms of the Creative CommonsAttribution 4.0 International License (http://creativecommons.org/licenses/by/4.0/),which permits unrestricted use, distribution, and reproduction in any medium, pro-vided the original work is properly cited.Supporting information is available online at www.g3journal.org/lookup/suppl/doi:10.1534/g3.115.026849/-/DC11These authors contributed equally.2Corresponding authors: Division of Biomedical Sciences, Warwick Medical School,University of Warwick, Gibbet Hill Road, Biomedical Cell Biology, Coventry CV47AJ, United Kingdom. E-mail: [email protected]
Volume 6 | April 2016 | 805
which may be encoded in the autonomous elements (e.g., Ac) or exog-enously supplied (e.g., Ds) (McClintock 1951). Some of the features thatmake hAT transposons particularly amenable for transgenic work inzebrafish are the accurate mechanism of integration (with well-definedintegration sequences), the ability to be remobilized if desired, the small sizeof cis-required sequences (�600 bp), a reasonably high transposition fre-quency, andmoderate copy numbers (Emelyanov et al. 2006). Significantly,transposable element vectors have a relatively large insert capacity (.10 kb)and are easy to generate in a standard molecular genetics laboratory.
In contrast to transposable elements, retroviral vectors such asMMLV have a limited insert packaging size (usually ,8 kb) and theirproduction requires specialized technical expertise. However, retrovi-ruses are currently the most efficient way to make a large number ofinsertions in the zebrafish genome, producing a high number of inte-grations for a given experiment (Amsterdam et al. 2011). The high copynumber potential and high mutation rate were key features in thesuccessful use of the MMLV retroviral vector in an insertional muta-genesis screen that targeted a large number of protein coding genes inthe zebrafish genome (Varshney et al. 2013).
One important consideration affecting the choice of transgenicvector is their insertion site preferences. Integrations occurring in the59-end of genes are advantageous for creating insertional mutants.However, vectors that only target actively transcribed gene regions havelimited use in capturing genes that are expressed at low levels, or thoseregulated by alternative promoters and enhancers. Similarly, while tar-geting enhancer regions might be an advantage for enhancer trapsand detecting open chromatin, transgene expression might suffer fromthe variability imposed by positional effects (Roberts et al. 2014). More-over, targeting of specific repetitive elements might lead to transgeneinactivation, while targeting of 39-UTR sequences might lead tochanges in posttranscriptional regulation (Goll et al. 2009; McGaugheyet al. 2014; Shpiz et al. 2014).
Integration bias has been reported for transposons and retrovirusesin a number of systems (e.g., Vigdal et al. 2002; Wu et al. 2003, 2005;Faschinger et al. 2008; Linheiro and Bergman 2008; Liang et al. 2009;Vollbrecht et al. 2010). Integration target sites are thought to be rela-tively random at large genomic scales, although there have been reportsof association with genetic elements such as transcriptional start sites,strong enhancers or promoters, UTRs, and CpG islands (Wu et al.2003; Kondrychyn et al. 2009; Vollbrecht et al. 2010; LaFave et al.2014). At the nucleotide sequence level, different integrating elementshave shown various degrees of sequence bias. MMLV shows a weakpreference for T/A nucleotides just outside the 4 bp site of integration(LaFave et al. 2014). In contrast, Ac/Ds and Tol2 are not reported toshow specific integration motifs (Kawakami 2007; Kondrychyn et al.2009; Vollbrecht et al. 2010). However, these analyses have been limitedby the number of genomic features analyzed, and the reliance on asmall number of sites in some studies. Crucially, the available insertcollections generated in zebrafish were either selected based on reportergene expression or phenotypes, and only represent integrations thathave been incorporated in the germ-line (Kondrychyn et al. 2009;Kawakami et al. 2010; LaFave et al. 2014).
We recently described the use of an Ac/Ds transposon system for amutagenesis screen in zebrafish (Quach et al. 2015). We produced acollection of 642 transgenic lines marking distinct cell and tissue types,and mutagenized genes in the zebrafish genome by trapping andprematurely terminating endogenous protein coding sequences. Sig-nificantly, our gene/enhancer trap mutagenesis screen provides anunprecedented amount of Ds integration data in zebrafish.
In this study, we set out to analyze the genome-wide integrationpreferences of Ds in zebrafish. We examined how Ds integrations
compare to those of other popular tools for generating transgeniczebrafish (Tol2 transposon and MMLV retrovirus), from the chromo-some to the sequence level, and generated an unselected Ds integrationset to explore the effect of selection on integration site preferences. Wefind that Ds integrations are more broadly distributed across generegions than Tol2 and MMLV, and reporter-based selection does notaffect integration site characteristics. Interestingly, while a strict motifat the target site was not found, we observed a preference for struc-tural features correlated with DNA strand flexibility in the targetDNA, which we also found in Ds integrations in maize, and intransposon and retroviral integrations in mouse ES cells.
MATERIALS AND METHODS
Ds integration linesTheDs integration lines were generated as described previously (Quachet al. 2015). Briefly, we coinjected one-cell stage zebrafish embryoswith pDsDELGT4 (a gene and enhancer trap construct flanked byDs sequences) together with in vitro transcribed Ac transposasemRNA. The resulting founder lines were then selected based on ex-pression of either EGFP ormCherry indicating successful enhancer andgene trapping, respectively. To study Ds integration preferences in theabsence of external selection, pDsDELGT4 plasmid was microinjectedinto 576 embryos at the one-cell stage as described above. Injectedembryos were grown for 3–5 d to obtain sufficient DNA, pooled intogroups of 6 and subjected to next-generation sequencing (NGS).
Identification of Ds integration sites by TAIL-PCR andgenomic sequencingIn order to identify unique Ds insertion sites, we first used thermalasymmetric interlaced PCR (TAIL-PCR) on expression-selected linesas previously described (Quach et al. 2015). Flanking sequencesobtained fromTAIL-PCRwere analyzed against the zebrafish referencegenome (Zv9) using BLAT (Kent 2002). Flanking sequences were con-sidered unambiguously mapped if the entire TAIL-PCR generated se-quence matched a single location of the genome assembly with 85%identity or more. This identity cut-off was derived empirically to ac-count for differences between the AB strain used for Ds insertions andthe Tubingen reference genome, and sequence quality derived from theTAIL-PCR protocol. Any ambiguously mapping TAIL-PCR-derivedsequence was excluded from further analysis.
TAIL-PCR results represented only �75% of sites expected bySouthern blot analysis. To determine insertion sites for the lines thatcould not be resolved by TAIL-PCR, NGS was performed on the Illu-mina MiSeq as described (Varshney et al. 2013) with the followingmodifications. About 500 ng of genomic DNA was fragmented usingthree pairs of restriction enzymes (MseI/PstI, BfaI/BanII, and Csp6I/Eco24I) in parallel. The digested samples were pooled and ligatedwith DNA linkers, and amplified by linker-mediated PCR usinglinker and Ds specific primers to capture the adjacent genomic DNAsequences. The Ds/gDNA/linker amplicons were subsequently ligatedto Illumina paired-end adapters and sequenced. The first round ofPCR was performed using a 39-Ds ITR primer and a linker primer(59-TATGAAAATGAAAACGGTAGAGGTATTTTACCGACCG-39and 59-GTAATACGACTCACTATAGGGCACGCGTG-39, respectively)and the second round of PCRwas performed using nested 39-Ds ITR andlinker primers (59-TTTACCGACCGTTACCGACCGTTTTCATC-39and 59-GCGTGGTCGACTGCGCAT-39, respectively). Ds insertionsites were identified using a modified version of the GeIST programpreviously used to detect MMLV LTR sequences (LaFave et al. 2014).For NGS analysis of selected gene and enhancer lines, fish were
806 | P. Vrljicak et al.

out-crossed and their resulting embryos were placed in individual wells,following which DNA was extracted and sequenced. For unselected fish,DNA fromgroups of six injectedfishwas placed in onewell and sequenced.
NGS of selected Ds lines produced 5473 putative inserts withfragment counts ranging from 5–10,000. To obtain a high-confidenceintegration set, we performed PCR validation of a subset of NGS-identified sites. We also examined the sequencing results of singleinsert lines and obtained NGS fragment counts for TAIL-identifiedsites. Based on these observations, a putative integration site wasdeemed high-confidence if it was detected with . 50 counts.
Based on findings with the selected set, we devised similar criteriafor the unselected Ds set, although we lowered the general fragmentcount cut-off to 7 as we expected inserts to be diluted in each sample.We noticed that recognition sequences for restriction enzymes usedduring the NGS protocol were highly prevalent in single fragmentputative inserts. Therefore, we applied amore stringent cut-off criterionof 50 fragment counts for these sites, so that no more than 10% of thetotal sites contained the restriction enzyme recognition sequences.
Tol2 and MMLV integration sites and matched controlsInverse-PCR andTAIL-PCR results for Tol2 integrationswere obtainedfrom published gene and enhancer trap screens (Kawakami et al. 2010;Kondrychyn et al. 2011; http://kawakami.lab.nig.ac.jp/ztrap/; http://plover.imcb.a-star.edu.sg/), and mapped to the Zv9 genome assemblyas described above. MMLV retrovirus integration sites generated byNGS were obtained from the Zebrafish insertion collection (Varshneyet al. 2013; http://research.nhgri.nih.gov/ZInC/). We used variousmatched control sets for comparison, taking into account the sequenc-ing technique, genome mapping, and size of the different experimentalintegration sets. In the case of Tol2 andDs integration sites obtained byinverse-PCR and TAIL-PCR, we generated one million 50 bp randomgenomic locations using the BEDTools random tool (Quinlan and Hall2010), and mapped them back into the Zv9 genome assembly usingBowtie (Langmead et al. 2009) to remove regions mapping to multiplelocations. We then performed 1000 independent random samplings ofthese regions to produce control sets of the same size as the experimen-tal sets. For NGS-generated insertions, we replicated the conditions ofthe sequencing protocol and took account of repetitive regions of thegenome (LaFave et al. 2014). Briefly, we identified the location of allMseI, BfaI, and Csp6I restriction enzyme sites across the genome. Wethen calculated the distance from each integration to the nearest of thethree restriction sites that could have produced a mapable fragment.We used these distances to generate files containing one matched ran-dom integration of the same distance and same restriction site as eachexperimental integration. The corresponding sequences were thenaligned back to the Zv9 assembly with Bowtie using the same settingsas in the experimental workflow, repeating this process 1000 times. Inthis way, the random sites take into account two potential sources ofbias: distance from restriction sites and alignability of the read. Theselected and unselected Ds, Tol2, and MMLV integration sites used inour analysis are presented in Supporting Information, Table S1.
Bioinformatic analysesIntegration sites and control sets were compared with the variousgenomic features using BEDTools intersect (Quinlan and Hall 2010).Genomic features were considered overlapping if they shared at least1 bp of the insertion site. Location of CpG islands and repetitive ele-ments were obtained from the UCSC browser track. H3K4me1 andH3K4me3 hotspots were obtained from Aday et al. (2011), and CpGDNA methylation from McGaughey et al. (2014). Gene models wereobtained from the Ensembl database. Where appropriate, standard
nomenclature was followed (Mullins 1995). Gene ontology analysiswas performed with DAVID (Huang et al. 2009a,b).
Ensembl gene annotations were used for determining integrationsite distribution across gene regions, with different features obtainedfrom the UCSC track. Integrations were assigned to a gene when theyoccurred anywhere between 5 kb beyond the transcription start site(TSS) and the transcription termination site (TTS). All genes werecountedwhenmultiple genes overlapped the integration sites. Similarly,all features were counted when multiple gene features overlapped theintegration sites. Intergenic regions were defined as lying beyond 5 kbfromTSS or TTS. To look for distribution along a gene region, gene sizewas normalized to 100%. To study the distribution of insertion sitesacross theTSS andTTS, thedistance fromsitewasobtainedwithin a 1kbwindow around the gene feature.
Gene expression information was obtained from previously pub-lished RNA-seq experiments (Harvey et al. 2013). To estimate overallgene expression levels, we combined the expression level in FPKM(fragments per kb of transcript per million mapped reads) for eachgene across developmental time-points. Sites were assigned to geneswithin 6 5 kb of the TSS and TTS.
Statistical analysesWe carried out genomic feature preference analyses by bootstrapping,searching for values of a given random control data set that differedfrom the corresponding value in the experimental set. For a givengenomic feature, the enrichment value is the ratio of its prevalence inthe experimental set over each of thematched control sets averaged overthe total (n = 1000). To calculate the P-value, we counted the numberof random sets in which a particular feature was enriched or depletedin relation to the experimental set, and divided the total by 1000 (thenumber of random tests). P-values were calculated for both enrichmentand depletion in every category, although we only report the relevantP-values here. The significance threshold is P = 0.05.
Mouse cell integrationsRetrovirus and transposon integrations in mouse cells were obtainedfrom published datasets (de Jong et al. 2014). Specifically, 131,594Sleeping Beauty (SB) integrations and 1,222,667 piggyBac (PB) in-tegrations intomouse embryonic stem cells (mESC), togetherwith 180,469mouse mammary tumor virus (MMTV) integrations into mouse mam-mary gland cells (NMuMG), were analyzed for sequence and struc-tural motif discovery, using random integration sites as controls.
Motif and structural feature discoveryWe obtained 48 bases of flanking sequences from the zebrafish Zv9or mouse MM10 genome assemblies for motif analyses, preserving theorientation of insertion. In the case of Ds and Tol2 integrations weobtained 20 bases before and after the 8 bp duplicated site. For zebrafishMMLV ormouse SB, PB, andMMTV sites, we obtained 20 bases beforeand28bases after the insertion site, so that position21was always thefirstposition of the integration site. Consensus motifs were generated withweblogo v3 and displayed as bits or probability (Crooks et al. 2004).
We used crystallography-derived values to calculate six DNA strandmovements (Rise, Roll, Shift, Slide, Tilt, and Twist) around the in-tegration sites. Using a custom Python script, we reduced each 48 bpsequence to its underlying dinucleotides, such that position 1 and 2represented the first dinucleotide, position 2 and 3 represented thesecond dinucleotide and so on. Each dinucleotide was then assigned thecorresponding movement values deduced from crystallography data (Olsonet al. 1998). For example, a GC dinucleotide would produce an average of36.1 degrees of Twist, and 0.41Å of Slide, while a GG dinucleotide would
Volume 6 April 2016 | Inserts Reveal Genomic Structural Features | 807

correspond to 32.9 degrees of Twist and –0.22Å of Slide. These movementvalues were then averaged for each dinucleotide position and plotted.
Data availabilityThe authors state that all data necessary for confirming the conclusionspresented in the article are represented fully within the article.
RESULTS
Generation of high-confidence Ds integration sitesBased upon the experimental strategy shown in Figure 1, we generatedtwo sets of Ds integration data for our genome-wide analysis, one“selected” and one “unselected.” For the source of “selected” Ds sites,we analyzed zebrafish lines obtained as part of the FISHTRAPmutagen-
esis screen (http://fishtrap.warwick.ac.uk, Quach et al. 2015). These stabletransgenic lines were selected on the basis of expression of fluorescentreporters (mCherry and/or GFP) during the first 7 d of development andrepresent protein/enhancer trap events. To identify the Ds insertion sites,we first performed thermal asymmetric interlaced PCR (TAIL-PCR) on310 reporter positive fish lines generating 385 unique insertion sites.TAIL-PCR results representedonly�75%of sites estimated by Southernblot analysis (Figure S1), so we performed NGS on 106 of theselines and 114 additional lines, obtaining a total of 1685 unique high-confidence Ds integration sites from 424 zebrafish lines.
Remarkably, only �45% of the TAIL-identified flanking sites werealso identified byNGS. Both TAIL-PCR andNGS rely on unambiguousmappings to the genome assembly for integration site identification.
Figure 1 Experimental design. (A) Pipelinefor obtaining high-confidence selected andunselected Ds integration sets. Ds integra-tions were generated by injection of Dstrapping plasmid together with Ac transpo-sase capped-RNA at 1-cell stage. Followinginjection, larvae were collected at 3–4 dayspost fertilization (dpf) without selection toobtain a set of unbiased Ds integrations, orraised to adulthood, outcrossed, and selectedfor reporter gene expression. Ds integrationswere analyzed by thermal asymmetric inter-laced PCR (TAIL-PCR) and genomic sequenc-ing. Numbers in parenthesis (i.e., 310, 220and 576) represent the number of fish linesor injected embryos from which the Ds inte-gration sites were identified. (B) Data analysisscheme. Selected and unselected Ds integra-tions were compared with Tol2 and MMLV(Moloney Murine Leukemia Virus) sites. Onethousand controls were generated for each in-tegration dataset. RE, restriction endonuclease;Zv9, zebrafish reference genome.
808 | P. Vrljicak et al.

However, we found that TAIL-PCR produced longer flanking site se-quences and was more accommodating of mismatches between theTubingen-strain reference genome and the AB strain used in the Ac/Ds mutagenesis screen (Howe et al. 2013; Quach et al. 2015). In fact,133 out of the 385 inserts identified by TAIL-PCR differed substantiallyfrom the genome assembly and were not mapped by NGS, explainingthe limited overlap between the two techniques. In addition, somepreviously identified TAIL-PCR sites were detected at very low levelsin the NGS results (Figure S2), suggesting that different flanking se-quences might be more efficiently identified by the two techniques.
Since each selectedfish line contains on average 3–4 insertions, someof which are likely unrelated to the fluorescent reporter expressionpattern used to identify the line, we expect the selection bias to bemitigated in our dataset. However, these selected Ds inserts would stillhave to be incorporated into the germ-line for stable transmission.Therefore, in order to obtain an unbiased set of Ds integration sites,we performed NGS on 576 embryos that had been injected with theDs plasmid and Ac transposase mRNA, but not selected on the basisof transgene reporter expression. In total, we obtained a set of 1344high-confidence integrations which we used as our “unselected”Ds set.These two Ds insertion sets were compared with 15,223 unselectedMMLV retroviral insertions (Varshney et al. 2013) (Table 1), andanalyzed together with appropriately matched control sets of the samesize and mapping characteristics. Although limited by the smaller sam-ple size and various selection strategies, we also examined the distribu-tion of 379 Tol2 integrations combined from two published enhancerand protein trap datasets (which we henceforth refer to as the “selectedTol2” set) (Kawakami et al. 2010; Kondrychyn et al. 2011).
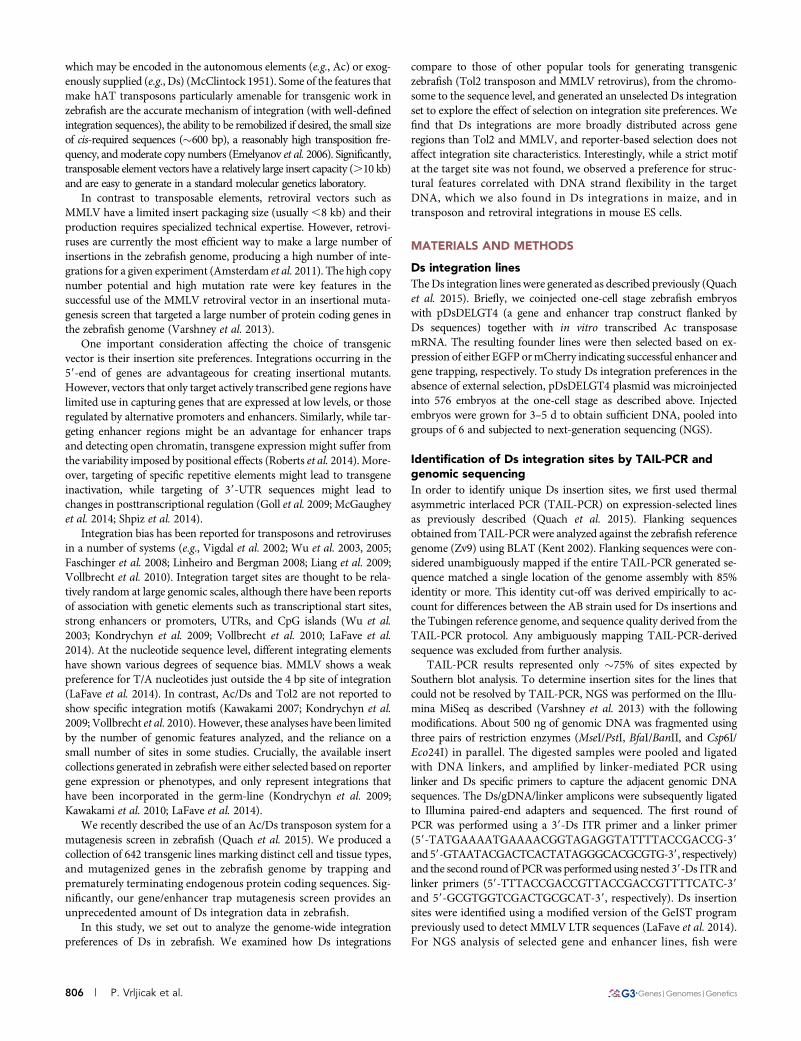
Ds integration sites are distributed throughout thezebrafish genomeTo investigate integration site preferences, we first examined theirdistribution across the zebrafish genome at the chromosome level(Figure 2). MMLV, selected Tol2, and selected and unselected Ds in-tegrations were found distributed across all 25 chromosomes. Consis-tent with some of the Tol2 integration sites having been created byremobilization of existing genomic integration sites, we observed en-richment of Tol2 sites close to donor locations in chromosomes 14 and24 (Kondrychyn et al. 2011). Although some chromosomal regionsappeared to be either over or underrepresented when compared tomatched controls, in general, Ds, Tol2, and MMLV integrations wereall found widely distributed across the genome, and we did not observeintegration rich regions shared across any of the datasets.
To explore if specific features of the genome were correlated withintegration events we analyzed the overlap of 25 genomic featureswith the integration datasets (Table S2). A plot of the statistically sig-nificant enriched and depleted genomic features is presented in Figure 3(with the full results shown in Table S3). In the following sections wediscuss the main findings.
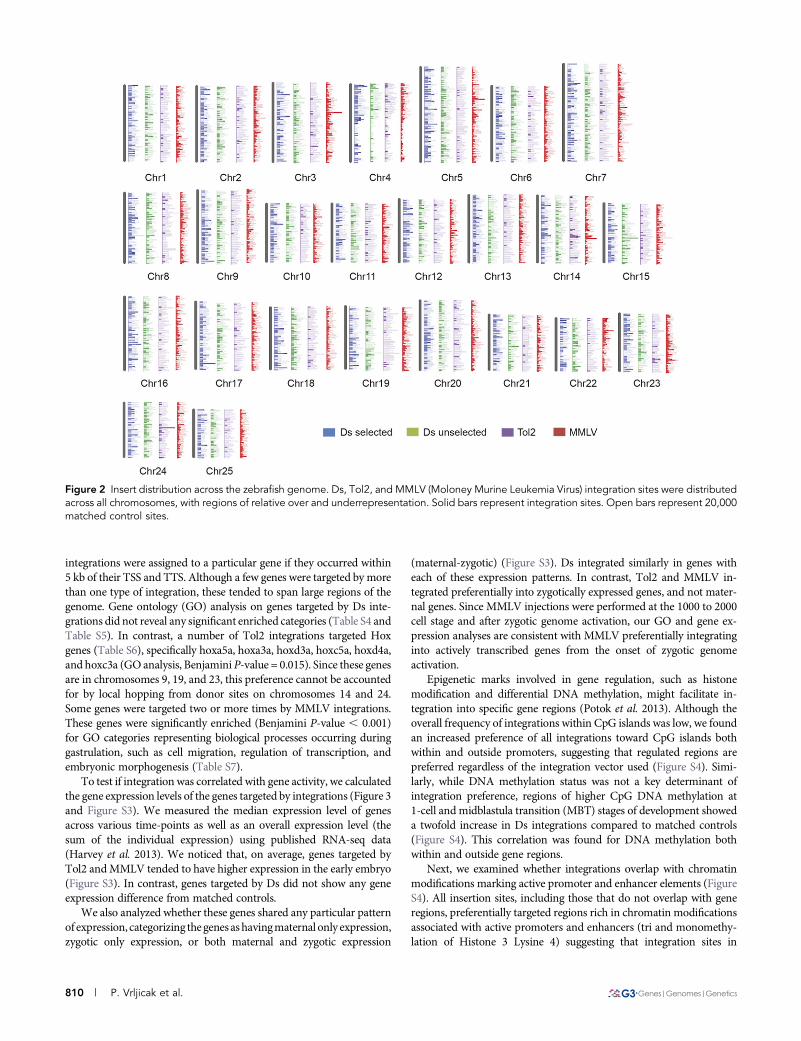
Ds insertions show preference toward gene regionsWe first examined whether Ds, Tol2, and MMLV integrated preferen-tially in gene regions.WeobtainedEnsembl geneprediction coordinatesand identified gene features such as introns, exons, and UTRs. Anyintegration occurring beyond 5 kb of the transcriptional start andtermination sites was deemed intergenic. We found that Ds, Tol2,and MMLV integrations were enriched around gene regions, but withdifferential preference for specific gene features (Figure 4A). Specifically,Ds integrations showed a preference for coding exons, whereas Tol2and MMLV preferentially integrated in the 59-UTR and regions up-stream of the TSS. In general, we observed no differences in thepreference of selected and unselected Ds integrations for intronic,59-UTR, 39-UTR, and intergenic regions. Detailed examination ofsites that overlapped gene regions showed that while MMLV andTol2 integrations are biased toward the first 10% of the gene area,Ds integration sites are more broadly distributed throughout generegions (Figure 4B).
Because of the preference of Tol2 and MMLV for the 59 region ofgenes, we examined the distribution of integrations around the TSS(Figure 4C). MMLV integrations were significantly biased downstreamof the TSS, consistent with previous observations in human cells thatidentified MMLV integrations going into enhancers within the 1st in-tron (Wu et al. 2003; LaFave et al. 2014). In contrast, both Tol2 and Dsintegrations show a symmetrical distribution around the TSS, althoughthe number of transposon integrations was smaller than those forMMLV. We found no similarity in integration patterns around theTTS for Ds, Tol2, or MMLV. Taken together, we found that Ds,Tol2, and MMLV integrations have a preference for gene regions.Ds integrations were found more broadly distributed along genes,unlike Tol2 and MMLV, which showed a significant bias toward the59 region of genes.
Integrations are correlated with measures of gene andenhancer activityNext, we asked whether the genes targeted by transposon and retroviralintegrations shared any common characteristics. For this analysis,
n Table 1 Integration datasets analyzed in this work
Database Model SelectionGerm-LineIntegration Stage Injected
DetectionTechnique Mapped Sites Reference
Ds selected Zebrafish Yes Yes 1-cell TAIL-PCR 383 (Quach et al. 2015)NGS 1355 This workTotal 1685
Ds unselected Zebrafish No No 1-cell NGS 1344 This workTol2 selected Zebrafish Yes Yes 1–2 cell Inverse-PCR 75 (Kawakami et al. 2010)
Yes Yes 1–2 cell TAIL-PCR 304 (Kondrychyn et al. 2011)Total 379
MMLV Zebrafish No Yes 1000–2000 cell NGS 15,223 (Varshney et al. 2013)Sleeping beauty mESC No N/A N/A NGS 131,594 (de Jong et al. 2014)PiggyBac mESC No N/A N/A NGS 122,667 (de Jong et al. 2014)MMTV Mouse mammary
cellsNo N/A N/A NGS 180,469 (de Jong et al. 2014)
TAIL-PCR, thermal asymmetric interlaced PCR; NGS, next-generation sequencing; MMLV, Moloney Murine Leukemia Virus; mESC, mouse embryonic stem cells;MMTV, Mouse Mammary Tumor Virus.
Volume 6 April 2016 | Inserts Reveal Genomic Structural Features | 809
integrations were assigned to a particular gene if they occurred within5 kb of their TSS and TTS. Although a few genes were targeted by morethan one type of integration, these tended to span large regions of thegenome. Gene ontology (GO) analysis on genes targeted by Ds inte-grations did not reveal any significant enriched categories (Table S4 andTable S5). In contrast, a number of Tol2 integrations targeted Hoxgenes (Table S6), specifically hoxa5a, hoxa3a, hoxd3a, hoxc5a, hoxd4a,and hoxc3a (GO analysis, Benjamini P-value = 0.015). Since these genesare in chromosomes 9, 19, and 23, this preference cannot be accountedfor by local hopping from donor sites on chromosomes 14 and 24.Some genes were targeted two or more times by MMLV integrations.These genes were significantly enriched (Benjamini P-value , 0.001)for GO categories representing biological processes occurring duringgastrulation, such as cell migration, regulation of transcription, andembryonic morphogenesis (Table S7).
To test if integration was correlated with gene activity, we calculatedthe gene expression levels of the genes targeted by integrations (Figure 3and Figure S3). We measured the median expression level of genesacross various time-points as well as an overall expression level (thesum of the individual expression) using published RNA-seq data(Harvey et al. 2013). We noticed that, on average, genes targeted byTol2 andMMLV tended to have higher expression in the early embryo(Figure S3). In contrast, genes targeted by Ds did not show any geneexpression difference from matched controls.
We also analyzed whether these genes shared any particular patternof expression, categorizing the genesashavingmaternal only expression,zygotic only expression, or both maternal and zygotic expression
(maternal-zygotic) (Figure S3). Ds integrated similarly in genes witheach of these expression patterns. In contrast, Tol2 and MMLV in-tegrated preferentially into zygotically expressed genes, and not mater-nal genes. Since MMLV injections were performed at the 1000 to 2000cell stage and after zygotic genome activation, our GO and gene ex-pression analyses are consistent with MMLV preferentially integratinginto actively transcribed genes from the onset of zygotic genomeactivation.
Epigenetic marks involved in gene regulation, such as histonemodification and differential DNA methylation, might facilitate in-tegration into specific gene regions (Potok et al. 2013). Although theoverall frequency of integrations within CpG islands was low, we foundan increased preference of all integrations toward CpG islands bothwithin and outside promoters, suggesting that regulated regions arepreferred regardless of the integration vector used (Figure S4). Simi-larly, while DNA methylation status was not a key determinant ofintegration preference, regions of higher CpG DNA methylation at1-cell and midblastula transition (MBT) stages of development showeda twofold increase in Ds integrations compared to matched controls(Figure S4). This correlation was found for DNA methylation bothwithin and outside gene regions.
Next, we examined whether integrations overlap with chromatinmodifications marking active promoter and enhancer elements (FigureS4). All insertion sites, including those that do not overlap with generegions, preferentially targeted regions rich in chromatin modificationsassociated with active promoters and enhancers (tri and monomethy-lation of Histone 3 Lysine 4) suggesting that integration sites in
Figure 2 Insert distribution across the zebrafish genome. Ds, Tol2, and MMLV (Moloney Murine Leukemia Virus) integration sites were distributedacross all chromosomes, with regions of relative over and underrepresentation. Solid bars represent integration sites. Open bars represent 20,000matched control sites.
810 | P. Vrljicak et al.

intergenic regions might represent unannotated genes or novel en-hancer elements.
Integrations in repetitive sequencesRepetitive elements, which account for 52.2% of the zebrafishgenome (Howe et al. 2013), have been shown to have roles inchromosome structural organization, gene regulation, genome in-tegrity, and evolution (Kidwell and Lisch 2000; Lander et al. 2001;Waterston et al. 2002; Feschotte 2008; Ting et al. 2011; Zhu et al.2011). Therefore, we examined the integration preferences for thevarious repetitive element families, such as DNA transposons,LINEs, and SINEs, present in the zebrafish genome (Figure S5).DNA transposon sequences and low-complexity repeats were con-sistently underrepresented in sites of integration. However, weobserved varying preferences for the other types of repetitive ele-ments. Specifically, we noticed that LTR sequences were overrep-resented in MMLV integration sites, while SINE, LINE, and simple
repeats were underrepresented. In contrast, we observed a weakoverrepresentation of Ds integration sites overlapping SINE andLTR elements, but no significant over or underrepresentation ofsites overlapping simple repeats.
Ds and Tol2 target sites do not show a strictsequence motifWe then examinedwhether any features at the sequence level could helppredict Ds, Tol2, and MMLV integrations in the zebrafish genome.In contrast to the strong binding site preference for the element ends,no strong target site consensus sequences have been identified for Dsand Tol2. However, a weak preference for specific nucleotides at thetarget site has been reported. Previous analysis of Ds integrations inmaize suggested thepresenceof aweakpalindromic consensus sequenceat the target site (Vollbrecht et al. 2010), while Tol2 integrations inzebrafish suggested the presence of a TNA(C/G)TTATAA(G/C)TNAmotif (Kondrychyn et al. 2009). Therefore, we searched for a consensus
Figure 3 Summary of genomic features analyzed. Genomic features analyzed for (A) Ds selected, (B) Ds unselected, (C) Tol2, and (D) MMLV(Moloney Murine Leukemia Virus). Average fold enrichment values (representing 1000 ratios of experimental over match controls) plotted on they-axis. P-values plotted on the x-axis. Statistically significant enriched/depleted features with P-value , 0.05 are presented (detailed results areprovided in Table S3).
Volume 6 April 2016 | Inserts Reveal Genomic Structural Features | 811
sequence at the target site in our Ds data and in the MMLV dataset(Figure 5A).
Consistent with previous reports, MMLV integrates preferentiallyin AT-rich regions (Wu et al. 2005; LaFave et al. 2014), and we alsoobserved a region of relative AT depletion following the integration site.In our analyses, we were able to detect the weak consensus sequencepreviously reported for Tol2 (Kondrychyn et al. 2009). We did not
observe the weak sequence motif for Ds integration sites previouslyobserved in maize (Figure 6). However, when insertion site se-quences were aggregated, we noticed a weak palindromic motifspanning 14 bases around the Ds insertion site with consensus sim-ilar to Tol2. This sequence is seldom found within the dataset targetsequences per se, and appears only when insertion sites areaggregated.
Figure 4 Distribution of integration sites across gene regions. (A) Fold enrichment values for various gene subregions. Average enrichment 6standard error (n = 1000). Ds integrations show preference for coding and 59 gene regions. Tol2 and MMLV (Moloney Murine Leukemia Virus)integrations show preference for 59 regions of genes. (B) Ds integrations are distributed uniformly across the length of gene regions, while Tol2and MMLV are enriched toward the first 10% of genes. (C) Ds, Tol2, and MMLV show enrichment close to transcription start site (TSS), but are notenriched around the transcription termination site (TTS) (D). Solid blue bars represent integration sites. Open red bars represent average of 1000matched controls 6 standard deviation.
812 | P. Vrljicak et al.
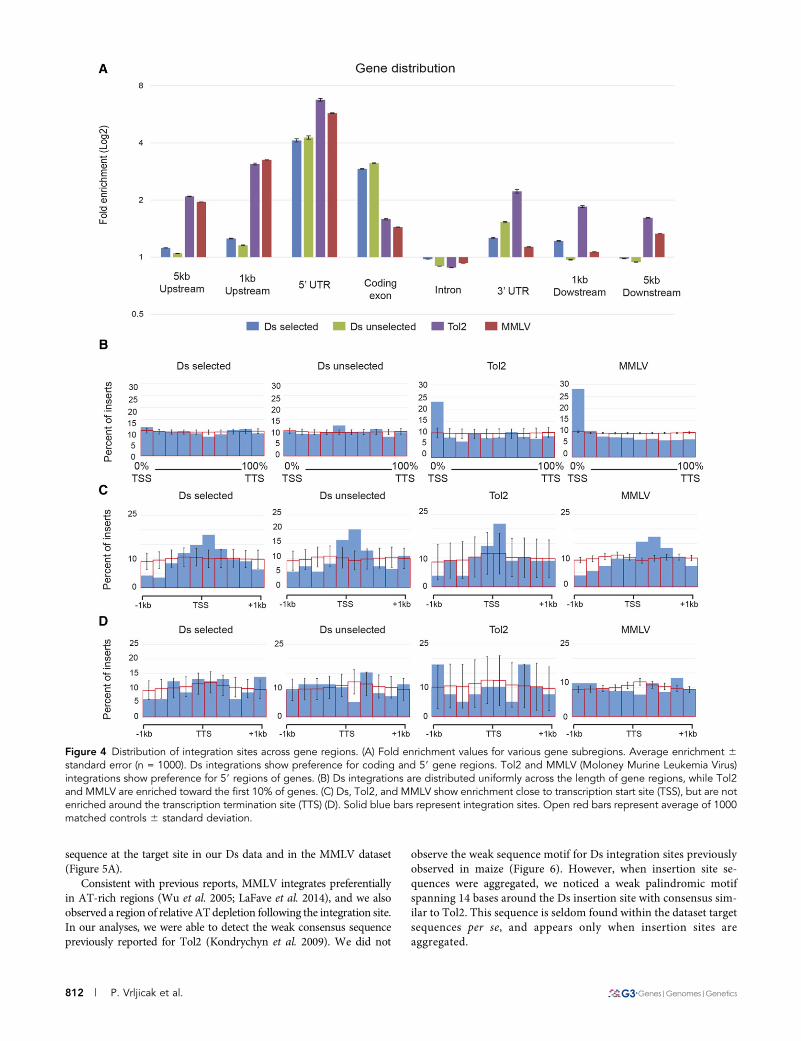
Transposon and retroviral integration sites show similarstructural featuresLocal interactions between adjacent nucleotides can induce distor-tions in the regular double helix structure (Olson et al. 1998). To testwhether integration sites were more likely to be deformed by protein-DNA interactions, we used data from protein-DNA complexes tocalculate six structural features of DNA: Rise, Roll, Shift, Slide, Tilt,and Twist. For example, protein DNA-twist predicts the twist angletorsion between adjacent bases, so that a dinucleotide pair with ahigh value of protein-DNA twist is more likely to be deformed byprotein–DNA interaction than one with a lower value. For trans-poson integrations, we observed significant changes from normalfor these six features arranged in a symmetrical pattern around thetarget sites (Figure 5B). For retroviral integrations, the outlying val-ues extended a few bases downstream of the target site. Regardless ofthe vector used, all integrations appear to fall in regions of higherDNA flexibility.
To determine if this feature is specific to integrations in zebrafish orwhether it is found in other vertebrate genomes, we analyzed previouslyreported integration sites for Sleeping beauty and piggyBac transposonsin mouse ESCs, and mouse mammary tumor retrovirus (MMTV) inmousemammary cells (de Jong et al. 2014) (Figure 7A). Sleeping beauty
was found to target TATA sequences and piggyBac insertions fell inAT-rich regions. In contrast, no consensus sequence motif was ob-served for MMTV retroviral insertions. Nonetheless, all integrationsoccurred at regions of highDNA flexibility (Figure 7B). Taken together,our findings suggest that structural features in the target DNA arecommon in transposon and retroviral integration sites in vertebrategenomes, and can potentially be used to enhance the efficiency ofgenome engineering by these and other methods.
DISCUSSIONTransgenesis is a powerful tool which, coupled to new genome editingtechniques, continues tomake zebrafish an excellentmodel organism inwhich to perform functional genomic studies. In this study,we set out tocompare the integrationpreferencesof threepopular tools forgeneratingtransgenics (MMLV retrovirus, andDs andTol2 transposons).We useda combination of TAIL-PCR and NGS to detect Ds integration sites.Only�45% of Ds sites identified by TAIL-PCRwere captured by NGS.Many of the Ds integration sites that were not detected by genomicsequencing showed variation from the genome assembly sequence,suggesting they were not mapped under the parameters used. Ds sitesshowed a wide range of detection efficiency as measured by averagefragment counts produced. Differences in the distance of the insertion
Figure 5 Target sites show structural features even in the absence of a strict motif. (A) Graphical representations of nucleic acid multiple sequencealignment were generated with WebLogo v3.4 (Crooks et al. 2004). Ds and Tol2 integrations show weak preference for specific nucleotides at theintegration site. Numbers on top indicate nucleotide position around the integration site shown on the x-axis. Information measured in bits andprobability is shown on the y-axis. (B) Average values of protein-DNA movement for each position in the multiple sequence alignment plottedaccording to their values. Numbers on top indicate position around the integration site shown on the x-axis. Red lines represent integration sitedata. Blue lines denote the average of matched controls (n = 1000). MMLV, Moloney Murine Leukemia Virus.
Volume 6 April 2016 | Inserts Reveal Genomic Structural Features | 813

site to the restriction enzyme cut site used during the NGS protocol,or the efficiency of PCR amplification, could potentially explain thedifferent isolation efficiencies observed.
The use ofNGS formappingmade it possible to identify integrationsin the absence of germ-line transmission or reporter expression. Wefound selected and unselected Ds sites to have remarkably similarintegration characteristics. Because each selected fish line contains�3–4 insertions, it is possible that some of the selection bias could have
been mitigated in our Ds “selected” dataset. However, we did notobserve a significant difference in genomic feature overlap betweenselected lines harboring one vs. multiple insertions either. Therefore,the similarity between selected and unselected insertions is unlikely tobe explained by the number of insertions per line alone (Figure S6).
Despite the small sample size of Tol2 integrations and differentselection strategies in the various screens, we found that all vectorsshowed a preference for gene regions. Tol2 and MMLV were largely
Figure 6 Ds integration site analysis in maize. 1826 Ds integration sites were obtained from published datasets (Vollbrecht et al. 2010) andcompared against random integration sites. (A) Sequence logo for Ds integrations. (B) Structural features of DNA at integration sites.
814 | P. Vrljicak et al.

concentrated around the 59 regions of highly expressed genes. Incontrast, we found that Ds sites were enriched in coding regions,and broadly distributed along gene regions, matching regions ofhigh DNA methylation outside of promoters. Significantly, Ds in-tegration preference for gene regions was found even in the absenceof selection.
The zebrafish genome shows an overall repeat content of 52.2%, thehighest reported so far in a vertebrate (Howe et al. 2013). Consistentwith this, integrations frequently overlapped repetitive elements. Anal-ysis of repetitive elements in the zebrafish genome revealed that LTRs,low complexity, and simple repeats are more likely found in codinggene regions, while SINE elements are more likely present in 59-UTRs(Figure S7). Our matched control sets have similar mapping character-istics to the experimental integration sets, therefore differences in map-ping cannot account for the relative depletion of low complexity repeatswithin integration sites. The preferential integration into specific re-petitive elements could represent a preference for their specific under-lying sequences or the resulting structural characteristics. Alternatively,other genomic characteristics could be correlated with the differentrepetitive elements. Repetitive sequences show differential methylationand activity in zebrafish (McGaughey et al. 2014). DNA repeats havealso been shown to be transcribed, and have been suggested to provideregulatory elements to protein-coding genes (Wang et al. 2007b;Bourque et al. 2008; Faulkner et al. 2009; Tyekucheva et al. 2011).Moreover, binding sites for important regulatory factors such as CTCFor TP53 are often associated with genomic repeats (Wang et al. 2007b;Bourque et al. 2008; Chadwick 2008; Simeonova et al. 2012).
An important question concerns the presence of particular insertionhotspots, since integration can cause adverse events such as activationof proto-oncogenes or inactivation of essential cellular genes. Both Tol2
and MMLV showed enrichment for specific GO categories. Ds inte-grations showed no observable correlation with specific gene types.While no single transgenic tool will be equally suited for every exper-imental inquiry, our analyses should help in the choice of transgenicsystem for interrogating gene function.
At the sequence level, both Ds and Tol2 target sites shared a similarweakmotif that appeared only when sequences were aggregated. Theweak motif likely reflects structural features of the target DNA.Current genome editing methods rely exclusively upon nucleotidesequence for selection of targeting sites (Lim et al. 2013; Irion et al.2014). Our analysis of known transposon and retroviral integrationsites in mouse ES cells and in zebrafish shows that regions of higherDNA flexibility are preferred for integrations of exogenous se-quences. Thus, structural features in DNA influence the site of in-sertion in vertebrate genomes. This feature can potentially be usedin combination with sequence information to enhance the efficiencyof genome editing, and to improve precision engineering at desiredlocations within genomes.
We found the presence of DNA flexibility features to be conservedamong different types of integrations and in different species. However,the specific features differ from system to system, likely resulting fromdifferences in their mechanisms of integration, or the presence ofdifferent cofactors. The ability of hAT transposons to function in diversespecies suggests that they might not require specific cofactors, or relyon very highly conserved cofactors (Weil and Kunze 2000; Emelyanovet al. 2006). In contrast, several groups have identified bromodomainand extraterminal (BET) proteins as the major host factors that spe-cifically interact with MMLV integrase and mediate the preferentialintegration of MMLV near TSS (Studamire and Goff 2008; De Rijcket al. 2013; Gupta et al. 2013; Sharma et al. 2013).
Figure 7 Measures of DNA flexibility show similar features in transposon and retroviral integration sites in mouse cells. (A) Sequence logo forvarious integrations in mouse cells show an obvious common motif. Numbers on top indicate position around the integration site shown on thex-axis. Information measured in bits and probability shown on y-axis. (B) Structural features of DNA at integration sites. Average DNA flexibilityvalues shown in y-axes. Nucleotide position shown on x-axis. MMTV, Mouse Mammary Tumor Virus.
Volume 6 April 2016 | Inserts Reveal Genomic Structural Features | 815

In summary, our genome-wide analysis shows that Ds integrationsites in the presence or absence of selection are remarkably similar andcan be found across the genome.A strictmotif associatedwith target sitewas not found, but a preference for structural features in the targetDNAwas observed. Remarkably, this feature is also found in transposonand retroviral integrations in maize and mouse cells. Our findingsshow that structural features influence the integration of heterologousDNA in vertebrate genomes, and can facilitate efficient targeted genomeengineering.
ACKNOWLEDGMENTSWe thank the Sampath laboratory for discussions and suggestions;H. Woodland and L. Sivashanmugam for suggestions to improve themanuscript. G.K.V., M.C.L., and S.M.B. were supported by the Intra-mural Research Program of the National Human Genome ResearchInstitute, National Institutes of Health. K.S. and P.V. are supported byWarwick Medical School.Author contributions: DNA sample preparation and sperm cryopres-ervation was performed by H.N.B.Q., S.T., P.V., and K.S. TAILsequencing was performed by H.N.B.Q., S.T., and A.J. Next-genera-tion sequencing was performed by G.K.V. and S.M.B. P.V., M.C.L.,S.M.B., and K.S. analyzed the data. P.V. and K.S. wrote the manuscriptwith input from all authors. The authors declare no conflict of interest.
LITERATURE CITEDAday, A. W., L. J. Zhu, A. Lakshmanan, J. Wang, and N. D. Lawson,
2011 Identification of cis regulatory features in the embryonic zebrafishgenome through large-scale profiling of H3K4me1 and H3K4me3 bind-ing sites. Dev. Biol. 357: 450–462.
Aiuti, A., S. Slavin, M. Aker, F. Ficara, S. Deola et al., 2002 Correction ofADA-SCID by stem cell gene therapy combined with nonmyeloablativeconditioning. Science 296: 2410–2413.
Amsterdam, A., G. K. Varshney, and S. M. Burgess, 2011 Retroviral-mediated insertional mutagenesis in zebrafish. Methods Cell Biol. 104:59–82.
Bourque, G., B. Leong, V. B. Vega, X. Chen, Y. L. Lee et al., 2008 Evolutionof the mammalian transcription factor binding repertoire via transpos-able elements. Genome Res. 18: 1752–1762.
Calvi, B. R., T. J. Hong, S. D. Findley, and W. M. Gelbart, 1991 Evidencefor a common evolutionary origin of inverted repeat transposons inDrosophila and plants: hobo, Activator, and Tam3. Cell 66: 465–471.
Cavazzana-Calvo, M., S. Hacein-Bey, G. de Saint Basile, F. Gross, E. Yvonet al., 2000 Gene therapy of human severe combined immunodeficiency(SCID)-X1 disease. Science 288: 669–672.
Chadwick, B. P., 2008 DXZ4 chromatin adopts an opposing conformationto that of the surrounding chromosome and acquires a novel inactiveX-specific role involving CTCF and antisense transcripts. Genome Res.18: 1259–1269.
Cheng, L. D., X. Y. Jiang, Y. M. Tian, J. Chen, and S. M. Zou, 2014 Thegoldfish hAT-family transposon Tgf2 is capable of autonomous excisionin zebrafish embryos. Gene 536: 74–78.
Crooks, G. E., G. Hon, J. M. Chandonia, and S. E. Brenner, 2004 WebLogo:a sequence logo generator. Genome Res. 14: 1188–1190.
Davie, K., J. Jacobs, M. Atkins, D. Potier, V. Christiaens et al.,2015 Discovery of transcription factors and regulatory regions drivingin vivo tumor development by ATAC-seq and FAIRE-seq open chro-matin profiling. PLoS Genet. 11: e1004994.
de Jong, J., W. Akhtar, J. Badhai, A. G. Rust, R. Rad et al., 2014 Chromatinlandscapes of retroviral and transposon integration profiles. PLoS Genet.10: e1004250.
De Ravin, S. S., L. Su, N. Theobald, U. Choi, J. L. Macpherson et al.,2014 Enhancers are major targets for murine leukemia virus vectorintegration. J. Virol. 88: 4504–4513.
De Rijck, J., C. de Kogel, J. Demeulemeester, S. Vets, S. El Ashkar et al.,2013 The BET family of proteins targets moloney murine leukemiavirus integration near transcription start sites. Cell Reports 5: 886–894.
Emelyanov, A., Y. Gao, N. I. Naqvi, and S. Parinov, 2006 Trans-kingdomtransposition of the maize dissociation element. Genetics 174: 1095–1104.
Faschinger, A., F. Rouault, J. Sollner, A. Lukas, B. Salmons et al.,2008 Mouse mammary tumor virus integration site selection in humanand mouse genomes. J. Virol. 82: 1360–1367.
Faulkner, G. J., Y. Kimura, C. O. Daub, S. Wani, C. Plessy et al., 2009 Theregulated retrotransposon transcriptome of mammalian cells. Nat. Genet.41: 563–571.
Feschotte, C., 2008 Transposable elements and the evolution of regulatorynetworks. Nat. Rev. Genet. 9: 397–405.
Genovesi, L. A., C. G. Ng, M. J. Davis, M. Remke, M. D. Taylor et al.,2013 Sleeping Beauty mutagenesis in a mouse medulloblastoma modeldefines networks that discriminate between human molecular subgroups.Proc. Natl. Acad. Sci. USA 110: E4325–E4334.
Goll, M. G., R. Anderson, D. Y. Stainier, A. C. Spradling, and M. E. Halpern,2009 Transcriptional silencing and reactivation in transgenic zebrafish.Genetics 182: 747–755.
Guo, Y., J. M. Park, B. Cui, E. Humes, S. Gangadharan et al.,2013 Integration profiling of gene function with dense maps of trans-poson integration. Genetics 195: 599–609.
Gupta, S. S., T. Maetzig, G. N. Maertens, A. Sharif, M. Rothe et al.,2013 Bromo- and extraterminal domain chromatin regulators serveas cofactors for murine leukemia virus integration. J. Virol. 87:12721–12736.
Harvey, S. A., I. Sealy, R. Kettleborough, F. Fenyes, R. White et al.,2013 Identification of the zebrafish maternal and paternal transcrip-tomes. Development 140: 2703–2710.
Howe, K., M. D. Clark, C. F. Torroja, J. Torrance, C. Berthelot et al.,2013 The zebrafish reference genome sequence and its relationship tothe human genome. Nature 496: 498–503.
Huang, D. W., B. T. Sherman, and R. A. Lempicki, 2009a Bioinformaticsenrichment tools: paths toward the comprehensive functional analysis oflarge gene lists. Nucleic Acids Res. 37: 1–13.
Huang, D. W., B. T. Sherman, and R. A. Lempicki, 2009b Systematicand integrative analysis of large gene lists using DAVID bioinformaticsresources. Nat. Protoc. 4: 44–57.
Irion, U., J. Krauss, and C. Nusslein-Volhard, 2014 Precise and efficientgenome editing in zebrafish using the CRISPR/Cas9 system. Development141: 4827–4830.
Kawakami, K., 2007 Tol2: a versatile gene transfer vector in vertebrates.Genome Biol. 8(Suppl 1): S7.
Kawakami, K., and T. Noda, 2004 Transposition of the Tol2 element, anAc-like element from the Japanese medaka fish Oryzias latipes, in mouseembryonic stem cells. Genetics 166: 895–899.
Kawakami, K., H. Takeda, N. Kawakami, M. Kobayashi, N. Matsuda et al.,2004 A transposon-mediated gene trap approach identifies develop-mentally regulated genes in zebrafish. Dev. Cell 7: 133–144.
Kawakami, K., G. Abe, T. Asada, K. Asakawa, R. Fukuda et al., 2010 zTrap:zebrafish gene trap and enhancer trap database. BMC Dev. Biol. 10: 105.
Kent, W. J., 2002 BLAT–the BLAST-like alignment tool. Genome Res. 12:656–664.
Kidwell, M. G., and D. R. Lisch, 2000 Transposable elements and hostgenome evolution. Trends Ecol. Evol. 15: 95–99.
Koga, A., M. Suzuki, H. Inagaki, Y. Bessho, and H. Hori, 1996 Transposableelement in fish. Nature 383: 30.
Kondrychyn, I., M. Garcia-Lecea, A. Emelyanov, S. Parinov, and V. Korzh,2009 Genome-wide analysis of Tol2 transposon reintegration inzebrafish. BMC Genomics 10: 418.
Kondrychyn, I., C. Teh, M. Garcia-Lecea, Y. Guan, A. Kang et al.,2011 Zebrafish Enhancer TRAP transgenic line database ZETRAP 2.0.Zebrafish 8: 181–182.
LaFave, M. C., G. K. Varshney, D. E. Gildea, T. G. Wolfsberg, A. D. Baxevaniset al., 2014 MLV integration site selection is driven by strong enhancersand active promoters. Nucleic Acids Res. 42: 4257–4269.
816 | P. Vrljicak et al.

Lander, E. S., L. M. Linton, B. Birren, C. Nusbaum, M. C. Zody et al.,2001 Initial sequencing and analysis of the human genome. Nature 409:860–921.
Langmead, B., C. Trapnell, M. Pop, and S. L. Salzberg, 2009 Ultrafastand memory-efficient alignment of short DNA sequences to the humangenome. Genome Biol. 10: R25.
Liang, Q., J. Kong, J. Stalker, and A. Bradley, 2009 Chromosomal mobili-zation and reintegration of Sleeping Beauty and PiggyBac transposons.Genesis 47: 404–408.
Lim, S., Y. Wang, X. Yu, Y. Huang, M. S. Featherstone et al., 2013 A simplestrategy for heritable chromosomal deletions in zebrafish via the combi-natorial action of targeting nucleases. Genome Biol. 14: R69.
Lin, S., N. Gaiano, P. Culp, J. C. Burns, T. Friedmann et al.,1994 Integration and germ-line transmission of a pseudotyped retro-viral vector in zebrafish. Science 265: 666–669.
Linheiro, R. S., and C. M. Bergman, 2008 Testing the palindromic targetsite model for DNA transposon insertion using the Drosophila mela-nogaster P-element. Nucleic Acids Res. 36: 6199–6208.
McClintock, B., 1951 Chromosome organization and genic expression.Cold Spring Harb. Symp. Quant. Biol. 16: 13–47.
McGaughey, D. M., H. O. Abaan, R. M. Miller, P. A. Kropp, and L. C. Brody,2014 Genomics of CpG methylation in developing and developedzebrafish. G3 (Bethesda) 4: 861–869.
McGrail, M., J. M. Hatler, X. Kuang, H. K. Liao, K. Nannapaneni et al.,2011 Somatic mutagenesis with a Sleeping Beauty transposon systemleads to solid tumor formation in zebrafish. PLoS One 6: e18826.
Mullins, M., 1995 Genetic nomenclature guide. Zebrafish. Trends Genet.Mar: 31–32.
Olson, W. K., A. A. Gorin, X. J. Lu, L. M. Hock, and V. B. Zhurkin,1998 DNA sequence-dependent deformability deduced from protein-DNA crystal complexes. Proc. Natl. Acad. Sci. USA 95: 11163–11168.
Potok, M. E., D. A. Nix, T. J. Parnell, and B. R. Cairns,2013 Reprogramming the maternal zebrafish genome after fertilizationto match the paternal methylation pattern. Cell 153: 759–772.
Quach, H. N., S. Tao, P. Vrljicak, A. Joshi, H. Ruan et al., 2015 A multi-functional mutagenesis system for analysis of gene function in zebrafish.G3 (Bethesda) 5: 1283–1299.
Quinlan, A. R., and I. M. Hall, 2010 BEDTools: a flexible suite of utilitiesfor comparing genomic features. Bioinformatics 26: 841–842.
Rad, R., L. Rad, W. Wang, A. Strong, H. Ponstingl et al., 2015 A conditionalpiggyBac transposition system for genetic screening in mice identifiesoncogenic networks in pancreatic cancer. Nat. Genet. 47: 47–56.
Roberts, J. A., I. Miguel-Escalada, K. J. Slovik, K. T. Walsh, Y. Hadzhiev et al.,2014 Targeted transgene integration overcomes variability of positioneffects in zebrafish. Development 141: 715–724.
Sharma, A., R. C. Larue, M. R. Plumb, N. Malani, F. Male et al., 2013 BETproteins promote efficient murine leukemia virus integration at tran-scription start sites. Proc. Natl. Acad. Sci. USA 110: 12036–12041.
Shpiz, S., S. Ryazansky, I. Olovnikov, Y. Abramov, and A. Kalmykova,2014 Euchromatic transposon insertions trigger production of novelPi- and endo-siRNAs at the target sites in the drosophila germline. PLoSGenet. 10: e1004138.
Simeonova, I., V. Lejour, B. Bardot, R. Bouarich-Bourimi, A. Morin et al.,2012 Fuzzy tandem repeats containing p53 response elements maydefine species-specific p53 target genes. PLoS Genet. 8: e1002731.
Song, G., Q. Li, Y. Long, Q. Gu, P. B. Hackett et al., 2012 Effective genetrapping mediated by Sleeping Beauty transposon. PLoS One 7: e44123.
Studamire, B., and S. P. Goff, 2008 Host proteins interacting with theMoloney murine leukemia virus integrase: multiple transcriptionalregulators and chromatin binding factors. Retrovirology 5: 48.
Takeda, H., Z. Wei, H. Koso, A. G. Rust, C. C. Yew et al., 2015 Transposonmutagenesis identifies genes and evolutionary forces driving gastroin-testinal tract tumor progression. Nat. Genet. 47: 142–150.
Ting, D. T., D. Lipson, S. Paul, B. W. Brannigan, S. Akhavanfard et al.,2011 Aberrant overexpression of satellite repeats in pancreatic andother epithelial cancers. Science 331: 593–596.
Tyekucheva, S., R. H. Yolken, W. R. McCombie, J. Parla, M. Kramer et al.,2011 Establishing the baseline level of repetitive element expression inthe human cortex. BMC Genomics 12: 495.
Varshney, G. K., J. Lu, D. E. Gildea, H. Huang, W. Pei et al., 2013 A large-scale zebrafish gene knockout resource for the genome-wide study of genefunction. Genome Res. 23: 727–735.
Vigdal, T. J., C. D. Kaufman, Z. Izsvak, D. F. Voytas, and Z. Ivics,2002 Common physical properties of DNA affecting target siteselection of sleeping beauty and other Tc1/mariner transposableelements. J. Mol. Biol. 323: 441–452.
Vollbrecht, E., J. Duvick, J. P. Schares, K. R. Ahern, P. Deewatthanawonget al., 2010 Genome-wide distribution of transposed Dissociationelements in maize. Plant Cell 22: 1667–1685.
Wang, G. P., A. Ciuffi, J. Leipzig, C. C. Berry, and F. D. Bushman,2007a HIV integration site selection: analysis by massively parallelpyrosequencing reveals association with epigenetic modifications.Genome Res. 17: 1186–1194.
Wang, T., J. Zeng, C. B. Lowe, R. G. Sellers, S. R. Salama et al.,2007b Species-specific endogenous retroviruses shape the transcrip-tional network of the human tumor suppressor protein p53. Proc. Natl.Acad. Sci. USA 104: 18613–18618.
Waterston, R. H., K. Lindblad-Toh, E. Birney, J. Rogers, J. F. Abril et al.,2002 Initial sequencing and comparative analysis of the mouse genome.Nature 420: 520–562.
Weil, C. F., and R. Kunze, 2000 Transposition of maize Ac/Ds transposableelements in the yeast Saccharomyces cerevisiae. Nat. Genet. 26: 187–190.
Wu, X., Y. Li, B. Crise, and S. M. Burgess, 2003 Transcription start regionsin the human genome are favored targets for MLV integration. Science300: 1749–1751.
Wu, X., Y. Li, B. Crise, S. M. Burgess, and D. J. Munroe, 2005 Weakpalindromic consensus sequences are a common feature found at theintegration target sites of many retroviruses. J. Virol. 79: 5211–5214.
Zhu, Q., G. M. Pao, A. M. Huynh, H. Suh, N. Tonnu et al., 2011 BRCA1tumour suppression occurs via heterochromatin-mediated silencing.Nature 477: 179–184.
Communicating editor: D. J. de Koning
Volume 6 April 2016 | Inserts Reveal Genomic Structural Features | 817